Embed Size (px)
Citation preview

1P,!A. 93 BATTELLE COLUMBUS LABS OH F/B 5/3FORECAST OF FUTURE OHIO RIVER BASIN, WATERWAY TRAFFIC BASED ON --ETC(U)SEP 79 N COLLIS DACW69-7B-C-0059
UNCLASSIFIED NL:uuun..Eli, hhEEEEEEEEoEEEEEEEEmhEEEI
I EmhEEEEmhEmhhEEEmohEEEEEmhEImohEEmhEEEohhEEEEEEEEmohhEEEE

14 tipc ii
SIrccubt
.ELECTE
ic ric
Uci s~ICI O r. APPROVED FOR PUBLIC RELEASE; DISTRIBUTIOrUNLIXITD.
Lu.i U.u~i
LU-
80% 7 2r17
Ljo I~*

UNCLASSIFIEDSECURITY CLASSIFICATION OF THIS PAGE (In Def Entered)
REPORT DOCUMENTATION PAGE RE MTRUC ORMI. REPORT NUMBER 2. GOVT ACCESSION NO. 3. RECIPIENT'S CATALOG NUMBER
4. -LT_.WdL_. S. TYPE OF REPORT & PERIOD COVERED
,,,I Frecast of Ziture ,hio J'ver Asinaterway Traffic bd'sed oW Shippez'6surveys -4n l rA"*+. /
e.L PEPOI4I44G.~*INUMBER01 4- - 0
7. AUTHOR(e) S. CONTRACT OR GRANT NUMBER(e)
13-- _ * DACW69-78-C-OQ9 ,"-
9. PERFORMING ORGANIZATION NAME AND ADDRESS 10. PROGRAM ELEMENT, PROJECT. TASKAREA & WORK UNIT NUMBERS
Battelle Columbus Laboratories
505 King Avenue . Ohio River BasinColumbus, OH 43201 Navigation Studies
II. CONTROLLING OFFICE NAME AND ADDRESS 12. REPORT DATE
U.S. Army Corps of Engineers, Ohio River Div., September 1979ATTN: Navigation Studies Branch, Planning Div., 13. NUMBER OF PAGES
P.O. Box 1159, Cincinnati, OH 45201 22514. MONITORING AGENCY NAME & ADDRESS('If different from Controlling Office) 15. SECURITY CLASS. (of thie report)
U.S. Army Corps of Engineers, Huntington Distr.P.O. Box 2127 1 UNCLASSIFIEDHuntington, WV 25721 SCHEDULE
16. DISTRIBUTION STATEMENT (of thie Report)
Approved for public release; distribution unlimited.
17. DISTRIBUTION STATEMENT (of the abetact entered In Block 20, if different from Report)
18. SUPPLEMENTARY NOTES
19. KEY WORDS (Continue on reverse side It neCeeary And Identify by block number)
Bulk cargo River basin developmentEconomic development Traffic surveysEconomic forecastingInland waterways ~ .~J, '~
Ohio River basin2M. >"urR ACT (Coutfe an revrs Ed* Nf sei"~ a" Ideatif by block number)
'-his Corps_-- rgineer*-repor I describes one of three independent but com-
plementary studies of future freight traffic on the Ohio River Basin Navi-gation System. Each of the studies considers existing waterborne commerce
and develops a consistent set of projections of future traffic demands forJ all of t navigable waterways of the Basin. Each report contains informa-
tion on past and present waterborne commerce in the Basin and projections by
commodity group and origin-destination areas from 1975 to at least 1990.
D N 473 UNCLASSIFIED , ,SECURITY CLASSIFICATION OF THIS PAGE (fte. Dete Entered)

UNCLSSIFIEDS CURITY CLASSIFICATION OF THIS PAOE(Whn Date Ent.e,o)
(Continued from #20)
The three study projections, in conj on with other analytical tools andsystem information, will be used to evaluate specific waterway improvementsto meet short and long-term navigation needs. The output from these studieswill serve as input to Corps' Inland Navigation Simulation Models to helpanalyze the performance and opportunities for improvement of the Ohio RiverBasin Navigation System. These data will be used in current studies relatingto improvement of Gallipolis Locks, the Monongahela River, the Upper OhioRiver, the Kanawha River, the Lower Ohio River, the Cumberland River and theTennessee River, as well as other improvements. N
The study and the 1975-1990 traffic projections discussed in this report weredeveloped by surveying all waterway users in the Ohio River Basin through acombined mail survey and personal interview approach. The purpose of thesurvey was to obtain an estimate from each individual shipper of his futurecommodity movements by specified origins and destinations, as well as otherassociated traffic information. Al identifiable waterway users were con-tacted and requested to provide the survey information. In addition, per-sonal interviews were held with the major shippers. The responses were thenaggregated to yield projected traffic demands for the Ohio River NavigationSystem.
Jii
\ -
UNCLASSIFIEDSECURITY CLASSIFICATION OF TMIS PAGE(When Data Enterd)

FINAL REPORT
FORECAST OF FUTURE OHIO RIVERBASIN WATERWAY TRAFFIC BASED
ON SHIPPERS' SURVEYS
Prepared for theU.S. Army Corps of EngineersHuntington District Engineer
P.O. Box 2127Huntington, WV
BY:Battelle
Columbus Laboratories505 King Avenue
Columbus, OH 43201
Under Contract: DACW69-78-C-0059
OHIO RIVER DIVISION
APPIOY FOR PUBLIC RELBASE; DISTRIBUTION UNLIMITED.
September 1979

Copies of this report may be purchased at the cost of reproduction of$5.00 from:
Division EngineerU.S. Army Engineer DivisionOhio River, ATTN: ORDAS
P.O. Box 1159Cincinnati, OH 45201
Please make checks payable to the United States Treasurer.
Library cataloging information:
Battelle Columbus Laboratories, Columbus, Ohio.Forecast of future Ohio River Basin waterway
traffic based on shippers' surveys ; finalreport / Prepared for the U.S. Army Corps ofEngineers, Huntington District ... by BattelleColumbus Laboratories, September 1979. Cincinnati,Ohio : U.S. Army Corps of Engineers, Ohio RiverDivision, 1979.
225 p. in various pagings : Ill. ; 27 cm.Contract DACW69-78-0059."...one of three independent but complementary
studies of future freight traffic on the OhioRiver Basin Navigation System."
I. Shipping--Ohio River Basin. 2. Inlandwater transportation--Ohio River Basin--Statistics.3. Ohio River Basin. I. United States. Army.Corps of Engineers. Ohio River Division.II. United States. Army. Corps of Engineers.Huntington District. III. Title.
HE597.03B3 OCLC no. 5320691

PREFACE
This Corps of Engineers report describes one of three independentbut complementary studies of future freight traffic on the Ohio RiverBasin Navigation System. Each of the studies considers existing water-borne commerce and develops a consistent set of projections of futuretraffic demands for all of the navigable waterways of the Basin. Eachreport contains information on past and present waterborne commerce inthe Basin and projections by commodity group and origin-destinationareas from 1975 to at least 1990.
The three projections, in conjunction with other analytical toolsand system information, will be used to evaluate specific waterwayimprovements to meet short- and long-term navigation needs. The outputfrom these studies will serve as input to Corps' Inland Navigation ISimulation Models to help analyze the performance and opportunitiesfor improvement of the Ohio River Basin Navigation System. These datawill be used in current studies relating to improvement of GallipolisLocks, the Monongahela River, the Upper Ohio River, the Kanawha River,the Lower Ohio River, the Cumberland River, and the Tennessee River, as 1well as other improvements.
This report, completed in June 1979, was prepared for the Corpsby Battelle Columbus Laboratories, Columbus, Ohio. The study and the1975-1990 traffic projections discussed in this report were developedby surveying all waterway users in the Ohio River Basin through acombined mail survey and personal interview approach. The purpose ofthe survey was to obtain an estimate from each individual shipper ofhis future commodity movements by specified origins and destinations,as well as other associated traffic information. All identifiablewaterway users were contacted and~ requested to provide the survey infor-
mation In addition, personal interviews were held with the majorshippers. The responses were then aggregated to yield projected trafficdemands for the Ohio River Navigation System.
A second report, completed in January 1979, was prepared for theCorps by CONSAD Research Corporation of Pittsburgh, Pennsylvania. Thestudy and the 1975-1990 projected traffic demands discussed in thatreport were developed by correlating the historic waterborne commodityflows on the Ohio River Navigation System with various indicators ofregional and national demands for the commodities. The demand variable(s)which appeared to best describe the historic traffic pattern for eachof the commodity groups was selected for projection purposes. Thehistoric and projected values for the demand variables are based uponthe 1972 OBERS Series E Projections of National and Regional EconomicActivity. The OBERS projections were developed by the Bureau ofEconomic Analysis of the U.S. Department of Commerce in conjunctionwith the Economic Research Service of the Department of Agriculture.

PREFACE(Continued)
A third report, to be completed in September 1979 is being preparedfor the Corps by Robert R. Nathan Associates, Inc. of Washington, D.C.The study and the 1975-2040 projections to be discussed in that report aremuch more comprehensive in scope, and focus on a much longer time frame.The basic study approach involves placing the historic production, con-sumption, and net shipments (by transportation mode) of commodities whichmove by water in the Ohio River Basin into perspective with total nationaloutput. The production, consumption, and shipment estimates are beingprepared for all geographic areas within the Basin which are either directlyor indirectly (through modal transfers) served by the Ohio River NavigationSystem. Economic, environmental and institutional factors which havehistorically affected output, consumption and modal shipments are beingidentified and analyzed. These same variables will then be projectedthrough the year 2040 under alternative scenarios. Detailed waterwayflow projections by commodity group and origin-destination areas will thenbe presented for the most probable future condition.
tL
.I

w i,
SUMMARY REPORT
FORECAST OF FUTURE OHIO RIVER BASINWATERWAY TRAFFIC BASED ON SHIPPERS' SURVEYS
to
HUNTINGTON DISTRICTU.S. ARMY CORPS OF ENGINEERS
OBalfelleColumbus Laboratories

Pfi3C1W PAGI BL&1=I-xor FUJa
I.z
ACKNOWLEDGEMENT
We would like to extend our gratitude to the many organizationswhich participated in this study and particularly to the individualswho were interviewed by us for the survey. We also extend our gratitudeto those firms who responded to our survey by mail. This report wouldnot have been possible without their willing cooperation.
This study was conducted under the direction of Charles Kimm.Harry Collis served as principal researcher. He was assisted by LorenRosenthal and Cathy Neuberger who lent valuable assistance in preparingthe final report. In addition, Homer Ball, Norman Fischer, David Nippert,and Janice Warmke also participated in this study.
Our special gratitude is extended to the U.S. Army Corps of Engineers,especially the Huntington District staff, for their support and unfailingassistance throughout this study.
LI
II
.1
-.-.-

TABLE OF CONTENTS
Page
SCOPE OF STUDY ..... .... ......................... . ....
Purpose ...... ...... .......................... 1r
Units of Analysis ...... .... ..................... 1
Rivers, Locks and Dams, and PE's ..... ........... 3
BEA's and States ...... ... ................... 3
Major Commodity Groupings ...... .............. 4
Brief Description of Barge Traffic Activities in theBasin ..... ........ .......................... 4
II. STUDY APPROACH ..... .... ......................... . i.. 11
Overview .... ..... ......................... . .. 11
Survey Questionnaire Design ...... ................ . .. 11
Identification of Waterway Users .... ............. ... 13
Questionnaire Mailings ...... ................ ... 13
Criteria for Major User Selection ... .......... ... 14
Major User Sample Size by Commodity Group ........ ... 14
Interview Procedures ....... ................... ... 15
Data Clarification Procedures for Respondents Not Selectedfor Field Interviews ....... .................. ... 16
WCSC Data Base "Reidentified" .... ............... .... 16
New Data Base Constructed to Supplant WCSC Data ... ...... 17
Generation of Aggregate Growth Projections for PE's,Rivers, BEA's, and Locks ...... ................ ... 18
Contrast of Original/Reidentified/New Data Bases ..... ... 18
Analysis of User Concerns and Intentions .. ......... ... 19
Analytic Tool: SPSS ....... ................... ... 19
III. FINDINGS ........ ... ............................ ... 20
Discrepancies Between WCSC Data and Survey Responses . . 20
Nature of the Problem ...... ................ ... 20
Sources of the Problem ...... ................ ... 21
Ohio River Basin Traffic Growth Projections ........... ... 25
Traffic Growth Projections by Commodity Groups. . .. 27
Traffic Growth Projections by Rivers ........... ... 33
Traffic Growth Projections by BEA's .. ......... ... 51

TABLE OF CONTENTS(Continued)
Page
Ohio River Basin Waterway Users' Views and Concerns. . . . 67
Impact of the Tennessee-Tombigbee Waterway ... ...... 67
Sensitivity to Unilateral Barge Rate Increases .... 68
Planned Modal Shifts ...... ................. ... 68
Results of Ranking of Important Aspects of WaterTransportation ....... ................... ... 68
Barge Rates ........ ..................... ... 69
Lock Transit Time ....... .................. ... 70
Availability of Empty Barges .... ............. ... 70
Equipment Related Concerns of the Ohio River BasinUsers ......... ....................... ... 70
Additional User Comments .... ............... .... 71
ATTACHMENT I
OHIO RIVER BASIN USERS SURVEY QUESTIONNAIRE ..... ............ I-1
ATTACHMENT II
OHIO RIVER BASIN COMMERCIAL DOCKS PROCESSED FOR STUDY QUESTION-NAIRE .............. .............................. 1I-1
ATTACHMENT III
COMPARISON OF WCSC DATA AND SURVEY DATA AND DEGREE OF SURVEYCOVERAGE BY COMMODITY GROUP ......... ................... II-i
APPENDIX A
TONNAGE BY RIVER OF ORIGIN BY RIVER IF ESTINATION BY YEAR(1976 THRU 1990) ......... ........................ A-1
APPENDIX B
TONNAGE FLOW TIME-SERIES BY LOCK BY DIRECTION .. .......... B-1
APPENDIX C
TONNAGE BY LOCK BY DIRECTION OF MOVEMENT BY YEAR (1976 THRU 1990). C-1
APPENDIX D
TONNAGE BY BEA OF ORIGIN BY BEA OF DESTINATION BY YEAR(1976 THRU 1990) ............ ........................ D-1
PE-PE FLOW PROJECTIONS ARE BEING WITHHELD FROM PUBLICATIONTO AVOID DISCLOSURE OF CONFIDENTIAL INFORMATION FOR SOME
SHIPPERS AND/OR RECEIVERS

LIST OF TABLES
Table 1. 1976 Ohio River Basin Waterborne Traffic by CommodityGroup Composition ......... .................... 6
Table 2. Selected Major Users' Traffic Volume Share of Ohio RiverBasin Total, by Commodity Group, 1976 ... .......... 14
Table 3. Comparison of 1976 Original COE Vaterborne CommerceStatistics and "Reidentified" WCSC Data for the SelectedMajor Users ........ ....................... .... 22
Table 4. Comparison of 1976 "Reidentified" WCSC Data and SurveyResponses for the Selected Major Users ............ ... 23
Table S. Ohio River Basin Waterborne Traffic Projections byCommodity Group, to 1990 ...... ................. ... 26
Table 6. Ohio River Basin Waterborne Traffic Projections forCoal, to 1990 ....... ..................... ... 27
Table 7. Ohio River Basin Waterborne Traffic Projections forPetroleum Fuels, to 1990 ...... ................. ... 28
Table 8. Ohio River Basin Waterborne Traffic Projections forAggregates, to 1990 ...... ................... .... 29
Table 9. Ohio River Basin Waterborne Traffic Projections for
Grains, to 1990 ....... ..................... .... 30
Table 10. Ohio River Basin Waterborne Traffic Projections forChemicals & Chemical Fertilizers, to 1990 .......... ... 31
Table 11. Ohio River Basin Waterborne Traffic Projections for Ores& Minerals, to 1990 ........ .................... .. 31
Table 12. Ohio River Basin Waterborne Traffic Projections for IronOre, Iron & Steel, to 1990 ...... ................. ... 32
Table 13. Ohio River Basin Waterborne Traffic Projections for
Miscellaneous Commodities, to 1990 .... ............. ... 33
Table 14. Waterborne Traffic Projections, Ohio River, to 1990 .... 34
Table 15. Estimated 1990 Lock Transit Volumes, Ohio River ........ . 36
Table 16. Waterborne Traffic Projections, Allegheny River, to 1990. 37
Table 17. Estimated 1990 Lock Transit Volumes, Allegheny River . ... 37
Table 18. Waterborne Traffic Projections, Monongahela River, to 1990. 39
Table 19. Estimated 1990 Lock Transit Volumes, Monongahela River. 39
Table 20. Waterborne Traffic Projections, Kanawha River, to 1990. 41
Table 21. Estimated 1990 Lock Transit Volumes, Kanawha River ........ 41

LIST OF TABLES(Continued)
Page
Table 22. Waterborne Traffic Projections, Kentucky River, to 1990 .. 43
Table 23. 1::stimated 1990 Lock Transit Volumes, Kentucky River . ... 43
Table 24. Waterborne Traffic Projections, Green-Barren River, to
Table 25. Estimated 1990 Lock Transit Volumes, Green-Barren River . .45
Table 26. Waterborne Traffic Projections, Cumberland River, to 1990 47
Table 27. Estimated 1990 Lock Transit Volumes, Cumberland River . . '47
Table 28. Waterborne Traffic Projections, Tennessee River, to 1990. 49
Table 29. Estimated 1990 Lock Transit Volumes, Tennessee River .. . 51
Table 30. Projected 1990 Traffic Growth by Commodity Group,Pittsburgh BEA .. .. ..................... 52
Table 31. Projected 1990 Traffic Growth by Commodity Group,Cleveland BEA. .. ...................... 53
Table 32. Projected 1990 Traffic Growth by Commodity Group,Columbus BEA .. .. ...................... 54
Table 33. Pi, ected 1990 Traffic Growth by Commodity Group,Huntington BEA .. .. ..................... 55
Table 34. Projected 1990 Traffic Growth by Commodity Group,Clarksburg BEA .. ...................... 56
Table 35. Projected 1990 Traffic Growth by Commodity Group,Cincinnati BEA .. ...................... 57
Table 36. Projected 1990 Traffic Growth by Commodity Group,Louisville BEA .. ...................... 58
Table 37. Projected 1990 Traffic Growth by Commodity Group,Evansville BEA .. ................... ... 59
Table 38. Projected 1990 Traffic Growth by Commodity Group,Paducah BEA. .. .................. ..... 60
Table 39. Projected 1990 Traffic Growth by Commodity Group,Lexington BEA. .. .................. .... 61
Table 40. Projected 1990 Traffic Growth by Commodity Group,Nashville BEA. .. .................. .... 62
Table 41. Projected 1990 Traffic Growth by Commodity Group,Huntsville BEA .. ....................... 63
Table 42. Projected 1990 Traffic Growth by Commodity Group,Chattanooga BEA. .. ...................... 64
Table 43. Projected 1990 Traffic Growth by Commodity Group,Knoxville BEA. .. ....................... 65
Table 44. Projected 1990 Traffic Growth by Commodity Group,*Memphis BEA. .. .................... ... 66

LIST OF FIGURES
Page
Figure 1. The Ohio River Basin .. ... ................. 2
Figure 2. Ohio River Basin by BEA's. .... ............. 5
Figure 3. Overview of Study Approach. .. ............... 12
Figure 4. Ohio River Traffic Growth Patterns, 1960-1990 .. ...... 35
Figure 5. Allegheny River Traffic Growth Patterns, 1960-1990 ... 38
Figure 6. Monongahela River Traffic Growth Patterns, 1960-1990 ... 40
Figure 7. Kanawha River Traffic Growth Patterns, 1960-1990 .. ...... 42Figue 8 Kenuck Rier Taffc GowthPaterns 190-190 .. .. 4
Figure 8. Krenuckye River Traffic Growth Patterns, 1960-1990 . . . 44
Figure 9. Guree-arrnd Rivers Traffic Growth Patterns, 1960-1990 .. . 46
Figure 10. Tuereane River Traffic Growth Patterns, 1960-1990 .. . . 48

• I
CHAPTER I.
SCOPE OF STUDY
QkJ

CHAPTER I. SCOPE OF STUDY
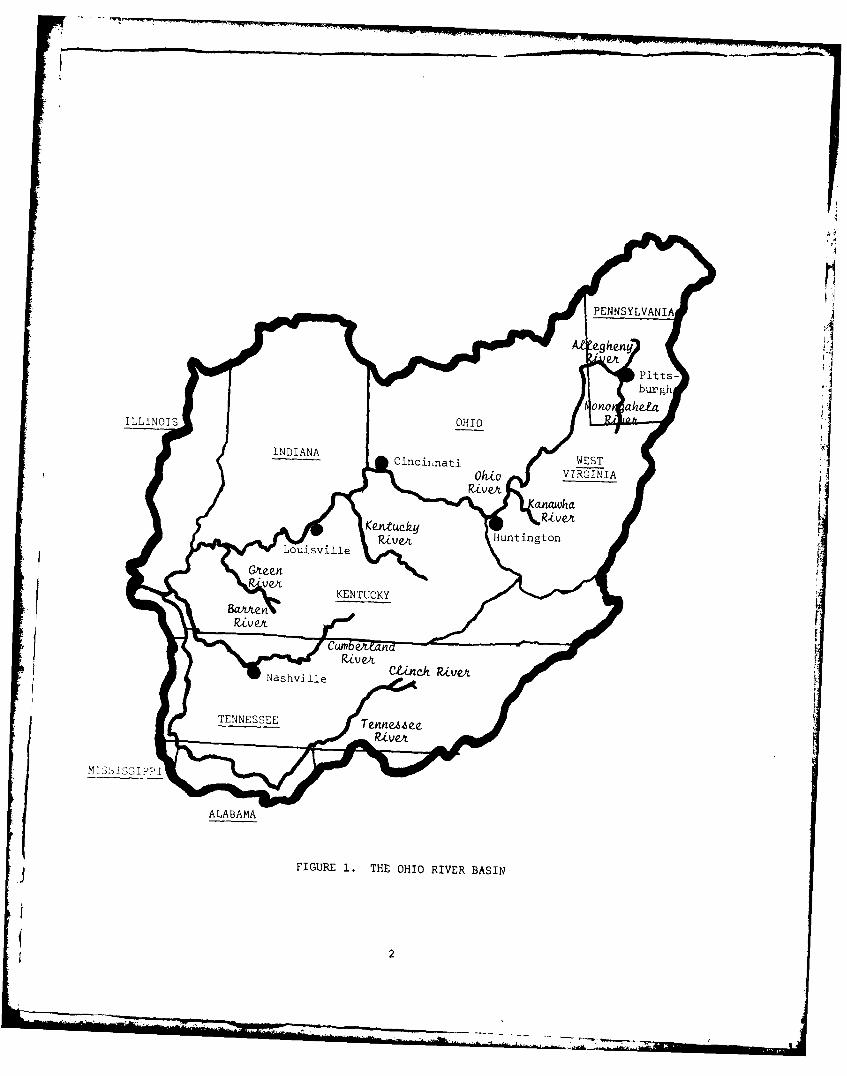
The Ohio River Basin is a nine-state region covering an area of204,000 square miles. Much of this region's basic industry is situatedon the nine navigable rivers which constitute the Ohio River System.These industries, and others further inland, use the rivers to transportbulk commodities such as coal, aggregates, and petroleum fuels. Accord-ing to 1976 Waterborne Commerce of the United States Statistics, a totalof 177.9 million tons of these and other commodities were moved in towsof one to fifteen barges on the main stem Ohio and its tributaries. TheBasin is depicted in Figure 1.
The U.S. Army Corps of Engineers (COE) is responsible for construct-ing and maintaining the 71 lock and dam projects* which make the OhioRiver System navigable. Other navigation related COE maintenance dutiesinclude dredging, construction of revetments and channel straightening.COE responsibilities also encompass certain regulatory functions regardingdevelopment activities in navigable waters and their tributaries.
Purpose
COE needs reliable barge traffic projections to help guide thewaterway improvement planning and management process. Such projectionsindicate which river segments, tributaries, and lock and dam projectsare likely to experience the most future congestion. COE can then makenecessary waterway improvements in anticipation of traffic problems.
COE is also interested in determining which operational and economicmatters, relating to barge transportation, are of greatest concern towaterway users. And, COE needs to know user intentions regarding changesin the size and configuration of barge tows, diversion of barge trafficin response to the waterway user charges, and reductions in empty or"light" barge traffic in the Basin.
This study was designed to generate barge traffic flow projectionsthrough the year 1990 for input to COE's waterway improvements plans.It was also meant to solicit user views regarding the matters mentionedabove. This information was to be obtained by surveying waterway usersthrough questionnaires and field interviews.
Units of Analysis
The units of analysis used in this study include rivers, lock anddam projects, commodity groups, BEA's and PE's. The last two unitsrequire some immediate explanation. BEA is an abbreviation for "Bureauof Economic Analysis". This Bureau, which is part of the CommerceDepartment, has subdivided the United States into 173 geographical areas;these areas, or "BEA's", are used by many federal agencies for planningpurposes. PE stands for "Port Equivalent". COE has segmented all rivers
* Currently there are 72 locks and dams including Locks & Dams 50 and
51 but Smithland will replace Locks & Dams 50 & 51.
NIAA eq"e
*1APitts-
M~ 3 5 I 3 bIpgh
ALABAMAt
FIGURE 0.TH.HI 9IVRBAI
INDIAN

into PE units for purposes of analysis and planning. These units ofanalysis are discussed in greater detail in succeeding paragraphs.
Rivers, Locks and Dams, and PE's
The nine navigable rivers of the Ohio River System are listed below.The figure in parentheses after each river indicates the number of activelock and dam projects on that river.
" Ohio (main stem) (20) * Green-Barren Rivers (3)* Allegheny (8) & Cumberland (4) r" Monongahela (9) * Tennessee (9)" Kanawha (3) o Clinch (1)* Kentucky (14)
The channels of these rivers are maintained at a minimum depth of ninefeet.
There are 91 active PE river segments in the Ohio River System. (Anactive PE segment is one which shows any dock activity.) PE's are avery disaggregate unit of analysis. In fact, more than 2,700 distinctPE-to-PE movements have been identified in the Basin. Discussions ofriver traffic at this level are soon overwhelmed by detail. Therefore,although commodity movements were tabulated and projected on the PElevel, such information is contained only in the appendices and is notanalyzed in the main body of the report.
BEA's and States
Portions of nine states are found in the Basin's navigable waterwayhinterland. They are listed in the order of direction of water flow.
e Pennsylvania * Illinois* West Virginia * Tennessee* Ohio e Alabama* Kentucky * Mississippie Indiana
Counties of the various states have been recombined into BEA areas.BEA's are labeled as the cities which are their focal points. A riversegment may be included within a BEA or it may be used as its boundary.There are 15 waterside BEA's in the study area:
* Pittsburgh, PA e Paducah, KYe Cleveland, OH e Huntsville, AL* Huntington, WV * Chattanooga, TN* Columbus, OH * Knoxville, KYe Cincinnati, OH * Nashville, TNe Louisville * Clarksburg, WV* Evansville, IN e Lexington, KY9 Memphis, TN
3

BEA's rather than states are used as a unit of analysis in thisreport. They are smaller and more homogenous in terms of industrialactivities than states. The BEA boundaries are depicted in Figure 2.
Major Commodity Groupings
The nine major commodity groups used in this study are:
* Coal & Coke e Chemicals & Chemical Fertilizers* Petroleum Fuels o Ores & Minerals* Crude Petroleum o Iron Ore, Iron & Steel* Aggregates e Miscellaneous Commodities** Grains
These major commodity groups are further divided into "4-digit"commodity classifications. A 4-digit breakdown of each commodity groupis found in Table 1. Also found in this table is the tonnage distributionof these individual commodities based on 1976 WCSC statistics.
Brief Description of Barge Traffic
Activities in the Basin
Table 1 provides a fair understanding of the industries which usethe waterway because each commodity group represents a specific kind ofindustrial activity.
Coal & Coke. Coal clearly dominates activities on the waterway.It is mined in nearly every state in the region. A large portion ofthat coal is consumed by power plants, steel firms, and other heavyindustry within the Basin.
Petroleum Fuels; Crude Petroleum. Petroleum fuels are transportedto various distribution points along the river. In some cases the supplysource is a refinery; in other cases barges act as extensions of petro-leum pipelines. A relatively small quantity of crude is imported to theregion.
Aggregates. Aggregates are quarried or dredged from the river,classified and taken to metropolitan areas where they are distributedprincipally by land modes to transportation. Or, aggregates may bebarged directly from source to construction sites.
-' *Includes commodities not covered under the first eight commoditygroupings.
4

cnJ
Cf)
op
rc'
E- ClL
5 )E

E- LO LA) H- HH1344-
0
( 8 0 -TL LO( r-LA0tOHO m 0 0 w ~L H 0 m N
C O4 0 LO C' rA 0 0> (n > O C~jCV (Da) H4 HH
0
r(14
H) HCr- H 2L -P D HO CO) LO ) (D IODCT)(D CO (y)
tk 0 C) nD al w* a1 14_ I:I( D 0 rI 4 rI0 n L -M N C' a) -t-t LomN ' 0 O l HO' 04 4 HLO 4C
0 0 0 r 0 0 H C
P E-
zo0
on D00
00
X-10 OH a
0 0 4,-4 HO Ul - 0(CI- r-f +14) 4- ( , 14150')) 0 -uH 0 )UAa u- ) aOEI -4H *H C.) U H1 HJZ4
u 04- r- H) jr Ho 04 U)H a) Hn . 1 44
(zI .- 14 04(- 4- 4 V) E0 ) 0 -0)~- z r= 4-'4;4- 4 )>0 01 0 0 )HUWrH 0)13 rd £ 4 1 0
E-' P ~ U ~ r - C)- IO CD aQ U
U 1 0 ~ H-1 04 H'd: - 0 U ) ( q1) a S1 V) z O
-UUCD 0) 0 .~Cf U) a)C/C 0) C)UOU)I- rir-
1'J "J HHHHH(CN N H 0~ CD C>0 0
ClH
4-' Z ) 0
0 0 U- W) 4-'U) ;4. ro
0 0 U D r.
0 a) F4 boU 04 -)
-S--- .- - --

4) 4J' II .11 . . I ()0 0000 C4 Io I01 I00c) o I 1 000 -IIO o 4
0
41OD r-A Hot- 0- 040L N -' r-10 (D-'r-w~0
C) Hl H4U'
0
ru0 .01HoC" -t04- IfO -t N -41- h-l r-H-4cN
H H) Q'mC)
- 0 m 1rqr m o)L)'
0 0
4-'0 H
0 (d /
C-) U)() C ~ C 1
0 z H 4) NH *-I N -4 U)-- ~ 0
'0 ~ () 4 -H("q 0 Q)0) *
4-1 )4-1 :$r a-H4 'IJ14 '0 )000u*Hj 00 C 00-) r-i 'o ') MZ 1
E- CH z 0 <( 04(2) E 0 )r. 0/ Qul0 '0'0 E- 'r J r14 4 H:
x n - -H A-. q0)r.0 4- N rH0 0 () $ q0 WtoO0
0 0- H0)~C a) U b)-d0Hna1 0 4 0 0~- 4-~0.0) 0. 0 co" q H- Q) -Hr0~ )C ( O / Z H 4- 0) faf 00)-H P
"1 00N P.4 4' PCd() 4-Jr : 0X bO I P 4-J~ :31:'0ZC 4 04)4)0Pa 0004-$ 0 0 v0 0
H- -1 H/ 0) - -E -r-mL D m L
4-) CLID )
0 -4-1 N
100

4J - . * I * I.
0 0 0 00 0 I'I C;C ;C; 1 0 10C 1 00C I 10000C)0 1 I
0 ~4 ~HLAH~HCJ H 0 0)(HO
0
r- 04 lAC N--tO nr CN C14 L M L (Dto
W 4J
4-)4' d
00 0
C/) ru0 CfO
WWW0)O CD4 000
01 cn H VO )
04 0.,10 4 -,-1 b0 0~H
E-Q )w 0 w 00 a)l-' -4 C: 0 00U
r4 wC/3 n En- ) E 4 - o r UW~ 1 C)WHz
0 H ~ AL N O H~ 0HC..Ja)C) wLA0 + H4 HC'(1HHHHo"D"HHH C) DP oHoC -H LIDH4 H Hr.H
0- 4 r O 3 )r ,
0- 0- r.r 4OiW )"0-Q 4> )b 0E0 40 00 0 0 0 0 0 0 4) a) - - 40 40 JEr a:
00 -1HH9 ) ): 1 r C)Q 4r4a -
0 01>1 Ii4-
0J
1-8

4- H-
Q) 4-)0 0 10 t0 C 0
00
Zo - o C
0'0
0
-:I- H N C)m n N-t C7 D 0 0Y
0 C')0 N 4-
4-'
4-JH U)0 ~r H aH f
4-' 0 4-' 4-)a)I .1 0 0 rdo 4
' j 4-J Q) 4' 4-'0 04' ora m)
OH 04-U 4J 0 a)
4-' HQ() 0'-I0, r:w 4-4 ::raw >4-'>0PI 4j 0 0 a)
<.- w -P 0 LO 4-'0 r r~ .,I
0 0 j-i a 0 4-1
4-j *4 4 >10
0 W cO P E- to 0
4HCOHH )
z0
Q 4-' 0
.:I,~ra 0f -0 - -
Cl)Cl C) -a .,q
0
00EO 00 0Ha w)00) ri4 '0c
P4 fu U) H)U 0~ 0)t0O a)-14
ca U
J, 0

Grains. Grains are collected by rail and truck from throughout theregion. Most barge shipments of grain are foreign export movements whichare transloaded to oceangoing vessels at Gulf Coast ports.
r
Chemicals & Chemical Fertilizers. A wide array of basic chemicalsand chemical fertilizers are moved on the river. Very little is exportedfrom the region. About half of the tonnage is imported from Gulf ports;the other half is originated and terminated within the Basin.
Ores & Minerals. The bulk of the metallic ores are used in steelalloy making. Most of the metallic ores are imported from outside theBasin. Salt is an important non-metallic mineral imported from theWestern Gulf Coast.
Iron Ore, Iron & Steel. Only a limited amount of iron ore is beinghandled by barge. Mainly this group represents steel products such assheet, plate, tubes, pipes, angles, etc. Two-thirds of this trafficoriginates from the headwaters of the Basin; the rest is imported fromoutside the region. There are also substantial exports of steel products
from the Basin.
Miscellaneous Commodities. The principal 4-digit commodities inthis category are asphalt and waterway improvement materials. Becauseof the diversity of commodities in this group, no particular patternof movement can be sketched.
Fi
10
-------

CHAPTER II.
STUDY APPROACH

CHAPTER II. STUDY APPROACH
This chapter discusses the collection of survey information andthe subsequent analysis of survey data. These topics include:
" Questionnaire design" Identification of waterway users and selection of major
users for interviews" Interview procedures" Tabulation and construction of data base" Contrast of new with preexisting data" Generation of traffic projections" Analysis of operational and economic user concerns and
intentions.
Overview
All Ohio River Basin Waterway Users were surveyd by questionnaireand/or field interviews. They were asked to describe their trafficflows in the base year 1976 and to project their traffic flows for theyears 1980, 1985, and 1990. They were also asked to discuss operationaland economic matters relating to barge movements which were of particularconcern to them. Major waterway users were identified through the useof preexisting traffic data (the Waterborne Commerce Statistics anddock listing compiled by COE). Field interviews were conducted withpersonnel from these firms to clarify the responses from the question-naire.
The survey responses were tabulated and traffic flow projectionswere made for each of 2,488 distinct commodity movements reported. Thesedetailed projections weoe summed, yielding aggregate projections forrivers, BEA's, PE's, and individual locks and dams. The 1976 datacollected from survey respondents were compared with preexisting data.Finally, waterway user concerns and views were ranked and analyzed. Theoverall study approach is depicted in Figure 3.
Survey Questionnaire Design
The questionnaire was designed in cooperation with COE. It had twosections, the first being quantitative, the second qualitative. Thequantitative section related to traffic growth projections, modal split,and other traffic statistics; the qualitative section surveyed the economicand operational concerns and intentions of waterway users. The question-naire is attached as Attachment I.
1 11

COE1976 MMERG MAILING
DATA BASE -T --- LIST
COMPILEMAIL STATISTICS
QUESTIONNAIRE FOR MAJORAND DOCK USER
STATISTICS SELECTION
VERIFICATIONOF OPERATIONAL
DOC INTERVIEWSKS F I 'L'
0 WYMAJORS S
USERS
\v VERIFICATION FORECAsl jFOTNERS USERS MAJOR VERIFICATION OF BASE YEAR MOVEMENTS bY:
VIEWS AND SHIPPERJS' OF OPERATIONAL DATA- COMMODITYCONCERNS VIEWS DOCKS AND 6 COMMOD, I TY TONNAGE
ICONCERNS LOCATIONS s TONNAGE O/DO/D
\v REVISE COEVERIFICATION 1976 DATA BASE RECONSTRUCTOF BASE YEAR FOR OPERATIONAL BASE YEAR MERGE
DATA DOCKS OF MAJOR MOVEMENTFILEUSERS 14 4
OTHER USERS MAJOR USERSPROJECTED MERGE P n.iFrTFD
GROWTH RATES TH fLS IN,BY COMMODITY BY COMMODIlu
PROJECTEDGROWTHRATES BYCOMMODITY
O/D
GENERATE GENERATE GENERATE1980 GROWTH 1985 GROWTH 1990 GROWTHPROJECTIONS BY: PROJECTIONS BY: PROJECTIONS BY:v PE TO PE o K TO PE e PE TO PEo BEA TO BEA 9 BEA TO BEA a BEA TO BEA* LOCK TO LOCK s LOCK TO LOCK a LOCK TO LOCKo RIVER 9 RIVER 9 RIVER* COMMODITY GROU I a OMMODITY GROUP 0 COR40DITY GROUP
FIGURE 3. OVERVIEW OF STUDY APPROACH
12

Copy of WCSC Data Provided Respondents. In addition to the question-naire, each dock(s) was sent a copy of the Waterborne Commerce Statistics(WCSC) information describing movements to and from their dock(s) in the1976 base year. This was done to provide a common frame of reference forsurvey respondents. This was expected to produce more consistent andcomparable survey responses. r
Commodity Projections. Firms were asked to verify their 1976 trafficflows and to project their traffic movements on a point-to-point basisfor each commodity they handled; projections were requested for the years1980, 1985, and 1990.
Modal Split. It was important to determine whether regional freighttraffic was susceptible to diversion either to or from barge. Respondentswere asekd to describe movements that now use one mode which might bediverted to other modes. This information was requested on a point-to-point, commodity specific basis. When the same commodities were movingby both barge and rail, respondents were asked whether a change in modalsplit was anticipated.
New Docks and Facilities. Respondents were asked whether theyplanned to construct, purchase, or lease new dock or river-front facilitiesor to close existing ones.
Operational and Economic User Concerns and Intentions. The qualita-tive portion of the questionnaire solicited user views on the followingissues:
* Barge costs and likely impact of cost increases* Competition from other modese Navigational problems* Planned use of the Tennessee-Tombigbee Waterwaye Equipment ownership, use, and configuration* Reduction of light and empty barge movements.
Identification of Waterway Users
Questionnaire Mailings
COE supplied the research effort with WCSC data for the 1976 baseyear. This data described traffic flows to, from, and within the Basinon a dock-to-dock, commodity specific basis. COE also provided an ad-dress listing for each dock in the Basin. These two information sourceswere dovetailed. What resulted was a listing of each dock, its location,its owner, and the commodity tonnages which moved to and from it in 1976.The listing was not completely accurate, but it did provide a solid
13
L76

departure point for the survey. In all, 901 questionnaires with accom-panying data sheets were sent to all identifiable docks in the Basin.This represents 79.7 percent of the 1976 dock listings. The breakdownby river is included as Attached II at the end of this report.
Criteria for Major User Selection
It was known at the commencement of the study that a relativelysmall number of firms contributed the bulk of movements in the Basin.The WCSC data were analyzed to determine precisely which firms thesewere, where their docks were located and the commodity tonnages theymoved. In cooperation with COE an initial set of 49 firms was chosenfor in-depth field interviews. The selection process was governed bythe need to estimate traffic flows for all major commodity groupingsas well as the desire to interview the most intensive users of thewaterway.
Major User Sample Size by Commodity Group
The WCSC data indicated that 49 major users contributed 71.8 percentof the tonnage which moved in the Basin in 1976. Many of these firmsmoved several major commodities. Table 2 breaks down the major usermovements by commodity group, and indicates the major user share ofeach commodity group.
TABLE 2. SELECTED MAJOR USERS' TRAFFIC VOLUMESHARE OF OHIO RIVER BASIN TOTAL BYCOMMODITY GROUP, 1976
System Major UserCommoity Tonnage Tonnage Major User
Group (in 000's) (in 000's) Share
1. Coal & Coke 103,471 85,668 82.8
2. Petroleum Fuels 19,060 16,080 84.4
3. Cr'ude Petroleum 883 717 81.2
4. Aggregates 21,224 7,590 35.8
5. Grains 5,333 3,513 65.9
6. Chemicals 9,449 5,586 59.1
7. Ores & Minerals 3,413 1,731 50.7
8. 1;ron Ore, Iron, & Steel 4,280 3,278 76.6
9. Miscellaneous Commodities 10,789 3,494 32.4
Total 177,902 127,657 71.8
Source: 1976 COE Waterborne Commerce Statistics
14

It can be seen that the major users dominated each of the commoditygroups with the exception of aggregates and the miscellaneous commodities.Major user movements amount to approximately one-third of these last twocommodity movements.
Interview Procedures
Personnel Interviewed. In most cases, no single individual withina respondent firm was able to provide a complete set of answers for thesurvey. Accounting people provided the verification of the trafficinformation for the 1976 base year; marketing and strategic planningdepartments provided traffic projections; and traffic personnel providedinformation about operating problems, modal split, etc. Firms with in-dependent operating divisions or subsidiaries posed even greater difficulties.
Because of the complexity of the organizations interviewed, it wasoften necessary to hold joint meetings with several company officials.Follow-up interviews were frequently necessary to obtain a complete setof survey responses. Generally, the respondent firms were quite helpful,both in terms of providing information and coordinating the responses ofthe various operating divisions to ease the study team's task. Ofthe initial 49 companies selected, three firms declined to participateand were replaced by three substitute firms. Of the final 49 firms, twofirms were unable to meet the data submission deadline and two others wereonly able to supply partial data.
Interview Format. Each interview began with a review of the pre-existing WCSC data describing that firm's barge activities in the Basin. LiThe dock listings and commodity flows associated with each dock werevarified or revised. In most interviews more time was spent on identi-fication of the dock ownership and verification of 1976 base year trafficstatistics. Thereafter, the interview proceeded along the format of thequestionnaire. The structure of the questionnaire was discussed pre-viously in this chapter and is attached as Attachment I.
The principal advantage of field interviews over mailed question-naires is the greater detail and clarity of responses. For example, abusinessman might report that he expects his traffic picture to be "stable"in the coming decade. At first hearing, this seems to be a zero-growthtraffic projection. However, a bit of probing might reveal that thestable baseline which the businessman is referring to is a compoundingannual growth of 1-3 percent which the firm has experienced for the lastfive years.
It is possible to obtain clarifying information from intervieweeswhich gives a better understanding of the reliability of growth projectionsfor the firm and its industry. Example: Have the projections beengenerated based on detailed market analysis, or are they simple extra-polations of past trends? Although this qualitative information could notbe directly incorporated into growth projections, it did allow the studyteam to assess the degree of certainty associated with growth projectionsfor the various commodity groups.
l 15,

Data Clarification Procedures for RespondentsNot Selected for Field Interviews
From the final mailing list of 901 identifiable operating docks inthe Basin, 564 docks were not selected for field interviews. While theirindividual tonnages were less than that reported for the major users'docks, their collective tonnage for 1976 represents 28.2 percent ofthe Basin traffic volume. From the 564 docks a total of 104 responseswere received. These questionnaire respondents were contacted bytelephone to clarify responses and to verify the 1976 WCSC statisticsreported for their operations. The respondent firms contacted in thismanner were generally quite helpful in supplying and clarifying anymissing data for the study.
WCSC Data Base "Reidentified"
Difficulties with WCSC Data. The field interviews suggested thatthere were a variety of deficiencies in the original WCSC data base.Among the most prominent difficulties was the misidentification ofdocks either in regard to their owners, operators, or users. It wasdecided that the field interviews should be used to "reidentify"movements in the original data base. It was particularly important todetermine whether movements had never been reported and were thereforetotally absent from the data base, or if there simply had been some mis-specification of orij.n or destination or commodity. As it turned out,both problems did exist. The magnitude of these problems is discussedin Chapter III.
Reidentification Process. The original WCSC data base was reworkedin light of the field interview data. Docks were reidentified on a userbasis, i.e., the firm which shipped or received commodities across adock as opposed to the firm which held title or once held title to thefacility. In cases where more than one firm used a dock, their movementswere disaggregated and were assigned different dock codes. In addition,edit checks were performed to insure consistency between and among thevarious data items found on each record. For example, PE codes werematched with river codes to check for consistency. As a final step,tonnages from physically adjacent docks owned by the same firm werecombined when that firm had no idea as to what tonnage moved acrosswhich dock.
The reidentification process provided a better understanding ofthe WCSC data base regarding which movements belonged to whom in theoriginal WCSC data and which movements were entirely unreported. As aby-product of this procedure, the portion of the WCSC data which des-cribed the movements of nonrespondents in the 1976 base year was se-gregated from the rest of the data.
16
.. . ......~~ ~~~ 77 -_ . L -L . .. '- - '... ...

New Data Base Constructedto Supplant WCSC Data
Because of the discrepancies discovered between the original WCSCdata and the survey responses, an entirely new file was constructed.It described not only the base year (1976) movements, but also pro-jected movements in the years 1980, 1985, and 1990. The data receivedfrom both the field interviews and the questionnaires were incorporatedinto this file. Data for nonrespondents were carried over from theoriginal WCSC file.
Calculating Growth Projections for Respondents. Growth projectionsfor the respondent firms were calculated on the basis of their 2,488individual commodity movements reported. This includes all of the majorusers and non-major user respondents. These 2,488 movements became theinput to the new data base. This procedure has substantial advantagesover calculating a growth rate for the Basin as a whole and then applyingit to base-year traffic volumes. The latter procedure shrouds all infor-mation about relative growth expectations for rivers, PE's, BEA's, andcommodity classifications on the 4-digit level.
It should be noted that not all of the 2,488 growth projectionswere truly independent. In some cases, a firm might provide onlya blanket growth projection for an entire commodity group comprisingdozens of distinct movements with some supplementary information onmovements which would be notable exceptions to the general trend. Otherfirms discussed each movement independently and provided very disaggregategrowth projections. In balance, it is believed that a large body ofinformation pertaining to relative growth potentials of commoditiesand geographical areas was successfully captured by the survey.
Exclusion of Double-Counts. Both shippers and receivers of bargedcommodities were surveyed. This created the potential for tonnage double-counts, because the same movements might be reported twice, first fromthe shipper's perspective and then from the receiver's. To avoid double-counts, it was decided to include only the receiver's response in caseswhere a double-count was detected. It was reasoned that future trans-portat ion demand would be more accurately projected by the receivers,whose demand for transportation services actually drives the system.
For many varieties of commodity movements, double-counts did notpose a problem. For example, grain shipments are almost totally out-bound for transshipment at New Orleans or other Gulf ports; salt isalmost entirely inbound from Avery Island and other points in the Gulfarea. In the first case the receivers were not surveyed; in the secondcase the shippers were not surveyed. However, coal, aggregates and avariety of other commodities were usually moved entirely within the
J Basin. For these commodities, special efforts were necessary to avoiddouble-counting the same tonnage.
17

Four steps were taken to eliminate double-counts. First, manycommodity movements in the Basin are internal to the firm. Surveyrespondents were asked to identify these internal movements. Second,the original WCSC data were analyzed to determine commodity exchangerelationships between firms. This was possible since COE data is dockspecific on both ends of a movement. Third, survey respondents wereasked to provide the names of their suppliers/customers when the poten-tial for double-counts was thought to exist. Fourth, movements werematched on a PE-to-PE commodity specific basis. When tonnage totals weresuspiciously close for parallel movements follow-up research was conductedto determine whether a double-count had been detected.
Nonrespondent Data. An excellent 69 percent response to the surveywas obtained (on a reidentified tonnage basis). The future trafficvolumes of the 31 percent nonrespondents were estimated via a three-stepprocess. The first step was to carry the nonrespondent data which hadbeen segregated in the original WCSC file over to the new file. Thesecond step was to adjust this data for probable understatement. Thesurvey responses resulted in an estimated 9 percent understatement inthe original data. The tonnages of all nonrespondent movements wereupgraded by an appropriate amount regardless of origin or destination.Finally, the growth rates evidenced by the survey data for the years 1980,1985, and 1990 were applied to the nonrespondents' base year tonnages toyield projections for the nonrespondents in those years. Separate growthrates were calculated and applied for each major commodity group.
Generation of Aggregate Growth Projectionsfor PE's, Rivers, BEA's, and Locks
The new data base contained projections for 6,050 distinct movements.This total consisted of the 2,488 individual movements reported by therespondent firms (both major user and non-major user respondents) togetherwith the 3,562 movements which represented the non-respondent firms'movements as based on the 1976 COE data. To provide a more underqtandableportrait of present and future traffic in the Basin, movements wereaggregated on the basis of PE's, BEA's, and rivers.
In addition to the point-to-point projections, tonnage flows werecalculated for each lock in the Basin, distinguishing by commodity groupand direction of flow.
Tables, graphs, and discussions of these findings can be found inChapter III and the appendices.
Contrast of Original/Reidentified/New Data Bases
Once the new data base was constructed, it was possible to contrastit with both the original and the reidentified WCSC data bases. Ofinterest were not only net changes in tonnage but also allocation errors
18

between docks and commodity classifications. COB was also interested indetermining whether the errors in the original WCSC data were largelydue to misinformation regarding dock ownership, or whether they hadtheir roots in other causes.
How the process of contrast and comparison would be carried out isobvious and will not be belabored. It is important to note that theranalysis could be performed on a dock specific basis for each 4-digitcommodity classification.
The WCSC reporting problems resolved themselves into a limitednumber of recognizable patterns. The magnitude and causes of theseproblems are discussted in Chapter III.
Comparisons of the WCSC data, the survey data and the degree ofsurvey coverage by commodity group is presented as Attachment III.
Anialysis of User Concernsand Intent ions
The major purpose of this survey is to develop traffic forecastsfor the waterways of the Ohio Basin which reflect the overall marketoutlooks, development plans and strategies of the individual firmsthat utilize the waterway system. To the extent that the individualwater users may not, or cannot, fully anticipate the strategies ofother firms, nor the capabilities of the waterway system, the result-ant forecasts represent demands for waterway service rather thanactual traffic projections. In order to more fully understand eachfirm's traffic demand projection, a series of questions were designedto gauge the respondent's sensitivity to various parameters which mightaffect the magnitude of the individuals' forecasts as well as the
9 of the questionnaire (Attachment I) which deal with waterway equilmentutilization, waterway reconfiguration, navigational problems and costs,
modal shifts and other matters influencing waterway use. Qualitativeand/or quantitative answers to these questions aided in the identificationof assumptions inherent in the traffic forecasts as well as the issuesor concerns to which the forecasts are most sensitive. Responses tothese questions were categorized and tabulated, with answers of eachfirm given equal weight. This process was a simple and straightforwardprocedure, because firms showed a great deal of consistency in theirresponse pattern.
Analytic Tool: SPSS
KAll of the editing, generation of tables, graphing, and other com-putational activities were carried out through the use of the computerlanguage SPSS (Statistical Package for the Social Sciences).
19

CHAPTER III.
FINDINGS

CHAPTER III. FINDINGS
This chapter unfolds the survey findings in three sections. Thefirst discusses disparities between the WCSC data and the survey data.The second section describes traffic growth projections to the year1990 for commodity groups, rivers, and BEA's. The final section analyzesuser views and concerns regarding barge transportation in the Basin.
Discrepancies Between WCSC Dataand Survey Responses
Nature of the Problem
When the survey was first undertaken it was thought that there mightbe a limited amount of erroneous information in the WCSC data. However,the first few interviews revealed some major inconsistencies betweenWCSC data and interview responses. This was a significant and unanti-cipated finding.
Errors in the WCSC data can be categorized as follows:
" Totally unreported movements" Erroneously described commodities" Erroneously described points of origin and destination.
It should be stated at this juncture that the WCSC data, as theycurrently exist, correctly portray the broad pattern of barge activi-ties in the Basin. However, at a detailed level of analysis (dock,4-digit commodity classification) the accuracy of the data is muchmore debatable. It also seems that a non-negligible percentage ofcommodity movements are never reported to COE.
The analysis in this section will proceed on the assumption thatsurvey respondents correctly described their traffic flows for the year1976, and that when these responses were inconsistent with WCSC datathe latter were incorrect. There are several jastifications for thisassumption.
" The survey responses came directly from the firms shippingand receiving the commodities, not from an intermediary(WCSC data are collected from barge carriers)
" There was intensive cross-checking and follow-up inquiries onsurvey responses
" Survey respondents were made aware of COE's concerns about theaccuracy of base-year reported WCSC data.
20
Nevertheless, there were probably a number of occasions when the
WCSC data were correct and the survey responses were erroneous.
Sources of the Problem
Unreported Movements. As indicated in Chapter II, data discrepanciesrwere analyzed in two stages. In the first stage, movements alreadyreported in the WCSC data were "reidentified" in terms of the company oforigin and destination. This was done using updated dock ownershiplistings gathered through the survey. The reidentified WCSC file iscontrasted with the original WCSC file in Table 3.
Many of the movements which appeared to be absent in the originalWCSC data came to light through the reidentification process. Thissuggests that much of the difficulty with the WCSC data could be resolvedsimply by updating COE listings of dock ownership and use.
In the second stage of analysis, survey responses were used tocreate an entirely new file for the 1976 base year. This file was con-trasted with the reidentified WCSC data. This contrast is shown inTable 4.* There are clear indications that WCSC data problems stem notonly from the misidentification of docks but also unreported and erro-neously reported movements.
There are a variety of circumstances which seem to promote thenonreporting of barge movements. Interestingly, some of these circum-stances might also lead to duplicate reporting of the same movements.
Circumstance 1: Exchange Agreements. Exchange or swappingagreements affect mainly the petroleum fuel and coal industries.These agreements allow suppliers to serve each others' customers,thereby producing transportation cost savings. Suppose for example,a refinery in Missouri contracts for the sale of a million barrelsot gasoline to a customer in Pittsburgh, while a refinery belongingto a different firm in West Virginia enters into a similar contractwith a customer in Illinois; the two refineries may then execute anexchange agreement where the Missouri firm supplies the Illinoiscustomer and the West Virginia firm supplies the Pittsburgh cus-tomer. This circumstance promotes underreporting. The firm whichoriginally agreed to the sale will not report the delivery becauseit did not barge the commodity. The firm which actually made thedelivery (assuming it barges its own commodities) may not reportthe movement because it wasn't its sale. Using the reverse logic,both firms might report the same movement.
Circumstance 2: Traffic Interlining. When traffic is inter-lined, Carrier One moves a barge from origin point A to interchange
21

1
TABLE 3. COMPARISON OF 1976 ORIGINAL COL WATERBORNECOMMERCE STATISTICS AND "REIDENTIFIED" WCSCDATA FOR THE SELECTED MAJOR USERS
Original(l) Reidentified(2)Commodity Tonnages Tonnages Percentage
Group (000's) (000's) Difference
Coal & Coke 67,504 81,233 +20.3
Petroleum Fuels 16,035 15,799 -1.5
Crude Petroleum 717 286 -60.1
Aggregates 6,619 6,691 +i.1
Grains 3,057 3,062 1-0.2
Chemicals & ChemicalFertilizers 4,986 5,229 +4.9
Ores & Minerals 1,623 1,651 +1.7
Iron Ore, Iron & Steel 2,584 2,642 +2.2
Miscellaneous Commodities 3,371 3,414 +1.3
Total 106,496 120,007 +12.7
Source: (1) Based on original 1976 COE Data for those majorusers who responded.
(2) Based on adjustment made to the original COEdata via Battelle survey.
22

TABLE 4. COMPARISON OF 1976 "REIDENTIFIED"
WCSC DATA AND SURVEY RESPONSES FORTHE SELECTED MAJOR USERS
Reidentified SurveyCommodity Tonnages Responses Percentage
Group (000's) (000's) Difference
Coal & Coke 81,233 84,643 +4.2
Petroleum Fuels 15,799 17,274 +9.3
Crude Petroleum 286 0 -100.0
Aggregates 6,691 7,682 +14.8
Grains 3,062 3,052 -0.3
Chemicals & ChemicalFertilizers 5,229 6,325 +21.0
Ores & Minerals 1,651 2,132 +29.1
Iron Ore, Iron & Steel 2,642 3,294 +24.7
Miscellaneous Commodities 3,414 2,665 -21.9
Total 120,007 127,067 +5.9
Source: Battelle Survey
23

point B; Carrier Two moves the barge from point B to the finaldestination C. In this situation, one, both, or neither of thecarriers may report the movement. If Carrier One reports, he maydescribe the movement as proceeding from point A to point B;alternatively, he may describe the entire movement from point A toultimate destination point C. The same holds true for Carrier Two.It is easy to see how this circumstance could result in erroneousrWCSC data.
Circumstance Three: Contract or Chartered Carriage. Contractand chartered commodity movements were frequently unreported. Thesetransportation arrangements blur the distinction between shipperand carrier. It may be that both parties assume that the otherwill report the movement. Or, the carrier may believe that contractcarriers do not have the same reporting obligations as commoncarriers.
Circumstance Four: Transport of Dredged Materials. Each yearmany million of tons of material are dredged from system rivers andmoved to shore for distribution as aggregates. Many of these move-ments are never reported. Carriers may feel no need to report thesemovements because they do not fit the norm. (The movement is typi-cally short, does not transit a lock, and has no dock of origin.)
Erroneously Described Commodities. This problem is confined mainlyto chemicals, ores & minerals and the miscellaneous commodity groups;the iron & steel and petroleum fuels groups also exhibit this problem,but to a lesser degree. Most of the classification errors are withincommodity groups but there is some misallocation between groups.
NEC (Not Elsewhere Classified) categories are a major problem. Theyhave become the repositories of all movements which cannot be readilyassigned to one of the other commodity classes. Unfortunately, there aremany cases when the technical or commercial name used to describe a com-modity prevents it from being recognized and properly categorized. Forexample, "AMAPA" and "COMILOG" are trade names for manganese ore. But,a movement reported as "AMAPA" might end up being categorized as nonferrousores-NEC, or nonmetallic minerals-NEC, or even chemical products-NEC.
There are also some idiosyncracies in the four-digit-commodity groupclassification scheme which may promote errors or ambiguities. Chiefamong these is commodity classification 4118 (waterway improvementmaterials) which is grouped with miscellaneous commodities and amountedto 4 million tons in 1976 on the basis of WCSC data. In many caseswaterway improvement materials are aggregates which have been dredged
j from the river, thereby improving channel depth, or they may be quarriedmaterials delivered to a lock-and-dam project. In these circumstancesthere is no single correct category for the materials moved.
24

There may also be many situations when the barge carrier simplydoes not know what commodity he is carrying. This is particularly trueof chemicals or ores which may have "exotic" names.
It is also important to note that carriers may report their movementsto federal agencies other than COE such as the Coast Guard. The commodityclassifications used by these other agencies do not always coincide withWCSC classifications. This may promote a certain amount of confusion.
Erroneously Described Origins or Destinat-ions. This problem ispervasive in the WCSC data on the dock-specific level. At higher levelsof aggregation it largely disappears. This difficulty may originatein the COE dock listings mentioned earlier. Each year many docks areconstructed, deactivated, leased, and traded; COB dock listings havenot totally kept track of these changes.
The following example shows how this may produce errors in the WCSCdata. A barge carrier may indicate that he delivered 500,000 tons ofaggregates to firm A in Evansville. Unfortunately, the dock which COBlists as belonging to firm A in Evansville may now be operated by agrain shipper. It is also possible that firm A owns a half dozen docksin the vicinity of Evansville. The movement might then be arbitrarily iassigned to one of those six docks.
Many firms in the Basin operate under several different trade names.When these names are based on geography or commodity, several firms mayuse very similar names. This creates ample opportunity for confusion.
Reconsignment enroute of grain, petroleum or coal barges may alsoproduce reporting errors. For example, a grain barge outbound for NewOrleans from Cincinnati may be reconsigned enroute to St. Paul. Themovement has been diverted but underlying paperwork documenting themovement may not change, and the obsolete information eventually findsits way into WCSC files.
Erroneous origin/destination information can also result from theexchange and interlining arrangements discussed earlier.
Ohio River Basin Traffic Growth Projections
The survey responses indicate that barge traffic will grow 74.0percent from 1976 to 1990. Table 5 shows the estimated 1976 base-yeartonnage flows and the projections for 1980, 1985, and 1990. Thesenumbers indicate that growth will be vigorous from 1976 to 1980, mode-rate from 1980 to 1985, and very modest from 1985 to 1990. The shapeof this growth curve is readily explainable.
25

TABLE 5. OHIO RIVER BASIN WATERBORNE TRAFFICPROJECTIONS BY COMMODITY GROUP, TO 1990(IN THOUSAND TONS)
ProjectedGrowth
1976-1990
Commodity Group 1 97 6a 1980 1985 1990 (%)
Coal & Coke 111,631 166,270 201,095 217,335 94.7
Petroleum Fuels 20,922 21,527 22,640 23,764 13.6
Crude Petroleums 664 0 0 0 -100.0
Aggregates 25,169 31,194 34,671 38,339 52.3
Grains 5,583 6,921 7,918 9,004 61.3
Chemicals & ChemicalFertilizers 11,290 12,504 13,802 15,701 39.1
Ores & Minerals 4,435 4,668 5,151 5,627 26.9
Iron Ore, Iron & Steel 5,167 5,779 6,341 6,676 29.2
Miscellaneous Commodities 10,915 18,327 22,385 24,124 121.0
Total 195,776 267,190 314,003 340,570 74.0
Increase Over PreviousPeriod (%) 36.5 17.5 8.5
Overall Growth (1976-1990, %) 74.0
SBased on readjusted volumes from Battelle's survey.
Traffic, particularly coal traffic, will grow strongly throughout thenext decade. But, an anticipated coal strike in 1981 will produce heavy
coal stockpiling in 1980. Coal traffic will surge in that year with aprobably subsidance in 1981. Growth will then resume at a moderate rate,with coal traffic once again being the major growth influence. Onceone gets beyond the 1985 period, business people become increasinglyreluctant to make positive growth projections. Citing various uncer-tainties in the present economic situation, many respondents projectedzero or marginal growth for those final five years.
Many respondents qualified their projections, indicating a numberof factors which might prevent the projected growth from materializing.There was an almost universal expression of anxiety about environmental,regulatory, and zoning laws. Collectively, these restrictions could
significantly dampen barge traffic growth.
Many traffic people also felt that substantial lock improvementsmight be necessary to accomodate the volume of future barge traffic.Otherwise, bottlenecks might physically limit barge activities in theBasin.
A final important consideration is the role of the railroads ascompetitive movers of bulk commodities within the region. Severalrespondents were very critical of rail carriers as bulk commoditymovers. Most respondents totally discounted the potential of railroadsto divert traffic from barges during the projection period. The growthfactors cited earlier reflect this negative perspective.
26

At the same time, it is known that several of the area's railroadsare discussing merger or reorganization, and that the federal governmentis becoming more attentive to the role railroads play in the U.S. trans-portation network. It is possible, therefore, that railroads willcompete more successfully for bulk freight traffic in the Basin thanmany respondents currently assume.
Traffic Growth Projections byCommodity Groupsr
The following commodity group projections (Tables 6 through 13)are all based on the 1976 readjusted tonnages as determined duringthe survey.
Coal. Growing coal consumption will be the most important influenceon barge traffic increases. Table 6 shows the coal comprised 57 percentof commodity tonnage moving in the Basin in 1976; by 1990 coal's trafficshare will have climbed to 63.8 percent.
TABLE 6. OHIO RIVER BASIN WATERBORNE TRAFFIC PROJECTIO!,SFOR COAL, TO 1990
1976 1980 1985 1990
Tonnages (000's) 111,631 166,270 201,095 217,335
Increase Over Previous Period M(-- 48.9 20.9 8.1
Overall Growth (1976-1990, %) ------- 94.7
Coal's Share of Total Traffic %)57.0 62.2 64.0 63.6
Three varieties of coal move in the Basin - metallurgical coal,coke, and steam coal. Although consumption of the first two is expectedto grow moderately, consumption of steam coal (the dominant commodityin this group) is expected to grow dramatically. Most steam coal isconsumed by electric power generating plants. The planning, permitting,and construction of a power plant may take as long as a decade. Be-cause of this, electric utilities are forced to map demand for electri-city (and energy inputs) well into the future. A great deal of confi-dence can be attached, therefore, to coal traffic forecasts. At thesame time, there may be some slippage in the completion dates of plannedpower generating units; coal traffic growth will show a correspondinglag.
Utilities also suggested that EPA restrictions on sulphur emissionsmight slow the use of coal as an energy source substantially more thanprojections indicate.
The depletion of coal reserves and environmental restrictions onsulphur emissions will produce shifts in coal origin points but destina-tion points will remain largely unchanged.
27

Petroleum Fuels. Petroleum fuels barge traffic is expected toincrease slightly (under 14 percent during the projection period). Table7 indicates that this commodity group's traffic share will decline from10.7 percent to 7.0 percent over this period.
TABLE 7. OHIO RIVER BASIN WATERBORNE TRAFFIC PROJECTIONSFOR PETROLEUM FUELS, TO 1990
1976 1980 1985 1990
Tonnages (000's) 20,922 21,527 22,640 23,764
Increase Over Previous Period (%) --- 2.9 5.2 5.0
Overall Growth (1976-1990, %) --- --- 13.6
Petroleum Fuels Share ofTotal Traffic (%) 10.7 8.1 7.2 7.0
Several factors account for the expected slow growth of petroleumfuel traffic. Oil companies expect that petroleum fuels will constitutea progressively smaller portion of the national energy mix in coming
decades. At the same time, the increasing prevalence of exchange
agreements will reduce the barge transportation of petroleum fuels.
Customer exchange agreements were discussed earlier in this chapter.One of their initial effects is a reduction of petroleum fuel transpor-tation measured in ton-miles. A second effect is the consolidation ofpetroleum fuel distribution points, as individual firms come to dominatethe distribution function in specific regions. The ultimate result isthe construction of pipelines (which require large volumes to be econo-mical) to supply the high-volume distribution poiits.
Petroleum fuel transportation proceu.ds in three stages. Crudepetroleum is transported to the refineries in the first stage. Refinedpetroleum products are transported to distribution points in the secondstage. Refined products are taken from distrilution points to finalconsumers in the third transportation stage. Bar es .re involved pri-marily in second stage transportation activitie- fin tlie Basin.
Therefore, the link between refinery and distributor will increasinglybe provided by pipelines rather than barges. In samc cases petroleumfuels will be transported a portion of their haul by pipeline and thentransloaded to barge to complete the trip.
It is likely that prevailing petroleum fuel traffic patterns andvolumes will remain fixed; traffic growth will be absorbed by pipelines.
Crude Petroleum. Crude petroleum movements have been almost totallydiverted from barges to pipelines. Original WCSC data indicated thatmajor users moved 717,000 tons of crude in 1976. The field interviews
28

could not confirm any such movements, nor is any reversal of the diver-sions to pipeline expected. Some future movements of crude petroleumof an emergency "make-up" nature will probably occur in the Basin, butthey will amount to only a few barges per refinery per year.
Aggregates. Table 8 indicates that traffic in aggregates willincrease at a compounding rate of 3-4~ percent over the projection
period. This commodity group's traffic share will decline from 12.9 >percent in 1976 to 11.3 percent in 1990.
TABLE 8. OHIO RIVER BASIN WATERBORNE TRAFFIC PROJECTIONSFOR AGGREGATES, TO 1990
1976 1980 1985 1990
Tonnages (000's) 25,169 31,194 34,671 38,339
Increase Over Previous Period ()--- 23.9 11.1 10.6
Overall Growth (1976-1990, %) --- ----- 52.3
Aggregates Share of Total Traffic () 12.9 11.7 11.0 11.3
The aggregates industry boomed during the interstate highway construc-tion program. The substantial completion of this program left a demandvacuum. To a significant extent that vacuum has been filled by residentialconstruction and road resurfacing (many roads were built decades ago at20 year design standards and are now reaching "maturity"). It is alsoexpected that a continued vigorous growth of the electrical utilityindustry will spur demand for aggregates for use in power plant construc-tion. There are no anticipated booms corresponding to the interstatehighway construction periods, but certain regions such as West Virginia and'aggregate poor' areas of Alabama may experience inordinate increases inaggregate imports from other areas of the Basin.
The extraction and waterborne transportation of aggregates in theOhio River Basin follow a simple pattern. Aggregates such as crushedlimestone, sand or gravel are extracted from quarries or dredged from
* the river bottom. The aggregates are then classified either as theyare loaded into barges (as is the case with dredging) or as they areloaded into trucks for the movements to the barge loading dock (as isthe case with quarries). They then move either directly via barge toconsumption sites, or they are shipped to a major metropolitan areasuch as Louisville or Cincinnati. From these metropolitan areas, theaggregates are either distributed locally or they are further processedand converted into building cement, added to asphalt, or distributed
locally as construction materials. In some instances the materialsare shipped via barge directly to consumption sites after the conversionprocess.
Extraction sites are expected to remain fixed for several reasons.Many firms reported that their existing quarries would provide them withadequate supplies for several decades. Moreover, the environmental andzoning restrictions on establishing new quarry or river dredge sites are
29

rather intimidating. The last factor will tend to eliminate "tramp"quarries, i.e., quarries mined near major construction sites for thepurpose of serving that one project only. The net result will be morewaterborne transportation of aggregates from established sites. It isalso likely that the major users will control a bigger portion of the
market in coming years. Therefore, their growth projections may differ *from industry projections, and the numbers in Table 8 may be somewhatoptimistic.
The destination pointc for aggregates will also remain fixed, withthe exception of the regions mentioned earlier. There will also betemporary traffic surges to specific construction sites such as powerplants.
Grains. As can be seen in Table 9, the traffic share of grain isexpected to remain constant; absolute tonnage increases for the year1990 will amount to 61 percent of the 1976 base year.
TABLE 9. OHIO RIVER BASIN WATERBORNE TRAFFIC PROJECTIONSFOR GRAINS, TO 1990
1976 1980 1985 1990
Tonnages (000's) 5,583 6,921 7,918 9,004
Increase Over Previous Period M(-- 24.0 14.4 13.7
Overall Growth (1976-1990, %) ------ 61.3
Grains Share of Total Traffic ( 2.9 .2.6 2.5 2.6
Grain is collected from throughout the western and central portions
of the Basin by truck and rail. It is transloaded to barge at citiessuch as Cincinnati, Evansville, and Louisville. Most grain is bargedto Gulf ports, transloaded to oceangoing vessels, and shipped abroad.This established pattern is not expected to change. 1
Grain merchants suggested that the projections they provided forTable 9 are optimistic. Advances in agricultural technology may plateau,in which case the output of regional grain-producing lands would stabilize.Moreover, the grain companies have invested heavily in rail rolling stock.It is used to ship grain via unit-trains to East Coast ports. It is theintention of the grain firms to maintain a competitive balance betweenthe modes. The precise traffic split is uncertain.
Chemicals & Chemical Fertilizers. As can be seen in Table 10,chemical traffic in the Basin will grow only half as fast as the average.Its traffic share will decline to 4.6 percent by 1990.
30

TABLE 10. OHIO RIVER BASIN WATERBORNE TRAFFIC PROJECTIONSFOR CHEMICALS & CHEMICAL FERTILIZERS, TO 1990
1976 1980 1985 1990
Tonnages (000's) 11,290 12,504 13,802 15,701
Increase Over Previous Period M% --- 10.8 10.4 13.8r
overall Growth (1976-1990, %) --- --- 39.1
Chemicals Share of Total Traffic M% 5.8 4.7 4.4 4.6
The growth of the chemical industry may be slowed by the enforcementof increasingly stringent air- and water-pollution standards. Theseenvironmental regulations affect chemical transportation as well aschemical production. They require safeguards against seepage and spillsand mandate the purchase of equipment to contain and collect pollutantsshould spills occur.
Established patterns of movement are not expected to change. Themajor chemical producing areas of the Kanawha Valley and the Upperwhile receiving feedstocks from the Lower Mississippi and Gulf Coast.
Advanced technology in containerization has introduced new methodsof transporting resins, plastics, and other granular chemicals in bothcontainers and LASH barge equipment. As a result, there may be moreopportunity for consolidation of these products for barge lot-sizeshipments.
Ores & Minerals. As can be seen in Table 11, the absolute volumeof ore & mineral traffic will increase marginally from 1976 to 1990.Their traffic share will decline to 1.7 percent.
TABLE 11. OHIO RIVER BASIN WATERBORNE TRAFFIC PROJECTIONSFOR ORES & MINERALS, TO 1990
1976 1980 1985 1990
Tonnages (000's) 4,435 4,668 5,151 5,627
Increase Over Previous Period ()--- 5.3 10.3 9.2
Overall Growth (1976-1990, %) --- -- --- 26.9
Ores & Minerals Share of Total
Traffic M% 2.3 1.7 1.6 1.7
31

The commodities contained in this group are mainly ores such asmanganese used for alloy steel production. As such, they are highlydependent on the strength of the steel industry. The firms handlingores & minerals are very cautious in their growth projections for theBasin. This reflects the slow growth expectations of the domesticsteel industry.
Over two-thirds of the ore & mineral traffic in the Basin originatesrin Lower Mississippi and Gulf Coast ports and terminates in the major '1
steel-producing areas of the Basin. These inbound patterns are expectedto continue in the future with little change. Outbound patterns areless certain. Manganese ores are currently being drawn from GSA stock-piles in the Basin. There is a strong possibility that these sourceswill be closed in the near future. As a result, more ore will be im-ported from Africa, Australia, and South American through Lower Missis-sippi and Gulf ports.
Salt is the major nonmetallic mineral in this group. It is broughtinto the Basin from the western Gulf Coast and has a positive growthfuture.
Iron Ore, Iron & Steel. Table 12 shows tliat traffic in iron ore,iron & steel will increase modestly over th Projection period. Itstraffic share will slip from 2.6 percent in 1976 to 2.0 percent in 1990.
TABLE 12. OHIO RIVER BASIN WATERBORNE TRAFFIC PROJECTIONSFOR IRON ORE, IRON & STEEL, TO 1990
1976 1980 1985 1990
Tonnages (000's) 5,167 5,779 6,341 6,676
Increase Over Previous Period M% --- 11.8 9.7 5.3
Overall Growth (1976-1990, %)--- --- --- 29.2
Iron & Steel's Share of Total Traffic (%) 2.6 2.2 2.0 2.0
Intermediate and finished iron & steel products are the most impor-tant commodities in this group. Currently, these products flow from theUpper Ohio and Monongahela Rivers to points downstream within and outsidethe Basin. Recent years have also witnessed a growing volume of foreignsteel imported to the Basin through Gulf and Lower Mississippi ports.
Slow growth predictions for domestic steel are attributable to thethreat of foreign imports and the reluctance of domestic steel producers
J to invest in major new facilities. The exchange value of the dollarwill have a strong influence on the level of foreign steel imports.
32

The firms interviewed predict a continuation of the current balancebetween foreign and domestic steel sources, but there are many qualifica-tions attached to this forecast.
Miscellaneous Commodities. The field interviews resulted in areassignment of many of the movements originally thought to belong inthe miscellaneous category to other commodity groups. NEC categorieswere particularly overburdened with misclassified movements. The fieldinterviews identified the major commodities in this group as asphalt,lime, building cement, naptha, and lubricating oils.
TABLE 13. OHIO RIVER BASIN WATERBORNE TRAFFIC PROJECTIONSFOR MISCELLANEOUS COMMODITIES, TO 1990
1976 1980 1985 1990
Tonnages (000's) 10,915 18,327 22,385 24,124
Increase Over Previous Period M% --- 67.9 22.1 7.8
Overall Growth (1976-1990, --%--)- 121.0
Miscellaneous Commodities Share
of Total Traffic ()5.6 6.9 7.1 7.1
Well over half the tonnage included in this group belongs to non-respondent firms. It is likely that responses from these firms wouldreveal further misclassifications. Because survey projections forcommodities in this group are very limited, the overall growth predic-tion for the group is not very reliable.
Lime (for coal desulphurization) is the major commodity withinthis group for which projections were given. The expected high trafficgrowth for this commodity in effect "pulled" the traffic predictionsfor all commodities in the group.
Traffic Growth Projections by Rivers
This section will discuss the commodity projections as they applyto each of the nine navigable rivers in the Ohio River Basin. Includedwill be descriptions of the principal commodities on each river, thedirection these commodities flow, and how the rivers interact with eachother in terms of these commodity flows. Also covered will be a dis-cussion of the effect of these flows on locks.

Main Stem Ohio. The Ohio is the principal river in the Basin; allother rivers are its tributaries. Table 1~4 shows the projected commodityflows on the Ohio. This table includes through traffic as well as freightwhich originates or terminates on the river. A graphic representation ofgrowth on the river is shown in Figure 4. Approximately L5. percent ofthis volume is through traffic.r
TABLE 14. WATERBORNE TRAFFIC PROJECTIONS,OHIO RIVER, TO 1990(IN THOUSAND TONS)
Commo~dity Group 1976 1980 1985 1990
Coal & Coke 85,842 134,577 167,675 182,298
Petroleum Fuels 20,535 21,104 22,180 23,270
Crude Petroleum 664 0 0 0
Aggregates 20,939 26,091 29,017 32,088
Grains 5,568 6,904 7,897 8,982
Chemicals & ChemicalFertilizers 10,863 12,180 13,459 15,346
Ores & Minerals 4,388 4,644 5,151 5,627
Iron Ore, Iron & iteel 5,164 5,776 6,338 6,672
Miscellaneous Commodities 10,387 17,441 21,303 22,958
Total 164,350 228,717 273,020 297,241
Because such a large portion of the Basin's traffic flows on themain stem Ohio, its growth characteristics and its traffic mix are quitesimilar to the Basin overall.
34

Tons
(in 000's)
300,000-
240,000--
1965 1970 I 1980 1985 J.1990i
1976 Year
FIGURE 4. OHIO RIVER TRAFFIC GROWTH PATTERNS, 1960-1990
35
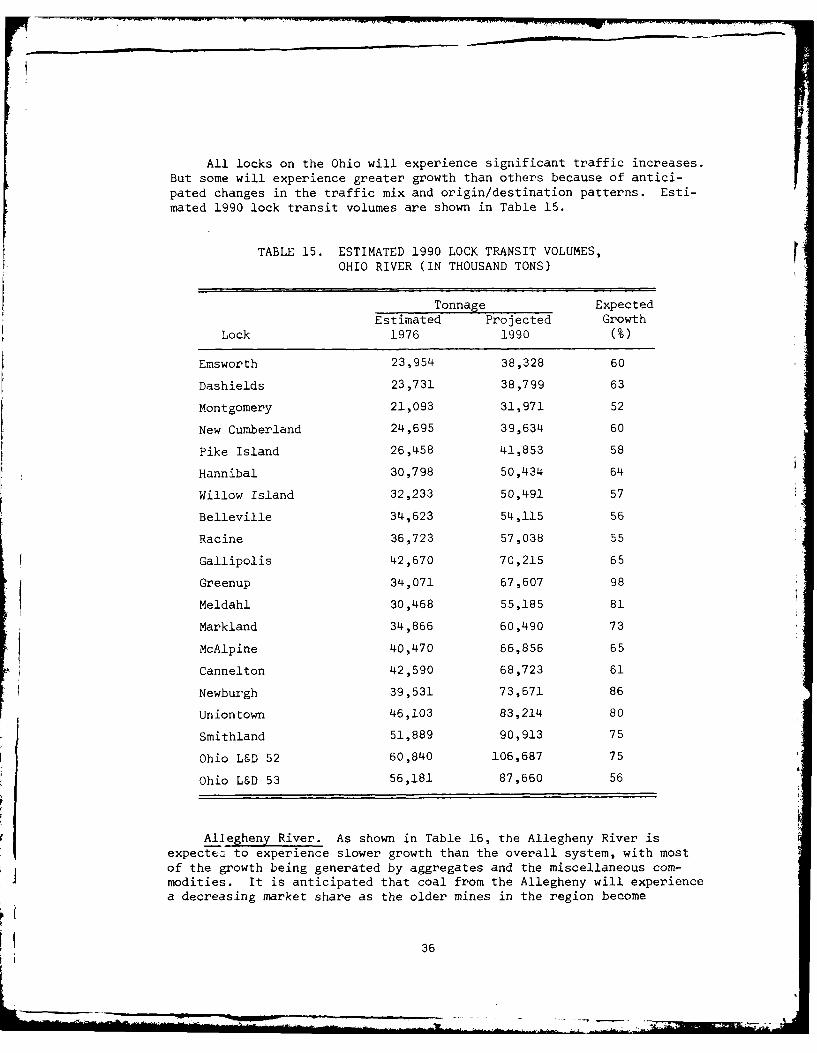
All locks on the Ohio will experience significant traffic increases.But some will experience greater growth than others because of antici-pated changes in the traffic mix and origin/destination patterns. Esti-mated 1990 lock transit volumes are shown in Table 15.
TABLE 15. ESTIMATED 1990 LOCK TRANSIT VOLUMES,OHIO RIVER (IN THOUSAND TONS)
Tonnage ExpectedEstimated Projected Growth
Lock 1976 1990 (%)
Emsworth 23,954 38,328 60
Dashields 23,731 38,799 63
Montgomery 21,093 31,971 52
New Cumberland 24,695 39,634 60
Pike Island 26,458 41,853 58
Hannibal 30,798 50,434 64
Willow Island 32,233 50,491 57
Belleville 34,623 54,115 56
Racine 36,723 57,038 55
Gallipolis 42,670 70,215 65
Greenup 34,071 67,607 98
Meldahl 30,468 55,185 81
Markland 34,866 60,490 73
McAlpine 40,470 66,856 65
Cannelton 42,590 68,723 61
Newburgh 39,531 73,671 86
Uniontown 46,103 83,214 80
Smithland 51,889 90,913 75
Ohio L&D 52 60,840 106,687 75
Ohio L&D 53 56,181 87,660 56
Allegheny River. As shown in Table 16, the Allegheny River isexpected to experience slower growth than the overall system, with mostof the growth being generated by aggregates and the miscellaneous com-modities. It is anticipated that coal from the Allegheny will experiencea decreasing market share as the older mines in the region become
36
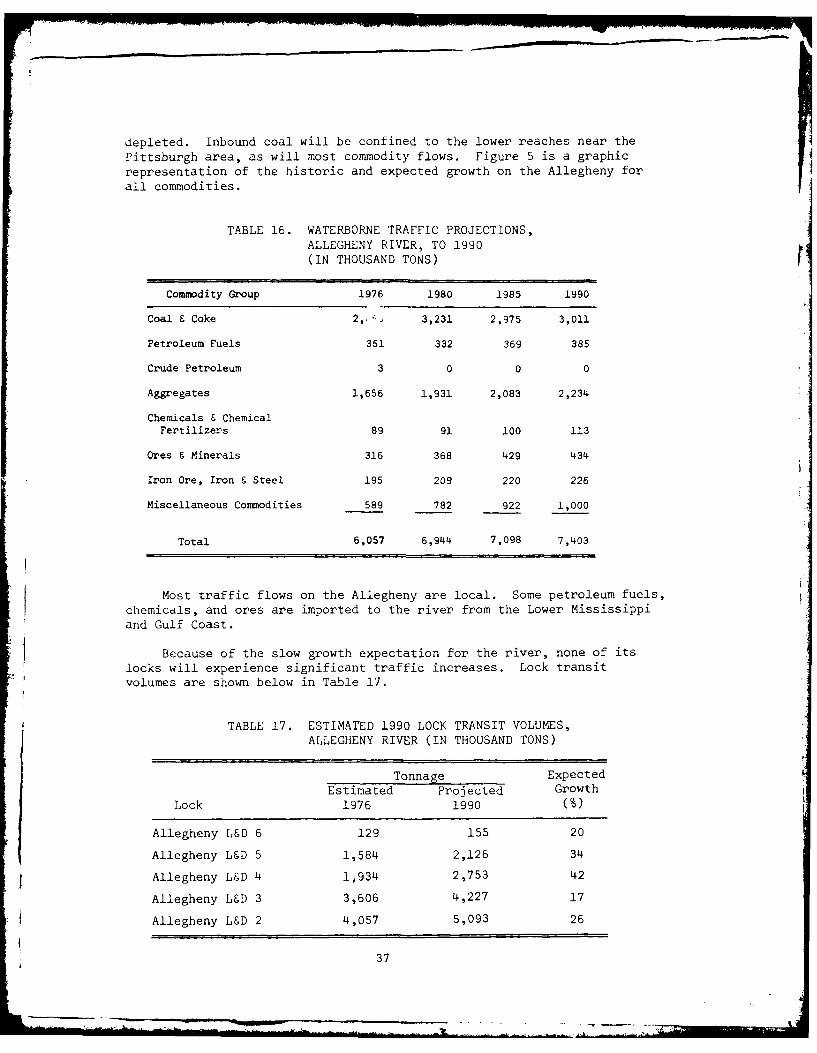
depleted. Inbound coal will be confined to the lower reaches near the
Pittsburgh area, as will most commodity flows. Figure 5 is a graphic
representation of the historic and expected growth on the Allegheny forall commodities.
TABLE 16. WATERBORNE TRAFFIC PROJECTIONS,ALLEGHENY RIVER, TO 1990
(IN THOUSAND TONS)
Comnodity Group 1976 1980 1985 1990
Coal & Coke 2,. 3,231 2,975 3,011
Petroleum Fuels 351 332 369 385
Crude Petroleum 3 0 0 0
Aggregates 1,656 1,931 2,083 2,234
Chemicals & ChemicalFertilizers 89 91 100 113
Ores & Minerals 316 368 429 434
Iron Ore, Iron & Steel 195 209 220 226
Miscellaneous Commodities 589 782 922 1,000
Total 6,057 6,944 7,098 7,403
Most traffic flows on the Allegheny are local. Some petroleum fuels,
chemicals, and ores are imported to the river from the Lower Mississippiand Gulf Coast.
Because of the slow growth expectation for the river, none of its
locks will experience significant traffic increases. Lock transitvolumes are shown below in Table 17.
TABLE 17. ESTIMATED 1990 LOCK TRANSIT VOLUMES,ALLEGHENY RIVER (IN THOUSAND TONS)
Tonnage ExpectedEstimated Projected Growth
Lock 1976 1990 (%)
Allegheny L&D 6 129 155 20
Allegheny L&D 5 1,584 2,126 34
Allegheny LgD 4 1,934 2,753 42
Allegheny L&D 3 3,606 4,227 17
Allegheny L&D 2 4,057 5,093 26
37

Tons(in OOts)
8,000
6,0000
6,000
2,000
2,000
1965 1970 1980 1985 1990
1976 Year
FIGURE 5. ALLEGHENY RIVER TRAFFIC GROWTH PATTERNS, 1960-1990
38
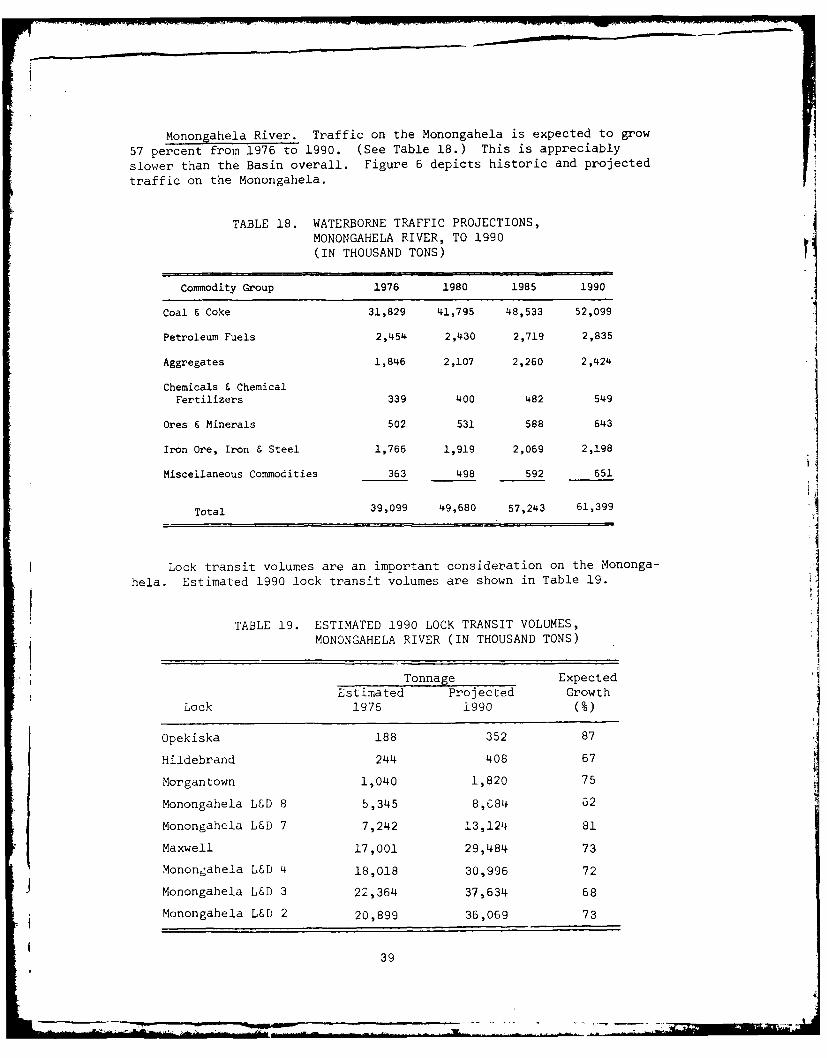
Monongahela River. Traffic on the Monongahela is expected to grow
57 percent from 1976 to 1990. (See Table 18.) This is appreciably
slower than the Basin overall. Figure 6 depicts historic and projected
traffic on the Monongahela.
TABLE 18. WATERBORNE TRAFFIC PROJECTIONS,
MONONGAHELA RIVER, TO 1990(IN THOUSAND TONS)r
commodity Group 1976 1980 1985 1990
Coal & Coke 31,829 41,795 48,533 52,099
Petroleum Fuels 2,454 2,430 2,719 2,835
Aggregates 1,846 2,107 2,260 2,424
Chemicals & ChemicalFertilizers 339 400 482 549
Ores & Minerals 502 531 588 643
Iron Ore, Iron & Steel 1,766 1,919 2,069 2,198
Miscellaneous Commodities 363 498 592 651
Total 39,099 49,680 57,243 61,399 *
Lock transit volumes are an important consideration on the Mononga-
hela. Estimated 1990 lock transit volumes are shown in Table 19. .TABLE 19. ESTIMATED 1990 LOCK TRANSIT VOLUMES,
MONONGAHELA RIVER (IN THOUSAND TONS)
Tonnage ExpectedEstimated Projected Growth
Lock 1976 1990 M%
Opekiska 188 352 87
Hildebrand 244 408 67
Morgantown 1,040 1,820 75
Monongahela L&D 8 5,345 8,C84 .52
Monongahela L&D 7 7,242 13,124 81
Maxwell 17,001 29,484 73
Monongahela LED 4 18,018 30,996 72
Monongahela LED 3 22,364 37,634 68
Monongahela LED 2 20,899 36,069 73
39

Tons(in 0001s)
64,000
56,00-0
48,000/
40,000
32,000
1965 1970 1980 1985 19901976 Year
FIGURE 6. MONONGAHELA RIVER TRAFFIC GROWTH PATTERNS, 1960-1990
40

Kanawha River. Traffic on the Kanawha is expected to grow 57.1percent between 1976 and 1990. Table 20 indicates that almost all ofthis growth will be accounted for by aggregates and coal.
TABLE 20. WATERBORNE TRAFFIC PROJECTIONS,KANAWHA RIVER, TO 1990(IN THOUSAND TONS)
Commodity Group 1976 1980 1985 1990
Coal & Coke 6,986 9,778 12,741 13,114
Petroleum Fuels 1,274 1,303 1,368 1,381
Aggregates 2,118 2,521 2,900 3,328
Chemicals & ChemicalFertilizers 3,588 3,809 4,076 4,171
Ores & Minerals 169 172 185 195
Iron Ore, Iron & Steel 82 84 95 104
Miscellaneous Commodities 220 305 359 380
Total 14,437 17,972 21,724 22,673
The Kanawha serves West Virginia, which is expected to be a growtharea in the Basin because of its coal deposits. The projected influx of Vaggregate traffic is due to expected increases in road and home con-struction. The Kanawha Valley is also heavily laden with chemicalindustry, but this variety of traffic will not increase greatly.
Coal moves both upstream and downstream on the Kanawha. A signi-ficant amount of chemical feedstocks are brought to the river from GulfCoast area. Final chemical products are distributed from the rivermainly to major industrial areas within the Basin. Estimated 1990 locktransit volumes are shown in Table 21.
TABLE 21. ESTIMATED 1990 LOCK TRANSIT VOLUMES,KANAWHA RIVER, (IN THOUSAND TONS)
Tonnage ExpectedEstimated Projected Growth
Lock 1976 1990 (%)
London 1,612 2,531 57
Marmet 5,843 8,573 47
Winfield 11,418 20,263 77
41
. .. .. , . . . ..

Tons(in 000's)
23,000
/19,000 -
//
15,000
11,000
I IIII1965 1970 1980 1985 1990
1976 Year
FIGURE 7. KANAWHA RIVER TRAFFIC GROWTH PATTERNS, 1960-1990
42

Kentucky River. Traffic flows on the Kentucky River are of lowmagnitude and will continue to be so in the future. Although Table 22indicates that the river will experience average growth, tonnage in 1990will only amount to 2 or 3 barges per day.
TABLE 22. WATERBORNE TRAFFIC PROJECTIONS,KENTUCKY RIVER, TO 1990(IN THOUSAND TONS)
Commodity Group 1976 1980 1985 1990
Petroleum Fuels 3 3 3 3
Aggregates 538 625 755 911
Total 541 628 758 914
Aggregates constitute 99 percent of the traffic on the river. Aggre-gate movements ebb and rise with construction cycles and the advent andcompletion of major construction projects. Therefore, traffic volumesmay be very erratic from year to year. But they are expected to showthe trend seen in Figure 8.
Of the fourteen lock and dam projects on the Kentucky only the lowerfour are expected to be used for commercial barge transportation. Volumesthrough these locks are expected to be identical because all confirmedtraffic originates and terminates in the Frankfort area, four poolsupstream from the river mouth. Estimated 1990 lock transit volumes areshown in Table 23.
TABLE 23. ESTIMATED 1990 LOCK TRANSIT VOLUMES,KENTUCKY RIVER, (IN THOUSAND TONS)
Tonnage ExpectedEstimated Projected Growth
Lock 1976 1990 (%)
Kentucky L&D 4 541 914 69
Kentucky L&D 3 541 914 69
Kentucky LgD 2 541 914 69
Kentucky L&D 1 541 914 69
4
1 43

Tons(in 0001s)
900
700 -
500
300
1965 1970 1980 1985 19901976 Year
FIGURE 8. KENTUCKY RIVER TRAFFIC GROWTH PATTERNS, 1960-1990
j 44
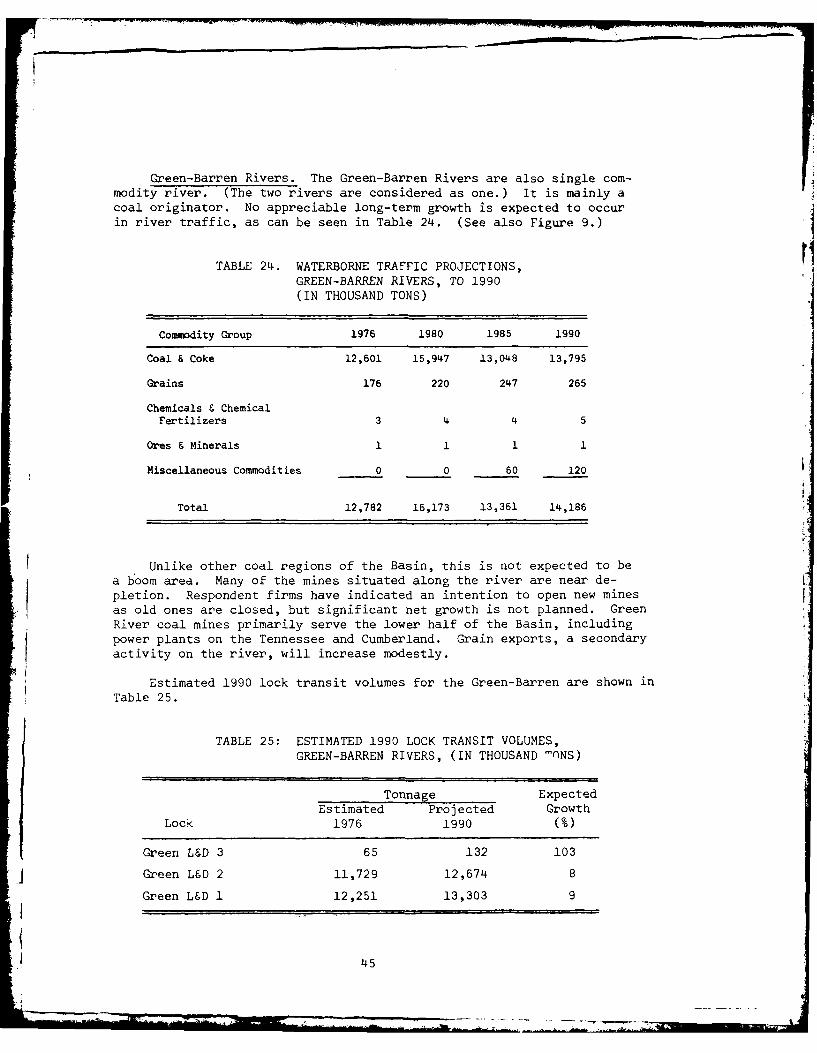
Green-Barren Rivers. The Green-Barren Rivers are also single corn-modity river. (The two rivers are considered as one.) It is mainly acoal originator. No appreciable long-term growth is expected to occur
in river traffic, as can be seen in Table 24. (See also Figure 9.)
TABLE 24. WATERBORNE TRAFFIC PROJECTIONS, 'GREEN-BARREN RIVERS, TO 1990(IN THOUSAND TONS)
Commodity Group 1976 1980 1985 1990
Coal & Coke 12,601 15,947 13,048 13,795
Grains 176 220 247 265
Chemicals & ChemicalFertilizers 3 4 4 5
Ores &Minerals 1 1 1 1
Miscellaneous Commodities 0 0 60 120
Total 12,782 16,173 13,361 14,186
Unlike other coal regions of the Basin, this is not expected to bea boom area. Many of the mines situated along the river are near de-pletion. Respondent firms have indicated an intention to open new minesas old ones are closed, but significant net growth is not planned. GreenRiver coal mines primarily serve the lower half of the Basin, includingpower plants on the Tennessee and Cumberland. Grain exports, a secondaryactivity on the river, will increase modestly.
Estimated 1990 lock transit volumes for the Green-Barren are shown inTable 25.
TABLE 25: ESTIMATED 1990 LOCK TRANSIT VOLUMES,
GREEN-BARREN RIVERS, (IN THOUSAND -"ONS)
--Tonnage ExpectedEstimated Projected Growth
Lock 1976 1990 M%
Green L&D 3 65 132 103
JGreen L&,D 2 11,729 12,674 8
Green L&D 1 12,251 13,303 9
45

Tons(in 00' s)
18,000-
15,000- IN
12,000-
9,000--
3,000-
3,000--
1965 1970 I 1980 1985 19901976 Year
FIGURE 9. GREEN-BARREN RIVERS TRAFFIC GROWTH PATTERNS, 1960-1990
46
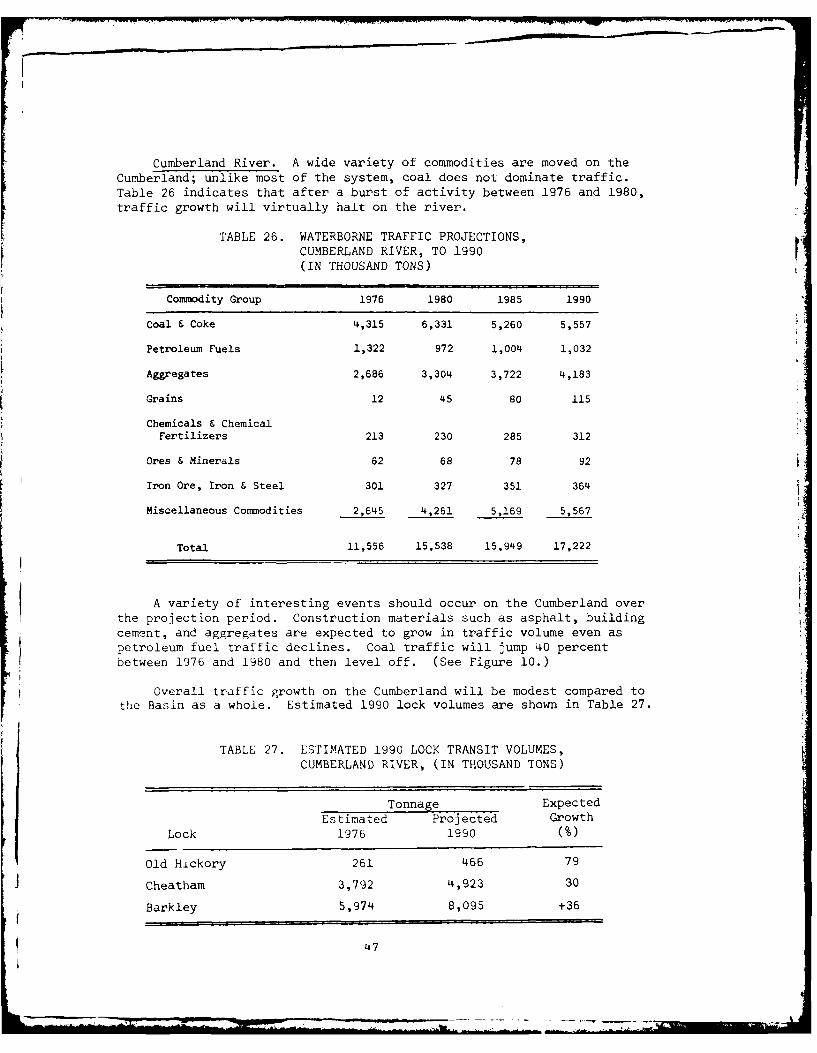
Cumberland River. A wide variety of commodities are moved on the
Cumberland; unlike most of the system, coal does not dominate traffic.Table 26 indicates that after a burst of activity between 1976 and 1980,traffic growth will virtually halt on the river.
TABLE 26. WATERBORNE TRAFFIC PROJECTIONS,CUMBERLAND RIVER, TO 1990(IN THOUSAND TONS)
Commodity Group 1976 1980 1985 1990
Coal & Coke 4,315 6,331 5,260 5,557
Petroleum Fuels 1,322 972 1,004 1,032
Aggregates 2,686 3,304 3,722 4,183
Grains 12 45 80 115
Chemicals & ChemicalFertilizers 213 230 285 312
Ores & Minerals 62 68 78 92
Iron Ore, Iron & Steel 301 327 351 364
Miscellaneous Commodities 2,645 4,261 5,169 5,567
Total 11,556 15,538 15,949 17,222
A variety of interesting events should occur on the Cumberland overthe projection period. Construction materials such as asphalt, buildingcement, and aggregates are expected to grow in traffic volume even aspetroleum fuel traffic declines. Coal traffic will jump 40 percent
between 1976 and 1980 and then level off. (See Figure 10.)
Overall traffic growth on the Cumberland will be modest compared tothe Basin as a whole. Estimated 1990 lock volumes are shown in Table 27.
TABLE 27. ESTIMATED 1990 LOCK TRANSIT VOLUMES,CUMBERLAND RIVER, (IN THOUSAND TONS)
Tonnage ExpectedEstimated Projecte Growth
Lock 1976 1990 M%
old hickory 261 466 79
Cheatham 3,792 4,923 30
Barkley 5,974 8,095 +36
47

Tonst(in 0001s)
18,000-
15,000
12,000/
9,000-
6,000
3,000
1965 1970 I1980 1985 19901976l Year
FIGURE 10. CUMBERLAND RIVER TRAFFIC GROWTH PATTERNS, 1960-1990
L48

Tennessee River. Traffic on the Tennessee will grow 86.5 percentfrom 1976 to 1990. Almost all of this growth is projected to occurbetween 1976 and 1980. Table 28 indicates that coal traffic is expectedto increase by 1'4 million tons over this brief period and then subside.
TABLE 28. WATERBORNE TRAFFIC PROJECTIONS,TENNESSEE RIVER, TO 1990(IN THOUSAND TONS)
Commo~dity Group 1976 1980 1985 1990
Coal & Coke 9,840 24,249 23,357 23,239
Petroleum Fuels 1,832 1,842 1,960 2,080
Aggregates 3,194 3,945 4,418 4,934
Grains 1,502 1,813 2,072 2,336
Chemicals & Chemical
Fertilizers 2,661 2,861 3,001 3,210
Ore &t theas ,1 ,38 142 ,4
Iron Ore, Iron & Steel 703 748 793 816
Total 25,089 43,383 45,057 46,787
pansonsandaddtios t riersie fciltie bytheutiitycompanies
be a significant subsidance in coal traffic in 1981 followed by moderategrowth to 1985; no growth is projected thereafter. The Tennessee is alsoa major grain-producing and aggregate-consuming region. Traffic in bothof these commodities will grow vigorously. Most of the grain will beexported, but there will also be significant inbound tonnages of animalfeed. The aggregates will come both from the Tennessee itself and fromnear reaches of the Cumberland and Ohio. (See Figure 11.)
Estimated 1990 lock transit volumes for the Tennessee are shown inTable 29. The tonnage shown for the Kentucky Lock includes that Cumber-land River traffic which by-passes Barkley Lock and the mouth of theCumberland by traversing the Barkley Canal.
'49

Tons(in 000s)
46,000 - -
40,000/
34,000/
28,000
22,000 r-
1965 1970 1980 1985 19901976 Year
FIGURE 11. TENNESSEE RIVER TRAFFIC GROWTH PATTERNS, 1960-1990
50

TABLE 29. ESTIMATED 1990 LOCK TRANSIT VOLUMES,TENNESSEE RIVER, (IN THOUSAND TONS)
Tonnage ExpectedEstimated Projected Growth
Lock 1976 1990 (%)
Ft. Loudon 228 409 79
Watt's Bar 378 673 78
Chickamauga 973 1,423 46
Nickajack 4,763 7,414 56
Guntersville 4,561 8,276 81
Wheeler 6,721 11,779 75
Wilson 7,030 12,220 74
Pickwick 7,923 24,159 205
Kentucky Dam 18,475 36,581 98
Traffic Growth Projections by BEA's
BEA's are used by man federal agencies for economic analysis. Theyare smaller and economir-±ly more homogeneous than states. BEA's occupy anintermediate status between rivers and PE's. As such they indicate whichstretches of the Basin's rivers are expected to experience the most traf-fic growth and whether that growth will be largely outbound or inbound.The analysis of the waterborne traffic flowing in and out of BEA's alsogives insight into the economy and growth expectations of a region.
It is something of an oversimplification, but BEA's can be roughlydivided into three classes. The first class includes BEA's with heavyamounts of extractive industries (coal and ore mines, oil production,etc.); these BEA's tend to have heavy outbound traffic. The second classof BEA's has a manufacturing orientation; its commodity movements aretypically weighted towards inbound traffic. When a BEA shows highvolumes of both outbound and inbound traffic, there is usually a largeamount of waterborne traffic internal to the BEA. This third class ofBEA typically has manufacturing industry situated near mineral depositsin order to minimize transportation costs.
A cautionary note is in order at this point. The traffic which islisted and analyzed for each BEA includes only that traffic which origi-nates or terminates on a river in the Ohio Basin. If a BEA includes a
stretch of river not located in the Basin its traffic is excluded fromthe analysis unless it is inbound or outbound from the Basin. It shouldalso be noted that, for ease of display, intra-BEA tonnage was counted
51

as both inbound to and outbound from the BEA's concerned. Therefore,these two columns cannot be summed to yield total net tonnage.
Due to roundings it should be noted that the following tables(Table 30 thru 4'4) the suns of the individual group totals may not
add to the exact total figures as shown.
Pittsburgh BEA. The Pittsburgh BEA encompasses the headwaters ofthe Oho most of th Monongahela, and all of the Allegheny. It is byfar the most heavily trafficked BEA in the Basin. Although the steelindustry is most important, many other varieties of manufacturing occurin this area. Almost 32 million tons of this traffic moved internallyto the BEA in 1976.
The Pittsburgh BEA is projected to handle the largest volumes of in-bound tonnage through 1990. However, the growth rate for this inboundtraffic is not expected to show the rate of growth exhibited in theoverall Basin projections. Outbound traffic growth is expected toclosely reflect the Basin's growth rate. Only the Huntington BEA isprojected to have a greater outbound traffic volume by 1990.
TABLE 30. PROJECTED 1990 TRAFFIC GROWTH BY
COMMODITY GROUP, PITTSBURGH BEA
Projected ProjectedEstimated Outbound Growth Estimated Inbound Growth
cow ityTonae (in 000'9) 1976-1990 Tnnage (in 6001s) 1976-1990Group 196 1990 0%) 1976 1990 M'.
Coal &Coke 36.298 59,856 +65 38.396 58,605 +53
Petroleum Fuels 672 691 +3 4.076 4.410 +8
Crude Petroleum 3 0 -100
Aggregates 6,224 9.414 +51 5,806 8,275 +43
Chemicals & ChemicalFertilizers 1,052 1,548 +47 1,455 2,088 +44
Ores & Minerals 145 236 +63 833 1,090 +31
iron Ore, iron & steel 2,316 2,735 +18 1,309 1,693 +29
Miscellaneous Commdities 450 835 +86 1,177 2,244 +91
Total 1 47,157 75,316 +60 1 53,056 78,406 48
52
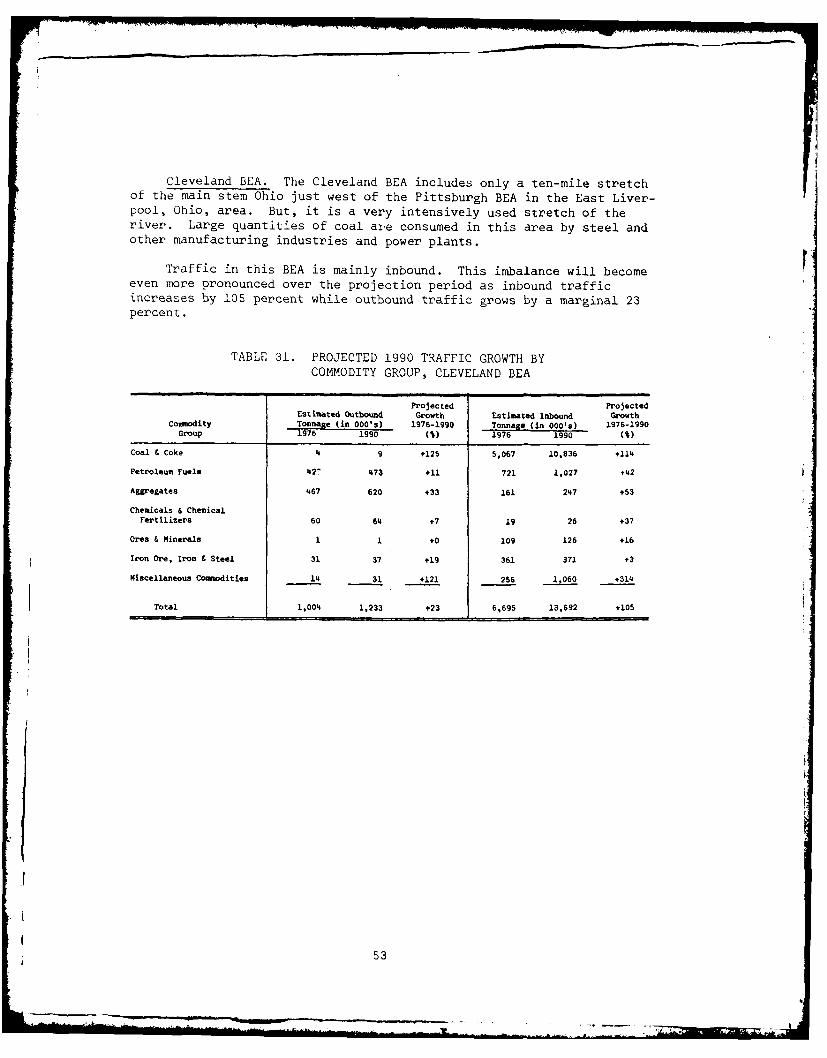
Cleveland BEA. The Cleveland BEA includes only a ten-mile stretchof the main stem Ohio just west of the Pittsburgh BEA in the East Liver-pool, Ohio, area. But, it is a very intensively used stretch of theriver. Large quantities of coal aie consumed in this area by steel andother manufacturing industries and power plants.
Traffic in this BEA is mainly inbound. This imbalance will becomeeven more pronounced over the projection period as inbound trafficincreases by 105 percent while outbound traffic grows by a marginal 23percent.
TABLE 31. PROJECTED 1990 TRAFFIC GROWTH BYCOMMODITY GROUP, CLEVELAND BEA
Projected ProjectedEstimated Outbound Growth Estimated Inbound Growth
Commodity Tonnage (in 000's) 1976-1990 Tonnage (in 000's) 1976-1990Group 1976 1990 (M) 1976 1990 (%)
Coal & Coke 4 9 +125 5,067 10,836 +114
Petroleum Fuels 42' 473 +11 721 1,027 +42
Aggregates 467 620 +33 161 247 +53
Chemicals & ChemicalFertilizers 60 64 +7 19 26 +37
Ores & Minerals I 1 +0 109 126 +16
Iron Ore, Iron & Steel 31 37 +19 361 371 *3
Miscellaneous Commodities 14 31 +121 256 1,060 +314
Total 1,004 1,233 +23 6,695 13,692 +105
53

Columbus BEA. The Columbus BEA is bounded on the east by a smallstretch of the main stem Ohio situated to the north of the HuntingtonBEA. Chemicals are the most important outbound commodity on this stretchof the river. Inbound traffic is twice as large as outbound and is com-posed primarily of aggregates and coal.
Outbound movements will increase moderately from this region, ledby coal. Inbound commodities such as chemicals and coal will grow at apace equal to the Basin's overall growth rate. The traffic balance willbecome more heavily weighted toward inbound movements.
TABLE 32. PROJECTED 1990 TRAFFIC GROWTH BYCOMMODITY GROUP, COLUMBUS BEA
Projected ProjectedEstited Outund Gowth Estimated Inbound Growth
Commodity Tonnage (in 000's) 1976-1990 Tonnage (in 000's) 1976-1990Group 1976 1990 (%) 1976 199 (%)
Coal & Coke 322 1,020 +217 1,161 2,835 +144
Petroleum Fuels 4 5 +25 700 773 +10
Crude Petroleum 0 0 0 164 0 -100
Aggregates 208 318 +53 1,45e 2,291 +57
Grains 2 4 +100 0 0 0
Chemicals & ChemicalFertilizers 1,831 2,232 +22 204 987 +384
Ores & Minerals 27 20 -26 314 371 +18 'Iron Ore, Iron & Steel 79 86 +9 66 78 +18
Miscellaneous Conmoditiee a 17 +113 239 689 +188
Total 2,482 3,702 +49 4,306 8,022 +86
'1II
i 54

Huntington BEA. The Huntington BEA is situated on the upper portionof the main stem Ohio. It includes portions of Kentucky, West Virginia,and Ohio and all of the Kanawha Riyer. This is one of the major trafficoriginating and terminating BEA~s in the Basin. Coal, petroleum fuels,chemicals, and aggregates are by far the most important commodities.In 1976, 13 million tons of these commodities moved internally to theBEA; 23 million tons were exported and 15 million tons imported.
The Huntington BEA is expected to be one of the coal boom areas inthe Basin. ts such, outbound coal traffic is expected to experienceexemplary growth over the projection period. It is expected to surpassthe Pittsburgh BEA by 1990 to become the largest coal exporting BEA inthe Basin.
TABLE 33. PROJECTED 1990 TRAFFIC GROWTH BYCOMMODITY GROUP, HUNTINGTON BEA
Projected ProjectedEstimated Outbound Growth Estimated Inbound Growth
Commodity Tonnage (in 000's) 1976-1990 Tonnage (in 000's) 1976-1990Group 1976 1990 (%) 1976 1990 (%)
Coal & Coke 27,430 66,774 +143 15,347 28,004 +83
Petroleum Fuels 4,974 5,597 +13 3.094 3,670 +19
Aggregates 1,987 3.038 +53 3,575 5,600 +57
Grains 1 2 +100 0 0 0
Chemicals & ChemicalFertilizers 1,113 1,225 +10 4.088 4.818 +20
Ores & Minerals 71 74 +4 212 249 +17
Iron Ore, Iron & Steel 172 211 +23 69 275 +298
Miscellaneous Commodities 451 1,235 +174 280 509 +82
Total 36,200 78,156 +116 26,665 43,226 +62
55

Clarksburg BEA. This BEA is situated in West Virginia on the Upper
Monongahela. Its traffic is almost entirely coal, outbound and inbound.
Almost all of this coal is consumed within the Clarksburg and PittsburghBEA's.
Traffic in this area will grow modestly. Many of the mines inthis area produce high-sulfur coal, which is currently at a competitivedisadvantage.
TABLE 34. PROJECTED 1990 TRAFFIC GROWTH BYCOMMODITY GROUP, CLARKSBURG BEA
Projected Projected
Estimated Outbound Growth Estimated Inbound Growth
Commodity Tonnage (in 000's) 1976-1990 Tonnage (in 000's) 1976-1990
Group 1976 1990 (%) 1976 1990 (%)
Coal £ Coke 3,526 6,366 +81 2,340 2,949 +26
Petroleum Fuels 0 0 0 295 350 +19
Aggregates 672 673 +0 0 0 0
Ores & Minerals 0 0 0 50 64 +28
MNseel Lneous Commodities 0 0 0 39 86 121
Total 4,199 7,040 +68 2,724 3,449 +27
56
56

Cincinnati BEA. The Cincinnati BEA envelopes the mid-reach of theOhio River. It includes the Licking River, a small tributary whichmerges with the Ohio at Cincinnati. Inbound tonnage is more than twotimes the outbound tonnage for the Cincinnati BEA. This is consistentwith the pattern set by other major manufacturing BEA's.
This BEA will experience twice the traffic growth of the averageBEA in the Basin for both outbound and inbound traffic. The major com-ponent of these increases is a high coal growth rate. Outbound coalgrowth is due to the expected development of coal loading facilities inthe area. The high growth rate for inbound coal can be attributed toexpected industrial development in the area as well as increasedconsumption at existing and planned power plants on the river.
TABLE 35. PROJECTED 1990 TRAFFIC GROWTH BYCOMMODITY GROUP, CINCINNATI BEA
Projected ProjectedEstimated Outbound Growth Estimated Inbound Growth
Commodity Tonnage (in 000's) 1976-1990 Tonnage (in 000's) 1976-1990Group 1976 1990 (%) 1976 1990 (%)
Coal Coke 2,653 11,699 +341 15,266 47,326 +210
Petroleum ruels 1,854 2,476 +34 2,145 2,354 +10
Aggregates 2,440 3,022 +24 2,195 2,993 +36
Grains 1,437 2,585 +80 1 2 +100
Chemicals & ChemicalFertilizers 66 85 +29 1,299 2,498 +92
Ores & Minerals 0 0 0 670 1,075 +60
Iron Ore, Iron & Steel 62 67 +8 659 965 +46
Miscellaneous Commdities 397 1,582 +298 793 1,634 +106
Total 8,909 21,516 +142 23,027 58,846 +156
57

Louisville BEA. The Louisville BEA includes the mid-reach of theOhio River between the Cincinnati and Evansville BEA's. It is an impor-tant center of waterborne activity. The full-range of commodities arehandled by the Louisville BEA, but coal, petroleum fuels, and aggregatesare the most important.
Louisville will experience marginal inbound traffic growth andvigorous outbound growth. For the first time it will become a majorcoal-exporting BEA. Outbound and inbound traffic will come into roughbalance.
TABLE 36. PROJECTED 1990 TRAFFIC GROWTH BYCOMMODITY GROUP, LOUISVILLE BEA
Projected ProjectedEstimated Outbound Growth Estimated Inbound Growth
Commodity .Ton O00's) 1976-1990 Tonnage (in 000's) 1976-1990Group 1976 1990 (%) 1976 1990 (M)
Coal & Coke 377 2,428 +544 6,744 6,643 -1
Petroleum Fuels 333 349 +5 3,992 4,887 +22
Aggregates 4,614 7,157 +55 2,621 3,719 +42
Grains 169 244 +44 0 0 0
Chemicals & Chemical
Fertilizers 18 22 +22 292 368 +26
Ores & Minerals 0 0 0 81 103 +27
Iron Ore, Iron & Steel 86 92 +7 348 397 +14
Miscellaneous Commodities 162 221 +36 393 816 +108
Total 5,760 10,513 +83 14,471 16,931 +17
58

Evansville BEA. This BEA contains portions of the lower main stemOhio and all active portions of the Green River. Energy commoditiesand aggregates dominate inbound traffic. These two commodities plusgrains also constitute the bulk of outbound traffic.
The Evansville BEA will experience slow outbound traffic growth,but inbound tonnage will almost triple. This latter increase will beled by an 11-million ton jump in coal imports mainly due to new powerplants in the area.
TABLE 37. PROJECTED 1990 TRAFFIC GROWTH BYCOMMODITY GROUP, EVANSVILLE BEA
Projected ProjectedEstimated Outbound Growth Estimated Inbound Growth
Commodity Tonnae (in 000's) 1976-1990 Tonnage (in 000'.) 1976-1990Group 1976 1990 (%) 1976 1990 (%)
Coal & Coke 29,343 39,364 +34 1,582 12,147 +768
Petroleum Fuels 3,398 3,448 +1 1,252 1,669 +33
Crude Petroleum 0 0 0 497 0 -100
Aggregates 1,999 4,039 102 1,646 2,172 +32
Grains 2,206 3,325 +51 163 257 +58
Chemicals & ChemicalFertilizers 65 68 +5 756 971 +28
Ores & Minerals 53 74 40 660 745 +13
Iron Ore, Iron & Steel 58 74 t28 96 142 +48
Miscellaneous Commodities 281 624 +122 264 591 +124
Total 37,403 51,017 +36 6,916 18,693 +170
.11 59

Paducah BEA. The Paducah BEA includes the mouths of the Ohio,Cumberland, and Tennessee Rivers and the mid-reach of the MississippiRiver above and below Cairo. The full spectrum of commodities are movedto and from this BEA. In the 1976 base its traffic volumes were substan-tial but less than Pittsburgh, Huntington, and Cincinnati.
By all appearances traffic will grow very vigorously in this BEA,both outbound and inbound. Paducah will become one of the most impor-tant coal-exporting BEA's partially due to coal docks in the area handlingincreasing amounts of western coal for barge movement up river. Alsomore of this BEA's existing coal mines are expected to move increasingtonnage by water to riverside power plants.
TABLE 38. PROJECTED 1990 TRAFFIC GROWTH BYCOMMODITY GROUP, PADUCAH BEA
T Projected ProjectedCom.sodity Estimated Outbound Growth Estimated Inbound Growth
Group Tonnae (in 000't) 19iC-1990 Tonnatge (in O0O' ) 1976-19901$J76 _930 M% !, 76 1,J90 (14)
Coal & Coke 5,564 25,347 +356 2,346 5,450 +134
Pet.roleum Fuels 377 468 +24 1,047 1,497 +43
Aggregates 3,660 5,667 +54 1,593 3,573 +12-,
Grains 266 385 +45 2 92 +4600
Chemizals L ChemicalFertilizers 495 555 +12 404 498 +23
Ores & Minerals 60 53 -12 572 536 -b
Iron Ore, Iron & Steel 128 132 +3 89 92 +3
Miscellaneous Commodities 4,786 11.G65 +131 1,090 2438 121
Total 15,356 43,672 +184 7,143 14,187 +99
60
- -- -'* - --

Lexington BEA. The Lexington BEA contains the mid and upper reaches
of the Kentucky River. Its profile is identical to the Kentucky River.
One or two barges of aggregates are inbound daily from the main stem
Ohio. A marginal quantity of petroleum fuels were exported by barge.
Growth expectations for the BEA are average, but there are no
indications that this will become a major region of barge activity.
TABLE 39. PROJECTED 1990 TRAFFIC GROWTH BY
COMMODITY GROUP, LEXINGTON BEA
Projected ProjectedEstimated Outbound Growth 1 Estimated Inbound Growth
Commodity Tonnage (in 000's) 1976-i990 Tonnage (in GO's) 197i-I90
Croup 1976 190 (%) 1976 1990 (%)
Petro2.uem Fuels 3 3 0 0 0 0
Aggegates 0 0 0 53d 911 t69
Total 3 3 538 911 t69
61

Nashville BEA. The Nashville BEA contains the middle reach of the
Cumberland River, a portion of the middle Tennessee River, and the head-waters of the Green-Barren Rivers. This is a low traffic volume BEA.
There is a heavy traffic imbalance towards inbound movements. The onlyoutbound commodity of consequence is aggregates. As with most BEA's a
large portion of the aggregates produced by the region are consumed rinternally.
The projections indicate that Nashville will be a slow trafficgrowth BEA. Nor will any single commodity group experience dramaticgrowth in absolute terms.
TABLE 40. PROJECTED 1990 TRAFFIC GROWTH BYCOMMODITY GROUP, NASHVILLE BEA
Projected Projected
Estimated Outbound Growth Estiated Inbound Growth
Commodity Tonnage (in 000's) 1976-1990 Tonnage (in 000's) 1976-1990
Group 1976 1990 (%) 1976 1990 (1)
Coal & Coke 98 200 +104 7,501 9,478 +26
Petroleum Fuels 10 11 +10 1,322 1,032 -22
Aggregates 1,269 2,026 +60 2,623 4,136 +58
Grains 12 115 +858 0 0 0
Chemicals & ChemicalFertilizers 31 77 +148 489 642 +31
Ores & Minerals 185 320 +73 280 345 +23
Iron Ore. Iron & Steel 58 62 +7 319 399 +25
Miscellaneous Commodities 119 263 +121 654 1,183 +81
Total 1,782 3,075 +73 13,188 17,213 +31
662

Huntsville BEA. This BEA straddles the mid-portion of the TennesseeRiver. It contains a substantial amount of industry particularly steelindustry. This BEA originates and terminates a full range of commoditiesin roughly the same proportion as the Basin overall.
Outbound traffic is expected to decline by 33 percent from theHuntsville BEA. This is largely due to a collapse of outbound coaltraffic. Inbound coal traffic will grow as outbound traffic declines.Inbound traffic overall will increase by 155 percent.
TABLE 41. PROJECTED 1990 TRAFFIC GROWTH BYCOMMODITY GROUP, HUNTSVILLE BEA
Projected ProjectedEstimated Outbound Growth Estimated Inbound Grow:h
Commodity onnge (in O00's) l97n-Ln.0 Tonnae (in ooC) l 7 -i s0Group 117b 199O (6) 1976 1i$1 ( )
Coal & Coke 2,863 400 -86 3,071 iIe59 t286
?e:roleun Fuels 56 56 +0 447 348 -22
Aggregates 146 223 +53 292 446 +53
Grains 70 112 +60 661 1,030 +56
Chemicals . ChemicalFertilizers 258 348 +35 1,133 1,302 +15
Ores & Minerals 47 0 -100 168 213 +27
Iron Ore, Iron & Steel 65 80 +23 235 277 +18
Miscellaneous Commodities 760 1,658 +118 398 900 126
Total 4,264 2,876 -33 6,404 16,377 +155
63

Chattanooga BEA. The Chattanooga BEA contains most of the upperportion of the Tennessee (its headwaters are in the Knoxville BEA). Itexperiences moderate traffic volumes with a slight weighting towardsinbound traffic. As with other BEA's on the Tennessee, the full spectrumof commodities is handled.
River traffic growth is expected to lag behind the Basin average.Coal and aggregates will be the most important growth commodities.
TABLE 42. PROJECTED 1990 TRAFFIC GROWTH BYCOMMODITY GROUP, CHATTANOOGA BEA
Projected ProjectedEstimated Outbound Growth Estimated Inbound Growth
Commodity Tonnage (in 000's) 1976-1990 Tonnage (in 000's) 1976-1990Group 1975 1990 (%) 1976 1930 (%)
Coal & Coke 1,533 2.343 +53 835 2,040 .i4
Petroleum Fuels 0 0 0 511 406 -21
Aggregates 1,345 2,059 +53 1,275 1,951 +53
Grains 8 12 +50 707 1,090 +54
Chemicals & ChemicalFertilizers 38 53 +39 254 352 +39
Ores & Minerals 1 1 +0 154 Is +27
Iron Ore, Iron & Steel 18 22 +22 107 130 +21
Miscellaneous Commodities 230 385 +67 668 1,349 '102
Total 3,174 4,875 +54 4,509 7,513 +67
j
64
.. ..... .
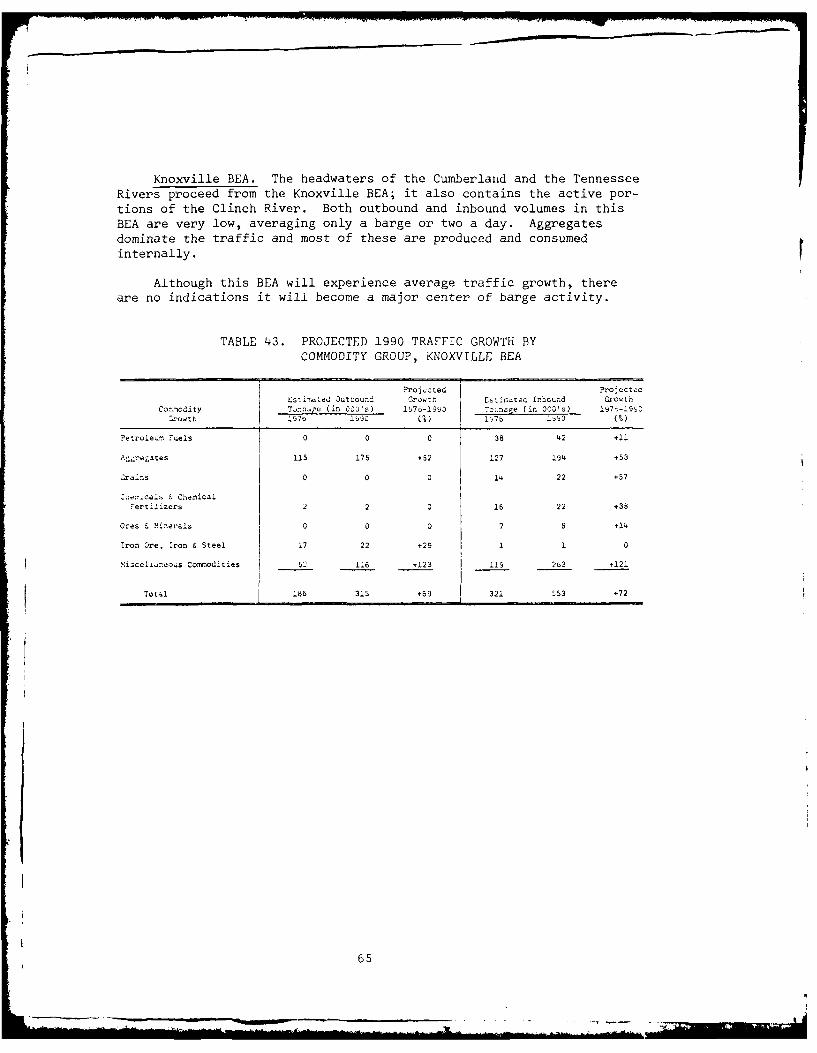
Knoxville BEA. The headwaters of the Cumberlanid and the TennesseeRivers proceed from the Knoxville BEA; it also contains the active por-tions of the Clinch River. Both outbound and inbound volumes in thisBEA are very low, averaging only a barge or two a day. Aggregatesdominate the traffic and most of these are produced and consumedinternally.
Although this BEA will experience average traffic growth, thereare no indications it will become a major center of barge activity.
TABLE 43. PROJECTED 1990 TRAFFIC GROWTH BYCOMMODITY GROUP, KNOXVILLE BEA
~S~tj uto~ P roj~cted Projscted
o'IoiyTs's (inL 00:)'s)- 176-1s 7o;,na~e (O03's) l97n-19 C
Petroleum. %~els 1 0 0 0 38 42 t1
Aggregates 115 175 t52 127 194 +53
;r :.s0 0 0 14 22 +57
Cem dl I cnern~calertilizers 2 2 0 16 22 +38
ores & 6inet'als 0 0 0 7 8 +14
Iron Ore, :ron & Steel 17 22 +29 1 1 0
MLicclidne.Dus CoornO ties 5-1 116 -+123. 119 263 +121
Total j 186 315 +69 321 553 +72
6 5

Memphis BEA. The Memphis BEA includes a stretch of the Mississippisouth of Cairo and is bounded on the east by the Lower Tennessee. ThisBEA experiences a heavy imbalance of inbound over outbound traffic. Awide variety of commodities are imported to this BEA, led by the energyproducts coal and petroleum fuels. The only outbound commodity ofconsequence in the BEA is petroleum fuels.
This BEA will experience average inbound traffic growth andnegligible outbound growth.
TABLE 44. PROJECTED 1990 TRAFFIC GROWTH BYCOMMODITY GROUP, MEMPHIS BEA
Projected ProjectedEstimated Outbound Growth Estimated Inbound Grow:n
Commodity Tonnge (in 000s) 10/U-1990 Tonnage (in 00O's) 1976-1g90
Group 1971 1990 (%) 1976 190 (9)
Coal & Coke 0 0 0 1,617 3,231 +100
Petroleum Fuels 705 779 +10 509 509 +0
Aggregates 0 0 0 450 688 +53
Grains 0 0 0 19 31 +63
Chemicals & ChemicalFertilizers 31 43 39 110 129 +17
Ores & Xinerals 0 0 0 i 1 +0
Iron Ore, Iron & Steel 22 26 +18 102 116 +14
Miscellaneous Commodities 17 37 +118 576 1,201 t109
Total 774 885 +14 3,384 5,907 +75
6

Ohio River Basin WaterwayUsers' Views and Concerns
This section highlights the information obtained in response tosurvey questions on pages 5 thru 9 of the questionnaire. For theseissues or topics concluded to be of most concern to the current usersof the waterway, interpretations are provided as directly extractedfrom the individual qualitative responses, or as otherwise obtained fromanalysis of responses in aggregate. Brief discussions aru provided for
the following general topics:
* The basinwide impact of the Tennessee-Tombigbee Waterway* The sensitivity of barge rates to modal choice* Specific operational aspects of the waterway forecasts* Anticipated future changes in equipment.
Impact of the Tennessee-TombigbeeWaterway
Recognizing that the Tennessee-Tombigbee Waterway will not beoperational until 1986, Ohio River Basin shippers were asked about theircurrent intentions to use the new waterway. The questionnaire andsurvey process were not designed to specifically estimate anticipatedtraffic levels for the Tennessee-Tombigbee, nor were the responsessufficient for this purpose. This study deals with the time periodthru 1990 - a period in which Ohio Basin shippers might be engaged indevelopment of markets and supply contracts for the longer-term, whenthe Tennessee-Tombigbee would ke operational. For this reason, it isuseful to know if the new waterway will significantly influence shippingdecisions made during the preceding years. The survey question wasdeveloped for this purpose.
Of the 119 existing waterway users responding to the surveyquestion, many responses indicated an unfamiliarity with the probableeconomics of the Tennessee-Tombigbee routing. Those most knowledgeableof the new waterway tended to comprise the larger shippers, and thesmaller users operating along the lower Ohio, Cumberland, andTennessee Rivers.
Users with operations largely concentrated in the middle andupper portions of the Ohio Basin do not expect to use the Tennessee-Tombigbee. This is not surprising, since well over two-thirds of the19b million tons shipped on the Basin waterways is internal to theOhio system. Thirteen firms indicated intended use of the waterway;four additional firms indicated possible use of the waterway withfinal decision contingent upon observed economics of the routing and/ormarket conditions. An additional fourteen firms responded that, at thistime, they did not know if they would be using the Tennessee-Tombigbeerouting in their operations. More than one-half of the seventeenrespondents who express intentions to use the waterway are currentlyoperating along the Tennessee River.
67

Commodities most frequently mentioned in connection with theTennessee-Tombigbee routing include chemicals, ores and minerals,iron and steel products, and certain petroleum products. In the absenceof detailed information about routing economics, existing high volumewaterway shippers of coal, grain, and petroleum fuels between theGulf Coast and the Ohio River state that the current Mississippi Riverroute would probably continue to be used.
Sensitivity to Unilateral BargeRate Increases
The respondents o this issue indicated that barge rates would haveto increase unilaterall by more than 10 percent before they would con-template diverting commodities to other modes. Most users do not feelthat increased barge rates will go unanswered by the major competitor,rail. They see an almost constant differential between rail and bargerates with little or no convergence of the two rates. Even at a 15percent unilateral rate increase, there is substantial belief by theusers that traffic will remain on the rivers. The major reason cited isthat the users have substantial capital invested in equipment forhandling barges. The inference is that barge rates would have to surpassrail rates substantially and remain higher before the cost savings ofswitching to the alternate mode would justify the investment needed forthe new rail equipment.
Commodities most mentioned as candidates for a modal shift are thehigh-value commodities such as finished and semi-finished steel products,chemical products, and the higher value petroleum products. As a result,the tonnage affected by a rate increase would not be substantial. Otherbulk commodities would require barge rates to surpass the rail ratesubstantially and remain higher before any commodities would be shiftedfrom the waterway.
Planned Modal Shifts
There were very few planned modal shifts away from barge for otherthan economic reasons. As has been discussed previously, most waterwayusers in the Ohio River Basin are barge oriented because of the lowerrate structure for the bulk commodities. They have constructed theirfacilities for this single mode of transportation. There were, however,indications that there may be shifts to barge from rail due mainly toperceived service deterioration and rising rail rates. These shiftscould be affected by those firms which already have bimodal operations.
Results of Ranking of ImportantAspects of Water Transportation
The respondents were asked to rank and explain sixteen aspectsof water transportation, giving specific locations of problem areas. Inseveral cases the respondents had marked more than one item with the sameranking figure, indicating that a relationship existed among those items.
68

A tabulation of responses indicates the following:
* Waterway barge rates" was marked most often as numberone concern" "Lock transit time" was marked most often as second
concern*"Availability of empty barges as needed" was marked mostoften as third concern.
Barge Rates
The Ohio River Basin Users are sensitive to the relationship ofthe different transportation modes and are particularly concerned withbarge rates. The concern for barge rates was not limited to any oneindustry but was distributed throughout the commodity groups. Rail rates,on the other hand, although they represent the greatest competitionfor the bulk commodities moved in the Ohio River Basin, were of top con-cern to only a limited number of companies (about 20 percent), in thegrain, chemical, steel, and general commodity industries.
The relative importance placed on barge rates and the lesser impor-tance placed on other rates is indicative of several things. First,many of the utility companies have built their facilities for singlemode delivery. Their concern with other rates will grow only when bargerates increase to the point of surpassing the other modes. They wouldthen be in a position to invest the necessary capital for rail. unloading
facilities.
The petroleum industry's concern with barge is due to the ability :of the petroleum companies to switch to pipeline. However, pipelinesare expensive to construct and are not a viable alternative in alldelivery cases. The petroleum industry is then in the same position asthe utilities, in that they will consider the investment in other modeswen the barge rates surpass the other rates resulting in added facili-
moe. that can be justified through the cost savings of the less expensive
The aggregate industries which are based on the rivers of the Basinhave developed themselves to be dependent upon the river with no alterna-t~ve mode available to them for their bulk movements.
The grain industry is perhaps the most multimodal of all commodityindustries in the Basin. Its facilities are capable of both rail andtruck delivery, aad rail and barge shipments. The respondents indicatedthat the most influential factor in the choice of mode is the location ofthe export outlet. A shift of outlet to the East Coast ports would have
* a greater effect than nearly equal transportation rates.
The chemical industry mentioned its concern with transportation rates,* J as these rates increasingly reflect the additional charges for more
expensive equipment changes and safeguards required by the regulation ofmost chemical transportation.
69

Transportation costs are a small part of the costs of the ores &minerals category. Therefore, barge rates are not as important as otheraspects of water transportation to the ores & minerals industry.
The respondents indicated that it is not just the charge per ton butrather the entire cost of barge transportation that affects them. Thelow volume, high density, high value of semifinished and finished ironsteel products makes these commodities sensitive to transportation rates.
The companies included in the miscellaneous group are largely publicterminals. They are primarily directed toward the waterway as the inter-face between the barge haul and the land delivery mode. These companiesindicated that they are affected by barge rates in that if their customersshift transportation modes, they are in a position to lose this business.
Lock Transit Time
The following locks were mentioned consistently as being bottlenecks *for the Ohio River Basin traffic flows:
" Ohio River:- Gallipolis - Smithland- Cannelton - Lock 52
- Lock 50 - Lock 53-Lock 51I
* ooghea-Lc Kanawha - Winfield Lock
o Tennessee - Pickwick Lock
In addition, the small locks on the Kanawha, Monongahela, andAllegheny Rivers were cited as generally causing delays severe enoughto have forced some shippers to alternate modes. The respondents indi-cated that they would use the Basin Waterway System more extensively ifIthese bottlenecks could be reduced.
Availability of Empty Barges
The concern about the availability of empty barges is not limited toone industry; it is an equally important concern to all industries inthe Basin. The shortage of empty barges is not limited to any onegeographical region, but rather is spread throughout the system and isof concern on all rivers in the Basin.
Equipment Related Concerns of theOhio River Basin Users
* Almost all firms expressed some concern about equipment availability.Most respondents saw the availability of barges and towboats as beinga function of lock delay and the resulting tie up of both loaded andempty equipment. The respondents indicated little desire to change barge
I 70

sizes in the Basin. Present facilities are able to handle both thestandard and the jumbo barges. Other sizes, such as the shorter LASHbarge, only cause loading and unloading difficulties. Larger bargeshave not been proposed for the Ohio due to the lock sizes and to facili-ties built for the present mix of standards and junbos.
Except for those firms who own their own equipment, most firms inthe Basin consider themselves powerless to decrease the number of emptybarges moving on the Basin's waterways. The firms which own equipmentindicated that they do attempt to secure backhauls for their equipmentwhen feasible both in economics and by regulation. They indicated thatthe competition for backhaul is strong as the backhauls are from areaswhere backhaul loads are scarce.
Light boats are not seen as a problem in the Basin. The firmsstated frequently that port service vessels were lacking in some areasand that this type of light boat traffic should be increased, notdecreased.
Additional User Comments
The recurring comment from users of the Basin waterways concernscommunications with the Corps of Engineers. The noteworthy suggestionsincluded:
" Publication of previous month's lockage times" Cummunication of river conditions* More extensive interface with users before planning lock
repairs.
Communication is recognized by the firms as a two-directional action, ibut they indicated that their suggestions to the Corps could improvetheir river operations and in turn, increase efficiency in commercialriver usage.
71

ATTACHMENT I
OHIO RIVER BASIN USERS SURVEY QUESTIONNAIRE
JI

OHIO RIVER BASIN USERSSURVEY QUESTIONNAIR
The information obtained in this survey will be treated confidentially.Individual reports are for statistical purposes only. The informationrequested below is for follow-up purposes only, when necessary. If youhave any questions, please contact the Battelle study team: Harry Collisat (614) 424-5115.
Company Name__________________
Address _________________
City, State, Zip Code ____________
Person CompletingThis Questionnaire ____________________________________
Title ____________
Telephone Number - Area Code( )______
(1) In addition to the commodity movements listed on the separate referencesheet, what other transportation modes did you utilize for those commod-ities, both inbound and outbound, durini 1976? (For example, if 20,000tons of coal were brought in by barge, how much coal, if any, also camein by truck, rail, conveyor, etc.?)
(a) Inbound Volume OriginatedCommodity Mode (In Tons) From*
*If any commodity had more than one origin/destination, please list the majororigin/destinations and their respective volumes separately.
0MBApproved No. --49-R- 363

(b) Outbound Volume DestinedCommodity Mode (In Tons) To*
(2) When you compare the last 5 years of your operations, what has been thetrend of your commodity flows moved by water transportation? (Please givethe trends by individual commodities.)
(a) Inbound Yearly Increase Yearly DecreaseCommodity _ (Percent) (Percent) No Change
!L'
(b) Outbound Yearly Increase Yearly DecreaseCommodity (Percent) (Percent) No Change
(b) iz continued on next page
* If any commodity had more than one origin/destination, please list the majororigin/destinations and their respective volumes separately.
OMB Approved Mo. I-2_L -49-R-363

(b) (Continued)
Outbound Yearly Increase Yearly DecreaseCommnodity (Percent) (Percent) No Change
(3) From your past operational experience and your company's plan for the future,
how do you see your waterway utilization in the future?
Increasing Use ____Decreasing Use ____ No Change ___
If you plan an increasing and/or decreasing use in the future, please fillin the following information by commodity.
(a) For inbound commodities
Increase Volume PercentTime or (Tons Change Origin
Commodity Period Decrease Per Year) Per Year (Site Specific)*
1977-1980 __________ ____ ____ ____
______________ 1981-1985 ____ ____ ____ ________
1977-1980 _____ _____ ____ ____ ____
______________ 1981-1985 ____ ____ ____________
1986-1990 ____ ____ ____ ________
1977-1980 __________ ____ ________
______________ 1981-1985 ____ ____ ____ ________
1986-1990 ____ ____ ____ ________
(a) iz contiLnued on niex.t page
*Site specific for origin/destination points. Please use dock, river, andriver mile, or nearest major urban area (for example: XYZ Company, OhioRiver Mile 350.0, or Portsmouth, Ohio).
4 MB Approved No. 1-3-49-R-363

(a) (Continued)
Increase Volume PercentTime or (Tons Change Origin
Commodity Period Decrease Per Year) Per Year (Site Specific)*
1 977-1980 ____ ____ ____ ________
____ ___ ___ ___ 1981-1985 _ _ _ _ _ _ _ _ _ _ _ _ _ _ _ _ _ _ _ _ _
1986-1990 _____ _____ ____ ________
1977-1980 _____ _____ ____ ________
____ ___ ____ ___ 1981-1985 _ _ _ _ _ _ _ _ _ _ _ _ _ _ _ _ _ _ _ _
1986-1990 _____ _____ ____ ________
(b) For outbound commodities
Increase VolumeTime or (Tons Percent Destination
Commodity Period Decrease Per Year) Per Year (Site Specific)*
1977-1980 ____ ____ ____ ________
____ ___ ____ ___ 1981-1985 _ _ _ _ _ _ _ _ _ _ _ _ _ _ _ _ _ _ _ _
1986-1990 _____ _____ ____ ________
1977-1 980 _ _ _ _ _ _ _ _ _ _ _ _ _ _ _ _ _ _ _ _
______________ 1981-1985 _____ _____ ____ ________
1986-1990 ____ _____ _____ ___ ____
1977-1980 _____ _____ ____ ________
____ ___ ____ ___ 1981-1 985 _ _ _ _ _ _ _ _ _ _ _ _ _ _ _ _ _ _ _ _
1986-1990 _____ _____ ____ ________
1977-1980 ____ _____ ____ _______
____ ___ ____ ___ 1981-1985 _ _ _ _ _ _ _ _ _ _ _ _ _ _ _ _ _ _ _ _
1986-1990 ____ ____ ____ ________
1977-1980 _____ _____ ____ ________
____ ___ ____ ___ 1981-1985 _ _ _ _ _ _ _ _ _ _ _ _ _ _ _ _ _ _ _ _
1986-1990 ____ ____ ____ ________
*Site specific for origin/destination points. Please use dock, river, andriver mile, or nearest major urban area (for example: XYZ Company, OhioRiver Mile 350.0, or Portsmouth, Ohio).
0MB Approved No. 1-4-49-R-363

(c) Do you expect to handle increasing commodity flows by:
(1) Using present facilities?
(2) Expansion of present facilities?
(3) Building and moving to new facilities?
(4) The Tennessee-Tombigbee Waterway, connecting the Tennessee River and theTombigbee River, is scheduled for completion in the mid-1980s. Will thisconnecting waterway have an impact on your utilization of river transpor-tation? Yes No If yes, please explain what this imDactwill be.
(5) If barge transportation costs were to unilaterally increase by thefollowing levels, please check at what level would you contemplate adiversion of shipments from water to other modes of transportation.
(a) Percent Increase Stay With Divertin Costs Waterway From Waterway
2
5
10 _ _ _ _ _ _ _ _ _ _ _ _
15
(b) At the level of barge rate increase at which you would divert shipments toanother mode, indicate which commodities you would divert and what percentto which mode. Then rank the impact of the rate increase usinq 1 as thehighest impact, 2 as next highest, etc. Please indicate whether Inbound (1)or Outbound (0) commodities and mode (i.e., rail, truck, or others).
ImpactCommodity I/O Percent Diverted Mode Diverted to Ranking
OMB Approved No. 1-5-49-R-363

(6) Do you contemplate any modal shifts in the near future for any otherreasons? Yes No If yes, please explain the shifts.
(7) Please indicate the importance of the following aspects of water transpor-tation to your existing operations. Use a ranking scale with 1 as themost important, 2 as next important, etc.
(a) Barge loading/unloading time
Timely access to loading, unloading, and transfer facilitiesRiverfront storage and stockpiling space
Use of barge for temporary commodity storage
Availability of empty barges as needed
Availability of towboats as needed
Pool transit time
Lock transit time
Navigational safety
Navigational obstructions (e.g., ice, bridge clearance, etc.)
Security of shipment (breakage, theft, etc.)
Waterway barge rates
Rail rates
Truck rates
Pipeline rates
Accessibility to alternative mode of shipment
J _ Others (please specify)
OMB Approved No.-49-R-363 I-6

(b) For your numbers 1, 2, and 3 choices in part (a) of this question, pleaseprovide the following information for each item individually.
(i) Why are these items important to your operation?
(ii) To what extent are you now experiencing or do you anticipate experi-encing problems concerning these items, and where in the Ohio Rivernavigational system are these problems most severe?
(8) If improvements were to be made concerning the areas in question (7), whatwould the impact be on your waterway utilization? Please explain.
(9) (a) Do you own and/or operate the waterway towing equipment used totransport your commodities? Yes No If yes, pleasecheck the type of equipment. (1) Barges (T2 Towboats
OMB Approved No. 1-7-49-R-363

7 AD-AO 193 BATTELLE COLUMBUS LABS OH F/ 5/ .3
FORECAST OF FUTURE OHIO RIVER BASIN, WATERWAY TRAFFIC BASED ON --ETCtU)SEP 79 H COLLIS OACW978-COO59
UNCLASSIFIED NL

(b) Do you foresee any major changes in the mix of barge types or size oftowboats used in your commodity movements over the next 15 years ascompared with equipment used in your 1976 commodity movements (e.g.,larger barges, smaller barges, larger towboats, smaller towboats, etc.).Yes No If yes, please explain.
(c) What actions are you now taking, or do you plan to take between now and1990 to minimize the number of empty barges and light boats moving on theOhio River System? Please explain.
jI
OMB Approved No. 1-8-49-R-363
4

(10) Additional commlents or suggestions, if any.
OMB6 Approved No.1--49-R-363 9

ATTACHMENT II
OHIO RIVER BASIN COMMERCIAL DOCKSPROCESSED FOR STUDY QUESTIONNAIRE

ATTACHMENT II: OHIO RIVER BASIN COMMERCIAL DOCKSPROCESSED FOR STUDY QUESTIONNAIRE
Total From Duplicate Listing No QuestionnairesRiver Mailing List Or No Address Traffic Sent
Ohio 661 87 50 524
Little Kanawha 6 0 1 5
Kanawha 81 4 6 71
Big Sandy 11 0 4 7
Pocatalico 1 0 0 1
Elk 7 1 3 4
Allegheny 49 3 20 26
Monongahela 130 5 19 106
Cumberland 41 3 4 34
Tennessee 113 2 12 99
Kentucky 4 0 3 1
Green-Barren 11 0 0 11
Rough 1 0 0 1
Clinch 4 0 2 2
Hiwassee 6 0 1 5
Licking 4 0 0 4
Total 1,130 106 125 901
ATTACHMENT III
COMPARISON OF WCSC DATA AND SURVEY DATA ANDDEGREE OF SURVEY COVERAGE BY COMMODITY GROUP

ATTACHMENT III: COMPARISON OF 1976 "REIDENTIFIED" WCSC DATAAND SURVEY RESPONSE FOR ALL RESPONDENTS(IN THOUSAND TONS)
Reidentified (1) All Survey (2)
Tonnage Responses PercentageCommodity Group (000's) (000's) Difference
Coal & Coke 82,848 88,631 + 7.0
PetroleumiFuels 15,932 17,543 + 10.1
Crude Petroleum 286 0 -100.0
Aggregates 7,914 10,349 + 30.8
Grains 3,117 3,108 - 0.3
Chemicals & Chemical 5,341 6,510 + 21.9Fertilizers
Ores & Minerals 1,706 2,534 + 48.5
Iron Ore, Iron & Steel 2,692 3,339 + 24.0
Micsellaneous Commodities 3,475 2,763 - 20.5
Total 123,311 134,777 + 9.3
Source: (1) Based on adjustments made to the original COE data via Battellesurvey
(2) Based on Battelle survey
II1-1

ATTACHMENT III: COMPARISON OF ALL SURVEY RESPONSES TO TOTALOHIO RIVER BASIN WATERWAY TONNAGE, 1976(IN THOUSAND TONS)
Total (1) All (2)Basin Survey Percentage
Commodity Group Traffic Responses Response
Coal & Coke 111,631 88,631 79.4
Petroleum Fuels 20,922 17,543 83.8
Crude Petroleum 664 0 0.0
Aggregates 25,169 10,349 41.1
Grains 5,583 3,108 55.7
Chemicals & Chemical 11,290 6,510 57.7Fertilizers
Ores & Mineral 4,435 2,534 57.1
Iron Ore, Iron & Steel 5,167 3,339 64.6
Miscellaneous Commodities 10,915 2,763 25.3
Total 195,776 134,776 68.8
Source: (i) Based on readjusted volumes from Battelle's survey
(2) Battelle survey
111-2.... ...

ATTACHMENT III: COMPARISON OF TOTAL OHIO RIVER BASIN WATERWAYTRAFFIC AS DERIVED FROM WCSC AND BATTELLESURVEY, 1976 (IN THOUSAND TONS)
BattelleCommodity Group WCSC l)Survey(2
Coal & Coke 103,471 111,631
Petroleum Fuels 19,060 20,922
Crude Petroleum 883 664+
Aggregates 21,224 25,169
Grains 5,333 5,583
Chemicals & Chemical 9,449 11,290Fertilizers
Ores & Minerals 3,413 4,435
Iron Ore, Iron & Steel 4,280 5,167
Miscellaneous Commodities 10,789 10,915
Total 177,902 195,776
Source: (1) Waterborne Commerce Statistics, 1976
(2) Based on readjusted volumes for 1976 from Batelle's survey
111-3

APPENDIX A
VOLUME PROJECTION BY RIVER OF ORIGIN
BY RIVER OF DESTINATION BY YEAR 1976 -1990
CIN THOUSANDS OF TONS)

A-1
VOLUME PROJECTION BY RIVER OF ORIGINBY RIVER OF DESTINATION BY YEAR 1976 -1990
(IN THOUSANDS OF TONS)
1976 1980 1985 1990
Ohio River Orgi0To Ohio River 60501. 86291. 113924. 1251565.
Little Kanawha 261. 319. 353. 390.Kanawha 5486. 8185. 8872. 9387.Big Sandy 91. 113. 126. 140.Elk 89. 98. 98. 98.Allegheny 538. 623. 664. 687.Monongahela 6675. 7850. 8545. 9154.Cumberland 5792. 7562. 7310. 7839.Tennessee 3834. 9078. 9279. 9193.Kentucky 538. 625. 755. 911.Green-Barren 0 0 60. 120.Upper Mississippi 1751. 2246. 3351. 3567.Lower Mississippi 5694. 7844. 9771. 10847.Missouri 12. 14. 14. 14.Illinois 672. 977. 1139. 1190.Arkansas 56. 61. 65. 68. ,Cuachita 1. 1. 1. 1.White 1. 2. 2. 2.Tombigbee 3. 6. 7. 7.Great Intracoastal Waterway-East 2610. 3129. 3338. 3556.Great Intracoastal Waterway-West 259. 304. 339. 376.Houston Ship Channel 449. 601. 717. 772.Yazoo 13. 19. 22. 24.
Kanawha River OriginTo Ohio 2754. 4115. 6995. 7186.
Kanawha 2970. 2409. 2308. 2335.Big Sandy 4. 3. 4. 4.Allegheny 20. 22. 24. 26.Monongahela 886. 9,78. 1,101. 1221.Cumberland 8. 9. 10. 12.Tennessee 152. 61. 65. 65.Upper Mississippi 17. 20. 24. 27.Lower Mississippi 59. 60. 67. 71.Illinois 144. 137. 152. 155.Gulf Intracoastal Waterway-East 14. 13. 15. 15.Gulf Intracoastal Waterway-West 47. 45. 48. 48.Houston Ship Channel 2. 3. 4. 5.Yazoo 1. 2. 2. 2.

A-2
VOLUME PROJECTION BY RIVER OF ORIGINBY RIVER OF DESTINATION BY YEAR 1976 - 1990
(IN THOUSANDS OF TONS)(Continued)
1976 1980 198, 1990
Big Sandy River OriginTo Ohio 794. 3642. 4968. 6307.
Kanawha 16. 16. 17. 17.Monogahela 16. 15. 15. 15.Cumberland 9. 20. 20. 20.Tennessee 28. 84. 116. 147.Upper Mississippi 22. 77. 119. 161.Lower Mississippi 150. 10. 10. 10.Illinois 14. 34. 34. 34.Gulf Intracoastal Waterway-West 35. 35. 35. 35.
Elk River OriginTo Ohio 5. 5. 5. 5.
Allegheney River OriginTo Ohio 1577. 2035. 2106. 2138.
Kanawha 1. 1. 1. 1.Allegheney 1523. 1699. 1413. 1523.Monongahela 303. 358. 400. 432.Tennessee 0. 18. 18. 18.Upper Mississippi 2. 2. 3. 3.Lower Mississippi 23. 35. 41. 45.Illinois 6. 0 0 0Gulf Intracoastal Waterway-East 8. 12. 15. 16.
Mononghaela River OriginTo Ohio 9701. 14161. 17321. 18864.
Kanawha 44. 46. 54. 58.Allegheney 810. 705. 751. 751.Monongahela 18007. 22292. 25087. 26596.Cumberland 1. 1. 1. 1.Tennessee 46. 399. 556. 561.Upper Mississippi 38. 39. 39. 41.Lower Mississippi 294. 351. 406. 447.Missouri 1. 1. 1. 1.Illinois 14. 14. 17. 17.Arkansas 33. 36. 41. 45.Tombigbee 7. 7. 8. 8.Gulf Intracoastal Waterway-East 44. 48. 54. 58.Gulf Intracoastal Waterway-West 279. 315. 353. 388.Houston Ship Channel 24. 28. 32. 34.Yazoo 1. 1. 1. 1.
J .

A-3
VOLUME PROJECTION BY RIVER OF ORIGINBY RIVER OF DESTINATION BY YEAR 1976 - 1990
(IN THOUSANDS OF TONS)(Continued)
1976 1980 1985 1990
Cumblerland River OriginTo Ohio 529. 859. 1077. 1155.
Kanawha 26. 29. 32. 35.Allegheney 2. 2. 2. 2.Mononghela 3. 3. 3. 3.Cumberland 323. 409. 499. 577.Upper Mississippi 52. 64. 73.; 81.Lower Mississippi 2332. 3495. 4154. 4550.Illinois 13. 14. 14. 14.Red 333. 557. 678. 732.Gulf Intracoastal Waterway-West 57. 68. 77. 88.
Tennessee River OriginTo Ohio 420. 462. 503. 530.
Kanawha 29. 29. 33. 34.Allegheney 38. 39. 42. 43.Mononghela 41. 50. 56. 60.Tennessee 6912. 9846. 9667. 10230.Upper Mississippi 365. 512. 624. 680.Lower Mississippi 4530. 6922. 8453. 9193.Missouri 16. 18. 20. 22.Illinois 436. 545. 630. 675.Arkansas 6. 7. 7. 8.Ouachita 19. 29. 34. 37.Red 128. 215. 262. 283.Tombigbee 13. 13. 13. 13.Gulf Intracoastal Waterway-East 501. 745. 933. 1018.Gulf Intracoastal Waterway-West 143. 170. 186. 194.Houston Ship Channel 20. 29. 34. 37.Yazoo 7. 10. 12. 14.Other 1. 2. 2. 2.
Kentucky River OriginTo Ohio 3. 3. 3. 3.
J

A-4
VOLUME PROJECTION BY RIVER OF ORIGINBY RIVER OF DESTINATION BY YEAR 1976 - 1990
(IN THOUSANDS OF TONS)(Continued)
1976 1980 1985 1990
Green-Barren River OriginTo Ohio 6536. 6248. 5889. 6711.
Cumberland 71. 627. 0 0Tenneessee 487. 2659. 1610. 1218.Green-Barren 530. 697. 826. 883.Upper Mississippi 520. 674. 669. 722.Lower Mississippi 4167. 4585. 3458. 3607.Illinois 446. 650. 808. 879.Gulf Intracoastal Waterway-East 18. 27. 33. 36.
Clinch River OriginTo Monogahela 1. 2. 2. 2.
Tennessee 45. 75. 91. 98.Tombigbee 2. 4. 5. 5.Other 1. 2. 2. 2.
Upper Mississippi River OriginTo Ohio 4514. 4950. 5380. 5919.
Kanawha 12. 17. 20. 21.Allegheney 165. 195. 213. 237.Monongahela 138. 184. 443. 575.Cumberland 549. 734. 843. 895.Tennessee 1732. 5485. 5432. 5590.
Lower Mississippi River OriginTo Ohio 6733. 7245. 8286. 9778.
Little Kanawha 120. 120. 121. 123.Kanawha 699. 687. 710. 727.Allegheney 442. 440. 509. 538.Monongahela 1276. 1332. 1470. 1597.Cumberland 1277. 889. 942. 988.Tennessee 1641. 1981. 2226. 2362.Green-Barren 1. 2. 2. 2.
Missouri River OriginTo Ohio 113. 142. 162. 183.
Allegheney 4. 7. 9. 10.Tennessee 370. 484. 561. 629.
iA

A-5
VOLUME PROJECTION BY RIVER OF ORIGINBY RIVER OF DESTINATION BY YEAR 1976 -1990
(IN THOUSANDS OF TONS)
(Continued)
1976 1980 1985 1990
Illinois River OriginTo Ohio 358. 306. 332. 350.
Kanawha 25. 24. 26. 26.Monongahela 10. 11. 12. 13.Cumberland 97. 107. 117. 122.Tennessee 627. 723. 805. 871.
Arkansas River OriginTo Ohio 85. 112. 137. 161.
Monongahela 3. 4. 5. 5.Cumberland 1. 2. 2. 2.Tennessee 89. 109. 126. 143.
Ouachita River OriginTo Tennessee 30. 36. 38. 40.
White River OriginTo Tennessee 1. 1. 2. 2.
Atchafalaya River OriginTo Ohio 55. 62. 86. 120.
Tombigbee River Origin[To Ohio 2. 3. 3. 3.
Kanawha 15. 14. 16. 16.Tennessee 2. 4. 5. 5.
Gulf Intracoastal Waterway-EastTo Ohio 669. 679. 722. 765.
Allegheney 1. 1. 1. 1.Monongahela 3. 4. 4. 4.Cumberland 36. 39. 42. 46.Tennessee 310. 361. 391. 421.Green-Barren 3. 4. 4. 5.
Gulf Intracoastal Waterway-WestTo Ohio 2444. 2781. 3159. 3561.
Kanawha 791. 796. 871. 916.Allegheney 478. 577. 682. 710.Monongahela 399. 415. 441. 409.Cumberland 26. 27. 29. 31.Tennessee 1806. 1880. 1891. 1981.
jGreen-Barren 1. 1. 1. 1.

A-6
VOLUME PROJECTION BY RIVER OF ORIGINBY RIVER OF DESTINATION BY YEAR 1976 - 1990
(IN THOUSANDS OF TONS)(Continued)
1976 1980 1985 1990
Houston Ship Channel OriginTo Ohio 676. 795. 885. 990.
Kanawha 132. 137. 142. 150.rAllegheney 114. 170. 202. 220.Monongahela 12. 16. 17. 19.Cumberland 19. 21. 23. 26.Tennessee 250. 286. 316. 352.
Yazoo River OriginTo Kanawha 9. 10. 11. 12.
Allegheney 1. 1. 1. 1.Monongahela 8. 12. 15. 16.Tennessee 8. 9. 10. 11.
Other River OriginTo Ohio 7. 11. 13. 14.
Source: Battelle Survey

APPENDIX B
TONNAGE FLOW TIME-SERIES BY LOCK BY DIRECTION

TABLE OF CONTENTS
Page
OHIO RIVER LOCKS & DAMS
Emsworth .. .. ....................... B-1Dashields. .... ..................... B-2Montgomery .. ... ..................... B-3New Cumberland. .. .................. ... B-4Pike Island. .. ...................... B-5Hannibal .. ... ...................... B-6Willow Island. .. ..................... B-7Belleville .. ... ..................... B-8Racine .. ... ....................... B-9Gallipolis .. ... ..................... B-10Greenup. ... ....................... B-liMeldah . ... ....................... B-12Markiand .. .... ..................... B-l3McAlpine .. ... ...................... B-14Cannelton .. .................. ...... B-15Newburgh .. ... ...................... B-16Uniontown. ... ...................... B-17Smithland. ......................... B-18Ohio Lock & Dam #52 .. .................... B-19Ohio Lock & Dam #53 .. .................... B-20
ALLEGHENY RIVER LOCKS & DAMS
Allegheny Lock & Dam #2. .... .............. B-21Allegheny Lock & Dam #3. ..... ............. B-22Allegheny Lock & Dam #4. ..... ............. B-23Allegheny Lock & Dam #5 .. .................. B-24I)Allehgeny Lock & Dam #6 .. ..................B-25Allegheny Lock & Dam #7 .. .................. B-26
MONONGAHELA RIVER LOCKS &, DAMS
Monongahela Lock & Damn #2 .. ................ B-27Monongahela Lock &, Dam #3 .. ................ B-28Monongahela Lock & Dam #4 .. ................ B-29Maxwell. ... ....................... B-30Monongahela Lock &, Dam #7 .. ................ B-31Monongahela Lock &, Dam #8 .. ................ B-32Morgantown .. ... ..................... B-33Hildebrand .. ... ..................... B-34Opekiska .. ... ...................... B-35
KANAWHA RIVER LOCKS &, DAMS
Winfield .. ... ...................... B-36Marmet .. ... ....................... B-37London .. ... ....................... B-38

TABLE OF CONTENTS(Continued)
Page
KENTUCKY RIVER LOCKS & DAMS
Kentucky Lock & Dam #1. .. .................. B-39Kentucky Lock & Dam #2. .. .................. B-40Kentucky Lock & Dam #3. .. .................. B-41Kentucky Lock & Dam #4. .. .................. B-42Kentucky Lock & Dam #5. .. .................. B-43Kentucky Lock & Dam #6. .. .................. B-44Kentucky Lock & Dam #7. .. .................. B-45Kentucky Lock & Dam #8. .. .................. B-46Kentucky Lock & Dam #9. .. .................. B-47Kentucky Lock & Dam #10 .. .................. B-48Kentucky Lock & Dam #11 .. .................. B-49Kentucky Lock & Dam #12 .. .................. B-5OKentucky Lock & Dam #13 .. .................. B-5IKentucky Lock & Dam #14 .. .................. B-52
GREEN RIVER LOCKS & DAMS
Green Lock & Dam #1 .. .................... B-53Green Lock & Dam #2 .. .................... B-54Green Lock & Dam #3 .. .................... B-55
CUMBERLAND RIVER LOCKS & DAMS
Barkley. ... ....................... B-56Cheatham .. .. ....................... B-57Old Hickory. .... .................... B-58
TENNESSEE RIVER LOCKS & DAMS
Kentucky Dam . .. .................. .... B-59Pickwick. .. ................... ..... B-60Wilson. .. ................... ...... B-61Wheeler .. .................. ....... B-62Guntersville. .. ................... ... B-63Nickajack .. ................... ..... B-64Chickamauga .. ................... .... B-65Watt's Bar. .. ................... .... B-66Ft. Loudon. .. .................. ..... B-67
CLINCH RIVER LOCK & DAM
Melton Hill .. .................... ... B-68

B-1
TONNAGE FLOW TIME-SERIES BY LOCK40000
30000
C)
0
z 00-C,)
o 000
LE-E
-ezNSRA
-0 DSTREAP
-3-TOTAL
6000 7-00YER80.000 90.000
EMSWORTH LOCK & DAM

B-2
TONNAGE FLOW TIME-SERIES BY LOCK40000
30000
0 Fz 000
LEGEN
-9 NSRA-X USTE
TOTA
6000z-0 EA 0009-0
-IHILD LO000DA
7772

B-3
TONNAGE FLOW TIME-SERIES BY LOCK32000
24000
U)
C3,
0
16000
8000
LEGEND
-9- DNSTREAP
-- UPSTREAP
T* OTAL
6000 70:000 80.000 90.000
YEAR
K MONTGOMERY LOCK & DAM

B-4
TONNAGE FLOW TIME-SERIES BY LOCK40000
30000
CD
0
LEGEND
-9- DNSTREAP
-- UPSTREAV
-NE TOTAL
60.000 70-000 YEAR 80.000 90.000
NEW CU14BERLAND LOCK & DAM

B- 5
TONNAGE FLOW TIME-SERIES BY LOCK42400
31800
.Z
0
z
P_421200
w
0
10600
LEGEND
-69- DNSTREAP
-X- UPSTREAV
-*- TOTAL600070.000 80.000 90.000
YEAR
PIKE ISLAND LOCK & DAH1

B-6
TONNAGE FLOW TIME-SERIES BY LOCK56000
42000
C,,
0800
0400
LEGE
-ezNSRAUPS2800
TOA
YEARNSRE
HANNIBAL LOCK & DAM

B-7
TONNAGE FLOW TIME-SERIES BY LOCK55000
43000
C,,
0 900
7060007-008-009-0
~4 YEAR
WILW1SAD OK A
CA

B-8
TONNAGE FLOW TIME-SERIES BY LOCK54900
42900
U)
30900
Ld
0 800
6 90 iii
60.000 70-000 YER80-000 90.000
BELLEVILLE LOCK & DAM

B-9
TONNAGE FLOW TIME-SERIES BY LOCK57800
45200-
LEEN
S 360-007-0 0009-0
YEA
RAIELC0 A

B-10
TONNAGE FLOW TIME-SERIES BY LOCK70300
54300
0z
C
z
22300
LEGEND
-9- DNSTREAP
-- UPSTREAM
*-TOTAL6300+
60.000 70-000 80.000 90.000J YEAR
GALLIPOLIS LOCK & DAM

B-li1
TONNAGE FLOW TIME-SERIES BY LOCK71000
55000
0 300
7 300 i
z 000 7:0 EA 0009.0
zREU OC A

B-i12
TONNAGE FLOW TIME-SERIES BY LOCK55900'
43900
LLLI
0
19900.319
LEGEND
--DNSTREAP
-X- UPSTREA
7900 - i- i-NE- TOTAL
60.000 70-000 80.000 90.000
YEAR
MELDAHL LOCK & DAM

B-13
TONNAGE FLOW TIME-SERIES BY LOCK64000
48000
0
32000
CD
0
1600
LEGEND
-G-DNSTREAV
-X- UPSTREAP
-3-TOTAL
60.000 70.000 80.000 90.000
YEAR
MARKLAND LOCK & DAM

B-14
TONNAGE FLOW TIME-SERIES BY LOCK72000
54000
0 600
36000
wEE-e DSTEA
-X- DNSTREAP
-7*- TOTAL
60.000 70-000 80.000 90.000
YEAR
McALPINE LOCK & DAM

8-15
TONNAGE FLOW TIME-SERIES BY LOCK72000
54000
(n0D
0
-36000
z
0 800
LEGEND
-9G- DNSTREA-X- UPSTREAP
-- TOTAL
60.000 70-000 80.000 90.000
YEAR
CANNELTON LOCK & DAM

B-1 6
TONNAGE FLOW TIME-SERIES BY LOCK80000
60000
0
I.4 0000
wEJE
---zSRA
U6PDSTREAV
*-TOTAL
60.000 70-000 YER80.000 90.000
NIEWBURGH LOCK & DAM

B-17
TONNAGE FLOW TIME-SERIES BY LOCK88000
66000
C,,
44000
0 200
LEGEND
-- DNSTREAP
-X- UPSTREAV
-*- TOTAL
60.000 70-000 80.000 20.000
YEAR
UNIONTOWN LOCK & DAM

B-18
TONNAGE FLOW TIME-SERIES BY LOCK96000
72000
.48000
2400
LEGEND
-0- DNSTREAP
-- UPSTREAP
cl 100M - TOTAL
60.000 70.000 YEAR 0 90.000
SMITHLAND LOCK & DAM

B-19
TONNAGE FLOW TIME-SERIES BY LOCK112000
84000
0
I.. 5000
wgE-e NSRA
UPTRA
YEADRSRE
OHIO LOCK & DAM #52

B-2O
TONNAGE FLOW TIME-SERIES BY LOCK8800o
66000
c/)
44000
w
0 200
LEGEND
-0- DNSTREAP
*-UPSTREAP
*-TOTAL
60.000 70.000 80.000 90.000J YEAR
OHIO LOCK & DAM #53

B-21
TONNAGE FLOW TIME-SERIES BY LOCK5500
4300
C.')<
190
-9 I-TRA
370
ALLEGHEY LOCKL DAM #
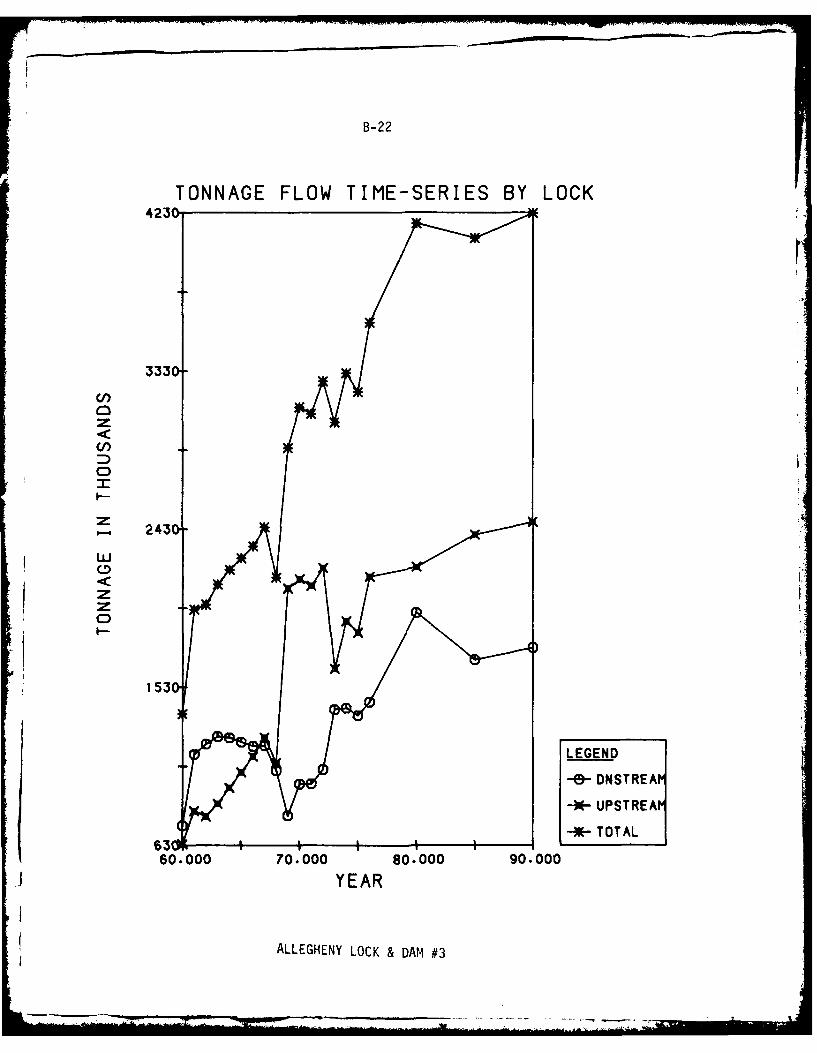
B-22
TONNAGE FLOW TIME-SERIES BY LOCK4230
3330
M,0
0<-
0
1 53
LEGEND
-9- DNSTREAP
*-UPSTREAP
*-TOTAL63060.000 70-000 80.000 90.000
J YEAR
ALLEGHENY LOCK & DAM #3

B-23
TONNAGE FLOW TIME-SERIES BY LOCK2820
2140
LU
CD,
080
LEGE-e NSRA
-z PSRA146 --- 4 -a OA
60007-0wEA 0009-0
ALLEGHEY LOCKLEDAMN#

B-24
TONNAGE FLOW TIME-SERIES BY LOCK2160-
1620-
U)
LU
CD
TOA
6 7 0 0 000 0'0
108EAR
ALEHNYLC &DM#

B-25
TONNAGE FLOW TIME-SERIES BY LOCK880-
66
c/)
CD
440I 4LiCD i
220-
LE GEFN D
-E- DNSTREAN
--*- UPSTREAt
-*- TOTAL
60.000 70,000 80.000 90.000
J YEAR
ALLEGHENY LOCK & DAM #6

8-26
TONNAGE FLOW TIME-SERIES BY LOCK48
UI)
244
122
LEGEND
--DNSTREAt-
-- UPSTREA
-- TOTAL
60.000 70.000 80.000 90.000
YEAR
ALLEGHENY LOCK & DAM #7

B-27
TONNAGE FLOW TIME-SERIES BY LOCK3620G
28200-
S20200
wL
12200-
LEGEND
G-DNSTREAM
-UPSTREAV
420- TOTAL
60.000 70.000 80-000 90.000
J YEAR
MONONGAHELA LOCK & DAM #2

B-28
400TONNAGE FLOW TIME-SERIES BY LOCK
30000
0
- 0000
LEEN
60007-001-0 0000
YEAR
MONONGAHELA LOCK & DAM #3

B-29
TONNAGE FLOW TIME-SERIES BY LOCK32000
24000
z
C,,
060
z
0
8000
LEGEND
-e- DNSTREAV
-- UPSTREAV
-- TOTAL
60.000 70:000 80-000 90.000
YEAR
MONONGAHELA LOCK & DAM #4

B- 30
TONNAGE FLOW TIME-SERIES BY LOCK32000
24000P
C)
D
C)
LI
16000
LEGENDNTR,%r
-G DSTREAt
-3-TOTAL
60 .000 70-000 YER80.000 90.000
MAXWELL LOCK & DAM

B-31
TONNAGE FLOW TIME-SERIES BY LOCK13800,
10400
U,
0 00
0
36-0
2060007-0w0009-0
YEA
MOOGHLzOK&DM#

B -32
TONNAGE FLOW TIME-SERIES BY LOCK900
6800
240
460M
60007-008-009:0YEA
MOOGHL OK&DM#

B-33
TONNAGE FLOW4 TTME-SERIES BY LOCK
0 3
CD
51-
TOTA07
6000 7000 8000.0 0
14RATW LC A

B-34
TONNAGE FLOW TIME-SERIES BY LOCK1 250
950-
(I)
650-
$ LUJ
~350-
LEGEND
-e- DNSTREAN
*-UPSTREA
-*-TOTAL
60.000 70.000 YEAR 000900
HILDEBRANID LOCK & DA14

B- 35
TONNAGE FLOW TIME-SERIES BY LOCK400
300-
CD
200-
wl
LFGEND
-e- DNSTR EA?
-- UF'STREAv
0T T T A L
j60.000 70.000 80-000 90.000
YEAR
OPEKISKA LOCK & DAM

B- 36
TONNAGE FLOW TIME-SERIES BY LOCK20800
16400
C3)
0
C.)
0
7600
60. 1200 07:080009 00
-Y-EARRE
WINFIELD LOCK & DAM

B-37
TONNAGE FLOW TIME-SERIFS BY LOCK8700-
6700-
CD
4700-
270G
LEGEND
--UPCSTFEA j
700160.000 70,000 80.000 90.000
Y EA R
MARMET LOCK & DAM

B- 38
TONNAGE FLOW TIME-SERIES BY LOCK2710C
2090-
c/)
CD
C-
850-
LEGEND
-e-DNSTREAM-- UPSTREAM
-- TOTAL
60.000 70.000 80.000 90.000
J YEAR
LONDON LOCK & DAM

B- 39
TONNAGE FLOW TIME-SERIES BY LOCK1 600-
20
C
LEEN
TOTA
YEARNSRE
KENTUCKY LOCK & DAM #1

B-40
TONNAGE FLOW TIME-SERIES BY LOCK1 600-
1 200-
:D
80
LlU
40
LEGEND
-E)- DNSTREAt
-*-UPSTREA
-- TOTAL
60.000 70.000 YER80.000 90.000
KENTUCKY LOCK A DAM #2
7.'I

B-41
TONNAGE FLOW TIME-SERIES BY LOCKi60C
i200-
CD
0-
z00
F-
400-
LEGEND
-e- DNSTREA 4
-X- UPcSTREAI
-*- TOTAL
60-000 70-000 80.000 90.000
YEAR
KENTUCKY LOCK & DAM #3

B-42
TONNAGE FLOW TIME-SERIES BY LOCK1 60C-
1 200-
C')
:D
CD
<V
400-
LEGEND
-e0- ONSTREAM
-X- UPSTREAM
0E)EE)E9DE9@9(9EE9E-*-9 TOTAL
60.000 70-000 80.000 90.000
Y YEA R
KENTUCKY LOCK & DAM #4

B-43
TONNAGE FLOW TIME-SERIES BY LOCK80C
6 0 0-
60
CD)
CD
200-
LEEN
40- NTRA
-X LUTEI
-* TTA
I SENT-.EN7

B-44
TONNAGE FLOW TIME-SERIES BY LOCK800
600-
cl)
_D
400-
LUJ
200-
LEGEND
e-DNSTREA*-UPSTREA
-- TOTAL
6 000 70.000 80.000 90.'000YEAR
KENTUCKY LOCK & DAM #6

B-45
TONNAGE FLOW TIME-SERIES BY LOCK800-
600-
_D
400-
0:
40
200:
LEGEND
49-- DNSTREA4
-*- UPOSTREA
oi 0 i-X- TOTAL
60.000 70.000 80.000 90.000
JY YE AR
KENTUCKY LOCK & DAM #7

B-46
TONNAGE FLOW TIME-SERIES BY LOCK7. 200-
5.400-
U)
U/):D
.~3.600-
Lu
1.8
LEGEND
-6- DNSTREAI-* UPSTREA
-~TOTAL
60.000 70.000 80.000 90.000YEAR
KENTUCKY LOCK &DAM #8

B-47
TON~~NAGE FLOW TIME-SERIES BY LOCK7. 2001
5.400-
C/)
:
CD
~.3.600-
0
1 .800-
LEGEND
--X- UPcSTREA
0 -~--TOTAL
60.000 70.000 80.000 90.000
YEAR
KENTUCKY LOCK & DAM #91
-P1

B-48
TONNAGE FLOW TIME-SERIES BY LOCK7. 200
5.40C
CDGCD
0 3.60
1.80O
LEGEND
-- DNSTREAN
-X- UPSTREAl I
-*--TOTAL
60.000 70.000 80.000 90.000YEAR
KENTUCKY LOCK & DAM #10

B-49
TONNAGE FLOW TIME-SERIES BY LOCK
1 38-
cf)
cf)
CD
92
0
z4
LEGEFND
49- DNSTREP.
-*- UFSTREA
-RE- TOTAL
60.000 70.000 80.000 90.000
YEAR
KENTUCKY LOCK & DAM #11

B-50
TONNAGE FLOW TIME-SERIES BY LOCK
184
CD)
CD
CD
46-
'LEGEN
DNTRU
-X0PSRA
-8-EASRE
KENTUCKY LOCK & DAM #12
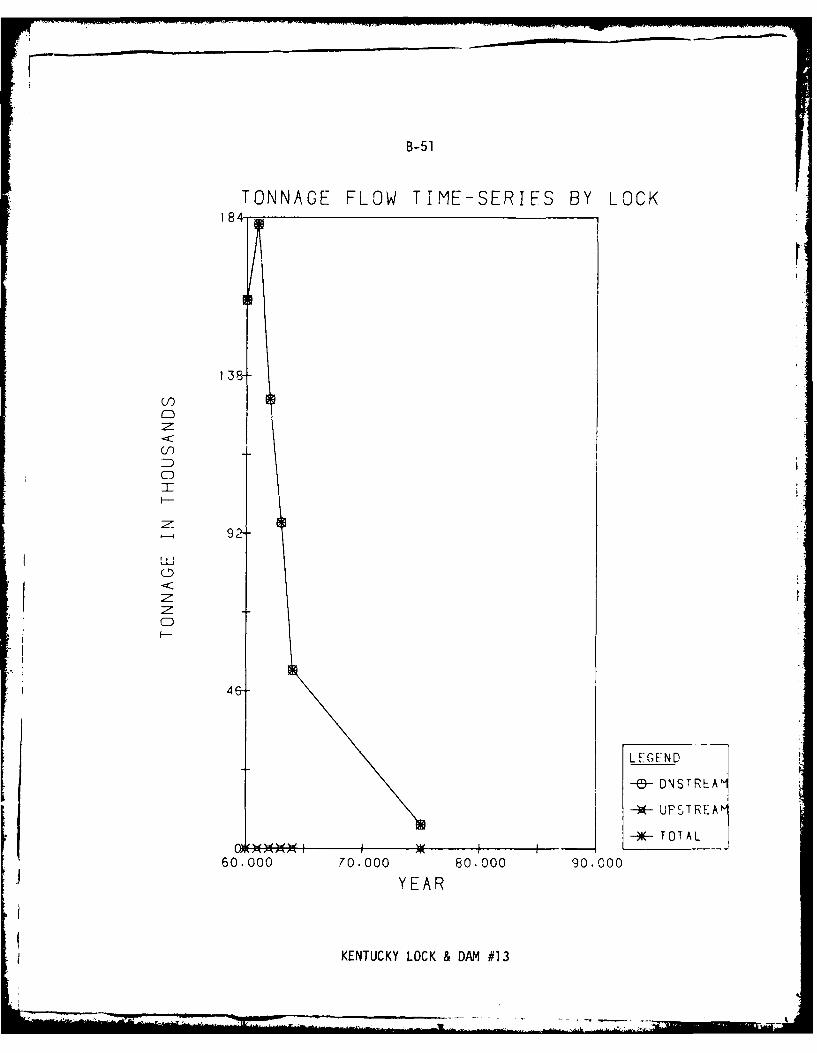
B-51
TONNAGE FLOW TIME-SERIES BY LOCK1 84
1 38
L')
CD
LEEN
TO A
60007 .00--009 -0
Y EA
KETCYLCw A 1

B-52
TONNAGE FLOW TIME-SERIES BY LOCK1 60-
12&
2!
U)
CD
80-
LUJ
0
40-
LEGEND
--- ONSTREA-X- UPSTREA
-*- TOTAL
660.000 70.000 80.000 90.000J YEAR
KENTUCKY LOCK & DAM #14

B-53
TONNAGE FLOW TIME-SERIES BY LOCK
i 2600-
:
CDQ-
0 20-
LEGEND
-e- ONSTREAN
-~-UPSTREAl
-*.TOTAL
60.000 70.000 80.000 90.000
YEAR
GREEN LOCK & DAM #1

B- 54
160TONNAGE FLOW TIME-SERIES BY LOCK
1 2600
:D
CD
8400-
0
4200-
LEGEND
-E - DNSTREA
-*-UPSTREA
-- TOTAL
6 60.000- -- 7 0.000 _ 80.000 90.000
YEAR
GREEN LOCK & DAM #2

B-55
TONNAGE FLOW TIME-SERIES_BY] LOCK
136-
0
CD
- 6
34-
LEGEND
-E - D NS TRA
_*X- UPSTREAt
-*E- TOTAL
60.000 70.000 80.000 90.000
j YEAR
GREEN LOCK & DAM #3

B -56
TONNAGE FLOW TIME-SERIES BY LOCK8800
6600
0 40
(I
0
0 20
LEGEND
-e-- DNSTREAP
-*- UPSTREAP
cl -W1- TOTAL__
60.000 70.000 80.000 90.000YEAR
BARKLEY LOCK &DAM

B- 57
TONNAGE FLOW TIME-SERIES BY LOCK4980-
3760-
cr)
Cn
__ 2540-
0
1 320-
--E-- DNSTREAr
............ U PST R EA
1 -*-TOTAL
60.000 70.000 80.000 90.000
j YEAR
CHEATHAM LOCK & DAM

B-58
TONNAGE FLOW TIME-SERIES BY LOCK50&
380-
cf)
CD
CD
26
140-
LEGEND
-E- DNSTREA
-- UPSTREA
T* TTAL
60.000 70,000 80.000 90.000YEAR
OLD HICKORY LOCK & DAM

B-59
TONNAGE FLOW TIME-SERIES BY LOCK40000
30000
C)
0000
C',
-. 0000
LEEN-eC NTRA
zPTRA
KENTUCK DAMRE

B-60
TONNAGE FLOW TIME-SERIES BY LOCK24400,
1 8400-
12400-
6400-
LEGEND
-E9- DNSTREA
-X- UPSTREAI
4001 -*- TOTAL
60.000 70.000 80.000 90.000
j YEAR
PICKWICK LOCK & DAM

B-61
TONNAGE FLOW TIME-SERIES BY LOCK1 2400
9400
/) 400 --
LLI
CD
6400 :
LEGFND-E-- DNSTREAN
-*K- UPSTREAM
40-*- TOTAL4001J60.000 70.000 80.000 90.000
YEAR
WILSON LOCK & DAM

B-62
TONNAGE FLOW TIME-SERIES BY LOCK1 2300
9300-
U)
Ul)
6300-
LUi0.cz
3300-
LEGEND
-e- DNSTREAM
-- UPSTREAM
-- TOTAL300160.000 70.000 YER80.000 90.000
WHEELER LOCK & DAM

B-63
TONNAGE FLOW TIME-SERIES BY LOCK8900 1
6700-
C)
CD
40
2300-
L F 0 EN D
--e9- DNSTREAH~
-- UPSTREAI
-ETOTAL1 00li60o. 000 70.000 80.000 90.000
GUNTERSVILLE LOCK & DAM

B-64
TONNAGE FLOW TIME-SERIES BY LOCK8100-
6100-
(I)
(I)
4100-
LUJ
2100-
LEGEND
--e- DNISTREAt
-- UPSTREA
10Joni --- TOTAL
60.000 70,000 80.000 90.000
j YEAR
NICKAJACK LOCK & DAM

B-65
TONNAGE FLOW TIME-SERIES BY LOCKI 980
1 50C
U)
:
CD
2020
CD0
54( !
LEGEND
--6- DNSTREAtF
-UPSTREA
--- TOTAL
50.000 70.000 80.000 90.000
YEAR
CHICKAMAUGA LOCK & DAM

B-66
TONNAGE FLOW TIME-SERIES BY LOCK710-;
550-
U)
:
CD)
CD
230:
39EN
49 NSRA
-X- DNSTREAV
74-*- TOTAL
60.000 70.000 80.000 90.000
YEAR
WATT'S BAR LOCK & DAM

B-67
TONNAGE FLOW TIME-SERIES BY LOCK4 0,
307-
U)
c/)
205:
20
103-
LEGEND
--- DNSTREAM
-X- UPSTREAM
-*-TOTAL
60.000 70-000 YER80.000 90.000
FT. LOUDON LOCK & DAM

B-68
TONNAGE FLOW TIME-SERIES BY LOCK9 .600-
7.200-
U)
CD
C)
CD
TOTAL
YEARNSRE
MELTON HILL LOCK & DAM

APPENDIX C
EXISTING AND PROJECTED TONNAGE
BY LOCK AND DIRECTION OF MOVEMENT
1976-1990

ii
t
J*
LL
a
c,
0
W. 4
0 U)o
4 W(
I,l
* ,0.
4 4
zii I-I1 I 1 4 it m C-' %a 4H I4H 14t4" H N -W) cm m tN H -4 .0 *, m- 1" - -C:4 4 -
-9 0 f " l a, U% 0.% PO e44 C 0- .
x €3 u M 3
CY. Z r , o : : U, , 0 .: " .I oy ,,, N :I - .. , I.
, *
4.4
* t 'oP (1 , ",I.w4 D.
0 r10 Ix - - - - - - --4- - - - - - - - - - - - -
Uz * y w 4LI -44
-
0 * z -0 0
0 o (A4
44 I.

* .0
za
0.
* UP
M co-i
z w*
C2
-* 0*o I A '
CP UP U wV'D o c , C .a'0 : C24t l tL
a* o-U ,I* A 0I oC y 0 1 a %1U Nm I ; 40, > * oIg N IW I rIC ICPk D I ( ,1 0
* & * IL0 1V I II I I i 010U z= z I II I I I 14 UI. Z4. ....
I. t~- 1. :
4 .4 * I I Io
wI-
IL I I a X 9 z 113
Ca) 4 I. )0 s t w w A UAi j 4 at, I.- % Mt t 0-i ji z . wN u4. .4. L4. u44 ua
m-M 7 0. 1- 41- 044.14..44- x0 4* 0i. S
ZN 04SJ 0. mSzce z I .-I-Ia z z* W W x M M 0 4 a n N p ~ * ~ * / * E . S - S 0 * S a l c
- ~ ~ ~ ~ ~ ~ z Id 'r, "NI .NS .C.NS .... M. MS S .S l

**
U
X
*z*0d
* 2Of
0 U)
z C,
0W ti
0 P- *
6-4
wA *ie J 1
I '. ,4 100 I t I I IU
49 .
w. .z 0 * 11. 4 1
fI . 0 10 ( dco, 1- C3U
~ o Z CL . II* 4 . W,* 10 It'. 4 . 4 0 ... @. .4 N.Wno 4 04- m4- 3c4 22 14% I-- 4 . N * ~ N *44 *.W ll *.C. fl'4% 09 -. Ot 'Ca .4 C10 IN* N. Is , . 6-
0 6 C30 .4 -a -F4 01-
M* 4.0 z - 9 0 xa-, Z 444*44444** - 444*P *44444**** W4 *4 *4 to ry *4444 *4 4 I" *4* * 4 4*
.' x* x~. V6 6j 6 .6 1 64ZN z a w -g 6 6j 6
*4*4~w u w ~ wI g@g0,04~'* 1%*064,'.60W,60 IN0 0 7 0*46
is w W &Z 6 6! *6 . 1 . * . ' I . O.60'. 0'.6y SIz 4*4 6
414*0 w-h v 6e 6.4* 6N- 60a.O i .4') .46 a'a o'0' 4n6W6
F.i 41 Lfl 6 LD -9 0'S .46 .4NUlN% U0 , .4646s46
2 * o~ a a 6 6 I 6SEEM6 6 6

0 r* jJ
0.
-
Iar
-9 1z - zZ'
0 iL
0 0 wo! 1
0D o u1U10% 40 10 s1% 10 :1 1 1 0
C., ) ly4 ob 't Uh-a *j m 1- 0 4F , IG w I" ,I' o14 0 1 4P
a- =I D. YaN 0 1 .mIs y9 j YN INN I I--j " 4 1--. i1.
N4 P4 .*'...
a1 x 0 i .-.02 Id
z /2 I -10 I
C, CL i Z' V1
AN tI'0 WO U, w 04 C) z C 0 zN C
j, 0 * Z"-. aa x a a a aZN. 1Z 0 a I a a S a

*W o
LL
0 w
I,-
c:
In
to
V,
* L*
0
.I-% m
-C a, .4 I l
In IF C3 I.- tc % y rW l r t m C
c z-' 0
L u.' .
of x N -w
* d
0 f CL 0N 1 4) 1riI N I (l l i: W
I. ) ,- r*-49 * 1.- J w*
-) z 0 Yx*1(O :NM
(A &~I
of x 0:3 2*
C, 0 0 *1-&. 4* 1/1. -a z Z . I a a
44* M v I -.1 I I 1 Ij 1 I 9WU I -C' w W O I I w I 4 ' I . . 1 4J. 1wA I 9 tv. I a- t S -4 I .4 1 e
41D j 111 I x'2 I ~ 1 4 1 4 I PI4 I W A 0 I I .31 I ( N I .4 1 I ' 4 I 1-
ILI 0 I- S

w
w
* 0,
0
0
* L .J0,
za.I
on
z Co
* L
C-
0 U, UN...
z 0- x* v
0 w
-J- 0...... . mm m
44 0 *1
S c .. . .i4. . ... . 1.a1,. . . .. . . . . . ...
Of .* * I % I IU * I I IU I. III I I I C
4 0 -. M*I P: :1d ~ u 'o C; U C: . 0 U%. Fl 1; 1 . 94 14
U)02 x 1 - .11' a' -fl -1 11 j .0
z 00*x z -
4* E *0 0 0 0 0 I U I 0 oZ0. xZ U 0 1 3 S 0 0 0 0 0 0 0 I 0
A. 0~ W SU C0.* I4,O0410. -04% 0'0'tmtS 0410'10004z * o . . o 0 ' gz0 U m U ~ o 0 ~ C . c J 0 ~ e .z t .
so. w- *c u U e4 eae.aI Oo 0. C e 4q0o~aga'b a o 5-cnn ~ ~ ~ ~ 9 .0 jl i0KOOO 40'0 UU014 x44 1 a 0'm w' LIPa, 0
14 O U) 0. ~ C 4 0) 0 0 34 U 0 S U 0 0

0 uw
0.
zI.-
* co*Lu
0
n w * ,fs t
* If w
0. I
0..,
0 7, 1. 1
r- IC -X) *II
> to *
0n IIx
2,0 0 3 -Z- -
0. It* z4 z- . 4 9 . I. 4. x x4 !' 0'x. ~ N
x5 5 x x x 5i 5 0 LD I m 5
I S 5 5 5 LD 0 I S I I l zS
-1 0 4 N i9W wc wO .co -o -o -j CL. 0 0 0 . z5IdI- 02 lI0D 4 4 4 4 N N N N N N 5 .

0
S ia* e
0
0 0
*z*
0w*>
0
C, 0 It
b-4 10m. P U
00
z , zzoD LLXJ*
all: 011 t*
L 4 'A
v 0 I : 1 0 C , 1 1 1 NI U !1C3. ,v 'b I.- DY ) .2 .4 10 cu wI * I O V I t . D 1 0 LA C40 1' 1 10_j. w C.U V) 404 14 N m Pt; 0 y. . .
> ZZP.4Z* JS a S S g a a a a S a a
L. . . . 4 ib ......w ae * 0. f I- S 6 5 54 6*owr z 0a a a a a I S U I S S S ~ I s.
.JS 00 b-4 -Iaa.-b bC -SC. b-bC.a4-aa-a4- -aa-aba.a- -1ba.C.4.or. Cf 2a-. 0 0
0 owZ.a S S 0= 42 0= Cal a CC a , gcm do ODJ *4'JtS j 400S S4 f b 4Ja ~ * Sf0 .n.0 z * j 0b . M a..a ~ . 40a~~~a.0a .r.a~ O
LaOiN "I-aLa a.,attb ~ P N ~ a 4.qt * U'a Nb J b '~ pb abS4 ~ ~ ~ ~ ~ ~ ~ ) *W* C.) L,) 2,ac0 2f o N0.P~b N NU N4O0~
C6 50. x.. sS-La. "I .4 1-a.a-b-a.ap-
40 0 ,- . 0z z ~ I f W 1 3 x w j
C30 W v 00 6 40 4 -9 I -9
.44
2 *0*Z Z ~ 4 WI .5 0 3 m

IIIII..
0
0
LUz .-
tL
0 0)
* . *
(.,3
0 10 wm
to t *:P
I -- t o U , mI I -T 1 P 4 I W % f, I m I •r I •n I I r 1 ' I - , P
3c(: r1i I I I IIm U I N I e I I I
.,. . -
0L. ) X
z 0 MI T 1 0 011
7 -J
x0 z 0.L x-to LU O -
0n 0 C n- .
CL w *n jj it, -S wor t Z$> o (it 7* 3 1'* 0 P- 0 N. P0 0 W0 z, " .0 * .x - .C.toO 0 00 xN Iej N.- i ror 7r ..o No O- .- t to 0 yp -* P.
v* VO* 0 4 d l o -
ur.O N 0 5 z w 0, x 0.40 * LW S0- .. 5 .I 0-S .P-SO ,0 . 5 1-'S.P .W S. 5 5 0 0 15 0U

7 AD-A0B7 193 BATTELLE COLUMBUS LABS OHN/ /FORECAST OF FUTURE OHIO RIVER BASIN, WATERWAY TRAFFIC BASED ON
--ETC(U)
SEP 79 H COLLIS DACW69-7B-C-0059
UNCLASSIFIED NL
3 /END
llllllll lli8oI

0 V,af ft'
% - - -- --- - - -- - -- --
* r*39 It am
40 #g.P4
.0 V
wo a
oo *
00 4.

a
0
.......
AL 0
at0
° NS
'K.
*L
0
w C m lC
*
*.-,
~o 4
.. . .. . . . .. . . . . . .: .. .. w T -: , -a' 11" '. ; 4: : ; ,
o M
02, I'm~dJ e0%8,, i %
0 06.44 1 4, I
ED P44
4 4 , i
imd el 0 0 ~ X e l e
~~v A
z a -j
0 a 0
-
6S
1.2 *
-8 A0O

I0
0 w
C4 0.VA SC2 V
w01 101 1" C, 1 , p 1 MI 1:.* 0 1:10 o ' 4 t C00 0-w Iq hIF uI 1.. uI 0m* 01C N0 . a1
(A * oIr ,IP 6I CI -1w1.5 .IMt IMf :"Ua 10 a 1 1 ' 0P
0 w 3 r 8011 1 1 'ziD- *"0P- 4....84 140
0 I z . 0U
ot 0 5"
s-I I y 14
z w
ul , 0
z . ow
IN 3 - j 5
wel 42 ZI o
4 ~~~ ~ 01 14 .4* N * 4. .4. * . F 4 w! .4 *'W, n* i i . .:0 4 01 NE0 wg aa $ " IA I3 in *4 z 4 m N 44 *I
4p 0 0*
I-*4 2 s 34643-*433.4* *44- I. **4*6-4*3.4-4*4 *4~-4**4 3434.4344544*443464344 .

0 Ii.
0
0-
*w* q
0.
0 t
C3-1~ 14,
*v In Ko w .4 mCo-t b, U I U - o U% 1 .
0U-9 r 0
= -U , 3Lt 0U ,S D I P35w.0
0 .40 j1
Wo I 00 N1 n0o fV)N 0t ro:0 - 1
4-1 " n U
e4 I 0Lk0 1 1 10
41 14 -z 0 Y , 4 -0i*
a- 4 Z 4 . o
IA. I- of3. z ioy w w r W
IL 2 jjCo. A x VPa 4 I
2...w W1 .0. x4 I4 11 . N .14 54 00 4* Pm IU 00 .44
3- M T la4 3 34 j 4-#43-43 v 4
-. 40 r~. 19 3 1- x 3 f 34 at -9 3ZP. iZN 3 S a 3 do 3 3 3 3
34.0 *~* WIU 5M4 NS003043N0Seen~a IP.0SU-3e03cNen.S*U*U3..3)- 4p US n3 ... NS.e.S .. . US .S .3,3.34

wIzI
0
0 Up
n * e0f p4
*w 0
0 C*0 ") z
C3z 6 a fx IW . I" aN#
z 14
6- .0 4.
w Z
"d OR - * -A -
0 "I B0~~~ "n*:i,gal I IN
o. . O .4 * 7 N. 64 .0 0* 00 .. . .14 .4 08 8

0
z6.
to a
* 400In .
*i t4 n4' ulc o. N o : o w . D F % d m bC1 4 0
.0 6 o. r Y o f 0 .P, .4*d
.9 zzi
1*3 0 2 t1 3wIt 6i
*2 C: 10 l3CP.1I," C :1NOOf0-w 1 1. 40 0 1" 0 1' 4 sI' ,It r1' 1,14P I ,
0 If 6 nI a 40 1 l i& 4 Ip n., au
* w w t 0C 1
1 0 6 1 ;,C
04 0
z. z wAm 6
z z
44 16 19
-a U
3-. 49 64
.. % -6

0
.,
1-.
* z
* z
*% 1.- *q t.
oD e*4 "3f
I-I I AV40v
Iw usI* 24
In "0 m
o~ o f-
w4 I C.4 0 1f w4 )Im 1.I w . o 4t oZol" 4 4F
IU 00 3AafP C o.. 41 14 4 49 i%~. 4*: U'.ZN4Z J 5 9 9 9 5 * ~ *aW
.0 a M IJ 9 I 9 U 1 * N 9 ' A Q 5 EA N A M 4 O A . N N s , I I , PI- in orE QI* .* * 0 9N I v*..g~l ... N~I~ N
" 0 -4P4W.
0 0 -1 ww Zat., * 0 Z 0N *9 * N*z9 z x vup)g4.E~u. G~. Np m a-9i .%PN 901D 9 N E .S P*I C 9 C 0 AI~ E 9
4LI. *15 - 1 n 9110*0 I4 P*N'P'qPIII4W9.

APPENDIX D
TOTAL OHIO RIVER BASIN TONNAGE
BY ORIGIN AND DESTINATION BEA
1969-1976

D-1
TOTAL 0OHI0 RIVER BASIN TONNAGEBY BEA OF ORIGIN AND DESTINATION
1976 - 1990(IN THOUSAND TONS)
1976 1980 1985 1990
Tallahassee BEA OriginTo Chattanooga BEA 1 2 2 2
Nashville BEA 10 10 11 11Knoxville BEA 6 9 11 12PT ntington BEA 8 9 10 11Louisville BEA IIIIEvansville BEA 41 0 0 0Pittsburgh BEA 3 4 4 4
Pensacola BEA OriginTo Pittsburgh BEA 1 1 1 2
Birmingham BEA OriginTo Chattanooga BEA 2 4 5 5
Huntington BEA 15 14 16 16Cleveland BEA 1 2 2 2
Memphis BEA OrkginTo Nashville BEA 352 373 392 411
Huntington BEA 21 22 23 24Louisville BEA 109 114 117 124Evansville BEA 102 106 110 116Cincinnati BEA 49 53 59 68Columbus BEA 3 3 44Pittsburgh BEA 109 95 101 105Cleveland BEA 22 22 23 24Paducah BEA 7 9 9 10
Huntsville BEA OrinTo Memphis BEA 24 35 42 46
Huntsville BEA 3030 1802 626 683Chattanooga BEA 230 379 461 497Nashville BEA 1 1 1 2Huntington SEA 73 77 82 85Louisville BEA 2 4 5 5Evansville BEA 12 13 14 15JCincinnati BEA 23 27 33 42Columbus BEA 2 2 2 24Pittsburgh SEA 43 52 61 65

D-2
TOTAL OHIO RIVER BASIN TONNAGEBY BEA OF ORIGIN AND DESTINATION
1976 - 1990(IN THOUSAND TONS)
196 1980 1985 1990r
Huntsville BEA Origin (Cont'd)To Cleveland BEA 5 5 5 5
Chicago BEA 217 303 371 406Peoria BEA 4 5 5 6Davenport BEA 4 6 6 7La Crosse BEA 14 16 18 20Minneapolis BEA 18 20 22 23Wichita BEA 9 10 11 13 iKansas City BEA 1 1 2 2Quincy BEA 8 9 10 11St. Louis BEA 8 9 10 10Paducah BEA 49 26 3 3Little Rock BEA 4 5 5 6Mobile BEA 31 44 55 60New Orleans BEA 366 583 706 764Houston BEA 83 88 93 95McAllen BEA 1 1 1 1
Chattanooga BEA OriginTo Huntsville BEA 68 84 94 104itChattanooga BEA 1963 2185 2388 2589
Nashville BEA 4 5 5 6Knoxville BEA 14 17 19 21Pittsburgh BEA 10 10 11 11Cleveland BEA 2 2 2 2Chicago BEA 27 38 47 51Peoria BEA 13 15 16 19Davenport BEA 10 11 12 14Dubuque BEA 6 6 7 8La Crosse BEA 19 28 35 39Wichita BEA 1 2 2 2St. Louis BEA 2 3 4 4New Orleans BEA 1022 1467 1818 1984McAllen BEA 12 17 21 22

D-3
TOTAL OHIO RIVER BASIN TONNAGE -
BY BEA OF ORIGIN AND DESTINATION1976 - 1990
(IN THOUSAND TONS)
1976 1980 1985 1990
Nashville BEA OriginTo Huntsville BEA 88 109 121 135
Nashville BEA 1289 1591 1842 2102Huntington BEA 26 29 32 35Evansville BEA 5 5 42 42Pittsburgh BEA 20 22 23 24Chicago BEA 3 3 3 3Peoria BEA 10 10 11 11Minneapolis BEA 28 39 47 55St. Louis BEA 22 23 23 24Paducah BEA 81 136 167 180New Orleans BEA 172 236 313 395Beaumont BEA 11 19 23 25Houston BEA 4 7 9 10McAllen BEA 22 25 29 35
Knoxville BEA OriginTo Columbia BEA 1 2 2 2
Birmingham BEA 2 4 5 5
Chattanooga BEA 43 73 89 96Knoxville BEA 115 142 158 175ClarksburgBE1222Chicago BEA 17 19 21 22Paducah BEA 2 2 2 2
Huntington BEA OriginTo Pensacola BEA 2 2 2 4
Memphis BEA 33 36 40 45Huntsville BEA 53 241 347 452Nashville BEA 148 567 1072 1075Huntington BEA 13012 19157 24821 26271Louisville BEA 639 976 989 886Evansville BEA 302 341 268 258Cincinnati BEA 6059 11013 21615 23899Columbus BEA 787 799 860 865
jClarksburg BEA 756 1048 1048 1048Pittsburgh BEA 10993 12671 14057 15366Cleveland BEA 1261 2517 3082 3568

D-
TOTAL OHIO RIVER BASIN TONNAGEBY BEA OF ORIGIN AND DESTINATION
1976 - 1990(IN THOUSAND TONS)
1976 1980 1985 1990
HuntingtonBEA Origin (Conttd)To Chicago BEA 169 185 199 201
Peoria BEA 11 12 13 14Davenport BEA 1 I 1 1Dubuque BEA 10 13 16 18La Crosse BEA 1 1 2 2Minneapolis BEA 17 21 21 21Sioux City BEA 1 1 1 1Wichita BEA 1 1 1 1Kansas City BEA 5 6 6 6St. Louis BEA 522 745 882 1014Paducah BEA 187 1798 1522 1523Little Rock BEA I I I IFort SmithbBEA 5 6 6 6Monroe BEA 1 2 2 2Jackson BEA 291 13 13 13Mobile BEA 387 483 559 593New Orleans BEA 108 247 257 262Lake Charles BEA 3 3 3 3Beaumont BEA 910 11 12
Houston BEA 422 558 669 720
Corpus Christi BEA 3 3 4 4
Louisville BEA OriginTo Tallahassee BEA 1 2 2 2
Memphis BEA 5 5 5 5Huntsville BEA 13 13 14 16
Nashville BEA 10 10 10 10Huntington BEA 831 989 1245 1547Louisville BEA 2575 2966 3283 3636
Evansville BEA 462 470 480 493Cincinnati BEA 445 550 679 849Columbus BEA 54 64 79 99Pittsburgh BEA 231 489 568 684Cleveland BEA 61 61 61 61Chicago MEA 8 21 24 30Peoria BEA 8 9 10 11
St. Louis BEA 39 112 132 164

D-5
TOTAL OHIO RIVER BASIN TONNAGEBY BEA OF ORIGIN AND DESTINATION
1976 - 1990(IN THOUSAND TONS)
1976 1980 1985 1990
Louisville BEA Origin (Cont'd)
To Paducah BEA 249 261 267 270Monroe BEA 12 21 25 27Jackson BEA 12 18 21 23Mobile BEA 3 376 469 625New Orleans BEA 198 696 833 1054Houston BEA 4 4 5 5
Evansville BEA OriginT6 Tallahassee BEA 1495 1496 1496 1497
Pensacola BEA 53 53 53 53Memphis BEA 1368 1760 2063 2199Huntsville BEA 528 157 86 93Chattanooga BEA 222 2392 1684 1317Nashville BEA 6549 9600 7449 7735Huntington BEA 979 982 999 1003Louisville BEA 7271 7102 7143 7166Evansville BEA 2835 3302 3653 3996Springfield BEA 24 26 27 28Cincinnati BEA 4540 4602 5471 9634Columbus BEA 835 835 835 835
I.Pittsburgh BEA 174 179 183 185Cleveland BEA 54 56 58 60Chicago BEA 798 1097 1327 1435Peoria BEA 120 120 120 120Davenport BEA 125 134 139 142Dubuque BEA 256 381 479 522La Crosse BEA 169 209 240 255Minneapolis BEA 147 183 210 223St. Louis BEA 795 966 1099 1160Paducah BEA 1992 3165 3858 4053Tulsa BEA 1 1 I 1Monroe BEA 2 4 5 5Greenville BEA 2 2 2 2

D-6
TOTAL 0110 LImER I xSIW TOUImaABY BRA Of ORIGIN AND DESTINATION
1976 - 1990(IN THOUSAND TONS)
1976 1980 1945 1990
Evansville BRA OrJ in (Conc'd)To Mobile BRA 60 72Z 763 787
New Orleans SEA 5361 S087 6006 i462Beaumont BEA 11 12 16 19Houston SEA 10 LZ 14 15Corpus Christi SEA 5 5 5 6McAllen MA 9 9 6 6
Springfield BEA OrainTo Huntsville SEA 9 11 13 15
Chattanooga BW 3 3 3
Cincinnati BEA OriInTo Tallahassee i. 1 1 2 2
Memphis BEA 12 Is 17 19Huntsville BEA 10 Dio.! f4i3 1515Chattanooga BF, 15 368 .3 252Nashville BEA 1 301 65 77Huntington MA 1203 1265 1441 1579Louisville BEA 9" 1112 1242 1383Evansville SEA 64 iv 1517Cincinnati SEA 3818 6u6p 864 9936Columbus BEA 232 354 517 519Pittsburgh BEA 588 662 730 "7SCleveland EA 9 252 473 474Chicago MA , 2 3 3Peoria BEA 2 2 3 3Minneapolis ILk 5 6 7St. Louis EA 3. 50 62 68Paducah lEA 453 2113 17;- 1921Monroe MA 1 22Mobile MA 23 29 33 38New Orleans 51.% 1.A 2002 2307 2678Beaumont BEA 2 0 1 0Houston EA 3 27 36 49
I

D-1
TOTAL OHIO lIVER lAS IN TONNAGE
BY BEA OF ORIGIN AND DESTINATION1976 - 1990
(IN THOUSAND TONS)
1976 1980 L985 1990
C. '.umbus BEA Origin
To Huntsville BEA 11 10 11 11 j4unt Lnton BEA 2156 2398 3252 3252
Louisvtlle BEA 15 15 is 15
Evansvlle BEA 2 0 0 0
Cinciunati BEA 16 16 16 16
Columbus SEA 178 221 246 272
Pittsburgh SEA 46 58 66 73
Cleveland SEA 10 10 11 11
Chicago SEA 26 29 33 34
Minneapolis BEA I I I I
St. Louis SEA 6 9 9 10
Paducah SEA 9 4 0 0
New Orleans BEA 3 4 4 5
ClarksburgLEA Origin
To Huntsville BEA 0 244 0 0
Nashville BEA 0 105 500 500
Colnimbus SEA 0 454 787 786
Clarksburg SEA 788 983 911 902
Pittsburgh BEA 3192 4036 4378 4421
Cleveland BEA 219 318 396 430
Pittsburgh BEA Origin 40 44
To Tallahassee BEA 30 35 0 1
Pensacola SEA I I I I
It rainghas BEA 10 13 15 16
Momphts BEA 113 121 126 131
Huntsville SEA 63 2626 2591 2362
Chattanooga SEA 66 70 74 78
Nashville BEA 631 97 144 146
Huntington BEA 2694 3272 3398 3525
Louisville BEA 421 453 498 514
Evansville SEA 77 86 93 101
Cincinnati SEA 3406 5067 5517 6019
Columbus IEA 1286 2040 2664 2901
Clarksburg 6EA 994 1246 1257 "255
Pittsburgh BA 31835 39599 45038 48562
Cleveland BSA 4038 6486 7376 7634
!|

D-8
TOTAL OIO lIVER BASIN TONNAGEBY SKA OF ORICIN AND DESTINATION
1976 - 1990(IN THOUSAND TONS)
1976 1960 1985 1990
Pittsburgh SEA Origin (Conc'd)To Chicago SEA 77 81 87 91
Peoria SEA 27 24 26 27Minneapolis SEA ?8 28 28 28Wichita BEA I I I IKansas City SEA 4 5 5 5St. Louis BEA V)3 179 183 191Paducah BRA 57 88 119 122Little Rock AEA 2 2 3 3Fort Smith BEA 45 49 53 57Tulsa BEA 34 38 42 44Monroe SEA I I 1 IGreenville SEA 3 3 4 4Jackson BEA 9 9 9 9Mobile SEA 25 27 31 34New Orleans BEA 558 666 757 823Beaumont BEA 19 20 20 21Houston BEA 378 421 466 501Corpus Christi BEA 34 38 42 48McAllen SEA 11 12 14 15
Cleveland SEA OriginTo MmhsBEA 2 2 3 3
SHuntsville RE.A 3 3 4 4
HWmtington BEA 49 49 50 soLouisville SEA I I I ICincinnati SEA 2 2 2 2Columbus BEA 21 18 20 20Clarksburg SKA 135 178 178 178Pittsburgh BRA 7). 737 840 894Cleveland lEA 25 28 30 30Chicago SEA 7 10 12 13Peoria MA 3 4 5 5Wichita BA I I I ISt. Louis LA 2 3 4 5Paducah MA 9 9 9 9Jackson lA 1 1 1 2Notaton MA 11 14 16 16
4 I Im" - : " I l IP I

D-9
TOTAL OHIO RIVER BASIN TONNAGEBY BEA OF ORIGIN AND DESTINATION
1976 - 1990(IN THOUSAND TONS)
1976 1980 1985 1990
Chicago BEA OriginTo Huntsville BEA 298 350 396 428
Chattanooga BEA 139 151 163 172Nashville BEA 95 104 114 119Knoxville BEA 1 2 2 2Huntington BEA 93 94 98 100Louisville BEA 42 45 48 50Evansville BEA 57 77 92 100Cincinnati BEA 7 7 8 9Columbus BEA 102 19 21 22Pittsburgh BEA 19 20 20 21Cleveland BEA 2 4 5 5Paducah BEA 39 39 39 39
Peoria BEA OriginTo Huntsville BEA 112 137 155 175
Chattanooga BEA 11 12 13 13Nashville BEA 2 2 3 3Cincinnati BEA 2 3 3 3Pittsburgh BEA 66 70 73 75
Davenport BEA OriginTo Huntsville BEA 17 21 23 25
Chattanooga BEA 9 9 9 9Huntington BEA 1 1 1 2Evansville BEA 4 4 4 5Cincinnati BEA 4 5 6 9Pittsburgh BEA 10 11 12 13
Dubuque BEA OriginTo Huntsville BEA 1 1 2 2
Pittsburgh BEA 1 1 1 1
La Crosse BEA OriginTo Huntsville BEA 3 4 5 5
Chattanooga BEA 3 3 4 4

TOTAL OHIO RIVER BASIN TONNAGEBY BEA OF ORIGIN AND DESTINATION
1976 - 1990(IN THOUSAND TONS)
1976 1980 1985 1990
Minneapolis BEA OriginTo Huntsville BEA 134 169 194 219
Chattanooga BEA 295 356 408 460Nashville BEA 57 87 106 118Knoxville BEA 9 11 13 14Evansville BEA 56 69 78 88Cincinnati BEA 12 12 16 21Pittsburgh BEA 13 13 14 15
Sioux City BEA OriginTo Huntsville BEA 43 73 89 96
Chattanooga BEA 2 3 3 4
Evansville BEA 1 1 2 2
Wichita BEAOrigin
To Huntsville BEA 21 32 38 41Chattanooga BEA 38 47 53 60Louisville BEA 9 10 11 12Evansville BEA 89 ill 127 143Cincinnati BRA 13 19 22 24Pittsburgh BEA 4 7 9 10
Kansas City BEA OriginTo Huntsville BEA 69 85 98 ill
Chattanooga BEA 195 241 277 314Knoxville BEA 1 1 2 2Evansville BEA 1 1 2 2
Columbia BEA OriginTo Huntsville BEA 1 1 2 2
(uincy BEA OriginTo Huntsville BEA 24 29 32 37
Chattanooga BEA 7 7 a 9Huntington BEA 1 1 1 1Evansville BRA 9 10 11 12Cincinnati BRA 27 32 45 60

D-1 I
TOTAL OHIO RIVER BASIN TONNAGEBY BEA OF ORIGIN AND DESTINATION
1976 - 1990(IN THOUSAND TONS)
1976 1980 1985 1990
St. Louis BEA OriginTo Huntsville BEA 270 299 319 341
Chattanooga BEA 282 348 388 410Nashville BEA 808 706 809 854Knoxville BEA 106 178 217 234Huntington BEA 1032 1037 1040 1041Louisville BEA 760 787 816 974Evansville BEA 635 675 713 657Cincinnati BEA 517 657 835 904Columbus BEA 42 33 48 87Pittsburgh BEA 469 553 854 1044Cleveland BEA 14 15 15 16Paducah BEA 93 132 145 153
Paducah BEA OriginTo Tallahassee BEA 7 11 13 14
Pensacola BEA 390 580 728 795Memphis BEA 1826 2673 3193 3458Huntsville BEA 50 7170 7715 7715Chattanooga BEA 153 319 70 71Nashville BEA 1545 1900 2124 2372Knoxville BEA 1 1 2 2Huntington BEA 2095 4644 3137 1644Louisville BEA 70 85 86 86Evansville BEA 126 186 8189 10188Cincinnati BEA 1422 2702 2721 2748Columbus BEA 28 29 31 32Pittsburgh BEA 103 140 160 169Cleveland BEA 248 364 428 461Chicago BEA 159 168 173 174Peoria BEA 10 187 258 258Davenport BEA 21 32 40 43La Crosse BEA 14 22 27 30Minneapolis BEA 1 2 2 2Kansas City BEA 5 5 5 5Quincy BEA 17 25 31 34St. Louis BEA 195 280 345 375Paducah BEA 2843 3751 4283 4620Little Rock BEA 1 2 2 2Tulsa BEA 2 2 2 2Shreveport BEA 444 746 910 981Monroe BEA 442 137 898 969

D-12
TOTAL OHIO RIVER BASIN TONNAGEBY BEA OF ORIGIN AND DESTINATION
1976 - 1990(IN THOUSAND TONS)
1976 1980 1985 1990
Paducah BEA Origin (Cont'd)To -Greenville BEA 570 852 1009 1097
Jackson BEA 141 221 265 287Mobile BEA 88 124 152 165New Orleans BEA 2271 3719 4436 4774Lake Charles BEA 6 7 8 9Beaumont BEA 54 65 70 75Houston BEA 10 11 12 13
Little Rock BEA OriginTo Huntsville BEA 3 6 7 7
Knoxville BEA 1 1 2 2Evansville BEA 1 1 2 2Pittsburgh BEA 3 4 5 5
Fort Smith BEA OriginTo Pittsburgh BEA 56 58 60 61
Tulsa BEA OriginTo Huntsville BEA 1 1 2 2
Chattanooga BEA 85 102 118 134Evansville BEA 0 21 42 63Cincinnati BEA 11 11 12 12Columbus BEA 1 2 2 2Pittsburgh BEA 1 1 1 1Cleveland BEA 13 14 14 15Paducah BEA 3 6 7 7
Monroe BEA OriginTo Chattanooga BEA 1 2 2 2
Nashville BEA 3 6 7 7Evansville BEA 4 7 9 10
Greenville BlEA OriginTo Chattanooga BEA 2 3 3 4
Nashville BEA 49 50 52 52Louisville BEA 74 76 38 20Evansville BEA 4 4 4 4Cincinnati BEA 17 23 32 47Columbus BEA 1 I I 1Pittsburgh BEA 86 91 93 94

TOTAL OHIO RIVER BASIN TONNAGEBY BEA OF ORIGIN tpND DESTINATION
1976 - 1990(IN THOUSAND TONS)
-1976 1980 1985 1990Jackson BEA OriginTo Huntsville BEA 8 9 10 11
-Huntington BEA 9 10 11 12Pittsburgh BEA 12 17 20 21
Mobile BEA OriginTo Huntsville BEA 88 96 104 117
Chattanooga BEA 57 60 62 65Nashville BEA 132 142 157 175Louisville BEA WIO 211 222 231Evansville BEA *69 304 330 359Cincinnati BEA 1.40 146 151 155Pittsburgh BEA 4 5 5 6Cleveland BEA 5 5 5 5Paducah BEA 55 84 89 89
New Orleans BEA OriginTo Huntsville BEA 1)46 500 552 593
Chattanooga BEA ',43 489 539 598Nashville BEA I'mO 1059 1152 1243Knoxville BEA 14 19 23 25Huntington BEA 1-;49 1514 1591 1651Louisville BEA K,7 1201 1348 1520Evansville BEA 1"97 1025 1147 1221Cincinnati BEA WF40 2135 2594 3217Columbus BEA (66 765 912 1499Clarksburg BEA 50 53 58 64Pittsburgh BEA 2E99 3086 3575 3853Cleveland BEA 4162 491 521 548Paducah BEA 90 1039 1160 1174
Lake Charles BEA OriginTo Cincinnati BEA 53 60 84 118
Columbus BEA 2 2 2 2
Beaumont BEA OriginTo Huntsville BEA t45 48 SI 54
Chattanooga BEA l'55 188 209 222Nashville BEA 71 119 145 156

D-14
r.
TOTAL OHIO RIVER BASIN TONNAGEBY BEA OF ORIGIN AND DESTINATION
1976 - 1990(IN THOUSAND TONS)
1976 1980 1985 1990
Beaumont BEA Origin (Cont'd)To Knoxville BEA 38 39 40 42
Huntington BEA 316 354 392 435Louisville BEA 18 25 30 37Evansville BEA 5 5 5 5Cincinnati BEA 205 283 330 360Pittsburgh BEA 354 464 533 576Cleveland BEA 19 25 30 32Paducah BEA 3 3 3 3
Houston BEA OriginTo Huntsville BEA 852 880 909 952
Chattanooga BEA 86 104 115 122Nashville BEA 26 28 30 33Knoxville BEA 16 17 19 22Huntington BEA 646 650 703 729Louisville BEA 232 264 258 268Evansville BEA 23 26 28 30Cincinnati BEA 329 395 456 535Columbus BEA 63 52 63 69Pittsburgh BEA 791 904 1004 1033Cleveland BEA 156 177 206 236Paducah BEA 101 102 5 6
Corpus Christi BEA OriginTo Huntsville BEA 24 23 24 24
Chattanooga BEA 1 1 1 2Nashville BEA 2 2 3 3Huntington BEA 118 133 159 173Louisville BEA 6 0 0 0Evansville BEA 330 363 364 364Cincinnati BEA 47 62 87 122Columbus BEA 2 2 3 3Pittsburgh BEA 25 21 22 22Paducah BEA 3 3 3 3
IL,

D-1 5
TTLOHIO RIVER BASIN TONNAGEBY BEA OF ORIGIN AND DESTINATION
1976 - 1990(IN THOUSAND TONS)
1976 1980 1985 1990
McAllen BEA OriginTo -Huntsville BEA 13 16 19 20
Nashville BEA 22 3 3Huntington BEA 34 32 36 37Louisville BEA 1 1 1 2Cincinnati BEA 23 28 36 45Pittsburgh BEA 164 183 207 211Cleveland BEA 67 67 69 71
Source: Based on Battelle Survey
Note: All movements which originate and terminate in the Lexington,Ky. BEA have been deleted to avoid disclosure of individualshipper/receiver operations.