Embed Size (px)
Citation preview
Energy Conservation in Uttaranchal University, D.Dun.
AECEP 1
Uttaranchal University Arcadia Grant, PO. Chandanwari,
Premnagar, Dehradun
October’2020
Study Conducted by
Association of Energy Conservation & Environment Protection Dehradun
Energy Conservation in Uttaranchal University, D.Dun.
AECEP 2
Acknowledgement
We would like to thank all the people whose assistance was a milestone in the completion of this
project. We wish to give thanks to University management and staff who took the time to respond
on our query and help us to collect data as required for Energy Audit of University campus.
We also like thank to Mr. Jagdeesh Joshi, Dr. Nirmal Chandra Uniyal, Dr. Kartikey Gaur, Mr. Akram
Ansari senior management and College staff who took the time to provide and gather data of
University Departmental buildings to complete this study. We also acknowledge the hard work of
leadership and core team member Mr. R.K.Aggarwal, Mr. Ashish Vashishth, Mr. Vibhor Aggarwal
and Mr. Naresh Tariyal of Association of Energy Conservation & Environment Protection.
Last but not the least we thank to Mr. Jitendra Joshi, Chancellor Uttaranchal University and all
senior Officials for their guidelines, support & Interest who directed this study.
Audit Team
Mr. Ashish Vashishth (BEE Certified Energy Auditor) - Project Head Mr.
R.K. Aggarwal (BEE Accredited EA) – Project Guide
Mr. Vibhor Aggarwal (B.Tech.) – Energy Auditor Mr.
Naresh Tariyal – Data Compiler

Energy Conservation in Uttaranchal University, D.Dun.
AECEP 3
Summary of Electrical Energy Saving Potential
Ch Particulars kWh
Saving Potentials
Amount Expenditure P B P No. Lacs Lacs Lacs (months)
1 Power Factor Improvement
i Improving power factor from 0.915 to 0.99 by repair, replacement of relay, additional capacitors,
2nd APFC for 2nd transformer
0.98 5.84 1.6 3
2 Reducing Voltage
i Shifting transformer taps to normal position (3); using both servo stabilizers for buildings
0.155 0.92 0.4 4
3 Lighting
1 Replacing 500 fluorescent tubes installed on walls without reflectors with LED at proper angle
0.1566 0.93 0.6 8
2 Replacing 25 nos 3*36 W CFL with LED 0.037 0.22 0.2 11
Total saving 0.1936 1.15 0.8 8
4 Ceiling Fans
Purchase all new star rated
5 Air Conditioners
i Operate all conditioners at 26-270C 0.0243 0.144 0 0
Total Electrical Saving 1.353 8.054 2.800 4
Summary of HSD Saving Potential
Ch
no.
Saving potentials
Item Liters
Amount
Lacs Expenditure
Lacs PBP
(months)
1
Insulation of all flue gas pipes, proper
clearance from openings, less voltage &
frequency during operation, monitoring of
specific fuel consumption etc
214.3 0.15 0.15 12
Summary of LPG Saving Potential
Ch
no.
Saving potentials
Item Kg
Amount
Lacs Expenditure
Lacs PBP
(months)
1 Proper cleaning & replacement of gas burners
with energy efficient burners 370 0.15 0.05 4
Energy Conservation in Uttaranchal University, D.Dun.
AECEP 4
GENERAL
About Report: This is a brief report covering all Energy Consuming equipment. It contains one
words and one xls file. It has been prepared in the order of saving potential with least payback
period. All calculations in xls are attached to explain formulae’s etc and enable staff to
understand basics of calculations. All remaining are calculations or basic data for reference.
Everything mentioned in this report is implementable
Focus Point to check: We wanted to arrive at Energy Consumption of Air conditioners, Fans,
Lighting etc. For this, we measured load of some samples as well as relied upon standard data.
Then hours of working were collected from staff after discussion. Based upon it, we worked out
annual energy consumption. Then we co-related it with actual and applied suitable factor like
75% & 85%. On this basis of this energy consumption, we calculated saving potential. All this is
given in xls sheets.
1) All saving potential calculations are reliable. But in some cases, investment figures may vary
as it is depending on University management to purchase latest appliances vs. market rates.
2) Mostly saving potential calculations are based upon actual measurement/ standards and very
few unavoidable cases on assumption.
About AECEP & Audit Team:
“Association of Energy Conservation and Environment Protection” working in the field of
Energy Consultancy, ISO 50001 (An Energy Management System), Solar Power plant consultancy
as well as Green & Environment Audit and Certification, we provide a complete solution for
Energy Conservation and Monitoring for Organizations.
Our members are working in the Energy Conservation Consultancy field from a long time and
having all required Instruments to conduct Audit. We are born to deliver the best solutions in the
field of Energy Management as well as Quality Management Systems which adds even more value,
modernize and provide efficient solutions for Organization’s existing Management systems.
Er. R K Aggarwal
He is BE (Elect). After retirement from Bhakra Management Board as Member (Power), started
consultancy in energy conservation in 2000. He is BEE’s certified (EA-0179) (Passed their examination
in first batch of 2004) as well as accredited energy auditor (Accredited energy auditor-0111) and PCRA’s
empanelled energy auditor (Since 2001). Some of his achievements in energy audit field are as below:
i) He has carried out energy audit of more than 435 industries & buildings. It includes 7 DC’s
during base line M& V, 5 M & V during 15-16 & 5 mandatory audits of DC’s during 15-16 &
14 during 2017-20 & more than 15 DC’s otherwise than mandatory.
Energy Conservation in Uttaranchal University, D.Dun.
AECEP 5
ii) Possess all imported & branded energy audit instruments.
iii) His contributions to draft codes on transformers, motors, refrigeration, lighting, driers, piping
were found very well by BEE during 2005 for which they gave me both cash (Highest amongst
3 selected for contribution) and commendation certificate.
2). Published material- One book on “Over hauling, Life assessment, Refurbishment & Up rating of
hydro power plants”. To the best of his knowledge, this is the only exhaustive book on this subject.
Er. Ashish Vashishth
18 years of Experience in Manufacturing Industries, Assy. Plants, Residential & Commercial Buildings,
Steel Sector, Forging Sector in all aspects of Energy Conservation. I am running the Society called as
“Association of Energy Conservation and Environment Protection” since 2007 and we are also
empanelled with PCRA,UREDA, CREDA (SDA of BEE) as well as APITCO for which we have
carried Energy Audit at State as well as National Level. I have also conducted a number of Seminars,
Quiz Programmes and Workshops etc. regarding Energy Conservation in various parts of Uttarakhand. I
have been also awarded as The Best Energy Auditor for the year 2010 under Uttrakhand Energy
Conservation by UREDA
Work Experience in Services: -
Conducting Energy Audit.
Conducting Training Programme.
Preparation of case studies in energy efficiency/conservation sector.
Preparation of Database of Product & Services.
Feasibility studies for setting up projects.
Preparation of Detailed Project Reports for setting up Projects.
Environmental Impact Assessment.
Supervision of Project Implementation.
Project Management.
Operation & Maintenance of Project.
Advising on Procurement matters.
Er. Vibhor Aggarwal
i. He is B.E. (Electronics & communication). He is in energy audit & conservation consultancy for
the last 5 years. He has carried out 3 M & V, 8 MEA audits of designated consumers and 56
medium & small scale consumers and buildings. He has Attended 3 nos two day’s training
courses of PEDA for green buildings & learned proper operation of building software. He was
associated with safety audit of 50 bank buildings. He has also passed NPC’s industrial &
buildings safety on line safety examination.
Energy Conservation in Uttaranchal University, D.Dun.
AECEP 6
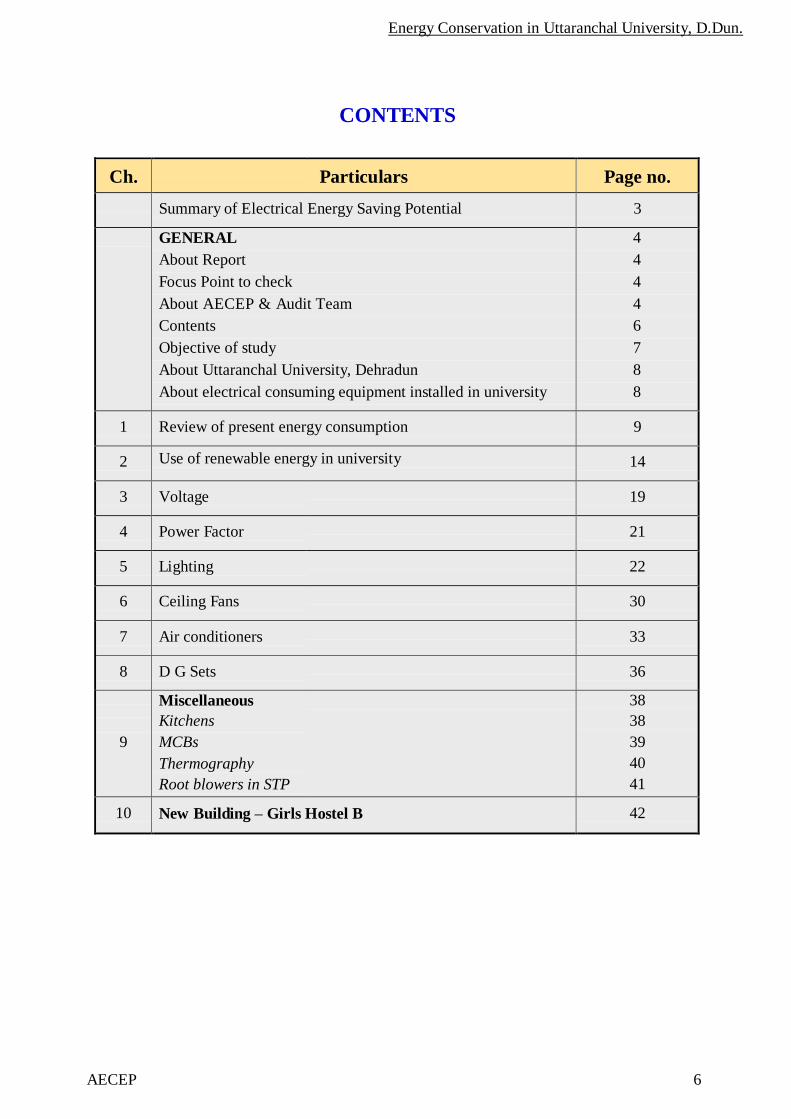
CONTENTS
Ch.
Particulars Page no.
Summary of Electrical Energy Saving Potential 3
GENERAL
About Report
Focus Point to check
About AECEP & Audit Team
Contents
Objective of study
About Uttaranchal University, Dehradun
About electrical consuming equipment installed in university
4
4
4
4
6
7
8
8
1 Review of present energy consumption 9
2 Use of renewable energy in university 14
3 Voltage 19
4 Power Factor 21
5 Lighting 22
6 Ceiling Fans 30
7 Air conditioners 33
8 D G Sets 36
9
Miscellaneous
Kitchens
MCBs
Thermography
Root blowers in STP
38
38
39
40
41
10 New Building – Girls Hostel B 42
Energy Conservation in Uttaranchal University, D.Dun.
AECEP 7
Objective of Study:
Verify the steps adopted for Energy management in the campus
Spot the Inefficient or Inadequate practices, if any
Improve the Energy preserving measures and methods
Identify potential Energy saving opportunities
Formulate feasible steps and measures to be adopted in the campus
The Uttaranchal University, Dehradun authorities got this study done to explore energy
saving potential.
About Uttaranchal University, Dehradun : Uttaranchal University is constituted with
the merger of professional institutes of Sushila Devi Centre for
Professional Studies & Research Society, namely Law College
Dehradun, Uttaranchal Institute of Technology and Uttaranchal
Institute of Management. It is ranked amongst one of the best
universities in the country. It offers an array of multi–disciplinary
courses and great placement opportunities for all the students.
Uttaranchal University can boast of being an institution par excellence. It is located in a
fascinating geological setting. It is flanked by NH-72 on one side and a beautiful broad slithering
river on the other side. The pine trees surrounding the area lend a pristine and wholesome
ambience to the campus. Uttaranchal University offers multi-disciplinary study programs under
its following institutes:
Law College Dehradun (LCD)
Uttaranchal Institute of Technology (UIT)
Uttaranchal Institute of Management (UIM)
Uttaranchal Institute of Pharmaceutical Sciences (UIPS)
School of Applied & Life Sciences (SALS)
School of Agriculture (SOA)
University Polytechnic (UP) and many more…
Energy Conservation in Uttaranchal University, D.Dun.
AECEP 8
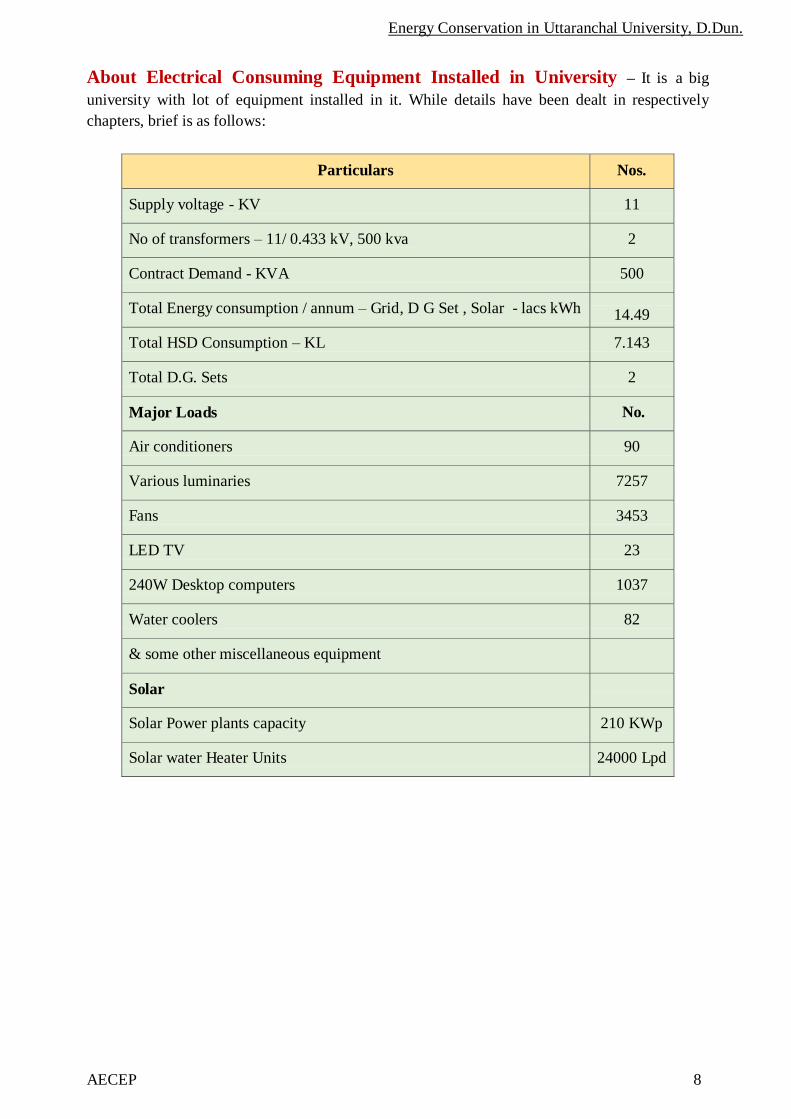
About Electrical Consuming Equipment Installed in University – It is a big
university with lot of equipment installed in it. While details have been dealt in respectively
chapters, brief is as follows:
Particulars Nos.
Supply voltage - KV 11
No of transformers – 11/ 0.433 kV, 500 kva 2
Contract Demand - KVA 500
Total Energy consumption / annum – Grid, D G Set , Solar - lacs kWh
14.49
Total HSD Consumption – KL 7.143
Total D.G. Sets 2
Major Loads No.
Air conditioners 90
Various luminaries 7257
Fans 3453
LED TV 23
240W Desktop computers 1037
Water coolers 82
& some other miscellaneous equipment
Solar
Solar Power plants capacity 210 KWp
Solar water Heater Units 24000 Lpd
Energy Conservation in Uttaranchal University, D.Dun.
AECEP 9
1) Review of present energy consumption
The Electricity demand is met from following sources:
i. Purchase from Grid : It is major source of power & forms 81.2% of total use
ii. Solar : The university authorities have installed 210 KWp capacity over roof top. Its
share is about 17.1% of total consumption
iii. D G Sets are also used when grid supply fails. This use is rare. Proper running record &
HSD consumed is maintained. But energy meters are not installed. Assuming average
production of 3.5 kwh/liter of HSD, total production comes to about 25000 kWH. It
forms 1.74% of total use.
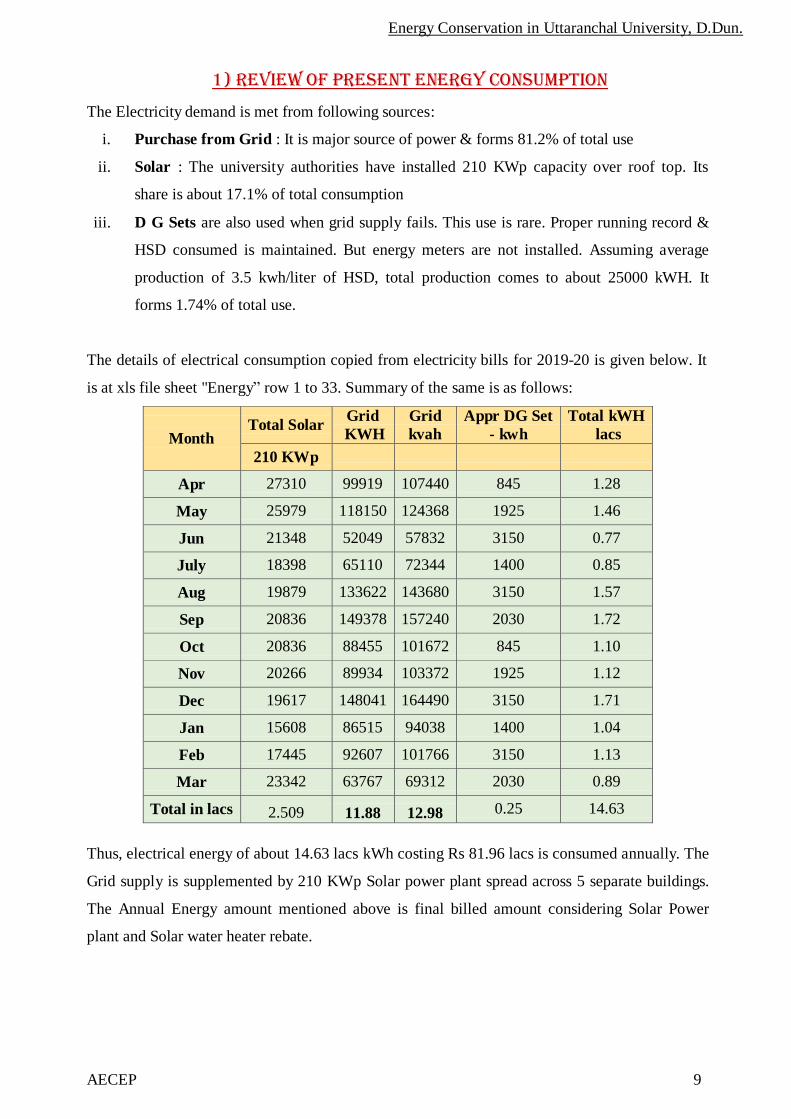
The details of electrical consumption copied from electricity bills for 2019-20 is given below. It
is at xls file sheet "Energy” row 1 to 33. Summary of the same is as follows:
Month
Total Solar Grid
KWH
Grid
kvah
Appr DG Set
- kwh
Total kWH
lacs
210 KWp
Apr 27310 99919 107440 845 1.28
May 25979 118150 124368 1925 1.46
Jun 21348 52049 57832 3150 0.77
July 18398 65110 72344 1400 0.85
Aug 19879 133622 143680 3150 1.57
Sep 20836 149378 157240 2030 1.72
Oct 20836 88455 101672 845 1.10
Nov 20266 89934 103372 1925 1.12
Dec 19617 148041 164490 3150 1.71
Jan 15608 86515 94038 1400 1.04
Feb 17445 92607 101766 3150 1.13
Mar 23342 63767 69312 2030 0.89
Total in lacs
2.509
11.88
12.98 0.25 14.63
Thus, electrical energy of about 14.63 lacs kWh costing Rs 81.96 lacs is consumed annually. The
Grid supply is supplemented by 210 KWp Solar power plant spread across 5 separate buildings.
The Annual Energy amount mentioned above is final billed amount considering Solar Power
plant and Solar water heater rebate.

Energy Conservation in Uttaranchal University, D.Dun.
AECEP 10
1) The tariff is discussed as follows:
i. Contract demand: The sanctioned contract demand is 500 KVA against maximum 516
actual during 2019-20. But this was only in 1 month. The average maximum demand is
352 KVA. Earlier, the Contract demand was 353 KVA but due to increase in some
months & penalties, it was got increased to 500 KVA in January 2020. It is satisfactory
ii. Power factor: The average power factor from Electricity bills found as follows :
Month
Grid KWH
Grid KVAh
PF
Apr 99919 107440 0.93
May 118150 124368 0.95
Jun 52049 57832 0.9
July 65110 72344 0.9
Aug 133622 143680 0.93
Sep 149378 157240 0.95
Oct 88455 101672 0.87
Nov 89934 103372 0.87
Dec 148041 164490 0.9
Jan 86515 94038 0.92
Feb 92607 101766 0.91
Mar 63767 69312 0.92
Total
(MW/MVA)
11.88
12.976
0 .915
Average 98962 0.91
The energy charges are based on kVAH reading. It is suggested that power factor be increased to
average 0.99. Saving on this score is as follows:
Energy Conservation in Uttaranchal University, D.Dun.
AECEP 11
Narration Values
Annual kWh- Lacs 11.87
Existing PF 0.915
Proposed PF 0.99
KVAH with existing power factor 12.973
KVah with proposed power factor 11.990
Saving in kVAH - Lacs 0.9828
Rate / kvah including other variable charges 5.94
Amount savable - Rs lacs 5.84
Expected investment on replacement of damaged
capacitors, relay , APFC on 2nd transformer
1.6
Payback period – Months 3
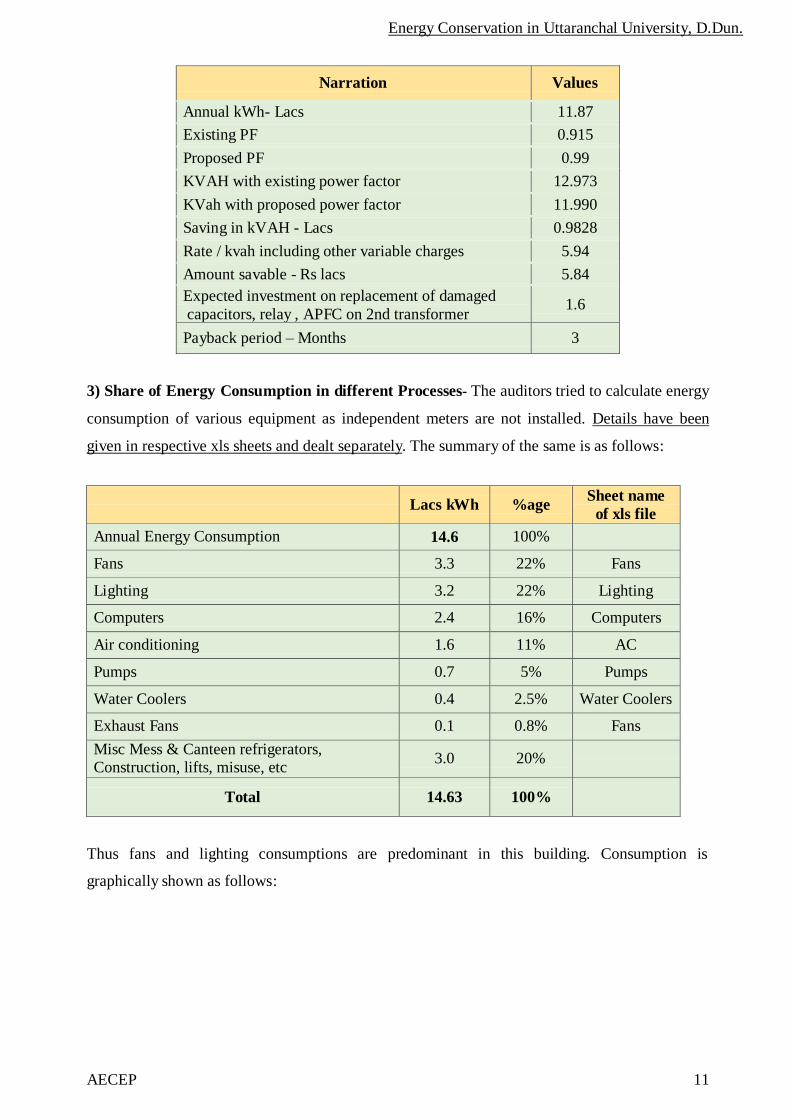
3) Share of Energy Consumption in different Processes- The auditors tried to calculate energy
consumption of various equipment as independent meters are not installed. Details have been
given in respective xls sheets and dealt separately. The summary of the same is as follows:
Lacs kWh
%age Sheet name
of xls file
Annual Energy Consumption 14.6 100%
Fans 3.3 22% Fans
Lighting 3.2 22% Lighting
Computers 2.4 16% Computers
Air conditioning 1.6 11% AC
Pumps 0.7 5% Pumps
Water Coolers 0.4 2.5% Water Coolers
Exhaust Fans 0.1 0.8% Fans
Misc Mess & Canteen refrigerators, Construction, lifts, misuse, etc
3.0
20%
Total
14.63
100%
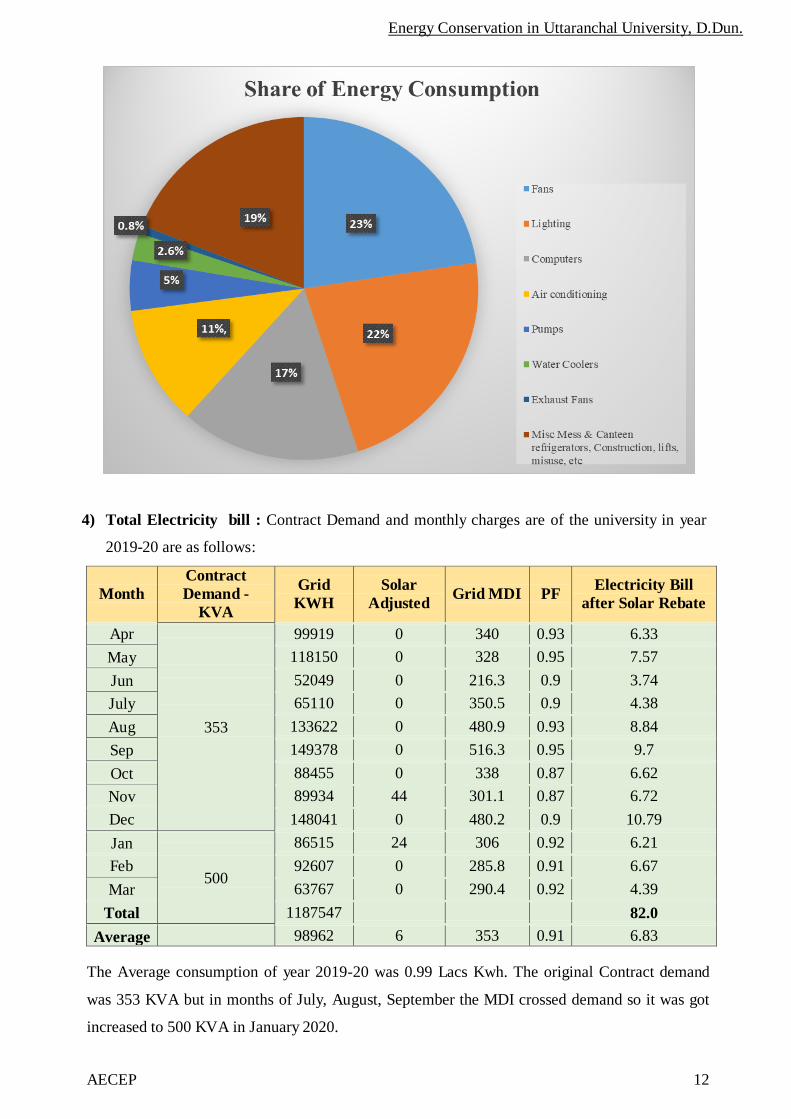
Thus fans and lighting consumptions are predominant in this building. Consumption is
graphically shown as follows:
Energy Conservation in Uttaranchal University, D.Dun.
AECEP 12
4) Total Electricity bill : Contract Demand and monthly charges are of the university in year
2019-20 are as follows:
Month
Contract
Demand -
KVA
Grid
KWH
Solar
Adjusted
Grid MDI
PF
Electricity Bill
after Solar Rebate
Apr
353
99919 0 340 0.93 6.33
May 118150 0 328 0.95 7.57
Jun 52049 0 216.3 0.9 3.74
July 65110 0 350.5 0.9 4.38
Aug 133622 0 480.9 0.93 8.84
Sep 149378 0 516.3 0.95 9.7
Oct 88455 0 338 0.87 6.62
Nov 89934 44 301.1 0.87 6.72
Dec 148041 0 480.2 0.9 10.79
Jan
500
86515 24 306 0.92 6.21
Feb 92607 0 285.8 0.91 6.67
Mar 63767 0 290.4 0.92 4.39
Total 1187547 82.0
Average 98962 6 353 0.91 6.83
The Average consumption of year 2019-20 was 0.99 Lacs Kwh. The original Contract demand
was 353 KVA but in months of July, August, September the MDI crossed demand so it was got
increased to 500 KVA in January 2020.
Energy Conservation in Uttaranchal University, D.Dun.
AECEP 13
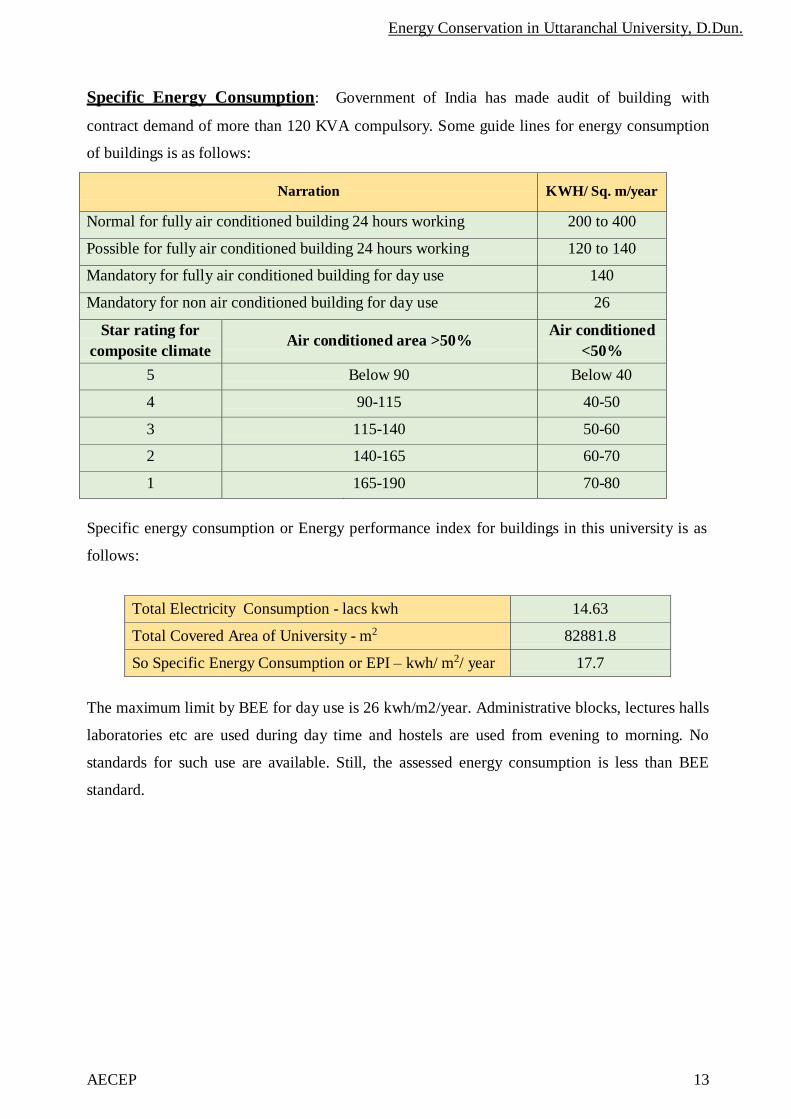
Specific Energy Consumption: Government of India has made audit of building with
contract demand of more than 120 KVA compulsory. Some guide lines for energy consumption
of buildings is as follows:
Narration
KWH/ Sq. m/year
Normal for fully air conditioned building 24 hours working 200 to 400
Possible for fully air conditioned building 24 hours working 120 to 140
Mandatory for fully air conditioned building for day use 140
Mandatory for non air conditioned building for day use 26
Star rating for
composite climate
Air conditioned area >50% Air conditioned
<50%
5 Below 90 Below 40
4 90-115 40-50
3 115-140 50-60
2 140-165 60-70
1 165-190 70-80
Specific energy consumption or Energy performance index for buildings in this university is as
follows:
Total Electricity Consumption - lacs kwh 14.63
Total Covered Area of University - m2 82881.8
So Specific Energy Consumption or EPI – kwh/ m2/ year 17.7
The maximum limit by BEE for day use is 26 kwh/m2/year. Administrative blocks, lectures halls
laboratories etc are used during day time and hostels are used from evening to morning. No
standards for such use are available. Still, the assessed energy consumption is less than BEE
standard.
Energy Conservation in Uttaranchal University, D.Dun.
AECEP 14
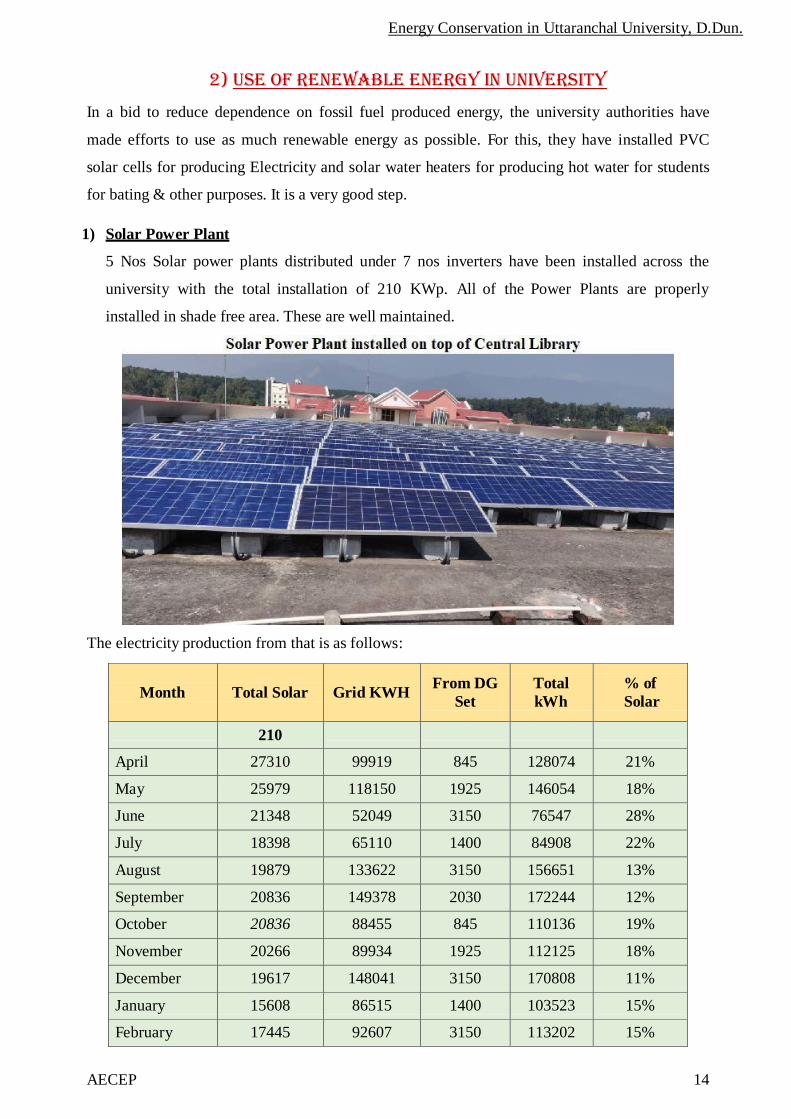
2) Use of renewable energy in university
In a bid to reduce dependence on fossil fuel produced energy, the university authorities have
made efforts to use as much renewable energy as possible. For this, they have installed PVC
solar cells for producing Electricity and solar water heaters for producing hot water for students
for bating & other purposes. It is a very good step.
1) Solar Power Plant
5 Nos Solar power plants distributed under 7 nos inverters have been installed across the
university with the total installation of 210 KWp. All of the Power Plants are properly
installed in shade free area. These are well maintained.
The electricity production from that is as follows:
Month
Total Solar
Grid KWH
From DG
Set
Total
kWh
% of
Solar
210
April 27310 99919 845 128074 21%
May 25979 118150 1925 146054 18%
June 21348 52049 3150 76547 28%
July 18398 65110 1400 84908 22%
August 19879 133622 3150 156651 13%
September 20836 149378 2030 172244 12%
October 20836 88455 845 110136 19%
November 20266 89934 1925 112125 18%
December 19617 148041 3150 170808 11%
January 15608 86515 1400 103523 15%
February 17445 92607 3150 113202 15%

Energy Conservation in Uttaranchal University, D.Dun.
AECEP 15
March 23342 63767 2030 89139 26%
Total in lacs
2.509
11.875
0.25
14.634
17.1%
Thus about 17.1 % electricity is met through Solar power. It is very good. Most the roof space
available is either covered by solar power plants or by solar water heaters at hostels. The plant
authorities plan to cover some more available area in near future.
2) The split up of solar Electricity produced from April to September from different plants
is given below (detailed is covered in Xls sheet “Uttaranchal Univ Solar” in tab Energy):
Month
Library 1
Library
2
Library
3
Law
college
Manage
ment
Civil
Block
Polyte
chnic
Total
Solar
Installed Capacity 30 30 30 50 20 20 30 210
April 2695 3536 3385 7399 2589 2665 4113 26382
May 2742 3606 3443 7377 2169 1935 4113 25385
June 3095 3029 3270 6187 1900 2274 3449 23204
July 3495 2306 3278 5526 1625 2034 3087 21351
August 2977 1933 2794 4848 2036 1772 2691 19051
September 3637 3323 3415 6087 2036 2220 3386 24104
Total in 180 Days 18641 17733 19585 37424 12355 12900 20839 139477
Days 180 180 180 180 180 180 180 180
KWH/KW/Day 3.45 3.28 3.63 4.16 3.43 3.58 3.86 3.69
Generation in 365 Days
37800
35959
39714
75888
25053
26158
42257
282828
Should be Value 4.25 4.25 4.25 4.25 4.25 4.25 4.25 4.25
Should be KWH in 180 Days
22950
22950
22950
38250
15300
15300
22950
160650
Short Fall in 180 Days
4309
5217
3365
826
2945
2400
2111
21173
Should be KWH in 365 Days
46538
46538
46538
77563
31025
31025
46538
325763
Short Fall in 365 Days
27897
28805
26953
40139
18670
18125
25699
42934
Cost of Shortfall / Year @ Rs 5.94 / Unit
Rs 2.55 lacs
The above table shows that average generation from April to September is 3.69 kwh/KWp /day.
Ideally it should have been 4.00 to 4.25 kwh/KWp/day. Thus about 42934 kwh/ year costing
Rs 2.55 Lacs has been produced less.
Energy Conservation in Uttaranchal University, D.Dun.
AECEP 16
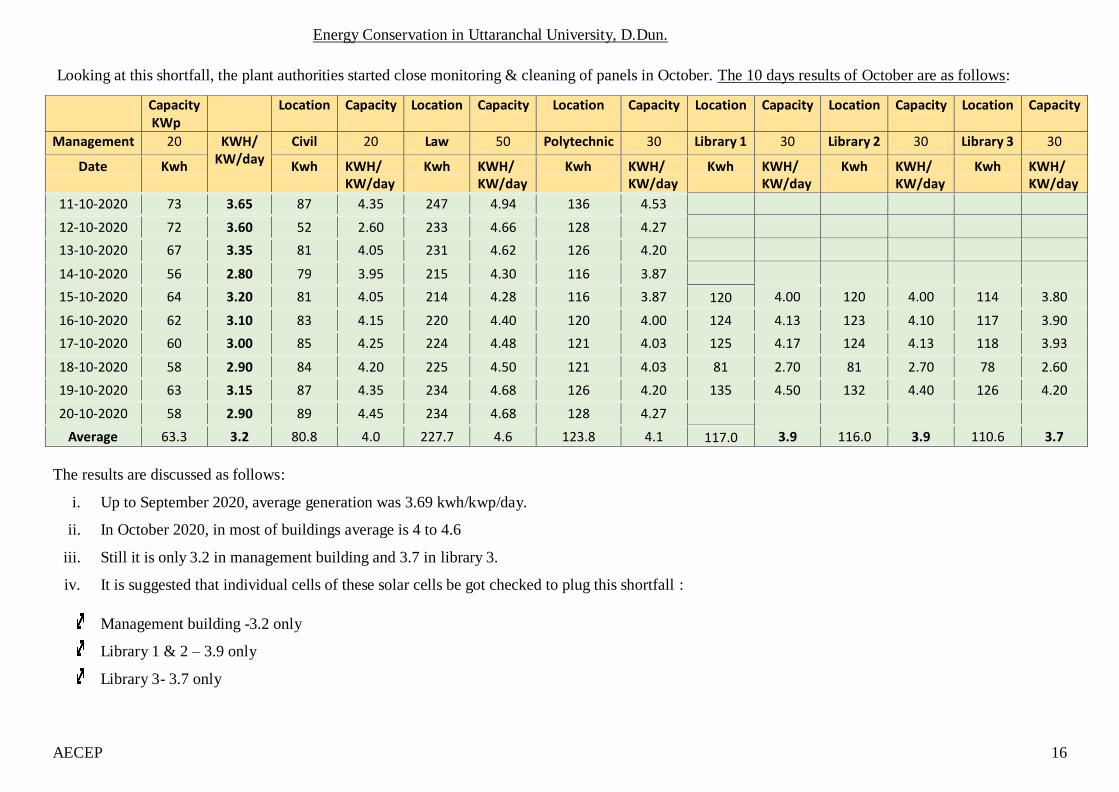
Looking at this shortfall, the plant authorities started close monitoring & cleaning of panels in October. The 10 days results of October are as follows:
Capacity KWp
Location Capacity Location Capacity Location Capacity Location Capacity Location Capacity Location Capacity
Management 20 KWH/ KW/day
Civil 20 Law 50 Polytechnic 30 Library 1 30 Library 2 30 Library 3 30
Date Kwh Kwh KWH/ KW/day
Kwh KWH/ KW/day
Kwh KWH/ KW/day
Kwh KWH/ KW/day
Kwh KWH/ KW/day
Kwh KWH/ KW/day
11-10-2020 73 3.65 87 4.35 247 4.94 136 4.53
12-10-2020 72 3.60 52 2.60 233 4.66 128 4.27
13-10-2020 67 3.35 81 4.05 231 4.62 126 4.20
14-10-2020 56 2.80 79 3.95 215 4.30 116 3.87
15-10-2020 64 3.20 81 4.05 214 4.28 116 3.87 120 4.00 120 4.00 114 3.80
16-10-2020 62 3.10 83 4.15 220 4.40 120 4.00 124 4.13 123 4.10 117 3.90
17-10-2020 60 3.00 85 4.25 224 4.48 121 4.03 125 4.17 124 4.13 118 3.93
18-10-2020 58 2.90 84 4.20 225 4.50 121 4.03 81 2.70 81 2.70 78 2.60
19-10-2020 63 3.15 87 4.35 234 4.68 126 4.20 135 4.50 132 4.40 126 4.20
20-10-2020 58 2.90 89 4.45 234 4.68 128 4.27
Average 63.3 3.2 80.8 4.0 227.7 4.6 123.8 4.1 117.0 3.9 116.0 3.9 110.6 3.7
The results are discussed as follows:
i. Up to September 2020, average generation was 3.69 kwh/kwp/day.
ii. In October 2020, in most of buildings average is 4 to 4.6
iii. Still it is only 3.2 in management building and 3.7 in library 3.
iv. It is suggested that individual cells of these solar cells be got checked to plug this shortfall :
Management building -3.2 only
Library 1 & 2 – 3.9 only
Library 3- 3.7 only
Energy Conservation in Uttaranchal University, D.Dun.
AECEP 17
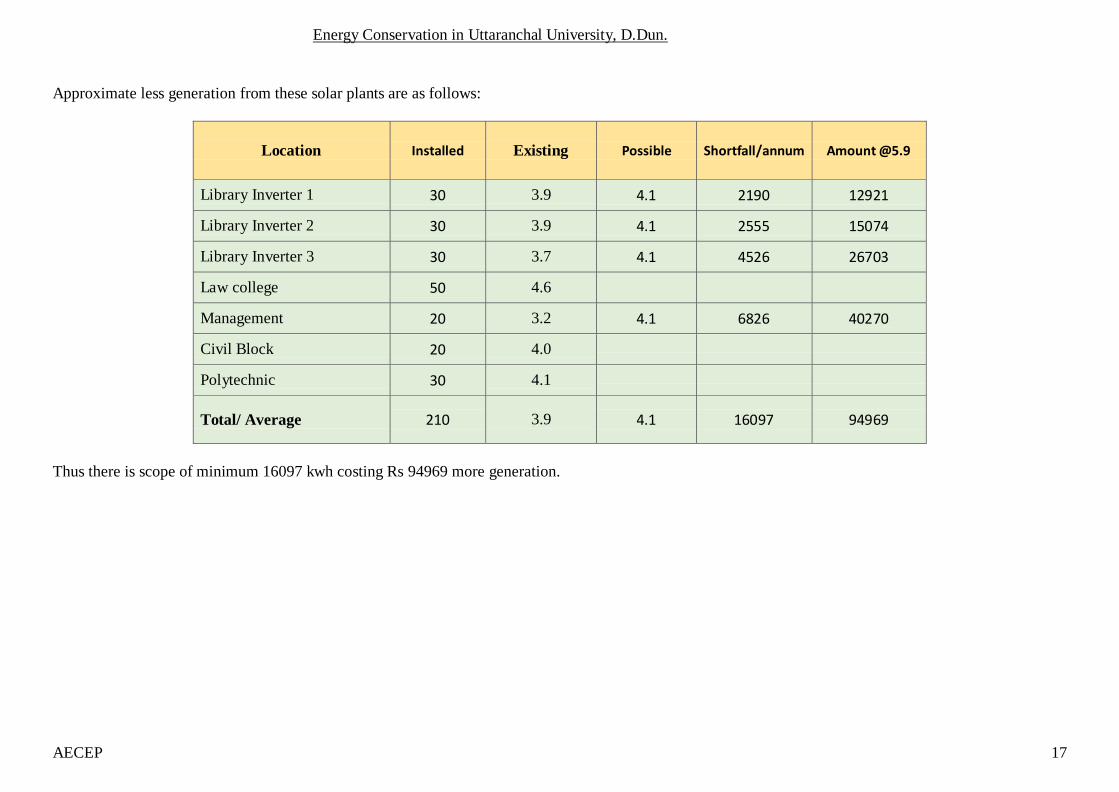
Approximate less generation from these solar plants are as follows:
Location
Installed
Existing
Possible
Shortfall/annum
Amount @5.9
Library Inverter 1 30 3.9 4.1 2190 12921
Library Inverter 2 30 3.9 4.1 2555 15074
Library Inverter 3 30 3.7 4.1 4526 26703
Law college 50 4.6
Management 20 3.2 4.1 6826 40270
Civil Block 20 4.0
Polytechnic 30 4.1
Total/ Average
210
3.9
4.1
16097
94969
Thus there is scope of minimum 16097 kwh costing Rs 94969 more generation.
Energy Conservation in Uttaranchal University, D.Dun.
18 AECEP
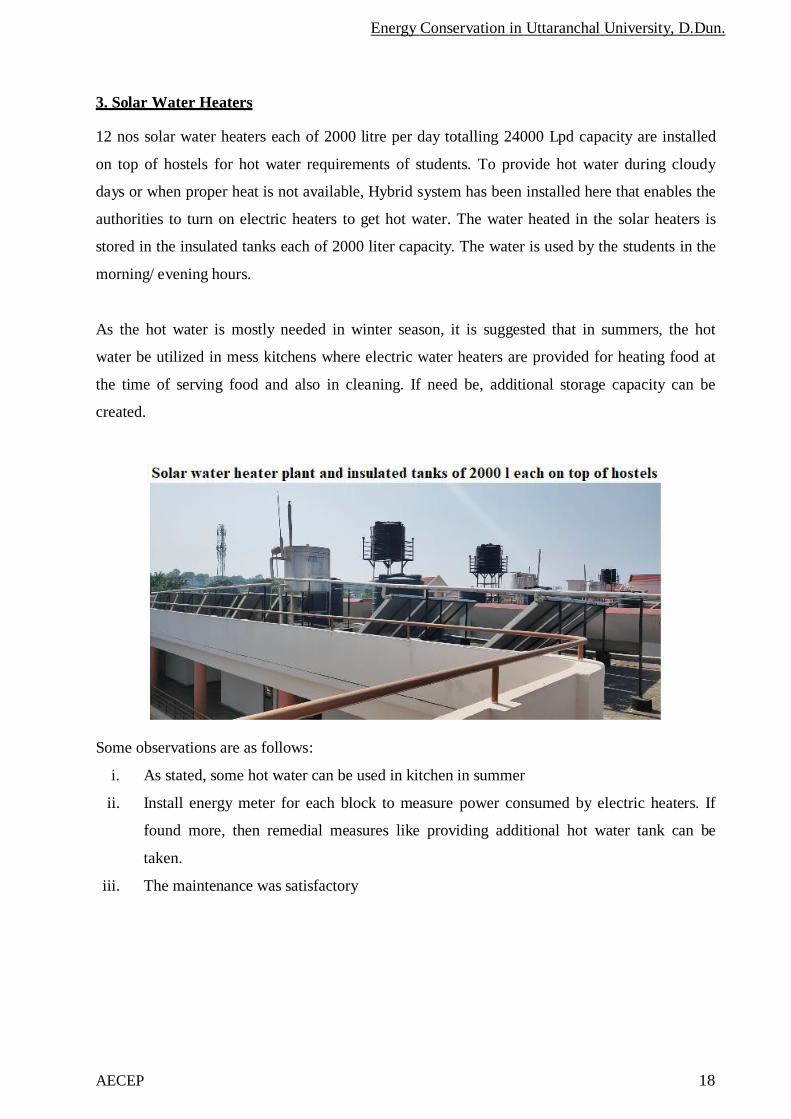
3. Solar Water Heaters
12 nos solar water heaters each of 2000 litre per day totalling 24000 Lpd capacity are installed
on top of hostels for hot water requirements of students. To provide hot water during cloudy
days or when proper heat is not available, Hybrid system has been installed here that enables the
authorities to turn on electric heaters to get hot water. The water heated in the solar heaters is
stored in the insulated tanks each of 2000 liter capacity. The water is used by the students in the
morning/ evening hours.
As the hot water is mostly needed in winter season, it is suggested that in summers, the hot
water be utilized in mess kitchens where electric water heaters are provided for heating food at
the time of serving food and also in cleaning. If need be, additional storage capacity can be
created.
Some observations are as follows:
i. As stated, some hot water can be used in kitchen in summer
ii. Install energy meter for each block to measure power consumed by electric heaters. If
found more, then remedial measures like providing additional hot water tank can be
taken.
iii. The maintenance was satisfactory
Energy Conservation in Uttaranchal University, D.Dun.
19 AECEP
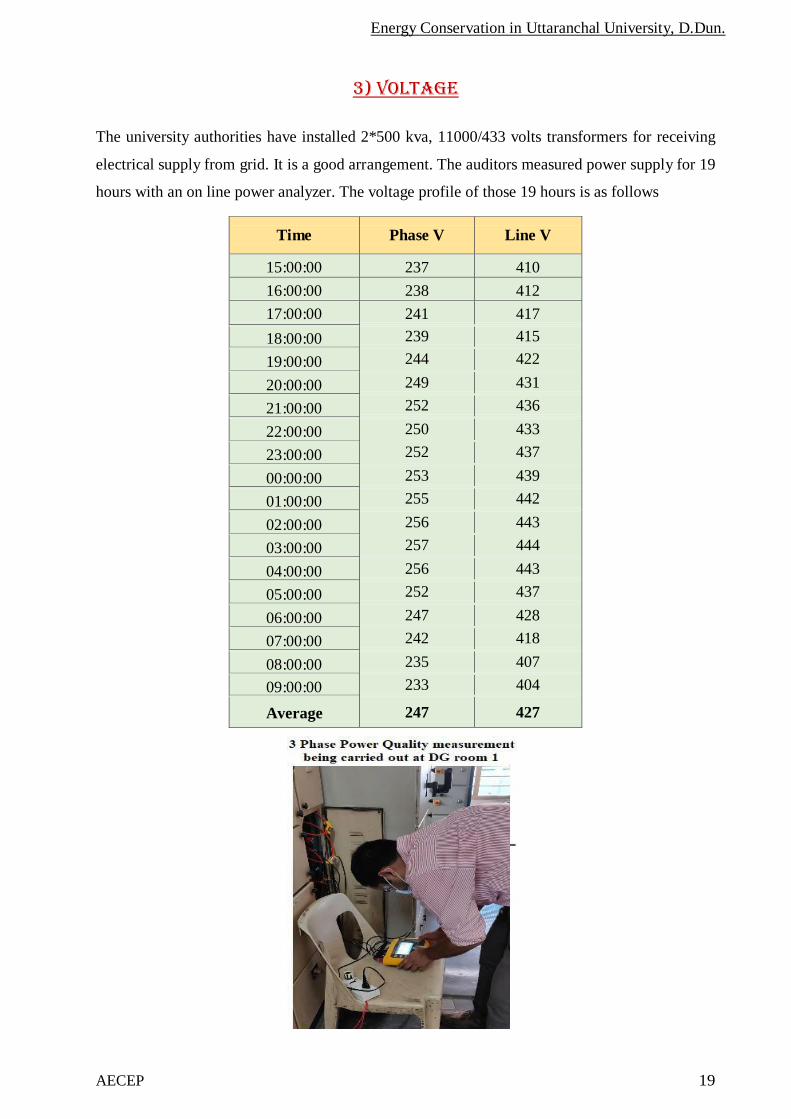
3) Voltage
The university authorities have installed 2*500 kva, 11000/433 volts transformers for receiving
electrical supply from grid. It is a good arrangement. The auditors measured power supply for 19
hours with an on line power analyzer. The voltage profile of those 19 hours is as follows
Time
Phase V
Line V
15:00:00 237 410
16:00:00 238 412
17:00:00 241 417
18:00:00 239 415
19:00:00 244 422
20:00:00 249 431
21:00:00 252 436
22:00:00 250 433
23:00:00 252 437
00:00:00 253 439
01:00:00 255 442
02:00:00 256 443
03:00:00 257 444
04:00:00 256 443
05:00:00 252 437
06:00:00 247 428
07:00:00 242 418
08:00:00 235 407
09:00:00 233 404
Average 247 427
Energy Conservation in Uttaranchal University, D.Dun.
20 AECEP
Here, we can see that the voltage remains high all the time. It ranged from 233 to 257 volts, with
average of 247 volts. Electrical equipment is rated for 230 volts in the range of 220-240 volts.
Higher voltage results in high Energy consumption & has detrimental effect on equipment.
Its effect is discussed as follows:
1. Effect of voltage on lighting- At present about 3300 fluorescent tubes are installed. Normal
fluorescent tubes are designed for 230 volts. Best efficiency of conventional fluorescent
tubes is obtained at about 215 volts .It is brought out that higher voltage besides causing
premature damage to luminaries, also unnecessarily increases power consumption as
illustrated by following table-
Sr. no Lamp 90% voltage 110% voltage
1 Fluorescent Tube light
Light output -9% +8%
Power input -15% +18%
Thus net effect of 110% voltage is 10% excess consumption in fluorescent tubes & about 5% in
other tubes.
2. Effect on fans: The increase in voltage increases fan power consumption as well as noise
level. University authorities have already installed electronic regulators on all fans. But if
this regulator is used at maximum point, then both energy consumption & noise level
increases. So as far as possible about 220 volts should be supplied.
3. Other equipment: For best efficiency, voltage should be 220-230 volts .
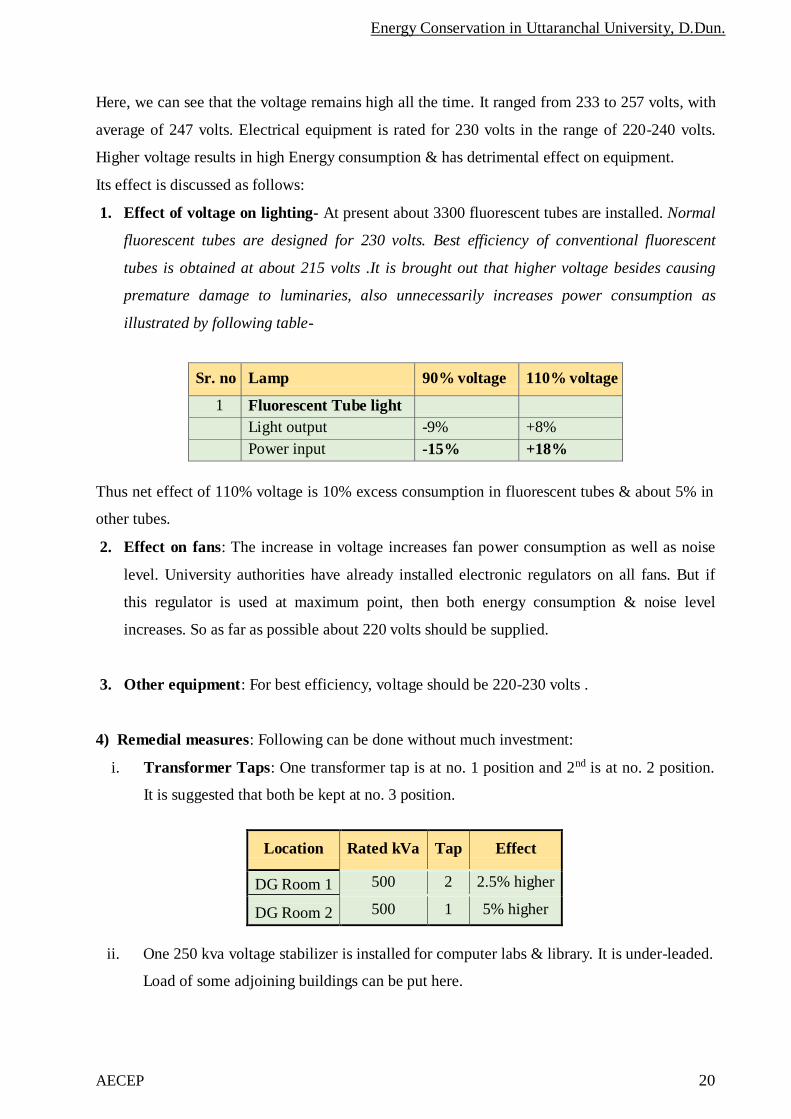
4) Remedial measures: Following can be done without much investment:
i. Transformer Taps: One transformer tap is at no. 1 position and 2nd is at no. 2 position.
It is suggested that both be kept at no. 3 position.
Location
Rated kVa
Tap
Effect
DG Room 1 500 2 2.5% higher
DG Room 2 500 1 5% higher
ii. One 250 kva voltage stabilizer is installed for computer labs & library. It is under-leaded.
Load of some adjoining buildings can be put here.

Energy Conservation in Uttaranchal University, D.Dun.
21 AECEP
iii. One stabilizer installed for the auditorium remains idle for most times as auditorium is
used rarely. A changeover switch can be fitted and it can feed stable voltage to the other
buildings and hostels. By this, detrimental effect of high voltage and unnecessary high
energy consumption of various equipment can be avoided.
Approximate saving & investment are as follows:
Narration Units Values
Present annual Energy Consumption KWH 1549594
Assume modest 1% Saving by reducing voltage KWH 15496
Amount savable @ Rs5.94/KWH Rs 92046
4). Power Factor
Presently, automatic Power Factor Controller (APFC) Panel has been installed on transformer 1
only. The auditors checked the Annual Power Factor coming out to average 0.91 and lowest
being 0.87 for 2 months. Following reasons were found responsible:
1) The relay was faulty. It may be got repaired or replaced so that proper nos of capacitors
remain ON. It is an 8 step relay; this time 12 step relay should be installed.
2) The capacitors installed are of bigger size. It is suggested that 5-6 smaller capacitors of
capacities 1-5 KVAR be installed so they can cater to the smaller adjustments needed for
proper Reactive Power supply.
3) Capacitor panel is not installed on Transformer 2. It was informed that it is already
planned. This work can be done on priority. The capacity is calculated in the following
table.
Energy Conservation in Uttaranchal University, D.Dun.
22 AECEP
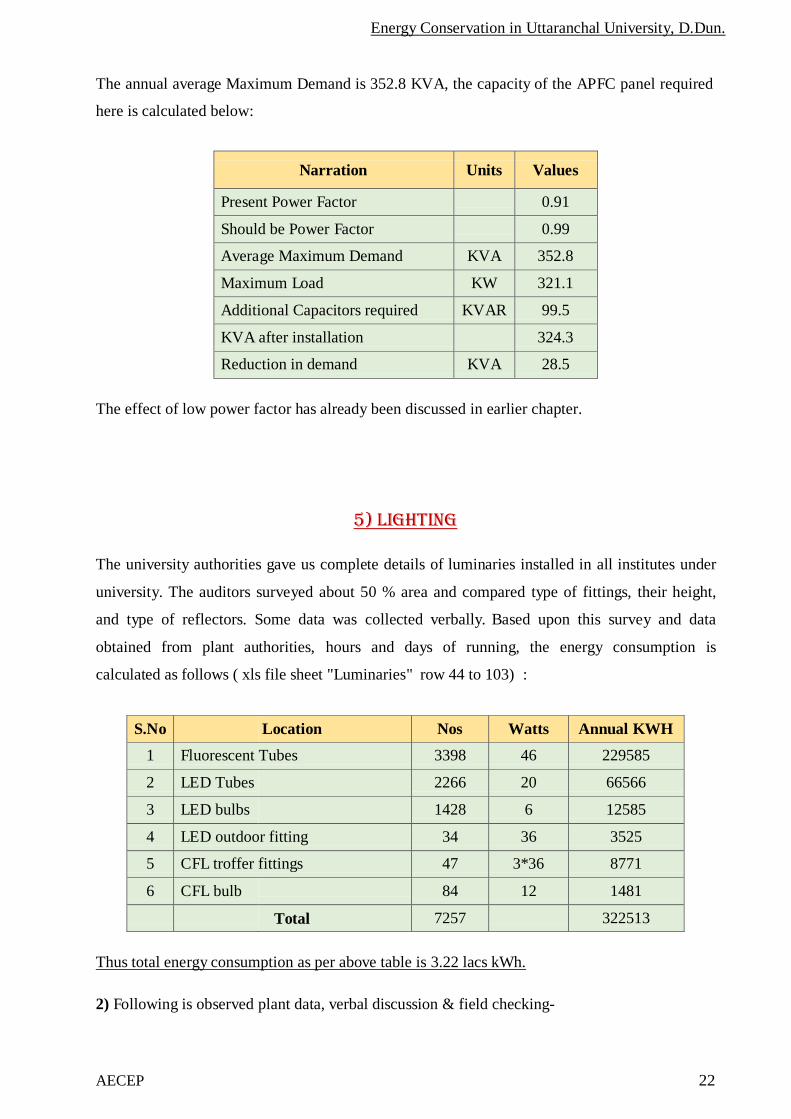
The annual average Maximum Demand is 352.8 KVA, the capacity of the APFC panel required
here is calculated below:
Narration
Units
Values
Present Power Factor 0.91
Should be Power Factor 0.99
Average Maximum Demand KVA 352.8
Maximum Load KW 321.1
Additional Capacitors required KVAR 99.5
KVA after installation 324.3
Reduction in demand KVA 28.5
The effect of low power factor has already been discussed in earlier chapter.
5) Lighting
The university authorities gave us complete details of luminaries installed in all institutes under
university. The auditors surveyed about 50 % area and compared type of fittings, their height,
and type of reflectors. Some data was collected verbally. Based upon this survey and data
obtained from plant authorities, hours and days of running, the energy consumption is
calculated as follows ( xls file sheet "Luminaries" row 44 to 103) :
S.No Location Nos Watts Annual KWH
1 Fluorescent Tubes 3398 46 229585
2 LED Tubes 2266 20 66566
3 LED bulbs 1428 6 12585
4 LED outdoor fitting 34 36 3525
5 CFL troffer fittings 47 3*36 8771
6 CFL bulb 84 12 1481
Total 7257 322513
Thus total energy consumption as per above table is 3.22 lacs kWh.
2) Following is observed plant data, verbal discussion & field checking-
Energy Conservation in Uttaranchal University, D.Dun.
23 AECEP
Silvered glass
Stainless steel
- 0.5 to 0.85
- 0.55 to 0.60
Chromium plate - 0.55 to 0.60
Vitreous enamel - 0.60 to 0.70
Plastic Polymer in mirror optic finishing -0 .80 to 0.85
Aluminum Sheet: High purity aluminium
sheet, anodized
-0.85
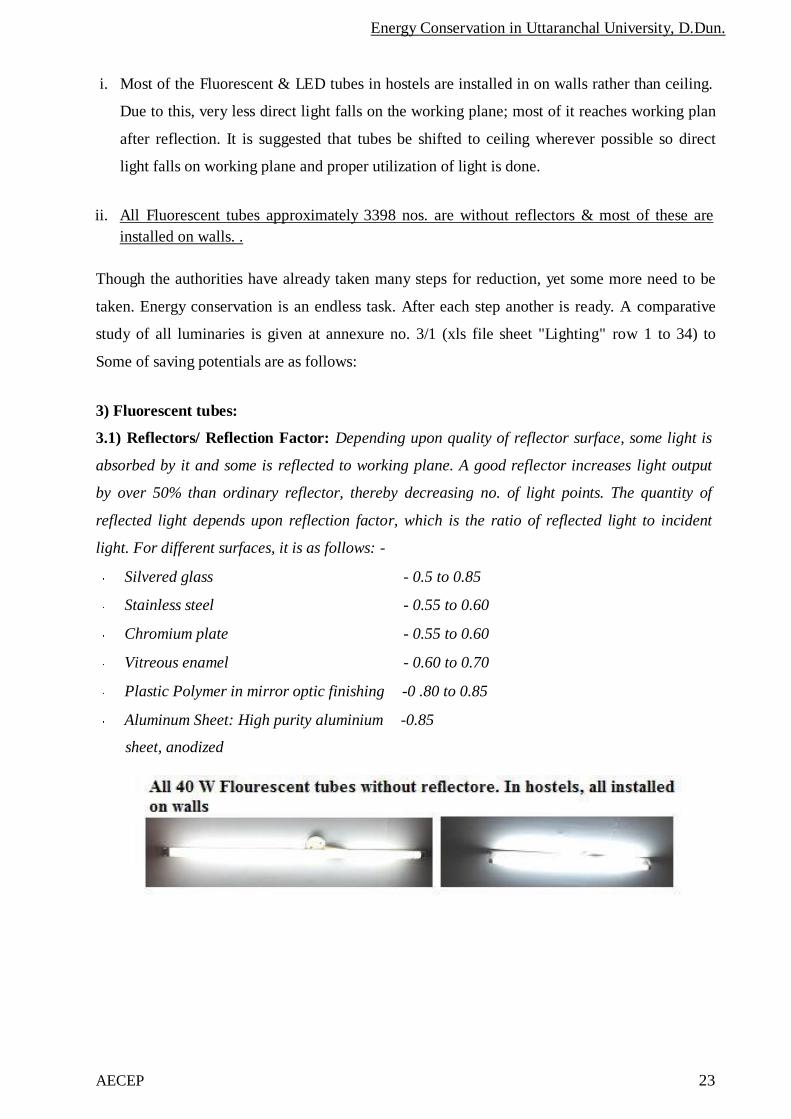
i. Most of the Fluorescent & LED tubes in hostels are installed in on walls rather than ceiling.
Due to this, very less direct light falls on the working plane; most of it reaches working plan
after reflection. It is suggested that tubes be shifted to ceiling wherever possible so direct
light falls on working plane and proper utilization of light is done.
ii. All Fluorescent tubes approximately 3398 nos. are without reflectors & most of these are
installed on walls. .
Though the authorities have already taken many steps for reduction, yet some more need to be
taken. Energy conservation is an endless task. After each step another is ready. A comparative
study of all luminaries is given at annexure no. 3/1 (xls file sheet "Lighting" row 1 to 34) to
Some of saving potentials are as follows:
3) Fluorescent tubes:
3.1) Reflectors/ Reflection Factor: Depending upon quality of reflector surface, some light is
absorbed by it and some is reflected to working plane. A good reflector increases light output
by over 50% than ordinary reflector, thereby decreasing no. of light points. The quantity of
reflected light depends upon reflection factor, which is the ratio of reflected light to incident
light. For different surfaces, it is as follows: -

Energy Conservation in Uttaranchal University, D.Dun.
24 AECEP
In the picture given above, most of the light is directed at the opposite wall, the ceiling, the wall
below and ground which are called non-working planes. Very less light is directed at the
intended table that is the working plane. The light received on the working plane comprises of
direct light as well as reflected light reflected from ceiling and wall. This effect is well explained
and backed with a calculation further in this chapter.

Energy Conservation in Uttaranchal University, D.Dun.
25 AECEP
Effect of installation on walls: It has been discussed above. Light does not fall on working
plane. It is illustrated with following images:

Energy Conservation in Uttaranchal University, D.Dun.
26 AECEP
By this method lux level will increase & wattage of tube can be decreased. It may also become
possible to de-lamp some fluorescent tubes.
4) Replacement of fluorescent tubes with LED lamps: A comparative table of fluorescent
tubes installed on walls with LED lamp installed at proper angle with a reflector is is shown
below. The actual calculations are available in Excel sheet in tab Lighting.
Particulars 40 W
Fluorescent
28 W -T5 20W
LED
w/o reflectors Silver optic
reflectors
20 W
Total Watts with choke 44 32 24
Lumen/ watt 55 90 75
Total light 100% 100% 100%
Direct light 33% 33% 100%
Reflected light 67% 67% 0%
Average reflection factor 40% 80% 100%
Average light transmitted through reflection -% 27% 54% 0%
So total light received on working plane 60% 87% 100%
Actual lumen received / Watts 33 78 75
Possibility of energy saving by installing LED
Expected wattage of LED including system 11 25 24
Saving % 76%

Energy Conservation in Uttaranchal University, D.Dun.
27 AECEP
Considering the actual Lumens/Watt received, only 11W LED light will be sufficient in
comparison to 40W Fluorescent tubes. Next size available in the market is 12W that can be
installed. The University authorities are aware of the saving potential of LED tubes. They are
already installing the LED tubes in a phased manner. Still there are around 3400 Nos fluorescent
tubes existing over the university campus that can be retrofitted with these reflectors. To keep
issue alive, we suggest replacement of 500 fluorescent tubes with 12 Watt lamps. The saving &
investment is as follows:
Narration Values
Wattage for 1 Fluorescent tube + Ballast 44
Wattage for 1 LED bulb + Ballast 15
Saving / fluorescent tubes - Watts 29
Saving for 500 tubes in 5 hours 9 months 24 days - kwh 15660
Money savable -Rs@ Rs 5.94/KWH 93020
Investment @ Rs120 per bulb 60000
Payback period- Months 8
4) 3*36 Watts CFL Troffer lights: 47 such lights are installed in central library & some
more are installed at different locations. These have following defects:
i. CFL lamps being compact version of fluorescent tubes are less efficient than latter.
ii. With passage of time, conventional reflectors installed on these have become dull. So
light reflection is less.
iii. The cover on these has also become dirty.
Energy Conservation in Uttaranchal University, D.Dun.
28 AECEP
It is suggested that these be replaced on priority. Approximate saving potential & investment is
as follows:
Narration Values
Wattage for 1 luminary + Ballast (3*36+ 3*6) 126
Wattage for LED bulb + Ballast 40
Saving / flo - Watts 86
Saving for 25such troffer lights 8 hours 9 months 24 days - kwh 3715
Money savable -Rs@ Rs 5.94/KWH 22068
Investment @ Rs 800 per LED 20000
Payback period- Months 11
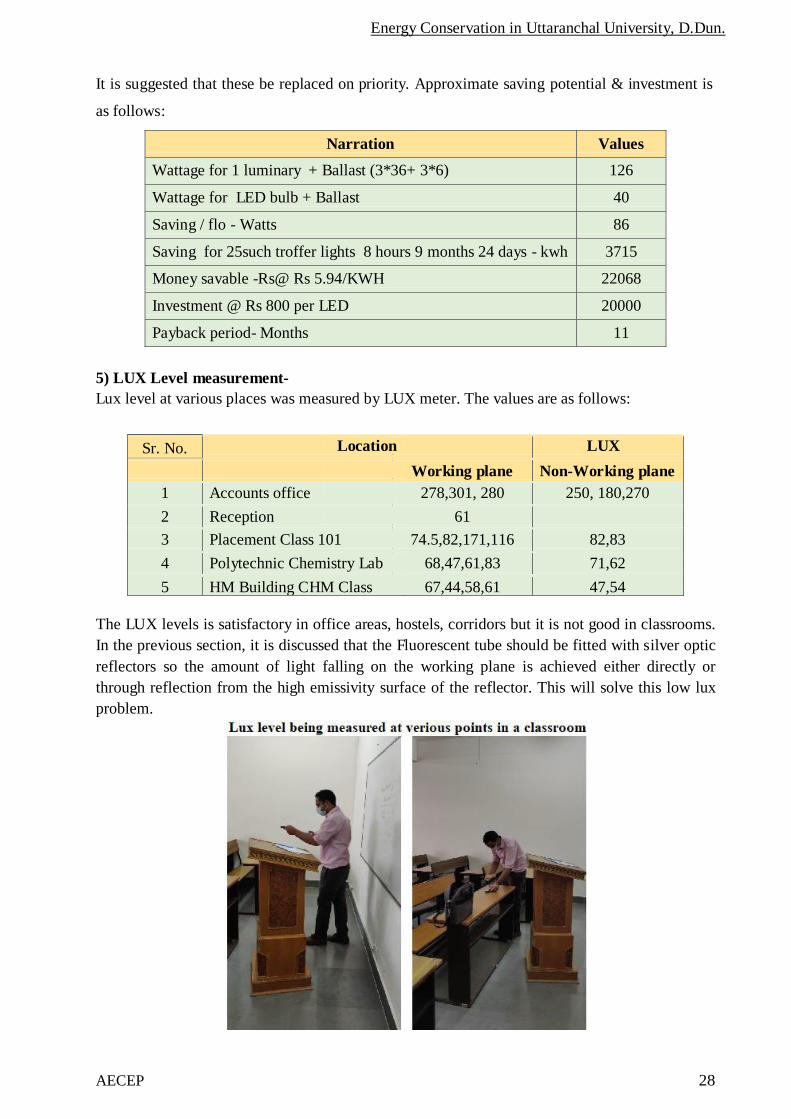
5) LUX Level measurement-
Lux level at various places was measured by LUX meter. The values are as follows:
Sr. No. Location LUX
Working plane Non-Working plane
1 Accounts office 278,301, 280 250, 180,270
2 Reception 61
3 Placement Class 101 74.5,82,171,116 82,83
4 Polytechnic Chemistry Lab 68,47,61,83 71,62
5 HM Building CHM Class 67,44,58,61 47,54
The LUX levels is satisfactory in office areas, hostels, corridors but it is not good in classrooms.
In the previous section, it is discussed that the Fluorescent tube should be fitted with silver optic
reflectors so the amount of light falling on the working plane is achieved either directly or
through reflection from the high emissivity surface of the reflector. This will solve this low lux
problem.
Energy Conservation in Uttaranchal University, D.Dun.
29 AECEP
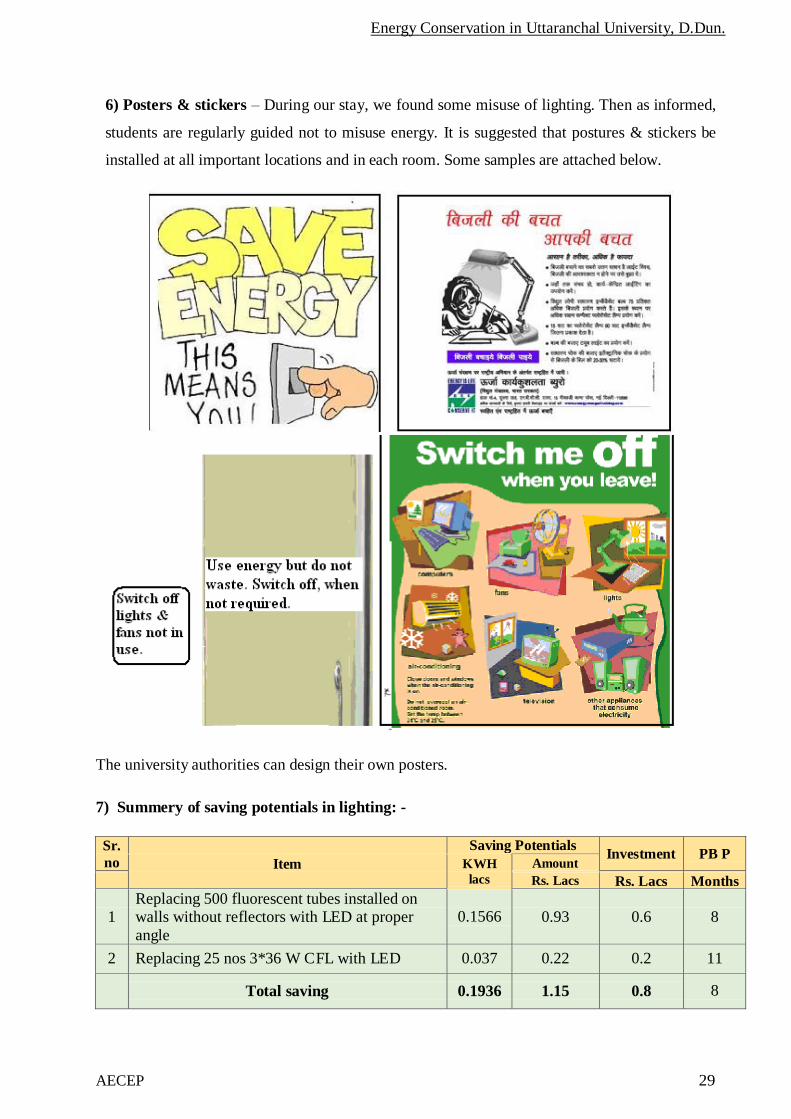
6) Posters & stickers – During our stay, we found some misuse of lighting. Then as informed,
students are regularly guided not to misuse energy. It is suggested that postures & stickers be
installed at all important locations and in each room. Some samples are attached below.
The university authorities can design their own posters.
7) Summery of saving potentials in lighting: -
Sr.
no Saving Potentials
Investment
PB P Item KWH
lacs Amount
Rs. Lacs Rs. Lacs Months
1 Replacing 500 fluorescent tubes installed on walls without reflectors with LED at proper
angle
0.1566
0.93
0.6
8
2 Replacing 25 nos 3*36 W CFL with LED 0.037 0.22 0.2 11
Total saving
0.1936
1.15
0.8
8
Energy Conservation in Uttaranchal University, D.Dun.
30 AECEP
6) Ceiling Fans
1) Existing fans- In this university about 3539 fans are installed. All fans are of 3 blades and
1200 mm sweep. These are installed in all air conditioned as well as non- air conditioned rooms.
It is a good practice. In an air conditioned space, a fan breeze make 26 0C room feel like 22.5 0C.
Thus by lowering the thermostat, air conditioned load can be saved. In hostels, these fans
operate for about 12 to 13 hours in hostels and about 7 to 8 hours in class rooms and in offices
about 6 to 7 hours. Based upon this, the average annual energy consumption is as follows (xls
file sheet "Fans" row 26 to 33):
2) Energy consumption – The consumption of new fans is 68 Watts/ fan & of old fans is about
72 W/fan.. On this basis, the auditors calculated power consumption fans. The calculation can be
found at (xls file sheet "Fans" row 29 to 68). The same is reproduced as follows:
S.No
Location
Fans
Hrs/day
Months
kWH
1 Main building 159 8 7 14531
2 Library 276 8 6 21621
3 Pharmacy 252 8 6 19741
4 T & P building 84 8 6 6580
5 Workshop building 73 8 6 5719
6 Mechanical building 76 8 6 5954
7 UIBS /HM building 84 8 6 6580
8 Civil building 256 8 6 20054
9 Diploma building 143 8 6 11202
10 UIM building 201 8 6 15746
11 Agricultural building 296 8 6 23187
12 Law building 334 8 6 26164
13 Project Office 6 8 6 470
14 Estate Office 5 8 6 392
15 cafeteria 5 8 6 392
16 Security Office 5 8 6 392
17 DG Room 5 8 6 392
18 food Court 59 8 6 4622
19 Guest House 21 10 6 2056
20 Messes 195 6 6 11457
21 AlI Hostel Boys & Girls 1004 12 6 117974
Total
3539
315224
Thus average 3.15 Lacs kWh which is 21% of total energy consumption is consumed.
Energy Conservation in Uttaranchal University, D.Dun.
31 AECEP
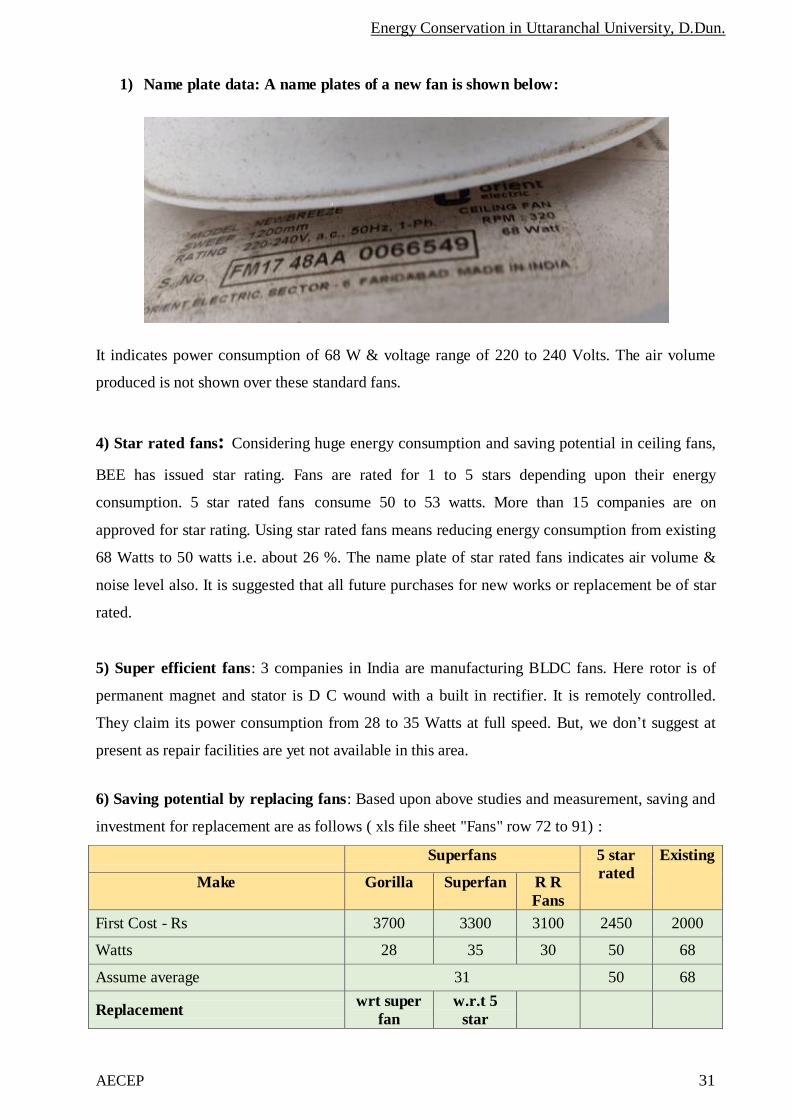
1) Name plate data: A name plates of a new fan is shown below:
It indicates power consumption of 68 W & voltage range of 220 to 240 Volts. The air volume
produced is not shown over these standard fans.
4) Star rated fans: Considering huge energy consumption and saving potential in ceiling fans,
BEE has issued star rating. Fans are rated for 1 to 5 stars depending upon their energy
consumption. 5 star rated fans consume 50 to 53 watts. More than 15 companies are on
approved for star rating. Using star rated fans means reducing energy consumption from existing
68 Watts to 50 watts i.e. about 26 %. The name plate of star rated fans indicates air volume &
noise level also. It is suggested that all future purchases for new works or replacement be of star
rated.
5) Super efficient fans: 3 companies in India are manufacturing BLDC fans. Here rotor is of
permanent magnet and stator is D C wound with a built in rectifier. It is remotely controlled.
They claim its power consumption from 28 to 35 Watts at full speed. But, we don’t suggest at
present as repair facilities are yet not available in this area.
6) Saving potential by replacing fans: Based upon above studies and measurement, saving and
investment for replacement are as follows ( xls file sheet "Fans" row 72 to 91) :
Superfans 5 star rated
Existing
Make Gorilla Superfan R R
Fans
First Cost - Rs 3700 3300 3100 2450 2000
Watts 28 35 30 50 68
Assume average 31 50 68
Replacement wrt super
fan
w.r.t 5
star
Energy Conservation in Uttaranchal University, D.Dun.
32 AECEP
Power savable by replacing - W 37 18
Power savable by replacing - % 54% 26%
For 20% Fans- No of fans 708 708
Energy consumption of 20% fans - kWh
73068
73068
Energy saving potential - kWh 39758 19342
Amount savable @Rs5.94/KWH 236160 114889
Average cost/ fan after considering Rs 1000 as resale value
2000
1500
Total investment - Rs 1416000 1062000
Payback Period - months 72 111
Purchase of new fans
Price difference 1000 750
Total investment - Rs 708000 531000
Payback period - months 36 55
It is seen from above calculations that saving potential by replacing with super fans is 54% and
with 5 star rated fan is 26%. But due to running for only 5 to 7 months in a year, it is not techno-
economically viable to replace. Purchase for new installation is viable. Besides energy saving, at
the time of purchase, special fans with 4 blades and low speed can be purchased to reduce noise
level. This is necessary in educational institutes for reducing noise level.
7) Miscellaneous
Fan regulators – Electronic regulators are installed in all places. We measured noise level due to
running of 6 to 7 fans in class rooms when voltage was around 245. We feel that at this noise
level, it must be difficult for teacher to speak properly. Voltage effect has been discussed in
chapter 2. If it is resolved, the noise level will drop down, energy consumption will reduce and
life span of fans will also be maintained.
Summary of saving potential
Nil as replacement is not justified. However, all new purchases should be of star rated.
Energy Conservation in Uttaranchal University, D.Dun.
33 AECEP
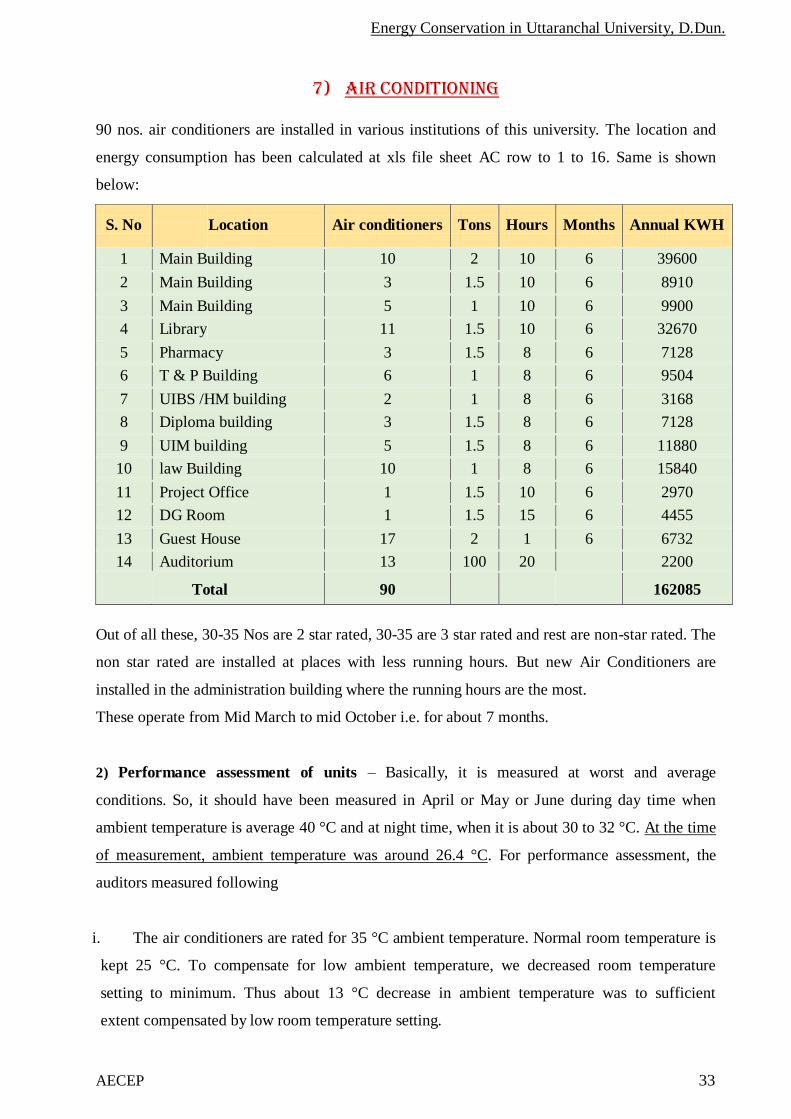
7) Air Conditioning
90 nos. air conditioners are installed in various institutions of this university. The location and
energy consumption has been calculated at xls file sheet AC row to 1 to 16. Same is shown
below:
S. No
Location
Air conditioners
Tons
Hours
Months
Annual KWH
1 Main Building 10 2 10 6 39600
2 Main Building 3 1.5 10 6 8910
3 Main Building 5 1 10 6 9900
4 Library 11 1.5 10 6 32670
5 Pharmacy 3 1.5 8 6 7128
6 T & P Building 6 1 8 6 9504
7 UIBS /HM building 2 1 8 6 3168
8 Diploma building 3 1.5 8 6 7128
9 UIM building 5 1.5 8 6 11880
10 law Building 10 1 8 6 15840
11 Project Office 1 1.5 10 6 2970
12 DG Room 1 1.5 15 6 4455
13 Guest House 17 2 1 6 6732
14 Auditorium 13 100 20 2200
Total
90
162085
Out of all these, 30-35 Nos are 2 star rated, 30-35 are 3 star rated and rest are non-star rated. The
non star rated are installed at places with less running hours. But new Air Conditioners are
installed in the administration building where the running hours are the most.
These operate from Mid March to mid October i.e. for about 7 months.
2) Performance assessment of units – Basically, it is measured at worst and average
conditions. So, it should have been measured in April or May or June during day time when
ambient temperature is average 40 °C and at night time, when it is about 30 to 32 °C. At the time
of measurement, ambient temperature was around 26.4 °C. For performance assessment, the
auditors measured following
i. The air conditioners are rated for 35 °C ambient temperature. Normal room temperature is
kept 25 °C. To compensate for low ambient temperature, we decreased room temperature
setting to minimum. Thus about 13 °C decrease in ambient temperature was to sufficient
extent compensated by low room temperature setting.

Energy Conservation in Uttaranchal University, D.Dun.
34 AECEP
Split AC Condenser side
Air velocity m/s - Inlet air Average
1.1 0.6 1.1 0.93
0.5 0.5 0.4 0.47
0.9 0.7 0.6 0.73
Average m/s 0.71
Duct Dimensions Area m² 0.44
(0.58*0.21)+(0.64*0.5) Volume m³/Hr 1131
Air velocity m/s -Outlet air Average
1.5 0.4 2 1.3
2.7 1.6 1.6 1.97
Average m/s 1.63
Duct Dimensions Area m² 0.23
Diameter = 54 cm Volume m³/Hr 1346
ii. Area and air inlet & their velocities, ambient and room temperatures – both dry and wet
bulb was measured. The same is shown at xls file sheet AC flow annexure no. 5.1. Due to less
area and intermixing of air from other nearby units, reliable readings cannot be obtained in
field. For this, a duct has to be provided on both in let as well as out let. However for
comparison and approximate calculations, this is the only field method and is followed.
Air flow: Air flow of 1 Air conditioner measurements is shown below:
Location Central Library
AC Rated 2 TR
The summary of all these measurement and calculations is as follows:
Location - >>> Library
Tons 2
Ambient air temp – Dry 26.4
Ambient air temp – Wet 21.3
Dry bulb temperature at inlet 26.9
Wet bulb temperature at inlet 22.5
Enthalpy of inlet air - K J / kg 66.31
Dry bulb temperature at outlet 45.7
Wet bulb temperature at out let 26.5
Enthalpy of outlet air - K J / kg 81.77
Heat shed at evaporator - KJ/kg 15.46
outlet duct area -Square m 0.23
Energy Conservation in Uttaranchal University, D.Dun.
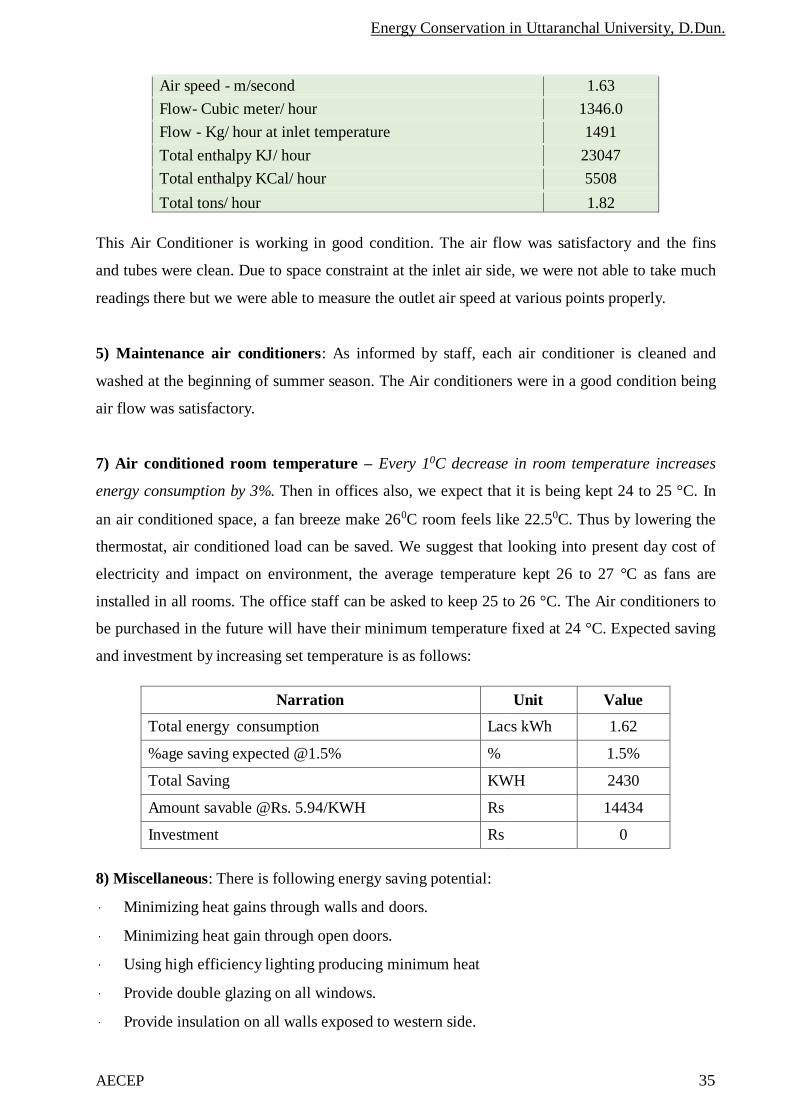
35 AECEP
Air speed - m/second 1.63
Flow- Cubic meter/ hour 1346.0
Flow - Kg/ hour at inlet temperature 1491
Total enthalpy KJ/ hour 23047
Total enthalpy KCal/ hour 5508
Total tons/ hour 1.82
This Air Conditioner is working in good condition. The air flow was satisfactory and the fins
and tubes were clean. Due to space constraint at the inlet air side, we were not able to take much
readings there but we were able to measure the outlet air speed at various points properly.
5) Maintenance air conditioners: As informed by staff, each air conditioner is cleaned and
washed at the beginning of summer season. The Air conditioners were in a good condition being
air flow was satisfactory.
7) Air conditioned room temperature – Every 10C decrease in room temperature increases
energy consumption by 3%. Then in offices also, we expect that it is being kept 24 to 25 °C. In
an air conditioned space, a fan breeze make 260C room feels like 22.50C. Thus by lowering the
thermostat, air conditioned load can be saved. We suggest that looking into present day cost of
electricity and impact on environment, the average temperature kept 26 to 27 °C as fans are
installed in all rooms. The office staff can be asked to keep 25 to 26 °C. The Air conditioners to
be purchased in the future will have their minimum temperature fixed at 24 °C. Expected saving
and investment by increasing set temperature is as follows:
Narration Unit Value
Total energy consumption Lacs kWh 1.62
%age saving expected @1.5% % 1.5%
Total Saving KWH 2430
Amount savable @Rs. 5.94/KWH Rs 14434
Investment Rs 0
8) Miscellaneous: There is following energy saving potential:
Minimizing heat gains through walls and doors.
Minimizing heat gain through open doors.
Using high efficiency lighting producing minimum heat
Provide double glazing on all windows.
Provide insulation on all walls exposed to western side.
Energy Conservation in Uttaranchal University, D.Dun.
36 AECEP
Heat gain coefficient through different glass surfaces is as below: -
S.
No
Product
Solar Heat Gain
Coefficient
(SHGC)
Thermal
Conductivity
Daylight
Transmittance
1 Clear Glass 0.72 3.16 79
2 Body Tinted Glass 0.45 3.24 65
3 Clear double layer glass with about 12 mm air film
0. 3
3.0
65
4 Hard Coated Solar Control Glass 0.26 3.27 24
5 Soft Coated Solar Control Glass 0.18 3.08 15
6 Low Emissivity Glass 0.56 2.33 61
7 Solar Control + Low Emissivity Glass
0.23
1.77
41
Summary of saving : Due to proper maintenance, less running & policy of university to make
all new purchases of star rated air conditioners, only techno economical potential are increasing
set temperature by 1 OC. It would save about 2430 kwh costing Rs 14430/- without any
investment
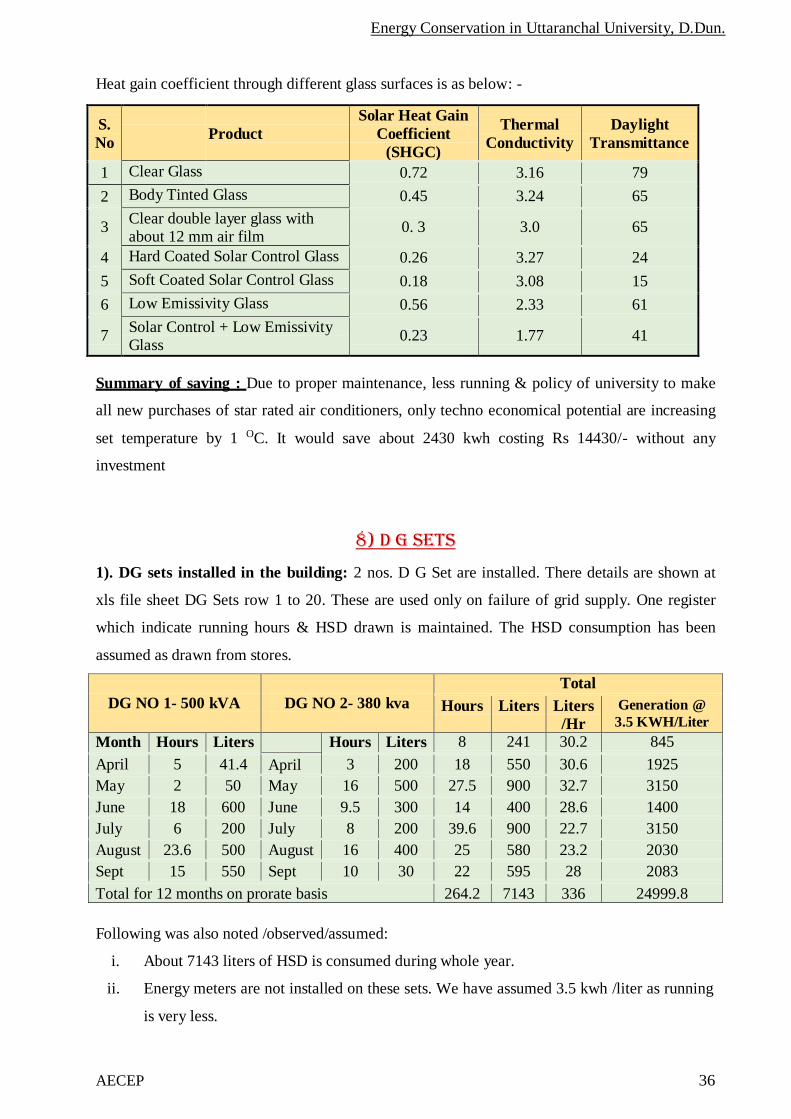
8) D G Sets
1). DG sets installed in the building: 2 nos. D G Set are installed. There details are shown at
xls file sheet DG Sets row 1 to 20. These are used only on failure of grid supply. One register
which indicate running hours & HSD drawn is maintained. The HSD consumption has been
assumed as drawn from stores.
DG NO 1- 500 kVA
DG NO 2- 380 kva
Total
Hours Liters Liters /Hr
Generation @
3.5 KWH/Liter
Month Hours Liters Hours Liters 8 241 30.2 845
April 5 41.4 April 3 200 18 550 30.6 1925
May 2 50 May 16 500 27.5 900 32.7 3150
June 18 600 June 9.5 300 14 400 28.6 1400
July 6 200 July 8 200 39.6 900 22.7 3150
August 23.6 500 August 16 400 25 580 23.2 2030
Sept 15 550 Sept 10 30 22 595 28 2083
Total for 12 months on prorate basis 264.2 7143 336 24999.8
Following was also noted /observed/assumed:
i. About 7143 liters of HSD is consumed during whole year.
ii. Energy meters are not installed on these sets. We have assumed 3.5 kwh /liter as running
is very less.
Energy Conservation in Uttaranchal University, D.Dun.
37 AECEP
iii. Any one of the sets is capable of taking whole electrical load of university.
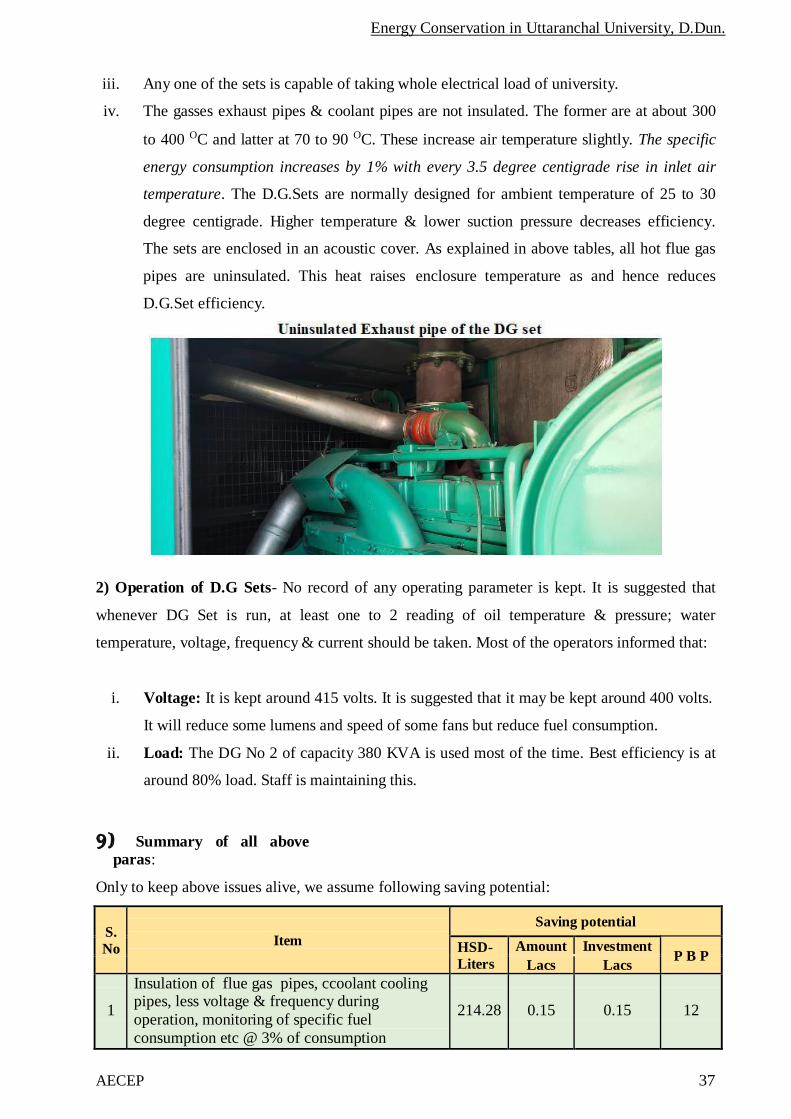
iv. The gasses exhaust pipes & coolant pipes are not insulated. The former are at about 300
to 400 OC and latter at 70 to 90 OC. These increase air temperature slightly. The specific
energy consumption increases by 1% with every 3.5 degree centigrade rise in inlet air
temperature. The D.G.Sets are normally designed for ambient temperature of 25 to 30
degree centigrade. Higher temperature & lower suction pressure decreases efficiency.
The sets are enclosed in an acoustic cover. As explained in above tables, all hot flue gas
pipes are uninsulated. This heat raises enclosure temperature as and hence reduces
D.G.Set efficiency.
2) Operation of D.G Sets- No record of any operating parameter is kept. It is suggested that
whenever DG Set is run, at least one to 2 reading of oil temperature & pressure; water
temperature, voltage, frequency & current should be taken. Most of the operators informed that:
i. Voltage: It is kept around 415 volts. It is suggested that it may be kept around 400 volts.
It will reduce some lumens and speed of some fans but reduce fuel consumption.
ii. Load: The DG No 2 of capacity 380 KVA is used most of the time. Best efficiency is at
around 80% load. Staff is maintaining this.
9) Summary of all above
paras:
Only to keep above issues alive, we assume following saving potential:
S.
No
Item
Saving potential
HSD-
Liters Amount Investment
P B P Lacs Lacs
1
Insulation of flue gas pipes, ccoolant cooling pipes, less voltage & frequency during
operation, monitoring of specific fuel
consumption etc @ 3% of consumption
214.28
0.15
0.15
12
Energy Conservation in Uttaranchal University, D.Dun.
38 AECEP
9) Miscellaneous
9.1) Kitchens
Various observations were noted in the kitchens:
1. LPG is the main source of heat in the kitchens in canteens and messes for preparing food.
Approximate yearly consumption in University is around 7500 Kg.
2. The auditors enquired the kitchen waste from the mess in-charge which is about 112
Tons/ year. The Solid organic waste is used as manure in the huge green garden areas
and wet waste is sent to the STP plant and further that water is used for watering the
plants.
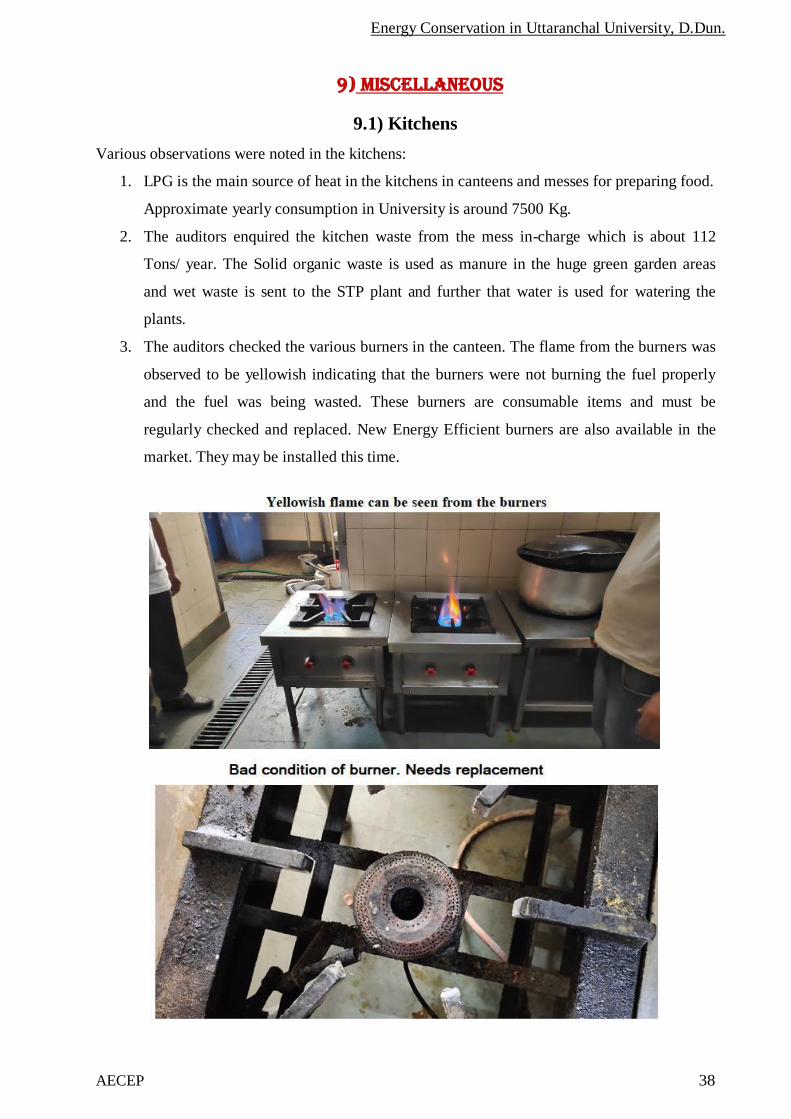
3. The auditors checked the various burners in the canteen. The flame from the burners was
observed to be yellowish indicating that the burners were not burning the fuel properly
and the fuel was being wasted. These burners are consumable items and must be
regularly checked and replaced. New Energy Efficient burners are also available in the
market. They may be installed this time.
Energy Conservation in Uttaranchal University, D.Dun.
39 AECEP
By proper maintenance & timely replacement of burners, we expect about 5% saving in LPG
gas. It will come to about 370 kg costing about Rs 0.15 Lacs with an expenditure of about Rs
0.05 lacs
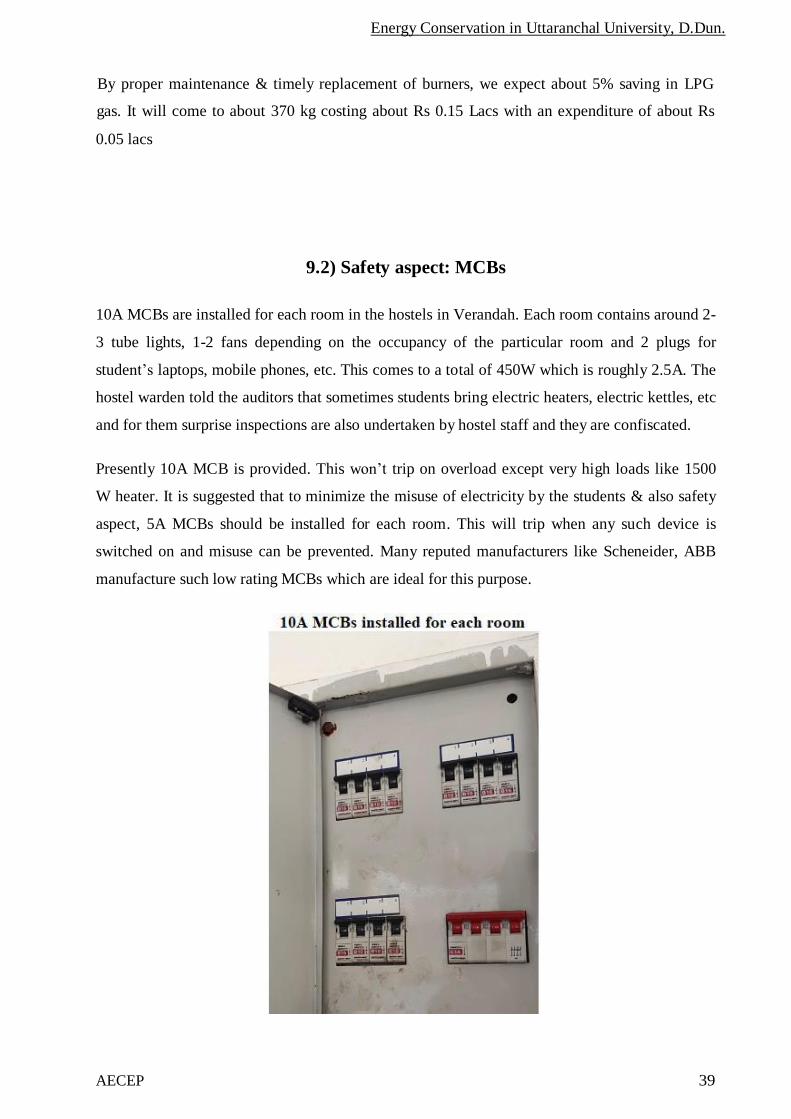
9.2) Safety aspect: MCBs
10A MCBs are installed for each room in the hostels in Verandah. Each room contains around 2-
3 tube lights, 1-2 fans depending on the occupancy of the particular room and 2 plugs for
student’s laptops, mobile phones, etc. This comes to a total of 450W which is roughly 2.5A. The
hostel warden told the auditors that sometimes students bring electric heaters, electric kettles, etc
and for them surprise inspections are also undertaken by hostel staff and they are confiscated.
Presently 10A MCB is provided. This won’t trip on overload except very high loads like 1500
W heater. It is suggested that to minimize the misuse of electricity by the students & also safety
aspect, 5A MCBs should be installed for each room. This will trip when any such device is
switched on and misuse can be prevented. Many reputed manufacturers like Scheneider, ABB
manufacture such low rating MCBs which are ideal for this purpose.
Energy Conservation in Uttaranchal University, D.Dun.
40 AECEP
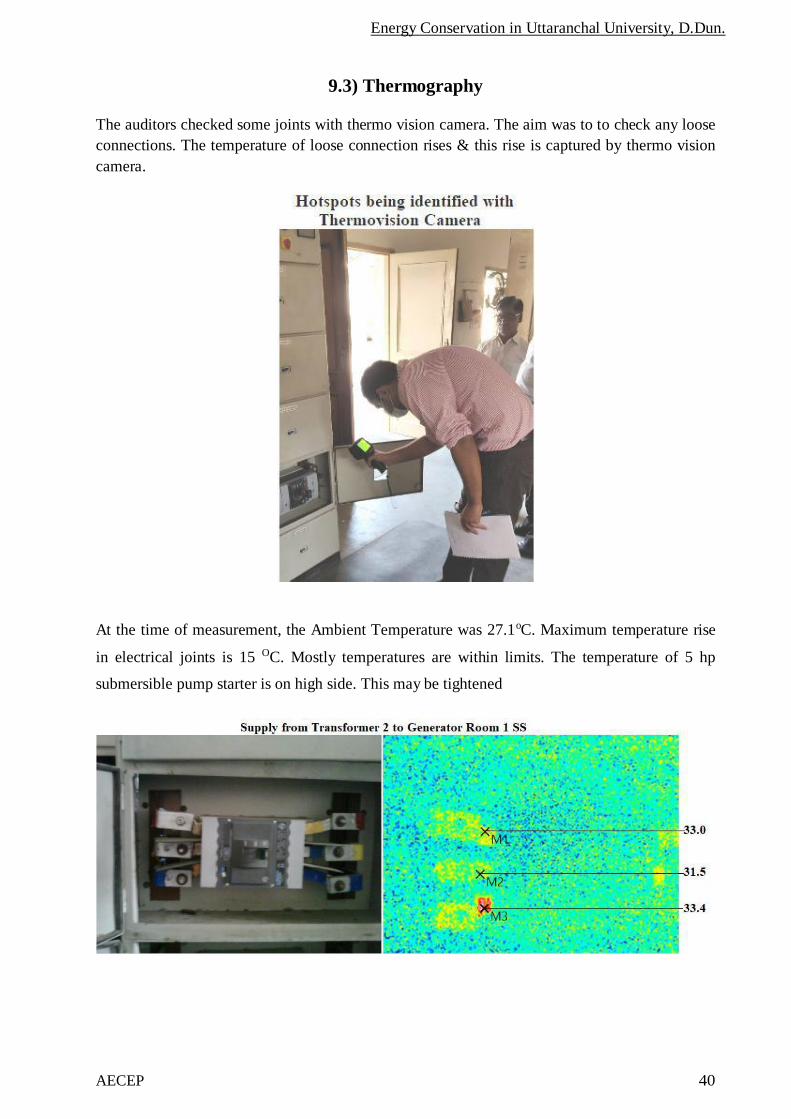
9.3) Thermography
The auditors checked some joints with thermo vision camera. The aim was to to check any loose
connections. The temperature of loose connection rises & this rise is captured by thermo vision
camera.
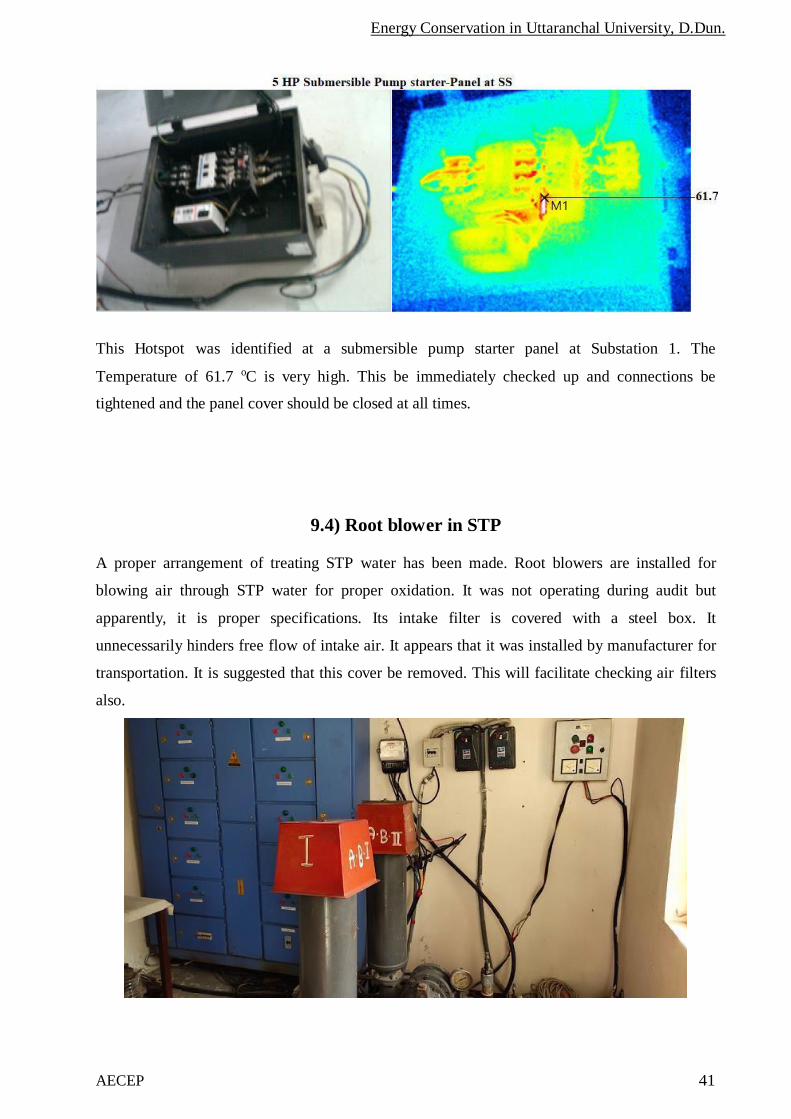
At the time of measurement, the Ambient Temperature was 27.1oC. Maximum temperature rise
in electrical joints is 15 OC. Mostly temperatures are within limits. The temperature of 5 hp
submersible pump starter is on high side. This may be tightened
Energy Conservation in Uttaranchal University, D.Dun.
41 AECEP
This Hotspot was identified at a submersible pump starter panel at Substation 1. The
Temperature of 61.7 oC is very high. This be immediately checked up and connections be
tightened and the panel cover should be closed at all times.
9.4) Root blower in STP A proper arrangement of treating STP water has been made. Root blowers are installed for
blowing air through STP water for proper oxidation. It was not operating during audit but
apparently, it is proper specifications. Its intake filter is covered with a steel box. It
unnecessarily hinders free flow of intake air. It appears that it was installed by manufacturer for
transportation. It is suggested that this cover be removed. This will facilitate checking air filters
also.
Energy Conservation in Uttaranchal University, D.Dun.
42 AECEP
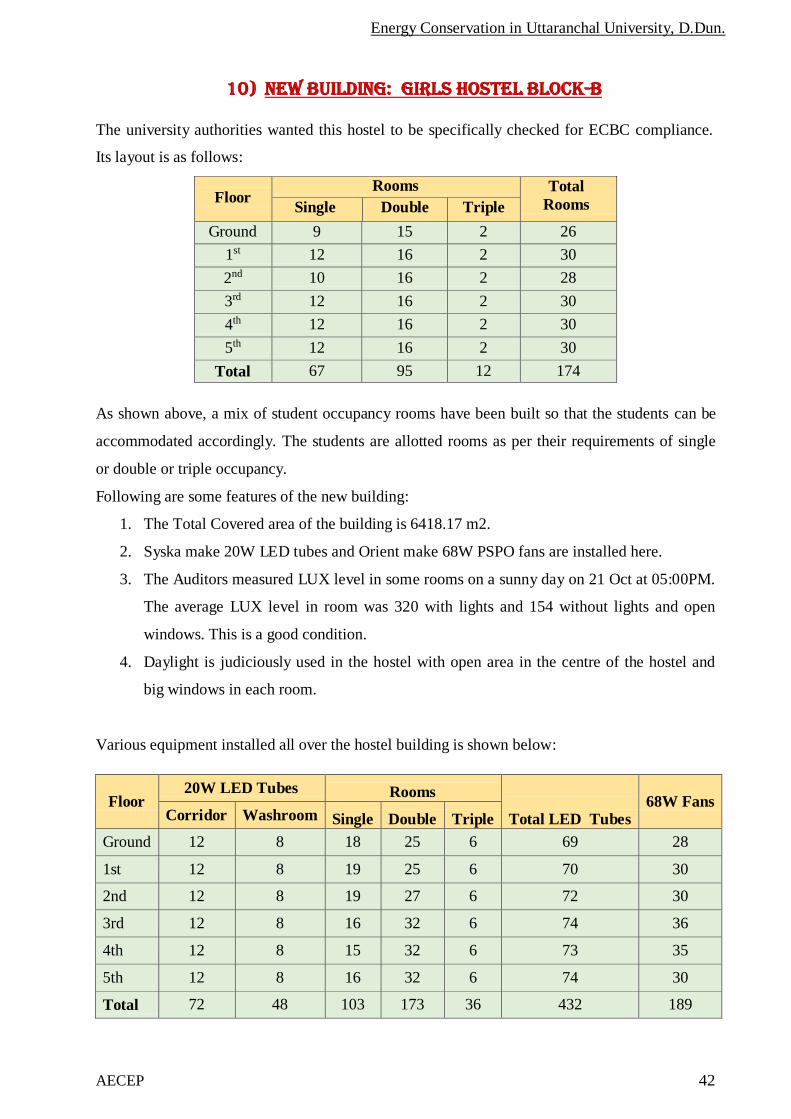
10) New building: Girls hostel Block-B
The university authorities wanted this hostel to be specifically checked for ECBC compliance.
Its layout is as follows:
Floor Rooms Total
Rooms Single Double Triple
Ground 9 15 2 26
1st 12 16 2 30
2nd 10 16 2 28
3rd 12 16 2 30
4th 12 16 2 30
5th 12 16 2 30
Total 67 95 12 174
As shown above, a mix of student occupancy rooms have been built so that the students can be
accommodated accordingly. The students are allotted rooms as per their requirements of single
or double or triple occupancy.
Following are some features of the new building:
1. The Total Covered area of the building is 6418.17 m2.
2. Syska make 20W LED tubes and Orient make 68W PSPO fans are installed here.
3. The Auditors measured LUX level in some rooms on a sunny day on 21 Oct at 05:00PM.
The average LUX level in room was 320 with lights and 154 without lights and open
windows. This is a good condition.
4. Daylight is judiciously used in the hostel with open area in the centre of the hostel and
big windows in each room.
Various equipment installed all over the hostel building is shown below:
Floor
20W LED Tubes
Rooms
Total LED Tubes
68W Fans
Corridor Washroom
Single
Double
Triple
Ground 12 8 18 25 6 69 28
1st 12 8 19 25 6 70 30
2nd 12 8 19 27 6 72 30
3rd 12 8 16 32 6 74 36
4th 12 8 15 32 6 73 35
5th 12 8 16 32 6 74 30
Total 72 48 103 173 36 432 189
Energy Conservation in Uttaranchal University, D.Dun.
43 AECEP
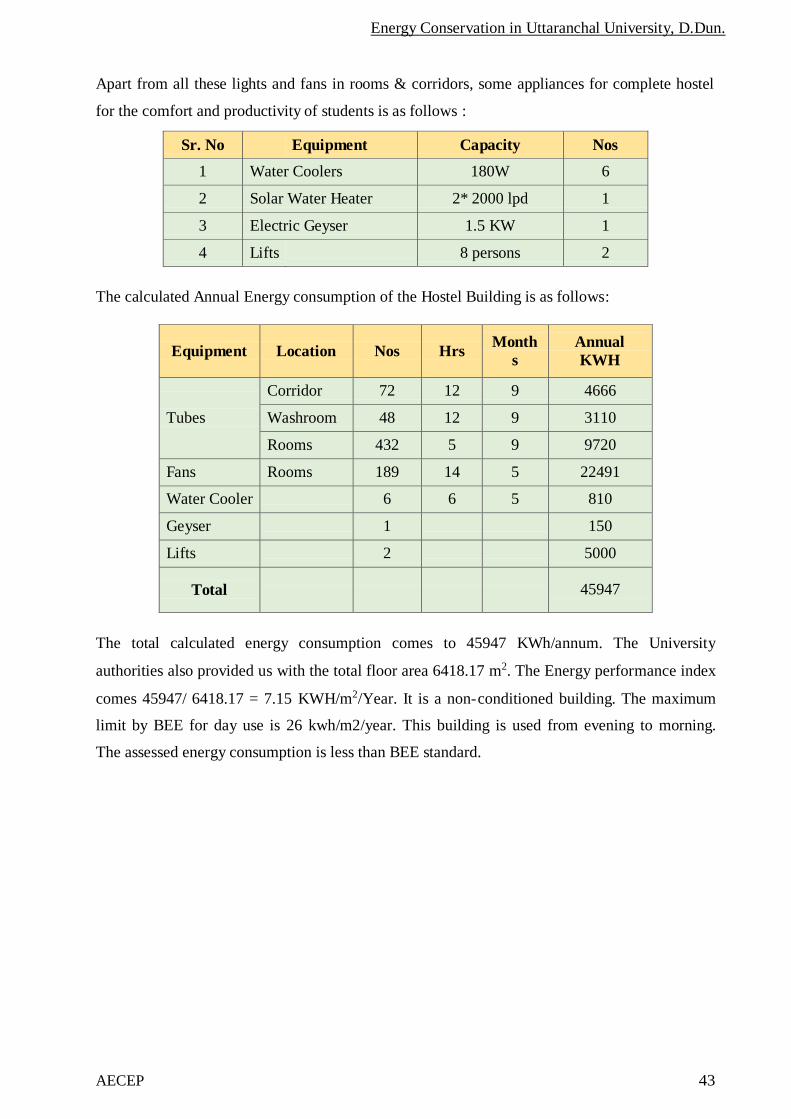
Apart from all these lights and fans in rooms & corridors, some appliances for complete hostel
for the comfort and productivity of students is as follows :
Sr. No Equipment Capacity Nos
1 Water Coolers 180W 6
2 Solar Water Heater 2* 2000 lpd 1
3 Electric Geyser 1.5 KW 1
4 Lifts 8 persons 2
The calculated Annual Energy consumption of the Hostel Building is as follows:
Equipment
Location
Nos
Hrs
Month
s
Annual
KWH
Tubes
Corridor 72 12 9 4666
Washroom 48 12 9 3110
Rooms 432 5 9 9720
Fans Rooms 189 14 5 22491
Water Cooler 6 6 5 810
Geyser 1 150
Lifts 2 5000
Total
45947
The total calculated energy consumption comes to 45947 KWh/annum. The University
authorities also provided us with the total floor area 6418.17 m2. The Energy performance index
comes 45947/ 6418.17 = 7.15 KWH/m2/Year. It is a non-conditioned building. The maximum
limit by BEE for day use is 26 kwh/m2/year. This building is used from evening to morning.
The assessed energy consumption is less than BEE standard.
Energy Conservation in Uttaranchal University, D.Dun.
44 AECEP
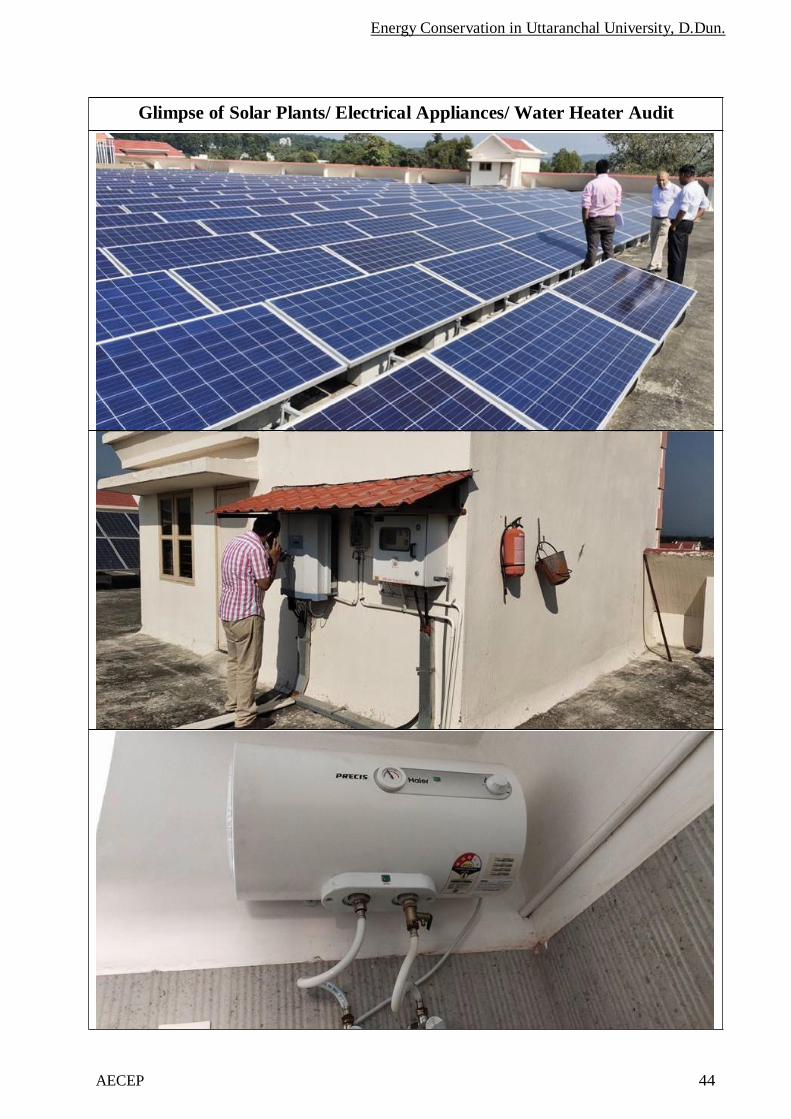
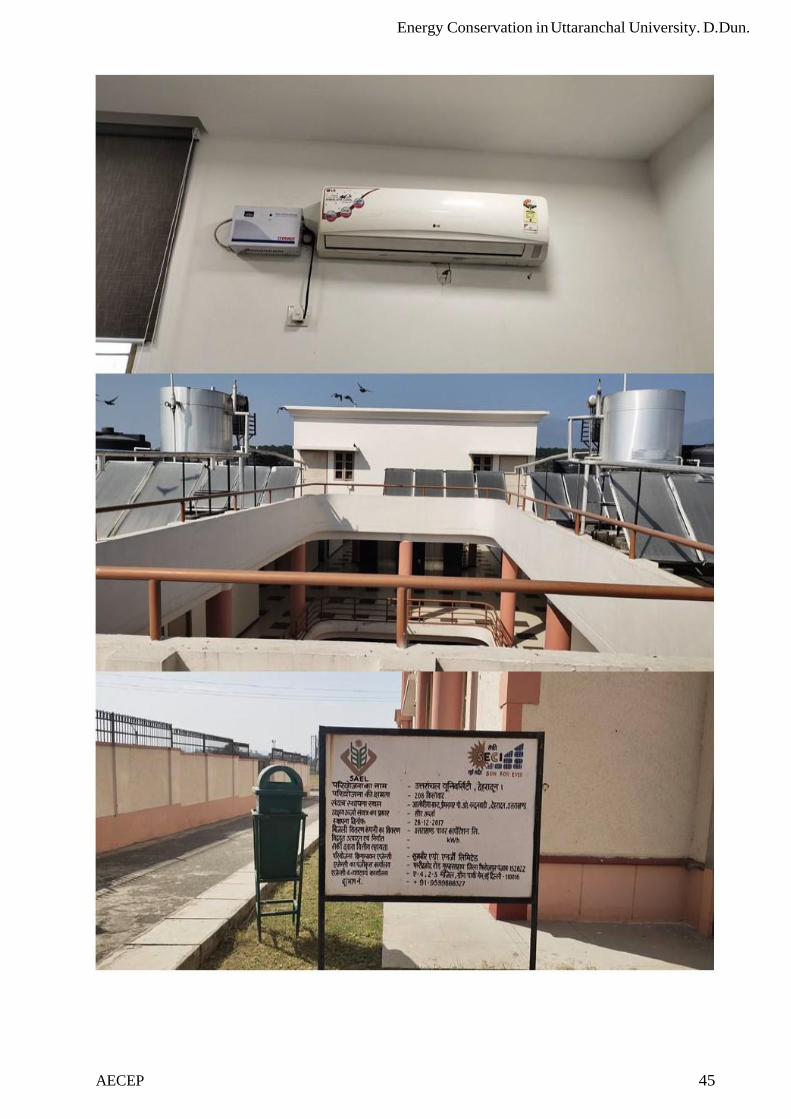
Glimpse of Solar Plants/ Electrical Appliances/ Water Heater Audit
45 AECEP
Energy Conservation in Uttaranchal University. D.Dun.
46 AECEP
Energy Conservation in Uttaranchal University. D.Dun.
Study Conducted out by
Association of Energy Conservation & Environment Protection, (AECEP)
32-B, Bhagirathi Puram, GMS Road, Dehradun-248001
Contact: 9456583967, E-mail: [email protected]
www.aecep.org


![UU PAPER-1 UU Roll No. AA UU...1-AA ] [ 3 ] [ P.T.O. UU UU UU UU UU UU UU UU UU UU UU UU UU 003. The trajectory of a projectile in a vertical plane is y x x=a b-2 where a band are](https://img.dokumen.tips/doc/110x75/5f67099c83705d66d477d4c0/uu-paper-1-uu-roll-no-aa-uu-1-aa-3-pto-uu-uu-uu-uu-uu-uu-uu-uu-uu.jpg)

![UU PAPER-1 UU Roll No. AA UU · 2019-04-21 · 1-AA ] [ 4 ] [ Contd... UU UU UU UU UU UU UU UU UU UU UU UU UU 007. A particle moves in a straight line with its retardation proportional](https://img.dokumen.tips/doc/110x75/5f24e5c35870927e327b65d0/uu-paper-1-uu-roll-no-aa-uu-2019-04-21-1-aa-4-contd-uu-uu-uu-uu-uu.jpg)


![UU PAPER-2 PCB Roll No. BA · 2-BA ] [ 3 ] [ P.T.O. UU UU UU UU UU UU UU UU UU UU UU UU UU 002. Two children Ramesh (on path ARB) and Sohan (on path ASB), travel down slides of identical](https://img.dokumen.tips/doc/110x75/5e1483c6a3dd674c594e381f/uu-paper-2-pcb-roll-no-ba-2-ba-3-pto-uu-uu-uu-uu-uu-uu-uu-uu-uu-uu-uu.jpg)