Embed Size (px)
Citation preview

Study No. 123 Publication No. 170
“Agricultural Policy in Uttar Pradesh and Uttaranchal- A Policy Matrix”
Prof. J. N. Mishra
2004
Agro- Economic Research Centre University of Allahabad
Allahabad 211002

PREFACE
Agriculture is the backbone for the economic development of Uttar
Pradesh, the most populous state of the country. More than 80 per cent
population of the state is directly or indirectly dependent upon agriculture
for its livelihood. The economy of the state is agrarian. The state contributes
37% wheat and 14% rice to the total production in the country. The share of
sugarcane and potato in the total production of the country has been
estimated at 35% and 38% respectively. The fruits and vegetables accounted
for 8% and 20% of the production of the country respectively.
Since the independence, state as well as central governments had
launched the Five Year Plans from 1951-52 to develop the agriculture sector
alongwith other sectors. Nineth Five Year Plan has already been completed
and Tenth Five Year Plan is on to achieve 8% annual growth rate in food
grains. Since the advent of Green Revolution, the production and
productivity, particularly of paddy and wheat, have received significant
jump at the cost of other crops viz. millets, pulses and oilseeds. The
mechanization in agriculture is also in full swing. The flow of credit from
financial institutions has also been increasing and expanding to the
agricultural and allied sectors since nationalization of commercial banks. A
number of programmes and schemes were launched to boost the production
of crops. The result was, undoubtedly, very encouraging. From time to time
different programme and schemes were also launched for the development
of horticulture, livestock, fisheries etc. The poverty alleviation programme
was also started simultaneously in the state.
On over all, the production and productivity of agricultural and
horticultural crops have significantly increased during the plan periods. Now
the state is not only producing foodgrains to feed its 16 crore people but it is
also in a position to export foodgrains to foreign countries. It is an irony of
fate that the maximum benefits of new strategies of green revolution,
modern packaging practices and allocated funds in five year plans were
concentrated on farms of only resourceful farmers.
There is acute uneven distribution of economic benefits accruing to
different size of farmers from the programmes and schemes. The marginal

and small farmers were not so benefited as compared to large farmers.
Instead of these, area and production of millets, pulses and oilseeds have
received great set-back on account of paddy and wheat. In view of this, the
state enjoys surplus status in paddy and wheat while there is actuate shortage
of pulses and oilseeds. This could happen because of the wrong agricultural
policy. On account of this, there was massive change in copping pattern in
favour of paddy and wheat. The bumper production of paddy and wheat has
also posed a serious problem of proper storing. The major share of available
resources is being used in these crops. Therefore, there was imbalance in
cropping pattern. It reflects that our polices and programmes were much
favourable to the development of paddy and wheat while other crops were
neglected. This was due to lack of vision on the part of the planners. There
was no clear cut agricultural policy in the state. Only sporadic programmes
and schemes of agricultural development were carried out during different
plan periods.
The irrigation facilities have been developed in the state even through
only 69.82% net area sown is irrigated. Of the net area sown only 50% area
has assured irrigation. Uttar Pradesh has abundant ground water and surface
water, but they are not being properly used. Over-use of water is a common
phenomenon in the crops. Since the introduction of green revolution, the
application of fertilizers has been increasing in unscientific manner just to
get higher and higher yields in subsequent years. Over-use and unbalanced
composition of N2, P205 and K20 of fertilizers is causing degration of land
and polluting the air and water. On the contrary, the use of biological
manure is not popular due to the weak extension net work.
As regards to horticultural crops the production and productivity have
increased manifold but marketing facilities were net created at par with the
production. More than 20% of the total production of horticultural crops gets
spoiled and wasted annually after post harvesting. The schemes and
programmes were totally concentrated to production rather than its proper
marketing. Value Added Products are not getting popular due to lack of
processing facilities.
As far as live stock is concerned, the production of milk per milch
cattle is still extremely low in the state in comparison to that in Punjab and
Hyarana States. The production of eggs, wool and other animal products is
also not upto the mark. The annual growth of animal husbandry was 4.5%
during IX plan period while it is targeted to achieve 8% during X plan

period. Thus, intensive efforts are needed to control diseases, improve breed,
develop feed and fodder farms and proper management in rearing the live
stock. The existing resources are also needed for optimum utilization to get
sustainable growth. More than 9 lakh breedable cows and 8 lakh breedable
buffaloes are suffering with problem of infertility which is a matter of
serious concern. The poultry husbandry is not upto the mark in the state.
There is huge gap between demand and supply of eggs and layers to fulfil
the demand of consumers. Hence, the state needs the establishment of
poultry farms in the private sector.
So far as the Fisheries Development Programme in the state is
concerned, the inland fish farming is in practice. The average fish production
of inland fish farms is quite low. Non availability of credit, poor
infrastructural facilities, poor extension services and weak marketing
network are the major constraints in fisheries development in the state. Since
the introduction of FFDA, tangible achievement is in progress. Marketing
network in relation to commodities, vegetables, fruits, flowers, milk, egg,
meat, wool and fish is not so outstanding. Malpractices still persist in the
markets. The storage capacity warehouses and coldstorages is quite
insufficient against the huge production. The marketing functionaries are
also inefficient to safeguard the interest of producers and consumers. The
role of MSP is also ineffective to protect the interest of producers.
The cropping pattern and cropping sequence are not being adopted in
a scientific manner. The farmers have very short vision in the allocation of
area to different crops. On account of this, the area under sugarcane and
potato has been increasing very fast since recent past decades. This has
created imbalance in the cropping pattern. The absence of proper agricultural
policy, undeveloped extension services and marketing infrastructural
facilities etc. are major factors for the backwardness of the state. Thus the
diversification in agriculture should get top priority.
The liberalization of economy and WTO could be only fruitful when
export potential of agriculture and allied sectors increases. The export of
agricultural produces is meagre because its share is only one per cent of the
global market. The position of the state is very deplorable. At present the
country faces much competition in global markets, therefore, the produce
must be at par with the global standard. There is need to develop high class
infrastructural facilities in accordance with the norm of global standard. In
so far as the formulation of agricultural policy is concerned, the state Govt.

has framed agricultural policy at the end of 1990s in the context of domestic
requirement. During the Five Year Plans and pre and post green revolution
period, a number of programmes and schemes were launched to boost the
agricultural production. The state has achieved grand success. The state
Govt. has made very comprehensive policies to improve the crops
production, horticultural crop production, live stock and fisheries production
in the Tenth Five Year Plan documents in the wake of liberalization and
WTO.
Thus the formulation of agricultural policy is very essential to meet
the challenges of domestic and foreign markets. The agricultural policy
should be framed through an integrated approach and by giving equal
importance to all the sectors of agriculture. Since investment in agricultural
sector has been decreasing from year to year, therefore, private investment
such as in research, extension network, marketing infrastructural facilities,
establishment of processing units, construction of godowns, coldstorage etc.
should be encouraged if we aim at promotion of export. For the formulation
of agricultural policy based on ground realities, the Director of Economics
and Statistics, Ministry of Agriculture, Govt. of India has entrusted to Agro-
Economic Research Centres to prepare a separate agricultural policy for the
respective states in the context of WTO. It is to be based on the published
data, plan documents, views and opinions of administrators, knowledge
people, academics, farm leaders and stake holders. Our report is based on the
facts and figures related to the two States of Uttar Pradesh and Uttaranchal,
the jurisdictional area of AER Centre, Allahabad.
The study has been conducted under supervision of Prof. J.N. Mishra,
Hon. Coordinator of the Centre. Dr. B.B. Tripathi, an eminent economist and
Vice Principal, Allahabad Degree College, Allahabad has drafted the report.
Sri D.K. Singh, Research Officer of the Centre has also assisted him in the
drafting of report and in the process of analysis and interpretation of data.
Sri R.A.G. Mahuley, Sri K.K. Rajput and Sri Hasib Ahmad have done hard
task and efforts in collecting secondary data from different published
sources and converting then into analytical tables. In process of collection of
data, opinion and views from different directorates, departments and
institutions, the research staff hare received full support and cooperation. I
am very grateful to the Directors of Agriculture, Horticulture, Livestock and
Fisheries and their supporting staff. Since most of literature and references
were made available by the staff of State Planning Institute, for which they
deserve our thanks.

I am also thankful to Prof. Samar K. Datta, IIM Ahamedabad and
Prof. R.S. Deshpande, Head, ADRT Unit, Bangalore for providing
guidelines for drafting of the report.
The comments and suggestions for improvement of the study are most
welcome and will be thankfully acknowledged.
22th, February 2004 (S. A. Ansari)
Prof. & Hony. Director
Agro-Economic Research Centre
University of Allahabad
Allahabad

PROJECT TEAM
Dr. J. N. Mishra Project Incharge
Dr. B. B. Tripathi
Dr. J. N. Mishra
Shri. D. K. Singh
Drafting of the Report
Sri. R. A. G. Mahuly
Sri. K. K. Rajput
Sri. Hasib Ahmad
Sri. R. S. Maurya
Secondary Data,
Processing & Tabulation
Smt. N. Nigam
&
Computer Typing
Shri. Ovesh Ahmad
Shri M. S. Ansari
&
Secretarial Services
Smt. M. R. Kesarvani
Shri H. C. Upadhyay Xeroxing of the Report
Shri. Raju Kumar
& Other Services
Shri. Amrit Lal

CONTENTS
Page No. Preface I-V
Project Team VI
Contents VII
List of Tables VIII-IX
CHAPTERS
I Agricultural Development Scenario of U.P.
II Developments Pattern of Agriculture in U.P.
III Major Initiatives in Agricultural Development
IV Analysis of Constraints to Agricultural Development
in U. P.
V Agricultural Policy for Uttar Pradesh
VI Agricultural Policy of Uttaranchal
VII Summary & Conclusion
(i) Bibliography
(ii) Publication of Government
(iii) Report
(iv) Publications of AERC, Allahabad
(v) Appendix
(vi) Comments
(vii) Action Taken

Title of Tables
Table No. Title of Tables Page
No.
I-1 Growth Rate of Area Production and Productivity.
I-2 Irrigation Capacity and Utilization in U.P. 2001.
II-1 Land use Pattern in Uttar Pradesh.
II-2 Region- wise Land Utilization during 1992-93.
II-3 Region -wise Land Utilization during 1999-2000.
II-4 Region -wise Area under Different Seasons.
II-5 Trend of Area and Production of Crops in U.P.
II-6 Growth Rate of Area and Production and Productivity.
II-7 Plan wise Growth Rate of Area, Production and Productivity of
Major Crops in Uttar Pradesh.
II-8 Percentage change of Area, Production and Productivity of Major
Crops.
II-9 Region wise Production and Averages Yields of Important Crops
during 1990-91 and 1997-98.
II-10 Plan wise Indices of Area of Major Crops in U.P.
II-11 Plan wise Indices of Production of Major Crops in Uttar Pradesh.
II-12 Plan Wise Indices of Productivity of Major Crops in Uttar Pradesh.
II-13A Zone wise Individual yields Achievement Level at Current
Productivity and Possible Gap.
II-13B Region wise Distribution of Districts According Category of
Development.
II-14 Year wise Physical Achievements of Fruits Vegetables and Potato
during Ninth Plan.
II-15 Year and Plan wise Area Production of Fruits, Vegetables and
Potato.
II-16 Level of Farm Machinery over time in U.P.
II-17 Plan Expenditure on agriculture in India and U.P.
II-18 Sector-wise Plan Expenditure in Uttar Pradesh (1951-52 to 2000-
01).
II-19 Uttar Pradesh at a Glance (Plan wise Expenditure).
II-20 Per Capita Plan Expenditure in Five Year Plans.
II-21 Physical Achievements of Five Year Plan and Yearly Plans.
III-1 Fish Production in U.P.
IV-1 Per Capita Reporting Area and Net Area Sown during 1950-51 to
2000-01 in U.P.
IV-2 Region wise Distribution of Holdings by Size.
IV-3 Status of Cropping Pattern in Various Economic Regions of U.P.
IV-4 Percentage of Net Area Sown to Operational Area and Cropping
Intensity.
IV-5 Details of Livestock in U.P.
IV-6 Population of Live Stock (Region wise).

IV-7 Availability of Veterinary Hospital Facilities.
IV-8 Population, Production and per Capita per Kg Per Year Availability
of Cereals, Pulses and Oilseeds in U.P.
IV-9 Regions Wise Per Capita Availability of Food Grains and Pulses.
IV-10 Different Sources of Irrigated Area and its Percentage.
IV-11 Percentage of Net Irrigated and Gross Cropped Area (Region wise).
IV-12 Region- wise and Source-wise of Percentage of Net irrigated Area.
to Net Area Sown.
IV-13 Per Hectare Distribution of Fertilizer.
VI-1 Land Utilization in Uttaranchal.
VI-2 Area, Production and Productivity of Major Crops in Uttaranchal.
VI-3 District-wise Area, Production and Productivity of Vegetables and
Potato in Uttaranchal.
VI-4 Area, Production of Important Vegetables in Different Districts of
Uttaranchal.
VI-5 Position of District According to Ranks of Area, Production and
Productivity of Vegetables and Potato.
VI-6 Details of Live Stock in Uttaranchal.
VI-7 Production of Milk and Other Produce in Uttaranchal.

CHAPTER-I
Agricultural Development Scenario of U.P.
Introduction
Uttar Pradesh is a culturally and historically rich State of the country.
The State comprises four natural regions i.e. Himalyan region, (now
Uttaranchal). Alluvial plain region, Bundelkhand region and Eastern plain
region. All the four regions have their own characteristics and natural
settings. Land and soil are the main natural resources of the state.
Agriculture, therefore, occupies the important place in the economy of Uttar
Pradesh. The plain region of Uttar Pradesh incorporating eastern plain region
is among the most fertile plains of the world. Agriculture has been and still
continues to be the main source of livelihood of the people of the State.
Location of State
Agriculture has comparative advantage over other businesses in the
state due to favourable soil and water resources. The total geographical area
of the state is 29.71 million hectares out of which 17.48 million hectares,
around 56 percent of the geographical area of the state, is under crops; while
at the national level only 46.60 per cent of the total reporting area is
cultivated. Similarly 69 per cent of the net cultivated area is irrigated in the
state, while only 40 per cent of the cultivated area is irrigated at the national
level. The gross cropped area in the State is 26.1 million hectares and the
cropping intensity is 149.5 per cent. The average size of holding in the state
is 0.90 hectare. There is preponderance of small and marginal farmers,
comprising 16 per cent and 74 per cent respectively, of total farmers.
However, these groups own only 24 per cent and 31 per cent of the land area
respectively. The total food grain production in the State was 45.2 million
tonnes in 1999-00, which was about 22 per cent of the total food grains
production of the country. The State produces around 26 million tonnes of
wheat which is around 35 per cent of the national wheat production and
highest among all the States. Sugarcane, is the main cash crop of the State
with 46 per cent of total sugarcane production of the country and highest
among all the States. Uttar Pradesh has the second highest production of rice
among all the States and it accounts for around 15 per cent of the national

production of rice. Uttar Pradesh has very strong potentials for fruits
production. The State produced about 8.8 Million tonnes of fruits in 1999-00
which was 18 per cent of the national production of fruits and this
constitutes the highest production of fruits among all the States.
In 1998-99 the production of vegetables in the state was about 17.1
million tonnes, which was 20% of the country’s total production. The State
is also the largest producer of potato in the country with 38% of the
country’s production. The potato production was 9.6 million tonnes during
1999-00. The area covered under floriculture in the State is estimated to be
around 2000 hectares. Some areas of different districts is under the
cultivation of medicinal and aromatic plants. The State has 24% of the
country’s buffaloes and 15% of the cow population. The total milk
production in the State (1999-00) was 14.34 million metric tonnes, the
highest among other states. The egg production was 813.3 million and wool
production has gone up to 2.25 million kgs. The annual fish production in
the State is about 0.18 million tonnes. The Silk production in the State
during 1997-98 was 43 tonnes.
Higher education in agriculture in the state is imparted though three
State Agriculture Universities, two Institutes of Agricultural Sciences and 24
Degree Colleges. Every year 2,900 agriculture graduates and 1400 post-
graduates pass out from these Institutions. The State Government has
already started implementing the Agriculture Policy through two of its
World Bank Supported Projects i.e. U.P. Diversified Agriculture Support
Project and U.P. Sodic Soil Reclamation Programme. Both the projects
focus on the participatory approach to agricultural development. Crop
diversity also has been very high in Uttar Pradesh. Thus Uttar Pradesh is
soil, water and crop rich state.
Objectives of the Study
1. To review the available material (including policy documents and Five
Year Plan Documents of the Union and State Governments, at the State
level dealing with policy interventions after the formation of the State.
2. To identify important constraints and review the efforts made by the
State in the past to meet major challenges pertaining to agriculture and
allied activities.

3. To record the State’s response to the already formulated National
Agricultural Policy, that is, to find out precisely how and where the State
would like to suitably supplement, modify and re-articulate the National
Policy in the local context.
4. To bring out the State’s concerns as well as to record the State’s view on
the changing economic situation due to India’s involvement with the
World Trade Organization (W.T.O).
5. To document the State’s initiatives to meet the problems and constraints
arising out of India’s WTO commitments and review in brief the
effectiveness of government interventions in the form of technology
adoptations, institutional adaptations, price policy changes (e.g., through
changes in tax and subsidy regimes) and legal policy changes undertaken
so far.
6. To discuss with the important stakeholders (as identified above) the
requirements for formulation of a policy document at the State level, in
response to the country’s growing concerns in response to challenges
arising from WTO or otherwise.
7. To elaborate on the initiatives taken to meet the challenge of
diversification, technology, resource management and price policy at the
State level (whether in response to WTO or otherwise).
8. To assemble these views in the form of a meaningful policy requirement
matrix, relating problems/issues as well as to suggest a programme of
action. The study intends to spell out the agencies, which should
undertake such actions.
Research Methodology
The study intends to assess the agricultural resource base of the State
alongwith highlighting the agricultural development scenario since recent
past. The study analyses the measures, schemes, programmes and strategies
launched in the state for agricultural development and their effect in the
various sub sectors of the agricultural economy. Further, the study also
endeavour to assess the weakness and threats for agricultural development
particularly keeping in view the challenges posed by the WTO accord on
agriculture. We have used secondary data from various plan documents of
the state as well as data from reports of the study groups, committees, and
survey reports. These sources have been used to assess development
performance. We have also contacted the stakeholders of agricultural
economy, like agricultural labourers, farmers of the different holding size,
officials of agriculture department, NGOs working actively for agriculture
and rural development, the farm leaders units engaged in processing and
trading units to get primary data and elicit their opinions. We have tried to
collect facts related to strength of agricultural economy, weakness of
agricultural economy, threats to agricultural economy and in the backdrop of
which we have tried to propose a suitable agricultural policy of the State.
Review of Agricultural Development
Agriculture has shaped the outlook and living of the people of the
state. During the colonial rule the agricultural sector suffered a lot due to
exploitative policy of the then government. It has been estimated that
agricultural productivity as well as production of cereals declined during the
last 50 years of the British rule. The faulty land tenure system, institutional
bottleneck, lack of scientific inputs and insufficient supportive services were
the major factors behind the backwardness of agricultural sector in the State.
Soon after the attainment of independence it was realised that a very
high priority should be given to agriculture. United Provinces Zamindari
Abolition Committee, observed that land reform was urgently required for
the development of agriculture of the State. Before the abolition of
Zamindari system there were as many as forty different types of land tenure
systems prevalent in Uttar Pradesh1. Although all agricultural land was
owned and held by Zamindars yet the area under the direct cultivation of
Zamindars was very small (only around 20 per cent of the agricultural land).
The rest about 80 per cent was occupied and cultivated by tenants. Among
the tenants the majority were the hereditary tenants. This was the situation
after the enactment of U.P. Tenancy Act 1939.2 The U.P. Zamindari
Abolition Committee Report observed that the land system prevalent in
Uttar Pradesh had retarded agricultural efficiency and made it impossible to
initiate technological change in agriculture. It was substantiated by experts
and economists also.3
As the land systems determine the social attitude and
1 Baljit Singh & S. Mishra: Study of Land Reforms in U.P., P. –21.
2 Report of the U. P. Zamindari Abolition Committee (1948) Vol. – I, P-336.
3 Report of the U. P. Zamindari Abolition Committee (1948) Vol.-II, P-340.

social satisfaction, the Committee recommended the abolition of all
intermediaries. Thus the committee opined, “land can no longer be allowed
to be treated merely as a source of income, that it is for use and therefore it
should be regarded as a definite and limited means for supplying labour to a
category of citizens whose occupation in life is the tilling of the soil”4.
The U.P. Zamindari Abolition Act came into force in July, 1952. It
was a landmark in the agricultural history of the state. It brought an end to
the ruinous system of Zamindari and gave security of tenure to the
cultivators. Gradually a system of ceiling on land holdings was also
introduced. The imposition of ceiling on agricultural holdings is essentially a
re-distributive measure. Although land-ceiling law was enacted in 1960 but
it could not yield any radical change in land ownership as the unit of
application of the ceiling on land holdings was person. Ceiling law could not
yield much result as plantation of tea, coffee and rubber, orchards, sugarcane
farms, dairy farms, wool raising farms and cooperative farms were
exempted. All these factors defeated the basic ideology of the Ceiling Act.
Similarly in the continuation of institutional reforms consolidation of
scattered and fragmented holdings became operative. Consolidation
programme has been successfully launched and consolidation work has been
completed in the State.
It can be summarized that during the first 25 years since the
attainment of independence the emphasis was laid on institutional changes in
agricultural sector. Accordingly, programmes for abolition of intermediaries,
regulation of rent, ceiling on land holdings and consolidation of holdings
along with some efforts to establish cooperative farms and Bhoodan and
Gramdan movements were initiated. But on the side of agricultural
production the situation could not improve. Production and productivity of
the state remained very low. A delegation from India was sent to China to
study the Chinese agricultural practices. Accepting the recommendation of
the delegation, the Chinese system of cultivation was introduced in Uttar
Pradesh also. It gave a nominal success in wheat production5. The Ford
Foundation Committee in 1957 recommended package programme to
enhance the agricultural production. Government of India launched Intensive
Agricultural District Programme (IADP) in 1960. Along with Pali
4 Baljit Singh: An Approach to State Taxes, Seminar on Mobilization of State Resources,
in proceedings edited by M.D. Joshi, P.-10. 5 Govt. of U.P. Agriculture Development of Statistics 1950-51 - 1971-72, P.-41.

(Rajasthan), Ludhiana (Panjab), Raipur (Chhatishgarh), Thanjavaur (Tamil
Nadu), West Godavari (Andhra Pradesh) and Shahabad (Bihar) districts
which were chosen for different crops, Aligarh district of Uttar Pradesh was
chosen under Intensive Agricultural District Programme for wheat crop. But
the success was limited. Agricultural production increased under the limits
of traditional seeds sown in the district and in neighbouring areas.
A programme for soil conservation was launched in the second five
year plan to check soil degradation as well as to bring degraded land under
crops. Soil Conservation includes riverines, programmes for the betterment
of saline and alkine land. Tree plantation or degraded land and contour
bunding are the important programmes for soil conservation. During the
second five year plan 31000 hectare of land was brought under soil
conservation programme. The commulative growth of the soil conservation
programme reached to 10,98,000 hectares at the end of the Fourth Five-Year
Plan. The Soil conservation programme has been launched successfully in
the state. A total 59,89,000 hectares of degraded land has been brought
under Soil Conservation measures upto 1999-00.
Most of the agricultural strategies launched at the National level were
introduced to the state also. Intensive Agricultural Area Programme was also
launched in U.P. in 1964. During the first three plans no breakthrough could
occur in the agricultural economy of Uttar Pradesh. The total foodgrain
production was 11.8 million tonnes in 1950-51 and it increased to 13.3
million tonnes in 1965-666. During the period though various programmes
for institutional changes were launched in U.P. but it was realised in the
mid-sixties during the severe drought (1965-66 & 1966-67) that the
institutional changes were not competent enough to overcome the bottleneck
of the agricultural economy of U.P. Therefore, in 1966 during the Kharif
season, the new strategy of agriculture supported with high yielding varieties
of seeds, fertilizer and irrigation was launched. Committee on Taxation of
Agricultural Wealth and Income (Lakdawala Committee) for Uttar Pradesh,
while studying the prospects of taxation in U.P. analysed the development
scenario of agricultural sector. The Committee recommended that dispersion
of new strategy was essential for the growth of agriculture7.
6 Govt. of India, Report of the Committee on Agricultural Wealth and Income, 1972
7 Report of Joint Study Team (Patel Committee) on Eastern Uttar Pradesh, Planning
Commission Govt. of India, 1964.

Table-I.1
Growth Rates of Area, Production and Productivity
Period Annual Growth Rates (In %)
Food Crops Area Production Productivity
1950-51 to 1970-71 0.65 2.55 0.95
1970-71 to 1990-91 0.23 3.05 2.88
1990-91 to 2000-01 (-) 0.14 1.78 1.91
1950-51 to 2000-01 0.33 2.59 2.26
Non-food Crops
1950-51 to 1970-71 2.19 3.16 1.88
1970-71 to 1990-91 1.77 3.43 2.82
1990-91 to 2000-01 3.03 2.65 (-) 0.38
1950-51 to 2000-01 1.69 2.77 1.07
All Crops
1950-51 to 1970-71 0.79 3.00 2.18
1970-71 to 1990-91 0.42 3.33 2.90
1990-91 to 2000-01 (-) 0.07 1.10 1.16
1950-51 to 2000-01 0.47 2.72 2.24
Source: Tenth Five Year Plan and Annual Plan 2002-03, U.P.
Similarly Joint Study Team (Patel Committee) on Eastern Uttar
Pradesh constituted by Planning Commission, Government of India,
suggested a package for the development of agriculture for eastern U.P.
During the post green revolution period agricultural production and
productivity increased manifold. The statistics related to agricultural
production, productivity and area given in the table-I.1 show that there are
three distinct phases. (Phase-I from 1950-51 to 1970-71, Phase-II from
1970-71 to 1990-91 and Phase-III from 1990-91 to 2000-01) in the
agricultural development of the state.
During the First Phase (1950-51 to 1970-71) the annual growth rate of
production of food grains was 2.55 per cent. The growth rate of productivity
was slightly higher than the growth rate of area under crops during the
period. The productivity growth rate during the period was 0.95 per cent per
annum while the area growth rate was 0.65 per cent per annum. Here it can
be said that during the first two decades of planning the increase in area
played an important role in the increase of production of food crops. It was a
period in which barren land and cultivable, waste-lands were brought under
crops. But due to traditional mode of farming, low productive seeds and low

use of chemical fertilizers the increase in yield was very low. 8
Net cropped
area was 15.6 million hectare in 1950-51 and it increased to 16.8 million
hectare in 1970-71. Thus, there was substantial increase in area under crops.
During the second phase (1970-71 to 1990-91) the growth rate of
agricultural production was higher than the growth rate of agricultural
production in the first phase. The distinct feature of the second phase was
the higher increase in productivity than that in the area under crops. The
composition of the variables were reversed during the second phase. During
the second phase the growth rate of productivity was 2.8 per cent per annum
while the growth rate of increase in area was only 0.23 per cent per annum.
During this period food grain production increased at the rate of 3.05 per
cent per annum and the rate of increase in production of non-food crops was
higher than that in the food crops.
During the third phase (1990-91 to 2000-01) increase in agricultural
production was solely through increase in productivity. There has been no
increase in area under crops in the state since 1990 but the production of
food grains enhanced from 33.8 Million tonnes in 1990 to 44.3 million
tonnes in 2000-01. The present scenario reveals that increasing demand for
land in urban areas and environmental issues are creating a pressure on
cultivated land. A clear trend of decline in net cropped area is emerging.
Though some waste-land, reclaimed fallow land and cultivable waste land
are being brought under the crops, but the shift of agricultural land for non-
agricultural uses is more than the increase in the cropped area. Actually there
was decline in area under food crops at the rate of 0.14 per cent per annum
coupled with the increase in agricultural production.
The statistics reveals that during 1990-91 to 2000-01 the growth rate
of agricultural production was 1.78 per cent and increase in productivity was
1.91 per cent per annum. During the period the area under foodgrain crops
declined. The rate of decline in area under foodgrain crops was 0.14 per cent
per annum. But the above conclusion regarding a continuous decline of the
growth rate of area under food crops is not true in case of non-food crops. It
shows that a shift is taking place in agricultural economy in favour of non-
food crops from foodgrain crops. The Table-I-1 confirms the above trend of
area under food and non-food crops.
8 C.H. Hanumantha Rao: Growth and Productivity in Agriculture, Allied Publishers, New Delhi.

Programmes for Sub-Sectors
Allied agricultural activities like animal husbandry, fisheries and
forestry are also very popular in the state. Since the beginning of the five
year plans a thoughtful programme for the development of allied activities
was also launched. Key Village Programme, Integrated Cattle Development
Programme and Fodder Development Programme were launched in the
state. Operation flood programme and breed improvement programme has
been quite successful in the state. Now dairying programme is expanding in
the state at a faster rate on the lines of ‘Amul Model’ specially in the western
region of the state. U.P. has the largest livestock population in the country.
The livestock sector is labour intensive and provides employment to around
25 per cent of the labour force and to the majority of female labourers.
Similarly inland fisheries programme has also been successfully launched.
The Fish Farmers Development Agency (FFDA) and Inland Fisheries
Development Programme are playing a crucial role in the development of
fisheries in each district of the state.
Water is the crucial requirement for all the life forms. Except
Bundelkhand region Uttar Pradesh is water rich state. Important rivers of the
state like Ganga and Yamuna are snowfed hence the flow of water is
perennial and massive even during the lean season. Few others parts of
country enjoy a similar advantage. According to Accelerated Irrigation
Benefit Programme (AIBP) 1995, India has 140 million-hectares ultimate
irrigation potential, while it was only 113 million-hectare according to
previous estimate. The gross cropped area in India is around 195 million-
hectare. Thus it is clear that at national level we can not irrigate our total
gross area even after using ultimate irrigation potential of 140 million
hectares. The situation is entirely different in U.P. Uttar Pradesh has more
irrigation potential than its gross cropped area. Irrigation potential in U.P. is
31.7 million-hectare while the gross cropped area is only 25 million-hectare
(Table-I.2). It has been estimated that irrigation capacity for 24.4 million
hectares in the state has been created and about 19.6 million hectares is
being utilized.
Agriculture is the primary livelihood of the majority of the population
in the state. At the beginning of the plan most of the farmers worked as per
their traditional knowledge and technology. Gradually, like other economic
sectors, agriculture has also become knowledge-based activity. Developed
countries have extensively improved their agriculture by applying

knowledge and scientific inputs. In this direction a substantial emphasis was
laid on agricultural research, education and extension. A number of
agriculture universities and colleges along with Krishi Vigyan Kendra and
Krishi Gyan Kendra have been established in the state.
Table-I.2
Irrigation Capacity and Utilization in U.P. 2000-01 (Thousand Hectares)
Item Minor Irrigation Major &
Medium
Irrigation
Total
Govt. Private
Capacity 3872 19097 7834 30803
Utility 1880 11404 6372 19656
Source: Planning Department, Govt. of U.P., Annual Plan 2001-02.
Infrastructure occupies the key for progress in all the productive
sectors of the economy. Agricultural development also depends upon a
sound base of infrastructure. Agricultural infrastructure facilities like rural
roads, warehouses, markets, adequate availability of power supply and
availability of credit are important components affecting the agricultural
production and productivity in the state. At present about 50 per cent of the
villages are linked with all-weather roads. In order to provide easy credit to
the farmers commercial banks and cooperative credit institutions have taken
initiatives. The scheme of Kisan Credit Card has also been introduced in the
state. Use of electricity is gradually increasing in the state in agricultural
sector.
Sericulture and Floriculture
Agricultural scenario of U.P. is basically foodgrain dominated.
Various policies and programmes after independence intended to raise the
production and productivity of foodgrains. No serious programme was
launched for sericulture and floriculture for which the state has good
prospects. The Western and Hill areas of the state have a tradition of
growing aromatic flowers. Similarly U. P. has a long tradition of silk reeling.
It has been a major production centre of silk garments. It was only after
1991-92 that the development of floriculture and sericulture got central place
for diversification of agriculture in U.P.

Supporting Services
Agricultural development is a dependent variable. It heavily depends
upon quality of soil and other basic inputs like fertilizer, irrigation, seed,
pesticides and credit. Supporting services like marketing, prices, information
and trade promotion measures etc. facilitate the process of agricultural
development.
Marketing is a crucial supporting service for agricultural
development. It was defective marketing system, which took millions of life
during colonial rule particularly in 1943. It has been mentioned that during
the famine of 1943 food articles were available but due to faulty marketing
system these were beyond the reach of common man. Marketing has twofold
objectives: (I) It provides income opportunities to producers and; (II)
Consumer gets agricultural produce at reasonable price on demand. After
realizing the need and relevance of good market system, it necessitated the
regulation of agricultural market. Andhra Pradesh, Karnataka, Maharashtra
and Tamil Nadu had regulated markets since 1931, but U.P. initiated market
regulations during 1961-66. Later on the number of regulated markets in
U.P. increased sharply and now U.P. ranks 5th
in the context of regulated
market.
The demand for storage increased sharply in late sixties at the national
and state levels. Storage of food grain is managed by Food Corporation of
India, State Warehousing Corporations and Central Warehousing
Corporation. The total number of warehouses were 187 in 1980-81. The
number increased to 301 in 1988-89. But here is declining trend in the
number of warehouses managed by State Warehousing Corporation. As a
result, the total number of warehouses declined to 225 in 1995-96. The Food
Corporation of India contributed maximum storage capacity. Apart from
warehouses managed by the above three agencies, at present there are 1060
cold storages in private, cooperative and government sector in the state. Out
of these 1060 cold storages only 834 cold storages are operational.
As it has already been pointed out that the process of diversification
was very weak upto 1980, and as a result, agricultural exports were low.
Agricultural exports from the state includes the export of the fresh and
processed produce. Agricultural exports are around 21 per cent of the India’s
total export, however the corresponding figure for the state is only 7 per
cent. Commercialization and diversification is taking place in the agriculture

of the state. This is a new phenomenon which can enhance the income of
farming community including small and marginal farmers. Diversification of
agriculture can contribute to the export basket from the state. The medium
and large farmers are capable to enter the trading business of agricultural
produce and they are in a position to generate surplus by adopting
agricultural diversification. Establishment of Agricultural Special Economic
Zones at various places is boosting the diversification of agriculture. The
area under horticulture crops such as fruits, vegetables and potato was 2.97
lakh hectares in 1950-51, which increased to 24.15 lakh hectares in 2001-02.
CHAPTER-II
Development Pattern of Agriculture in U.P.
Introduction
Change is inevitable. The basic ideology behind the change is gradual
transformation unlike revolution. The society and its business also change.
Accordingly, agricultural pattern also changes over the period of time.
Settled agriculture started in India with the introduction of foodgrain crops.
Under colonial rule East India Company and later on British Government,
tried to change agricultural pattern of the country. They laid emphasis on the
growth of commercial crops rather than the foodgrain crops. Popularization
of Indigo (Neel) cultivation and tea plantation are the example of deliberate
change in agriculture. Britishers enacted a law introducing ‘Tinkathia’
system, under which a cultivator in Bihar was forced to grow Neel upon
3/20 area of the cropped land. It was against the welfare of the common man
and resulted into acute shortage of foodgrains. It was also one of the factors
for frequent recurrence of famine in the country. It is worthwhile to mention
that Mahatma Gandhi entered in the freedom movement as an opponent of
Neel cultivation. The above brief narration testifies that the development
pattern of agriculture has been changing from time to time. After the
attainment of independence agricultural pattern has gradually changed.
There has been some change in crop composition, horticulture, livestock and
other activities.
Crop-Economy
During the first half of the 20th century, there has been very poor
growth of agricultural sector of the country. It was a phase of near stagnation
in farming sector. It has been observed that during the period 1900-45
growth rate of agriculture was only 0.3 per cent per annum, but the growth
rate of foodgrains was negative during the period. Index number of all
agricultural produce at the base year 1904-05=100 increased to 117.6 in
1946-47, while index number of foodgrain production declined to 95.7
during the said period. Productivity of food grains declined more sharply

and it declined from 100 of 1904-05 to 84.0 in 1946-47*1
. This indicates the
neglect of foodgrain crops. The trend had been pervasive in almost all the
regions of the country including Uttar Pradesh. At the dawn of independence
there was acute food shortage and the crisis became worst due to inflow of
refugees. Therefore, after independence more emphasis was laid on
foodgrain crops.
Rural economy of U.P. is crop dominated. Net sown area in Uttar
Pradesh is around 168 lakh hectares which is about 70 per cent of the total
geographical area (242 lakh hectares) of the state, while only 46 percent of
the geographical area of the country is under crops. Percentage of area sown
more than once is also higher in the state in comparison to the national
average. It shows that crop economy is dominant in U.P. The table-II.1
related to land utilization in U.P. confirms the above finding:-
Region-wise Land Utilization
The region-wise land utilization as analysed in Table-II-2 shows that
the proportion share of area under barren lands, cultivable waste lands, non
agricultural land uses etc. of reporting area were the maximum in
Bundelkhand region while area under water logged and sodic lands were the
maximum in Eastern and Central regions of the state. The cropping intensity
was the highest being 156.77 per cent in Western region against lowest of
114.55 per cent in Bundelkhand region during 1992-93. There was marked
enhancement in cropping intensity during 1999-2000 (117.56%) from
114.55 per cent during 1992-93 in Bundelkhand region. However, the
cropping intensity in Western and Central regions was more or less stagnant
during the corresponding period. The area under sodic land, water logged
and permanent pastures has steadily been decreasing in every five year plan
across the regions. (Table-II-3)
There was a slight increase in gross cropped area in 1999-2000 over
1992-93 at the state level. the maximum positive increase in gross cropped
area was 6.43 per cent in Bundelkhand region followed by 4.48 per cent in
the Central region during corresponding period. The increase in gross
cropped area was attributed to increase in area under summer crops across
the regions. (Table-II-4)
1 Govt. of India, Report of the National Commission on Agriculture, 1976, Vol.-1.

In the crop economy of U.P. foodgrains are dominant in terms of area.
About 50 per cent of the net sown area is cropped more than once.
Accordingly, the gross cropped area in U.P. in 1999-00 was 251 lakh
hectares. In 1950-51 about 83.4 per cent of the total cropped area was under
foodgrain crops. There has been some decline in percentage of area under
foodgrain crops by 1999-00 and it has been estimated that about 80 per cent
of the gross cropped area is under foodgrain crops. But there has been
continuous increase in the area under cereals. It increased from 62.2 per cent
of the gross cropped area in 1950-51 to 69.2 per cent of the gross cropped
area in 1999-00. The decline of area under foodgrain crops has been due to
sharp decline in area under pulses. The gross cropped area under pulses was
21.2 per cent of the gross cropped area in 1950-51, which continuously
declined and reached the bottom of 10.6 per cent in 1999-00. The same
declining trend has been observed in all the coarse grain crops also, along
with pulses. Similarly there has been marked decline in area under important
oilseeds. The gross cropped area under oilseeds was 10.5 per cent of the
gross cropped area in 1950-51, which gradually declined to 3.8 per cent in
1999-2000. The foodgrains crop structure has shifted in favour of wheat and
paddy. Similarly the area under vegetable crops is also increasing. Some
high value crops such as horticulture, herbicides and aromatic crops are also
coming up in Uttar Pradesh. Thus, it can be summarized that;
1. Percentage of net sown area to total geographical area of the state is
almost constant in U.P.
2. A large number of holdings in the state are small and very small.
3. Agricultural economy of U.P. is dominated by food crops. Area under
pulses, oilseeds and coarse cereals is sharply declining.
4. Crop composition has shifted of wheat and paddy.
5. The diversification process has been very slow in U.P.

Table -II.5
Trend of Area and Production of Crops in U.P.
Name of Crops 1950-51 1991-92 1999-2000
Area
(000 hect.)
Production
(000 M T)
Area
(000 hect.)
Production
(000 M T)
Area
(000 hect.)
Production
(000 M T)
Cereals 12743
(62.21)
8751 16084
(66.98)
31322 17384
(69.21)
41710
Pulses 4345
(21.21)
3023 2837
(11.81)
2494 2668
(10.62)
2551
Total Food
grains
17088
(83.42)
11774 18921
(78.79)
3386 20052
(79.83)
44261
Oilseeds 2158
(10.53)
779 1147
(4.78)
905 954
(3.80
834
Others 1239
(6.05)
3947
(16.43)
110459 4112
(16.37)
118311
Gross cropped
area
20485
(100.00)
24015
(100.00)
25118
(100.00)
N.B. Figures in brackets is percentage to gross cropped area.
Source: Agriculture department, Govt. of U.P.
The statistics related to physical production also confirms that break-
through has occurred in U.P. in case of cereal crops only. Increase in
production of vegetables and horticultural crops are the recent phenomenon.
Production of cereals was 87.5 lakh tons in 1950-51; it increased to 417.1
lakh tones in 1999-00. The production of pulses declined from 30 lakh tons
in 1950-51 to 25.5 lakh tons in 1999-00. The decline in production of pulses
presents serious contradictions in crop economy of U.P., particularly to the
people living below poverty line in the state. Though there has been increase
in total production of oilseeds during the above period but the area has
declined. It shows that productivity of oilseeds has increased. The benefits of
the programmes for the development of oilseeds have changed. The above
table confirms the facts regarding the change in area and yield of crop
economy. The table shows that area under all non-foodgrain crops was 16.58
per cent of the gross cropped area. It increased to 21.21 per cent of the gross
cropped area in 1991-92 but again declined to 20.17 per cent in 1999-00.
During the First Phase (1950-51 to 1970-71) the annual growth rate of
production of food grains was 2.55 per cent. The productivity growth was
slight higher than the growth rate of area under crops during the period. The
productivity growth rate during the said period was 0.95 per cent per annum
while the area growth rate was 0.65 per cent per annum. Here, it can be said
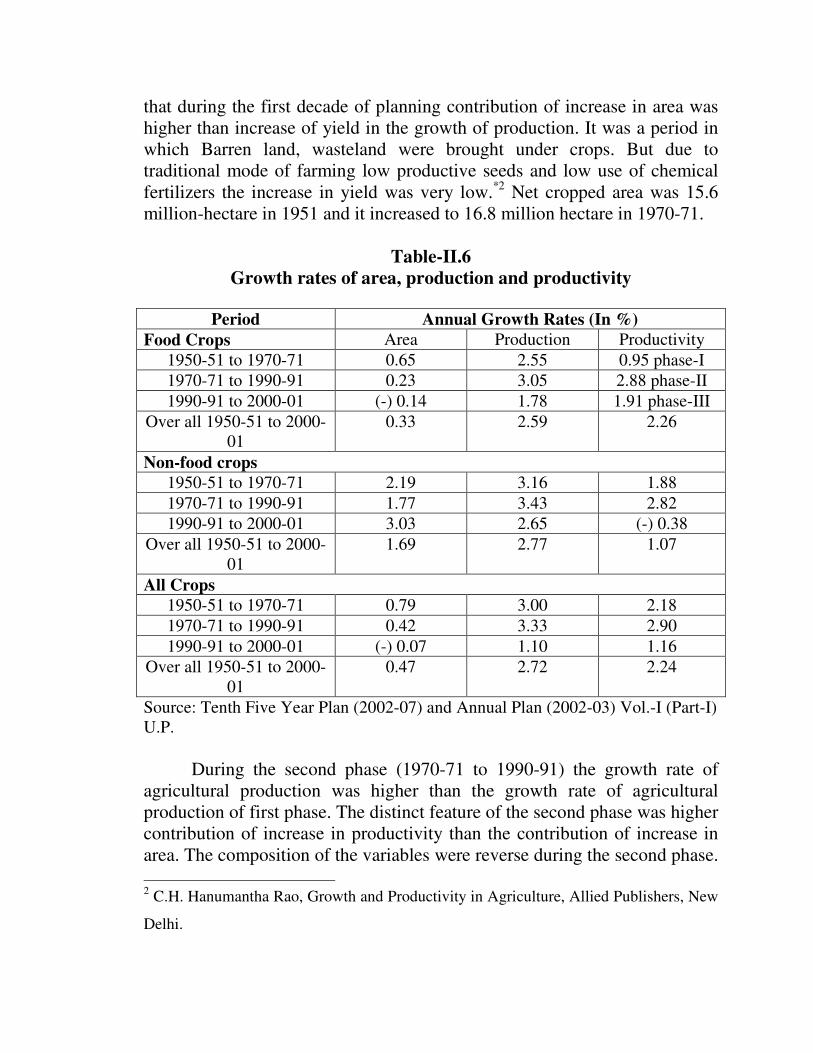
that during the first decade of planning contribution of increase in area was
higher than increase of yield in the growth of production. It was a period in
which Barren land, wasteland were brought under crops. But due to
traditional mode of farming low productive seeds and low use of chemical
fertilizers the increase in yield was very low.*2
Net cropped area was 15.6
million-hectare in 1951 and it increased to 16.8 million hectare in 1970-71.
Table-II.6
Growth rates of area, production and productivity
Period Annual Growth Rates (In %)
Food Crops Area Production Productivity
1950-51 to 1970-71 0.65 2.55 0.95 phase-I
1970-71 to 1990-91 0.23 3.05 2.88 phase-II
1990-91 to 2000-01 (-) 0.14 1.78 1.91 phase-III
Over all 1950-51 to 2000-
01
0.33 2.59 2.26
Non-food crops
1950-51 to 1970-71 2.19 3.16 1.88
1970-71 to 1990-91 1.77 3.43 2.82
1990-91 to 2000-01 3.03 2.65 (-) 0.38
Over all 1950-51 to 2000-
01
1.69 2.77 1.07
All Crops
1950-51 to 1970-71 0.79 3.00 2.18
1970-71 to 1990-91 0.42 3.33 2.90
1990-91 to 2000-01 (-) 0.07 1.10 1.16
Over all 1950-51 to 2000-
01
0.47 2.72 2.24
Source: Tenth Five Year Plan (2002-07) and Annual Plan (2002-03) Vol.-I (Part-I)
U.P.
During the second phase (1970-71 to 1990-91) the growth rate of
agricultural production was higher than the growth rate of agricultural
production of first phase. The distinct feature of the second phase was higher
contribution of increase in productivity than the contribution of increase in
area. The composition of the variables were reverse during the second phase.
2 C.H. Hanumantha Rao, Growth and Productivity in Agriculture, Allied Publishers, New
Delhi.

During the second phase the growth rate of productivity was 2.8 per cent per
annum while the growth rate of area was only 0.23 per cent per annum.
During this period food grains production increased at the rate of 3.05
per cent per annum.
During the third phase (1990-91 to 2000-01) increase in agricultural
production was solely through increase in productivity alone. There has been
no increase in area under crops since 1990 in the state but the production of
food grains enhanced from 33.8 Million tonnes in 1990 to 44.3 million
tonnes in 2000-01. The present scenario reveals that increasing demand for
land of urban areas and environmental issues are creating a pressure on
cultivated land. A clear trend is there to show the decline in net cropped
area. Though some wasteland, reclaimed land, fallow land and cultivable
wasteland is being brought under the crops. But the drift is more than the
increase in the cropped area.
The statistics reveals that during 1990-91 to 2000-01 the growth rate
of agricultural production was 1.78 per cent and increase in productivity was
1.91 per cent per annum. During the period the area under foodgrain crops
declined. The growth rate of area under foodgrain crops was 0.14 per cent
per annum. But the above conclusion regarding a continuous decline in the
growth rate of area under food crops is not true in case of non-food crops. It
shows that a shift is taking place in favour of non-food crops from foodgrain
crops. The Table-II.6 confirms the above trend of area under food and non-
food crops.
Plan-wise Growth of Area, Production and Productivity of Important
Crops
Plan-wise area, production and productivity of important crops in the
state have been given in Table-II-7. Crop-wise and plan-wise analysis of
area, production and productivity are narrated below:
Paddy
Paddy is the main crop of Kharif season of different regions of U.P. It
occupied 21 per cent of gross cropped area in 2000-01. The growth rate of
area, production and productivity was positive in Ist and II
nd Five Year Plans,
while production and productivity were negative in IIIrd
Five Year Plan.
From 4th
Five Year Plan onwards, there had been positive growth rate. It is

also notice from the table that the growth rate of area under this crop was
comparatively lower than its production and productivity during the study
period. The growth rate production and productivity was the maximum
during the Vth
five year plan while it was the lowest during the IXth
five year
plan. The area under paddy was 36.35 lakh hectares during Ist five year plan
which went up to 58.97 lakhs hectares during the IXth five year plan, thereby
showing an increase of 62.23 per cent over the base year. The maximum
jump in area under this crop was noticed in the VIth
five year plan. The
productivity of this crop was 5.77 quintals per hectare which has
significantly increased to 20.77 quintals per hectare during the IX th
five year
plan. There was substantial increase in productivity of this crop in the
succeeding five year plans. (Table-II-8)
Maize
Maize is the second important kharif crop of the state which occupied
3.71 per cent of gross cropped area during 2001-02. The area under this crop
was 9.44 lakh hectares during Ist five year plan which has marginally
increased to 9.76 lakh hectare during IXth
plan showing 3.39 per cent
increase. However, the productivity of this crop doubled during the IXth
five
year plan from productivity of 7.83 quintals during Ist five year plan (Table-
II-8). The growth rate of area was negative over plan period except Ist, III
rd
and VIIIth
five year plans. Maximum down fall occurred after the
introduction of green revolution. The range of growth of productivity was
between 1.85 and 7.83 per cent per annum. There was very erratic growth
rate of productivity of this crop over the plan periods (Table-II-7).
Other Coarse-Grain Crops
The area under jowar, mandua, kodan and sawan has decreased
gradually in all the succeeding five year plans. The area under kakun and
kulthi are now invisible in all most in part of the state.
Wheat
Wheat is very important crop of the Rabi season and is grown in all
the regions of the state. It occupied the highest share being 52.79 per cent
during 1999-2000 of gross cropped area. Table II-8 indicates that 36.53 lakh
hectare area was under wheat during Ist plan which increased to 92.59 lakh
hectares during IXth
five year plan, thereby showing an increase of 153.44

per cent over the base year. The pace of enhancement of area under this crop
started since the inception of green revolution. The productivity of this crop
was only 8.23 qtls per hectare in Ist five year plan which increased to 26.53
qtls per hectare in the IXth
five year plan. The area, production and
productivity of this crop have a positively increasing trend in every five year
plan period. It is also noticed from Table-II-7 that growth rate of area and
productivity was quite encouraging from seventies onwards (Vth
five year
plan). There was very slow growth of area under this crop during the VIIIth
five year plan and it became almost negative during the IXth
five year plan
(Table-II-7).
Oilseeds
Table-II-7 also reveals that growth rate of area and production was
negative in IInd
and Vth
five year plans. The growth rate of productivity of
oilseed was quite impressive over all the five year plan periods. Overall,
growth rate of area production and productivity was quite low during IXth
five year plan in comparison to wheat and paddy crops (Table-II-7).
The cause of slow pace of growth rate of area can be attributed to
changing the area to sugarcane, vegetables, paddy and wheat. Since it is very
susceptible to pests and diseases so the production of oilseeds appeared to be
un-productive (Table-II-8).
Pulses
Moong, urd, gram, pea, lentile and arhar are the main pulse crops of
the state. Out of total cropped area, the pulses accounted for 10.60 per cent
area during 2001-02 which was 21.20 per cent during 1950-51. The position
of pulses had been very distressing since seventies. The maximum area of
rabi pulses shifted to wheat crop because of Green Revolution. During the Ist
and IInd
five year plans, he growth rate of area and production was quite
encouraging. From IIIrd
five year plan onward the growth rate of area,
production and productivity suffered a great set back. There was decline in
area of gram, pea and arhar across the regions. On account of expansion of
irrigation facilities coupled with new strategy of wheat and paddy crops, the
area under pulses started being used for wheat, paddy and vegetable crops.
The above analysis highlights that the pulses and coarse grain crops
have suffered a lot since introduction of green revolution and expansion of

irrigation net work in the state. Besides, the area and production of
sugarcane and vegetable crops have also increased manifold in the state.
Region-Wise Productivity of Major Crops
The productivity of paddy and wheat, sugarcane and potato was the
maximum in the Eastern region while it was the minimum in Bundelkhand
region. However, the productivity of pulses was the highest in the
Bundelkhand region. Table-II-9 reveals that productivity of oilseeds was the
maximum in the western region followed by the Central region. The
productivity of these crops in Central as well Eastern Regions was close to
Western regions while there was a wide gap between western and
Bundelkhand regions. It is also noticed from Table-II-9 that there was an
increasing trend in the productivity of wheat in Bundelkhand region as
compared to other regions. The enhancement in productivity of wheat was
quite slow across the regions. (Table-II-9). The productivity of different
crops either of kharif of rabi seasons was more or less stagnant during IXth
five year plan because of unbalanced use of fertilizers, excessive use of
water and unchanged cropping pattern across the state. The pace of growth
rate of production was higher during 1980s than during 1990s. The cause of
lower growth rate in food grains production was declining investment in
agriculture. Hence, the agro-climatic regional planning requires to be
stressed in a bigger way. There is also need for diversification from crops
sector to livestock and fisheries across the regions of the state. A substantial
capital should be allocated for control of floods, reclamation of sodic and
degraded lands etc. so that more lands could be used for cultivation. The
farmers should be advised to also spare some areas for pulses, vegetable,
floriculture, medicinal plants etc. to get regular income throughout the year.
Table -II-13
Individual Yields Achievable Level Current Productivity and Possible
gap (Qtls/ha.)
Individual
highest yield
Achievable
Productivity
Current
Productivity
Possible
GAP
Zone Rice Wheat Rice Wheat Rice Wheat Rice Wheat
Hills 59 48 30 25 20 18.65 10 6.35
Western Plains 62 68 40 45 25 32.48 15 12.52
Mid-Western Plains 53 54 40 40 26 29.23 14 11.77

South Western -- 57 30 42 18 30.75 12 11.25
Semi Dry Plains
Mid Plains 47 73 30 38 19 27 11 11
Bundelkhand 25 41 20 25 12 20.04 8 5
North Eastern Plains 43 52 25 40 20 25.5 5 14.5
Eastern Plains 49 57 30 40 21 25.51 9 14.5
Vindhya 33 38 25 20 22 16.38 8 3.62
Uttar Pradesh 47 57 30 35 21.48 26.68 8.52 8.32
Table-II-13B
Region-wise Distribution of Districts According to Category of Development
Developed Moderately
Developed
Less Developed Backward
Western Region
Ghaziabad Rampur Ferozabad Badaun
Meerut Moradabad Farrukhabad
Muzaffarnagar Bulandshahar Shahjahanpur
Saharanpur Bareillly Etah
Mathura Aligarh Etawah
Bijnore Pilibhit
Hardwar Mainpurii
Agra
Central Region
Kanpur Nagar Rae Bareli Fatepur
Kucknow Kheri Kanpur Dehat
Barabanki Sitapur
Hardoi
Eastern Region
Varanasi Deoria Pratapgarh
Gorakhpur Mirzapur Maharajganj
Ballia Gonda
Allahabad Siddharthnagar
Sultanpur Bahraich
Jaunpur
Sonebhadra

Faizabad
Ghazipur
Azamgarh
Mau
Basti
Bundelkhand Region
Jhansi Jalaun Hamirpur
Lalitpur
Banda

Horticulture Economy
Uttar Pradesh is blessed with strong horticulture production base. It is
the sixth largest producer of vegetables and eighth largest producer of fruits
in the country. It contributes around 45 per cent of the potato production of
the country. It has 2.66 lakh hectares of area under the mango orchard. It is a
pioneering state which initiated the declaration of fruit belt orchard
dominated areas of the state has been declared as fruit belt and promotional
as well as protective measure are being introduced. Thus, U.P. has great
potential for the development of horticulture like, fruits, vegetables,
aromatic & medicinal plants and floriculture crops. As a result of continuos
efforts, horticultural crops have substantially increased. New varieties of
fruits, vegetables and new technology have also been introduced in the field
of horticulture. The table given below shows the area and production of
horticulture during first plan and at the end of Ninth Plan:-
Table-II.14
Year-wise Physical Achievements during the Ninth Five Year Plan
Year Fruits Vegetables Potato Area
(lakh
Ha.
Prod.
(lakh
M.T)
Area
(lakh
Ha.)
Prod.
(lakh
M.T)
Area
(lakh
Ha.)
Prod.
(lakh
M.T) 1951-56 (Ist Plan)
1.00 5.00 1.00 10.00 0.07 6.86
1997-99 8.24 85.00 10.20 165.00 3.96 58.54
1998-99 8.37
(7.58)
88.00
(3.53)
10.50
(2.94)
171.20
(3.76)
3.90 (-
1.51)
80.00
(36.66)
1999-2000 8.55
(2.15)
85.25
(-3.13)
10.75
(2.38)
177.77
(3.84)
3.95
(1.28)
96.00
(20.00)
2000-01 7.15
(-16.37)
69.24
(-19.13)
11.23
(4.47)
163.30
(-8.14)
4.00
(0.01)
85.00
(11.46)
2001-2002 Proposed 8.85
(-23.78)
100.00
(44.43)
11.25
(0.18)
191.05
(16.99)
4.05
(1.25)
103.00
(21.18)
Note: Figures in brackets are percentage change over preceding years.

Table-II-15
Year & Plan wise Area & Production of Fruits, vegetables and Potato
Sl.
No.
Years/ Plan Fruits Vegetables Potato Total
Area Prod. Area Prod. Area Prod. Area 1 1951-56
Ist Five year plan
1.00
((33.67)
5.00 1.00
(33.67)
10.00 0.97
(32.66)
6.86 2.97
(100.00)
2 1956-61
IInd Five Year Plan
1.50
(36.38)
9.00 1.50
(38.38)
15.00 1.13
(27.24)
7.99 4.13
(100.0)
3 1961-66
IIIrd Five Year Plan
2.99
(43.40)
17.99 2.43
(35.27)
27.13 1.47
(21.33)
13.41 6.89
(100.00)
4 1969-74
IVth Five Year Plan
3.49
(41.70)
21.79 3.07
(36.38)
36.08 1.81
(21.92)
16.95 8.37
(100.00)
5 1974-79
Vth Five Year Plan
5.23
(40.64)
28.15 4.94
(38.38)
55.25 2.70
(20.98)
42.41 12.8
(100.00)
6 1980-85
VIth Five Year Plan
5.80
(35.58)
38.39 7.41
(45.46)
89.92 3.09
(18.96)
52.56 16.30
(100.00)
7 1985-90
VIIth Five Year Plan
6.98
(37.59)
56.60 8.30
(44.70)
108.40 3.29
(17.71)
59.90 18.57
(100.00)
8 1990-91
Annual Plan
7.16
(38.00)
59.00 8.45
(44.85)
113.00 3.23
(17.15)
61.46 18.84
(100.00)
9 1991-92 Annual Plan
VIII Plan
7.33
(37.53)
63.00 8.76
(44.85)
120.60 3.44
(17.62)
60.09 19.53
(100.00)
10 1992-93 7.49
(36.00)
66.00 9.21
(145.10)
124.2 3.72
(18.22)
54.71 20.42
(100.00)
11 1993-94 7.94
(138.01)
67.24 9.30
(44.52)
132.85 3.65
(17.47)
7.69 20.89
(100.00)
12 1994-95 7.78
(37.26)
72.50 9.49
(45.45)
143.00 3.61
(17.29)
65.61 20.88
(100.00)
13 1995-96 7.94
(37.34)
81.78 9.97
(44.95)
159.00 4.11
(11.53)
92.63 22.18
(100.00)
14 1996-97
IX Plan Year
8.10
(36.52)
9.97
(44.95)
159.00 4.11
(18.53)
92.63 22.18
(100.00)
15 1997-98 8.24
(36.78)
85.00 10.20
(45.54)
165.00 3.96
(17.68)
58.54 22.40
(100.00)
16 1998-99 8.37
(36.76)
88.00 10.50
(46.11)
171.20 3.90
(17.13)
80.00 22.77
(100.00)
17 1999-2000 Estimated 8.55
(36.82)
85.25 10.75
(46.34)
177.77 3.95
(16.96)
96.00 23.25
(100.00)
18 2000-01 7.15
(31.95)
69.24 11.23
(50.18)
163.30 4.00
(17.87)
85.00 22.38
(100.00)
19 2001-02 proposed 8.85
(36.64)
100.00 11.25
(46.58)
191.05 4.05
(16.78)
103.00 24.15
(100.00)
Note: figures in brackets are percentages of total area.
The targets for production of fruits, vegetables and potato have been
substantially raised for the Tenth Five Year Plan. It has been decided to
promote horticultural exports and the farmers are being encouraged to
undertake cultivation of medicinal and aromatic plants. It has also been
decided to promote food processing units in the state specially in the areas

rich for horticultural crops. Similarly the state has good prospects for
floriculture. The state has a tradition of growing aromatic flowers in
Kannauj, Hathras and Ballia. National Horticulture Broad, National
Cooperative Development Corporation, Agricultural Processing Export
Development Authority (APEDA) and U.P. Diversified Agriculture Support
Project (UPDASP, Horticulture Component) are trying to develop
floriculture in the state.
Development potential of horticulture and floriculture is very high in
the state. In this backdrop various development programmes have been
launched for the sector. Public sector investment in the horticulture and
floriculture sector has also been considerably raised. There was negligible
expenditure for these sub-sectors of agriculture during the Ist, IInd and IIIrd
plans. It was the VIth plan in which 1.31 per cent of the plan expenditure
was made available for horticulture. The plan outlay has sharply increased to
5.24 per cent in the Xth five year plan. As a result of this the production,
productivity and area under horticultural crops have increased. The future of
farming community in the state depends considerably on diversification of
agriculture, particularly in favour of horticultural crops.
Live Stock Economy
Agriculture and livestock remained like one inseparable entity since
the beginning of agriculture, whether unsettled or settled. They nourished
each other. Live stock has a key role in the agricultural economy of U.P. as
it provides milk, meat, wool, farm power, manure and cooking fuel. Live
stock has a major role in providing assured income and employment to small
and marginal farmers and weaker sections of the society, particularly to
women and landless labourers*3
. Mentioning the importance of livestock
sector Royal Commission on Agriculture (1926) highlighted that, “Cow
worship in India is common because it supplies bullock power, which is the
backbone of rural economy.”*4
It is closed interwoven with agriculture and
obviously plays an important part in the rural economy. But it did not
receive as much attention as crop production till the Royal Commission on
3 Livestock Economy of India, Conference proceedings, Indian Society of Agricultural
Economics, Oxford & IBH, Pub. Co. New Delhi, 1989.
4 Govt. of India, Royal commission on Agriculture, New Delhi, 1928.
Agriculture provided an unusually comprehensive and insightful discussion
of India’s livestock economy.
Live stock sector is more relevant to Uttar Pradesh as the percentage
of small and marginal holding as well as agricultural landless labourers is
higher in U.P. than the all India average. The percentage of marginal
farmers’ land holding in total land holding of the country is 59.4 per cent,
while in U.P. this percentage is 75.6 per cent*5
. This shows that for
providing income and employment to marginal farmers and landless
labourers, livestock has more weightage in U.P. The number of livestock is
substantially large in U.P. than that in India. During the last two decades
cattle population in the state has declined by a margin of 3 per cent annually.
Buffaloes have recorded a decrease of 0.5 per cent annually. Though the
number of goats, sheep, pigs and poultry population have increased. Cattle
Breeding Programme has been an important programme in the state
followed since independence. Until the Third Plan breeding policy
emphasized the development of multipurpose cows that would provide more
milk and quality work cattle. But from the Third Plan onwards the strategy
was shifted to the breeding of high yielding cross-bred cows whose male
progeny is less suited for rearing as work cattle. The strategy was
implemented in Intensive Cattle Development Projects and subsequently in
Operation Flood Projects.
Capital Formation in Agriculture
Investment creates capital, whether tangible or intangible. Investment
in economic activities includes public sector investment and private sector
investment. After independence public sector investment has played a
crucial role in the development of agriculture by enhancing infrastructure
like irrigation, electricity, agricultural research, roads, markets, warehouses
and communication etc. Capital formation either in form of public capital
or individual capital creates a conducive atmosphere for agriculture.
Agricultural machinery is a part of gross capital formation in agriculture.
There has been steep progress in the use of agricultural machinery and
implements in the state. Use of tractors, threshers, diesel engine sets, electric
5 Govt. of U.P. Tenth Five Year Plan Vol. I Part-I and Statistical Diary of U.P 2001, P-
85.

tube-wells have increased remarkably during the plan period in U.P., as
presented in table-II-16.
Gross capital formation in agriculture both from public and private
sectors increased in India till 1979-80 in terms of amount and total capital
formation. Share of agriculture and allied sector in total gross capital
formation was 17.7 per cent in 1979-80. The trend has changed after 1979-
80. The decline has been more steep since 1982-83. Percentage share of
agriculture and allied sector in total gross capital formation declined to 7.1
per cent in 2000-01. Similarly the investment in agriculture as percentage of
G.D.P. was 1.6 per cent in 1993-94. It declined to 1.3 per cent in 2000-01.
The decline in public sector investment is a matter of serious concern.
Percentage share of public sector in gross investment of agricultural sector
was 33 per cent in 1993-94. The contribution of public sector investment in
agriculture declined to 24.2 per cent, while the share of private sector in
gross investment of agriculture increased from 67 per cent in 1993-94 to
75.8 per cent in 2000-01*6
. The above trend of capital formation continues in
U.P. also. In U.P., public sector investments were in the form of agricultural
machinery such as tractors, power tiller, thresher. Investments in irrigation,
electricity, agricultural research, road, trade and communication have
declined. The more disturbing point is decline of private sector investment in
agriculture in U.P. During the period of study we found that in eastern and
western regions of U.P agricultural surplus, particularly from big farmers, is
being shifted to cities and nearby towns as well as more for consumption
expenditure.
On the basis of plan expenditure on agriculture the above conclusion
can also be substantiated. It has seen observed that upto the Vth five year
plan total expenditure on agriculture in India was more than 12 per cent of
the total plan expenditure. After 1979 it declined sharply and during IXth
five year plan the same was only 4.9 per cent of the total plan expenditure in
India*7
. The same trend prevails in U.P. also. In U.P. during the Vth plan
total expenditure on agriculture was 13.6 per cent of the total plan
expenditure and it declined to 5.4 per cent in the sixth plan. But there has
been marginal increase in the figures during the next three plans. The trend 6 Computed from on Report on Currency & Finance, RBL, 2000-01 & Economic Survey
2000-01. 7 Planning Commission, Government of India, Tenth Five Year Plan Vol.II,.

has been presented in the table-II-17. The declining trend in public and
private sector investment is to be reversed by better targeting of subsidies,
increasing investment in productive assets such as agricultural machinery,
irrigation, power, credit and developing rural infrastructure in the state.
Table-II.17
Plan Expenditure on Agriculture in India & U.P.
Plan Period Expenditure on Agriculture as
percentage to total Public
Expenditure in India
Expenditure on
agriculture as percentage
to total Public expenditure
in U.P.
I Plan 14.9 24.7
II Plan 11.3 28.8
III Plan 12.7 27.8
IV Plan 14.7 18.9
V Plan 12.3 13.6
VI Plan 5.8 5.4
VII Plan 5.9 8.4
VIII Plan 5.2 9.1
IX Plan 4.9 12.3
Source: Govt. of India, X Five Year (2002-07) Plan, Vol.-II and Compiled
from various Plan Documents of U.P.
On the basis of intra-sectoral plan expenditure in various sectors of
agriculture in U.P., it has been observed that during First plan expenditure
on crop economy was 81.7 per cent of the total plan expenditure which
declined to 23.7 per cent in the Ninth plan. On the other hand plan
expenditure has increased in livestock, horticulture, forestry and soil
conservation as well as in cooperation and warehousing including
marketing. The increase in these sub-sectors has been more remarkable since
Forth Five Year Plan. The plan expenditure trend given in the following
table shows that more emphasis is being given to allied activities of
agriculture as well as to development of supporting services for agricultural
sector. Forestry and soil conservation have also attracted attention of the
policy makers as total plan expenditure was 4.2 per cent of the total
expenditure of the First Five Year Plan. It gradually increased so much so
that 34.8 per cent of the total expenditure of the VIIIth plan was used for

forestry and soil conservation. It further increased to about 39 per cent in
Ninth Five Year Plan. The trend reveals to very important conclusions.
1. The health of land and soil has degraded intensively and soil
degradation creates a threat to future development of agriculture.
2. Forest cover is an essential aspect for soil conservation and other
benefits related to forestry.
3. Horticulture has gained momentum particularly after Fourth Five Year
Plan as 1.31 per cent of plan expenditure was used for horticulture in
Six Five Year Plan, which increased to 5.24 per cent in Ninth Five
Year plan.
Table-II-19
Uttar Pradesh at a Glance (Plan wise Expenditure)
Item and Units Time Particular
1 2 3
Five Year's Expenditure (In Crores)
A. First Five Year Plan 1951-56 153
B. Second Five Year 1956-61 233
C. Third Five Year 1961-66 561
D. Annual Plan year 1966-69 455
E. Fourth plan Year 1969-74 1166
F. Five Year Plan 1974-79 2909
G. Annual Five Year Plan 1979-80 829
H. Six Plan Year 1980-85 6594
I. Seven Five Year Plan 1985-90 11949
J. Annual Five Year Plan (Annual) 1990-92 6904
K. Eight Five Year Plan 1992-97 21680
L. Nine Five Year Plan Annual 1997-98 5667
M. Nine Five Year Plan Annual 1998-99 6364
N. Nine Five Year Plan 1999-2000 6569
O. Nine Five Year Plan 2000-2001 8188
With Uttaranchal

The plan expenditure pattern in various sector of agriculture in the
state shows that fisheries sector of the state has not received much attention
of the policy makers. The percentage of total expenditure on fisheries
remained constant (around 1 per cent of the total expenditure) except Second
Five Year Plan. Plan expenditure on fisheries sector was 3.3 per cent of the
total plan expenditure of the state in Second Five Year Plan.
Agriculture being the dominant sector in terms of GDP, employment
and source of the supply of the basic requirement of life deserves serious
attention of the state. Increased capital formation through plan expenditure
in agriculture shall boost the agricultural productivity and its diversification.
Development of livestock sector, fisheries, horticulture, floriculture,
aromatic plants for which U.P. has vast potential also depends on capital
formation.
Table-II-20
Per Capita Plan Expenditure in Five Year Plans
Plan Period U. P. India Percentage U. P. to
India
1st Five Year Plan (1951-56) 25 38 65.8
2nd
Five Year Plan (1956-61) 32 51 62.7
3rd
Five Year Plan (1961-66) 72 92 78.3
Annual Plan (1966-69) 53 61 86.9
4th
Five Year Plan (1969 - 74) 132 142 93.0
5th
Five Year Plan (1981 - 85) 329 361 91.1
6th
Five Year Plan (1981 - 85) 588 718 81.9
7th
Five Year Plan (1985 - 90) 1077 1270 84.8
8th
Five Year Plan (1992 - 97) 1559 2135 73.00

CHAPTER-III
Major Initiatives in Agricultural Development
At the dawn of independence it was imperative to develop agriculture
in view of continuing food shortage and heavy inflow of refuges in the
country as well as in Uttar Pradesh. The government of U.P initiated various
schemes and programmes, from time to time, to increase the agricultural
production. The chapter deals with the major initiatives taken for agricultural
development in the state. An overview of the agricultural development
schemes and programmes launched during the plan period shows that the
focus of the programme has changed from time to time. During the first
three decades of the plan period the emphasis was to increase gross
foodgrain production. As the income of the people grew the consumers’
taste and requirements of the farmers changed. Accordingly, the essence of
schemes, programmes and priorities also changed to accommodate the
changes in consumers’ taste and market environment. The major schemes
and programmes launched for agricultural development in the state are
summarised below:
1. Schemes and Programmes to Raise Gross Agricultural Output:
As we have earlier observed that during first two decades of planning
high priority was assigned to institutional changes for the growth of
agricultural production, specially foodgrains such as abolition of
intermediaries, consolidation of holdings, ceiling on land holdings,
regulation of rent, tenancy reform etc. Later on technological innovations
were adopted and implemented to raise the gross agricultural production.
This aspect has also been summarized in the earlier discussions.
2. Schemes & Programmes Related to Crop Production:
The other aspect of the schemes and programmes has been crop and
region specific. During the plan period a number of programmes and
schemes were introduced such as: Kisan Mitra Scheme (for all crops), Small
Farmers Development Agency (SFDA), Marginal Farmers and Agricultural
Laboures Development Agency (MFALDA), Free Boring Scheme, Intensive
Sugarcane Development Programme, Scheme for Fodder and Pasture
Development, Feed and Fodder Production Enhancement Programme.

Crop production and its growth have been the major concern of the
government of Uttar Pradesh. Various national programmes, such as IADP,
IAAP, Technological Change, Drought Prone Areas Programme, Hill Areas
Development Programme, Diversification and Multiplication Programmes
have been launched in U.P. These programmes were financially assisted by
the government of India. Besides these macro programmes, government of
U.P. has launched various development programmes and schemes for
specific crops and backward areas of the state. Some notable programmes
and scheme are Free Boring Scheme, Feed and Fodder Production
Enhancement Programme, Crop Insurance Programme, Integrated Cereal
Development Programme. Special Programme of Rice Development,
Agricultural Training for Women Programme, Integrated Cereal
Development Programme (Maize), establishment of Agricultural
Development Funds, Intensive Cane Development Programme etc. Besides
these, Technology Mission Programme is also in operation in the state to
enhance the production of selected crops like urd, moong, pageonpea, gram
and lentil. The Technology Mission also helps raise the production and
productivity of oilseed crops. It also intends to increase the production of
maize. UPDASP has also initiated a number of programmes for raising the
crop production and diversifying the agricultural sector, such as,
Programmes of Barley, Maize, Bajra, Rice, Oilseeds, Pulses and Wheat etc.
3. Horticulture:
Government of Uttar Pradesh, as in case of India, paid more attention
to the development of foodgrains. It is only since the beginning of
globalization of agriculture that the government started to pay more attention
to horticultural crops and at present U.P. produces 8.5 million tons of fruits.
This is around 18 per cent of total fruit production of the country. Vegetable
production is around 20.4 million tons constituting around 19 per cent of
total vegetable production of the country. Similarly around 2000 hectares of
area is under the cultivation of flowers in the state. Thus U.P. has
considerably progressed in the production of horticultural crops such as
fruits, vegetable, potato, spices, flowers, mushroom and betel leaves. The
U.P. Horticulture Department has launched the following major schemes for
the development of horticultural crops:
1. Plantation of fruit sapplings.
2. Establishment of nurseries and gardens at block level on private land.
3. Establishment of herbal gardens.

4. Development of vegetables and spices.
5. Development of fruit belt areas
6. Development of mushroom cultivation.
7. Development of medicinal and aromatic plant.
8. Distribution of seeds for the cultivation of spices and vegetables.
9. Change of varieties of the plantation crops.
10. Establishment of fruit processing industries.
11. Establishment agri-export zones.
12. Strengthening of farmers and gardeners.
13. Development of Citrus Fruits and Plants in Bundelkhand Region.
14. Ornamental gardening scheme.
Above is the list of major schemes being implemented for the
development of horticulture in the state. Besides these schemes, some other
programmes are being implemented in U.P. for the development of
horticultural crop, such as intensification of major horticultural crops like
fruit, vegetable, spices, medicinal and aromatic plant and bee-keeping.
Similarly, a programme has been launched for introduction of new
production technology like establishment of green houses for floriculture,
establishment of green house for protected vegetable production, promotion
of low tunnel technology for nursery management and mechanization in
vegetable production. There is another programme for productivity,
improvement of post harvest infrastructure and marketing facilities.
Establishment of Agro-Export Zone is an important programme for
the development of major horticultural crops for which the state has very
rich potential. In this direction Mango Export Zone has been established at
Lucknow and Saharanpur and Agri-Export Zone for potato has been setup at
Agra. The state government has forwarded a proposal to central government
for establishing Agri-Export Zone at Varanasi (for vegetable), Pratapgarh
(for Aonla) Rampur and Barabanki (for Mentha). These Agri- Export Zones
shall help further development of various vegetable crops.
4. Live-Stock
The main aim of animal husbandry development in the state was to
create employment and alleviate the poverty of down trodden people
through effective implementation of policies and programmes. The
following major policies and activities were initiated during different Five
Year Plans for the development of live stock in the state.
I. Policies and Activities to Control Live stock Diseases. Epidemics
have been controlled through preventive vaccination. On account of
this, mortality rate have come down. Under this programme maximum
emphasis has been to establish veterinary hospitals, dispensaries and
mobile units. Apart from these, special efforts have also been made to
control infertility problems in live stock. This programme has been
giving positive result since its inception.
II. Artificial Insemination Programme (AIP) has received grand success
in the state. Frozen Semen and Embryo Transfer Technology have
been implemented in a big way. This has brought a revolutionary
improvement in the breed of milch animals.
III. Feed and Fodder Programme Feed and fodder storage has been a
major bottleneck for the live stock economy of the state. Keeping it in
view Feed and fodder Programme was started in 1959-60 in the
selected villages, in which seed of barseem and perennial grass were
distributed to cultivators at 50 per cent subsidy. But the response was
poor.
IV. Poultry Development Programme the Govt. had exempted poultry
feed and ingredients from trade tax under this programme to achieve
2.50 lakh improved poultry of layer. Efforts were also made to
improve marketing back-up and provided technical support to
entrepreneurship. The Scheme for Promotion of “Backyard Poultry
Keeping” is being launched during the Tenth Five Year Plan for
increasing the production of egg and poultry meat. This programme
will encourage target group to increase their income and employment
among the house-wives.
V. Sheep and Wool Development the sheep extension work had been
carried out through 124 Sheep and Wool Extension Centres during the
IV Five Year Plan. For getting quality production of wool, the Govt.
had initiated the following schemes:
(a) Establishment of Sheep Breeding Farms.
(b) Establishment of Wool, Grading and Marketing Centres
(c) Expansion and Strengthening of Goat Breeding Facilities.

(d) Veterinary support to shepherds under Sheep and Wool Development.
The “Mass Drenching Programme” along with the vaccination of
sheep was started to get good quality wool production. This programme
would enhance the wool production upto 0.560 lakh kg. per annum in
years to come.
VI. Goat Production Programme Govt. had given adequate attention to
improve the goat breeds. On account of this, the goat meat and milk
production has significantly increased. Goat produced 266.337 lakh
kilograms of meat and 0.0893 lakh M.T. of milk during 1999-2000.
The Animal Husbandry Departments will provide small goat units
(one buck+ten does) to thriving family under self-employment
scheme. The department has set a target to establish 200 Goat
Breeding Societies. Each society has 50 members. In the wake of this,
the goat meat production shall increase by 10% by the end of Tenth
Five Year Plan.
VII. Piggery Development Programme Animal Husbandry Department had
given full attention for strengthening and expansion of Pig Breeding
Facilities. A Regional Pig Breeding Station was established at the
Central Dairy Farm, Aligarh at the end of the second Five Year Plan
to produce quality boars and gilts to issue in the field for piggery
development. Integrated Pig Development Scheme was also launched
throughout the state through Public/ Cooperatives/ Breeder’s
Societies/ NGOs. A large number of SC/ST families were maximum
covered under this programme. Diagnostic Investigation Laboratories
were also established in potential areas.
VIII. Fodder and Pasture Development Training and Extension Support,
Establishment of A.H Extension wing, strengthening of live stock
marketing units were also among the programmes of Animal
Husbandry Development to achieve better growth by the end of X
Five Year Plan.
IX. Dairy Development Uttar Pradesh is the largest milk producing state
of the country. The state produces 14.5 M.MT milk annually which is
about 16% of the total production of the country. At present 11917
Dairy Cooperative Societies are working under the 51 district unions
and the Provincial Cooperative Dairy Federation (PCDF). More than
7.59 lakh dairy farmers of the state are getting employment in this

sector. In order to increase the milk production and to improve the
economic condition of the milk producers, the following schemes and
programmes were been launched in the state:
(a) Awareness for Dairy Development and Extension and Training.
(b) Financial help to Milk Co-operative Institutions under Special
Component Plan.
(c) Border Area Development Programme.
(d) Market Intervention Operation.
(e) Revitalization, Consolidation and Expansion of existing Milk Unions/
Societies.
(f) Establishment of Dairies and Chilling Plants.
(g) Milk Production and Enhancement Programme.
(h) Mahila Dairy for Milk Cooperative Societies.
(i) Saghan Mini Dairy Department (SMDP).
(j) Mother Dairy.
Integrated Dairy Development Project in non operation, flood prone
and backward areas (IDDP): Govt. of India has been providing 100%
grants-in-aid to state Govt. for dairy development under this scheme. Three
projects viz, U.P.-I (Bundekhand), U.P.-2 (Purvanchal) and U.P.-3 (Tarai)
have been sanctioned by Govt. of India in 1993-94 with a financial outlay of
Rs. 1242.80 lakh. Diversified Agriculture Support Project (DASP): The
DASP has also been supporting to boost the dairy development programme
in the state.
5. Fisheries
Fisheries sector has been assisting economically weaker communities.
There has been a remarkable growth of inland fisheries in the State. It
provides gainful employment and higher income to the farmers. With a view
to developing the fisheries in the state, the state Govt. had set up Fish
farmers Development Agency (FFDA) in the following phases:
Phase-I: 1975-76 to 1979-80 5 districts
Phase-II: 1980-81 to 1987-88 17 districts
Phase-III: 1988 onward, 37 districts.
At present all the districts of State have been covered under FFDA. The
FFDA had been launched in each district of the state to facilitate the
following activities for the development fisheries.

(a) Promotion of aquaculture in rural areas.
(b) Integrated fish farming.
(c) Plantation on bundhs
(d) Financial assistance (bank loan and subsidy).
FFDA has played a significant role in promotion of fisheries sector in
the state. The average fish productivity of ponds was only 600 kg/ha/yr
before the initiation of programme, but it was raised upto 2250 kg/ha/yr after
the implementation of the programmes. It also arranges the bank loan along
with subsidy to fishermen for construction and improvement of ponds. In so
far as the marketing of fish is concerned, FFDA has been developing
infrastructural facilities to provide the reasonable price to fishermen. Apart
from this, the exploitation of fishermen by middlemen have also been
stopped due to implementation of FFDA in the state.
The Agro-Economic Research Centre, Allahabad had conducted a
study on “Evaluation of Fish Farmers Development Agencies in U.P.”,
during 1995-96 to know the performance of FFDA in U.P. FFDAs were
selected from different agro-climatic zones of U.P. A sample of 328 units
was drawn from different land holdings in the selected FFDA. The study had
broughtout the following results:
The fish production had increased to 14.17 qtls per/ ha./ per year from
the yield of 3 to 5 qtls per/ha/yr due to application of scientific methods. The
fishermen had also received net return more than Rs. 19124 per ha. Fish
farming had also created employment of about 153 man-days per ha. Hence,
this programme was very beneficial for fishermen. Besides its positive
contribution in the over all development of fishermen, the study has also
found negative response of FFD from selected samples. Such as,
irregularities in Patta allotment of ponds, non cooperation of banks, lack of
technical persons, lack of proper marketing net-work etc. On an over all
basis, the FFDA programme was beneficial in the development of fisheries
in the State. Hence, the state Govt. has given the maximum attention for
proper implementation of FFDA in Tenth Five Year Plan. State Government
has taken initiative to introduce pearl culture in the State along with fish
farming. Demonstration farms have been established for pearl culture. The
concept of integrated fish farming incorporates pearl culture and poultry
farming along with fish farming. Pearl culture has high potential for income
and employment generation.

Table-III-1
Fish Production in U.P.
1991-92 1999-2000 2000-2001
1 Fish Production (000 quintals) 112 1903
(1599.12)
2083
(9.46)
2 Fish in Ponds (in Lakhs)
I. Fishery Department 157.16 193.38
(23.05)
210.25
(8.72)
II. Fish Development Nigam 114.50 276.75
(141.70)
270.00
(-2.44)
3 Private Sector (Fishery Fingers in Lakh)
I. Fishery Department 2599.26 7170.33
(75.86)
8108.90
(3.09)
II. Fish Development Nigam 93.37 669.05
(616.50)
670.36
0.20)
Note: Figures in brackets are percentage change.
The above analysis of major initiatives taken in the State for
agricultural development shows that a number of Programmes and Strategies
were launched for the progress of agricultural sector. These resulted in the
growth crop production and productivity. But it is clear that very attention
has been paid during the planning period for the growth cereal crops,
particularly for wheat, rice and sugarcane. Though livestock sector also
attracted the programmes of the government but some other sectors like
Poultry, Pig Farming, Agro-forestry, Bee-keeping could not get proper
attention.

CHAPTER-IV
Analysis of Constraints to Agricultural Development
in U.P.
This chapter highlights and analyses the constraints operating in
agricultural sector. It deals with the constraints related with land, labour, live
stock, horticulture, crop economy, food sector, irrigation, technology,
extension, dryland development, trade and marketing.
1. Land
Per capita availability and the criterion of quality are the most
important constraint related to land for agricultural development in the state.
The availability of cultivable land has been sharply decreasing year after
year due to increasing population and fast pace of industrialization and
urbanization in the state. The per capita availability of cultivated land was
0.25 hectare in 1951-52 which has come down to 0.10 hectare in 2000-2001.
Out of total reporting area, net sown area accounted for 55.47 per cent in
1951-52 which has gone up to 69.42 per cent in 2000-2001. Despite the
increase in net sown area, the per capita availability of net sown area has
been decreasing. Both have negative correlation.
Table-IV-1
Per Capita of Reporting Area and Net Area Sown During 1951 to 2001
in U.P
Year Total
Population
(lacs)
Reporting area (Hectare) Net Area Sown Hectares
Area Per capita Area Per capita
1950-51 6,32 29258285 0.46 16231147 0.25
1960-61 7,38 29397785 0.40 17289873 0.23
1970-71 8,83 29806179 0.33 17304883 0.19
1980-81 11,09 29739421 0.26 17221367 0.15
1989-90 13,20 29799009 0.18 172232051 0.13
2000-2001 16,61* 24200000 0.14 16800000 0.10
* Except Uttaranchal

The number of holdings less than 1 hectare was 15.87 crores which
accounted for 75.6 per cent of total holdings. Maximum number of
households possesses tiny size of holding, only 9.9 per cent land holdings
were commanded by large farmers in the State (1995-96). There is increase
in the area and number under the small size of holdings and decrease in area
and number under large size of holdings. The average size of holdings is
0.86 ha. It reflects that there is uneven distribution of land among different
categories of the farms. Out of total holdings, marginal and small size of
holdings jointly accounted for 90.10 per cent (less than 2.00 ha.) in 1995-96
against 9.90 per cent of large holdings during the corresponding year. Out of
total area of 17710.4 thousand ha. the marginal and small holdings
accounted for 57.90 per cent against 42.10 per cent of medium and large
holdings. It shows that there is very large imbalance between marginal and
large size of holdings.
Region-wise Distribution of Holding size:
There is a vast variation in the area and population ratio of the five
regions. The Eastern region is the largest region in terms of area and
population followed by Western region as compared to other regions. Hence,
the marginal and small holdings are the maximum in this region. Against
this, the Bundelkhand region had less pressure of population on land as
compared to other regions. Therefore, average size of holdings was higher
than that in other regions. Even then, the marginal as well as small holdings
were ranged between 80 and 90 per cent of total holdings across the regions.
It is also evident from Table-IV-2 that fragmentation of holdings occurred in
each region but was found the maximum in the Eastern region as compared
to Bundelkhand region. The size of holding has been sharply declining in
each region due to high pressure of population on land. (Table-IV-2)
The Ceiling of Holding Act has not been implemented strictly as a
number of disputes are pending in courts. It is noticed that 145003 ha. land
has been declared surplus of which 91.62 per cent was taken into possession.
Out of total surplus land, only 70.14 per cent was distributed to 2.91 lakh
beneficiaries. It shows that the surplus land remaining for distribution is only
14000 hectare. It means that the size of cake to be distributed is very small.
Land-leasing mechanism is also more or less not operative in the state due to
the fear of transfer of ownership. Therefore, the small and marginal holdings
are overburdened to provide livelihood for small and marginal farmers. The
distress selling of land by marginal farmers is still prevalent in some parts of
the state due to the existence of non-viable small size of holdings. The
concentration of land holdings is still maximum among the rich farmers. The
main aim of consolidation of land holdings was to consolidate the scattered
holdings to make them economically viable by the use of modern
techniques. It became very fruitful. But could not remain for long due to
subdivision of holding and the sale operation. The incidence of tenancy has
considerably declined during the preceding four decades.
Since U.P. has 9 agro-climatic zones, therefore, the topography of
land has vast variation. On account of this, sodic land accounted for 9.55 per
cent, followed by 24.91 per cent, 12 per cent and 6.72 per cent in ravines,
riverine land and waterlogged. These jointly accounted for 53.18% of
reporting area of the State which are more or less lying under utilized or
mono-cropped.
The degradation of land, erosion in soils is continuing due to excess
use of water, fertilizers and pesticides. The contract farming in Uttar Pradesh
is also not much prevalent due to very low size of holdings and a very high
attachment of farmers with their land. Since the structure of land has much
variation among the different agro-climatic zones, the common strategy of
agricultural development is not possible for the state as a whole. The ground
water table of the state has been going down fast due to excessive
installation of pumpsets/ tube-wells. This leads to the degradation of fertility
of land. Out of 901 community development blocks of the state, 72 have
gone dark and 184 have become grey. Out of total water-logged and flooded
area of 82,186 ha. in the state the eastern part account for 71.31 per cent.
About 34 per cent of total reporting area of the eastern U.P. remains under
flood and water-logged. The agricultural land in the vicinity of cities are
being grabbed by builders. All these are negative factors for
commercialization agriculture.
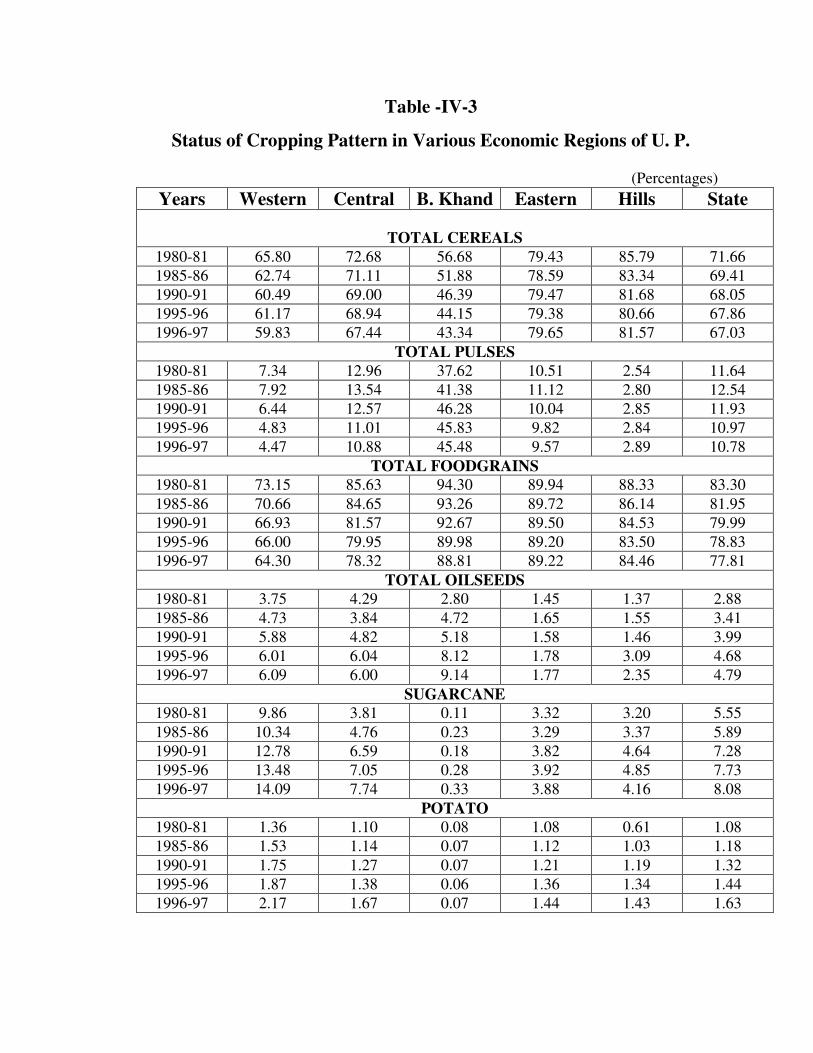
Table -IV-3
Status of Cropping Pattern in Various Economic Regions of U. P.
(Percentages)
Years Western Central B. Khand Eastern Hills State
TOTAL CEREALS
1980-81 65.80 72.68 56.68 79.43 85.79 71.66
1985-86 62.74 71.11 51.88 78.59 83.34 69.41
1990-91 60.49 69.00 46.39 79.47 81.68 68.05
1995-96 61.17 68.94 44.15 79.38 80.66 67.86
1996-97 59.83 67.44 43.34 79.65 81.57 67.03
TOTAL PULSES
1980-81 7.34 12.96 37.62 10.51 2.54 11.64
1985-86 7.92 13.54 41.38 11.12 2.80 12.54
1990-91 6.44 12.57 46.28 10.04 2.85 11.93
1995-96 4.83 11.01 45.83 9.82 2.84 10.97
1996-97 4.47 10.88 45.48 9.57 2.89 10.78
TOTAL FOODGRAINS
1980-81 73.15 85.63 94.30 89.94 88.33 83.30
1985-86 70.66 84.65 93.26 89.72 86.14 81.95
1990-91 66.93 81.57 92.67 89.50 84.53 79.99
1995-96 66.00 79.95 89.98 89.20 83.50 78.83
1996-97 64.30 78.32 88.81 89.22 84.46 77.81
TOTAL OILSEEDS
1980-81 3.75 4.29 2.80 1.45 1.37 2.88
1985-86 4.73 3.84 4.72 1.65 1.55 3.41
1990-91 5.88 4.82 5.18 1.58 1.46 3.99
1995-96 6.01 6.04 8.12 1.78 3.09 4.68
1996-97 6.09 6.00 9.14 1.77 2.35 4.79
SUGARCANE
1980-81 9.86 3.81 0.11 3.32 3.20 5.55
1985-86 10.34 4.76 0.23 3.29 3.37 5.89
1990-91 12.78 6.59 0.18 3.82 4.64 7.28
1995-96 13.48 7.05 0.28 3.92 4.85 7.73
1996-97 14.09 7.74 0.33 3.88 4.16 8.08
POTATO
1980-81 1.36 1.10 0.08 1.08 0.61 1.08
1985-86 1.53 1.14 0.07 1.12 1.03 1.18
1990-91 1.75 1.27 0.07 1.21 1.19 1.32
1995-96 1.87 1.38 0.06 1.36 1.34 1.44
1996-97 2.17 1.67 0.07 1.44 1.43 1.63

Most of the cultivable land of east U.P. is prone to water logging due
to heavy rain. The flood is a common phenomenon in east U.P. due to lack
of proper drainage system and frequent damage of bundha during flood. The
Kharif crops are generally not grown or damaged. Against this,
Bundelkhand is drought prone region of the state, therefore, most of area
could not be utilized for double cropping. The area of Bundelkhand region
along with Vindhyan occupies 13.74 per cent of the reporting area of the
state. Most of the cropped area of the region is mono cropped. The structures
of the soil of the region are highly heterogeneous in nature. The soils are
poor in organic content and also very shallow. A large part of this region is
plateau which is not suitable for cultivation. Net cultivated area of the state
is not properly cultivated till today. The cropping intensity was only 149.34
per cent during 1999-2000. Fertility of soil also differs much from region to
region in the state. The fertility of land has been degrading in western region
of U.P. because of the neglect of various pulses in the cropping patterns. The
rotation of crops in scientific manners is not being adopted in the most parts
of the state. On account of excess use of water, fertilizer and pesticides as
well as neglect of various pulses in cropping pattern is disturbing natural soil
composition. It will lead to a sharp decline in productivity of crops in years
to come.
Apart from the above constraints, the state transferred 18% of its
geographical area against only 5% of its population for the formation of the
new state of ‘Uttaranchal’. Hence, the per capita geographical area and per
capital forest area have been reduced and these are hampering the economic
development of the State.
Table-IV-4
Percentage of Net Area Sown to Operational Area and Cropping
Intensity Region % of Net area sown to operational area Cropping Intensity
1990-91 1997-98 1990-91 1997-98
Hill 5.25 43.90 164.29 161.71
Western 89.60 90.60 `152.83 156.23
Central 80.10 79.80 141.75 148.04
Eastern 84.40 86.00 153.95 150.28
Bundelkhand 80.80 84.70 113.01 117.99
Uttar Pradesh 83.00 83.30 147.29 148.72

Cropping Pattern of Different Regions of Uttar Pradesh:
The crops grown in U.P. are mainly divided into two seasons viz.
Kharif and Rabi. The main kharif crops are paddy, maize, jowar, bajra,
moong, urd, til, groundnut, soyabean; while wheat, barley, gram, pea, lentil,
arhar, mustard, linseed, potato are rabi season crops. The above crops are
generally grown in almost all regions of the state (Table-IV-3). Out of total
gross cropped area, cereals accounted for 67.03 per cent followed by 10.78
per cent, 4.79 per cent, 8.08 per cent and 1.63 per cent for pulses, oilseeds,
sugarcane and potato respectively during 1996-97. It is also reflected from
the table-IV-3 that proportion share of cereals and pulses had declined in
1996-97 as compared to year 1980-81. However, the proportion share of
area under sugarcane and oilseeds had substantially increased in 1996-97
over the year 1980-81.
Table-IV-3 also reveals that proportion share of area under cereals had
sharply come down by 5.97 per cent, 5.24 per cent and 13.34 per cent in
1996-97 over 1980-81in Western, Central and Bundelkhand regions
respectively while it was more or less stagnant in Eastern region during the
corresponding period.
In regard to the area under pulses, it had declined in all the regions
except Bundelkhand region. There was much enhancement in area under
sugarcane in all the regions. The area under oilseeds in Bundelkhand region
increased considerably followed by Western region. It shows that area under
paddy, wheat, maize and coarse grain crops have been reducing in all
regions of the state. It also implies that area under pulses too started
decreasing from year to year in all the regions except Bundelkhand region.
Now the cropping patterns also started shifting from cereals to sugarcane,
potato and horticultural crops in Western, Central and Eastern region. The
coarse grain crops viz. maduva, kakun, kudo, sawan etc. were generally
grown in rainfed areas of different regions during the sixties but therefore,
these were replaced by other competitive crops. However, it is worthy to
note that area under oilseeds has been increasing which is evident from the
fact that more lands are being spared for mustard, groundnut and soyabeen.
Land improvement activities, better water management, expansion of
irrigation network, availability certified seeds diffusion of new technique
etc. are basic factors to take better sequence of cropping pattern across the
regions of the state.

2. Labour
The man and land ratio has a decreasing trend on account of high
pressure of population. Man and land ratio was higher being 8.04 in the state
against 5.95 of the country in 1991. Out of total workers of 519.28 lakh, the
agricultural labours accounted for 42.05 per cent followed by 57.95 per cent
of non-agricultural labours in the state in 2001, against 39.88 per cent and
60.12 per cent respectively in 1981. It shows that pressure of agricultural
workers is more in the state in comparison to the nation. It has been
estimated that additional labour force during Tenth Plan (2002-07) would
increase to 59 lakh with an average annual growth rate of 2.8 percent. The
self employment in the state has decreased in 1999-2000 as compared to
1972-73. While casual workers have an increasing trend during the
corresponding period. They do get job for about 150 days in a year in
agricultural sector. In order to get jobs in slack season, they generally go to
cities. The migration of labourers is the maximum from east U.P. because of
the high pressure on land.
The employment opportunities in agricultural sector have adequately
increased due to increase in the cropping intensity but availability of jobs for
labour has been decreasing on account of high pressure of population on
land. Apart from this, due to the fast mechanization in agriculture the
replacement of human labours has been taking place in few pockets of the
state. Since the illiteracy per cent is higher in the workforce of the target
groups, therefore, they have no alternative but to absorb themselves in the
agricultural activities. The disguised unemployment in agriculture is higher
in East U.P. than that in the western and Bundelkhand regions. There are
minimum opportunities of employment in non-agricultural sector in rural
areas, so the labourers have been migrating from villages to cities in search
of employment. Most of the rural industries of the state are at the verge of
closure due to their high cost and poor quality products as compared to
modern industries. The employment opportunities in non-agricultural sectors
has been decreasing year after year in the state. Therefore the laboures are
getting jobless in villages and are forced to go out side the state.
The Minimum Wages Act is not being properly enforced in the
remote villages of the state. The minimum wag rate of labour was Rs. 50 per
day but the labourers were getting Rs. 30 to 40 per day. The wage rate of
woman and man is equal for doing the agricultural activities but it is yet not
in practice in the villages. The women workers get about 10 per cent less

wages than their male counterparts. The welfare schemes for labours are not
being properly enforced at the ground level. The medical facilities,
compensation on casualties, construction of better houses, insurance scheme,
etc. are not being actively enforced in the agricultural and non agricultural
sectors.
Child labour is still engaged in agricultural and non-agricultural
sectors for lower wage payment. Large number of children belonging to
landless labour families are engaged in non-agricultural sectors on account
of their poverty and poor resource base. Hence, the Child Labour Abolition
Act is not properly enforced in the state.
Sugar industry of the state is the largest agro-based industry providing
maximum employment opportunity. Most of the sugar factories of the state
are sick and labourers are being retrenched from jobs. Hence, the labour of
surplus region of east U.P. are becoming jobless and on account of this the
twin problems of poverty and unemployment are becoming acute.
Most of the workers in the state are employed in unorganized sector.
The share of organized sector employment to total workers was estimated at
only 5 per cent during 55th
round of the NSS. As per the 55th round of NSS,
the total number under-employed were 112 lakh of which 86 per cent
belonged to rural areas. Thus, they required additional work in rural areas.
The programme for self-employment and supplementary wage
employment schemes are not being properly and effectively carried out to
favour the target group. There is no proper arrangement to improve the skill
of labours in the rural areas. A large number of BPL populations are getting
generally seasonal employment. Food for Works Scheme is also getting a
setback due to its improper implementation in the areas of distress.
3. Live Stock
The excessive cattle population in Uttar Pradesh is a major problem for
their better rearing. The area under pasture land is decreasing due to its
conversion into cultivable land. The area under grazing was 0.30 per cent of
reporting area in 1991-92, which has decreased to 0.28 per cent in 1999-
2000. Against this, total population of Live Stock was 4.94 crore in 1961
which has gone upto 7.01 crore in 1993, showing 41.90 per cent increase
over the period. Due to shrinkage of natural pastures, the sheep and goat

keeping has become difficult, hence, the production of wool in the state may
go down in future, while it is a basic raw material of carpet industries, a
popular industry of the state. Per day production of milk per cow and buffalo
has been estimated at about 2.90 Kgs. and 4.20 Kgs. respectively which
were far below the output in the neighbouring states viz, Harayana and
Punjab. The causes of low yield of milk in the state are non-availability of
adequate quantity of quality fodders, poor shelters and maximum number of
deshi-breed. Apart from this, the veterinary services are quite inadequate in
the state.
Table-IV-5
Details of Live Stock in Uttar Pradesh
(Thousands)
Classification 1988 1993 1997
Total Live stock 66075++ 70183 56442*
Cow 28323 25663 20002
Buffaloes 18239 20086 18968
Goats, he, she 11321 13110 11781
Sheeps 2180 2404 1908
Pigs 2489 2905 3181
Total Poultry 9320 10790 12194
Hens 3473 3829 4130
+ -Not taken dogs
++- With 4929 thousands dogs
0 -With 5354 thousands dog
*-With Uttaranchal
Sources: Indian Live Stock Census 1988, 1993 and 1997

Table-IV-6
Population of Live Stock (Region wise)
Region No. of Population of Milch
Cattle Per Hospital
No. of Milch Cattle per
thousand Population
1990-91 1996-97 1989-90 1992-93
Hill 16946 15272 114 108
Western 40751 40157 75 77
Central 38120 40148 62 66
Eastern 34433 34389 52 52
Bundelkhand 51415 50015 99 96
Uttar Pradesh 35244 34420 67 68
Table-IV-7
Availability of Veterinary Hospital Facilities
1991-92 1999-2000 2000-2001
Veterinary Hospital 1823 1758 1758
Livestock Development
Centre
2943 2557 2557
Artificial Inseminations
Centre
2651 2942 3079
Semen Collection Centre 34 25 25
Hybrid Semen Prod. Centre 6 4 4
Veterinary Doctor (000) 17412 20560 17325*
Artificial Insemination
(000) Veterinary
2638 2499 1531
A- Cow 1566 1549 1027
B- Buffalloe 1072 949 504
(000) Vaccination 27215 22661 20392
The Dairy Policy in the state in regard to supply of cross breed cattle
did not get momentum as much as it was desired. Out of total number of
milch cattle (Cows and Buffaloes), of 69.52 lakh, buffaloes constituted
83.23 per cent followed by 16.77 per cent cows in 1993. Of the total number
of cows, only 32.20 per cent were cross breed. It reflects that Artificial

Insemination Programme is not achieving the good success at ground level.
The state has 1758 veterinary hospitals which serve 97,134 villages of the
state. The number of “D” class dispensaries were estimated at 38 per village.
The collection Centre of Semen was only 25 in the state. Out of total number
of milch cattle, only 1,53,100 milch cattle were gone into artificial
insemination in 2000-01. The facility of veterinary hospital and other
essential Centres are inadequate to serve a large number of milch cattle in
the state. There is huge shortage of veterinary doctors and technical staff as
per requirement in the state. Most of the veterinary hospitals situated in rural
areas are in weak conditions because of poor availability of doctors and
medicines. As per the recommendation of National Commission on
Agriculture, 1976 one veterinary hospital is required for 500 animals but one
veterinary hospital is serving 21,000 animals in the state. There is also
imbalance between milch and draught animals in the state. Most of the
households keep the livestock for social and demographic reasons. They are
not much concerned for improvement in milch production of their milch
cattle. More than 70 per cent cattle and buffalo population have been
identified as non-descript type. (Table-IV-7)
The intensive cattle breeding activities are not upto the mark in most
parts of the state. The demand for draught animals in agriculture is
decreasing due to expansion of mechanization. Thus, draught animals are
becoming a burden on the farms. The Dairy Development Programme is
benefiting mostly the resourceful farmers. There is also lack of momentum
in the promotion of feed industries. Transfer of fodders from surplus to
deficit regions is not being activated. Uttar Pradesh Development of Milch
Cattle Council had launched a programme to provide employment to the
unemployed youths but the success was not satisfactory due to rural politics.
Adequate number of bulls and sire has not been kept at progeny centers
because of their higher maintenance costs. The semen is not kept properly in
the stock centres. The Artificial Insemination is not so successful as only 20
per cent of the conception gets success. The calf of the Frozen breed is
useless for the agricultural purposes. Therefore, people do believe in the
natural process than the Artificial Insemination. The outlook carries a weight
also. On account of this, the Dairy Development Programme gets set back in
backward parts of the state. However, western regions are much better than
the eastern part of the state. The production of milk per cow and buffalo is
about four times higher in western region than that of eastern region. Besides
these, artificial insemination facility is less than optimum in east part of the
state. The progress in the development of exotic breed of milch cow,

organization of artificial insemination for changing local breed and
construction of dairy processing plants are quite low in the eastern region
than that in the western region of the state. The dairy is treated as next best
occupation in the western region while it is still being carried on as a
traditional occupation of certain castes in eastern U.P. due to poverty,
illiteracy, small holdings, social binding of woman of higher castes.
Poultry farming is not being done on commercial lines. It is being
practised by some small and marginal farmers. Only a few farmers have
adopted it as a special enterprise. The poultry, pig, and goat farmings are
still in traditional way in the villages. These farming have high risk. These
are also highly prone to diseases and have large number of enemies, so the
better feeding, good veterinary support, food, shelter, better services etc. are
basic requirements for maintaining viable poultry farming in the state.
4. Horticulture
Horticultural sector has handsome share in the total income of the
state and it has been creating ample employment opportunities to the masses
in peak as well off-seasons in a year. U.P. is the major producer of
vegetables and fruits, accounting for 25 per cent and 20 per cent of the total
production of the country respectively. The fruits, vegetables, flowers, spices
and medicinal plants are broadly grown in the state on account of varied
agro-climatic conditions supported by natural resources. U.P. has first and
sixth position in the production of vegetables and fruits respectively among
the states of the country. While productivity and quality of horticultural
crops are much lower and inferior in the state as compared to that in
Maharashtra, Andhra Pradesh, Karnataka, Tamil Nadu and Kerala. Scarcity
of adequate planting material, low use of plastic in horticultural crops,
minimum use of Hi-tech, inadequate infrastructural facilities of marketing
etc. are major constraints in increasing the areas, production and
productivity of different horticultural crops. Apart from this, the quality of
produce of horticultural crops is not in tune with the market demand. The
traditional varieties of fruits, vegetables, flowers, spices are still prevalent.
Since more than 70 per cent growers of horticultural crops are poor, they are
not in a position to use the costlier techniques of the production and disposal
of horticultural produces.
The post harvest infrastructure and marketing facilities are extremely
inadequate in the state. On account of this, more than 20 per cent produce of

fruits and vegetables get rotten and damaged during harvesting season.
Besides this, non-availability of adequate space in cold storages to keep the
vegetables, fruits, flowers etc. during the harvesting periods, the prices go
down to so low that it fails to meet the expenses of harvesting operation. The
producers sell their produces at even throw away prices. The state produces
about 85 lakh tonnes of fruits a year accounting for 18% of the total
production of the country. While the production of vegetable is about 203.68
lakh tonnes in the state but the export of these horticultural produces is
almost zero. U.P. ranked first and second in the production of potato and
mango respectively among the states of the country during 2001-02. Inspite
of such huge production of potato and fruits in the state, the export was very
negligible. Out of the total production of mango of 31.62 lakh tonnes during
2001-02, only 0.37 per cent was exported It shows that quality of mango and
potato was not at par with the standard of consumers of foreign countries.
The production of potato and fruits of the state are sub standard as compared
to that in the states of Punjab, Harayana, Maharasthra, Andhra Pradesh,
Tamil Nadu because of minimum application of Hi-tech in production and
unscientific use of post harvest technology.
Infrastructural facilities for export of the horticultural produces from
the state are not adequate. Private as well as public investment to promote
production of horticultural crops and develop marketing facilities are not
adequate as compared to other potential states of the country. The
association of growers are too weak in the state to arrange inputs and
marketing of their products. The major constraints of horticultural
development in the state are, non-availability of sufficient quantity of
planting materials, high price of improved seed, lack of sufficient marketing
facilities in producing areas and low adoption of post harvest techniques.
Beside these, the quality oriented production of horticultural crops is not
found at almost all the farms of the state in accordance with demand of
foreign consumers. There are 462 food processing units in the state but they
are not adopting the methods and procedures to maintain the high qualities
of produces at international norm and standard. There is also shortage of
training centres to guide the growers to produce standard quality in the state
as other states are adopting. The analysis reveals that there is surplus
production of horticultural crops in the state but it lacks better marketing
facility.

5. Food Sector
Availability of food is the basic requirement of the society. It is the
responsibility of agricultural sector as well as markets and Govt. to provide
food to all. Very often market fail in providing food security to the
vulnerable sections of the society. This type of market failure was an
important reason of the recurring famines in the country during 1870 and
1943. This necessitated intervention of the Govt. in the food supply process.
In Uttar Pradesh the PDS, RPDS, TPDS, Annapurna Yojana and Antyodaya
Anna Yojana are in operation. It has created a comfortable situation in
providing cereals to the masses. But there is acute shortage of per capita
availability of pulses particularly to the poor. Nutritional security is yet to be
achieved. Mal-nutrition is common in families living below poverty line.
Though the milk and inland fish production have substantially increased in
the state but lack of purchasing power is creating hindrance in obtaining
nutritional security particularly by the poor.
Table-IV-9
Region-wise Per Capita availability of Foodgrains and Pulses
Regions Foodgrains (Kg) Pulses (gms)
1990-91 1997-98 1990-91 1997-98
Hill 253.92 216.80 11.12 2.75
Western 270.90 280.62 21.38 5.66
Central 251.14 247.84 21.38 31.72
Eastern 240.14 238.35 15.36 11.23
Bundelkhand 332.04 320.39 134.29 114.75
Uttar Pradesh 258.04 258.06 20.14 14.26
Region-wise Per Capita Availability of Foodgrains and Pulses:
Table-IV-9 reveals that per capita availability of food grains was the
highest in western region during 1997-98 while in other regions, it was
below the state average. Except western region, the per capita availability of
food grains has come down during 1997-98 over 1990-91. As regards to per
capita availability of pulses, it was the highest being 114 grams in
Bundelkhand region while it was the lowest in the Eastern region. There was

sharp decline in per capita availability of pulses during 1997-98 across the
regions over the year 1990-91.
Region-wise Per Capita Availability of Foodgrains and Pulses:
The state is now fully sufficient in cereal production. There is no
shortage of wheat and paddy for daily consumption of 16 crore population of
the state. Against this, there is a huge shortage of pulses. Table-IV-9 shows
that per capita availability of food grains was quite sufficient in 1990-91 as
well as 1997-98 across the regions. However, availability of pulses has come
down during 1997-98 as compared to 1990-91 across the regions. It is a
great paradox for Bundelkhand region known as bowl of pulses that the
availability of pulses has come down in 1997-98 as compared to 1990-91.
6. Irrigation
The area under irrigation has been constantly increasing. Since First
Five Year Plan adequate funds have been allocated for the expansion of
canal network and installation of public and private tube-wells / pump-sets.
Huge subsidy has also been provided to target groups for installation of
pump-sets. Hence, the growth of irrigated area have been positive during
different Five Year Plans. The length of canal was 45,810 kms in 1968-69
which has got expanded to 75,147 kms in 1997-98. The number of tube-
wells / pump-sets was 225 thousand in 1968-69 which has drastically
increased to 3,682 thousand in 1999-2000, showing 1,536 per cent increase
over the period. The area irrigated was 6,580 thousand hectares in 1968-69
which has increased to 17,575 thousand hectares in 1999-2000, thereby
showing 167.11 percent increase over the period. Out of total area irrigated
by different sources, state tube-wells/pumpsets accounted for 69.29 per cent
followed by 30.07 per cent, 4.50 per cent, 3.00 per cent by canals, well and
others respectively in 1991 which became 69.76 per cent, 23.79 per cent,
3.55 per cent, 1.75 percentages respectively in 1999-2000. It reflects that the
traditional sources of irrigation viz. ponds, tanks, wells have been neglected
which were the assured sources of irrigation during drought period and were
also fruitful in maintaining water table. Most of the area under ponds, tanks
and lakes have been converted into cultivable land. While most of wells
became non-functional supply of water in canals is not equitable. Lands
situated at the tail of canals do not receive sufficient water. Against this,
farmers use excess water where the areas are situated near the head of
canals. It shows that there was no proper hydrological linkage between

surface water and ground water resources. Most of distributaries of canals
got silted due to lack of regular cleaning of the silt. The channels connected
with canals are mostly damaged. The canal charge being a flat rate, the
farmers tend to use excess water in crops, causing water logging and salinity
in most part of the state. Inefficient management of supply of water and over
use of water in crops are major concern of the state. Most of canals of Uttar
Pradesh face the problem of financial assistance adequate enough to repair
the embankment and clean the tracks. The numbers of pump-sets and tube-
wells have tremendously increased but these are not economical as
compared to canal irrigation.
Table-IV-10
Different Sources of Irrigated Area and its Percentages
( Area in 000 hectares)
Source 1950-51 1970-71 1991-92 1998-99 1999-2000
Net Irrigated Area Canal 18.47
(38.22)
24.97
(5.68)
31.02
(28.85)
30.07
(24.35)
29.88
(23.77)
Tubewell 2.76
(5.71)
23.30
(5.30)
67.90
(63.16)
86.16
(69.77)
87.00
(69.76)
Wells 19.05
(39.42)
17.03
(3.87)
4.50
(4.18)
4.39
(3.55)
4.82
(3.87)
Tank, Lake and Ponds 371.00
(84.42)
0.86
(0.81)
0.95
(0.77)
0.82
(0.65)
Others 8.05
(16.65)
3.15
(0.73)
3.23
(3.00)
1.92
(1.56)
2.18
(1.75)
Total 48.33
(100.00)
439.45
(100.00)
107.51
(100.00)
123.49
(100.00)
12470
(100.00)
Gross irrigated Area 5209 8362 14943 17146 17575
With Private and Govt. Tubewell.
Source: Agriculture Director, U.P. & Agriculture Statistics of U.P. for 50-51 or 70.771.
Due to irregular supply of electricity and hike in price of diesel, the
tube-wells / pump-sets are not functioning efficiently and effectively. The
charge of a pump-set is about Rs. 50 per hour which is higher than the
charge of canal. The percentage of gross irrigated area to gross cropped area
and percentage of net irrigated area to net area sown were 68.00 and 65.90
respectively which were much lower than those in Punjab and Haryana
states. There is no dearth and scarcity of ground and surface water in most
parts of the state except Bundelkhand but they have not been fully utilized.

The exploitation of ground water by pump-sets has been in full swing in the
state as compared to surface water. Area irrigated by Pump-sets / Tube-wells
has increased to 8,700 thousand hectares in 1999-2000 from the irrigated
area of 6,790 thousand hectares in 1991-92 showing 21.95 per cent increase
over the period. Hence, it is the irony of fate that there is over exploitation of
ground water which would create serious problems in future. Since the
quality of canal water is inferior to water from pump-sets, hence the farmers
prefer to irrigate the crops by the pump-sets. Therefore, there is vast
variation in using the surface water and ground water in the crops in the
state. The indiscriminate use of ground water is responsible for decline in the
ground water table in western region of the state.
The number of state tube-wells was 7,844 in 1996 which has
increased to 28,551 in 2000-01, showing 264 per cent increase over the
period, but most of state tube-wells are not working to their capacity due to
power crisis. Besides this, 5,69,609 energized tube-wells of private owners
are also not working to their capacity due to erratic supply of electricity in
villages. Irregular supply of water in canals, erratic supply of electricity and
frequent hike in price of diesel are major cause of concern in the adoption of
new technique in the production of crops.
Region-wise and Source-wise Irrigated Area:
More than 31 per cent of net area sown is still un-irrigated in the state.
Across the regions, 62.70 per cent net area sown of Bundelkhand region is
still rainfed. Against this, 87 per cent of net area sown of the western region
followed by 86 per cent of the central region were fully irrigated during
1997-98. It is evident from table-IV-11 that the irrigation network has also
been expanding in Bundelkhand region. The percentage of irrigated are to
net area sown has risen to 68.66 per cent in 1997-98 from 60.90 per cent in
1990-91 across the regions. However, the pace of enhancement (in
percentage) of irrigated area the net area sown relatively higher in
Bundelkhand region than the other region of the state during the same
period. Table-IV-12 indicates that the proportion of share of irrigated area
by canals and state tube-wells has been decreasing year by year in all
regions. Against this, the proportion share of net irrigated area to net area
sown by private tube-wells has been increasing year by year across the
regions. It reflects that Bundelkhand region requires special attention for
expansion of irrigation network. The canal and tube-wells require huge
investment within the region due to its geographic situation and low strata of

ground water. Therefore the conservation of rain water by different methods
would be more economical to take more and more area under irrigation in
years to come.
7. Technology and Extension
Since the introduction of new strategy in agriculture, the Govt. and
public institutions have been promoting new techniques for crop production
through promotion of awareness by training and visit (T&V), demonstration,
distribution of inputs, organising the farmers’ fairs, etc. ‘From lab to field
approach,’ through various means, has been getting maximum attention
since the introduction of green revolution. Technology dissemination to the
farmers are confined to resource farming. The flow of technology is not
getting desired momentum due to the increase in the prices of inputs. The
approach of T & V was quite encouraging to persuade the farmers to adopt
new techniques but it could not be carried out after non- availability of funds
from World Bank. Since technological changes in agriculture are frequently
occurring, hence the participatory approach should be initiated through
investment in research and extension. The availability of funds for
development, research and extension is not enough to do these activities in a
big way at ground level. There is also lack of good coordination between the
scientists of SAUs and State Govt. officials. The strength of extension staff
is quite low against the requirement of the state. On account of this, transfer
of technology is not properly implemented at farms.
It is also unfortunate that state has only 29 Krishi Vigyan Kendras
(KVK) to serve 72 districts. For proper dissemination of upto-date
techniques of agriculture, the state requires at least 42 KVKs. The financial
position of existing KVKs is also not so healthy to diffuse the latest
technology effectively and efficiently at ground level. The KVKs also do not
cater to the local need. The multiplication of seed farms is not being carried
out efficiently due to paucity of funds. The seed replacement ratio is about
12 per cent which is very low as compared to the required ratio of 20 per
cent.
The consumption of Nitrogen (N), Phosphorous (P) and Potash (K)
have increased manifold in Uttar Pradesh. Total consumption of NPK have
constantly increasing trend since the advent of green revolution. It increased
from 15.12 Kgs per ha. in 1968-69 to 118.17 Kgs per ha. in 1998-99 with
contribution of NPK being 93.57 Kgs 21.31Kgs and 3.29 Kgs per ha.

respectively. It shows that consumption of NPK is disproportionate against
the recommended proportion (4:2:1) for NPK. It destroys the structure and
texture of the soil. The indiscriminate use of fertilizers and pesticides are
also giving adverse impact on environment and natural resources. The
reasons for excess use of fertilizers and pesticides were lack of awareness
among the farmers about the benefits of biotic activities and importance for
growing leguminous crops in the fields. Appropriate post harvest technology
is not being properly communicated from top to bottom by the extension
agencies. Besides this, non-adoption of appropriate post harvest technology,
the quality of foodgrains, vegetables, fruits, etc. goes down as per standard
of market demand. Since the use of machine for different operation in crop
production, high replacement of human labours are higher in agricultural
sector than that of other sectors. The energy consumption in agricultural
sector has been increasing year by year. It is very unfortunate that local
resources are not being taken into account in the formation of new
technique. Apart from this, the new techniques are much costlier so that
large segment of farmers are not taking much participation in the adoption of
technology.
Extension is closely related to technology creation. It ensures access
of farmers to the technology development. Recognizing the necessity and
role of extension a complete programme known as "National Extension
Service” was launched in the county in 1953. Lab to Land Programme is
also an extension programme for diffusion of technology to the farms. It has
been mentioned in the documents of Govt. of India that during last decades,
quality research has declined in India in the field of agriculture. The Tenth
Plan document (Approach Paper to the Tenth Five Year Plan) clearly states
that extension programme has collapsed in the country.
During the period of the study, we found that the Govt. extension
department is busy in popularizing the new technologies related to
mechanization, irrigation, fertilizers, and pesticides, seeds sowing, storages
and post harvest technology to prevent the produce losses and to add the
value of agricultural produce. Simultaneously corporate sector has also come
up in extension work for their own produce particularly in the areas of new
seed popularization, pesticides popularization, agricultural machineries and
food processing. Now it can be said that the efforts of corporate sector is
creating a challenge before extension programme of the Govt. Hence, the
clash between socially desired approach and profit oriented approach
deserves attention. Corporate sector has profit motive, through it should

have it with a social face, even then the profit motive dominates in the
working of corporate extension service. We found in the villages that small
and marginal farmers as well as farmers of the less developed regions of the
state, particularly Bundelkhand and Vindhan areas, do not get access to new
technologies related to agriculture.
Per Hectare Distribution of Fertilizers in Different Regions:
There was variation in the level of adoption of inputs among the
regions. The use of fertilizers in crops has gained momentum since the
inception of green revolution. The use of fertilizers is well associated with
the availability of irrigation sources. Distribution of fertilizers in different
regions had much variation between 1990-91 and 1997-98. Distribution of
fertilizers was maximum in the western region while it was the lowest in the
Bundelkhand region during both the periods. It is also noticed from the
table-IV-13 that the distribution of nitrogen phosphorous and potash was
quite uneven among the regions. It shows that the use of nitrogen in crops
was much more than the recommended doses while potash was being used
in less quantity than the prescribed doses. None of the farmers of different
regions was using balanced dose of fertilizers in his crops. Low consumption
of fertilizers in Bundelkhand region was due to non-availability of irrigation
facilities and maximum area being under pulse crops.
Table-IV-13
Per Hectare Distribution of Fertilizer
Region 1990-1991 1997-1998
Nitrogen Phos. Potash Nitrogen Phos. Potash
Hill 53.61 16.25 5.00 66.16 16.49 6.71
Western 83.75 20.71 3.81 115.39 25.60 4.18
Central 62.40 15.55 3.52 81.24 19.80 2.77
Eastern 63.61 90.44 4.61 18.00 23.22 3.63
Bundelkhand 16.93 9.92 0.24 20.68 10.14 0.06
Uttar Pradesh 66.35 17.82 3.78 91.69 22.28 3.52

8. Dry land Agriculture
Since the scope for expanding the area under irrigation is limited
hence, sincere efforts should be made to develop the dry land agriculture.
Research and innovation of new varieties suitable for dry areas are essential.
The semi dry land is mostly confined to Bundelkhand region of Uttar
Pradesh which accounted for 9.94 per cent of geographical area. Millets,
oilseeds and pulses are main crops in dry land areas. In this region, new
technology of agriculture has not been carried out in a big way because of
non-availability of adequate water. The farmers are poor and subsist on
agriculture. The yield of millets, pulses and oilseeds are invariably lower.
"Technology Mission" is also not so effective in the dry land areas because
of low adoption of improved biological and mechanical technology in the
oilseeds, pulses and millets. On account of this, the dry land areas of the
state are lagging far behind the well endowed western and central regions of
the state. There is high risk and uncertainty in the production of crops in the
region. Beside these, the infrastructural facilities are not developed.
Illiteracy is also the highest (50.04 per cent) as compared to 47.79 per cent
of the state in 1991. The size of land holding is bigger in the this region but
the agriculture is not performing better due to constraints in technology
transfer coupled with scarcity of water.
The National Watershed Development Programme was in operation in
32 districts of the state, out of which 7 belonged to Bendulkhand region. The
main objective of this programme was to conserve moisture in the soil by the
development of water sheds and provide the financial help for better
cultivation of crops and rearing livestock. The maximum attention has also
been paid to guide the farmers to adopt mixed farming, cultivation of
horticultural crops and agro forestry. The jawar, bajra, maize and other
coarse grains are main crops of dry land. The per hectare yield was 8.94 qtls,
13.95 qtls, 14.49 qtls of bajra, jowar and maize respectively in 1999-2000
which are lower as compared to crops grown in the rainfed areas of Uttar
Pradesh. The millet crops fetch very lower price than other crops. The
demand of coarse grains in the market has decreased sharply. The new
technologies for the coarse crops have not received any preparation from the
agricultural scientists at par with wheat and paddy. Traditional way of
cultivation and use of old varieties are still prevalent in dry land area of the
state. The processing method of coarse grains is also not modern to improve
its quality to get higher prices.

The livestock in dry land are found mostly Deshi breeds. The
production of milk per milch cattle is very low i.e. 4 kgs. as compared to 8
kgs in the endowed regions of the state. The rearing of sheep and goat in dry
land is also very problematic because of diversion of the non-agricultural
land into cultivable land. The quality of wool is also not upto the standard
because of traditional method of cutting and processing of wool. The
technology transfer for agriculture and livestock is not adequate because the
shortage of strength of technical staff at the ground level. The veterinary
services are also very poor because technical staffs do not want to remain in
dry prone districts of the state. The infrastructural facilities viz., road,
electricity, schools, banks, etc. are extremely poor as compared to western
part of the state. The consolidation of land is not so effective due to
geographical situation of land, the construction of water sheds in dry land
region generally lack proper planning and vision. Hence, the return on huge
investment on watersheds was not optimal. The existing rate of return of
watersheds is much less as compared to cost involved. The state Govt. pays
Rs. 50 per feet for making terraces but it requires Rs. 500 per feet for terrace
cultivation. Most of the watersheds are not operational because of the want
of repairing. The cultivation of water intensive crops such as paddy and
sugarcane is not being avoided in the irrigated area.
9. Marketing and Trade
The marketing is also one of the major constraints of agricultural
development in the state. The production of foodgrains, vegetables and fruits
has increased mainfold since the advent of green revolution and
implementation of hi-tech in horticulture. Besides, the products of live stock
have also been increasing year by year since the introduction of programmes
and policies of animal husbandry. Now the state has generated surplus in
food grains, vegetables, fruits and products of live stock. But the farmers are
still denied their due share of consumer's rupee because of imperfection of
marketing functionaries. Despite a number of Acts, Regulations, Bye-laws
enforced in markets, the malpractices are still prevalent in even regulated
markets. The marketing of agricultural produce is still under the command
of private traders. Out of total marketed surplus, more than 80% trading is
being performed by private agencies in the state.
The Minimum Support Price is still not much operative in most parts
of the state. Food Corporation of India, State Warehousing Corporation,
Central Warehousing, Agro-Industries Corporation and other government

agencies are white elephants, as only 7.74 per cent and 2.60 per cent of total
production of paddy and wheat respectively were procured by these agencies
during 1996-97. Among the agencies involved in the procurement of paddy,
rice and wheat, U.P. Cooperative Federation was found more active having
procured 36.57 per cent of total trading of wheat during 1995-96 followed
by 20.14 per cent, 14.97 per cent, 13.32 per cent 9.34 per cent and 5.66 per
cent in case of State Govt., U.P. State Agro-Industries and other corporations
U.P. State Food Essential Commodities and FCI respectively. The capacity
of warehouses, godowns, cold storages and other storing devices are not
being expanded at par with production of agricultural and horticultural
crops. The total number of storages were 225 in 1995-96 of which state
warehousing corporation accounted for 44.44 per cent followed by 32.89 per
cent and 22.67 per cent of FCI and CWC respectively. These storages jointly
have the capacity of 23.51 lakh tonnes against the total production of 3.62
crore tonnes. It shows that out of total production of cereals only 6.50 per
cent could be stored in different storages in the state. On account of the lack
of proper own storing capacity and non-availability in Govt. storages, the
farmers are bound to sell their maximum share of marketed surplus just after
threshing operation and get the lowest price. More than 20 per cent of total
marketed surplus of foodgrains goes waste in each year due to lack of
adequate storing facility which could have met the consumption needs of
millions of people in the country. On account of ineffective intervention of
U.P. Govt. the dominance of private traders are persisting in the markets.
Large and medium farmers prefer to sell their produce in the regulated
markets having good transportation facilities while small and marginal
farmers sell their produces to hats (Village) or at doors to avoid the
botheration and difficulties of the markets. Besides this, the small and
marginal farmers do not get satisfactory response from the govt. agencies
during trading as compared to private traders, so they prefer to sell their
produce at lower prices to private traders. Underweight of quantity of all
commodities is still prevalent in the local markets as well as regulated
markets because of the lack of proper supervision of marketing staff. It is
noticed that 2 to 5kg per qtl is taken out from marketed quantity by traders in
addition to wrong weight of quantity in the markets. The farmers are
harassed in the regulated markets by saying that produce is low in quality
and has much moisture than the prescribed norms. The payment is also not
so prompt in case of Govt. agencies because more than 20 percent of the sale
amount is given after a week. The institutional credit and pledge financing
are also not properly availed by the farmers.

Since the number of regulated markets is only 265 and more than
83.74 per cent are un-regulated in the state, hence a large number of private
traders do their marketing activities outside regulated markets. The density
of regulated market in U.P. is only 38.92 per thousand of gross cropped area
which are absolutely inadequate to provide the better marketing facilities to
the farmers. Apart from this, one regulated market serves 151 villages. It
shows that a regulated market is probably established in a radius of 14 kms
against the prescribed norm of within a radius of 5 kms. On account of
establishment of regulated markets on long distance, the access to all the
produce is not possible at present. Auction method is not honestly adopted
even in regulated markets. Overwhelming majority of farmers of the state
sell their produce in un-regulated markets. The price signal is not also well
developed. Most farmers are not adequately aware of functioning of
regulated markets due to high illiteracy among them. The above analysis
reflects that regulated markets have not been playing a significant role to
minimize the unregulated markets and private traders. The size and structure
of regulated markets are limited as compared to production and size of the
state. The storage and marketing of agricultural produce including
horticultural produce are facing actuate problems because of inadequate
facility available in the storages particularly for small and marginal farmers.
Most of the processing units, viz., rice mills, flour mills, pulse mills
and spellers have been established in the cities and are controlled by private
traders. Therefore, the farmers do not receive the due share of value addition
price of commodities. Inspite of this, more than 80 per cent of vegetable
production are sold as fresh products. Therefore, vegetable growers,
orchardists get very low prices in the market specially in glut season. The
processing units have been mostly established in private sectors, hence they
have monopoly in fixation of prices of fresh products of vegetables and
fruits.
The capacity and structure of processing units are very limited in
relation to production of vegetables and fruits. The processing units are also
not being established in private sector because of non-conducive and
terrifying attitude of political leaders of the state. The liberalization of
economy of the state is not getting the boost due to the lack of vision for
globalization. Irregular availability of electricity, higher input costs and lack
of devotion among the workers towards the works etc. are major hurdle

discourage the private investors to establish processing units in potential
areas of the state.
Sugarcane is the main cash crop of the state. Million of population of
the state directly or indirectly depend on the production of sugarcane. The
state has 101 sugar mills at present of which 52 are in private sector
followed by 22 which are under the control of State Govt. and 27 are in
cooperative sectors. Most sugar factories are sick. Few of them have been
closed and rests are running in heavy losses. On account of this, crushing
capacity of running sugar factories are very low as compared to the
production. At present, the existing sugarcane factories are now in a position
to crush about only 30 per cent of the total production of sugarcane in the
state. There is tug of war between factory owners and state Govt. in the
fixation of price of sugarcane. The suppliers of sugarcane have not been
getting their payment in due time from factories. On account of lack of
proper marketing of sugarcane, the area of sugarcane has been reducing
from year to year which gives a wrong signal in so far as the sound
economy of the state in years to come is concerned.
10. Trade
Trade is considered as the engine of growth. Trade enhances the
income of the farmers. After independence for a long period, trade in
agriculture was protected and restricted. Liberalization has opened vistas for
the expansion of agricultural trade. De-canalization is also taking place in
agricultural trade. Establishment of Agricultural Economy Zones is an
important policy shift to boost the agricultural trade. In spite of globalization
and liberalization in agricultural trade, there are some very strong
constraints, for example, out of total fruits trade, only 0.37 per cent was
exported. Similarly, the vegetables and cereals trade are also negligible.
Due to lack of knowledge among the farmers about the sanitary
measures of the international standard, lack of quality produce in cereals,
fruits and vegetables and lack of trade related infrastructural facilities such
as export houses, venture capital, packing and transportation and lack of
awareness among the farmers at gross root level about the foreign markets
and export mechanism, the, farmers hesitate to change the crop composition
in favour of trade dominated agricultural produce.

CHAPTER-V
Agricultural Policy for Uttar Pradesh
The chapter deals with the SWOT analysis and Policy Matrix based
on hard empirical data and interviews who have lone standing knowledge in
the field of agriculture and related activities. It also deals some points for the
Agricultural Policy of the State in view of the earlier discussions and taking
into account strength, weakness, opportunities and threats of the agricultural
economy of U.P. There was lack of any thoughtful Agricultural Policy for
the State till independence. This type of situation prevailed in the whole
country also. The British rule in India was characterised by the lack of the
deliberate State policy in any of the economic sectors of the country. As the
result of the recommendations of the Famine Commission (1901) and the
Irrigation Commission (1903) scientific research and experimentation was
started by the Government of Lord Curzon to whose far-sighted vision much
of the progress of the Indian agriculture must be attributed. It was realised
that the initiative to solve the agricultural problems in India has to be taken
mostly by the government because the bulk of agriculturists did not have
sufficient capital, known-how and interest to take the lead. Departments of
agriculture were established in various provinces between 1875 and 1905.
Their functions were clearly defined by the Govt. of India which consisted
largely of collection of statistical and economic data. Dr. J. A. Voelcker, a
distinguished agricultural chemist was brought to India in 1889 to conduct
and enquiry into the character of the soil and agricultural conditions. This is
regarded as the first serious step to frame a policy of agricultural research
suited to the conditions of India.
The distinguished visitor was of the opinion that the methods followed
by the Indian agriculturist were not as backward as they were believed to be.
The existence of the diversity of agricultural practices indifferent parts of the
country could be removed if there is spread of general and agricultural
education, extension of canals and other means of the irrigation, and
extension of experiments/ research aided by chemical science in reference to
new crops, methods of cultivation, manures etc. The all India Board of
Agriculture was setup in 1905 at Pussa in Darbhanga district of Bihar for
research and higher education. All together the years from 1905 to 1919
were marked by steady growth in agriculture research and education. After
the reforms of 1999 agriculture became a transferred subject and
responsibility for improvement in agriculture including veterinary and co-
operation was shifted to the provinces. Subjects of Research, Irrigation and
Forestry however, remained with the Government of India.
A Royal Commission was appointed in 1926 to examiner and report
on the conditions of agricultural and rural economy in India to make
recommendations for the improvement of agriculture and the production of
the welfare and prosperity of the rural population. The Commission issued a
comprehensive report in 1928 covering a very wide field. The aim of the
suggestions and recommendations made by the Commission has been to
bring about greater efficiency throughout the whole field of agricultural
production and to render the business of farming more profitable to
cultivator. Their conviction was “that no substantial improvement in
agriculture can be effected unless the cultivator has the will to achieve a
better standard of living and the capacity, in terms of mental equipment and
of physical health, to take advantages of the opportunities which science,
wise laws and good administration may place at his disposal. Of all the
factors making for prosperous agriculture, by far the most important is the
outlook of the peasant himself.”
The recommendations of the Commission were comprehensive in
nature including subjects like sub-division and fragmentation of holdings,
improvement of livestock, irrigation, marketing and rural reconstruction.
Unfortunately before much could be achieved by implementing the
Commission’s recommendations, the Great Economic Depression came.
Owing to the restrictive budgetary policy of the Government to combat the
effects of the Depression, most of the recommendations of the Royal
Commission of developmental nature were not acted upon. A significant and
immediate outcome was the establishment of Imperial (now Indian) Council
of Agricultural Research in 1929. The Depression affected directly India’s
market for raw and manufactured jute and indirectly the demand for other
Indian exports.
The World War II was in many ways a turning point for agricultural
economy of the country. One notable development of the war years was the
sharp rise in prices. Commercial crops like jute, cotton and groud-nut lost
their market and demand for foodgrains increased considerably, pushing up
prices. Government sought to meet the situation by restricting area under
cash crops and encouraging diversion to food crops. Inview of the steadily

deteriorating food situation in the wake of Burmese occupation by Japanese
forces in 1942, the Government convened a Food Production Conference in
April, 1942 which was attended by the representatives of the Provinces and
States. As suggested by the Conference and to achieve immediate increase in
agricultural production the GMF campaign was initiated in 1943 and loans
and grants were given by the centre to the States to enable them to increase
production. The aim of policy on the diversion of area from cash crops,
mainly short staple cotton to food crops, extension of cultivation to current
fallows and culturable wastes intensive cultivation, was given a new
perspective.
The Bengal Famine of 1943 in which 15 lakh people perished due to
their inability to by food at high prices was undoubtedly the worst of the
century. The Famine Inquiry Commission appointed in July, 1944 under the
Chairmanship of Sir John Woodhead, after a very careful examination of all
relevant factors came to the view that the impact of the tragedy could have
been greatly reduced if not avoided, by more efficient and vigilant
administration. In their Final Report the FIC urged the Government to
recognise the ultimate responsibility in making food available to all. They
ruled out the policy of laissez faire on the matter of food supply and the
distribution as inexpedient and suggested that all the resources of the
Government must be brought to bear in achieving an equitable distribution.
The recommendations of the Food Production Conference and the Famine
Inquiry Commission provided the initial frame for a national food policy
which was modified from time to time according to exigencies of the
situation.
A major development of this period was the first ever elaboration of
an all India policy on agriculture. The reports of many of the sub-committees
appointed by the policy committee on Agriculture, Forestry and Fisheries
helped to shape future policy in the respective fields. Mention might be
made her of the study undertaken by Dr. W. Burns on Technological
Possibilities of Agricultural Development in India based on existing farm
situation and available indications of production possibilities from known
technological improvements. During the period 1939-1947 Government took
majors not only to meet the immediate food storage but also to make
permanent improvements in agriculture. Comments the National
Commission on Agriculture that “In response to the challenging situation in
production and distribution of foodgrains. The rudiments of a national
production policy as also food policy began to emerge.”

Different agro-climatic zone, rich soil and water resources, rich bio-
diversity, strong irrigation facilities various plantation and fruit crops are the
major strength of State. On the other hand a large number of small and
marginal holdings, a substantial area under ravines and waterlogged lack of
storage and processing facilities, non-sufficient agricultural credit, frequent
recurrence of flood and droughts, high unemployment and under
employment, disproportionate use of NPK, neglect of coarse grain crops and
pulses, poor quality of livestock, low diversification and inadequate
marketing facilities and defective marketing system are the major weakness
of the agriculture sector of the State. Price spread is some times very wide
and puts the farmers in miserable condition. Very after farmers do not get
even minimum support price fixed by the State. It will, therefore, be suitable
to frame a suitable agricultural policy for the State keeping in view the
following dimension:
1. The State have too many people not too much land. It is therefore,
necessary to promote intensive cropping pattern in the State.
2. Excessive and disproportionate use of chemical fertilizers in destroying
the inherent natural fertility of the soil. It is therefore necessary to
popularize the extension of coarse cereals which have, after processing,
high value and nutrient potential for the soil. Thus a region specific
suitable cropping pattern is to be evolve and popularize.
3. Price Policy is the most important elements of agricultural policy. It can
eliminate the necessary of farming community. It is therefore necessary
to announce minimum support price for various crops and a suitable
mechanism for sale of the agricultural produce to the cultivators.
4. Demand led production is the requirement of the time. Nature and
preferences of the consumer demands is changing, demand for processed
food is increasing as income of the consumers is increasing. It is
therefore necessary to place high priority for diversification of
agriculture.
5. Most of the farmers of the State are Small and Marginal with poor
resource base, credit policy should be framed in such a way that farmers
may get sufficient credit on demand.
6. Globalization is now not a option but a reality. The State can earn foreign
exchange by export of rich agricultural produce. It requires development
of proper at post infrastructure and supporting services for which the
State is lagging behind.
7. Agricultural labourers are bond to survive in acute poverty, very often
they do not receive minimum wages. They remain unemployed during a

substantial period of the year. Social security is also nominal for them.
The Agricultural Policy should lake care of the agricultural labour and
effective network of social security should be evolved for them.
8. Sustainability of development should be maintained in all the economic
sectors. It is responsibility of the present generation to transfer a fertile
and rich land to the coming generation. It is therefore necessary to
regulate indiscriminate use of water soil and other free gifts of nature. An
strategy of converting fertilizer and water into grain should be checked.
9. Marketing and storage occupy a crucial role in the development of
agriculture and supplying the agricultural to the consumers through out
the year. It is therefore necessary to strength the regulated market
network throughout the State.
10. Uttaranchal has a very rich potential for fruits, flowers, aromatic and
medicinal plants. A thoughtful strategy for development of these crops
can enhance the income and employment among the farming community
of the State.
These observations about the agricultural policy of the State are based on
region wise SWOT analysis. The SWOT analysis for the State as a whole
and a region wise and policy matrix for the agricultural policy of the State is
given below.


Policy Matrix
Sl.
No.
Sub Sector Area of Concern Development
Strategy Initiatives Required
1. Crop
Economy
Target to achieve growth
rate of 5.1% per annum
in food grains
I. Expansion of area under HYV. I. There should be a proper linkage
between different Departments of
Agriculture.
II. Popularization of seed
treatment. Expansion of seed
replacement rate.
II. The extension net-work should be
re-strengthened. The Seed and
Farms Division should take full
responsibility to supply Certified
Seeds to the farmers.
III. Motivate the farmers for
balanced use of fertilizer.
III. The prices of seed are required to
be lowered.
IV. Guidance to the farmers for
normal use of water.
IV. Timely availability of fertilizers
and pesticides at reasonable
prices.
V. Adoption of plant protection
measures.
V. Flow of water in canals and
supply of electricity should be
ensured.

VI. Maximum area lying under
unproductive uses needs be
brought under plough.
VI. Encouragement for scientific
cultivation of crops.
VII. Prompt delivery of inputs. VII. Maintain ecological balance and
appropriate land water
management.
VIII
.
More and more crops should be
brought under crop insurance
scheme.
IX. SAUs should take initiatives to
develop agro-climatic zone wise
technology.
X. Diversification of agriculture
towards cash crop.
2 Seed The SRR is static and
around 8 to 9 per cent.
I. The SRR should be atleast 20
per cent.
I. SAUs, ICARI and other agencies
should produce more Breeder
Seed and Foundation Seed of
oilseeds and pulses.

SRR in case of maize,
groundnut, soyabean and
sunflower is extremely
poor.
II. Seed and Farms Division should
collect the seed from SAUs, and
ICARI well in advance of the time
of sowing of crops.
III. State Seed Corporation, NSC,
Seed and Farms Division and
TDC are required to expand and
strengthen their activities.
IV. Strict action should be taken
against organisations supplying
low quality seeds.
V. Expansion and upgradation of
storage facilities.
VI. Promotion of use of Bio-
Technology.
VII Support for varietal improvement
and hybridization.
VIII There should be forward and
backward linkages between
producing and supplying agencies.

IX. Financial support should be
available to breeder scientists.
3 Irrigation I Only 68.82% of net area
sown is irrigated.
I. Modernization of existing
irrigation system.
I. Cleaning of the main as well as
tributary canals are required.
II Less than 50% area
under assured irrigation
II Flood protection measures II Pucca embankment is needed on
main canals.
III Construction of check dams III Supply of water at tail of canal
should be ensured.
IV Promotion of lift irrigation. IV Adequate funds are needed for
proper functioning of old canals
and construction of new canals.
V Popularization of drip and
sprinkling system of irrigation
V Non-operative state tube-wells
should be repaired at war footing
level.
VI Subsidy available for boring
and purchasing of engines
VI More and more areas should be
covered under water harvesting
system.
VIII Watershed development
programme in rainfed areas.
VII. The ponds, wells, lake etc. are
required to become operational by
providing financial assistance for
theirs repairs.

VIII. Drainage repairing is required.
IX. Inter-State projects of irrigation
should be completed to release the
financial commitments.
X. The net-work of canal should be
expanded in unirrigated areas.
XI. The subsidy for the purchase of
pipe, sprinklers etc should
continue.
4 Fertilizer Ratio of fertilizer
consumption at present is
26:8:1 (N2:P205:K20)
which is unbalanced and
affecting soil texture and
structure. It should be
narrowed down to 7:5:1.
I. Balanced use of fertilizer. I. Expansion of soil testing
laborateries. Timely distribution
of different types of fertilizer at
single door.
II. Use of farm organic manure. II. The laborateries for production of
bio- agents should be established.
III. Popularization of pulses
cultivation.

IV Motivate the farmers to use the
fertilizers in prescribed
compositions for different crops.
5 Pesticides I. Maximum use of
pesticides.
I. Awareness among the farmers
to use minimum doses of
pesticides.
I. IPM/ IPNM bio-control will have
to be popularized among the
farmers.
II. Pest and insect resistant varieties
should be evolved by the scientists
of SAUs and Research
Laboratories.
6 Land I. Degradation
Problems
I. Uttar Pradesh Bhumi Sudhar
Nigam has been reclaiming the
Alkaline/ Saline soil in 17 most
Usar prone districts with the
help of World Bank.
I. UPBSN should cover more Usar
prone districts.

II. 9.23 lakh ha. Ravines
7.63 lakh ha. Alkaline/
Saline
13.50 lakh ha. Riverine
land
7.50 lakh ha. water logged
37.66 lakh ha. Total
II. Soil Conservation Department
has also been reclaiming the
Usar soil.
II. There should be no financial
constraints for the Soil
Conservation Department. Full
financial support is needed.
III. More than 23.09 lakh ha.
is covered under fallow
land and 5.86 lakh ha.
under cultivable waste
land.
III. Waste Land Development and
Utilization Programme have
been continuing.
III. There is need to manage flood
prone watershed area by
appropriate soil conservation.
IV. Fragmentation of
holdings.
IV. Rainwater harvesting
programme are being activated.
IV. There is also a need to strengthen
water harvesting through
construction of ponds, check dams
etc. It requires huge investment.
So financial support is a must.
V. Water shed development
programme has been expanding
V. Participating water shed
management is needed.

VI. Consolidation of holdings is
being conducted in second
phase in the covered districts
VI. Soil and water conservation
programme should be
implemented. The training is a
must for the beneficiaries for
proper utilization and maintenance
of assets created under this
programme.
VII. Efforts should be made to cover
all the districts of state under
consolidation of holdings.
VIII Participation of women farmers in
agricultural activities is needed.
7 Horticulture I. Low productivity of
various horticultural
crops
I. Supply of planting material and
improved varieties.
I. Modernization and upgradation of
nurseries.

II. Poor quality production II. Improvement in pre and post
harvest technology.
II.A
B.
C.
Dissemination of latest technology
at ground level by strengthening
the extension services.
Motivate the farmers to use
biological manure and take IPM
approach in pest control to
establish wormi-cultural farms.
Training is needed for growers to
adopt Hi-tech in post harvesting
process.
III. Maximum post
harvesting losses and
less number of
processing units.
III. Insufficient storing facilities. III. Establishment of cold storages.
IV. Remunerative prices are
not available.
IV. Processing of produces of
horticultural crops to get
additional price value.
IV. Huge subsidy is need to attract the
private investors for establishment
of cold storages and processing
units in potential pockets. Air
conditioned markets are needed
for export of flowers, fruits,
vegetables etc.

V. Lack of post harvest
technology.
V. Availability of quick transport
facilities.
V. Agro-based industries and
regional planning are needed to
safeguard the producers.
VI. Undeveloped
infrastructural facilities
in regards to export.
VI. Development of infrastructural
facilities for export of
horticultural produces.
VI. The exporters should be
encouraged in national and
international trade fairs and buyer
seller conferences.
VII Share in total export of
horticultural produce of
the state is extremely
low.
VII. There is urgent need for setting
up Agri-Export Zone (AEZ) in
the state.
VII.
A.
B.
Export of Basmati Rice, Mango,
Guava, Citrus Fruits, Potato,
Ginger, Garlic Green Peas,
Mushroom, Mentha, Medicinal
and Scented Plants etc. should get
top priority.
Efforts should be made to
establish a Perishable Cargo
Centre with the assistance of
APEDA.

VIII Inadequate database in
horticulture.
VIII Directorate has made
comprehensive plan for
collection of data on
horticultural crops by its own
staff.
VIII Horticulture Inspector, DAO and
others should be made responsible
for collecting data pertaining to
area, production, marketing
position for proper planning at
different stages.
8 Livestock I. Cattle population has
declined at the rate of
3% annually
I. Improvement of breeding
services.
I. Door to door Artificial
Insemination facilities should be
provided.
II. Buffaloes have
decreased by 0.05%
annually
II. Genetic upgradation II. Efforts are required to improve
genetic potential of indigenous
livestock.
III. Goat and sheep have also
decreased annually at
0.38% and 1.36%
respectively.
III. Cross -breeding programme at a
large scale.
III. Establishment of sheep breeding
farms. Technical support at the
door- step is required.
IV. More than 70% of cattle
and buffalo population
are non-descript and
hence responsible for
low productivity of milk.
IV. New advanced technologies like
use of frozen semen and
embryo- transfer technology are
being implemented.
IV. The breeding coverage should be
extended upto 35% against 29% at
present.

V. Infertility problem in
livestock.
V. Efforts are being made to
control infertility problem in
livestock.
V. Strengthening diagnostic facilities
optimization of animal husbandry
activities, veterinary hospitals,
“D” dispensaries, Pasudhan Prasar
Adhikari are more needed.
VI. Epidemic and diseases
are common phenomena
in livestock.
VI. More veterinary hospital
dispensaries and mobile units
should be established.
VI. Vaccination programme against
dreadful diseases viz. H.S., FMD
is of utmost importance.
VII Less availability of
fodder and livestock feed
concentrate.
VII. Availability of adequate
nutritious feed and fodder have
been ensured by adopting
advanced and improved
management practices at farms.
VII There is need to improve fodder
production and grass land
development programme.
VIII Shrinkage of natural
pastures.
VIII
.
Area under natural pastures is
being protected by enforcing
the relevant laws.
VIII Degraded forest land should be
put under fodder production.
IX. Low number of chilling
plants.
IX. Private entrepreneurs are
invited to establish chilling
plants in rural areas.
IX. Subsidy for establishment of
chilling factories should be
provided to entrepreneurs.
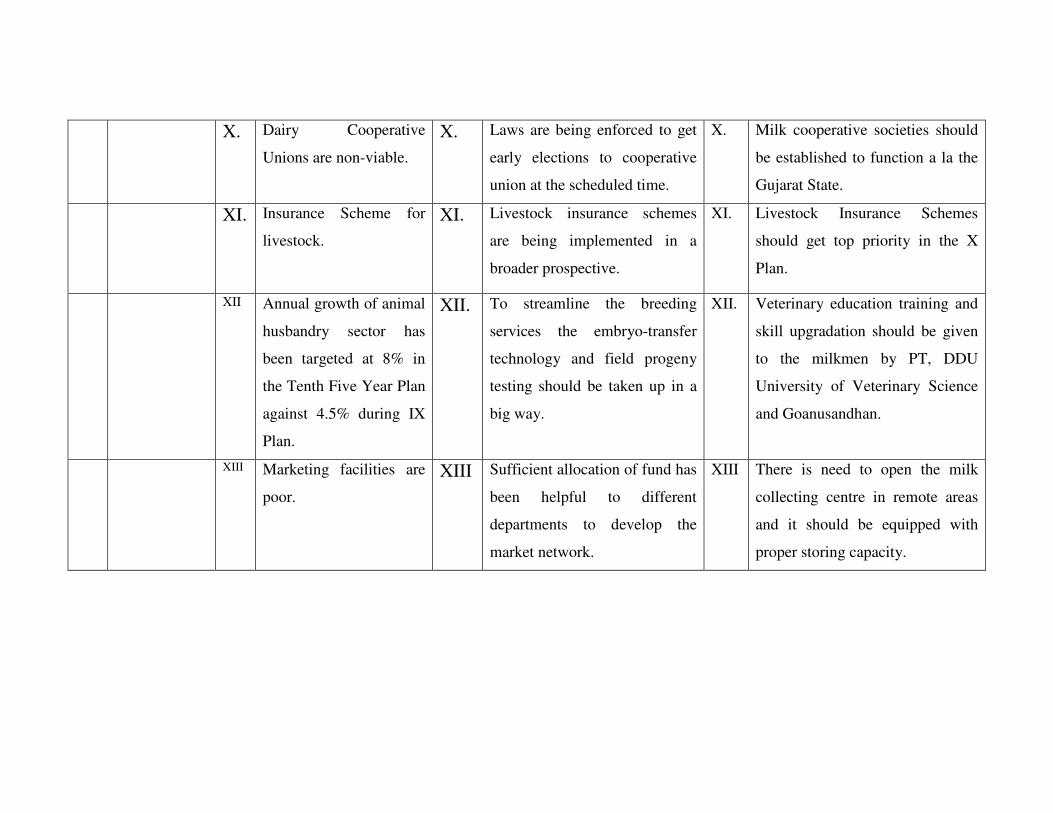
X. Dairy Cooperative
Unions are non-viable.
X. Laws are being enforced to get
early elections to cooperative
union at the scheduled time.
X. Milk cooperative societies should
be established to function a la the
Gujarat State.
XI. Insurance Scheme for
livestock.
XI. Livestock insurance schemes
are being implemented in a
broader prospective.
XI. Livestock Insurance Schemes
should get top priority in the X
Plan.
XII Annual growth of animal
husbandry sector has
been targeted at 8% in
the Tenth Five Year Plan
against 4.5% during IX
Plan.
XII. To streamline the breeding
services the embryo-transfer
technology and field progeny
testing should be taken up in a
big way.
XII. Veterinary education training and
skill upgradation should be given
to the milkmen by PT, DDU
University of Veterinary Science
and Goanusandhan.
XIII Marketing facilities are
poor.
XIII Sufficient allocation of fund has
been helpful to different
departments to develop the
market network.
XIII There is need to open the milk
collecting centre in remote areas
and it should be equipped with
proper storing capacity.

9 Fisheries I Much gap between
availability and
requirement of fish
production.
I.A
B.
C.
Promotion of aquaculture in
rural areas.
Promotion of integrated fish
farming.
Construction of ponds.
I.A
B.
C.
D.
E.
Effort are required to utilize
maximum water for fish culture.
There should be proper linkage
with Irrigation Department.
Fish seed production also requires
further gear up.
Conservation of riverine fisheries.
Utilization of alkaline soil for
aquaculture.
Water logged areas should be
utilised for fish culture.
II. Highly risky in fish
farming.
II. Provision of housing for
fishermen for establishment of
mini hatcheries.
II. Provision of Group Accident
Insurance Scheme.
III. Maximum dispute in the
allotment of ponds, tanks
on Gram Sabha land.
III. Amendment of laws relating to
the allotment of ponds, tanks
etc. in favour of fishermen.
III Proper Utilization of ponds on
Gram Sabha land for fish culture.
IV. Poor Infrastructure
facilities.
IV. Identification of marketing
places.
IV Community allotment of
marketing place.
V. Non-availability of
adequate credit
V. Financial help for purchase of
inputs.
V Supply of in well Fingers advance.

VI. Lack of scientific storing
facilities.
VI. Provision of Scientific
Containers for the fishermen.
VI Quick and well equipped transport
facilities are required. Railways
should make special arrangement
for transport of fish.
VII Insufficient training
facilities.
VII. Establishment of Training and
Extension Centre for fishermen.
VII Strengthening the activities of
FFDA in favour of fishermen.
VIII Maximum exploitation
of fisheries during
hatching for their sale in
rural areas.
VIII
.
Provision of better
infrastructural facilities for fish
marketing to securer the
fishermen against exploitation
by middlemen.
VIII NABARD should be vigilant for
proper loaning to fishermen to
purchase the inputs.
10 Miscellaneous I. Diversification of
present agriculture
I. At present, the diversification in
agriculture is maximum towards
cash crops.
I. The diversification should also be
initiated in the other
complimentary sectors. i.e
horticulture, animal husbandry,
seri-culture, milk production, bee-
keeping etc. The UPDAs will have
to lead in this direction.

II Development of
infrastructural facilities.
II. Each village and market will be
linked with pucca roads. The
supply of electricity drinking
water, school, primary health
centres, livestock, clinic centre
are the main strategies of the X
plan.
II. MLA and MP funds should be
properly utilized for the integrated
development of villages. There
should be proper linkage among
the different departments to get
work done efficiently and quickly
III. Cane development. III. Prompt payment of sugarcane
prices.
III. State as well central Governments
should take total responsibility for
prompt payment of sugarcane
price to the growers.
IV. Welfare of farming
community.
IV. Kisan Credit Card, SHGs and
other micro financial
institutions are fulfilling credit
needs of the farmers.
IV. NBARD should look into the
activities of financial institutions
for promotion of their micro
activities.
V. Implementation of
provisions of Minimum
Wage Act.
V. Provision of action in the Act
against the guilty persons.
V. The Labour Officer of the district
should take full responsibility to
enforce the Minimum Wages Act
in rural areas.

VI. Representation of
women in the various
decision making bodies.
VI. Empowerment through different
means has been given to women
to exercise equal authority in
decision making.
VI. SHGs should be extended to more
and more areas.
VII Investment in agriculture
is low (both in public
and private sectors.
VII The State Govt. as well as
financial institutions is required to
have a liberal attitude to attract
private investors. Prompt action is
needed in favour of private
investors in the allotment and
supply of subsidy. The private
investor should get help from
different departments such as
Revenue, PWD, Electricity etc. to
get their work done immediately.

CHAPTER -VI
Agricultural Policy of Uttaranchal
Introduction
Prior to November 2000, Uttaranchal was a part of Uttar Pradesh
known as hill region. It became the 27th State of the country on November 9,
2000, thus becoming a part of the Central Himalayas, starting from foothills
in south extending to snow clad mountains in the north. The state is
fortunate enough to have important rivers, valleys, glaciers, flower valleys
and high peaks, covered with snow throughout the year, so it is a picturesque
place. It is a very tiny state of the country, having only 53483 sq. km. land
which is merely 1.6% of the country’s total area. The total population of the
state was 84.7 lakhs which accounted for 0.83% of total population of the
country as per Census report of 2001. Of the total population, the population
of males and females was 43.17 and 41.63 lakh respectively, showing sex
ratio of 954 females per 1000 males. The decennial growth rate worked out
to 15.49% during 1991-2001. The literacy rate of males was 84.0% against
60.26% for females as per 2001 Census. The density of population was 159
per sq. km. in the state against 324 per sq. km. Of the country in 2001. The
state is divided in two administrative divisions viz. Garhwal and Kumaon,
comprising of 13 districts. Almora, Phithoragarh, Nainital, Bageshwar,
Champawat and Udham Singh Nagar belong to Garhwal division while
Pauri Garhwal, Dehradun, Tehri Garhwal, Chamoli, Uttarkashi, Rudra
Prayag and Haridwar fall under Garhwal division.
The geographical area of Uttaranchal is 53483 sq. kms. Out of the
total geographical of Uttaranchal the area under forest accounted for 62.56
per cent followed by 23.42% area under non-agricultural use during 1998-
1999. The net area sown was only 14.02% of reporting area which is the
lowest among the states of the country. Out of 7.81 lakhs ha. of net area
shown only 44% was irrigable whereas most of hilly areas are still rainfed
because only 12% of cultivated area is still irrigable. The cropping intensity
in the state was around 160.61%. The size of holding is maximum
concentrated (71.8%) between 1.00 to 2.00 ha. in Uttaranchal against
59.40% of the country. The small and marginal farmers are 71.8% and
16.3% of the total holdings respectively. Table-VI-1 & 2.

Table-VI-1
Land Utilization in Uttaranchal
(Area in 000 hectare)
Particulars Years
1996-97 1997-98 1998-99
1. Reporting Area 5595939 5593342 5592361
2. Forest 3499687
(62.54)
3501285
(62.60)
3498447
(62.56)
3. Usar & Unculturable Land 299608
(5.35)
299114
(5.35)
294756
(5.27)
4. Waste Land 320228
(5.72)
322840
(5.77)
324443
(5.80)
5. Permanent Pastures 227398
(4.07)
227324
(4.07)
228940
(4.10)
6. Tress 218818
(3.91)
218134
(3.90)
217033
(3.88)
7. Current Fallow 11423
(0.20)
11102
(0.20)
11257
(3.88)
8. Non-Agricultural uses Land 163836
(2.93)
164238
(2.94)
166324
(2.97)
9. Other Fallow Land 67659
(1.21)
67007
(1.20)
67044
(1.20)
10. Net Area Sown 787282
(14.07)
782298
(13.99)
784117
(14.02)
11. Area Sown More than Once 471450 458349 475272
12. Gross Cropped Area 1258732 1240647 1259389
13. Cropping Intensity 159.88 158.59 160.61
14. Net Irrigated Area* 340069 331291 343407
(a) Canal 100307
(29.5)
95266
(28.8)
101867
(29.7)
(b) Tube well 175536
(51.6)
177238
(53.5)
180945
(52.7)
(c ) Wells 19618 (5.8) 17866
(5.4)
18475
(5.4)
(d) Ponds, lake etc. 75
(0.0)
74
(0.0)
91
(0.0)
(e) Others 44533
(13.1)
40847
(12.3)
42029
(12.2)
Gross Irrigated 532518 529931 551054
Source: Statistical Diary Uttaranchal 2001-02
Figures in brackets are percentage to reporting area.
*Figures in brackets are percentage to Net Irrigated area.

Table-VI-2
Area, Production and Productivity of Major Crops in Uttaranchal Area-hectare
Production-M. Tonnes
Productivity-Qtls. hect.
Crops 1996-97 19967-98 1998-99
Area Production Produ-
ctivity
Area Production Produc-
tivity
Area Production Produc-
tivity
1. Cereals 938889
(81.97)
1554362 16.56 936243
(83.04)
1636350
17.48 961012
(83.76)
1587931 16.52
Paddy 280940
(24.53)
523376 18.63 291151
(25.82)
603128 20.72 305058
(26.59)
560078 18.36
Wheat 388329
(33.90)
721424 18.58 382964
(33.97)
686525 17.93 386697
(33.70)
684175 17.69
Barley 27101
(2.37)
24942 9.07 27044
(2.40)
34088 12.60 27101
(2.36)
25818 9.65
Jowar -- -- -- 6
(0.00)
4 6.67 7
(0.00)
4 5.71
Bajra 20
(0.001)
29 14.50 17
(0.001)
24 14.12 20
(0.002)
23 11.50
Maize 33500
(2.92)
38924 11.62 35346
(3.13)
58333 16.58 35683
(3.11)
42650 11.95
Others 208999
(18.25)
245667 11.75 199715
(17.71)
254248 12.73 206446
(17.99)
275223 13.35
2. Pulses 36361
(3.17)
22613 6.22 33617
(2.98)
21952 6.53 32776
(2.86)
19751 6.03
Urd 11217
(0.98)
4823 4.30 10807
(0.96)
4452 4.12 10571
(0.92)
3284 3.12
Moong 324
(0.03)
178 5.49 180
(0.02)
84 4.67 161
(0.01)
99 6.15
Arhar 1786
(0.16)
1265 7.08 1822
(0.16)
1168 6.41 1801
(0.16)
1077 5.98
Gram 1643
(0.14)
1497 9.11 1290
(0.11)
1107 6.58 1179
(0.10)
1051 8.91
Other Pulses 21391
(1.88)
14850 6.94 19518
(1.73)
15141 7.76 19064
(1.66)
14240 7.47
3. Oilseeds 34451
(3.01)
24140 7.01 28439
(2.52)
16871 5.93 25598
(2.23)
19748 7.71
Mustard 14246
(1.24)
14227 9.99 14078
(1.25)
7949 5.65 13454
(1.17)
11340 8.43
Groundnut 3235
(0.28)
3491 10.79 3616
(0.32)
4097 11.33 3356
(0.29)
3789 11.29
Other
Oilseeds
16970
(1.48)
6422 3.78 10745
(0.95)
4825 4.49 8788
(0.59)
4619 5.25
4. Other
Crops
135686
(11.85)
7431768 547.72 129182
(11.46)
7338749 668.09 127928
(11.15)
7340034 513.76
Sugarcane 120172
(10.49)
7126037 592.99 113907
(10.10)
7119245 629.01 112459
(9.80)
6994258 621.94
Potato 15063
(1.31)
304081 201.87 14852
(1.32)
217682 146.57 15120
(1.32)
344281 227.51
Tobacco 252
(0.02)
1540 61.11 269
(0.02)
1771 65.84 216
(0.02)
1438 66.57
Cotton 153
(0.01)
25 1.63 118
(0.01)
9 0.76 116
(0.01)
22 1.89
Others 46
(0.004)
85 18.47 36
(0.003)
42 11.66 17
(0.001)
36 21.18
Total 1145387 1127481
1147314
Note: Figures in brackets are Percentage to total
Source: Statistical Diary Uttaranchal 2001-02

Thus, the average size of holding was 0.94 ha. in the state. Out of
cropped area of 1147 thousand ha., cereal accounted for the highest share
followed by 2. 86%, 2.23% and 11.15% for pulses, oilseeds and other crops
respectively during 1998-99.
Among the cereals, wheat and paddy were important crops, which
accounted for 33.70% and 26.59% respectively. Pea and soybean were
dominant crops among the pulses. Sugarcane and potato were also important
commercial crops of the state, which occupied 9.8% and 1.32% of GCA
during 1998-99. The area under vegetable crops had also adequate share
(7.21% of GCA) during the corresponding period. It shows that vegetables
and potato jointly occupied 9.13% of GCA. It is also noticed from
Table-VI-3 that allocation of area under vegetables was much higher
(63.58%) in Garhwal division than that of 36.42% in Kumaon division. It
reflects that Garhwal division is more suitable for production of vegetables
than that of Kumaon division of the state. As far as production and
productivity of different types of vegetables are concerned, Garhwal division
is well off as compared to Kumaon division. Of the total production of
vegetables of 6,56,945 M. tonnes, the share of Garhwal division was
estimated at 73.92% against the share of 26.08% of the Kumaon division.
Table-VI-3.
Among the vegetables, pea, french bean, radish and tomato were
dominant crops and had occupied 14.98%, 9.52%, 8.30%, 5.99%
respectively during 2000-01. Pea occupied highest share being 24.37% in
Udham Singh Nagar district of Kumaon division while its share was 13.71%
in Tehri district of Garhwal division. Radish was prominent vegetable in
Pauri district followed by Almora district.
As far as tomato is concerned, it had maximum coverage of area of
21.08% and 16.34% in Dehradun and Haridwar districts of Garhwal
division. While it was maximum being 11.40% and 10.98% in Pithoragarh
and Almora districts respectively of Kumaon division during the same
period. It shows that maximum concentration of area of vegetables was
found in Haridwar and Dehradun districts of Garhwal division while Almora
and Nainital districts had maximum area under vegetables among the
districts of Kumaon division Table-VI-4 & 5.

Agricultural Policy of Uttaranchal
After its separation from Uttar Pradesh the Uttaranchal Government
has chalked out new strategy for Agricultural Policy vis-à-vis liberalization
and WTO. The Agricultural Policy has been framed keeping in view the
agro climatic situation and condition of soil texture and structure etc. The
maximum emphasis has been laid on horticultural crops viz. vegetables,
fruits, medicinal plants having export potential. The salient features of the
Agricultural Policy for the development of agriculture, horticulture, live
stock and other allied sectors during 2000-2001 are detailed below:
Agricultural Sector
The foodgrain crops are generally grown in the plain areas of the
state. The main crops are paddy, wheat, sugarcane, mustard, soyabean, lentil
and gram in the state. Hence, the state Govt. has been paying adequate
attention to increase the production and productivity of these crops by
adopting the following policies and programmes.
I. The availability of improved seed, fertilizers and pesticides is being
ensured.
II. Automatic forecasting appliances are being set up at different places
to get advance knowledge of weather condition.
III. The consolidation of land holdings are being executed in plain
districts, while voluntary consolidation of holdings approach is being
popularized in the hill districts of the state.
IV. Emphasis is being given to mechanization of agriculture to reduce the
cost of production and improve the efficiency of work. In this
connection, modern small implements and power tillers are being
provided to farmers at subsidized rate. The sprayers and sprinklers etc.
are also available to the growers at minimum prices.
V. Efforts are being made to construct Hydrodrum in hill districts to
restore the maximum water of rain.
VI. The replacement rate of seed at present being very nominal would be
increased by 15 per cent in years ahead.
VII. Uttaranchal Govt. is trying to open more fertilizer shops in remote
areas to ensure the availability of fertilizers.
VIII. White til crop has much potential in this state. Efforts are on to
increase the area under this crop.

IX. Groundnut can also be grown in the hilly tracts, hence, efforts have
been continuing to replace its old varieties.
X. As the soyabean is one of the commercial crops of the state, the
modernization activities in its cultural activities are needed to sustain
its productivity for a long time. The state Govt. has been trying to
construct the modern godowns for the storage of foodgrains and
concrete steps are also going on for its processing and proper
marketing with a view to enabling the farmers to get remunerative
prices.
The production and productivity of paddy and wheat crops have a
tendency to decline during last few years in the state. Hence, the state Govt.
has made following comprehensive plan to sustain the production and
productivity of these crops.
I. To motivate the farmers for comprehensive use of biological manures.
II. To advise the farmers to increase the seed replacement rate.
III. To motivate the farmers for using balanced doses of fertilizers.
Horticultural Crops
The horticultural crops are major enterprise of the hilly tracts of the
state. Its contribution in total economy of the state is much higher than that
of agricultural crops. The potato, cabbage, pea, tomato, shimla chilly etc. are
the major vegetables. Apart from this, floricultural crops are also very
promising in the state. Gladiolus, tube-rose, chrysanthemum, rose, marigold
etc. are main flowers of the state.
Uttaranchal is very suitable for the better production of vegetables,
potato, flowers, fruits in normal as well as off season. The suitability of
soils, availability of water, cool temperature, suitable temperature in summer
season and massive rainfall etc. are the main contributing factors to
producing standard quality vegetables, flowers and fruits in Uttaranchal
State. Since the creation of the hill state, the state Govt. has been trying to
boost the production of horticultural crops at global standard in the potential
pockets of the state. In the context of WTO, following policies have been
framed to get the maximum share of exports from the country in the years
ahead:

1. Distribution of Hybrid seeds.
2. Provision of Hi-Tech will be provide to horticultural crops through strong
extension net-work.
3. Emphasis on the production of tomato, brinjal, shimla chilli, french bean
etc. in the potential areas of the state.
4. A very positive strategy devised by Horticulture Department for the
betterment of rose, marigold, carnation, gladiolus and tuberose in
selected district of the state. In this context, polyhouses would be
constructed in potential areas.
5. Popularisation of the aromatic and medicinal plants among the growers to
provide them the good marketing infrastructural facilities.
6. Popularisation through proper strategy of the cultivation of spices in the
selected areas of the state. The demonstration and supply of planting
materials are the basic activities of horticulture department at present.
7. The state Govt. has made a big plan to mobilize the private investers to
establish the processing units in the producing areas of the state. In this
connection, the state Govt. is ready to provide all the physical financial
help to the investors in the establishment of processing units in the state.
8. The state Govt. has been doing sincere efforts for establishing the cold
storages in the plain areas of the state to provide the better storing
facilities of vegetables, flowers and fruits.
The state Govt. is ready to protect the interest of producers and
consumers by providing them good services of marketing, processing,
storing, packing and transporting through the following programmes and
policies.
1. Establishment of terminal markets to provide alternative marketing
facilities to the producers.
2. Each Tehsil will be covered by acts and regulations of regulated markets.
3. Each regulated market will adopt atleast a village for its integrated
development.
4. Village markets will also be modernized.
5. Out of total income of markets, 75 percent will be invested in that
market.
6. Since vegetable, flowers and fruits are highly perishable, the private
investors are being invited to set up cool chain system to protect the post
harvest losses.

Live Stock
The economy of live stock is not so encouraging in Uttaranchal as
compared to Uttar Pradesh, Delhi, Hayarna and Punjab. The production of
milk per milch cattle is very low in the state due to the immense population
of local breeds Table-VI-6 & 7. The prospect of live stock is very strong
because of large grazing and forest areas. The foreign breeds of milch cattle
such as Friesian, Jersey, are very suitable in the state. In order to boost the
production of milk, the state Govt. has made following programmes and
policies for the development of live stock.
Table-VI-6
Details of Live Stock in Uttaranchal (000)
Sl.
No.
Categories of Live Stock
1988 1993 1998
1. Cows (Deshi) 1999 2008 1927
2. Cows (Cross Bread) 85 123 104
3. Milch Cattle 2064 2131 2031
4. Draught Cattle 1007 1064 1094
5. Sheeps 354 359 312
6. Goats 914 1098 1085
7. Pigs 24 25 32
8. Others 192 243 58
9. Total Live Stock 4575 4920 4612
10. Poultry 663 845 983
Table-VI-7
Production of Milk and Other Produce in Uttaranchal
Category of live Stock Production
1988 1993 1998 Milk Production per day per Milch Cattle (kg)
(a) Cows
(b) Buffaloes
1.301
2.466
1.328
2.551
1.437
3.078
Eggs per Bird per year (Nos.) 191 201 200
Wool per Sheep per year (grams) 1259 1267 1229
Meat per animal (kg)
(a) Sheep
(b) Goat
(c) Pig
15.299
14.682
50.675
14.958
14.457
50.619
14.943
14.142
50.533
Source: Statistical Diary Uttaranchal 2001-02

Programme and Policies
1. Initiation of an Intensive AI Programme in each nook and corner of the
state.
2. Live stock census for its better management in the years to come.
3. Adequate emphasis on the veterinary supports to live stock. To provide
the better treatment of live stock, the state Govt. is going to allot
adequate finance to open the veterinary hospitals in remote areas of the
state. In addition to this, the poultry development programme will also be
launched very soon in the potential districts.
Sericulture
The agro-climatic condition is very suitable for development of
sericulture in hilly districts of the state. It could be a good business in the
state. The state Govt. has framed the following programmes for its
development.
1. Financial and physical support to farmers for the plantation of mulberry
trees.
2. Training centres for development of sericulture would also provide
training to women.
3. The establishment of development centres for better marketing facilities.
Bee keeping
Uttaranchal state is botanicals very prosperous and has very
conducive agro-climatic condition for bee keeping. The bee keeping is not
only a remunerative business but it increases the productivity of crops also.
In order to popularise the bee keeping in the state, Govt. has already chalked
out massive policies and programmes for its development such as;
1. Coverage of more and more people under bee keeping training
programme.
2. Extension of credit facilities to the interested families.
3. Improved marketing facilities to provide better price of honey.

Mushroom
Since the temperature in even summer season of hill districts of the
state is very moderate, all varieties of mushroom could be grown throughout
the year. Mushroom cultivation is very remunerative and has very high
potential for export. Therefore, state Govt. has been paying adequate
attention to its development such as;
1. Motivation and training to the farmers and supply of planting material at
subsidized rates.
2. Plan to provide the processing and marketing facilities.
3. A new strategy the mushroom production at global standard by
establishing modern processing units in the potential areas. The supply of
electricity to processing units would be ensured.
Tea
The tea plantation was carried out during the British regime in
selected areas of the hill districts. But due not availability of processing units
in the state, it was sent to Calcutta which meant prohibitive transport costs.
On account of this, it was uneconomic here as compared to that in Assam or
West Bengal. In order to revive its cultivation, the state Govt. has made a
number of plans:
1. The potential area will be identified and Land Development Banks would
also be opened.
2. Research station will also be established.
3. Processing units will be established at tea growing districts.
4. Marketing net-work will be strengthened.
Development of Marketing Net-Work
The marketing facilities in the state is extremely weak. The road
transport is well developed only in 9 out of 13 districts of the state. Most of
villages and primary markets are not connected with roads. Head load
transport is only way to carry the produces from producing centres to
secondary markets. On account of these bottlenecks, the producers have to
bear heavy losses and are deprived from getting remunerative prices of their

produce. The state Govt. has been giving top priority to develop transport
facilities by connecting the villages and markets with pacca roads.
Besides these developments, the following export promotion
initiatives are on top of the Govt. agenda at present:
I. Establishment of Export Processing Zones in appropriate places.
II. Establishment of Agro-Park which would be equipped with modern
facilities as are available in foreign countries.
III. Formation of the Export Unions to protect small and marginal
producers from middlemen.
IV. Provision of adequate loans to producers at reasonable rate of interest
SHGs and NGOs will be more strengthened to provide timely and
adequate loans to the growers.
The size of holdings particularly in hill districts of the state is very
small. Therefore, diversification in agriculture is rather very essential to get
assured income throughout the year. The agro-climatic conditions, soil
texture and structure, sufficient availability of water, good extension support
are available in the state. Even then, the state is well behind the State of
Himanchal Pradesh. The Uttaranchal has come into existence in 2000. The
state has made its own agricultural policy in 2001. If the policy is
implemented with sincerely the state would emerge as one of the best states
of the country with regard to the export of vegetables, flowers, fruits etc. in
years to come.

CHAPTER-VII
Summary and Conclusion
Uttar Pradesh is a rich state in terms of agricultural and other natural
resources. It is a soil and water rich state. Texture of the soil is highly
favourable to crop growth and its diversification. Percentage of net cropped
area to total geographical area of the state is higher than the percentage of
net cropped area to total geographical area of the country. A major part of
the state is constituted of alluvial soil deposited by perennial rivers Ganga,
Yamuna, Sarju and their tributeries. Western and Central regions of the state
are the most fertile tracts of the country. Similarly eastern region of the state
also has fertile soil and natural environment. But the soil of Bundelkhand
region comprising of Banda, Hamirpur, Jhansi, Jalaun, Lalitpur and some
part of Mirzapur, Sonbhadra and Allahabad Districts are rocky. It is less
fertile in comparison to the soils of other regions.
The Study on Agricultural Policy in Uttar Pradesh and Uttaranchal: A
Policy Matrix
Intends to analyse and discuss the agricultural development
performance of the Uttar Pradesh incorporating major initiatives taken by
the Government in for agricultural development of the State. It also deals the
major constraints prevailing in agricultural sector for proper growth of the
sector. Accord on Agriculture of the WTO has created some new challenges
before the State to meet the challenges has also been discussed in the study.
Taking into account the strength weakness opportunities and threats related
to agricultural sector a Policy Matrix has been prepared. Following is the
objectives and methodology of the study.
Objectives of the Study
1. To review the available material (including policy documents and Five
Year Plan Documents of the Union and State Governments, at the State
level dealing with policy interventions after the formation of the State.

2. To identify important constraints and review the efforts made by the
State in the past to meet major challenges pertaining to agriculture and
allied activities.
3. To record the State’s response to the already formulated National
Agricultural Policy, that is, to find out precisely how and where the State
would like to suitably supplement, modify and re-articulate the National
Policy in the local context.
4. To bring out the State’s concerns as well as to record the State’s view on
the changing economic situation due to India’s involvement with the
World Trade Organization (W.T.O).
5. To document the State’s initiatives to meet the problems and constraints
arising out of India’s WTO commitments and review in brief the
effectiveness of government interventions in the form of technology
adoptations, institutional adaptations, price policy changes (e.g., through
changes in tax and subsidy regimes) and legal policy changes undertaken
so far.
6. To discuss with the important stakeholders (as identified above) the
requirements for formulation of a policy document at the State level, in
response to the country’s growing concerns in response to challenges
arising from WTO or otherwise.
7. To elaborate on the initiatives taken to meet the challenge of
diversification, technology, resource management and price policy at the
State level (whether in response to WTO or otherwise).
8. To assemble these views in the form of a meaningful policy requirement
matrix, relating problems/issues as well as to suggest a programme of
action. The study intends to spell out the agencies, which should
undertake such actions.
Research Methodology
The study intends to assess the agricultural resource base of the State
alongwith highlighting the agricultural development scenario since recent
past. The study analyses the measures, schemes, programmes and strategies
launched in the state for agricultural development and their effect in the

various sub sectors of the agricultural economy. Further, the study also
endeavour to assess the weakness and threats for agricultural development
particularly keeping in view the challenges posed by the WTO accord on
agriculture. We have used secondary data from various plan documents of
the state as well as data from reports of the study groups, committees, and
survey reports. These sources have been used to assess development
performance. We have also contacted the stakeholders of agricultural
economy, like agricultural labourers, farmers of the different holding size,
officials of agriculture department, NGOs working actively for agriculture
and rural development, the farm leaders units engaged in processing and
trading units to get primary data and elicit their opinions. We have tried to
collect facts related to strength of agricultural economy, weakness of
agricultural economy, threats to agricultural economy and in the backdrop of
which we have tried to propose a suitable agricultural policy of the State.
Water, the most required input for crop economy is also abundant in
most part of the state except Bundelkhand region. According to estimates of
Accelerated Irrigation Programme (AIP) Uttar Pradesh can irrigate its total
gross cropped area by proper planning and water management in the state.
While at the national level total gross cropped area can not be irrigated even
after using ultimate irrigation potential. According to AIP the ultimate
irrigation potential in India is only 138 million hectare, while the gross
cropped area is around 190 million hectare.
Uttar Pradesh has a long tradition of growing various crops consisting
of cereals, pulses, oilseeds, vegetables as well as fruit crops. It has been a
prosperous state for agricultural produce before the advent of British rule in
India. Agra, Avadh, Jaunpur, Varanasi and Kara were rich agricultural areas
and very important centres for the revenue of the government. But the
introduction of faulty land tenure system in the form of Zamindri and
Mahalwari ruined the agricultural prosperity of the state and forced the
farmers to survive in poverty and disgrace. The farmers were bound to
cultivate as tenants of the intermediaries not as owners of the land. The then
government, at the time of food crises caused through famine made some
adhoc arrangements for crop growth. Some canals like upper Ganges, lower
Gangas, Sharda Sayak etc. were opened during British rule. There was no
incentive in price and or non-price form for the farmers for the development
of agricultural economy. The period of British rule was the period of
darkness for the erstwhile prosperous agricultural state of the country.

Soon after independence institutional improvement programme were
launched in U.P., basically to abolish the intermediaries from the land tenure
system. Accepting the recommendations of United Provinces Zamindari
Abolition Committee (1948) all forms of intermediaries were abolished and
ownership of holdings was given to the tillers. Similarly other programmes
for land reforms like consolidation of holdings, establishment of cooperative
farms and programme for ceiling on land holdings were also launched. A
programme for ‘Bhoodan’ and ‘Gramdan’ was also initiated in the State.
Along with these programmes some other programmes and schemes
were also launched to raise crop production and productivity. The extension
of Grow More Food Compaign, launched in 1943, was an important effort to
improve the agricultural economy of the state. Community Development
Programme (1952) and National Extension Service (1953) also aimed at
improvement of agricultural production. Establishment of three tier
Panchyati Raj System was an effort to give autonomy at village level.
Following the recommendation of Indian delegation to China, some
improved methods of cultivation were introduced in the crop economy of the
state. Intensive Agricultural District Programmes (IADP) launched at
national level was implemented in Aligarh district of the state for overall
development of the wheat crop. Later on the IAAP was also initiated in the
state.
Though the above mentioned programme and policies were helpful in
mitigating the bottlenecks prevailing in the agricultural sector but even then
increase in agricultural production and productivity was not upto the desired
level. Most of the increase in agricultural production during 1948-1965
could be attributed to increase in area under crops. During the period most of
the barren land and cultivable waste land was brought under crops. A large
tract of the ‘Tarai’ area (near foothills of Himalayas) was brought under
crops. There was no remarkable increase in the productivity of the crops
during 1948-1965. In the background of continuing food shortage all efforts
for agricultural development were confined to the growth of foodgrain crops.
The third plan period was a very bad period for the agricultural sector of the
state due to severe drought of 1965-1966.
To overcome the food crises of the country and the state new strategy
of agriculture popularly known as Green Revolution was launched in U.P. In
fact Punjab, Haryana and Western U.P. have been the leaders in the
introduction of green revolution in India. Green revolution based upon HYV

seeds, chemical fertilizers and increased irrigation facilities raised the crop
production and productivity in the state particularly for wheat followed by
Paddy, Jawar, Bajara and Maize. During the period 1970-1991 growth in
agricultural productivity became the major source of increase in agricultural
production. It is remarkable to note that since 1980 increase in agricultural
productivity has emerged as a sole factor for growth of agricultural
production. In fact net-cropped area in the state has started to decline
because of shift of agricultural land for non-agricultural purposes. Land
hunger is sharply increasing in the state for urbanization, commercial
settlement, habitat, factories, institutions and other non-agricultural uses.
Thus the pressure on remaining cropped area is increasing for supplying the
foodgrains to a very large population (about 16.8 crores) according to
Census 2001.
Agriculture is the important business of the State. Uttar Pradesh
enjoys a comparative advantage for agriculture practices in comparison to
several other states of the country. Keeping in view the dominance of
agriculture the Government of India and the U.P. Government. Launched
various programmes, schemes and strategies for the development of
agriculture and allied activities. It has been already mentioned that during
the first three decades of the planning, development efforts of agriculture
were confined to the growth of production and productivity of foodgrain
crops. Grow More Food campaign, Chinese method of cultivation, IADP,
IAAP, new strategy of agriculture, subsidy to agriculture, increase in
irrigated area all focussed at increased in the production of foodgrain crops.
Though it was the demand of the time to overcome the food shortage, but
other aspects related to crop economy particularly pulses and oilseeds could
not get proper attention of the planners and policy makers. Programmes to
supply HYV seeds, chemical fertilizers, pesticides, improved agricultural
implements and machinery as well as extension service became the powerful
tools for the growth of foodgrain crops. Agricultural Price Policy became
also conducive for the growth of food grain crops.
Apart from this, some programmes for development of allied sectors
were also initiated in the state during the plan period. Livestock and animal
husbandry hold the key to agricultural development besides being an
independent sector for generation of income and employment. Animal
husbandry is closely interwoven with agriculture. Uttar Pradesh is endowed
with rich and diversified assets of livestock. Programmes have been
launched in the state to control livestock diseases and emphasis has been laid

to establish veterinary hospitals, dispensaries and mobile unit. Artificial
insemination programmes as well as feed and fodder development
programme have also been launched in the state. Until the third plan
breeding policy emphasized on the objective of more milk and quality work
cattle. But from the third plan onwards the strategy was sifted to breeding of
high yielding cross-bred whose male progeny is less suited for rearing as
work cattle.
Uttar Pradesh has comparative advantages over other states for the
development of horticultural crops. Fruits, vegetables and flowers can be
grown in the state during the various crop seasons. Various programmes for
plantation of fruit saplings, herbal gardens, establishment of fruit belt areas,
plantation of medicinal and aromatic plants have been launched. Moreover
establishment of Agri-Export Zones is providing an opportunity for the
farmers to enhance their income. Agri-Export Zones at Varanasi (vegetable),
Pratapgarh (Aonla), Rampur and Barabanki (Mentha) are shortly to be
established. These Agri-Export Zones shall be helpful for further
development of horticultural crops. Some programmes have been launched
in Bundelkhand region of the state for the development of citrus fruits. The
region has favourable soil and climatic conditions for the growth of citrus
fruits.
Sheep and goats have been providing employment and income to the
farmers since the beginning of the settled agriculture. U.P. has high potential
for sheep goat rearing. A research institution of Indian council of
Agricultural Research is working at Mathura, in the State for the
development of goats. It has helped in expansion and strengthening of goat
breeding facilities. Similarly animal husbandry department has given full
attention for expansion and strengthening of pig breeding. Integrated Pig
Development Scheme was launched during the second five year plan. A
regional pig breeding station was established at the Central Dairy Farm,
Aligarh. Poultry farming and bee keeping are also being popularised in the
State.
Dairy sector has emerged as an independent re-numerative activity.
Uttar Pradesh is the largest milk producing state of the country. The state
produces about 16 per cent of the total milk production of the country. Dairy
Cooperatives are becoming popular in the state to strengthen milk sector.
Programmes for awareness of Dairy and establishment of Dairy and Chilling
Plants have been launched in the state. Integrated Dairy Development

Projects have been launched in flood prone and backward areas.
Government of India has given l00 percent grant-in-aid for the development
of three dairy development projects namely: U.P. - l (Bundelkhand), U.P. - II
(Purvanchal) and U.P.-III (Tarai). U.P. DASP has also supported the
programme of dairy development in the state.
Fisheries sector has emerged as a foreign exchange earning sector for
the country. At present marine export constitute the highest proportion in
agricultural exports of the country. Uttar Pradesh has a good potential for the
growth of inland fisheries. Fish Farmers Development Agency (FFDA) is in
operation in each district of the state to facilitate the development of inland
fisheries. It is providing infrastructural and support services to the fish
farmers in the state. An independent Ministry is working in the state for the
development of fisheries. The state has given high attention for proper
implementation of (FADA) Programme in the State. Central Inland Fisheries
Institute and Institution of Indian Council of Agricultural Research are
working at Allahabad for the development of inland fisheries.
Though the development initiative taken by the government in Uttar
Pradesh is appreciable yet the results of the development initiatives are not
upto the desired level. Some constraints are affecting the development
performance. High population density and huge size of population are
creating the hurdle in the development of agriculture. Most of the holdings
in the state are small and marginal as a result of which the farmers do not get
the economy of scale in agriculture. Large farmers are not very keen to
adopt recent advances in agriculture, while marginal and small farmers are
not in a position to afford the implementation of recent advances at their
farms due to their poor asset base.
Indiscriminate installation of tubewells and borewells has resulted in
depletion of ground water in various community development blocks of the
state. It has been estimated that 74 Community Development Blocks of the
state have gone dark and 184 have become grey with reference to ground
water resources. Bundelkhand region of the state suffers from lack of
irrigation facilities. As a result production and productivity of the region are
very low. The fertility of land is declining in almost all the regions of the
state due to neglect of multiple mixed cropping pattern and non-adoptation
of proper crop rotation pattern. Organic manicuring have been neglected by
the farmers. Chemical fertilizers are being used progressively without
following the balanced norm of chemical fertilizer use. Per hectare fertilizer

consumption in the State was 130.4 Kg. higher than all India average of 90
Kg. per hectare.
Child labour is still prevalent in agricultural activities in U.P. Through
the wage rate in at par with minimum wage rate in some parts of the state
particularly in the areas closer to cities. But the wage rate is lower than
minimum wage rate in the remote and backward part of the state. Average
wage for female workers is lower than the average wage rate of the male
workers. There is seasonal unemployment for agricultural workers during
the off agricultural season. As a result agricultural labourers as well as
marginal farmers are forced to migrate to cities in search of bare livelihood.
The livestock sector suffers from excessive cattle population in the
state. The area under grazing and pasture land is declining at a sharp rate.
The pasture land is being shifted for cultivation and other non-agricultural
uses. Due to shrinkage of natural pastures the sheep and goats rearing is
becoming difficult. There is possibility of decline in wool production in
future. Though a number of programmes are in operation in the state to
improve livestock sector but it is insufficient in the context of very large
cattle population. The artificial insemination programme is not achieving
much success. The average yield of the milch animal is very poor. The use
of drought animals is declining in the state due to expansion of
mechanization in agricultural activities and these are becoming a burden on
farms and farmers. The Dairy development programme is being beneficial
mostly for resource rich farmers. It is not becoming beneficial for the poorer
section of the rural society. The progress in development of exotic breed of
milch cow is quite low. The poultry, pig and goat farming are still being
carried in traditional ways in the villages. These are highly prone to diseases
causing unaffordable loss to the farmers.
Besides, the inadequate expansion of processing units, marketing
facilities for the horticultural crops are also lagging behind their
development in the state. Very often prices of the produce of horticultural
crops become very low and the farmers are forced for distress sale.
Popularization of high tech horticultural crop is yet to come in the state for
common farmers.
The post-harvest infrastructure and marketing facilities are extremely
inadequate in the state. On account of this more than 20 percent produce of
fruits and vegetables are damaged during the harvesting season. Pest and

diseases cause a heavy loss to the farmers. Capital formation in agricultural
sector is very low in the state in public as well as private sector. There is net
drain of savings from rural to urban areas and from agricultural to non-
agricultural activities. Public sector capital formation since mid-eighties has
declined in the state. This has created a challenge for the future growth of
agriculture as well as requirement of food supply for the increasing
population in the state as well as in the deficient states of the country.
India is a signatory to World Trade Organisation (WTO) accord.
Accord on Agriculture (AoA) of the WTO provides for opening of the
domestic agricultural market, lowering of support to agriculture, abolition of
Quantitative Restrictions to agriculture, implementation of TRIPs provision
in the agricultural sector and to implement the Phyto-sanitary measures.
These items of AoA have created a challenge for the agriculture of the state.
Developed countries are selling their agricultural produce in the state at
lower price than that prevailing in the market. Foodgrains, pulses, fruits and
processed food from other countries can be seen in the agricultural market of
the state. Though the state government has taken some initiatives to
safeguard the interest of the farmers of the state, yet on the sanitary grounds
the export potential of the state for the agricultural produce is rated very low.
A situation of dumping is emerging in the state for wheat, pulses and fruits.
It requires establishment and strengthening of the Agri-Export zones and
other agricultural facilities. The agricultural policy of the state should
concentrate effectively on certain variables:
1. There is an urgent need to evolve a sustainable agricultural practice to
check sharp erosion of natural resources. It is the duty of the present
generation to transfer rich and fertile soil to the coming generation. It
requires a proper blending of new agricultural practices with tested and
centuries old traditional practices for agriculture.
2. Demand led agricultural development and crop diversification are the
needs of the hour. In view of mounting food stocks it has become more
important to diversify the crop economy in favour of high value
diversified agriculture.
3. Allied agricultural activities such as animal husbandry, bee keeping,
horticulture, dairy, goat and sheep rearing have become very important.

4. There is lack of fundamental researches for the development of location
specific agricultural practices. The approach paper of the Tenth Plan
rightly observes that the extension service to provide a boost to modern
agriculture is insignificant. They have virtually collapsed. This requires
an effective development of location specific agricultural practices and
re-engineering of extension service for the future agricultural growth.
5. Environmental degradation is posing a serious challenge to all life forms
on the earth. The agricultural policy should take care of the
environmental issues in the operation of agricultural activities. There is
need for promotion of farm and social forestry. Agricultural processing
should find an effective place in agricultural policy of the state. In view
of the rising income of the society. The demand pattern of agricultural
produce is changing. There is need for the expansion of crops producing
superior cereals and other agricultural produce.
6. Farm leaders, progressive farmers and various non-government
organization have advised for a favorable terms of trade to the
agriculture. This should also form an integral part for the development of
process of agriculture.
7. A judicious use of the natural resources is urgently required. The aspect
of continuity in the availability of natural resources require serious
attention of the policy makers. The crops which require less water and
low level of plant nutrients should be developed. Following is the SWOT
analysis for agricultural sector of the State. It should be taken into
consideration to formulate the agricultural policy for the state.
The SWOT and Policy Matrix have been discussed in Chapter-V.

BIBLIOGRAPHY
BOOKS
A. Vaidyanathan Bovine Economy in India, Oxford and IBH Pub.
Company, New Delhi, 1988. Alok Ghosh Indian Economy, Its Nature and Problems, The World
Press Calcutta, 1980.
Ashok Rudra Indian Agricultural Economics-Myths and Realities.
Ashoka Mehta Economic Planning in India, New Delhi, 1970.
A.M.Khusro & The Problem of Cooperative Farming in India, Asia
A.N.Agrawal Publishing House Bombay, 1961.
A. R. Desai Rural Sociology in India, Popular Prakashan, Bombay,
1984.
A. D. Sharma & Geetika GATT and WTO, Kitab Mahal, Allahabad, 1995
Ashok Gulati Agricultural Price Policy in India., Concept Publication
Company, New Delhi., 1987.
A. Kumar Agricultural Technology and Price Policy in India.- Chugh
Pub. Allahabad, 1992.
B. C. Tandon Economic Planning, Theory and Practice, Chaitnya
Publishing House, Allahabad, 1972.
B. S. Minhas Planning and the Poor, S. Chand and Company, New Delhi,
1974.
B. L. Raina Population Policy, B. R. Publishing Corporation, New
Delhi, 1988.
Biplab Das Gupta The New Agrarian Technology and India.
B. M. Bhatia Indian Food Problem and Policy, Somaiya Publication Pvt.
Ltd. Bombay, 1970.
C. H. Shah (ed) Agricultural Development of India, Policy and Problems,
Orient Longman, Bombay, 1979.
C. D. Wadhava (ed) Some Problems of India’s Economic Policies, Tata Mc
Graw Hill Publishing Company, New Delhi, 1977.
C. H. Hanumantha Rao Technological Change and the Distribution of Gains in
Indian Agriculture, Macmillan, New Delhi, 1975.
C. H. Hanumantha Rao Agricultural Growth, Rural Poverty and Environmental
Degradation in India, Oxford University Press, Delhi, 1994.
D. Charan Wadhva Some Problems of Indian Economic Policy, Tata, Mc Graw
Hill Publishing Company, New Delhi, 1977.
H. D. Malviya Land Reforms in India, New Delhi, 1955.
Hanumantha Rao Agricultural Policy in J.S. Mongia. (ed) Indian Economic
Policies 1947-77, Allied Publishers Private Limited, New
Delhi, 1980.
J. K. Mehta Economics of Development, Principles and Policies,
Allahabad, 1971.
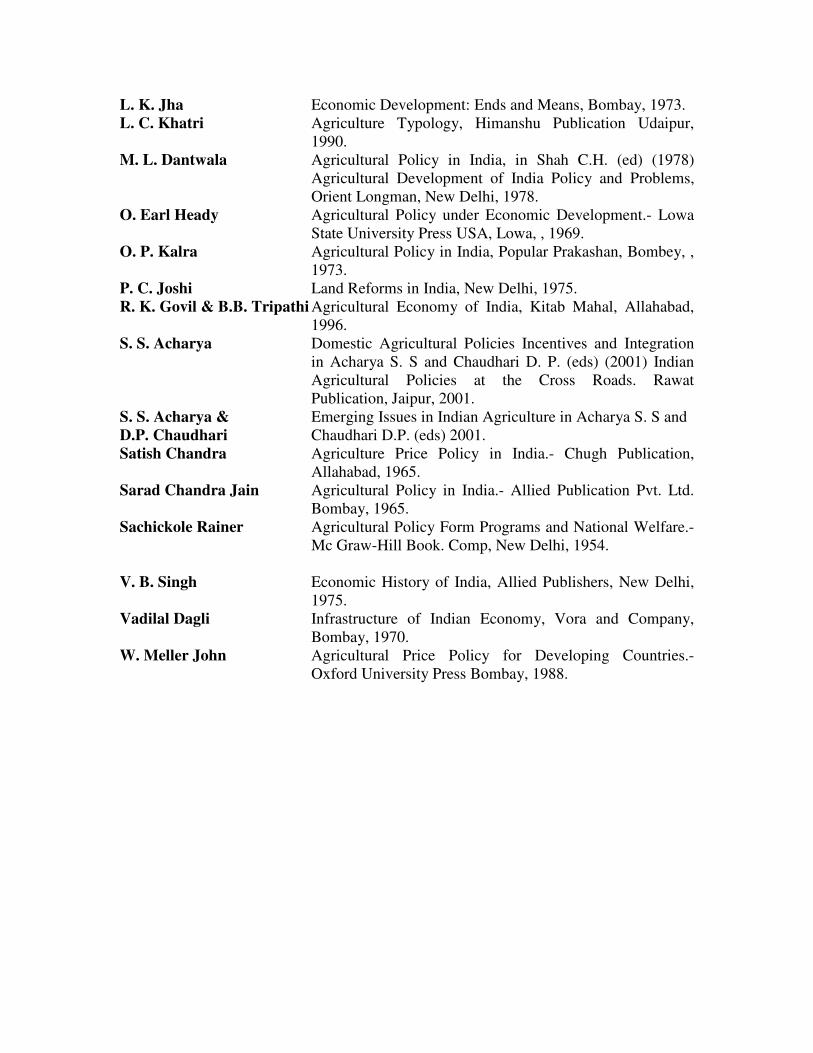
L. K. Jha Economic Development: Ends and Means, Bombay, 1973.
L. C. Khatri Agriculture Typology, Himanshu Publication Udaipur,
1990.
M. L. Dantwala Agricultural Policy in India, in Shah C.H. (ed) (1978)
Agricultural Development of India Policy and Problems,
Orient Longman, New Delhi, 1978.
O. Earl Heady Agricultural Policy under Economic Development.- Lowa
State University Press USA, Lowa, , 1969.
O. P. Kalra Agricultural Policy in India, Popular Prakashan, Bombey, ,
1973.
P. C. Joshi Land Reforms in India, New Delhi, 1975.
R. K. Govil & B.B. Tripathi Agricultural Economy of India, Kitab Mahal, Allahabad,
1996.
S. S. Acharya Domestic Agricultural Policies Incentives and Integration
in Acharya S. S and Chaudhari D. P. (eds) (2001) Indian
Agricultural Policies at the Cross Roads. Rawat
Publication, Jaipur, 2001.
S. S. Acharya & Emerging Issues in Indian Agriculture in Acharya S. S and
D.P. Chaudhari Chaudhari D.P. (eds) 2001.
Satish Chandra Agriculture Price Policy in India.- Chugh Publication,
Allahabad, 1965.
Sarad Chandra Jain Agricultural Policy in India.- Allied Publication Pvt. Ltd.
Bombay, 1965.
Sachickole Rainer Agricultural Policy Form Programs and National Welfare.-
Mc Graw-Hill Book. Comp, New Delhi, 1954.
V. B. Singh Economic History of India, Allied Publishers, New Delhi,
1975.
Vadilal Dagli Infrastructure of Indian Economy, Vora and Company,
Bombay, 1970.
W. Meller John Agricultural Price Policy for Developing Countries.-
Oxford University Press Bombay, 1988.

Publication of Government
� Govt. of U.P., Planning Institute, Vth Five Year Plan, Lucknow.
� Govt. of U.P., Planning Institute, IVth Five Year Plan, Lucknow
� Govt. of U.P. , Planning Institute, Annual Plan 2003-04 Vol. II., Lucknow
� Govt. of U.P., Planning Institute, VIth Five Year Plan (1980-85) & Annual Plan
(1981-82) New Delhi.
� Govt. of U.P., Planning Institute, VIIIth Five Year Plan (1997-2002) New Delhi.
� Govt. of U.P., Planning Institute, IXth Five Year Plan & Annual Plan (1997-98)
� Directorate of Agriculture U.P., Lucknow- States of Dept of Agriculture in U.P.
� Govt. of U.P., Planning Institute, State Effort for Agricultural Development in U.P.,
Work-Plan for 2000-2001 under Macro Management, Lucknow.
� Govt. of U.P., Directorate of Agricultural, Uttaranchal, Macro-Mode Management
Work Plan 2002-03.
� Govt. of Uttaranchal, Directorate of Economics and Statistics, Department of
Planning Statistical Diary, Uttaranchal 2001-02, Dehradun.
� Govt. of Uttaranchal, Directorate of Economics and Statistics, Department of
Planning, Uttaranchal at Glance, 2002-03, Dehradun.
� Govt. of U.P., Work-Plan for 2000-01, State’s Effort for Agricultural Development
in Uttar Pradesh, Directorate of Agriculture, Lucknow.
Journals
� Agricultural Situation in India, Directorate, Economics and Statistics, Ministry of
Agriculture, Govt. of India New Delhi.
� Economic and Political Weekly Bombay.
� Indian Economic Review, Delhi School of Economics.
� Indian Journal of Agricultural Economics, Indian Society of Agricultural Economic
Bombay.
� Kurukshetra, Ministry of Rural Development.
� Margin, National Council of Applied Economics Research.
� State Bank of India, Monthly Review State Bank of India Central Office, Bombay.
� The Hindu Survey of Indian Agriculture, Madras.
� Yojana Bhawan, New Delhi and Lucknow.

REPORTS
� Report of the Indian Famine Commission, Government of India, New Delhi, 1880. � Report of the Royal Commission on Decentralisation, Government of India, New
Delhi, 1909. � Report of the Cooperative Planning Committee, Government of India, New Delhi,
1946. � Report of the Grow More Food Enquiry Committee, Government of India, New
Delhi, 1952. � Report of Foodgrain Enquiry Committee (Ashoka Mehta Committee) Government of
India, 1957. � Report of the Team for the Study of Community Projects and National Extension
Service, (Balwant Ray Mehta Committee), Government of India, New Delhi, 1958. � Report of the Jha Committee on Foodgrain Prices for 1964-65, Government of India,
New Delhi, 1965. � Report of All India Rural Credit Review Committee, Reserve Bank of India, Bombay,
1966. � Report of Banking Commission, Government of India, New Delhi, 1972. � Report of Irrigation Commission, Government of India, New Delhi, 1972. � Report of the Committee on Unemployment, (Bhagwati Committee), Government of
India, 1973. � Report of the Committee on Panchayat Raj Institutions (Ashoka Mehta Committee)
Government of India, New Delhi, 1978. � Report of the Committee to Review Arrangement for Institutional Credit for
Agriculture and Rural Development, (CRAFICARD) (Chairman B. Sivaraman) R. B.
I., Bombay, 1981. � Report of the Working Group on District Planning (Chairman C.H. Hanumantha
Rao), Planning Commission, New Delhi, 1985.

Publications of AERC, Allahabad
� Report of the Impact of New Technology on Economic Condition of the Farmers in
Gorakhpur District, 1977.
� Report of the Performance of High Yielding Varieties of Wheat in East u.P.
(Gorakhpur and Basti Distt.) 1977.
� Report of the Agricultural Development in U.P. 1970-71 to 1975-76, 1979.
� Report of the Agricultural Development in Eastern U.P., 1979.
� Report of the Impact of Consolidation of Holdings on Agricultural Production in East
U.P., 1981.
� Report of the Management of Social Forestry in U.P., 1986.
� Report of the A Study of impact of recent drought on the Economic Conditions of
rural People in Uttar Pradesh (1987-88) 1989.
� Report of the Impact of National Watershed development Projects on Rainfed
Agriculture in U.P., 1989.
� Report of the Impact of Pulse Development project on Weaker Sections of Farming
Community in Uttar Pradesh, 1990.
� Report of the Evaluation of Centrally Sponsored Scheme for assistance to Small and
Marginal Farmers for Increasing Agricultural Production in Uttar Pradesh, 1990.
� Report of the Evaluation of the Impact of Centrally Sponsored Scheme of
Reclamation of Alkaline Soils on Sections in U.P., 1991.
� Report of the Impact of Increase in Fertilizers Prices on Demand/ Consumption of
Fertilizers in U.P., 1992.
� Report of the Emerging Problems of Agricultural Marketing with Social Focus on
Processing in U.P., 1992.
� Report of the Impact of Subsidies on Agricultural Development in Uttar Pradesh,
1993.
� Report of the Decentralized Planning in Agriculture and Rural Development, 1993.
� Report of the Resource Constraints to Adoption of Recommendations Under T& V
System of Extension, 1994.
� Report of the Evaluation of Implementation of Central sector Scheme on Promotion
of agricultural Mechanization Through Small Tractors (A Condensed Report), 1996.
� Report of the Economics of Bee-keeping in U.P., 1996.
� Report of the Evaluation of Fish Farmers Development Agencies in U.P., 1997.
� Report of the Economics of Poultry Production and Role of Unorganized Sector in
Uttar Pradesh, 1998.
� Report of the Evaluation of the Performance of Krishi Vigyan Kendra in U.P., 1999.
� Report of the Development of Infrastructure for the Export of Agro-Products from
U.P., 1999.
� Report of the Socio-Economic Evaluation of the National Integrated Pest
Management Programme (IPM) for the Rice in U.P., 2000.
� Report of the Evaluation of Impact on Production and Export of Central sector
Scheme Integrated Programme for Development of SPICES Implemented during VIII
Plan., 2001.
� Report of the Development of Floriculture in U.P. Problems and Prospects, 2000.

� Report of the Impact of Minimum Support Prices on Agricultural Economy in U.P.,
2001.
� Report of the Likely Impact of Liberalized Imports and Low Tariff on Edible Oil
Sector in U.P., 2001.
� Report of the Assessing the Existing Training and Testing Facilities for Farm
Machinery in U.P., 2001
� Report of the Agricultural Input Subsidies in India: Quantum of Subsidies to SC
Farmers in U.P., 2002.
� Report of the Evaluation –Usar (Sodic Land) Reclamation Programme in U.P., 2003
� Report of the Rural Non-Farm Employment in U.P., 2003.
� Report of the Building U.P. of an Efficient Marketing System to Obviate the Need
for a Large Scale State Intervention, 2003.
ACTION TAKEN
1. Comments received - 12/03/2004
2. Date of Dispatch of report - 13/04/2004
I am extremely grateful to Dr. R.S. Deshpande, Professor and Head
ADRT Unit Bangalore for his valuable comments on the draft report
"Agricultural Policy in Uttar Pradesh and Uttaranchal - A Policy Matrix".
Most of his comments have been in corporate in the final report. The details
of action taken against the comments are given below.
1. The plan-wise growth rate and percentage change over time of area,
production and productivity of major crops have been incorporated in
the final report.
2. The part of WTO has been separated from report and sent to Prof.
Samar Dutta, CMA, Indian Institute of Management Ahemdabad.


Annexure-1
Level of Economic Development in Various Regions of U.P.
Development Indicator Eastern Western Central Bundelkhand U.P.
1 2 3 4 5 6
A Population
1 Density of population
(per sq.km.) 776 765 658 280 689
2 Decennial growth in population
(%) (1991-01) 26.35 26.05 24.73 22.32 25.80
3 Percentage of urban population
to total population (2001) 11.78 28.25 25.11 22.46 20.78
4 Percentage share in State’s
population (2001) 40.11 36.76 18.17 4.96 100.00
5 Percentage of villages having
population less than 200 to total
villages
(1991)
14.79 8.95 5.48 9.98 11.07
6 Literacy percentage total (2001)
(Male) 55.22 58.44 59.04 60.332 57.36
7 Literacy percentage (2001)
(Female) 39.54 44.64 47.12 44.18 42.98
8 Senior Basic School 31 31 27 24 30
B III Infrastructural
Facilities
9 Length of PWD Roads per lakh
of population (km.) (2000-1) 56.55 59.72 58.86 100.26 60.30
10 Length of PWD Roads per
thousand sq. km. of area
(km) (2000-01)
440.31 455.41 387.66 279.97 415.63
11 Per capita power consumption
(kwh) (2000-01) 169.12 186.5 170.0 155.0 175.0
12 Percentage of electrified
villages to total villages
(2001-02)
77.90 88.81 72.55 69.94 79.27
13 Percentage of net area irrigated
to net area sown (2000-01) 69.2 88.01 73.9 42.3 73.7
14 Percentage of water logged area
to total Kharif area (2000-01) 10.22 0.06 0.71 0.00 3.92
C Agriculture and Allied
15 Percentage of holdings of
less than 1.0 hectare area
(1995-96)
83.00 68.80 76.55 70.30 75.40
16 Average size of holdings
(in hect.) (1995-96)
0.65 1.02 0.83 1.72 0.86
17 Fertilizer distribution per 116.86 140.60 109.40 36.27 117.05

hectare of gross cropped area
(kgs) (2000-01)
18 Gross value of agricultural
output per hectare of gross
cropped area (1999-2000)
(at current prices) (Rs.)
19388 25572 20703 13031 21398
19 Net sown area per capita
rural (hec.) (1999-2000)
0.10 0.14 0.14 0.31 0.13
20 Productivity of major crops
(qtls. Hect.) (2000-01)
i. Total foodgrains 20.05 26.18 19.77 10.91 21.04
ii. Wheat 24.17 32.34 25.54 19.47 27.24
Iii. Rice 20.02 21.58 17.36 9.79 19.77
Iv. Potato 182.10 242.79 168.79 213.12 213.11
v. Oilseeds 6.39 11.19 7.12 5.52 8.25
vi. Sugarcane 474.48 578.7 512.79 427.37 547.2
21 Per capita foodgrains
production (kgs) (2000-01)
235.82 288.36 233.39 2889.79 257.36
D Employment and
Manpower
22 Percentage of main workers
to total population (1991)
29.5 28.3 30.6 32.7 29.4
23 Main workers engaged in
agriculture to total main
workers (1991)
77.3 66.7 72.9 78.4 72.8
24 Per rural person gross value
of agricultural produce (Rs.
at current prices) (1999-
2000)
5675 5675 4304 4814 4179
25 Per capita net output from
commodity producing sector.
(Rs. at current prices) (1999-
2000)
6995 12385 9637 9267 9765
Source: Annual Plan 2003-04 Vol.-I (Part-I) Uttar Pradesh.