Embed Size (px)
Citation preview

UTTARAKHAND AND HIMACHAL PRADESH
(A Comparative Study of Development)
2012-13
Directorate of Economics & Statistics Government of Uttarakhand 100/6, Neshvilla Road, Dehradun-248001 Telefax: 0135-2712604

Research Team: Dr. Manoj Kumar Pant, Joint Director
Shri. A.S. Bisht, Economics and Statistics Officer
Shri Satendra Kumar, Addl. Statistical Officer
Shri.Brijesh Kumar, Asst. Statistical Officer
Shri Anil Kotiyal Data Entry Operator

CONTENTS
S.No. Particulars Page No. 1 Introduction 1
2 Population and area 1
3 Agriculture and allied activities 1-3
4 Infrastructure 3-5
5 Social Sector 5-6
6 Other Sector 6-8
7 Gross State Domestic Product 8-9
8 Graph & Charts 10-13
9 Pictorial Presentation 14-19

FOREWORD I am pleased to note that the Directorate of Economics & Statistics (DES) has
come out with 4th edition of Uttarakhand and Himachal Pradesh a Comparative Study of Development 2012-13. It contains a comparison of various economic and
social indicators between two States.
I hope that this publication would be useful for researchers, policy makers and
development administrators to consider suitable policy changes.
I am happy to record my appreciation of sincere efforts of the officers and staff
member of the Directorate of Economics & Statistics involved with this publication.
Sd.
¼S.Ramaswamy½
Principal Secretary (Planning) Govt. Of Uttarakhand, Dehradun.

Acknowledgement
Directorate of Economics and Statistics, Uttarakhand has brought out fourth issue of "Uttarakhand and Himachal Pradesh, a comparative study of Development". It contains a comparison of various economic and social indicators between two states. Latest data available on different sectors of Uttarakhand and Himachal Pradesh have been incorporated in this publication which show actual picture of both states. Efforts made by the Officers and the staff preparing this issue, are praise worthy.
I hope this publication would be helpful for researchers, administrators, policy makers and other users to understand the current economic and social status of Uttarakhand and Himachal Pradesh.
Sd. (Y.S.Pangtey)
Director, Economics & Statistics Uttarakhand, Dehradun

Uttarakhand and Himachal Pradesh: A Comparative Study of Development
1- Introduction 1.1- Uttarakhand and Himachal Pradesh are two neighboring Himalayan states. These are
alike with respect to various characteristics, such as topography, demography, socio-
economic development pattern and are very much similar in respect of geographical area,
forest cover, and climate. Before analyzing the socio-economic development, it is necessary
to go through the historical background of two states. Himachal Pradesh came into existence
in 1948 as a centrally administered territory. The most important fact is that it has
participated in all five year plans. Though it became full state in the year 1971. On the
contrary, Uttarakhand came into existence as a separate state on November 9, 2000. From
the Sixth five-year plan onwards, a separate hill sub plan was formulated for the hill regions
but the utilization of plan funds was relatively lower for the hilly regions. It created a massive
gap between two states in the development growth. For the publication it is an attempt to
analyze the socio economic pattern and the development scenario of Uttarakhand and
Himachal Pradesh. For analytical studies, indicator wise analysis have been opted within
different secto` For this a perfect time point has not been taken because data of all the
selected indicators for a specific time-point are not available. Except other data sources,
data from statistical Diary Uttarakhand and statistical outline of Himachal Pradesh of
different years have been taken for the comparison of two states.
This publication mostly concentrates on sector wise comparative study of two
states by which we can analyse each and every socio-economic indicator. The details are as
under:-
2- Population and area As per Census 2011 total population of Uttarakhand is 100.87 Lakh and 68.65 Lakh
of Himachal Pradesh Density of population in Uttarakhand is 189 per sq km and 123 per sq.
km. in Himachal Pradesh. Both states are much similar by geographical area. Total
geographical area of Uttarakhand is 53483 sq. km whereas 55673 sq. km. of Himachal
Pradesh.
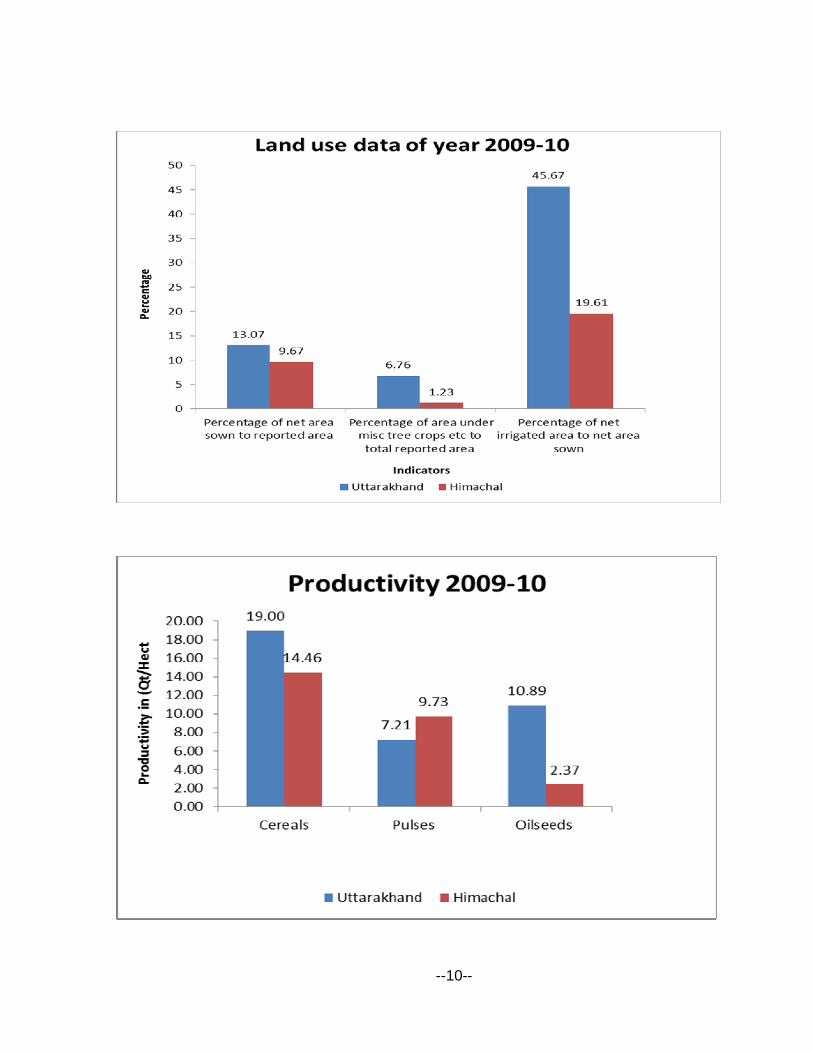
3- Agriculture and allied activities 3.1 Agriculture: First and foremost, the land use pattern between two states should be
analyzed. For the year 2009-10, Percentage of net area sown to total reported area of
Uttarakhand is 13.07 compared to 9.67 of Himachal Pradesh and the difference is only
--1--

marginal but the percentage of net irrigated area to net area sown of Uttarakhand is
higher as (45.67) compared to Himachal Pradesh (19.61). There is much difference which
has been found as far as productivity of different crops is concerned. Productivity of
pulses for 2009-10 in Uttarakhand is relatively lower as compared to Himachal Pradesh
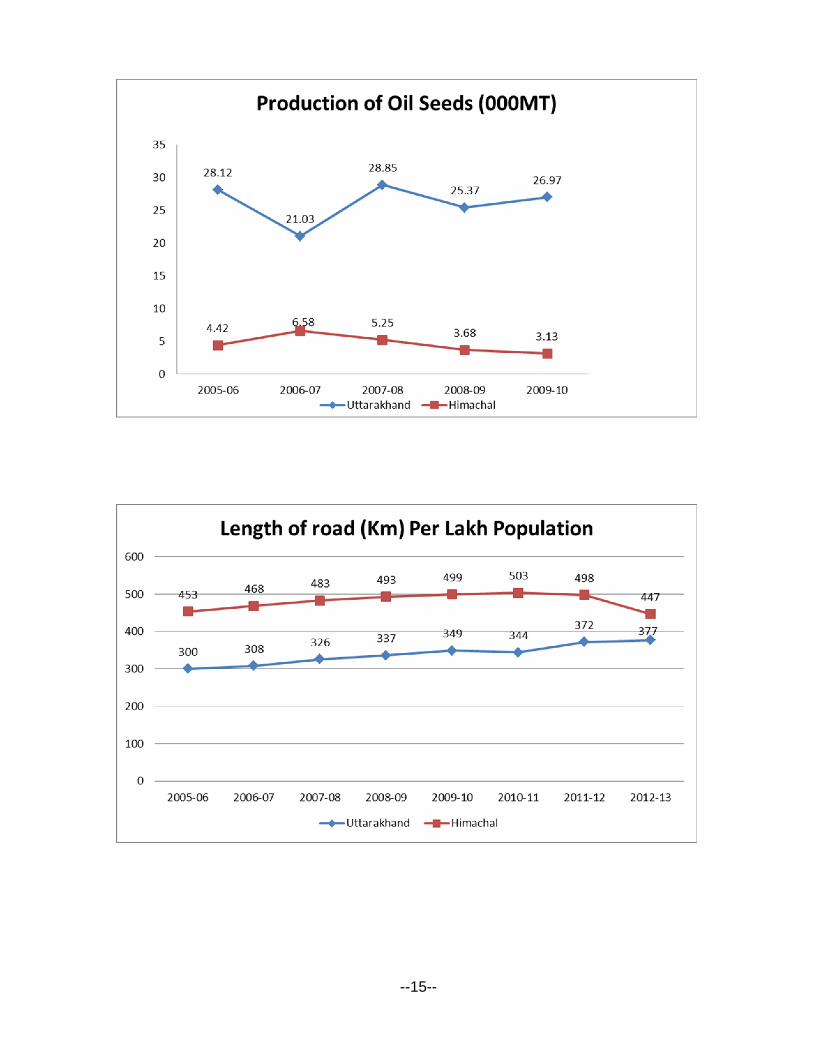
but much higher in respect of sugarcane and oilseeds. Food sufficiency indicator, per
captia production of cereals in Himachal Pradesh for the year 2009-10 is 164.15 kg, is
relatively lower than Uttarakhand (173.10 kg).
3.2 Horticulture: Uttarakhand leads in the production of fruit. In the year 2011-12 production
of fruit in Uttarakhand was 802124 Mt while it was 372820 Mt in Himachal Pradesh. and
area under fruit cultivation in Himachal Pradesh was 214574 Hects, which is higher than
the area 200727 Hects of Uttarakhand but productivity of fruit in Uttarakhand is much
higher than Himachal Pradesh. 3.3 Live Stock: As per livestock census 2007, number of cattle and Buffaloes in Uttarakhand
is 51.41 lakhs while it is 52.16 lakhs in Himachal Pradesh, which is similar to each other. 3.4 Forestry: Total area under forest in Uttarakhand is 3484803 Hects. (61.43%) while it is
3703297 Hects in Himachal Pradesh (66.52%). Table-1
AGRICULTURE AND ALLIED ACTIVITIES
Sector Indicators Uttarakhand Himachal Pradesh
1. Agriculture (a) Land use pattern 1- Percentage of net area sown to reported area (2009-10)
13.07 9.67
2- Percentage of area under misc tree crops etc to total reported area (2009-10)
6.76 1.23
3- Percentage of net irrigated area to net area sown (2009-10)
45.67 19.61
4- Cropping intensity (2009-10)
157.39 174.70 (b) Productivity (2009-10) qt/Hect
1- Cereals 19.00 14.46 2-Pulses 7.21 9.73 3-Oilseeds 10.89 2.37 4-Others crops- Sugarcane 608.92 211.89 (c) Per Capita production 1- Per capita production of cereals (kg) (2009-10)
173.54 164.15
2- Per capita production of pulses (kg) (2009-10)
3.79 3.11
--2--

2. Horticulture 1- Area of fruit cultivation (hect) (2011-12)
200727 214574
2- Production of fruits (Mt) (2011-12) 802124 372820 3. Live Stock Total live stock (lakh) 2007 51.41
52.16
(1) Cattle and Buffaloes 34.55 30.30
(2) Sheep 2.90 9.01
(3) Goats 13.35 12.41 (4) Horses, Ponies, Mules, etc. 0.61 0.44
4. Forestry (1) Total Forest area (Hect.) (2009-10)
3484803 3703297
(2) Percentage of area under forest to total reported area
61.43 66.52
4- Infrastructure 4.1 Road: The Tenth plan document of Himachal Pradesh reflects that in Himachal
Pradesh the road length per lakh population was 307 km in 1971. In the year 2012-
13, road length per lakh population for Himachal Pradesh was 446.83 km. In case of
Uttarakhand, the road length per lakh population in 1999 was only 239 Km. It was very
low as compared with1971 figure of Himachal Pradesh. The main reason for this grim
situation can be attributed to the higher rate of growth of population. In the year 2012-
13 the length of roads per lakh population of Uttarakhand is 381.02 km. 4.2 Drinking Water: On the basis of Tenth plan document of Himachal Pradesh. The State
achieved the status of supplying safe drinking water to each and every inhabited villages
in 1995. Uttarakhand is considered lacking even after a period of ten year Till the year
2012-13 Uttarakhand could cover 99.98 percent inhabited villages. Out of inhabited
revenue villages (15546), 15544 inhabited revenue villages achieved the status of
supplying safe drinking water. 4.3 Communication: In communication sector Total No. of Post offices in Himachal Pradesh
was 2778 while it was 2719 in Uttarakhand.in year 2012-13.Thus there is not much
different between Uttarakhand and Himachal. 4.4 Tourism: Figure for the year 2011-12 depicts that better infrastructural facilities are
available in Himachal Pradesh to attract Tourists. Though the absolute number of tourist
reaching Uttarakhand is much more than to that of Himachal Pradesh. Whereas there is
a very high flow of foreign and high spending tourist in Himachal Pradesh, Uttarakhand
dominates in pilgrimage tourism.
--3--
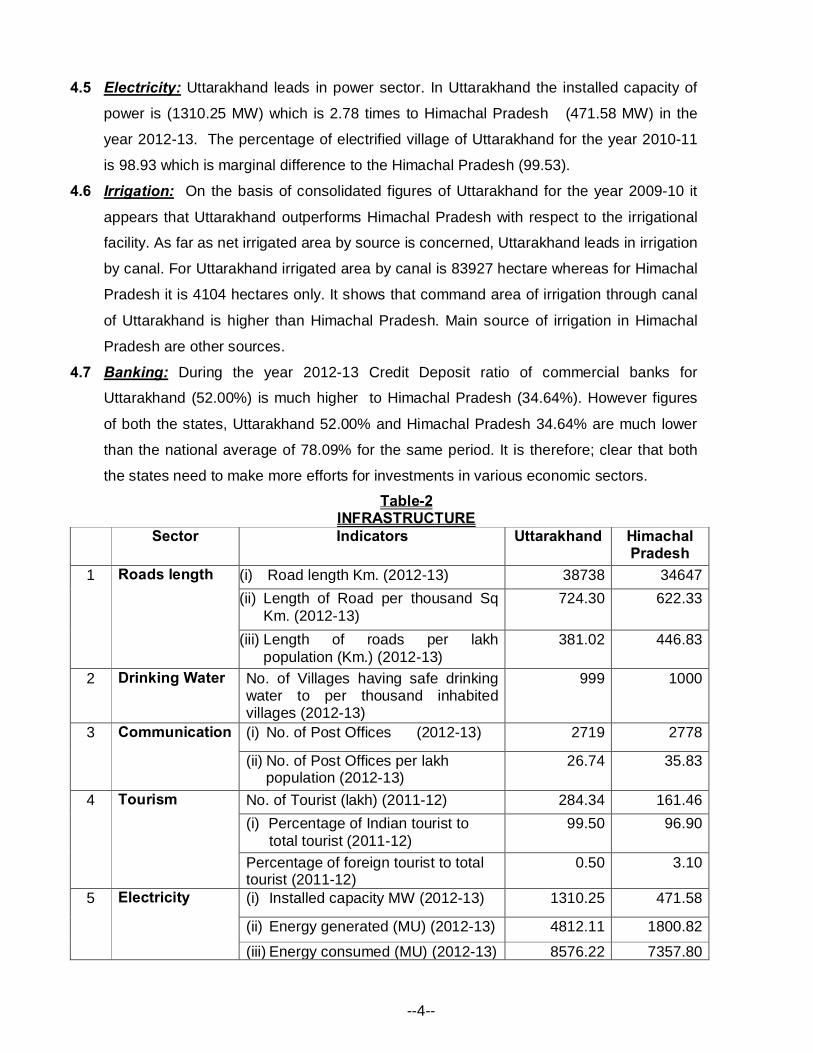
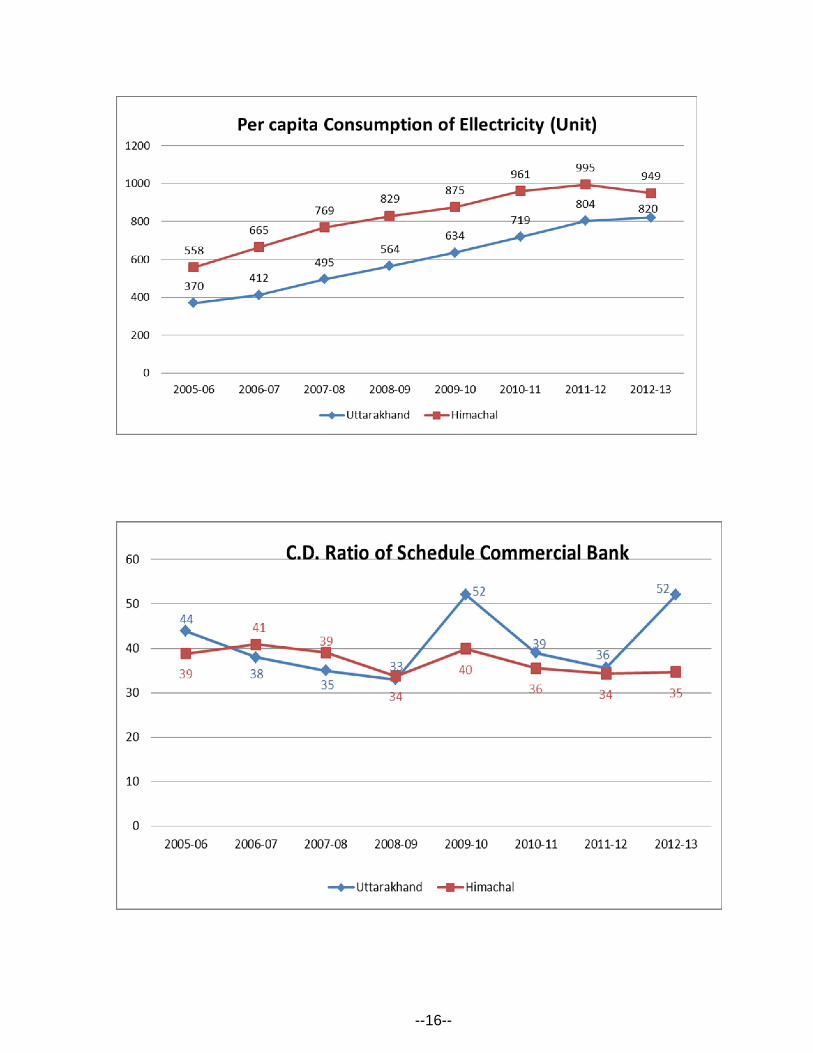
4.5 Electricity: Uttarakhand leads in power sector. In Uttarakhand the installed capacity of
power is (1310.25 MW) which is 2.78 times to Himachal Pradesh (471.58 MW) in the
year 2012-13. The percentage of electrified village of Uttarakhand for the year 2010-11
is 98.93 which is marginal difference to the Himachal Pradesh (99.53). 4.6 Irrigation: On the basis of consolidated figures of Uttarakhand for the year 2009-10 it
appears that Uttarakhand outperforms Himachal Pradesh with respect to the irrigational
facility. As far as net irrigated area by source is concerned, Uttarakhand leads in irrigation
by canal. For Uttarakhand irrigated area by canal is 83927 hectare whereas for Himachal
Pradesh it is 4104 hectares only. It shows that command area of irrigation through canal
of Uttarakhand is higher than Himachal Pradesh. Main source of irrigation in Himachal
Pradesh are other sources. 4.7 Banking: During the year 2012-13 Credit Deposit ratio of commercial banks for
Uttarakhand (52.00%) is much higher to Himachal Pradesh (34.64%). However figures
of both the states, Uttarakhand 52.00% and Himachal Pradesh 34.64% are much lower
than the national average of 78.09% for the same period. It is therefore; clear that both
the states need to make more efforts for investments in various economic sectors.
Table-2 INFRASTRUCTURE
Sector Indicators Uttarakhand Himachal Pradesh
1 Roads length (i) Road length Km. (2012-13) 38738 34647 (ii) Length of Road per thousand Sq
Km. (2012-13) 724.30 622.33
(iii) Length of roads per lakh population (Km.) (2012-13)
381.02 446.83
2 Drinking Water No. of Villages having safe drinking water to per thousand inhabited villages (2012-13)
999 1000
3 Communication (i) No. of Post Offices (2012-13) 2719 2778
(ii) No. of Post Offices per lakh population (2012-13)
26.74 35.83
4 Tourism No. of Tourist (lakh) (2011-12) 284.34 161.46 (i) Percentage of Indian tourist to
total tourist (2011-12) 99.50 96.90
Percentage of foreign tourist to total tourist (2011-12)
0.50 3.10
5 Electricity (i) Installed capacity MW (2012-13) 1310.25 471.58
(ii) Energy generated (MU) (2012-13) 4812.11 1800.82
(iii) Energy consumed (MU) (2012-13) 8576.22 7357.80
--4--
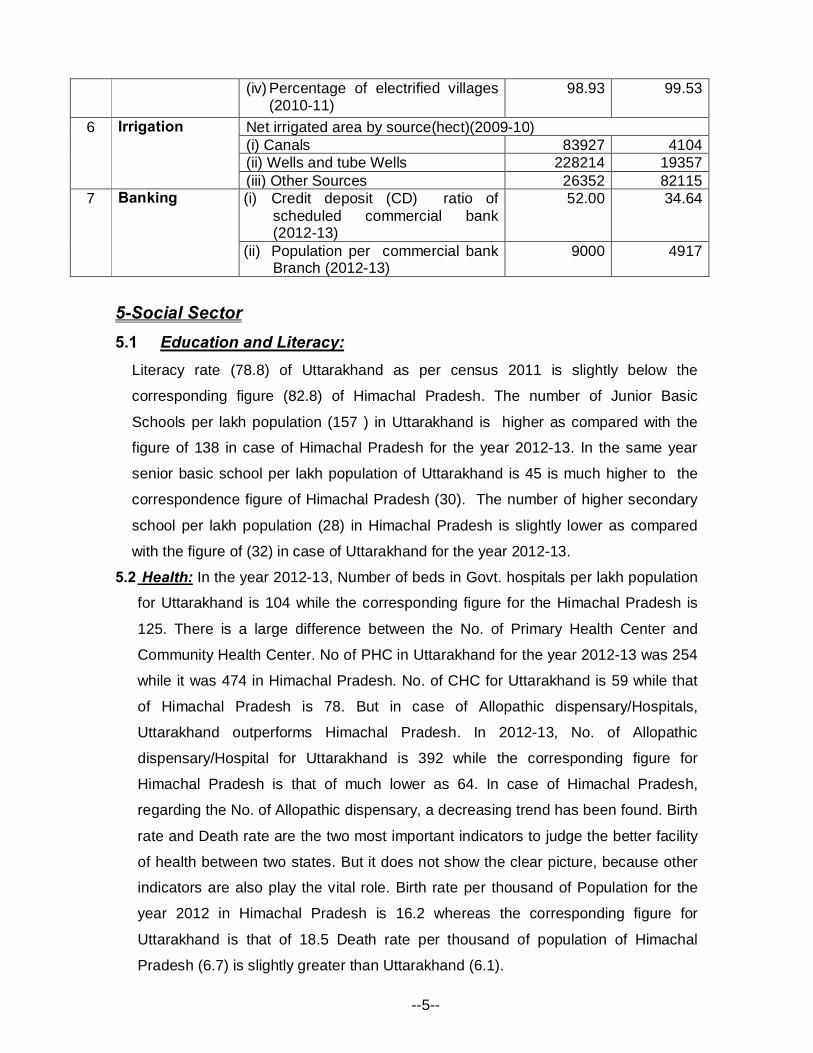
(iv) Percentage of electrified villages (2010-11)
98.93 99.53
6 Irrigation Net irrigated area by source(hect)(2009-10) (i) Canals 83927 4104 (ii) Wells and tube Wells 228214 19357 (iii) Other Sources 26352 82115
7 Banking (i) Credit deposit (CD) ratio of scheduled commercial bank (2012-13)
52.00 34.64
(ii) Population per commercial bank Branch (2012-13)
9000 4917
5-Social Sector 5.1 Education and Literacy:
Literacy rate (78.8) of Uttarakhand as per census 2011 is slightly below the
corresponding figure (82.8) of Himachal Pradesh. The number of Junior Basic
Schools per lakh population (157 ) in Uttarakhand is higher as compared with the
figure of 138 in case of Himachal Pradesh for the year 2012-13. In the same year
senior basic school per lakh population of Uttarakhand is 45 is much higher to the
correspondence figure of Himachal Pradesh (30). The number of higher secondary
school per lakh population (28) in Himachal Pradesh is slightly lower as compared
with the figure of (32) in case of Uttarakhand for the year 2012-13. 5.2 Health: In the year 2012-13, Number of beds in Govt. hospitals per lakh population
for Uttarakhand is 104 while the corresponding figure for the Himachal Pradesh is
125. There is a large difference between the No. of Primary Health Center and
Community Health Center. No of PHC in Uttarakhand for the year 2012-13 was 254
while it was 474 in Himachal Pradesh. No. of CHC for Uttarakhand is 59 while that
of Himachal Pradesh is 78. But in case of Allopathic dispensary/Hospitals,
Uttarakhand outperforms Himachal Pradesh. In 2012-13, No. of Allopathic
dispensary/Hospital for Uttarakhand is 392 while the corresponding figure for
Himachal Pradesh is that of much lower as 64. In case of Himachal Pradesh,
regarding the No. of Allopathic dispensary, a decreasing trend has been found. Birth
rate and Death rate are the two most important indicators to judge the better facility
of health between two states. But it does not show the clear picture, because other
indicators are also play the vital role. Birth rate per thousand of Population for the
year 2012 in Himachal Pradesh is 16.2 whereas the corresponding figure for
Uttarakhand is that of 18.5 Death rate per thousand of population of Himachal
Pradesh (6.7) is slightly greater than Uttarakhand (6.1).
--5--

Table-3 Social Sector
Sl.
No.
Sector Indicators Uttarakhand Himachal
Pradesh
1 Education (i)Literacy rate (2011) 78.8 82.8
(ii)Student Teacher ratio-(2012-13)
(a) Primary 21 15
(b) Senior basic 37 29
(c) Higher secondary 37 14
(d) Degree /Post Graduate 108 38
(iv) No of schools per lakh population
(2012-13):-
(a) Junior basic school 157 138
(b) Senior basic school 45 30
(c) Higher secondary school 32 28
(d) Degree colleges/ Post Graduate
colleges
1 1
2 Health (i) No. of Primary health centers
(PHC) (2012-13)
254 474
(ii) No. of community health centers
(CHC) (2012-13)
59 78
(iii) No. of Allopathic dispensary/
hospitals (2012-13)
392 64
(iv) No. of beds per lakh population
in Govt. hospitals(2012-13)
104 125
(v) Crude birth rate per thousand
population 2012
18.5 16.2
(vi) Crude death rate 2012 6.1 6.7
(vii) Infant Mortality Rate 2012 34 36
6-Other sectors 6.1 Revenue Receipts:- While analyzing the economic activities, it is important to
compare the revenue receipts between two states. Percentage of tax revenue to total revenue
for Uttarakhand for the period 2011-12 is 61.95 while the corresponding figure of Himachal
--6--

Pradesh is that of 42.87 Percentage of non-tax revenue to total revenue for Uttarakhand (8.3)
is much less than the Himachal Pradesh (12.97) for the period 2011-12. Per capita revenue
receipts of Uttarakhand for the year 2011-12 is ` 13574, whereas in case of Himachal Pradesh
the corresponding figure is ` 20946. In case of per capita revenue expenditure for the same
period, Himachal Pradesh (` 20017) is higher than Uttarakhand (` 17314).
6.2 Plan investment in public sector:- Total outlay for 11th five year plan for
Uttarakhand is `2563970 Lakhs whereas the corresponding figure for Himachal Pradesh is
`1400000. Lakhs. Plan outlay for Uttarakhand is more than that of Himachal Pradesh. For
annual plan 2012-13, Uttarakhand outlay is ` 780953 Lakhs while the corresponding figure for
the Himachal Pradesh is ` 370000 Lakhs. It is important that Uttarakhand has to invest more
for infrastructure and different social sector and other socio and economic sector. Hence
proposed outlay of uttarakhand is much larger than Himachal Pradesh.
6.3 Per capita outlay: Per capita outlay for the year 2012-13 for Uttarakhand ` 7681 while
the corresponding figure for the Himachal Pradesh is ` 4772. It clearly shows that Govt. of
Uttarakhand has allocated comprehensive amount of money for the development of
Uttarakhand people in comparison to Himachal Pradesh.
Table-4
Other Sector Sl. No
Sector Indicators Uttarakhand Himachal Pradesh
1 Other sectors
(A) Revenue Receipts-2011-12 (i)Tax revenue(lakhs) 848166 633051 (ii)Non Tax revenue (lakhs) 113607 191520 (iii) Grants –in-aid (lakhs) 407369 652137
Total revenue receipts 1369142 1476708 (iv)Percentage of tax revenue receipts to total revenue receipts
61.95 42.87
(v)Percentage of non tax revenue receipts to total revenue receipts
8.30 12.97
(vi) Percentage of grants-in-aid to total revenue receipts
29.75 44.16
(vii) Per capita revenue receipts(`) 13574 20946 (B) Revenue expenditure-2011-12 (i) Revenue expenditure (lakh ) 1746352 1389797 (ii)Per capita revenue expenditure (`) 17314 20017
2 Plan investment in public sector
(i) Total outlay for 11th five year plan (` Lakhs) (2007-12)
2563970 1400000
(ii) Proposed outlay for annual plan 2012-13 (` Lakhs)
780953 370000
3 Per capita outlay
Per capita outlay for the year 2012-13 in (`) 7681 4772
--7--

7-Gross State Domestic product GSDP is one of the most well accepted indicator to judge the economic
performance of a state. The GSDP of Uttarakhand and Himachal Pradesh can be
summarized in the following table:-
Table-5 Gross State Domestic Product
(Base year 2004-05)
Sl.No Estimates Uttarakhand Himachal Pradesh 1. GSDP (` in Crores) At Current
Prices At Constant Prices
At Current Prices
At Constant Prices
(i) GSDP of year 2008-09 56025 42832 41483 33210 (ii) GSDP of year 2009-10 70730 50598 48189 35897 (iii) GSDP of year 2010-11 83969 55667 57452 39054 (iv) GSDP of year 2011-12 97858 60880 64957 41908
(v) GSDP of year 2012-13 107868 64293 73710 44480 (vi) GSDP of year 2013-14 122433 67927 85585 47255 (vii) Growth Rate of GSDP
(Percent) 2008-09 22.18 12.65 22.14 7.42
(viii) Growth Rate of GSDP (Percent) 2009-10
26.25 18.13 16.17 8.09
(ix)Growth Rate of GSDP (Percent) 2010-11
18.72 10.02 19.22 8.79
(x)Growth Rate of GSDP (Percent) 2011-12
16.54 9.36 13.06 7.31
(ix)Growth Rate of GSDP (Percent) 2012-13
10.23 5.61 13.48 6.14
(x)Growth Rate of GSDP (Percent) 2013-14
13.50 5.65 12.04 6.24
2. (i) State per capita income
(`)2008-09 50657 - 49903 -
(ii)State per capita income (`) 2009-10
62757 - 58402 -
(iii)State per capita income (`) 2010-11
73819 - 68297 -
(iv)State per capita income (`) 2011-12
85372 - 75185 -
(iv)State per capita income (`) 2012-13
92191 - 83899 -
(iv)State per capita income (`) 2013-14
103349 - 92300 -
--8--

From the above table it is very clear that growth rate of GSDP of Uttarakhand
increased from year 2008-09 to 2009-10 and after that growth rate is downwards up to the
year 2012-13 in the year 2013-14 growth rate is slightly upward whereas of Himachal
Pradesh at constant price the growth rate has increased constantly from the year 2008-09 to
2010-11after that the growth is slightly downwards in the year 2011-12 further for the year
2013-14 the growth is slightly up. In the reference period (2008-09 to 2013-14) in Himchal
growth at current prices is down almost half.
GSDP of Uttarakhand for the year (2008-09) is ` 42832.45 crores GSDP (constant
price) of Uttarakhand for the year 2013-14 is ` 67927 crores. The percentage increase in
GSDP in 6 years is 59. In case of Himachal Pradesh GSDP of base year (2008-09) is `
33210 crores GSDP (constant price) of Himachal Pradesh in 2013-14 is ` 47255 crores the
percentage increase in GSDP in 6 years is 42 percent. Hence in the reference of 6 years
period 59 percent increase in GSDP of Utarakhand with respect to Himachal Pradesh(42%).
It is a good significance for investment in Uttarakhand economy development.
--9--

PICTORIAL PRESENTATION
UTTARAKHAND
V/S
HIMACHAL PRADESH
COMPARISION OF SELECTED
INDICATORS FOR DIFFERENT YEARS
--10--

--11--

--12--

--13--
PICTORIAL PRESENTATION
UTTARAKHAND V/S
HIMACHAL
Comaparison of Selected Indicator for
Different Years

--14--
--15--
--16--

--17--

--18--

--19--
References:- All Data
1. Statistical Outline Himachal Pradesh
2. Statistical Diary Uttarakhand