Embed Size (px)
Citation preview

1
Utilization of mid-upper arm circumference versus
weight-for-height in nutritional
rehabilitation programmes:
a systematic review of evidence
Dominique Roberfroid1,2
Naïma Hammami1,3
Carl Lachat1,4
Zita Weise Prinzo5
Victoria Sibson6
Benjamin Guesdon7
Sylvie Goosens8
Patrick Kolsteren1,4
October 2013
1 Woman & Child Health Research Centre, Institute of Tropical Medicine, Antwerp, Belgium
2 Belgian Health Care Knowledge Centre, Brussels, Belgium
3 Institute of Public Health, Brussels, Belgium
4 Department of Food Safety and Food Quality, Ghent University, Belgium
5 Department for Health and Development, WHO HQ, Geneva
6 Save the Children – UK
7 Action Contre la Faim – France
8 Médecins Sans Frontières – France
Corresponding author: Dominique Roberfroid, Woman & Child Health Research Centre, Institute of
Tropical Medicine, 155 Nationalestraat, 2000 Antwerp, Belgium, [email protected]
This work was commissioned by the World Health Organization.
Authors declare that they have no conflict of interest.

2
Abbreviations
CI confidence interval
F-75 therapeutic milk used in stabilization phase of the treatment of SAM
F-100 therapeutic milk used in transition and recovery phases of the treatment of SAM
IQR interquartile range
MUAC mid-upper arm circumference
NCHS National Center for Health Statistics
NGO nongovernmental organization
OTP outpatient treatment programme
PICO Population, Intervention, Comparator and Outcomes
RCT randomized controlled trial
RUTF ready-to-use therapeutic food
SAM severe acute malnutrition
SD standard deviation
SFP supplementary feeding programme
W/H weight-for-height
WHM W/H percentage of the median
WHO World Health Organization
WHO-GS World Health Organization Child Growth Standards
WHZ weight-for-height z-score
Measurements
cm centimetre
d day
g gram
kcal kilocalorie
kg kilogram
kJ kilojoule
m month
ml millilitre
mm millimetre
n number
w week

3
Abstract
Background
A low mid-upper arm circumference (MUAC) <115 mm is increasingly used as a stand-alone
anthropometric admission criterion for nutritional rehabilitation of severely acute malnourished
children, alongside a low weight-for-height z-score (WHZ) <-3. As these two indicators correlate
poorly, we reviewed the evidence on the comparative outcomes of children with severe acute
malnutrition (SAM) admitted to and discharged from nutritional rehabilitation programmes on the
basis of either MUAC or WHZ. The utilization of bilateral pitting oedema as an independent indicator
of SAM was out of the scope of our review.
Methods
We searched Medline, Embase, the CRD databases, the Cochrane Library and grey literature for
evidence on mortality, recovery, treatment duration, costs, adverse events and population coverage
when admission of SAM children was based on MUAC vs WHZ.
Findings
Eleven studies were included. Only one cohort study directly compared children with a MUAC <115
mm and those with WHZ <-3 at the start of the nutritional rehabilitation. It reported similar mortality
rates in both groups, although different causalities might have been involved as a low MUAC was
more associated with stunting, younger age, being a female and nutritional oedema than a low WHZ.
Four studies admitted SAM children on the basis of MUAC only. The mortality risk was relatively
low in three studies (2.1%). The mean standard deviation (±SD) recovery time ranged from 44±30
days to 50±26 days, and the daily MUAC gain from 0.17±0.16 mm to 0.51±0.3 mm. These findings
were consistent with six additional studies where WHZ but not MUAC was the admission criterion.
Overall, the increase in MUAC paralleled the daily weight gain, which ranged between 2.0 and 6.5
g/kg/day. One study reported a lower daily MUAC gain when children were younger and smaller, and
in females. Two studies discharged children on the basis of MUAC (MUAC ≥124 mm only or MUAC
≥130 mm), but did not report on outcomes after discharge. The most appropriate MUAC cut-off for
discharge is thus unknown. No study reported on costs, adverse effects or population coverage. No
study assessed the outcomes of children with a low WHZ excluded from treatment because they did
not fulfil the MUAC stand-alone admission criterion.
Conclusion
There are indications that MUAC could be used adequately as a stand-alone criterion for SAM
children to be admitted to and discharged from nutritional rehabilitation programmes. However, the
evidence base is currently insufficient. More data are particularly needed on the risks of children with
a low WHZ not treated for SAM where MUAC is used as a stand-alone criterion. The extent to which
factors such as age, sex and stunting affect the rehabilitation outcomes in children admitted with
MUAC <115 mm must also be clarified. There are numerous nutritional programmes currently active
worldwide and their thorough evaluation could generate such data in the short term.
This work was commissioned by the World Health Organization (WHO).
Authors declare that they have no conflict of interest.

4
Background and objective
In 1999, the World Health Organization (WHO) defined severe acute malnutrition (SAM) in 6–59
month old children as a weight-for-height z-score (WHZ) <-3 standard deviations (SD) (severe
wasting) of a reference population, or the presence of bilateral pitting oedema (1). The reference
population was the one collected by the United States National Center for Health Statistics (1978
NCHS reference) until the issue of the WHO 2006 Child Growth Standards (2006 WHO-GS) (2). In
2007, the United Nations agencies endorsed a low mid-upper arm circumference (MUAC) <110 mm
as an independent diagnostic criterion for SAM, alongside a WHZ <-3 or nutritional oedema (3). The
cut-off was recently increased to MUAC <115 mm because it was judged to better align with the
WHZ <-3 classification under the 2006 WHO-GS (2). MUAC is judged to have operational
advantages compared to WHZ: no reference table is needed as a single cut-off is applied
independently of sex, age and height; only one measurement is required, with a simple and cheap arm
strip; and the colored band can be easily used and interpreted by poorly educated community workers
allowing its use in large community-based programmes (4). Since United Nations endorsement and
because of its operational advantages, MUAC is increasingly used as a stand-alone admission
criterion for nutritional rehabilitation in countries such as Bangladesh, Ethiopia and Pakistan.
However, MUAC-based and WHZ-based malnutrition diagnosis correlates poorly, a puzzling
observation for two indicators of severe wasting. It was reported that only about 40% of children
identified as SAM by one indicator is also diagnosed as such by the other (2). For example, among
severely malnourished children hospitalized in rural Kenya, 65.1% (486/746) of the WHZ-based
SAM cases also had an MUAC <115 mm, whereas 56.0% (489/873) of the MUAC-based SAM cases
was also identified by WHZ (5). In that study, 42.9% (489/1140) of the SAM cases based on one
indicator or the other was identified by both. The discrepancy between the two indicators can be even
more extreme. Fernandez et al. reported that among 34 937 children between the ages of 6 and 59
months, from 39 nutritional surveys, 75% of the children with a WHZ <- 3 (2006 WHO-GS) was not
identified by a MUAC <115 mm (6). Such discrepancy generates important programmatic challenges
and confusion. On the one hand, relying on only one of these indicators may underdetect true acute
malnutrition cases and result in missed opportunities of treating a severe condition. On the other hand,
a strategy where the diagnosis of SAM can be based on either indicator could inflate programme
volumes unduly, as it is unclear if children identified by one indicator and not by the other require
standard nutritional rehabilitation.
A much related question concerns the choice of the anthropometric indicator for monitoring
nutritional rehabilitation and deciding discharge. Until recently, SAM in children 6–59 months had
been considered a condition systematically requiring inpatient treatment. The recommended
anthropometric discharge criterion was then based on WHZ ≥-1 or a weight-for-height (W/H) ≥90%
of the reference median (1). It has also been proposed that children be discharged based on percent
weight gain (>15% of the weight at enrolment) (2). However, when admission to nutritional
rehabilitation is based on MUAC alone, it might be practical to use MUAC also for monitoring the
recovery, particularly in community-based programmes. Historical cohort studies from Bangladesh,
Malawi and Uganda, for example, indicated that the mortality risk does not exceed 1/10 000/day if
MUAC ≥125 mm (4). Consequently, it has been proposed that this cut-off could define nutrition
recovery. However, outcomes of children discharged on the basis of MUAC only must be reviewed
before issuing guidance.
In order to clarify these two important issues, we reviewed the evidence on the outcomes of SAM
children admitted to and discharged from nutritional rehabilitation programmes on the basis of
MUAC as a stand-alone criterion, compared to using WHZ. The utilization of bilateral pitting oedema
as an independent indicator of SAM was out of the scope of our review. Our research questions are
summarized in Table 1.

5
Table 1
Research questions
PICO criteria
Population SAM children aged >6 months, being admitted to inpatient
or outpatient programmes of nutritional rehabilitation in low
and middle income countries
Intervention 1. MUAC for SAM diagnosisa
2. MUAC for monitoring recovery and discharge
Comparator 1.WHZ for SAM diagnosis
2.WHZ for monitoring recovery and discharge
Outcomes 1. short-term mortality
2. recovery rate
3. time to recover
4. weight, MUAC, length gain
5. use of resources, costs
6. adverse effects
7. numbers treated, population coverage a SAM is defined by a MUAC <110 mm when compared with WHZ <-3 according to the 1978 NCHS reference and a
MUAC <115 mm when compared with WHZ <-3 according to the 2006 WHO reference.
Methods
We searched Medline via PubMed (http://www.ncbi.nlm.nih.gov), Embase (http://www.embase.com),
the Cochrane Library (www.cochranelibrary.com) and the databases of the Centre for Reviews and
Dissemination (www.crd.york.ac.uk). We also searched the Emergency Nutrition Network web site
(http://ennonline.net/) for additional field reports and the MUAC community web site
(http://tng.brixtonhealth.com/tracker).
We applied the following search strategy in Medline:
#1. (((arm OR midarm OR mid-arm) AND circumference) OR MUAC*)
#2. weight-for-height OR weight-for-length OR WHZ OR WHM OR WFH OR weight gain OR
wast* OR wasting syndrome [mesh] OR emaciation [mesh] OR Malnutrition [Mesh] OR growth
disorders [mesh] OR child nutrition disorders [mesh]
#3. (treatment OR therapeutic OR supplementary feeding) OR (rehabilitation OR discharge* OR
cure*)
#4. infant [Mesh] OR child [Mesh]
#5. #1 AND #2 AND #3 AND #4
#6. editorial [ptyp] OR comment[ptyp] OR letter [ptyp]
#7. #5 NOT #6
The search strategy was adapted to fit each individual database. We searched for evidence up to July
2012. Although the research question initially included a comparison term with WHZ, our preliminary
evidence search found virtually no such comparative studies. Therefore, we decided to include all
original (observational or experimental) studies reporting on the use of MUAC for inclusion,
monitoring or discharge from nutritional rehabilitation in children >6 months. We excluded editorials,
letters or comments; studies including only children older than 60 months of age or children with
chronic diseases; studies on the predictive power of MUAC for mortality at the population level;
studies in developed countries; studies with a small sample size (n ≤30); and studies in languages
other than English, French or Spanish.
We first screened titles and abstracts. All papers for which the title and/or abstract indicated that
inclusion criteria could be fulfilled were retrieved and read in full. The selection process was applied
by two independent researchers. In case of discrepancies, a third reviewer was consulted and the
decision to include or exclude the paper was reached by consensus. Papers excluded at this second
6
step were listed with reasons for exclusion. References of included studies were also screened.
Moreover, we contacted authors every time additional data or information were needed.
Quality appraisal of the selected studies was derived from the checklists of the Scottish Intercollegiate
Guidelines Network (www.sign.ac.uk/methodology/checklists.html). We adjusted the existing
checklist for cohort studies to fit case series, the main design of included studies. The selected quality
criteria were: (i) adequate sampling of subjects (i.e. study not performed on a very specific
subpopulation with limited external validity); (ii) management of missing values (% of incomplete
data reported, % of loss-to-follow-up, participation bias assessed and discussed); (iii) quality of
measurement (training of assessors and standardization of measurements reported, double
measurements of anthropometry parameters, quality control procedures described); and (iv)
appropriate statistical analysis. Each item was rated by two independent reviewers as: adequately
addressed; moderately addressed; poorly addressed; or not reported.
Because of the great heterogeneity in the methods of studies included, no pooled estimates were
generated.
Results
We retrieved 326 references from electronic databases, and three additional reports from
nongovernmental organizations (NGOs) (7–9) (Error! Reference source not found.). Eventually, 12
papers reporting on 11 studies met the inclusion criteria. Two papers (Ciliberto et al. 2005 and
Ciliberto et al. 2006) had a comparable study population (75% overlap) (personal communication of
Mark Manary) (10,11). These two papers were, therefore, considered as a unique study. Five studies
reported on the use of MUAC as a stand-alone criterion for admitting children in their nutritional
rehabilitation programme (Table 2). The six other studies admitted children on the basis of a low
WHZ, but reported on MUAC gain during nutritional rehabilitation (Table 3). Among the 11 studies
included, 3 used cut-off for admission that did not correspond to the definition of SAM (MUAC < 120
mm in the study by Bekele et al. (7); MUAC <130 mm in the study by Nielsen et al. (12); WHZ <-2
in the study by Ciliberto et al. (10). However, outcomes of SAM children could be extracted from
these three studies. Studies also presented great heterogeneity in terms of treatment provided and
discharge criteria (Table 2). All studies, except one, took place in African countries and 5 of the 11
studies occurred in the same setting in Malawi and had a high proportion of oedematous malnutrition.
The majority of studies treated uncomplicated cases of SAM in an outpatient programme setting.

7
Figure 1: Flow chart of review
We retrieved no randomized controlled trial (RCT) comparing outcomes of children admitted on the
basis of a low WHZ vs a low MUAC. Only one observational study compared the mortality risk of
hospitalized children according to their MUAC vs WHZ level (5). This study, conducted at Kilifi
District Hospital in Kenya, collected prospectively data on 8190 children aged 12–59 months
hospitalized over a period of 28 months. Among those, 3.3% was severely wasted by WHZ only
(WHZ -3 by 1978 NCHS reference), 4.7% by MUAC only (MUAC 115 mm), and 5.6% by both
WHZ and MUAC. It is worth mentioning that the selection of patients was not done on the basis of
nutritional criteria but on the need for hospital care. This explains the high proportion of participants
with no low WHZ, no low MUAC and no bipedal oedema in the cohort. The mortality risk was quite
similar for children presenting with a WHZ -3 only or MUAC 115 mm only, peaking at 10.1% and
10.9%, respectively. The highest death rate was observed for children combining both indicators
(25.4%). Unfortunately, no other outcomes were reported (authors have been contacted but the data
were not available). Children diagnosed with a MUAC 115 mm presented more frequently signs of
recent or current kwashiorkor, stunting, subcostal indrawing, and were more likely to be females and
of younger age compared to those admitted with a WHZ -3 (5). Bipedal oedema was present in
38.0% of children with a low MUAC vs 13.9% in those presenting with WHZ -3 only.
Four other studies, including one unpublished, reported on outcomes of children diagnosed
malnourished on the basis of MUAC only, without a comparison group of children admitted on the
basis of WHZ (4,7,12,13). The mortality risk for SAM children was reported in three of the studies
and was relatively low (2.1%), except for SAM children enrolled in a supplementary feeding
programme (SFP) in Ethiopia (4). The mean recovery time (see the definition of discharge criteria in
Table 2) went from 44.4±29.7 days (13) to 50.5±25.8 days (7) (Table 4). The mean (±SD) daily
MUAC gain ranged from 0.17±0.16 mm d-1
in children admitted with a MUAC <110 mm and treated
Records identified through database searching (n=329)
Pubmed (n=211), Embase (n=115), Cochrane (n=0),
DARE (n=0), NGO report (n=3)
Duplicates (n=51)
Records after duplicates removed (n=278)
Records excluded
based on title and
abstract (n=244)
Full text assessed for eligibility (n=34)
Records included in the review (n=12) (11 studies)
Full text not fulfilling
the inclusion criteria
(n=24)
Papers manually
retrieved
(n=2)

8
in an SFP (4) to 0.51±0.3 mm d-1
in Burkina Faso (7). The value reported in the study in Guinea-
Bissau (2.1 mm d-1
; 95% CI -1.29; 5.47) seems implausible and should be considered cautiously given
the methodological weaknesses of that study (12). Two of the studies stratified the results by level of
MUAC at admission (7,12). They showed that children admitted with a lower MUAC displayed a
greater weight and MUAC daily gain. The study in Burkina Faso also reported an average change in
WHZ between admission and discharge greater in children with a lower MUAC at admission (7).
Also in that study, a lower MUAC at inclusion resulted in a greater mortality risk and required more
often some inpatient care (7). Finally, these authors also stratified the outcomes by age (≤12 months
vs >12 months), height (<67 cm vs ≥67 cm) and sex (7) (Table 5). The MUAC daily gain was higher
in older and taller children, and in males.
Six additional studies were included as they reported on the MUAC gain during nutritional
rehabilitation of SAM children, although the inclusion of these children in the programme had not
been based on MUAC (Table 3) (11,14–18). Overall, MUAC increased from 0.2 to 0.4 mm d-1
, with
no obvious differences between studies admitting children on the basis of MUAC or WHZ (nine
studies in total) (Table 4). The increase in MUAC mirrored the daily weight gain, which ranged
between 2.0 and 6.5 g/kg/day. Three of these studies also reported on WHZ change between
admission and discharge, which ranged from 0.6 (17) to 1.27 (18) SD.
Only two studies used MUAC as a discharge criterion (7,12). The study in Burkina Faso where
children were discharged on the basis of a MUAC ≥124 mm reported that the mean WHZ at exit was -
1.7±0.9 (7). That study also compared the outcomes of malnourished children who were discharged
from a community-based programme based on 15% weight gain and MUAC >110 mm (between
April and December 2008) vs MUAC ≥124 mm only (between April and December 2009) (7).
Globally, the time to recover for all children was shorter when using MUAC ≥124 mm (36.1±19.7
days) as a discharge criterion compared to 15% weight gain (52.5±25.4 days). Remarkably, the
average length of stay to achieve >15% weight gain was longer for less malnourished children
(48.0±23.0 days for children admitted with MUAC ≤114 mm and 55.1±26.0 days for children
admitted with a MUAC between 115 mm and 119 mm). When the discharge criterion was switched to
MUAC ≥124 mm, the average lengths of stay became 46.5±24.9 days and 32.5±16.3 days,
respectively. Globally, default rates were 7.8% when 15% weight gain was used as a discharge
criterion and 4.3% for those discharged based on MUAC, although this difference might be partly
attributable to a change in retrieval strategies between the two observation periods (personal
communication of Sylvie Goosens). The percentage of non-responders was 2.1% in the group that
needed to attain a 15% weight gain compared to 1.5% in the group discharged at MUAC ≥124 mm.
The other study in Guinea-Bissau used a MUAC ≥130 mm as a discharge criterion but did not report
outcomes specifically for SAM children (12). Outcomes after discharge were not reported in these
two studies.
We found no studies assessing the follow-up of children after discharge, i.e. whether the risk of
relapse or longer-term mortality varied by the anthropometric indicator used for discharging children
is unknown. We retrieved no study reporting on the other planned outcomes, i.e. costs, adverse events
or population coverage.
Table 6 summarizes the quality appraisal for the selected studies. One consistent weakness was the
lack of information on the reliability of measurements. In most studies, quality control and
standardization of measurements was not described. The risk of selection bias and the plausible
impact of missing values on results were also poorly addressed. Table 7 lists the studies excluded as
well as the reasons for exclusion.

9
Discussion
Direct evidence for comparing treatment outcomes of SAM children diagnosed by MUAC vs WHZ is
scarce. Only one study indirectly addressed the question (5). Unfortunately, lessons learnt from that
study in a Kenyan hospital are limited for a number of reasons. First, MUAC or WHZ were not used
for enrolling SAM children, but these two indicators were measured in sick, hospitalized children. It
is thus impossible to extrapolate the results to a programme of nutritional rehabilitation of SAM
children. As a matter of fact, children presenting a MUAC 115 mm but a WHZ >-3 had a profile
significantly different from those identified on the basis of WHZ only. In particular, they suffered
more often from kwashiorkor, were more stunted, younger, and more likely to be females. Second,
only death rates were reported, and the other outcomes of nutritional rehabilitation of these
complicated cases are unknown.
There is evidence from four studies (4,7,12,13) that children classified as SAM on the basis of a low
MUAC respond to nutritional rehabilitation in terms of weight gain and MUAC gain, although the
recovery rates were low in two of those studies (4,12). Children admitted with a lower MUAC
displayed a greater daily gain in MUAC during the rehabilitation. There is also consistent evidence
that MUAC increases during nutritional rehabilitation from studies that enrolled SAM children based
on a low WHZ. No studies assessed the outcomes after nutritional rehabilitation when MUAC was
used as the discharge criterion.
Our findings indicate that MUAC could be used adequately as a stand-alone criterion for the
diagnosis, monitoring and discharge of SAM children. However, important pieces of evidence are still
lacking before a strong recommendation for such use of MUAC can be formulated. First, the
outcomes of children with a WHZ <-3 excluded from nutritional rehabilitation because their MUAC
is ≥115 mm have not been studied. Just one study reported that mortality rates in children presenting
with a WHZ -3 only or MUAC 115 mm only were similar (5). However, that study included a
cohort of hospitalized children, i.e. the admission was not based on anthropometric criteria. This
evidence gap is worrying given the rapid extension of community-based programmes admitting
children in nutritional rehabilitation on the basis of a low MUAC alone, and emphasizes the need for
urgent studies and programme evaluation. Second, studies did not provide much data on factors
interacting with the outcomes of the nutritional rehabilitation in children admitted on the basis of
MUAC. In particular, young age, being a female and being stunted are factors that are independently
associated with a low MUAC (19). One of the included studies also reported that, besides age, sex and
stunting, bipedal oedema was also a factor more often observed in children with a low MUAC than in
those with a low WHZ (5). Although these factors are expected to influence the pathological
significance of a low MUAC and thus the progress and outcomes of nutritional rehabilitation, only the
authors of the study in Burkina Faso stratified their results by age, sex and height upon enrolment (7).
The mean MUAC and weight daily gain were lower, the treatment duration longer and the proportion
of non-responders greater in younger and smaller children, and in females (Table 4). This might
correspond to a suboptimal response in less severely acutely malnourished children, or be an indicator
that the treatment is less effective or required in such children. Unfortunately, it is unclear how these
three parameters interrelated as no multivariate analysis was performed. More data are needed to
define if MUAC <115 mm alone can be applied to diagnose SAM indifferently in all children, or if
the outcomes of the nutritional rehabilitation vary substantially according to the presence of other
factors. Third, we retrieved no evidence on the best MUAC cut-off to be used. A same MUAC cut-
off, either for defining SAM (MUAC <115 mm) or recovery (≥125 mm), translates in a different
nutritional status according to age and sex (20), as illustrated in Figure 2. Whether using a higher
MUAC cut-off (both for admission and discharge) in older children, and particularly in males, would
be appropriate is unknown. Lastly, we also retrieved no evidence on the benefit of using MUAC vs
WHZ in terms of population coverage or cost.

10
A 15% weight gain also has been recommended previously by WHO as a discharge criterion (2).
However, the average time to achieve 15% weight gain was longer in less wasted children (MUAC
>115 mm) compared to the most wasted ones, indicating a faster weight gain in those children more
malnourished at enrolment (7). On the contrary, a MUAC-based discharge resulted in a longer
average recovery time for the most severely wasted. Together, these observations provide indirect
evidence that 15% weight gain is an inappropriate discharge criterion as it results in the more severely
malnourished children getting the shortest treatment (7).
There were important limitations in the quality of the evidence that need to be highlighted: (i) no
studies were specifically designed to compare outcomes of SAM children identified, monitored or
discharged on the basis of MUAC vs WHZ; (ii) the sample sizes were relatively small in 4 of the 12
studies included; and (iii) precision and accuracy of anthropometric measurement were not addressed
in most of the studies, albeit the contradictory evidence to date on whether more precision can be
reached with MUAC or with WHZ (21–23). In addition, a third of the studies included was carried out
in the same Malawian setting, with a majority of oedematous cases and a high prevalence of HIV
infection, which might impact the external validity of our results to an unknown extent.
In conclusion, there are indications that MUAC could be used adequately as a stand-alone criterion
for admitting to and discharging from nutritional rehabilitation SAM children. However, the evidence
base is currently insufficient to make a strong recommendation in favour of using MUAC as a stand-
alone criterion in programmes of nutritional rehabilitation. The most crucial evidence gap concerns
the morbidity and mortality of children with WHZ <-3 receiving no treatment because their MUAC is
≥115 mm. The extent to which all children with MUAC <115 mm require standard nutritional
rehabilitation is also unknown. There are numerous nutritional programmes currently active
worldwide and their thorough evaluation could generate such data in the short term.

11
Table 1
Characteristics of studies reporting on outcomes in children with a low MUAC as a stand-alone diagnosis criterion of SAM Reference Country Age
(months)
Number Design Criteria for admission Treatment Discharge criteria
Berkley 2005 (5) Kenya 12–59 8 190 Cohort Clinical diagnosis of SAM Inpatient care with F-75 and F-100 NR
Bekele 2009 (7) Burkina
Faso
6–59 30 130 Case
series
MUAC <120 mma Outpatient care mainly, with RUTF (Plumpy Nut®) (500
kcal/packet) two packets if weight <8 kg, three if weight
≥8 kg. F-75 and F-100 are available for hospitalized
children.
15% weight gainb
MUAC ≥124 mmc
Nielsen 2004 (12) Guinea-
Bissau
6–59 247 Case
series
MUAC <130 mmd Outpatient care with a gruel made of millet, fresh eggs,
fresh bananas, margarine and full-strength milk powder,
providing 3.8 kJ/ml (8.7% of energy from proteins).
Children received micronutrient tablets and flour mix in
an amount of 6500–8700 kJ/d.
MUAC ≥130 mm
Defourny 2009 (13) Niger 6–36 6 311 Case
series
MUAC <110 mm Outpatient care mainly, with RUTF (1000 kcal/d for
children <8 kg and 1500 kcal/d for children ≥8 kg).
Children with severe co-morbidities, nutritional oedema
extending beyond the feet or a negative appetite test were
admitted for inpatient care.
NR
Myatt 2006 (4) Ethiopia 6–36 98 Case
series
MUAC <110 mm and WHM
>70% and no oedema
OTP = high intensity intervention (n=42).
SFP = low intensity Intervention (n=56).
NR
NR = not reported a Outcomes for children with MUAC 110 mm are reported. b In 2008. c In 2009. d Outcomes for children with MUAC <115 mm are reported.

12
Table 2
Characteristics of studies included where MUAC was not an inclusion criterion but MUAC gain during rehabilitation was reported
Study Country Age
(month
s)
Num
ber
Design Criteria for admission Treatment Discharge criteria
Amthor 2009 (14) Malawi 6–60 826 Case series WHM <70% and/or oedema and
appetite
Outpatient, RUTF: 175 kcal/kg/d and 5.3 g protein/kg/d
during 8 w
WHM ≥85%
Ciliberto 2005 (10),
Ciliberto 2006 (11)a
Malawi
10–60
645
Non-
randomized
(stepped
wedge design)
controlled trial
WHZ <-2b and/or “mild” oedema and
appetite
Second phase of treatment in inpatient therapy (n=113) vs
home-based RUTF (175 kcal/kg/d and 5.3 g protein/kg/d
during 8 w) after 1 w hospitalization (n= 532)
WHZ >-2
Linneman 2007
(15)
Malawi 6–60 2131 Case series W/H <70% and/or oedema and
appetite
Outpatient, RUTF: 175 kcal/kg/d and 5.3 g protein/kg/d
during 8 w
WHM >85% and
oedema resolved
Manary 2004 (16)
Malawi
>12
282
Non-
randomized
controlled
comparative
trial
WHZ <-3, no oedema, discharge
hospital if infection control and
appetite
Outpatient, RUTF, comparison three home-based diets.
The first dietary group received RTUF in a quantity
sufficient to meet their nutrient requirements for full catch-
up growth (733 kJ/kg/d, 175 kcal/kg/d). The second group
received a multivitamin/mineral fortified RTUF
supplement providing 2090 kJ/d, about 33% (25–50%) of
the daily energy requirement. The third group was given
maize/soy flour.
WHZ >0
Oakley 2010 (17)
Malawi
6–59
1874
RCT, double
blind
WHZ <-3 and/or oedema and appetite
Outpatient, RUTF containing 25% milk (n=954) vs 15%
milk (n=929)
WHZ >-2 and no
oedema at 8 w
Sullivan 1991 (18)
Gambia
6–36
22
Case series
WHM <75% and ≥4 loose stools/d for
>2 w
Inpatient 3–4 w, 180 kcal/kg/d and 4 g protein/kg/d (w 1)
Gaining weight and
no diarrhoea a 75% overlap in population with oedema treated exclusively in outpatient (personal note from author).
b Outcomes for children with a WHZ <-3 are reported.
13
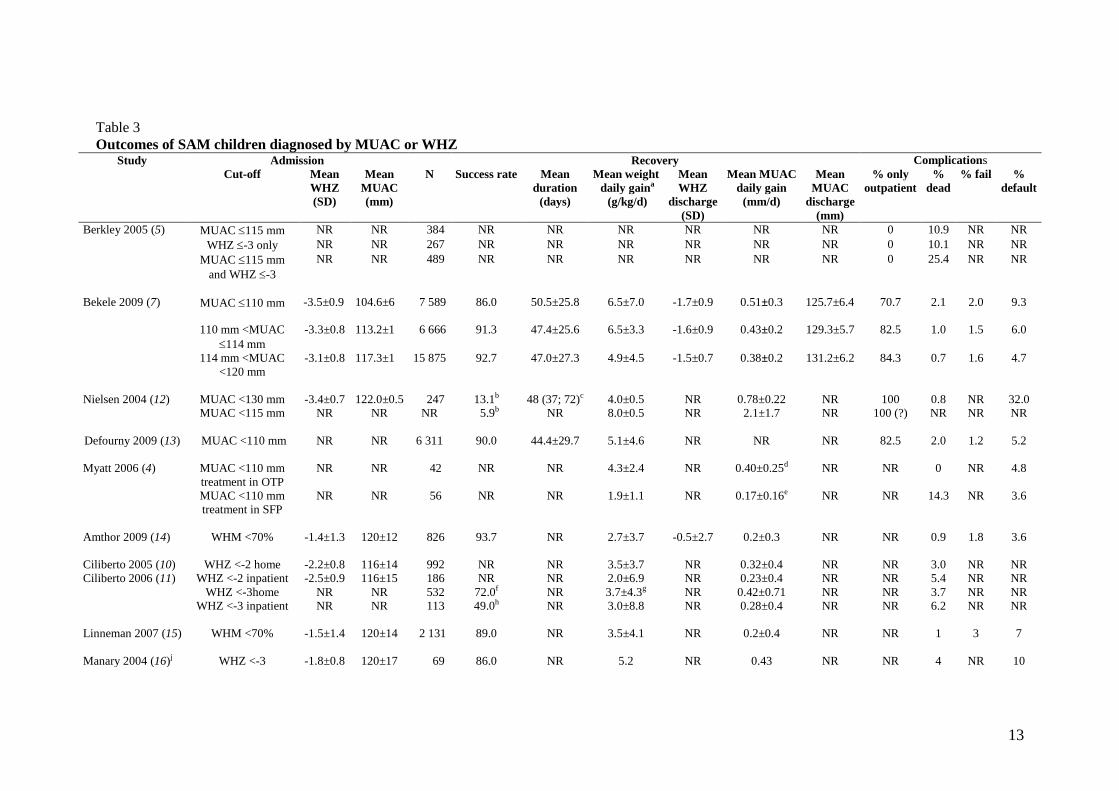
Table 3
Outcomes of SAM children diagnosed by MUAC or WHZ Study Admission Recovery Complications
Cut-off Mean
WHZ
(SD)
Mean
MUAC
(mm)
N Success rate Mean
duration
(days)
Mean weight
daily gaina
(g/kg/d)
Mean
WHZ
discharge
(SD)
Mean MUAC
daily gain
(mm/d)
Mean
MUAC
discharge
(mm)
% only
outpatient
%
dead
% fail %
default
Berkley 2005 (5) MUAC 115 mm NR NR 384 NR NR NR NR NR NR 0 10.9 NR NR
WHZ -3 only NR NR 267 NR NR NR NR NR NR 0 10.1 NR NR
MUAC 115 mm
and WHZ -3
NR NR 489 NR NR NR NR NR NR 0 25.4 NR NR
Bekele 2009 (7) MUAC 110 mm -3.5±0.9 104.6±6 7 589 86.0 50.5±25.8 6.5±7.0 -1.7±0.9 0.51±0.3 125.7±6.4
70.7 2.1 2.0 9.3
110 mm <MUAC
114 mm
-3.3±0.8 113.2±1 6 666 91.3 47.4±25.6 6.5±3.3 -1.6±0.9 0.43±0.2
129.3±5.7 82.5 1.0 1.5
6.0
114 mm <MUAC
<120 mm
-3.1±0.8 117.3±1 15 875 92.7 47.0±27.3 4.9±4.5 -1.5±0.7 0.38±0.2 131.2±6.2 84.3 0.7 1.6
4.7
Nielsen 2004 (12) MUAC <130 mm -3.4±0.7 122.0±0.5 247 13.1b 48 (37; 72)c 4.0±0.5 NR 0.78±0.22 NR 100 0.8 NR 32.0
MUAC <115 mm
NR NR NR 5.9b NR 8.0±0.5 NR 2.1±1.7 NR 100 (?) NR NR NR
Defourny 2009 (13) MUAC <110 mm
NR NR 6 311 90.0 44.4±29.7 5.1±4.6 NR NR NR 82.5 2.0 1.2 5.2
Myatt 2006 (4) MUAC <110 mm
treatment in OTP
NR NR 42 NR NR 4.3±2.4 NR 0.40±0.25d NR NR 0 NR 4.8
MUAC <110 mm
treatment in SFP
NR NR 56 NR NR 1.9±1.1 NR 0.17±0.16e NR NR 14.3 NR 3.6
Amthor 2009 (14) WHM <70%
-1.4±1.3 120±12 826 93.7 NR 2.7±3.7 -0.5±2.7 0.2±0.3 NR NR 0.9 1.8 3.6
Ciliberto 2005 (10)
Ciliberto 2006 (11)
WHZ <-2 home -2.2±0.8 116±14 992 NR NR 3.5±3.7 NR 0.32±0.4 NR NR 3.0 NR NR
WHZ <-2 inpatient -2.5±0.9 116±15 186 NR NR 2.0±6.9 NR 0.23±0.4 NR NR 5.4 NR NR
WHZ <-3home NR NR 532 72.0f NR 3.7±4.3g NR 0.42±0.71 NR NR 3.7 NR NR
WHZ <-3 inpatient
NR NR 113 49.0h NR 3.0±8.8 NR 0.28±0.4 NR NR 6.2 NR NR
Linneman 2007 (15) WHM <70%
-1.5±1.4 120±14 2 131 89.0 NR 3.5±4.1 NR 0.2±0.4 NR NR 1 3 7
Manary 2004 (16)j WHZ <-3 -1.8±0.8 120±17 69 86.0 NR 5.2 NR 0.43 NR NR 4 NR 10

14
Study Admission Recovery Complications
Cut-off Mean
WHZ
(SD)
Mean
MUAC
(mm)
N Success rate Mean
duration
(days)
Mean weight
daily gaina
(g/kg/d)
Mean
WHZ
discharge
(SD)
Mean MUAC
daily gain
(mm/d)
Mean
MUAC
discharge
(mm)
% only
outpatient
%
dead
% fail %
default
Oakley 2010k (17) WHZ <-3
-2.1±1.2 121±13 1 874 82.0 NR 2.4±2.8 -1.5±1.1 0.2±0.3 NR 97 4 8 3
Sullivan 1991 (18) WHM <75% -3.97 108.4 22 NR NR NR -2.70 0.03 114.8 NR 0 NR NR
N = number of children; NR = not reported a Weight and MUAC gain assessed at 4 weeks, except in Bekele 2009 (7) and Oakley 2010 (17) where it was assessed at 8 weeks. b Recovery rate expressed in persons per 1000 person-days; 27 children still under treatment at the end of the study. c Median and IQR range. d Measured on 19 over 42. e Measured on 24 over 56. f Children reaching WHZ >-2 after 8 weeks of therapy. g In the first four weeks of therapy. h Children reaching WHZ >-2 after 8 weeks of therapy. i Computed by us as only the main MUAC gain over 90 days was reported; average WHZ change was 1.61±0.86. j We report here only the results of children receiving RUTF, the group who performed the best. k We pooled the results of the two randomization groups.

15
Table 5
Influence of age, height, sex on outcomes of acutely malnourished children admitted by MUAC (7) Variable Cut-off
variable
Sample
size
Mortality
(%)
Recovery
(%)
Median time to recover
(d) (IQR) (cured)
Mean weight gain (g/kg/d)
± SD (cured)
Mean MUAC gain (mm/d) ±
SD (cured)
Other adverse effects
Age ≤12 m 13 210 1.2 90.4 49.9±27.0 5.1±3.2
0.38±0.23
Non-responder 2.1%,
defaulter 5.7%
>12 m ≤59 14 118 1.0 91.0 46.1±27.3 5.6±6.3 0.46±0.26 Non-responder 1.2%,
defaulter 5.6%
Height
<67 cm 7 828 1.5 88.1 50.6±27.0 5.4±3.6 0.38±0.23 Non-responder 2.8%,
defaulter 6.5%
≥67 cm 22 302 1.0 91.6 47.0±26.0 5.4±5.4 0.44±0.26 Non-responder 1.3%,
defaulter 6.1%
Sex
Female 15 356 1.0 90.5 49.1±27.4 5.1±4.6 0.40±0.2 Non-responder 2.0%,
defaulter 6.1%
Male 14 774 1.2 90.9 46.7±25.7 5.6±5.5 0.44±0.3 Non-responder 1.4%,
defaulter 6.2%

16
Table 6
Quality appraisal of included studies
Study Children
selection Reliability of measures
Statistical
analysis Missing data Other comments
Training of
assessors
Double
measurement
s
Quality
control
(methods)
MUAC
assessed in all
children
% drop-out Effect drop-
out assessed
Berkley 2005
(5) A M NR NR A NR NR NR
Bipedal oedema present in
38% of children with
MUAC 115 mm
Bekele 2010
(7) M A NR NR A A 6.2 NR
25% of children not
included in the evaluation
(missing height); 12% of
children with MUAC <115
mm required hospitalization
Nielsen 2004
(12) P NR NR NR A
M, not if
absent from
home
32 NR
Defourny 2009
(13) P NR NR NR NR A 4.7 NR
Myatt 2006 (3) P NR NR NR NR NR 4.8 NR
Oedema excluded, only
children ≤75 cm, small
sample size (n=42)
Amthor 2009
(14) M A NR NR
M, weight gain
over 4 weeks
(NR if after loss of oedema)
NR 3.6 NR
Ciliberto 2005
(10)
Ciliberto 2006
(11)
M NR NR NR A, weight gain over 4 weeks
NR 9.6 A
Linneman
2007 (15)
M
A
NR
NR
A, weight gain
over 4 weeks
A
7.4
A
Manary 2004
(16)
M, only
hospitalized children
NR NR NR A A 10 A

17
Oakley 2010
(17)
M
A
A
A
A
NR
3
M
Sullivan 1991
(18)
M, only
hospitalized
children
NR NR A A M 8.5 NR
A = Adequate; M = Moderate; P = Poor; NR = Not reported
Figure 1 Arm circumference according to age and sex
Males1 Females
2
Thick red line: MUAC = 115 mm; thick blue line: MUAC = 125 mm.
Source: WHO-GS 2006.
1 http://www.who.int/childgrowth/standards/second_set/cht_acfa_boys_z_3_5.pdf.
2 http://www.who.int/childgrowth/standards/second_set/cht_acfa_girls_z_3_5.pdf.

18
Table 7 Studies excluded and reasons for exclusion
Study Reason for exclusion
1. Akinbami 2010 (24) Children not included for severe malnutrition but for disease treatment in hospital; mortality results not
presented by level of MUAC at entry; no results of nutritional rehabilitation reported.
2. Beckett 2000 (25) Included children with a length-for-age 1 SD and weight-for-length between -1 and -2 SD of the median of
the WHO reference.
3. Bejon 2008 (26) Children not included for severe malnutrition but for disease treatment in hospital; focus on attributable
fraction of death due to malnutrition with varying anthropometric indicators, no MUAC on follow-up
reported.
4. Blankhart 1977 (27) No nutritional rehabilitation; MUAC compared to weight-for-age.
5. Briend 1986 (28) Validity of different nutritional indices and classifications for predicting the death of children with diarrhoea
admitted to hospital; nutritional rehabilitation not reported.
6. Cheek 1977 (29) MUAC not used for admission or follow-up, small sample size.
7. Chevalier 1996 (30) MUAC not used for admission or follow-up
8. Collins 2006 (31) Position paper; no MUAC gain reported.
9. Connor 2010 (32) Included moderately malnourished children; selection based on WHZ; no MUAC gain reported.
10. Doherty 1998 (33) RCT testing three different regimens of zinc supplements in children with a WAM <60% and/or oedema, and
proportion with a WHZ <-3 and/or a MUAC <110 mm is not reported.
11. Dramaix 1993 (34) Children not included for severe malnutrition but for disease treatment in hospital; nutritional rehabilitation
not reported; no comparison of outcomes of WHZ-based SAM vs MUAC-based SAM reported.
12. Erinoso 1993 (35) Unclear MUAC cut-off (80%–70%–60% of what?); unusual therapeutic protocol (all had intensive nutritional
support with high protein and energy-rich foods), very high lethality rates.
13. Hossain 2009 (36) Admission criteria based on W/H, MUAC or oedema but no details on the number and outcomes of children
admitted based on MUAC.
14. Isanaka 2011 (37) Paper focused on the duration of untreated malnutrition.
15. Kumar 1996 (38) No use of MUAC for nutritional rehabilitation.
16. Lagrone 2010 (39) Only moderate acute malnutrition children included.
17. Lapidus 2009, 2006 (40,41) Children aged 6–59 months admitted with malnutrition (<80% W/H and/or MUAC <110 mm and/or presence
of oedema; results on outcomes not provided for children selected on MUAC; no variations of MUAC during
rehabilitation reported).
18. Loewenstein 1973 (42) Correlation between MUAC and weight-for-age z-scores (WAZ) or WHZ or weight for different countries.

19
Study Reason for exclusion
Assessment of sensitivity and specificity of MUAC compared to WHZ was not possible.
19. McDowell 1982 (43) MUAC and W/H relative to clinical malnutrition.
20. Manary 2008 (44) General paper on management of acute malnutrition.
21. Minetti 2009 (45) Only comparison of NCHS and WHO 2006 standard references for W/H; no performance of MUAC.
22. Ojo 2000 (46) Population level; estimation of prevalence malnutrition by MUAC z-scores and WHZ; no comparison of
anthropometric indicators; no nutritional intervention.
23. O’Neill 2012 (47) Predictive power of MUAC-for-age for mortality; no nutritional rehabilitation.
24. Savadogo 2007 (48) Inclusion at entry not clearly defined (children dichotomized in MUACAZ -4.93 and MUCAZ >-4.93); no
MUAC reported at entry; no MUAC gain reported.

20
References
1. Management of severe malnutrition: a manual for physicians and other senior
health workers. Geneva, WHO, 1999.
2. A Joint Statement by the World Health Organization and the United Nations
Children's Fund. WHO child growth standards and the identification of severe
acute malnutrition in infants and children. Geneva, WHO/UNICEF, 2009.
3. A Joint Statement by the World Health Organization, the World Food Programme,
the United Nations System Standing Committee on Nutrition and United Nations
Children's Fund. Community-based management of severe acute malnutrition.
Geneva, WHO/WFP/UN/UNICEF, 2007.
4. Myatt M, Khara T, Collins S. A review of methods to detect cases of severely
malnourished children in the community for their admission into community-based
therapeutic care programs. Food and Nutrition Bulletin, 2006, 27(Suppl. 3):S7–23.
5. Berkley J et al. Assessment of severe malnutrition among hospitalized children in
rural Kenya: comparison of weight-for-height and mid-upper arm circumference.
Journal of the American Medical Association, 2005, 294(5):591–597.
6. Fernandez MA, Delchevalerie P, Van HM. Accuracy of MUAC in the detection of
severe wasting with the new WHO growth standards. Pediatrics, 2010,
126(1):e195–e201.
7. Bekele, Y et al. 2009 activity report of a community-based therapeutic feeding
program with MUAC as exclusive admission criteria. Paris, Médecins sans
Frontières, 2010.
8. Myatt M, Duffield A. Weight-for-height and MUAC for estimating the prevalence
of acute undernutrition: a review of survey data collected between 1992 and 2006.
London, Save the Children UK, 22 October 2007.
9. Pinoges L. Comparison of mid-upper arm circumference (MUAC <125 mm) and
weight-for-height indicators (WH <80% if the median and WH <-2 z-score).
Geneva, Médecins sans Frontières, Action Contre la Faim and the United Nations
High Commisioner for Refugees databases. Epicentre Epidemiology, 2002.
10. Ciliberto MA et al. Comparison of home-based therapy with ready-to-use
therapeutic food with standard therapy in the treatment of malnourished Malawian
children: a controlled, clinical effectiveness trial. American Journal of Clinical
Nutrition, 2005, 81(4):864–870.
11. Ciliberto MA et al. Home-based therapy for oedematous malnutrition with ready-
to-use therapeutic food. Acta Paediatrica, 2006, 95(8):1012–1015.
12. Nielsen J et al. Malnourished children and supplementary feeding during the war
emergency in Guinea-Bissau in 1998–1999. American Journal of Clinical
Nutrition, 2004, 80(4):1036–1042.
13. Defourny I et al. A large-scale distribution of milk-based fortified spreads: evidence
for a new approach in regions with high burden of acute malnutrition. PLoS One,
2009, 4(5):e5455.

21
14. Amthor RE, Cole SM, Manary MJ. The use of home-based therapy with ready-to-
use therapeutic food to treat malnutrition in a rural area during a food crisis.
Journal of the American Dietetic Association, 2009, 109(3):464–467.
15. Linneman Z et al. A large-scale operational study of home-based therapy with
ready-to-use therapeutic food in childhood malnutrition in Malawi. Maternal &
Child Nutrition, 2007, 3(3):206–215.
16. Manary MJ et al. Home-based therapy for severe malnutrition with ready-to-use
food. Archives of Disease in Childhood, 2004, 89(6):557–561.
17. Oakley E et al. A ready-to-use therapeutic food containing 10% milk is less
effective than one with 25% milk in the treatment of severely malnourished
children. Journal of Nutrition, 2010, 140(12):2248–2252.
18. Sullivan PB et al. The treatment of persistent diarrhoea and malnutrition: long-term
effects of in-patient rehabilitation. Acta Paediatrica Scandinavica, 1991,
80(11):1025–1030.
19. Roberfroid, D et al. Utility of MUAC in screening severe acute malnutrition:
current status and way forward. London, Save the Children UK, 2010.
20. Mei Z et al. The development of a MUAC-for-height reference, including a
comparison to other nutritional status screening indicators. Bulletin of the World
Health Organization, 1997, 75(4):333–341.
21. Ulijaszek SJ, Kerr DA. Anthropometric measurement error and the assessment of
nutritional status. British Journal of Nutrition, 1999, 82(3):165–177.
22. Ayele B et al. Reliability of measurements performed by community-drawn
anthropometrists from rural Ethiopia. PLoS One, 2012, 7(1):e30345.
23. Mwangome MK et al. Reliability and accuracy of anthropometry performed by
community health workers among infants under 6 months in rural Kenya. Tropical
Medicine & International Health, 2012, 17(5):622–629.
24. Akinbami FO et al. Body mass composition: a predictor of admission outcomes
among hospitalized Nigerian under 5 children. Asia Pacific Journal of Clinical
Nutrition, 2010, 19(3):295–300.
25. Beckett C et al. Effects of an energy and micronutrient supplement on
anthropometry in undernourished children in Indonesia. European Journal of
Clinical Nutrition, 2000, 54(Suppl. 2):S52–S59.
26. Bejon P et al. Fraction of all hospital admissions and deaths attributable to
malnutrition among children in rural Kenya. American Journal of Clinical
Nutrition, 2008, 88(6):1626–1631.
27. Blankhart DM, Latham MC, Schulpen TWJ. Low arm circumference reporting and
nutrition rehabilitation of under fives. Journal of Tropical Pediatrics and
Environmental Child Health, 1977, 23(1):8–11.
28. Briend A et al. Usefulness of nutritional indices and classifications in predicting
death of malnourished children. British Medical Journal (Clinical Research
Edition), 1986, 293(6543):373–375.

22
29. Cheek DB et al. Protein-calorie malnutrition and the significance of cell mass
relative to body length. American Journal of Clinical Nutrition, 1977, 30(6):851–
860.
30. Chevalier P et al. Immuno-nutritional recovery of children with severe malnutrition.
Sante, 1996, 6(4):201–208.
31. Collins S et al. Management of severe acute malnutrition in children. Lancet, 2006,
368(9551):1992–2000.
32. Connor NE, Manary MJ. Monitoring the adequacy of catch-up growth among
moderately malnourished children receiving home-based therapy using mid-upper
arm circumference in Southern Malawi. Maternal and Child Health Journal, 2010,
(1–5).
33. Doherty CP et al. Zinc and rehabilitation from severe protein-energy malnutrition:
higher-dose regimens are associated with increased mortality. American Journal of
Clinical Nutrition, 1998, 68(3):742–748.
34. Dramaix M et al. Serum albumin concentration, arm circumference and oedema and
subsequent risk of dying in children in central Africa. British Medical Journal,
1993, 307(6906):710–713.
35. Erinoso HO, Akinbami FO, Akinyinka OO. Prognostic factors in severely
malnourished hospitalized Nigerian children. Anthropometric and biochemical
factors. Tropical and Geographic Medicine, 1993, 45(6):290–293.
36. Hossain MI et al. Experience in managing severe malnutrition in a government
tertiary treatment facility in Bangladesh. Journal of Health, Population and
Nutrition, 2009, 27(1):72–79.
37. Isanaka S et al. Estimates of the duration of untreated acute malnutrition in children
from Niger. American Journal of Epidemiology, 2011, 173(8):932–940.
38. Kumar R, Aggarwal AK, Iyengar SD. Nutritional status of children: validity of
mid-upper arm circumference for screening undernutrition. Indian Pediatrics, 1996,
33(3):189–196.
39. Lagrone L et al. Locally produced ready-to-use supplementary food is an effective
treatment of moderate acute malnutrition in an operational setting. Annals of
Tropical Paediatrics, 2010, 30(2):103–108.
40. Lapidus N et al. Prognostic accuracy of WHO growth standards to predict mortality
in a large-scale nutritional program in Niger. PLoS Medicine, 2009, 6(3):e39.
41. Lapidus N et al. Mortality risk among children admitted in a large-scale nutritional
program in Niger, 2006. PLoS One, 2009, 4(1):e4313.
42. Loewenstein MS, Phillips JF. Evaluation of arm circumference measurement for
determining nutritional status of children and its use in an acute epidemic of
malnutrition: Owerri, Nigeria, following the Nigerian Civil War. American Journal
of Clinical Nutrition, 1973, 26(2):226–233.
43. McDowell I, King FS. Interpretation of arm circumference as an indicator of
nutritional status. Archives of Disease in Childhood, 1982, 57(4):292–296.

23
44. Manary MJ, Sandige HL. Management of acute moderate and severe childhood
malnutrition. British Medical Journal, 2008, 337:a2180.
45. Minetti A et al. Impact of the shift from NCHS growth reference to WHO (2006)
growth standards in a therapeutic feeding program in Niger. Tropical Medicine &
International Health, 2009, 14(10):1210–1214.
46. Ojo O, Deane R, Amuna P. The use of anthropometric and clinical parameters for
early identification and categorisation of nutritional risk in pre-school children in
Benin City, Nigeria. Journal of the Royal Society for the Promotion of Health,
2000, 120(4):230–235.
47. O'Neill SM et al. Child mortality as predicted by nutritional status and recent
weight velocity in children under two in rural Africa. Journal of Nutrition, 2012,
142(3):520–525.
48. Savadogo L et al. Management of severe acute malnutrition in an urban nutritional
rehabilitation center in Burkina Faso. Revue de Epidemiologie et de Sante Publique,
2007, 55(4):265–274.