Embed Size (px)
Citation preview
UTILITY OF KOPPITZ NORMS FOR THE BENDER-GESTALT
TEST PERFORMANCE OF A GROUP OF SESOTHO-SPEAKING
CHILDREN
Lerato Makhele
Submitted in accordance with the requirements for the Masters of Science
(Clinical Psychology) degree
Department of Psychology
University of the Free State
October 2005
Supervisor: Dr. S.P. Walker
Co-supervisor: Prof. K. Esterhuyse

DECLARATION
_____________________________________________________________________
I declare that the article hereby submitted by me for the Masters of Science degree at
the University of the Free State, is my own independent work and has not previously
been submitted by me at another university/faculty. I furthermore, cede copyright of
the article in favour of the University of the Free State.
Lerato Makhele
Date

ACKNOWLEDGEMENTS
_____________________________________________________________________
I would like to express my sincere appreciation to the following people:
Dr. Stephen Walker, my supervisor, for his constructive advice with the collation of
data and his patience and dedication for putting it all together
Professor Karel Esterhuyse, my co-supervisor for his invaluable assistance in the
statistical analysis
Dimakatso Hlohlongwane and Portia Ngxangane, my God-sent angels, for the
valuable hours spent scoring protocols and providing cheerful support
The headmaster, staff and pupils of all the schools visited for being so
accommodating and allowing the present study to be conducted in their schools
The Free State Department of Education for allowing this study to be conducted
The Andrew Mellon Foundation for funding my studies the past two years
And lastly to my husband Ntsienyane, for your wisdom, commitment and loving
support. I could not have done this without you, thank you.
CONTENTS
_____________________________________________________________________
1. LITERATURE REVIEW 1
2. METHOD 8
2.1. Subjects 8
2.2. Instruments 10
2.3. Procedure 10
3. RESULTS 11
4. DISCUSSION 19
5. LIMITATIONS AND RECOMMENDATIONS
FOR FUTURE RESEARCH 20
6. REFERENCES 22
LIST OF TABLES
_____________________________________________________________________
Table 1: Frequency distribution of the investigated group based
on gender and socio -economic status 9
Table 2: Means and standard deviations of the number of errors
made for the Sesotho-speaking group and Koppitz’ norm
group 11
Table 3: Comparison of slope coefficients in equations relating
age to the Bender-Gestalt Test performance 12
Table 4: Means and standard deviations of the number of errors
made for the Sesotho-speaking boys and girls 13
Table 5: Means and standard deviations with re spect to the
number of errors made for low, average and high
socio-economic groups 14
Table 6: Comparison of chronological age and performance
age on the Bender-Gestalt Test for the seven-year-
old Sesotho-speaking group 15
Table 7: Comparison of chronological age and performance
age on the Bender-Gestalt Test for the eight-year-
old Sesotho-speaking group 16
Table 8: Comparison of chronological age and performance
age on the Bender-Gestalt Test for the nine -year-
old Sesotho-speaking group 17

Table 9: Children’s percentages of specific errors incurred
for the different age groups at a frequency of 50%
or more 18

APPENDICES
_____________________________________________________________________
A. Parents’ letter and consent form (English and Sesotho) i
B. Biographical Questionnaire (English and Sesotho) iii
C. Classification of Socio-economic Status viii
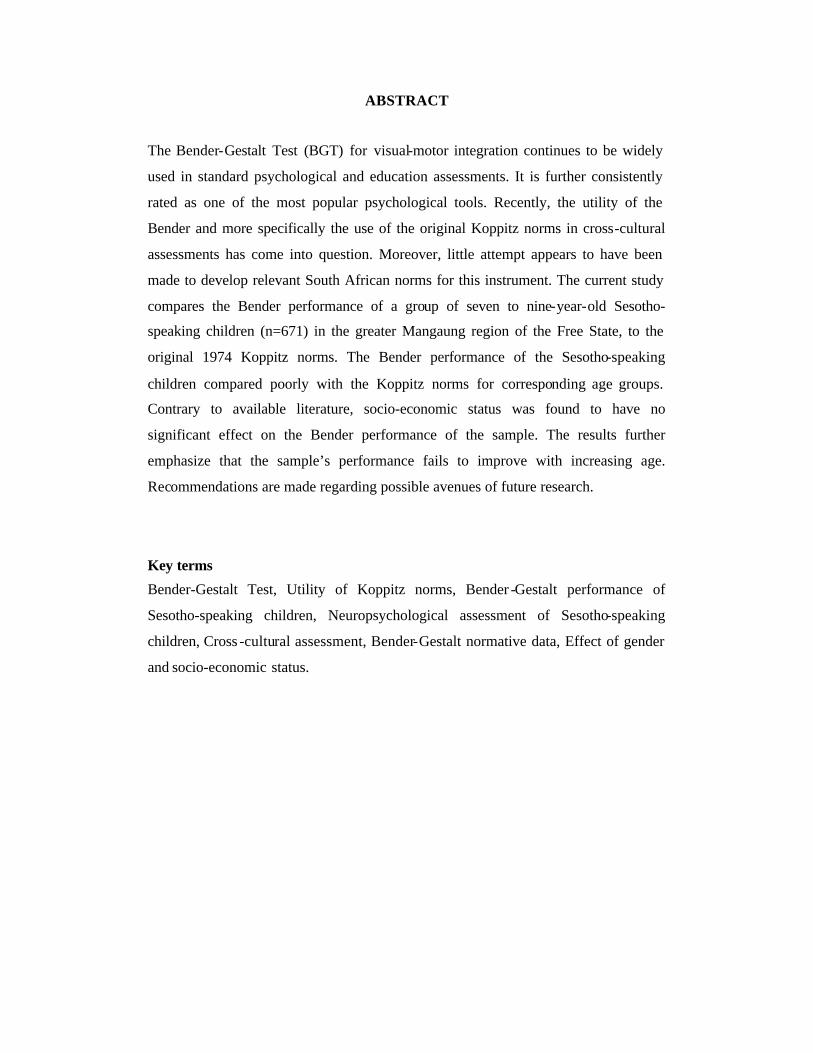
ABSTRACT
The Bender-Gestalt Test (BGT) for visual-motor integration continues to be widely
used in standard psychological and education assessments. It is further consistently
rated as one of the most popular psychological tools. Recently, the utility of the
Bender and more specifically the use of the original Koppitz norms in cross-cultural
assessments has come into question. Moreover, little attempt appears to have been
made to develop relevant South African norms for this instrument. The current study
compares the Bender performance of a group of seven to nine-year-old Sesotho-
speaking children (n=671) in the greater Mangaung region of the Free State, to the
original 1974 Koppitz norms. The Bender performance of the Sesotho-speaking
children compared poorly with the Koppitz norms for corresponding age groups.
Contrary to available literature, socio-economic status was found to have no
significant effect on the Bender performance of the sample. The results further
emphasize that the sample’s performance fails to improve with increasing age.
Recommendations are made regarding possible avenues of future research.
Key terms
Bender-Gestalt Test, Utility of Koppitz norms, Bender -Gestalt performance of
Sesotho-speaking children, Neuropsychological assessment of Sesotho-speaking
children, Cross -cultural assessment, Bender-Gestalt normative data, Effect of gender
and socio-economic status.

OPSOMMING
Die Bender-Gestalt Toets (BGT) vir visueel-motoriese intergrasie word steeds
daagliks in standaard sielkundige en opvoedkundige assesserings ge bruik. Dit word
beskou as een van die mees populêre sielkundige instrumente. Die toepaslikheid van
die BGT en meer spesifiek die gebruik van die oorspronklike norms in kruis-kulturele
assessering word egter bevraagteken. Pogings om relevante norms vir die Suid-
Afrikaanse populasies te ontwikkel, is baie beperk. Die huidige studie vergelyk die
prestasie van ‘n groep Sesothosprekende kinders (n=671) tussen die ouerdomme van
sewe en nege jaar, met die oorspronklike 1974 Koppitz norms. Hierdie kinders is
almal vanuit die Mangaung-distrik, in die Vrystaat, afkomstig. Die Sesothosprekende
kinders se prestasie op die Bender was in vergelyking met die ooreenstemmende
Koppitz normgroepe, baie laer. In teenstelling met die literatuur, is die prestasie van
die huidige steekproef nie beduidend deur hul sosio-ekonomiese status beïnvloed nie.
Die resultate beklemtoon verder dat die steekproef se prestasie nie met toename in
ouderdom verbeter het nie. Voorstelle word in terme van moontlike areas vir verdere
navorsing gemaak.
Sleutelwoorde
Bender-Gestalt Toets, Toepaslikheid van Koppitz norms, Bender -Gestalt prestasie van
Sesothosprekende kinders, Neuro-sielkundige assessering van Sesothosprekende
kinders, Kruis -kulturele assessering, Bender-Gestalt normatiewe data, Effek van
geslag en sosio-ekonomiese status.
1. LITERATURE REVIEW
The Bender-Gestalt Test or Bender-Visual-Motor-Gestalt Test is a popular paper-and-
pencil-drawing test that historically, has been widely used in the screening and
assessment of neuropsychological impairment. The test aims at identifying defects in
an individual’s visio-constructive ability, which is considered a Gestalt function
composed of biological imprints of sensory reception, perception and motor action
(Ghassemzadeh, 1988). For more than six decades, this psychometric measure
developed by Lauretta Bender in 1938 to identify brain-injured adults and to detect
signs of emotional disturbance, has been included as an integral part of psychological
assessments of cognitive functioning (Lacks, 1984).
The Bender-Gestalt Test (BGT) consists of nine cards each displaying an abstract
design. Bender (1938) adapted these stimulus designs from those originally used by
Wertheimer in 1923 for his research on visual perception (Koppitz, 1975). Bender
saw her test as being particularly relevant to the assessment of cognitive maturation
and the diagnosis of organically based pathologies. When administering the test, the
examiner presents the cards one at a time to the test-taker who is required to copy
each design as accurately as possible. No time limits are imposed. Standard
administration requires the designs to be copied on a blank unlined sheet of paper
with an HB pencil (Bender, 1938). The individual’s designs are then rated on their
relative de gree of accuracy and overall integration. The final product is a reflection of
the original stimuli as modified by the test-taker’s unique visual-motor ability.
The BGT’s popularity can be partially attributed to its brief administration and
scoring, as well as its cost effectiveness with regard to the test materials required.
Moreover, a wide variety of quantitative and qualitative interpretation methods
facilitate the flexible use of the BGT amongst a wide variety of clinical populations.
The mainly non-verbal administration required by the BGT is said to make it a
relatively non-threatening assessment tool and facilitates its use in cross-cultural
assessments (Groth-Marnat, 2003; Viljoen, Levett, Tredoux & Anderson, 1994) .
For many years, the BGT has been an integral part of most neuropsychological
assessment batteries. It appears equally widely used by clinicians working with adults

as well as children (Bassa & Schlebusch, 1984; Lees -Haley, Smith, Williams & Dunn,
1996; Piotrowski, 1995; Rabin, Barr & Burton, 2005). Surveys in the United States of
America indicate that the BGT continues to be ranked among the top ten assessment
instruments of choice among psychologists (Lees-Haley et. al., 1996). Despite this
apparent popularity, some studies on the utility of the BGT have yielded ambiguous
findings or fuelled criticism of the instrument (Chan, 2000; Goldstein & Britt, 1994;
Groth-Marnat, 2003; Koppitz, 1975). Nonetheless, the BGT still consistently rates as
one of the 25 most frequently used tests by specialty neuropsychologists in North
America (Groth-Marnat 2003; Rabin, Barr & Burton, 2005). Furthermore, numerous
South African surveys bear testament to the popularity of the BGT among local
assessment practitioners (Bassa & Schlebusch, 1984).
The popularity of the BGT has historically been associated with its reputation as an
instrument with a wide variety of applications amongst diverse clinical groups.
However, for the first two decades following its inception, the BGT was applied
almost exclusively to adult population groups to diagnose a variety of clinical
disorders such as schizophrenia, aphasia and other neurological syndromes (Bender,
1938; Koppitz, 1975; Lacks, 1984). Despite its reported value as a specialty
neuropsychological instrument, more recent opinion is that the BGT’s actual value
lies in its utilization as a brief and economical screening tool for neurological
dysfunction (Groth-Marnat, 2003).
Disillusionment with the BGT as a definitive indicator of brain dysfunction among
adults coincided with its increased popularity as a screening instrument in the
assessment of childhood learning disabilities. Increased awareness of learning
disabilities among school-going children during the 1960’s and 1970’s increased the
need for an inexpensive, brief, easy-to-administer screening tool. The BGT appeared
particularly well suited for this task (Gilger & Kaplan, 2001). It is presumed that the
early detection of learning difficulties can aid in preventing future academic
difficulties and free children from the problems frequently accompanying these
obstacles. Thus, it was felt that the utility of the BGT and other measures of visual-
motor ability may lie in the fact that such measures may form part of assessment
procedures used in the screening of scholastic problems that may emerge during the
early stages of a child’s education. The BGT soon came to be viewed as a valuable

addition to assessment batteries for children. Its particular value resides in its ability
to provide an indication of broad cognitive ability in children. The maturational
relationship between age and BGT performance indicated its additional promise as a
measure of cognitive development (Gilger & Kaplan, 2001; Groth-Marnat, 2003;
Koppitz, 1975). More recently, the use of the BGT amongst children has become
somewhat controversial. Taylor and Partenio (1984) found that IQ accounted for a
significant amount of the BGT performance difference among the white, black and
Hispanic ethnic groups. However, Goldstein and Britt (1994) argued tha t BGT scores
show less significant correlation with scholastic achievement. In light of these and
similar findings, Chan (2000) and Mitchelle -Burns (2000) proposed that the BGT’s
diagnostic efficiency could be improved by alterations to the standard administration
and scoring procedures for the instrument. Chan reported that BGT scores of primary
school children in Hong Kong captured using a modified administration of the BGT
along with a qualitative scoring system, correlated significantly with the children’s
scores on the standardized test of achievement. A comparable study by Mitchelle-
Burns showed that modified administration and scoring of the BGT resulted in a more
accurate diagnosis of learning problems in children, than was the case with standard
procedures.
Despite the reported efficacy of alternative approaches to the administration and
scoring of the BGT, the more standardized methods seem to have prevailed (Chan,
2000; Koppitz, 1975; Mitchelle-Burns, 2000). Of these, the Koppitz Developmental
Scoring System appears most popular and is thus most frequently used (Groth-
Marnat, 2003; Koppitz, 1975; Lacks, 1984). The goal of Koppitz’ Developmental
Scoring System is to provide the examiner with different ways of analyzing children’s
BGT performances by evaluating perceptual maturity, possible neurological
impairment and emotional adjustment. Bender (1938) postulated that reproduction of
the BGT designs depends on maturation, which is believed to be virtually completed
by age 11. Consequently, the developmental scoring system is thought to be of
particular utility with children under the age of eleven. This is partly due to this
particular scoring system’s tendency to lose discriminating power when applied to
adolescents (Bolen, Hewett, Hall & Mitchell, 1992). The frequently noted tendency of
BGT performance to plateau after 11 years of age tends to support the premise that

visual-motor integration should be almost fully developed by about age eleven
(Koppitz, 1975; Shapiro & Simpson, 1995).
Most developmental measures of function or ability that yield a performance age, like
the BGT, can only be meaningfully interpreted when a child’s chronological age is
taken into consideration. Koppitz developed age-related norms for the BGT in 1963.
These norms were based on a sample of white American middle -class children from
kindergarten to fifth grade. A realization of the effects of culture on BGT performance
was reflected in her 1974 revision of these norms, which included minority groups
such as African-Americans and Hispanics. Although attempts were made to rescale
and extend Koppitz’ norms for utilization amongst other population groups, these
were mostly explorative studies and the norms developed by Koppitz in 1974 still
remain the most preferred norms for use with children (Chan, 2000; Groth-Marnat,
2003; Koppitz, 1975; Lacks, 1984; Mitchelle -Burns, 2000; Shapiro & Simpson,
1995). It would thus seem that the most widely used BGT norms include data on a
limited number of minority individuals and cannot reasonably be thought to offer
reliable indications of cognitive or visual-motor integrative development some 30
years after their establishment.
The BGT, like many other psychological assessment tools developed and
standardized in the matrix of Western culture, may not be applicable for use amongst
individuals from other cultures (Nell, 2000). Initially it was assumed that non-verbal
assessment tasks were more suited to cross -cultural assessments (Lezak, 1995).
Consequently, drawing tests like the BGT and construction measures such as the
Block Design subtest of the Wechsler Adult Intelligence Scale are widely used in the
cross cultural context (Van der Merwe, 1998). However, more recent opinion holds
that these tasks tap abilities that are heavily influenced by factors such as culture and
educational background (Roselli & Ardila, 2003).
Numerous studies focusing on the applicability and use of the BGT amongst children
have focused on the relationship between BGT performance and socio -cultural
background. The effect of demographic variables such as intelligence, education and
psychosocial factors on BGT performance has been widely documented (Goldstein &
Britt, 1994; Karr, 1982; Koppitz, 1975; Parush, Sharoni, Hahn-Markowitz & Katz,

2000; Taylor & Partenio, 1984; Viljoen, 1992). Studies conducted on American
children have indicated significantly better performances by white middle-class
children than by their Native American and African-American counterparts, who were
all from disadvantaged backgrounds. Considering the role cultural background might
have on BGT performance, other American studies focused their investigations on
specific ethnic groups. In one such study, similar BGT performance scores were
reported for both advantaged and disadvantaged African-American kindergarten
pupils (Koppitz, 1975). Similarly, when Taylor and Partenio (1984) explored BGT
performance among the different ethnic groups in the United States, they found that
the black group in their sample had twice the number of errors at age 11 tha n the
white participants despite controlling for the effects of intelligence and socio -
economic status. What the abovementioned studies indicate is the presence of
unexplained factors that may be culture-related, for the discrepancies found in BGT
scores among different ethnic groups.
Performance discrepancies become even more evident when BGT usage in non-
western cultures is examined. This was highlighted by Parush et. al., (2000), who
claimed that cultural background played a significant role in overall BGT
performance. Their study compared BGT performance of Bedouin children to that of
mainstream Israeli children. The worse performance by the Bedouin children was
attributed to their more rural environment, conservative Islamic background and
limited access to education. The BGT scores of African children are no exception to
the discrepancies evident in cross-cultural assessments. Results obtained in a study on
Sierra Leone children revealed poorer performance for the investigated sample when
compared to Koppitz’ norms (Karr, 1982). Taking cultural influences into
consideration, the researchers divided the sample into four bipolar groups, i.e.
“village” and “modernized”, “village” representing the rural areas and urban tribal
and urban Creole representing the “modernized” areas. All groups were representative
of four prominent subcultures in Sierra Leone in terms of the degree of modernization
and western life. Of all the groups, the urban Creole performed better on the BGT
than the rest of the sample. Although lower than the Koppitz sample, the authors
believed that the varying degrees of modernization among the four subcultures
contributed to the poorer performance evident in the groups’ BGT scores resulting in
maturational delays which were significantly more pronounced in the other three

groups than the urban Creole group (Karr, 1982). Despite such reported evidence and
the misapplication of the BGT in cross-cultural assessments, what the previously
mentioned studies and others by Ghassemzadeh (1988), Yousefi, Shahim, Razavieh,
Mehryar, Hosseini and Alborzi, (1992) and Mazzeschi and Lis (1999) reveal, is a
pattern of possible cognitive maturation reflected in Koppitz’ findings which suggests
that visual-motor ability is a cognitive entity represented by improved BGT
performance with increases in chronological age.
Studies on the variability of BGT performance amongst South African children have
also been reported in the literature (Saunders, 1974; Viljoen et. al., 1994). One of the
earliest reports (Saunders, 1974) indicated that coloured children performed worse
than expected for the corresponding age on the 1963 Koppitz norms. However,
distinct differences in BGT performance were also evident when the sample was
divided according to language. Coloured children from an English-speaking
background performed better than those from an Afrikaans -speaking background.
Possible explanations for this phenomenon included differences in parental level of
education, with the parents of the English-speaking children reporting higher levels of
education. The English-speaking children also came from higher socio-economic
backgrounds compared to their Afrikaans-speaking counterparts. Two decades later, a
study conducted by Viljoen et. al., (1994) on Zulu-speaking children in Kwa-Zulu
Natal also revealed discrepancies in BGT performance between the group and
Koppitz’ norm sample, the Zulu -speaking group emerging as the poorer performers.
One of the recommendations that followed from this study was the need to develop
norms relevant to the South African context. Consequently, the authors published
norms for the BGT performance of Zulu-speakers from age six to 18 years. It is
interesting to note that the mean performance of the individuals in this norm group
still compares negatively to the 1974 Koppitz norms. Moreover, South Africa’s
cultural and linguistic diversity means that norms such as these cannot be reliably
generalized beyond a specified sector of the population.
The vast majority of research on the variability of BGT performance that has been
reviewed thus far, strongly emphasizes the effect of socio-cultural and developmental
variables. Socio-economic status and education appear to be most frequently
implicated in explanations of poor BGT performance amongst North American

minority groups (Koppitz, 1975; Taylor & Partenio, 1984). Despite the limited
research conducted on the cross-cultural validity of the BGT in the developing world,
most studies have frequently cited low socio -economic status, poor access to
education and cultural variables as being potentially responsible for reduced
performance on the instrument (Karr, 1982; Parush et. al., 2000). Studies conducted
in South Africa yield similar trends to those found in other developing countries
(Saunders, 1974; Viljoen et. al., 1994). Access to quality education is viewed as
impacting significantly on individuals’ performances on measuring instruments in
general, and the BGT in particular. The racial segregation policies adopted by the
previous South African government contributed to current socio-economic
inequalities that are widely accepted as influencing the performance of certain groups
on psychological tests (Foxcroft, 2004; Viljoen et. al. , 1994). Such negative past
socio-political climate in countries such as South Africa could possibly have yielded a
long-term cross-generational effect due to a lack of access to proper educational
resources. This kind of susceptibility might be largely responsible for the effects
evident in the cross-cultural investigations re ported thus far. The multicultural nature
of South African society has historically resulted in the development of different
norms for different cultural and language groups (Foxcroft, 2004; HPCSA, 2004; Van
Eeden & Visser, 1992; Viljoen, 1992). While this may appear to some to be a logical
solution to the challenges of psychological assessment in a multi-cultural society, it
does smack of discrimination. However, seen in the context of the necessity to
perform assessments in everyday clinical practice, no ideal solution exists. Until such
time as socio-economic imbalances have been rectified, clinicians may best serve this
purpose by the collection of a wide variety of normative data that is truly reflective of
South African society (Foxcroft, 2004; Viljoen et. al., 1994).
From the preceding literature review it becomes apparent that despite the lack of
relevant norms and in the face of contradictory research, the BGT continues to form
an integral part of many neuropsychological and educational assessments carried out
on children in South Africa. Consequently, the application of outdated and seemingly
irrelevant normative data appears to continue unabated in the assessment of South
African children from wide -ranging social backgrounds. In light of the very obvious
need, not only for the objective evaluation of the validity of the widely used Koppitz
norms for the BGT, but also in an attempt to extend the existing normative data for

this instrument, this study aims to investigate the utility of the Koppitz norms for the
Bender-Gestalt performance of a group of Sesotho-speaking children.
2. METHOD
2.1. Subjects
A total of ten schools in the greater Mangaung area in the Free State province were
chosen for the study. Located in an urban area, these schools use Sesotho as their
medium of instruction. Permission was obtained from the Free State Department of
Education to approach these schools to participate in the study. Nine schools
eventually agreed to participate. It was decided to focus the study on children between
the ages of seven and nine years. This was due to Bender (1938) and Koppitz (1975)
identifying this age span as a period of rapid visual-motor integrative development.
Moreover, Saunders (1974) and Koppitz (1975) state that children are most likely to
be assessed with regard to various scholastic functions during this period. It was
reasoned that seven to nine-year-olds would comprise the majority of the children in
grade 2 to grade 4, at the selected schools. Consequently, letters were sent home with
all children in the respective grades requesting their guardians to grant informed
consent for the children to participate in the study. The guardians were also required
to complete the accompanying biographical questionnaire and return it to the school
along with a consent form. Consent was obtained for 671 seven to nine-year-old
children to participate in the study. The frequency distribution of the final sample is
depicted in Table 1.

Table 1. Frequency distribution of the investigated group based on gender and
socio-economic status
7 years 8 years 9 years Total
Variable Category N % N % N % N %
Gender Boys 126 46,8 114 51,1 77 43,0 317 47,2
Girls 143 53,2 109 48,9 102 57,0 354 52,8
Total 269 40,1 223 33,2 179 26,7 671 100,0
Socio-economic Low 77 50,3 62 54,9 66 70,2 205 56,9
Status Average 56 36,6 37 32,7 21 22,3 114 31,7
High 20 13,1 14 12,4 7 7,5 41 11,4
Total 153 42,5 113 31,4 94 26,1 360 100,0
It is apparent from Table 1, that gender was evenly distributed within the sample. The
girls slightly outnumbered the boys with 53,2%, 48,9% and 57,0% for ages seven,
eight and nine respectively. The boys comprised a total of 46,8%, 51,1% and 43,0%
of the sample for the respective age groups. Not all parents who gave consent returned
socio-economic status questionnaires. Thus, information on socio-economic status
was available for only 57% of the sample. With regard to the 360 children for whom
socio-economic information was available, 11,4 % were classified as having high
socio-economic status, with 31,7 % having average socio-economic status and low
socio-economic status being attributed to 56,9 % of the sample.
Despite the researcher’s best efforts to increase the response rate, the general
infrastructure and geographical layout of the region, as well as low levels of parental
literacy is thought to have largely contributed to the poor response rate. More
qualitative perusal of the socio-economic status questionnaires raises doubt regarding
the cross-cultural validity of Riordans’ (1978) scale within this particular sample. This
appears primarily to be attributable to a poor fit between the questionnaire’s
occupational categories and the occupations repor ted by the respondents. The reported
socio-economic status data should therefore be interpreted circumspectly.

2.2. Instruments
1. A biographical questionnaire was distributed to parents to collect information
regarding their education level and occupation in order to determine their
socio-economic status. The respondents were then assigned to one of the three
socio-economic status levels (i.e. low, average or high) according to the scale
developed by Riordan (1978) (see Appendices B and C).
2. The Bender-Gestalt Test for visual-motor integration (Bender, 1938) was the
primary instrument of investigation. Standardized on white American middle-
class five to eleven-year-old children, the BGT has shown test-retest reliability
of 0.53-0.90 for children in kindergarten to sixth grade (Koppitz, 1975). The
BGT’s construct validity is implied by a 0.65 correlation with the
Developmental Test of Visual-Motor Integration.
2.3. Procedure
Seven Sesotho-speaking post-graduate Psychology students from the University of the
Free State assisted in the administration of the Bender -Gestalt test. All seven had
experience in the administration of the Bender -Gestalt test and received further
training in the standard administration method suggested by Koppitz (1975) prior to
administering the BGT to the participants. The children were assessed in groups of 4
to 6 individuals, in accordance with the group-assessment method of the BGT as
suggested by Koppitz (1975). The standard Bender-Gestalt designs reproduced to
scale on A4 cards were used as stimuli for the assessment. All other aspects of the
administration were conducted according to the standard method suggested by
Koppitz. All instructions were given in Sesotho. Each child was provided with a blank
unlined A4 sheet of paper and a pencil. Pencil erasures were available to the groups,
but their use was discouraged as per the Koppitz administration method. Clear
visibility of the designs was ensured for each child prior to commencing the test
administration. The designs were displayed to the group, one at a time, until all
subjects had completed their drawings.
Queries and requests by the participants that deviated from the standard procedure
were dealt with according to the recommended Developmental Bender Administration
System as proposed by Koppitz. Each protocol was independently scored by two
research assistants according to the Koppitz Developmental Bender Scoring System,

with all scoring discrepancies between these raters being resolved by a third scorer.
Since the Developmenta l Bender Scoring method is based on the number of errors
made in copying the designs (a possibility of 30 errors), the total score yielded is a
negative score. This score is based on recording imperfections instead of giving credit
for accuracy in the reproduction of the Bender designs. The number of errors each
participant made was then equated to a test-age using Koppitz’ 1974 norms. Unlike
the 1964 norms, the 1974 norm sample featured an attempt by Koppitz to include a
cross-section of children from different backgrounds with the total sample comprising
of 86 % white, 8,5 % African-American, 4,5 % Hispanics and 1 % Orientals.
3. RESULTS
In order to compare the Sesotho sample with the 1974 Koppitz norm group the t-test
for independent groups was employe d. Means and standard deviations are presented
in Table 2, with an age breakdown.
Table 2. Means and standard deviations of the number of errors made for the
Sesotho-speaking group and Koppitz’ norm group
Sesotho Koppitz*
Age group X SD X SD
t
7 years 6,6 2,5 5,8 3,3 1,786
8 years 8,6 3,2 4,2 2,5 10,864**
9 years 8,0 3,4 2,8 2,2 14,607**
** p < 0,01
Note. Koppitz* refers to Koppitz’ 1974 normative sample.
The results in Table 2 indicate that the Koppitz norm group’s mean number of errors
decreased with age. Conversely, the Sesotho-speaking sample’s mean number of
errors increases with age. A significant difference was found between the mean
number of errors made of the two groups for eight and nine -year-olds. While it is
evident that the Sesotho-speaking group obtained a higher mean number of errors than

the all-age-inclusive Koppitz sample, the difference in mean number of errors made
by the seven-year-old group is not statistically significant.
In order to gain information regarding the rate of improvement for the two groups,
slope estimates (b ) were calculated for the linear regression with age as the predictor
and Bender-Gestalt performance scores as the criterion. This information is presented
in Table 3.
Table 3. Comparison of slope coefficients in equations relating age to the
Bender-Gestalt Test performance
Sesotho sample Koppitz’ sample
b 0,007 -1,460
t 5,80**
sb 0,001 0,254
r 0,197 -0,958
** p < 0,01
The slope represents the rate of change – the steeper the slope the faster the
improvement of performance with age.
For the BGT, the slope would be expected to be negative considering that a lower
error score is indicative of better performance. A test for the equality of slope
coe fficients (Howell, 2002) was conducted and the results reported in Table 3. The
Koppitz sample exhibited a negative slope (-1,46), which was much steeper than the
Sesotho-speaking sample’s slope of 0,007. From Table 3 it appears that the difference
in slopes is significant at the 1 % level. It is also noticeable that the rate of
improvement for the Koppitz sample appears to be greater (1,46 units per year), than
that of the Sesotho-speaking group, which indicates worse performance with increase
in age (0,007 units per year).
It is clear from the comparison of the slope coefficients that almost no improvement
occurs from seven to nine years in the Sesotho-speaking sample, while the Koppitz
norm group shows consistent improvement. This difference is also reflected in Table

2 where the mean number of errors made by the Sesotho-speaking group does not
decrease with age, while a significant decline is apparent with respect to the Koppitz
norm group.
Due to the extent to which the Sesotho-speaking sample’s mean number of errors
made differ from those of the original norm group, it was decided to investigate the
possible role that gender and socio-economic status may have had on BGT
performance of the Sesotho-speaking group. Firstly, the effect of gender was
investigated. This information is provided in Table 4.
Table 4. Means and standard deviations of the number of errors made for the
Sesotho-speaking boys and girls
Boys Girls
Age group X SD X SD
t p d
7 years 6,5 2,6 6,7 2,5 -0,69 0,4932
8 years 8,2 3,2 8,9 3,2 -1,83 0,0685
9 years 6,9 3,1 8,8 3,5 -3,89 0,0001** 0,56
** p < 0,01
Table 4 suggests an initial increase in the number of errors made from the seven-year-
olds to the eight-year-olds, but a slight decrease in the number of errors made between
the eight and nine -year-olds. However, the nine -year-old boys’ mean number of errors
made still remains higher than the seven-year-old boys’ mean number of errors made.
With regard to the girls, there is also an increase in the mean number of errors made
from age seven to eight. The mean number of errors made then appears to remain
consistent for the nine-year-olds.
The t-test for independent groups was used to determine whether a significant
difference exists in the mean number of errors made for each gender within the three
age groups. The results in Table 4 indicate that a significant difference in the mean
number of errors made for the nine-year-old boys and girls is apparent at the 1 %
significance level. Thus, the nine-year-old girls display a significantly higher mean
number of errors made than the nine-year-old boys. The effect size of this result was
also calculated and is indicated by Cohen’s d (a value of 0,2 is indicative of a smaller
effect, 0,5 of a medium effect and a value of 0,8 is indicative of a larger effect). The d
value of 0,56 reported in Table 4 is thus for all practical purposes, an indication of a
medium effect size. Secondly, the possible effect of socio-economic status (low,
average, high) on BGT performance of the Sesotho-speaking sample was investigated.
Complete socio -economic status data was available for only about half of the sample
(n=360). Consequently, any findings pertaining to the effect of socio-economic status
on the BGT in this norm group should be dealt with circumspectly. The potential
effect of socio-economic status was also investigated per age group and the results of
the analysis of variance (F-value) are reported in Table 5.
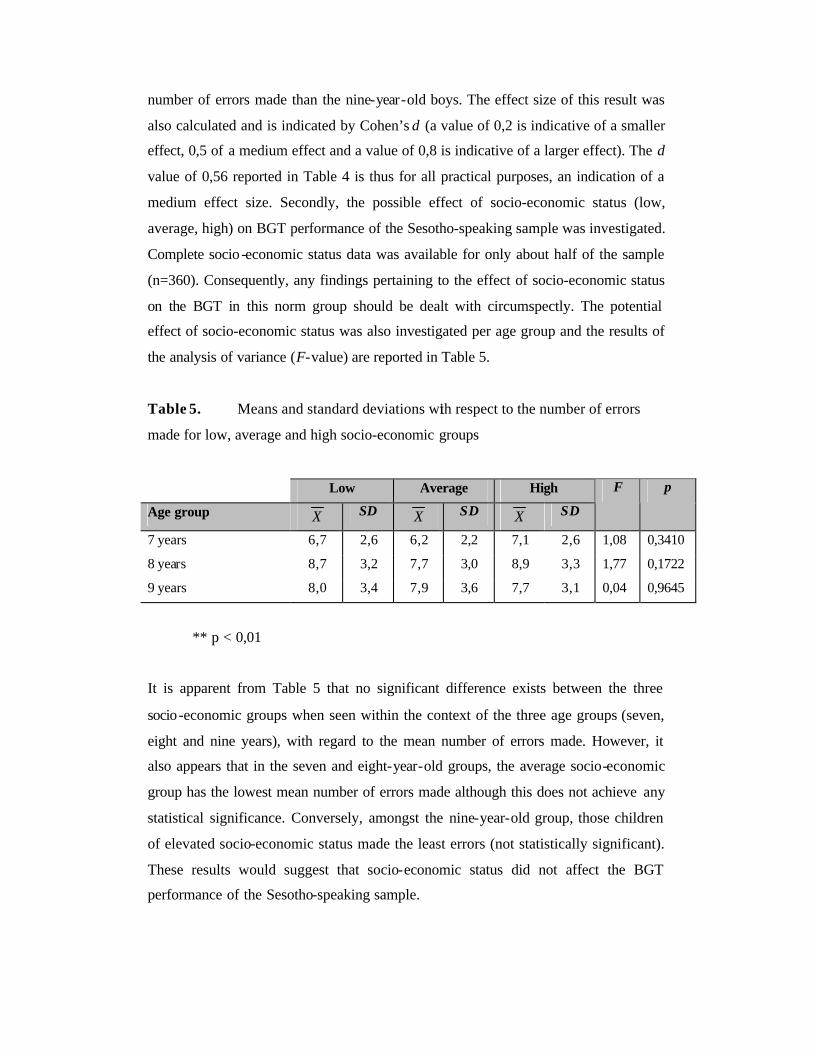
Table 5. Means and standard deviations with respect to the number of errors
made for low, average and high socio-economic groups
Low Average High
Age group X SD X SD X SD
F p
7 years 6,7 2,6 6,2 2,2 7,1 2,6 1,08 0,3410
8 years 8,7 3,2 7,7 3,0 8,9 3,3 1,77 0,1722
9 years 8,0 3,4 7,9 3,6 7,7 3,1 0,04 0,9645
** p < 0,01
It is apparent from Table 5 that no significant difference exists between the three
socio-economic groups when seen within the context of the three age groups (seven,
eight and nine years), with regard to the mean number of errors made. However, it
also appears that in the seven and eight-year-old groups, the average socio-economic
group has the lowest mean number of errors made although this does not achieve any
statistical significance. Conversely, amongst the nine-year-old group, those children
of elevated socio-economic status made the least errors (not statistically significant).
These results would suggest that socio-economic status did not affect the BGT
performance of the Sesotho-speaking sample.

Moreover, the performance age (based on the number of errors made) of the Sesotho-
speaking group on the Bender -Gestalt Test was compared to their chronological age.
The set of comparisons for the seven-year-old group (two groups of 7-0 to 7-5 and 7-6
to 7-11) is depicted in Table 6. (Generally a six-month delay was regarded as
acceptable during interpretation)
Table 6. Comparison of chronological age and performance age on the Bender-
Gestalt Test for the seven-year-old Sesotho-speaking group
For the 7-0 to 7-5-year-old group it appears that 40(24,4%) of the participants fall
within the expected performance age (allowing for the six -month delay). A total of
54(32,9%) performed better than the levels indicated for their chronological age and
70(42,7%) performed below the levels expected for their chronological age. As
indicated in Table 6, 27(25,7%) of the 7-6 to 7-11-year-old group performed within
the expected range with 33(31,4%) performing better than the levels indicated for
their chronological age. The number of children in this group performing below the
level expected for their chronological age was 45(42,9 %).
Chronological age
7 – 0 to 7 - 5 7 – 6 to 7 – 11
Performance age N % N %
4 – 10 to 4 - 11 2 1,2 0 0,0
5 – 0 to 5 – 5 12 7,3 2 1,9
5 – 6 to 5 – 11 29 17,7 16 15,2
6 – 0 to 6 – 5 27 16,5 14 13,3
6 – 6 to 6 – 11 23 14,0 13 12,4
7 – 0 to 7 – 5 17 10,4 16 15,2
7 – 6 to 7 – 11 25 15,2 11 10,5
8 – 0 to 8 – 5 17 10,4 18 17,1
8 – 6 to 8 – 11 7 4,3 12 11,4
9 – 0 to 9 – 11 4 2,4 1 1,0
10 – 0 to 10 – 11 1 0,6 1 1,0
11 – 0 to 11 – 11 0 0,0 1 1,0
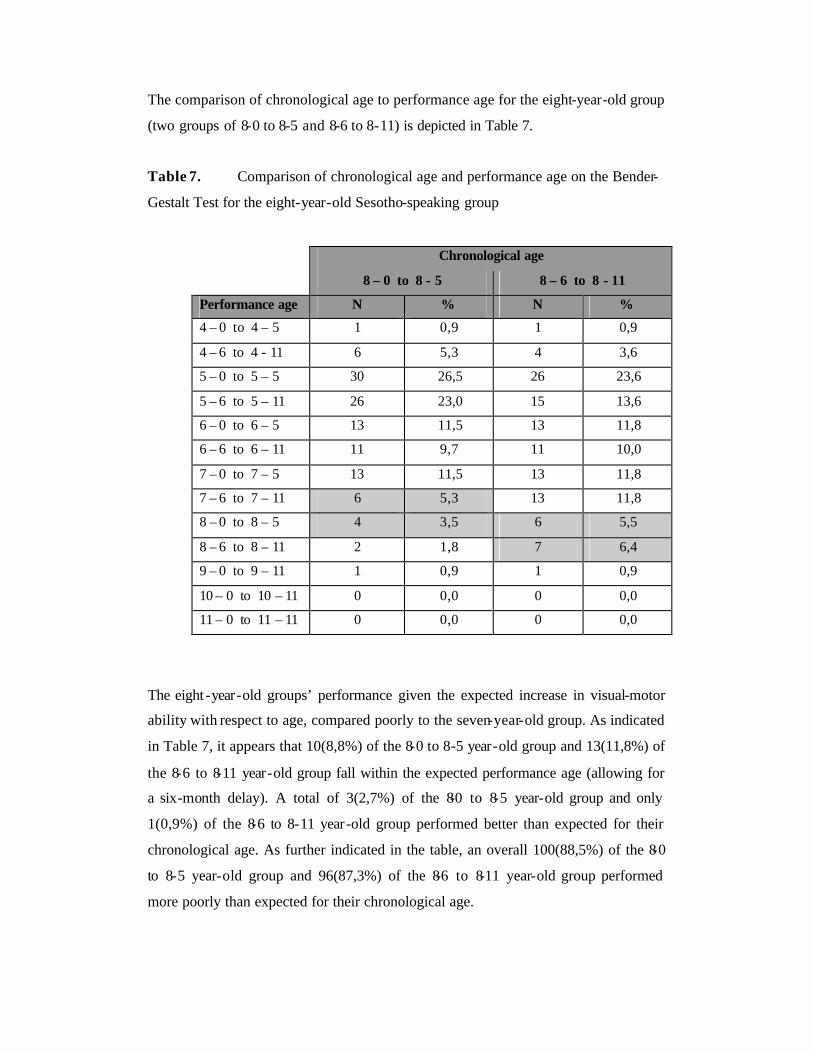
The comparison of chronological age to performance age for the eight-year-old group
(two groups of 8-0 to 8-5 and 8-6 to 8-11) is depicted in Table 7.
Table 7. Comparison of chronological age and performance age on the Bender-
Gestalt Test for the eight-year-old Sesotho-speaking group
Chronological age
8 – 0 to 8 - 5 8 – 6 to 8 - 11
Performance age N % N %
4 – 0 to 4 – 5 1 0,9 1 0,9
4 – 6 to 4 - 11 6 5,3 4 3,6
5 – 0 to 5 – 5 30 26,5 26 23,6
5 – 6 to 5 – 11 26 23,0 15 13,6
6 – 0 to 6 – 5 13 11,5 13 11,8
6 – 6 to 6 – 11 11 9,7 11 10,0
7 – 0 to 7 – 5 13 11,5 13 11,8
7 – 6 to 7 – 11 6 5,3 13 11,8
8 – 0 to 8 – 5 4 3,5 6 5,5
8 – 6 to 8 – 11 2 1,8 7 6,4
9 – 0 to 9 – 11 1 0,9 1 0,9
10 – 0 to 10 – 11 0 0,0 0 0,0
11 – 0 to 11 – 11 0 0,0 0 0,0
The eight -year-old groups’ performance given the expected increase in visual-motor
ability with respect to age, compared poorly to the seven-year-old group. As indicated
in Table 7, it appears that 10(8,8%) of the 8-0 to 8-5 year-old group and 13(11,8%) of
the 8-6 to 8-11 year-old group fall within the expected performance age (allowing for
a six-month delay). A total of 3(2,7%) of the 8-0 to 8-5 year-old group and only
1(0,9%) of the 8-6 to 8-11 year-old group performed better than expected for their
chronological age. As further indicated in the table, an overall 100(88,5%) of the 8-0
to 8-5 year-old group and 96(87,3%) of the 8-6 to 8-11 year-old group performed
more poorly than expected for their chronological age.
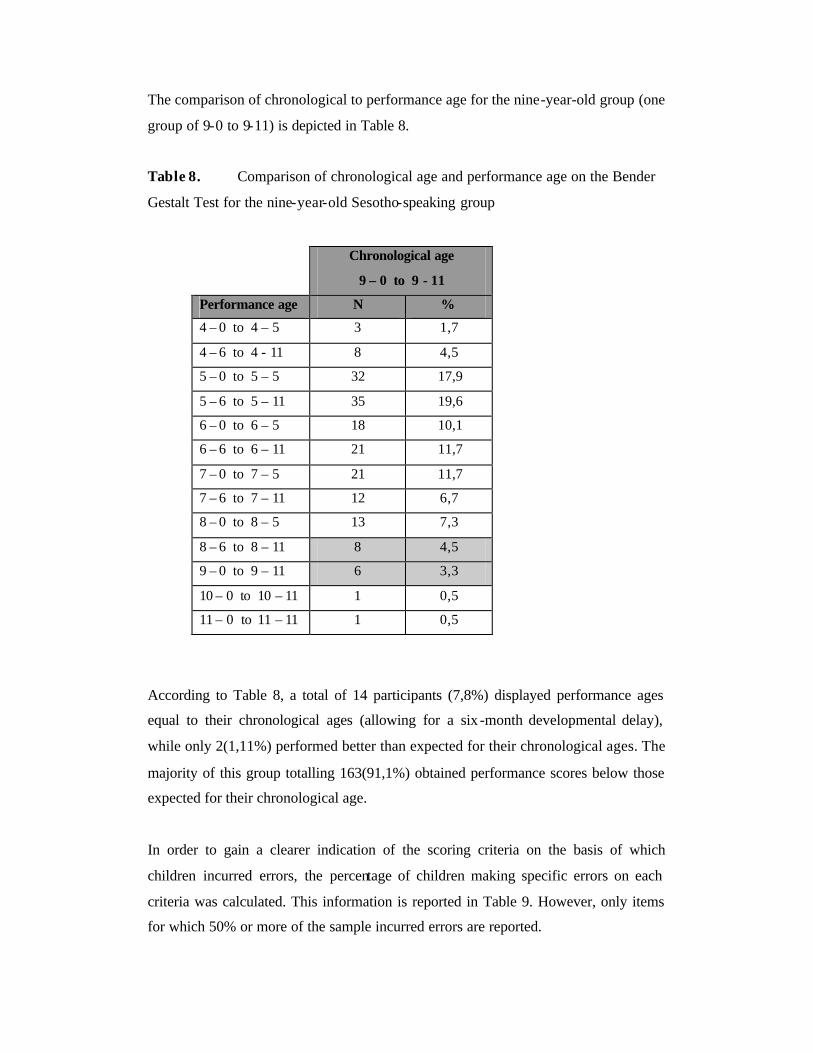
The comparison of chronological to performance age for the nine-year-old group (one
group of 9-0 to 9-11) is depicted in Table 8.
Table 8. Comparison of chronological age and performance age on the Bender
Gestalt Test for the nine-year-old Sesotho-speaking group
Chronological age
9 – 0 to 9 - 11
Performance age N %
4 – 0 to 4 – 5 3 1,7
4 – 6 to 4 - 11 8 4,5
5 – 0 to 5 – 5 32 17,9
5 – 6 to 5 – 11 35 19,6
6 – 0 to 6 – 5 18 10,1
6 – 6 to 6 – 11 21 11,7
7 – 0 to 7 – 5 21 11,7
7 – 6 to 7 – 11 12 6,7
8 – 0 to 8 – 5 13 7,3
8 – 6 to 8 – 11 8 4,5
9 – 0 to 9 – 11 6 3,3
10 – 0 to 10 – 11 1 0,5
11 – 0 to 11 – 11 1 0,5
According to Table 8, a total of 14 participants (7,8%) displayed performance ages
equal to their chronological ages (allowing for a six -month developmental delay),
while only 2(1,11%) performed better than expected for their chronological ages. The
majority of this group totalling 163(91,1%) obtained performance scores below those
expected for their chronological age.
In order to gain a clearer indication of the scoring criteria on the basis of which
children incurred errors, the percentage of children making specific errors on each
criteria was calculated. This information is reported in Table 9. However, only items
for which 50% or more of the sample incurred errors are reported.
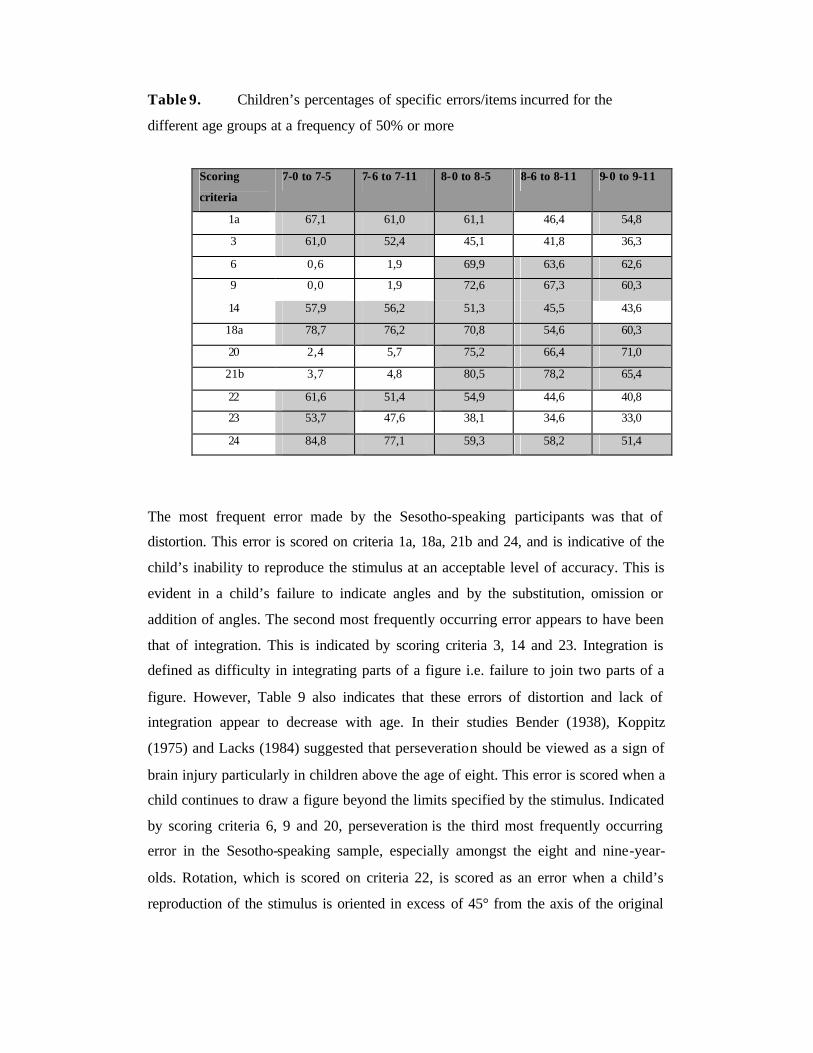
Table 9. Children’s percentages of specific errors/items incurred for the
different age groups at a frequency of 50% or more
Scoring
criteria
7-0 to 7-5 7-6 to 7-11 8-0 to 8-5 8-6 to 8-11 9-0 to 9-11
1a 67,1 61,0 61,1 46,4 54,8
3 61,0 52,4 45,1 41,8 36,3
6 0,6 1,9 69,9 63,6 62,6
9 0,0 1,9 72,6 67,3 60,3
14 57,9 56,2 51,3 45,5 43,6
18a 78,7 76,2 70,8 54,6 60,3
20 2,4 5,7 75,2 66,4 71,0
21b 3,7 4,8 80,5 78,2 65,4
22 61,6 51,4 54,9 44,6 40,8
23 53,7 47,6 38,1 34,6 33,0
24 84,8 77,1 59,3 58,2 51,4
The most frequent error made by the Sesotho-speaking participants was that of
distortion. This error is scored on criteria 1a, 18a, 21b and 24, and is indicative of the
child’s inability to reproduce the stimulus at an acceptable level of accuracy. This is
evident in a child’s failure to indicate angles and by the substitution, omission or
addition of angles. The second most frequently occurring error appears to have been
that of integration. This is indicated by scoring criteria 3, 14 and 23. Integration is
defined as difficulty in integrating parts of a figure i.e. failure to join two parts of a
figure. However, Table 9 also indicates that these errors of distortion and lack of
integration appear to decrease with age. In their studies Bender (1938), Koppitz
(1975) and Lacks (1984) suggested that perseveration should be viewed as a sign of
brain injury particularly in children above the age of eight. This error is scored when a
child continues to draw a figure beyond the limits specified by the stimulus. Indicated
by scoring criteria 6, 9 and 20, perseveration is the third most frequently occurring
error in the Sesotho-speaking sample, especially amongst the eight and nine-year-
olds. Rotation, which is scored on criteria 22, is scored as an error when a child’s
reproduction of the stimulus is oriented in excess of 45° from the axis of the original
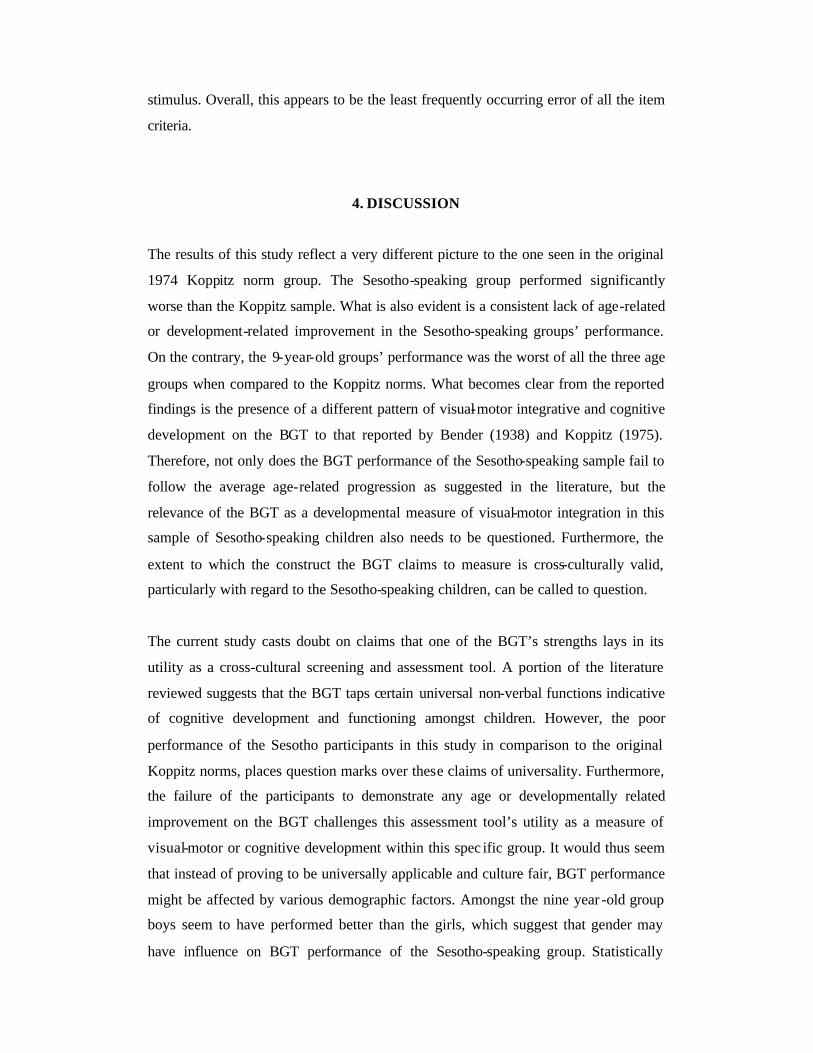
stimulus. Overall, this appears to be the least frequently occurring error of all the item
criteria.
4. DISCUSSION
The results of this study reflect a very different picture to the one seen in the original
1974 Koppitz norm group. The Sesotho-speaking group performed significantly
worse than the Koppitz sample. What is also evident is a consistent lack of age-related
or development-related improvement in the Sesotho-speaking groups’ performance.
On the contrary, the 9-year-old groups’ performance was the worst of all the three age
groups when compared to the Koppitz norms. What becomes clear from the reported
findings is the presence of a different pattern of visual-motor integrative and cognitive
development on the BGT to that reported by Bender (1938) and Koppitz (1975).
Therefore, not only does the BGT performance of the Sesotho-speaking sample fail to
follow the average age-related progression as suggested in the literature, but the
relevance of the BGT as a developmental measure of visual-motor integration in this
sample of Sesotho-speaking children also needs to be questioned. Furthermore, the
extent to which the construct the BGT claims to measure is cross-culturally valid,
particularly with regard to the Sesotho-speaking children, can be called to question.
The current study casts doubt on claims that one of the BGT’s strengths lays in its
utility as a cross-cultural screening and assessment tool. A portion of the literature
reviewed suggests that the BGT taps certain universal non-verbal functions indicative
of cognitive development and functioning amongst children. However, the poor
performance of the Sesotho participants in this study in comparison to the original
Koppitz norms, places question marks over these claims of universality. Furthermore,
the failure of the participants to demonstrate any age or developmentally related
improvement on the BGT challenges this assessment tool’s utility as a measure of
visual-motor or cognitive development within this spec ific group. It would thus seem
that instead of proving to be universally applicable and culture fair, BGT performance
might be affected by various demographic factors. Amongst the nine year -old group
boys seem to have performed better than the girls, which suggest that gender may
have influence on BGT performance of the Sesotho-speaking group. Statistically
socio-economic status seemed to have not influenced the BGT performance of the
Sesotho-speaking group. However, it should be noted that while not statistically
significant, the nine-year-old group from the low socio-economic group performed
worst on the BGT. The researcher also noticed that the schools that participated in the
study lacked many facilities. Consequently, inequalities in the level of education may
account for the Sesotho-speaking children’s poor performance to some degree.
Nevertheless, what is apparent is that the performance of the Sesotho sample does not
replicate the pattern of performance of the Koppitz sample and does not appear to be
significantly influenced by factors commonly cited in the literature (e.g. socio -
economic status, chronological age).
The current study strongly suggest that the Koppitz norms have limited utility in the
interpretation of Sesotho-speaking children’s performance on the BGT. This
statement can be made with a fair degree of confidence as the large sample (n=671)
allows for a reasonable degree of generalization within the Sesotho-speaking
population aged between seven and nine years, within this particular geographical
region. Continued use of the Koppitz norms would not accurately reflect these
children’s level of cognitive development and would result in a high rate of false
positive diagnoses for cognitive and visual-motor difficulties. The resulting
misappropriation of resources for intervention and remediation would continue to be a
financial and human resources burden within the education milieu. Consequently, the
continued use of the BGT as a primary screening and assessment tool amongst the
Sesotho-speaking children should be discontinued. However, this is not to say that the
instrument may not make a significant contribution within the context of more
comprehensive neuropsychological assessments.
5. LIMITATIONS OF THE STUDY AND RECOMMENDATIONS FOR
FUTURE RESEARCH
In light of the preceding discussion, various limitations of this study need to be
carefully considered. Firstly, the study was focused on a very narrow section of the
population, within a very specific geographical area. Thus, although the relatively
large sample facilitates generalization of the results within the target population, no

generalizations can be made to other cultural groups, age groups or individuals from
other geographic locations. This situation is further complicated by South Africa’s
rich cultural diversity. It is logical to reason that if norms for BGT performance are
not transferable from Western to African cultures, then similarly there can be no
certainty that individuals from different African cultures will exhibit similar
performances on the BGT either. These difficulties highlight the need for extensive
well-constructed norming studies for existing instruments, or failing this, the necessity
to develop more locally relevant measuring instruments.
A second limitation of the current study relates to the absence of measures for related
areas of function. No attempt was made to control for variables such as intelligence,
the validity of the BGT in comparison to other measures of visual-motor integration
etc. However, as stated earlier the size of the sample was sufficiently representative of
the target population. Therefore, the assumption can be confidently made that the
BGT performance of the participants is normally distributed within the sample.
Nonetheless, additional information would add to the analysis of the results and cast
some light on the nature and relevance of the particular construct/s measured by the
BGT amongst Sesotho-speaking children.
Thirdly, the method of allocating individuals to the different socio-economic levels
proved to be poorly suited to the context of the study. The participants’ parents could
not reliably be divided into various socio -economic levels as their careers and
qualifications did not effectively correlate with those suggested by Riordan (1978) for
determining socio-economic status. Moreover, socio -economic data was only
gathered for half of the sample, therefore conclusions reached regarding the role of
socio-economic status in BGT performance need to be dealt with circumspectly.
Future research should thus focus on defining the validity of the construct/s measured
by the BGT amongst Sesotho-speaking or other Southern African groups. This would
enable the development of the most effective means of assessing this and other
constructs within these specific cultural groups. Longitudinal studies may also add
valuable information to the nature of the construct measured by the BGT, as well as
its predictive utility and possible developmental application.

6. REFERENCES
Bassa, F.M. & Schlebusch, L. (1984). Practice preferences of clinical
psychologists in South Africa. South African Journal of Psychology, 14 , 118-123.
Bender, L. (1938). A Visual-motor Gestalt Test and its clinical use. Research
monographs: no 3. New York: American Orthopsyc hiatric Association.
Bolen, L.M., Hewett, B.J., Hall, C.W. & Mitchell, C.C. (1992). Expanded
Koppitz’ Scoring System of the Bender-Gestalt Visual-Motor Test for
adolescents: A Pilot study. Psychology in the schools, 29 , 113-115.
Chan, P.W. (2000). Relationship of visual-motor development and academic
performance in Hong Kong assessed on the Bender -Gestalt Test. Perceptual
Motor Skills, 90, 209-214.
Foxcroft, C.D. (2004). Planning a psychological test in the multicultural South
African context. South African Journal of Industrial Psychology, 30 (4), 8-15.
Ghassemzadeh, H. (1988). A pilot study of the Bender-Gestalt Test in a sample of
Iranian normal children. Journal of Clinical Psychology, 44(5), 787-792.
Gilger, J.W. & Kaplan, B.J. (2001). Atypical Bra in development: A conceptual
framework for understanding developmental learning disabilities. Developmental
Neuropsychology, 20 (2), 465-481.
Goldstein, D.J. & Britt (jnr.), T.W. (1994). Visual-motor coordination and
intelligence as predictors of reading, mathematics and written language ability.
Perceptual Motor Skills. 78, 819-823.
Groth-Marnat, G. (2003). Neuropsychological Assessment in Clinical Practice: A
guide to test interpretation and integration. Canada: John Wiley & Sons.

Howell, D.C. (2002). Statistical methods for psychology (5th ed). Johannesburg:
Duxbury.
Karr, S.K. (1982). Bender-Gestalt performance of Sierra-Leone; West African
children from four subcultures. Perceptual and Motor Skills, 55, 123-127.
Koppitz, E.M. (1963). The Bender-Gestalt Test for young children (2nd ed.). New
York: Grune & Stratton.
Koppitz, E.M. (1975). The Bender-Gestalt Test for young children: II Research
and Application, 1963-1973. New York: Grune & Stratton.
Lacks, P. (1984). Bender-Gestalt screening for brain dysfunction. New York:
John Wiley & Sons.
Lees-Haley, P.R., Smith, H.H., Williams, W.C. & Dunn, J.T. (1996). Forensic
Neuropsychological Test Usage: An Empirical Survey. Archives of Clinical
Neuropsychological, 11(1), 45-51.
Lezak, M. (1995). Neuropsychological assessment (3rd ed.). New York: Oxford
University Press.
Mazzeschi, C. & Lis, A. (1999). The Bender-Gestalt Test: Koppitz’
Developmental Scoring System administered to two samples of Italian preschool
and primary school children. Perceptual and Motor Skills, 88 , 1235-1244.
Mitchelle -Burns, J. (2000). Performance in children with and without learning
disabilities on Canter’s Background Interference Procedure and Koppitz’ Scoring
System for the Bender test. Perceptual and Motor Skills, 90 , 875-882.
Nell, V. (2000). Cross-cultural neuropsychological assessment: Theory and
Practice. London: Gaurende Erlbaum Associates.

Parush, S., Sharoni, C., Hahn-Markowitz, J. & Katz, N. (2000). Perceptual, motor
and cognitive performance components of Bedouin children in Israel.
Occupational Therapy International, 7 (4), 216-231.
Piotrowski, C. (1995). A review of the clinical and research use of the Bender-
Gestalt Test. Perceptual and Motor Skills. 81, 1272-1274.
Rabin, L.A., Barr, W.B. & Burton, L.A. (2005). Assessment practices of clinical
neuropsychologists in the United States and Canada: A survey of INS, NAN and
APA Division members. Archives of Clinical Neuropsychology. 20 , 33-65.
Riordan, Z.V.A. (1978). Locus of control in South Africa: A cross-ethnic study.
Unpublished Doctoral Thesis: University of Port Elizabeth.
Roselli, M. & Ardila, A. (2003). The impact of culture and education on
neuropsychological measurements a critical review. Brain and Cognition, 52 , 326-
333.
Saunders, E.A. (1974). Components of the Bender-Gestalt Performance in
coloured children in relation to environment, teacher effectiveness and perceptual
training. Masters Thesis: University of the Witwatersrand, Johannesburg.
Shapiro, S.K. & Simpson, R.G. (1995). Koppitz’ Scoring System as a measure of
Bender-Gestalt performance in behaviorally and emotionally disturbed
adolescents. Journal of clinical Psychology. 51 ,1.
Taylor, R.L. & Partenio, I. (1984). Ethnic differences on the Bender-Gestalt:
Relative effects of measured intelligenc e. Journal of Consulting and Clinical
Psychology, 52 (5), 784-788.
Van der Merwe, C. (1998). Die toepaslikheid van die blokontwerptegniek vir die
meting van intelligensie by swart leerlinge. Masters Thesis: University of the Free
State.
Van Eeden, R. & Visser, D. (1992). The validity of the South African Individual
Scale-Revised (SSAIS-R) for different population groups. South African Journal
of Psychology, 22 (3), 163-174.
Viljoen, G. (1992). Neuropsychological Assessment of Zulu-speaking children .
Masters Thesis: University of Cape Town.
Viljoen, G., Levett, A., Tredoux, C. & Anderson, S. (1994). Using the Bender-
Gestalt in South Africa: Some normative data for Zulu -speaking children. South
African Journal of Psychology, 24(3), 145-150.
Yousefi, F., Shahim, S., Razavieh, A., Mehryar, H.A., Hosseini, A.A. & Alborzi,
S. (1992). Some normative data on the Bender-Gestalt Test performance of
Iranian children. British Journal of Educational Psychology, 62, 410-416.
Regulation and Use of psychological tests. Retrieved September 2004, from
http://www.hpcsa.co.za.

APPENDICES

APPENDIX A (ENGLISH)
LETTER TO PARENT/GUARDIAN
Dear Parent/Guardian
A study on the utility of the Bender Gestalt test
We are conducting a study on the utility of the Bender -Gestalt Test to Sesotho-
speaking children. We are especially interested in the use of this measure as a means
of detecting learning problems amongst children. Very little research in this regard
has been done in South Africa and almost none in the Free State. We therefore believe
that the information obtained can add to our knowledge regarding the use of this
measure and hopefully provide data for further advancement of the test.
Should you decide to allow your child to participate in the study, your information
will be treated with the utmost confidentiality. If you are willing to permit your child
to participate in the study, please sign this letter at the space provided below and
complete the accompanying biographical questionnaire.
We will appreciate your co-operation and participation in this research.
You are more than welcome to contact us personally, should you need more
information or clarity.
Sincerely
Lerato Makhele Dr Stephen Walker
Researche r Supervisor
…………………………………………………………………………………………..
Parent/Guardian : Choose the appropriate response (Yes, I agree/No, I disagree)
____________________ (Please make your signature here)

APPENDIX A (SESOTHO)
LENGOLO LA MOTSWADI/MOHLOKOMEDI
Motswadi/Mohlokomedi
Thuto ka Bender-Gestalt Test
Re etsa diteko tsa “Bender-Gestalt Test” baneng ba buang Sesotho. Sepheo sa rona ke
ho sebedisa tsela ena, e le ho sheba hore na mathata a thuto a ho kae. Ha ho na
diphuputso tse ileng tsa etswa mabapi le hona Afrika Borwa, ha ele Foreistata yona,
ha e yo. Re kgolwa hore dintlha tseo di tla hlahiswang ke diteko tsena, di tla re thusa.
Bana ba tla nkang sepha ditekong tsena tsa ho toroya, dikarabo tsa bona di tla
bolokwa sephiring, ha hona motho e mong ya tla tseba ka tsona. Ha motswadi kapa
mohlokomedi ana le maikemisetso a ho dumella ngwana ho nka karolo, o tlamehile
ho tlatsa lengolo lena fatshe le foromo ya dipotso e tsamayang le lengolo lena, mme o
dikgutlise le ngwana. Ke lebohela tshebedisano mmoho, le ho nka karolo ditekong
tsena.
O na le hona ho ikopanya le rona ka seqo kapa letsetsa mohala, ha o hloka thlaloso
mabapi le diteko tsena.
Ka boikokobetso
Lerato Makhele Dr. Stephen Walker
Mmatlisise Mohlokomedi
…………………………………………………………………………………………
Motswadi/Mohlokomedi: Kgetha karabo ya hao (Ee , ke a dumela/Tjhee, ha ke
dumele)______________________ (Ka kopo saena lebitso la hao mona)

APPENDIX B (ENGLISH)
BIOGRAPHICAL QUESTIONNAIRE FOR PARENT, GUARDIAN OR
BREADWINNER
1. Name of child: ______________________
2. Childs’ date of birth: __________________
3. Childs’ gender: ______________
4. Parent/guardians’ name: __________________
5. Parent/guardians’ gender: ___________________
6. Who does the child live with? ______________________
7. Level of Education of parent/guardian/breadwinner. Please indicate the
highest level of education by making a circle on the appropriate response:
None 1
Primary school (grade 7/ Standard 5 or lower) 2
Junior Certificate (Grade 10/ Standard 8) 3
Apprenticeship/Trade 4
Matric (Grade 12/ Standard 10) 5
Further training (University excluded) 6
University 7
8. Classification of occupation of parent/guardian/breadwinner. Please indicate
the type of job you do by making a circle on the appropriate response:
OCCUPATION CLASSSIFICATION
Top professional posts, executive head, administrative and technical
occupations , e.g. rector, professor, medical doctor, psychiatrist, advocate,
engineer, chief technologist, company director, company manager, regional
manager of company or government department.
9
Professional, administrative and management, e.g. lecturer, labour
consultant, personnel manager, chemical analyst, prosecutor, priest,
psychologist, architect, school principal, magistrate, teacher, social worker,
scientist, company consultant, land owner.
8

Independent or Commercial person, e.g. estate agent, marketer, owner of
hired vehicle, dealer, company representative, building contractor, graphic
designer, consultant, sangoma, agricultural chemist, business owner, land
owner.
7
Lower-grade administrative, technical and clerical occupations with
supervisory and administrative responsibilities, e.g. shift supervisor,
manager, farm supervisor/senior foreman, postal master, shift manager, pastor,
restaurant, missionary, officer in the police or army, senior clerk, marketer
6
Trade and trained worker with trade qualification, e.g. qualified fitter and
turner, cook, electrician, diesel mechanic, optometric technician, tradesman,
carpenter, welder, builder, motor vehicle mechanic, duster, painter, builder,
data typist, photo framing officer.
5
Routine clerical and administrative worker, service and sales worker, e.g.
cashier, supervisor, foreman, sales person, traffic officer, telephonist, soldier,
store assistant, construction worker, warden, shop assistant, police officer,
typist, store supervisor.
4
Half/Semi-skilled production and manual labour, e.g. mason, miner,
hairdresser, construction worker, dressmaker, driver of hired vehicle.
3
Unskilled production and manual labour, e.g. cleaner, butcher, cook, farm
worker, baker, domestic worker, caretaker, road worker, waiter, petrol
attendant, cashier, gardener, fabric worker, security guard, factory worker.
2
Non-economic active or non-productive person, e.g. unemployed, pensioner
and police reserve.
1
No response 0

APPENDIX B (SESOTHO)
FOROMO E TLATSWANG KE MOTSWADI/MOHLOKOMEDI
1. Lebitso la ngwana: ________________
2. Letsatsi la hae la tlhaho: _______________
3. Ngwana; E motona kapa e motshehadi? _________________
4. Lebitso la motswadi/mohlokomedi: ___________________
5. Motswadi/mohlokomedi: E motona kapa e motshehadi:
________________
6. Ngwana o dula le mang? __________________
7. Thuto e phahameng ya motswadi/mohlokomedi/motswaredi: Bontsha
thuto e phahameng ka ho etsa sedikadikwe khethong ya hao.
Ha eyo 1
Thuto ya poraemari (Grade 7/Sehlopha sa 5) 2
Thuto e phahameng (Grade 10/Sehlopha sa 8) 3
Mohwebi/mosebetsi wa matsoho 4
Grade 12 (Sehlopha sa 10) 5
Thuto e pejana (eseng Yunibesiti) 6
Yunibesiti 7
8. Tlhopiso ya mosebetsi wa motswadi/mohlokomedi/motshwaredi. Bontsha
ka ho etsa sedikadikwe karabong ya hao.
Tlhopiso ya mosebetsi
Diporofeshene tse phahameng : mohlala, Molaodi/Setho sa kgotla la
phetiso/puso/botekeniki, Moreketoro, Moporofesa, Ngaka, Saekhatirisi,
Mmueli, Moenjinere, Hlooho ya tekhenology, Molaodi wa lebatowa wa
khampani kapa lefapha la thuto.
9

Porofeshene, Molaodi, Mmusisi: mohlala, Moleketoro, Mohlokomedi wa
mosebetsi, Mohlophisi wa meriana, Moahlodi, Moprista, Saekhologisi,
Setshwantsi, Mosuwehlooho, Maseterata, Titjhere, Mosebeletsi wa setjaba,
Boramahlale, Motherisi wa kgwebo, Monga naha.
8
Barekisi ba ikemetseng: mohlala, Morekisi, Monga makoloi a hiriswang,
Mohwebi, Moemedi wa khampani, Mokontoraka wa kaho, Moradi wa
dikerafa, Motherisi, Ngaka ya setso, Mokhemisi wa tsa temo, Rrakgwebo,
Monga naha.
7
Balaodi bo tlaase: mohlala, Botekeniki, Botlelereke, Bohlokomedi bo
nang le maikarabelo, Mohlokomedi wa ditjhifi, Molaodi, Mohlokomedi wa
polasi/foromane e ka sehlohong, Raposo, Molaodi wa ditjhifi, Moruti,
Resetorante, Morumuwa, Ofisiri wa sepolesa kapa sesole, Tlelereke e ka
sehloohong, Morekisi.
6
Kgwebo/mosebeletsi ya rupelletsweng ka tsa kgwebo: mohlala,
Mophehi, Ramotlekase, Mokheniki wa dilori, Ngaka ya mahlo,
Motekeniki, Rrakgwebo, Mmetli, Moweleti, Mohahi, Mokheniki wa
dikoloi, Sehlakodi, Moferefi, Moforeimi wa dinepe, Mothapaiti wa tsebisi,
Moofisiri.
5
Tlelereke ya tlwaelo/bolaodi/tshebeletso/morekisi: mohlala, Ramatlotlo,
Mohlokomedi, Foromane, Morekisi, Molaola sephetephethe, Ramohala,
Lesole, Mothusis wa setoro, Mosebetsi wa konteraka, Morekesetsi, Ofisisri
ya lepolesa, Motlanyi, Mohlokomedi wa setoro.
4
Bokgoni ba dithlahiso le mosebetsi wa matsoho: mohlala, Morafi,
Mokuti, Mosebetsi wa konteraka, Seroki, Mokganni wa dikoloi tse
hiriswang.
3
Ditlhahiso tsa bokgoni bo sa phethahalang le mosebetsi wa matsoho;
mohlala, Mohlwekisi, Raselaga, Mophehi, Mosebeletsi wa polasi, Mobaki,
Mosebeletsi wa hae, Molebedi, Basebetsi ba tsela, Mofepi, Morekisi wa
peterolo, Ramatloltlo, Mosebetsi wa serapa, Mosebetsi wa masela,
Lepolesa polokeho, Mosebetsi wa faboriki.
2
Batho ba sa sebetseng kapa ba safaneng ka ekonomi: mohlala, Ba-
penshene, Ba sa sebetseng, Mapolesa a polokelotsietsi.
1

Ha ho karabo 0

APPENDIX C
Classification of socio -economic status for three racial groups in South Africa
(Riordan, 1978)
CLASSIFICATION OF SOCIO-ECONOMIC STATUS
RACIAL GROUP
Low
Average
High
Black
2-5
6-10
11-16
Coloured
2-6
7-10
11-16
White
2-10
11-13
14-16