Embed Size (px)
Citation preview

Uticaj mikrotalasnog zagrevanja na kinetiku hemijskih reakcija i fizičkohemijskih procesa
Prof. dr Borivoj Adnađević

• Microwave heating is a widely accepted,
non-conventional energy source which is now applied in numerous fields.
• Dramatically reduces reaction times• Increases product yields • Enhance product purities by reducing unwanted
side reactions

The effect of microwave irradiation: • thermal effects - overheating (Baghurst & Mingos, 1992), • hot-spots (Zhang et. al., 1999), • selected heating (Raner et. al., 1993), • specific microwave effects (Hoz et. al., 2005).
• The thermal effects are connected with the different characteristics of microwave dielectric heating and conventional heating

• The thermal effects are connected with the different characteristics of microwave dielectric heating and conventional heating
MICROWAVE HEATING CONVENTIONAL HEATING
Energetic coupling Conduction/ convection
Coupling at the molecular level Superficial heating
Rapid Slow
Volumetric Super ficial
Selective Non-selective
Dependant on the properties of the materials
Less dependant on the properties of the materials
Table 1. The basic characteristics of microwave and conventional heating
Microwave heating (MWH) significantly:
• accelerates the rate of chemical reactions and physico-chemical processes,
• gives higher yields and improve properties of the products.

Microwave heating is a widely accepted, non-conventional
energy source for organic synthesis and different physico-
chemical processes:
• sintering, nucleation and crystallization,• combustion synthesis, • calcination, • solvent-free reactions, • heterogeneous catalysis and • combinatorial chemistry

• The issue of specific microwave effects is still a controversial matter. Several theories have been postulated and also some predicted models have been published.
• Berlan et al., 1998, observed the acceleration of a cycloaddition reaction under isothermal microwave reaction conditions and explained the change in entropy of the reaction systems.

• Microwave enhanced the imidization reaction of a sulfone and ketone group-containing polyamic acid, which Lewis et al., 1992, elucidated with a mechanism based on “excess dipole energy”, in which it was proposed that the localized energy (temperature) of the dipole groups was higher compared to the non-polar bonds within these systems.
• Rybakov and Semenov, 1994, explained the effect of microwave reaction conditions on the kinetics of reactions in the solid state with the formation of a ponderomotive force, which influences the time-average motion of charged particles and enhances ionic transport in the solid state.

• The ability of microwave radiation to excite rotational transitions and thus enhance the internal energy of a system was used by Strauss and Trainor, 1995, to explain the effects of microwave fields on the kinetics of chemical reactions.
• Binner et al., 1995, investigating the effect of a microwave field on the kinetics of titanium carbide formation, concluded that in the presence of a microwave field, the molecular mobility increases which leads to the increasing value of Arrhenius pre-exponential factor which further causes an acceleration of the synthesis of titanium carbide.
• Stuerga and Gaillard, 1996, explained the acceleration of the reaction rate in condensed states under microwave reaction conditions in comparison to conventional reacting conditions by the enhanced rate of collisions in condensed phases, which induces transfer between rotational and vibrational energy levels and reaction acceleration.
• Booske et al., 1997, used the existence of non-thermal energy distributions to explain microwave-enhanced solid-state transport.

• Based on the experimentally confirmed decrease in the values of the activation energy of sodium bicarbonate decomposition under microwave reaction conditions, Shibata et al., 1996, concluded that the effect of a microwave field on dielectric materials is to induce rapid rotation of the polarized dipoles in the molecules. This generates heat due to friction while simultaneously increasing the probability of contact between the molecules, thus enhancing the reaction rate and reducing the activation energy.

• Perreux and Loupy, 2000, studied and classified the nature of the microwave effects considering the reaction medium and reaction mechanism, i.e., the polarity of the transition state and the position of the transition state along with the reaction coordinate.
• Blanco and Auerbach, 2003, theoretically proved that the energy of a microwave field is initially transferred to select molecular modes (transition, vibration and/or rotation) and used this information to explain the inverse desorption of benzene and methanol from zeolite, compared to thermal desorption.

• Conner and Tumpsett, 2008, explained specific microwave effects with the capability of microwaves to change the relative energies of rotation of intermediates in a given sequences.

The aim:
• Presents the results of investigations of the kinetics of – under conventional and microwave conditions for
• a) chemical reactions: isothermal PAA hydrogel formation, fullerole formation, and sucrose hydrolyses
• b) physicochemical process: ethanol adsorption and PAM hydrogel dehydration;
– present the effects of microwave reaction conditions on: • -kinetics model, • -values of kinetic parameters, • -the complexity of the kinetics of the investigated processes
• To explain the effects of a microwave field on the kinetics of chemical reaction and physico-chemical processes.
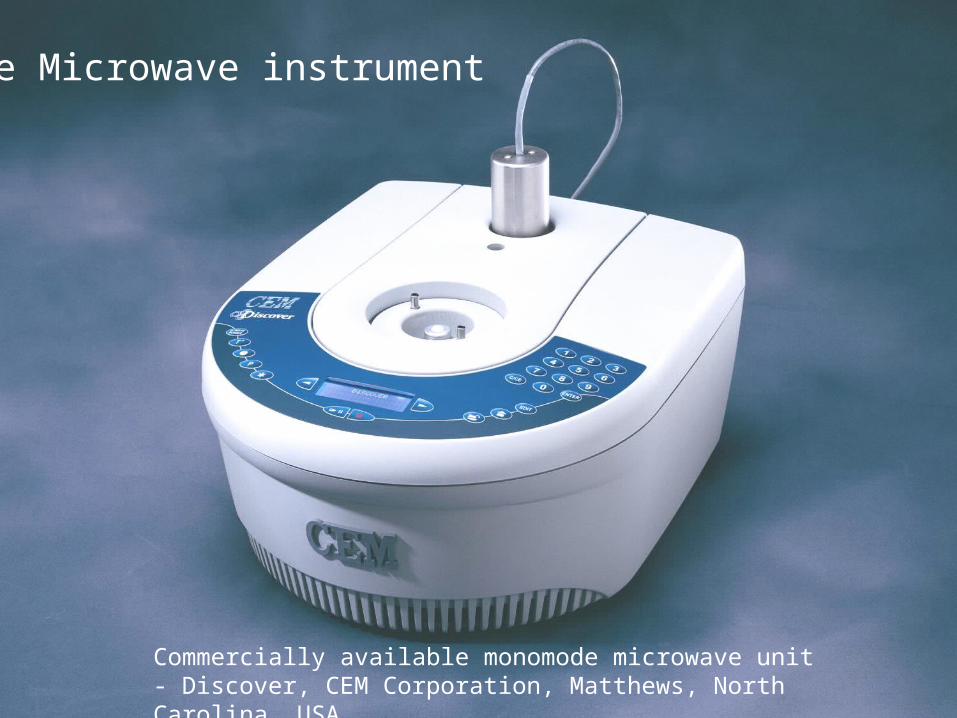
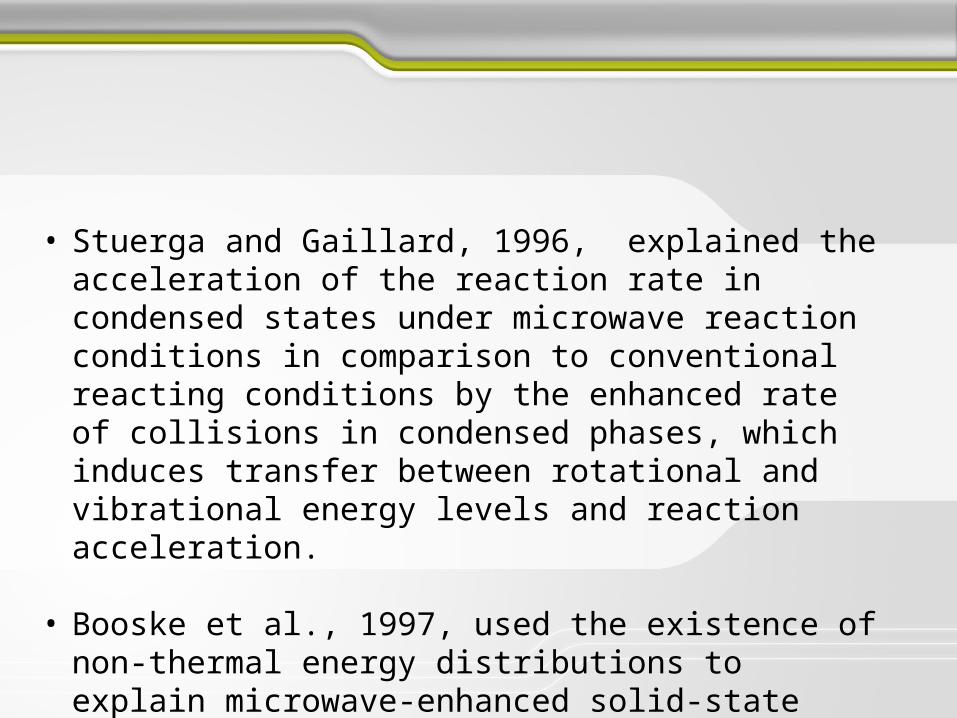
The Microwave instrument
Commercially available monomode microwave unit - Discover, CEM Corporation, Matthews, North Carolina, USA

• Model-Fitting Metod
• Differential isoconversion method (Friedman’s method)
Methods used to evaluate the kinetic model and kinetic parameters

Model-Fitting Metod
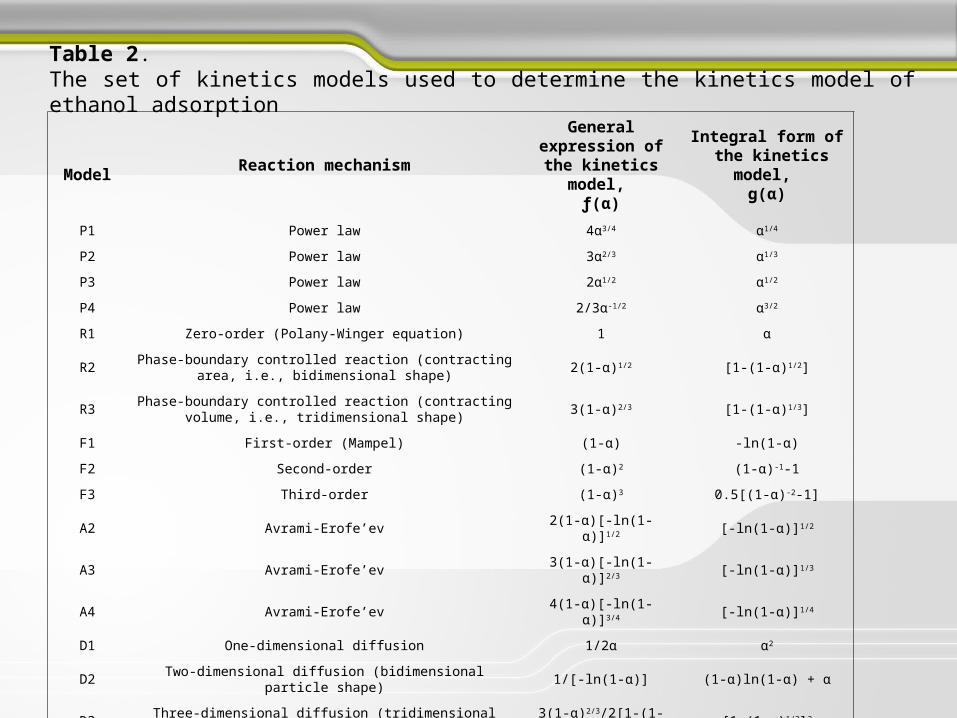
According to the model-fitting method the kinetic reaction model in solid state are classified in 5 groups depending on the reaction mechanism: (1) power law reaction (2) phase-boundary controlled reaction (3) reaction order (4) reaction described by the Avrami equation and (5) diffusion controlled reactions.

The model-fitting method is based on the following. The experimentally determined conversion curve αexp=f(t)T has to be transformed into the experimentally normalized conversion curve αexp=f(tN)T, where tN is the so-called normalized time. The normalized time, tN, was defined by the equation:
Model-Fitting Metod

where t0.9 is the moment in time at which α=0.9.
The kinetics model of the investigated process was determined by analytically comparing the normalized experimentally conversion urves with the normalized model’s conversion curves. The kinetics model of the investigated process corresponds to the one for which the sum of squares of the deviation of its normalized conversional curve from the experimental normalized conversional curve one gives minimal values.
Model-Fitting Metod
9.0t
ttN
ModelReaction mechanism
General expression of the kinetics
model, ƒ(α)
Integral form of the kinetics model,
g(α)
P1 Power law 4α3/4 α1/4
P2 Power law 3α2/3 α1/3
P3 Power law 2α1/2 α1/2
P4 Power law 2/3α-1/2 α3/2
R1 Zero-order (Polany-Winger equation) 1 α
R2Phase-boundary controlled reaction (contracting area, i.e.,
bidimensional shape)2(1-α)1/2 [1-(1-α)1/2]
R3Phase-boundary controlled reaction (contracting volume, i.e.,
tridimensional shape)3(1-α)2/3 [1-(1-α)1/3]
F1 First-order (Mampel) (1-α) -ln(1-α)
F2 Second-order (1-α)2 (1-α)-1-1
F3 Third-order (1-α)3 0.5[(1-α)-2-1]
A2 Avrami-Erofe’ev 2(1-α)[-ln(1-α)]1/2 [-ln(1-α)]1/2
A3 Avrami-Erofe’ev 3(1-α)[-ln(1-α)]2/3 [-ln(1-α)]1/3
A4 Avrami-Erofe’ev 4(1-α)[-ln(1-α)]3/4 [-ln(1-α)]1/4
D1 One-dimensional diffusion 1/2α α2
D2 Two-dimensional diffusion (bidimensional particle shape) 1/[-ln(1-α)] (1-α)ln(1-α) + α
D3Three-dimensional diffusion (tridimensional particle shape) Jander
equation3(1-α)2/3/2[1-(1-α)1/3] [1-(1-α)1/3]2
D4Three-dimensional diffusion (tridimensional particle shape) Ginstling-
Brounshtein3/2[(1-α)-1/3-1] (1-2α/3)-(1-α)2/3
Table 2. The set of kinetics models used to determine the kinetics model of ethanol adsorption

0.0 0.2 0.4 0.6 0.8 1.0
0.0
0.2
0.4
0.6
0.8
1.0
D4
D3
D2
D1 A4
A3
A2
F1 R3
R2
R1
P4
P3 P2
P1
t/t0,9
Reakcionimodeli
Fig 2: Modelne krive

Differential isoconversion method
The activation energy of the investigated adsorption process for various degrees of conversion was established by the Friedman method-based on the follows.
The rate of the process in condensed state is generally a function of temperature and conversion:
(4)i.e.
(5)
),( T
dt
d
)()( fTk
dt
d

Differential isoconversion method
Where dα/dt is the reaction rate, is function of α and T, α is the conversion degree, the rate constant t the time, T the temperature, and is the reaction model associated with a certain reaction mechanism. The dependence of the rate constant on temperature is ordinary described by the Arrhenius law:
(6)
where Ea is the activation energy, A is the pre-exponential factor and R is the gas constant
)exp(RT
EaAk
Differential isoconversion method
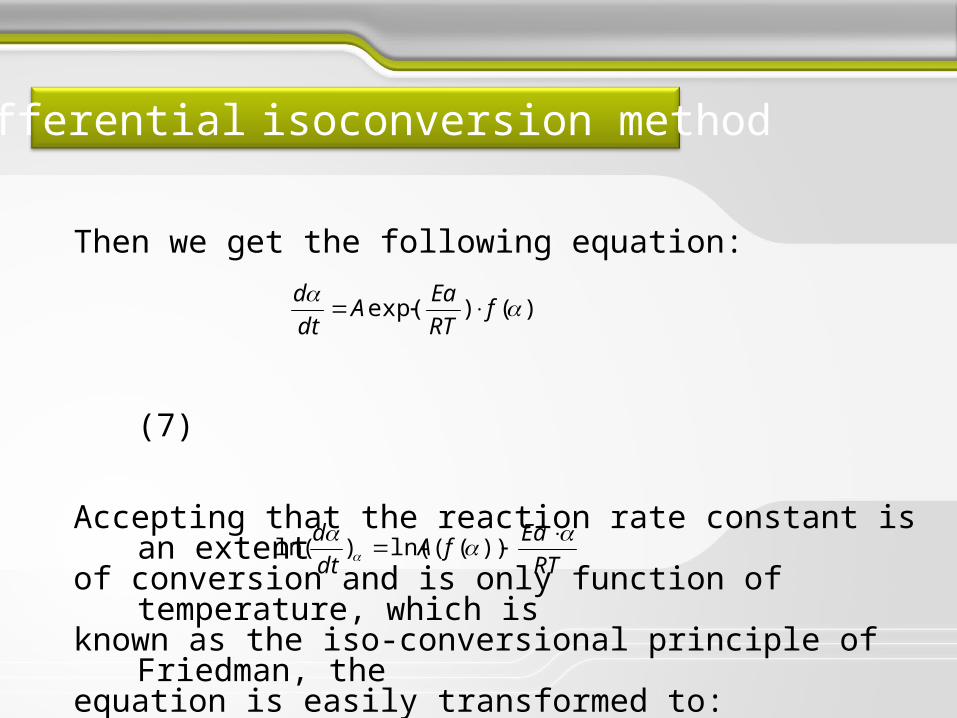
Then we get the following equation:
(7)
Accepting that the reaction rate constant is an extentof conversion and is only function of temperature, which is known as the iso-conversional principle of Friedman, the equation is easily transformed to:
(8)
That allows the evaluation of the activation energy for particular degree of conversion:
)()exp( f
RT
EaA
dt
d
RT
EafA
dt
d
))((ln()(ln

Isothermal kinetics of acrylic acid polymerization and crosslinking
0 100 200 300 400 5000.0
0.2
0.4
0.6
0.8
1.0
Time, min
303 K 313 K 323 K
(A)
Fig 3: Conversion curves for the formation of PAA hydrogel
0 1 2 3 4 50.0
0.2
0.4
0.6
0.8
1.0
Time, min
303 313 323
(B)
(A) CIRC conditions (B) MWIRC conditions

Dependence of dα/dt on the degree of PAA hydrogel formation under (A) conventional conditions and (B) microwave conditions
T, K Conventional process Microwave process
(dα/dt)max,[min–1]
Kinetic parameters
(dα/dt)max,[min–1]
Kinetic parameters
303 0.019 Ea=22±0.2 kJ/mol
ln A = 5±0.1
0.947 Ea=17±0.3 kJ/molln A=7±0.1313 0.023 1.105
323 0.032 1.433
0.0 0.2 0.4 0.6 0.8 1.00.00
0.01
0.02
0.03 303 K 313 K 323 K
d/dt
(A)
0.0 0.2 0.4 0.6 0.8 1.00.0
0.4
0.8
1.2
1.6
d/dt
303 313 323
(B)

Kinetic model of : second-order chemical reaction (CH) first-order chemical reaction (MWH )
0 100 200 300 400 5000
5
10
15
20
[1/(1
-)]-1
303 K 313 K 323 K
Time, min0 1 2 3 4 5
0
2
4
6
8
-ln(
1-
Time, min
303 313 323
Fig 4. Isothermal dependence of [[1/(1- α)] -1] on reaction time for PAA hydrogel formation under the CH
Fig 5. Isothermal dependence of [–ln(1-α)] on reaction time for PAA hydrogel formation under MWH
T, K Conventional process Microwave process
k, min–1 Kinetic parameters
K, min–1 Kinetic parameters
303 0.023 Ea,M=21±1 kJ/molln (AM /min–1)=
9.4±0.2
1.008 Ea,M=17±1 kJ/molln (AM /min–1)=8.6±0.2 313 0.035 1.180
323 0.047 1.590
0.0 0.2 0.4 0.6 0.8 1.00
10
20
30
40
50
E a, k
Jmol-1
conventional microwave
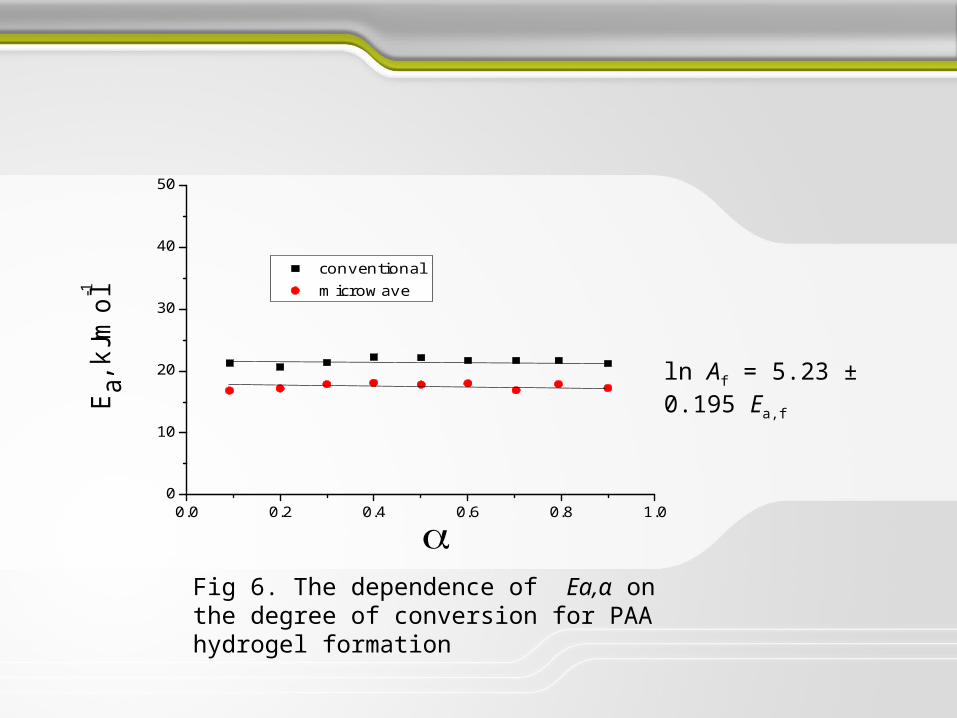
ln Af = 5.23 ± 0.195 Ea,f
Fig 6. The dependence of Ea,α on the degree of conversion for PAA hydrogel formation
Larsson Model of selective energy
• During the interaction of a catalyst with reacting molecules, the existence of a compensation effect and the formation of an “active complex” (Larson, 1989) is explained as the consequence of transfer of the necessary amount of vibrational energy from an energetic reservoir onto the reacting molecule, which is aimed at “active complex” formation.
• The established changes in the kinetics parameters (decrease) can be explained with the decrease in: required amount of vibration energy necessary for “active complex” formation and in resonance frequency of the energetic transfer the between the oscillators under MWIRC in comparison to CIRC.

Larsson Model of selective energy
• It can be assumed that a reacting molecule can be modeled as a sum of normal oscillators and that that molecule convert into an “active complex” anytime when it accepts the necessary amount of energy (energy of activation) and that during the formation of such an “active complex”, vibrational changes occur which are in relation with changes connected with the localization of the energy on a defined bond (normal oscillator).

Larsson Model of selective energy
Then, in accordance with the Larsson Model the wave number of the resonant oscillation (ν) and the energy of activation (Ea) of the reaction can be calculated. The wave number of the resonant oscillation is given by: (9)
where b is the energetic parameter of the compensation effect equation, while the values of the activation energy is quantized and given as:
(10)
where n is the number of quantum of vibrational energy transferred from one to another oscillator or from an energy reservoir („heat bath”) to the resonant oscillator, which are necessary to overcome the energetic barrier (activation energy) and x is the anharmonicity constant of the oscillator.
bR
715.0
RTxnnEa )( 2
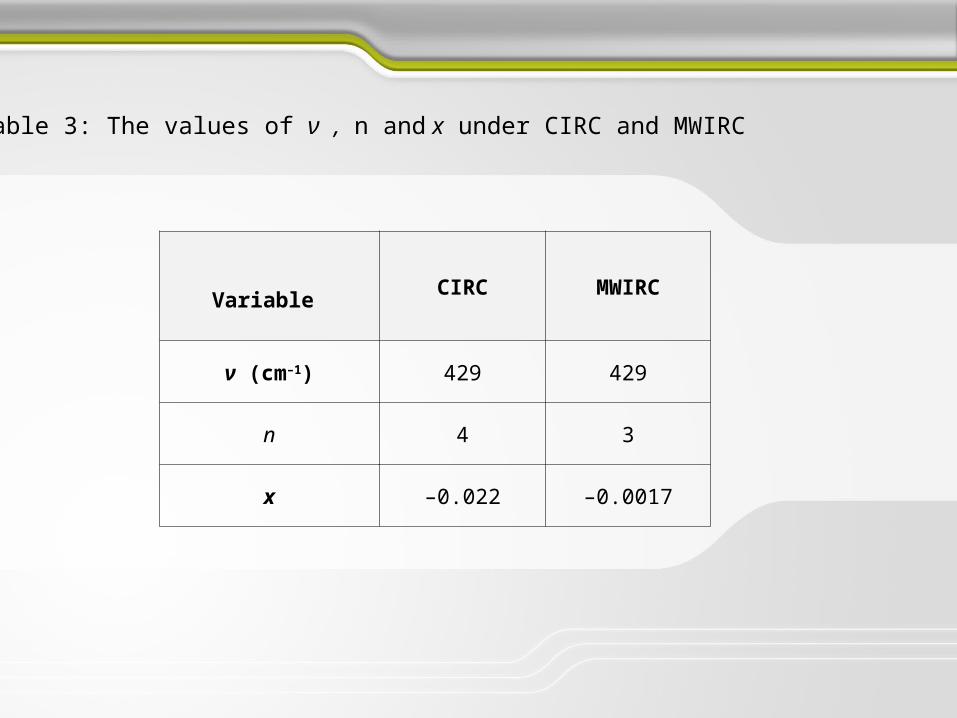
Variable CIRC MWIRC
ν (cm–1) 429 429
n 4 3
x –0.022 –0.0017
Table 3: The values of ν , n and x under CIRC and MWIRC

2. Isothermal kinetics of fullerol formation
0 40 80 120 160 2000.0
0.2
0.4
0.6
0.8
1.0
293 K 298 K 303 K 308 K 313 K
Time, min
(A)
0 20 40 60 800.0
0.2
0.4
0.6
0.8
1.0
Time, min
293 K 298 K 303 K 308 K 313 K
(B)
Fig 7. The isothermal conversion curves for fullerol formation under (A) CIRC and (B) MWIRC
tkM exp1

Figure 7. The dependence of [–ln(1-α)] on reaction time for fullerol formation for (A) CIRC and (B) MWIRC
0 40 80 120 160 2000
5
10
15
20
25
-ln(
1-)
Time, min
293 K 298 K 303 K 308 K 313 K
(A)
0 20 40 600
4
8
12
16
-ln(1
-)
Time, min
293 K 298 K 303 K 308 K 313 K
(B)
Table 4. The temperature influence on the model’s reaction rate constants and the kinetics parameters for fullerol formation, for the conventional and the microwave reacting conditions
T, K Conventional process Microwave process
k, min-1 Kinetics parameters
k, min-1 Kinetics parameters
293 0.047 Ea,M=38±2 kJ/molln(AM /min-1)=
12.6±0.5
0.101 Ea,M=10.5±0.5 kJ/molln(AM /min-1)=2.44±0.04 298 0.066 0.175
303 0.080 0.186
308 0.106 0.192
313 0.135 0.211
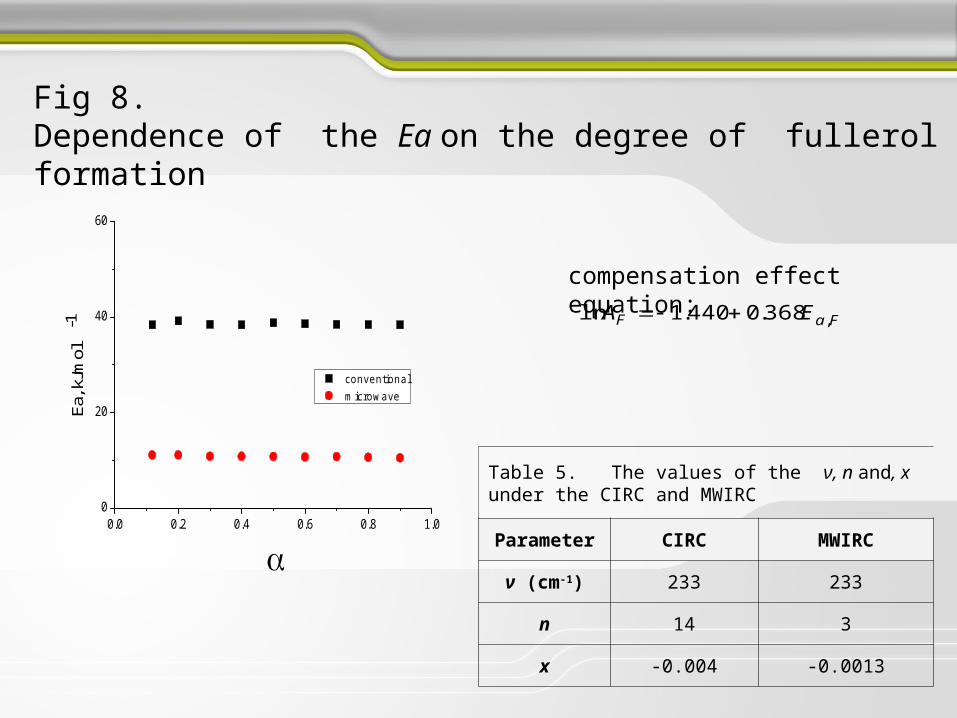
Fig 8. Dependence of the Ea on the degree of fullerol formation
0.0 0.2 0.4 0.6 0.8 1.00
20
40
60
Ea, k
Jmol
-1
conventional microwave
compensation effect equation:
FaF EA ,368.0440.1ln
Table 5. The values of the ν, n and, x under the CIRC and MWIRC
Parameter CIRC MWIRC
ν (cm-1) 233 233
n 14 3
x -0.004 -0.0013

Isothermal kinetics of acid catalysed sucrose hydrolyses under the CIRC and MWIRC
0 10 20 30 40 50 600.0
0.2
0.4
0.6
0.8
1.0
Time, min
303 K 313 K 323 K 333 K
(A)
0 4 8 12 160.0
0.2
0.4
0.6
0.8
1.0
Time, min
303 K 313 K323 K333 K
(B)
Fig 7. The isothermal conversion curves for sucrose hydrolyses
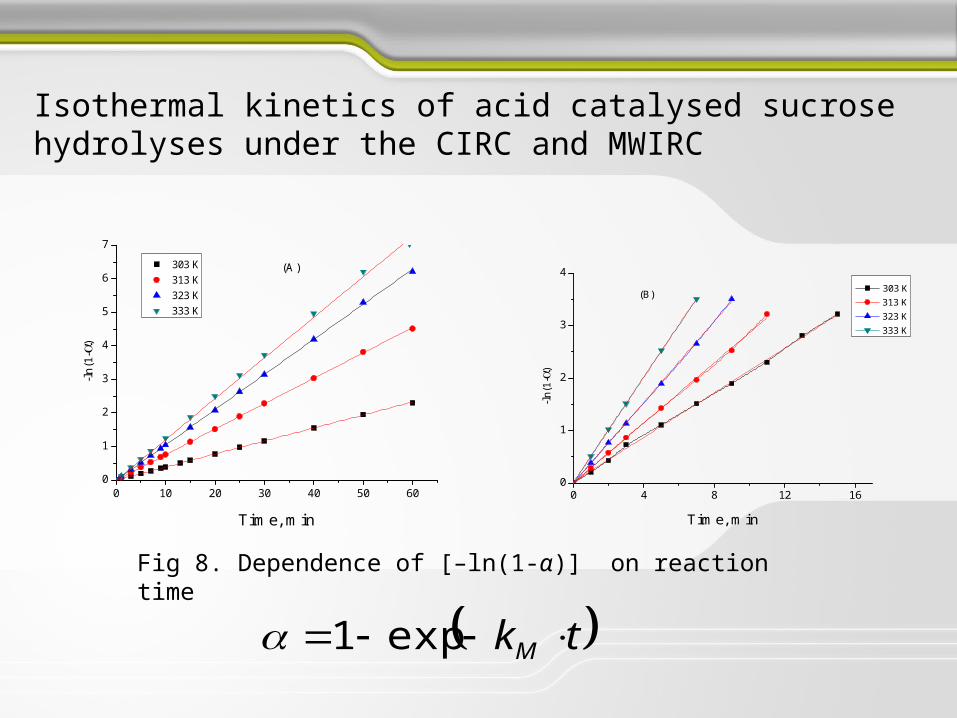
Isothermal kinetics of acid catalysed sucrose hydrolyses under the CIRC and MWIRC
tkM exp1
0 10 20 30 40 50 600
1
2
3
4
5
6
7
303 K 313 K 323 K 333 K
-ln(
1-)
Time, min
(A)
0 4 8 12 160
1
2
3
4
-ln(
1-)
Time, min
303 K 313 K 323 K 333 K
(B)
Fig 8. Dependence of [–ln(1-α)] on reaction time

Table 6. The temperature influence on the kM and the kinetic parameters
for sucrose hydrolyses under the conventional and the microwave reacting conditions
T, K Conventional process Microwave process
k, min-1 Kinetics parameters k, min-1 Kinetics parameters
303 0.024Ea,M=32±2 kJ/molln(AM /min-1)= 9±1
0.204Ea,M=25.15±1 kJ/mol
ln(AM /min-1)=8.4±0.1 313 0.039 0.287
323 0.076 0.386
333 0.105 0.510
0.0 0.2 0.4 0.6 0.8 1.00
10
20
30
40
50
Ea,
kJm
ol-1
conventional microwave
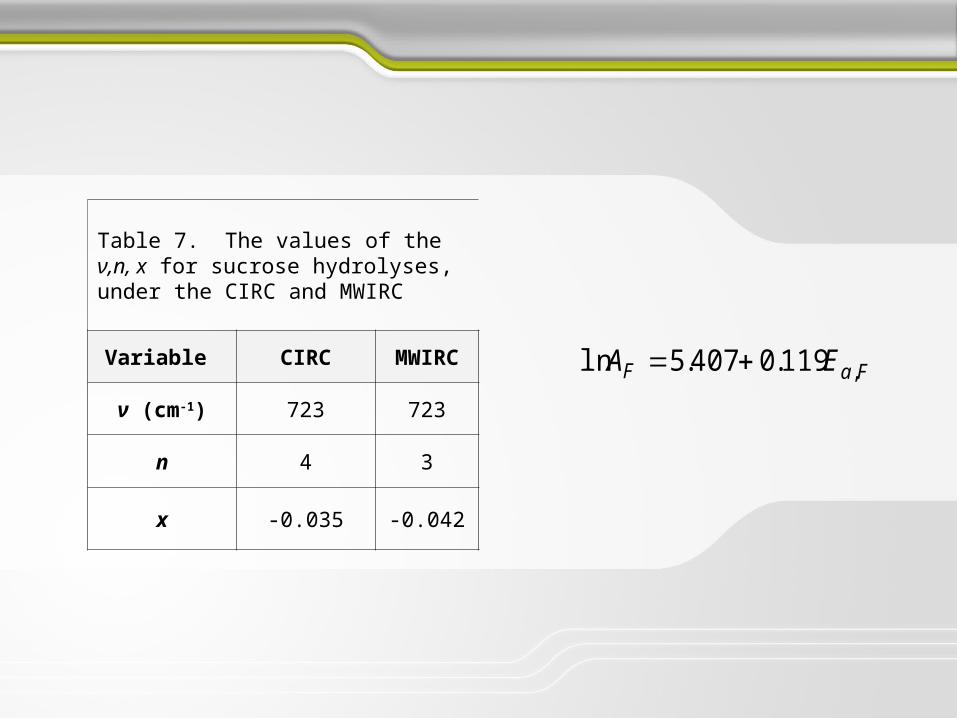
Table 7. The values of the ν,n, x for sucrose hydrolyses, under the CIRC and MWIRC
Variable CIRC MWIRC
ν (cm-1) 723 723
n 4 3
x -0.035 -0.042
FaF EA ,119.0407.5ln

Isothermal kinetics of ethanol adsorption from aqueous solutions onto carbon molecular sieve under the CH and MWH
Figure 9. The kinetic curves of ethanol adsorption on CMS-3A for (A) CH and (B) MWH
0 20 40 60 800.00
0.04
0.08
0.12
0.16
Wt.%
Time, min
303 K 331 K 323 K 333 K
(A)
0 2 4 6 8 100.00
0.04
0.08
0.12
0.16
Wt,
%.
Time, min
303 K 308 K 313 K
(B)

Isothermal kinetics of ethanol adsorption from aqueous solutions onto carbon molecular sieve under the CH and MWH
0.0 0.2 0.4 0.6 0.8 1.00.0
0.1
0.2
0.3
0.4
0.5
d/dt
303 K 311 K 323 K 333 K
303 K 308 K 313 K
conventional
microwave
Figure 10. Dependence of dα/dt on the degree of ethanol adsorption

Fig 11. Dependence of dα/dt on the degree of ethanol adsorption
0.0 0.2 0.4 0.6 0.8 1.00.0
0.1
0.2
0.3
0.4
0.5
d/dt
303 K 311 K 323 K 333 K
303 K 308 K 313 K
conventional
microwave
Conventional process Microwave process
T, K (dα/dt)max, [min-1]
Kinetics parameters T, K (dα/dt)ma
[ min-1]Kinetics parameters
303 0.084 Ea=11.9±0.2 kJ/mol lnA = 2.2±0.1
303 0.387 Ea=10.9±0.2 kJ/mol lnA=2.6±0.1311 0.094 308 0.417
323 0.114 313 0.447
333 0.129
Table 8. Temperature influence on (dα/dt)max for adsorption of ethanol and kinetic parameters, for the CIRC and MWIRC processes

Model fitting method : 311 tkM
0 5 10 15 20 25 300.0
0.2
0.4
0.6
0.8
1.0
[1-(1
)1/
3 ]
Time, min
303 K 311 K 323 K 333 K
303 K 308 K 313 K
conventionalmicrowave
Fig 12. Dependence of dα/dt on the degree of ethanol adsorption
0.0 0.2 0.4 0.6 0.8 1.0
4
8
12
16
20
Ea,kJm
ol-1
conventional microwave
,295.0907.1ln aconv EA
,223.0937.1ln amw EA
Table 9. The influence of temperature on model’s kinetic constants of the ethanol adsorption rate and kinetic parameters, for the CIRC and MWIRC processes
Conventional process Microwave process
T, K
[min-1] Kinetics paramete
rs
T, K [min-1] Kinetics paramet
ers
303
0.028 Ea=12±0.5 kJ/mol
lnA =1.15±0.
05
303 0.129 Ea=11.2±0.5 kJ/mollnA=2.4±0.1
311
0.032 308 0.139
323
0.038 313 0.149
333
0.043Table 10. The values of the ν, n and , x under the CIRC and MWIRC of ethanol adsorption process
Variable CIRC MWIRC
ν (cm-1) 292 386
n 3 2
x -0.025 -0.0016

Isothermal dehydration of poly(acrylic -co-methacrylic acid) hydrogels
Fig 13. The conversion curves for dehydration process of the hydrogel (A) conventional and (B) microwave
0 50 100 150 2000.0
0.2
0.4
0.6
0.8
1.0
293 303 313
Time, min
(A)
0 2 4 6 8 100.0
0.2
0.4
0.6
0.8
1.0
Time, min
313 K 323 K 333 K
(B)
A phase-boundary controlled reaction model (contracting area) : 1/2M1 1 α k t

Fig 14. The dependence of on time for dehydration process of the hydrogel (A) CH and (B) MW
0 20 40 60 80 100 1200.0
0.2
0.4
0.6
0.8
1.0
293 K 303 K 313 K
1-(1
-)0.
5
Time, min
(A)
0 2 4 6 80.0
0.2
0.4
0.6
0.8
1.0
313 K 323 K 333 K
1-(1
-)0.
5
Time, min
(B)
Table 11. The effect of temperature on the kM values and kinetic parameters of the isothermal dehydration of the PAM hydrogel by the CH and the MWH
T, K Conventional process T, K Microwave process
kM [min–1] Kinetics parameters
kM [min–
1]Kinetics parameters
293 0.0052 Ea=58.5±0.5 kJ/mol
ln A = 18.5±0.2
313 0.120 Ea=51.6±0.5 kJ/molln A=17.7±0.2303 0.0109 323 0.207
313 0.0236 333 0.393

Fig 15. The dependence of the Ea on the dehydration degree of the hydrogel
0.0 0.2 0.4 0.6 0.8 1.035
40
45
50
55
60
65
E a, k
Jmol
-1
conventional microwave
Table 12. The values of υ, n, and χ under conventional and microwave conditions
Variable CIPC MWIPC
υ 726 726
n 7 6
χ –0.011 –0.015
F a,Fln 11.71 0.116A E