Embed Size (px)
Citation preview

USRDS 2013 Annual Data Report Overview
Allan J. Collins, MD, FACP Professor of Medicine University of Minnesota Director, United States Renal Data System Coordinating Center Minneapolis, Minnesota

Disclosures
• Institutional Grants and Contracts: NIH, HRSA, NKF, Amgen, Keryx, BMS, DaVita, Novartis, NxStage, Zoll,
• Board of Directors: Kidney Health Australia, The Kidney Foundation Karachi, IKEA-J KEEP, KDIGO, KDPN,
• Advisory Boards: NxStage, Keryx, Amgen, ZS Pharma
• Consulting Epidemiology and clinical trial design: Amgen, Keryx, DaVita Clinical Research, NxStage, ZS Pharma

Overview of the US ESRD population • Growth of the population • Care at initiation of dialysis • Trends in dialysis modalities under the new PPS • Changes in Hb levels and transfusions • Hospitalizations, infections and
readmissions • Trends in mortality

Patient counts, by modality Figure p.3 (Volume 2)
Incident & December 31 point prevalent ESRD patients.
Incident cases decreased in 2011 and sustained in 2012! Growth in the prevalent dialysis population is driven by
lower death rates!
USRDS 2013 ADR

Incident & prevalent patient counts (USRDS), by modality Figure 1.1 (Volume 2)
Incident & December 31 point prevalent ESRD patients; peritoneal dialysis consists of CAPD & CCPD.
USRDS 2013 ADR

Adjusted incident rates of ESRD & annual percent change Figure 1.2 (Volume 2)
Incident ESRD patients. Adj: age/gender/race; ref: 2010 ESRD patients.
USRDS 2013 ADR

Counts of new & returning dialysis patients Figure p.2 (Volume 2)
CMS Annual Facility Survey.
USRDS 2013 ADR

Incidence of ESRD • Incident case fell on a absolute level for the
first time in 30 years • Incidence rates are clearly down • Growth in the prevalent population is driven
by lower death rates • Returning transplant patients have
dramatically declined • How about dialysis modalities?
200,000
250,000
300,000
JAN
200
7M
ARM
AY JUL
SEP
NO
VJA
N 2
008
MAR
MAY JU
LSE
PN
OV
JAN
200
9M
ARM
AY JUL
SEP
NO
VJA
N 2
010
MAR
MAY JU
LSE
PN
OV
JAN
201
1M
ARM
AY JUL
SEP
NO
VJA
N 2
012
MAR
MAY JU
LSE
PN
OV
14,000
18,000
22,000
JAN
200
7M
ARM
AY JUL
SEP
NO
VJA
N 2
008
MAR
MAY JU
LSE
PN
OV
JAN
200
9M
ARM
AY JUL
SEP
NO
VJA
N 2
010
MAR
MAY JU
LSE
PN
OV
JAN
201
1M
ARM
AY JUL
SEP
NO
VJA
N 2
012
MAR
MAY JU
LSE
PN
OV
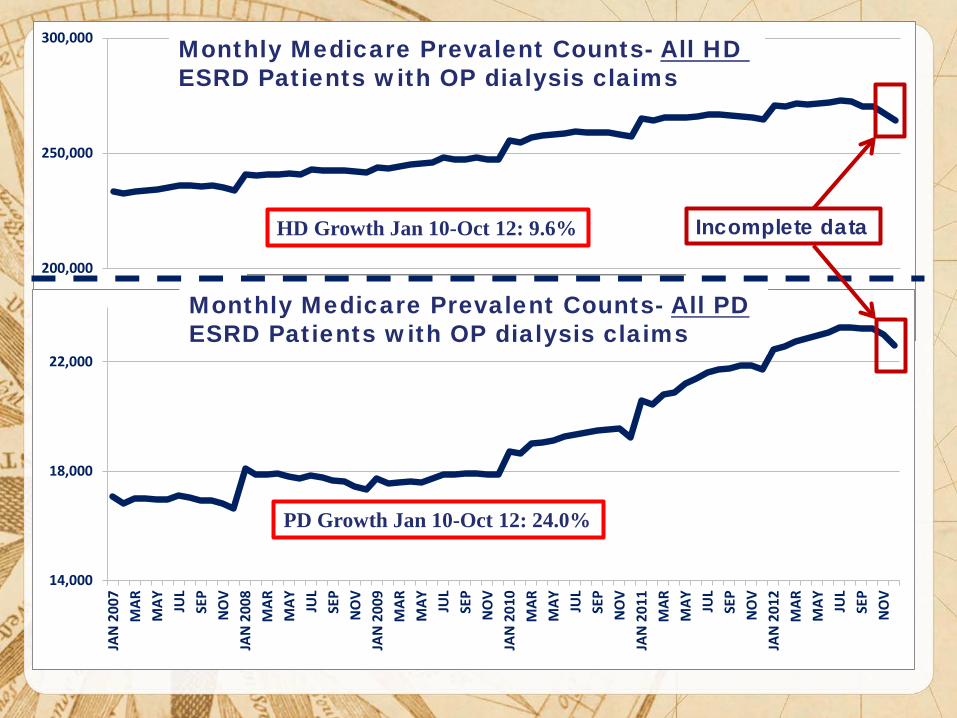
Monthly Medicare Prevalent Counts- All HD ESRD Patients with OP dialysis claims
Incomplete data
Monthly Medicare Prevalent Counts- All PD ESRD Patients with OP dialysis claims
HD Growth Jan 10-Oct 12: 9.6%
PD Growth Jan 10-Oct 12: 24.0%

Trends in PD vs HHD training runs
ASN 2013 Abstract

Trends in transplantation: unadjusted rates, wait list, & total & functioning transplants Figure 7.1 (Volume 2)
Unadjusted incident & transplant rates: limited to ESRD patients age 20 & older, thus yielding a computed incident rate higher than the overall rate presented elsewhere in the Annual Data Report. Wait list counts: all patients listed for a kidney or kidney-pancreas transplant on December 31 of each year. Wait time: all patients entering wait list in the given year. Transplant counts: all patients known to the USRDS. Functioning transplant: annual status of all patients who received a kidney or kidney-pancreas transplant, regardless of transplant date.
USRDS 2013 ADR
185,626

Changes in Dialysis under the new Prospective Payment System • PD growth is consistent with the
incentives for home dialysis therapy incorporated into the PPS Bundle
• Transplant wait listings grow and total transplants appear to be stable
• Patients returning from a failed graft have been flat for several years

USRDS 2013 ADR
Access use at first outpatient hemodialysis, by pre-ESRD nephrology care, 2011 Figure 1.22 (Volume 2)
Incident hemodialysis patients, 2011.

Dialysis catheters still needs to be addressed!
• The high use of catheters has been documented by USRDS since 2008 yet little has changed
• What has happened with the implementation of the CKD education benefit to promote earlier access placement?

USRDS 2013 ADR
Cumulative probability of receiving the CMS Kidney Disease Education System benefit, 2010–2011 Figure 7.26 (Volume 1)
General Medicare patients with CKD age 65 & older, & Pre-ESRD patients age 67 or older at initiation of ESRD.
Cum
ulat
ive
Perc
ent
The CKD education benefit is underutilized

USRDS 2013 ADR
Mean hemoglobin at initiation, by pre-ESRD ESA treatment Figure 1.23 (Volume 2)
Incident ESRD patients.

USRDS 2013 ADR
Mean monthly hemoglobin & mean EPO dose per week: hemodialysis patients Figure 2.3 (Volume 2)
Period prevalent hemodialysis patients.

USRDS 2013 ADR
Patient distribution, by mean monthly hemoglobin (g/dl): hemodialysis patients Figure 2.2 (Volume 2)
Period prevalent hemodialysis patients.

USRDS 2013 ADR
Hemodialysis patients receiving transfusions, by race Figure 2.7 (Volume 2)
Incident hemodialysis patients. (Each month includes patients with a claim for hemodialysis.)
Incomplete counts of incident Pts and IBNR* hospitalizations
*IBNR: Incurred But Not Reported

USRDS 2013 ADR
Adjusted all-cause hospital admission rates & days, by modality Figure 3.2 (Volume 2)
Period prevalent ESRD patients. Adj: age/gender/race/primary diagnosis; ref: ESRD patients, 2010.
2011 Under the Bundle, hospitalizations
declined

USRDS 2013 ADR
Change in adjusted all-cause & cause- specific hospitalization rates, by modality Figure 3.1 (Volume 2)
Period prevalent ESRD patients. Adj: age/gender/race/primary diagnosis; ref: ESRD patients, 2010.

USRDS 2013 ADR
Patients receiving intravenous antibiotics under Medicare Parts B & D pre- & post-dialysis bundle, by unit affiliation Figure 6.14 (Volume 2)
Point prevalent Medicare enrollees alive on January 1.

USRDS 2013 ADR
Patients receiving oral antibiotics under Medicare Parts B & D pre- & post-dialysis bundle, by unit affiliation Figure 6.15 (Volume 2)
Point prevalent Medicare enrollees alive on January 1.

USRDS 2013 ADR
Adjusted infection & cardiovascular hospital days, by modality Figure 3.3 (Volume 2)
Period prevalent ESRD patients. Adj: age/gender/race/primary diagnosis; ref: ESRD patients, 2010.

Hospitalizations for infections: considering primary vs secondary complications
• Hospitalizations in the past have focused on the Principle Diagnosis codes
• Coding drift noted for infectious complications such as Sepsis led the CC to consider infections in either the principle position or secondary positions on claims
• The 2013 ADR compares hospitalizations For infection from the principle position verses With infection by including the secondary positions

USRDS 2013 ADR
Adjusted rates of hospital admissions, by modality & diagnosis code type: infection Figure 3.4 (Volume 2)
Period prevalent ESRD patients. Adj: age/gender/race/primary diagnosis; ref: ESRD patients, 2010.

USRDS 2013 ADR
All-cause rehospitalization or death within 30 days after live hospital discharge in patients age 66 & older, by population, 2011 Figure 3.20 (Volume 2)
January 1, 2011 point prevalent Medicare patients age 66 & older on December 31, 2010; for the CKD & no CKD cohorts during 2010, CKD is defined & patients are continuously enrolled in Medicare Parts A & b with no HMO coverage & without ESRD.

USRDS 2013 ADR
All-cause rehospitalization or death 30 days after live hospital discharge, by age, 2011 Figure 3.14 (Volume 2)
Period prevalent hemodialysis patients, all ages, 2011; unadjusted. Includes live hospital discharges from January 1 to December 1, 2011.

Re-hospitalizations are highest in the hemodialysis population • The Medicare system is holding all hospitals to a quality
improvement program to reduce readmission rates for AMI, CHF and Pneumonia In October of 2012 a 1% penalty was imposed for up
to same level above the national average In October 2013 it is up to 2% In October 2014 it will be up to 3%
• The dialysis population accounts for a disproportionate readmission rate across all CVD and infection domains
• Hospitals may discuss these high rates with the nephrology physicians

Hospitalization are the central issue in morbidity that remains under addressed • Infections remain high and unaddressed in both
HD and PD patients • High antibiotic use confirms the infection
burden in the dialysis population • PD patients have high hospital infection rate that
have not changed since 1993 • The source of the infections in HD may have
shifted from catheters to “Button Holes” and should be investigated
• Perhaps better procedures are needed to reduce infection across all dialysis modalities!

USRDS 2013 ADR
Adjusted all-cause mortality rates (from day 90), by modality & year of treatment Figure 5.1 (Volume 2)
Incident ESRD patients. Adj: age/gender/race /primary diagnosis; ref: incident ESRD patients, 2010.
Incident based Death rates are down again in 2011!

USRDS 2013 ADR
Adjusted all-cause mortality in prevalent hemodialysis patients, by vintage Figure 5.4 (Volume 2)
Period prevalent dialysis patients defined on day one or day 90 of dialysis. Adj: age/gender/race/primary diagnosis. Ref: incident hemodialysis patients, 2010.
Prevalent Death rates are down again in 2011!

Summary • Incident cased have declined for the first
time in decades • Some aspects of care has changed under
the new Bundle • Hospitalizations and mortality continue to
decline • Infections continue to be a major concern • Overall, patient related outcomes continue
to improve


![High Performance Inverter FRENIC-Ace · HHD ND HD HND HHD ND HD HND HHD ND, HND HD HHD ND HD HND HHD ND HD HND HHD ND HD HND HHD ND HD HND HHD Type Nominal applied motor *1 [kW(HP)]](https://img.dokumen.tips/doc/110x75/5f62ecd88b73466e3601a9ce/high-performance-inverter-frenic-ace-hhd-nd-hd-hnd-hhd-nd-hd-hnd-hhd-nd-hnd-hd.jpg)