Embed Size (px)
Citation preview
Oceanside High SchoolSchool Accountability Report Card, 2008–2009Oceanside Unified School District
An annual report to the
community about teaching,
learning, test results,
resources, and measures of
progress in our school.
»
Oceanside High School School Accountability Report Card, 2008–2009Oceanside Unified School District
»Contents
ONLINE USERS: CLICK ON A TITLE TO JUMP TO THAT SECTION
This School Accountability Report Card (SARC) provides information that can be used to evaluate and compare schools. State and federal laws require all schools to publish a SARC each year.
The information in this report represents the 2008–2009 school year, not the current school year. In most cases, this is the most recent data available. We present our school’s results next to those of the average high school in the county and state to provide the most meaningful and fair comparisons. To find additional facts about our school online, please use the DataQuest tool offered by the California Department of Education.
If you are reading a printed version of this report, note that words that appear in a smaller, bold typeface are links in the online version of this report to even more information. You can find a master list of those linked words, and the Web page addresses they are connected to, at:http://www.schoolwisepress.com/sarc/links_2009_en.html
Reports about other schools are available on the California Department of Education Web site. Internet access is available in local libraries.
If you have any questions related to this report, please contact the school office.
How to Contact Our School1 Pirates CoveOceanside, CA 92054Principal: Kimo MarquardtPhone: (760) 722-8201
How to Contact Our District2111 Mission Ave.Oceanside, CA 92054Phone: (760) 966-4000http://www.oside.us
Published by
SCHOOL WISE PRESS385 Ashton Ave., Ste. 200San Francisco, CA 94112Phone: (415) 337-7971www.schoolwisepress.com
©2009 Publishing 20/20
Principal’s Message
Measures of Progress
Student Achievement
Preparation for College and the Workforce
Students
Climate for Learning
Leadership, Teachers, and Staff
Resources
School Expenditures
Adequacy of Key Resources
Data Almanac
»
Oceanside High SchoolSchool Accountability Report Card, 2008–2009Oceanside Unified School District
Oceanside Unified School District
Grade range and calendar
9–12TRADITIONAL
Academic Performance Index
738County Average: 738State Average: 712
Student enrollment
2,581County Average: 1,237State Average: 1,082
Teachers
100County Average: 52State Average: 47
Students per teacher
26County Average: 24State Average: 23
Principal�s Message
Oceanside High School (OHS) has worked very hard to raise the academic standards and performance of our students. Our API has risen over 140 points in five years. In 2004 we opened the enrollment in Advanced Placement (AP) classes to all students. Since then the number of AP exams taken has more than doubled from 366 in 2003 to 805 last year. OHS was named one of Newsweek’s top American high schools based on our high academic standards.
Kimo Marquardt, PRINCIPAL
Oceanside High School School Accountability Report Card for 2008–2009 Page 2
Major Achievements• Our school’s goal is to ensure that every student who wants to attend college will be prepared and gain
entrance into a four-year university.
• Our teachers have developed content and instruction guidelines that ensure the same rigor in each of our core content classes.
• Students have open access to all of our AP classes.
• An alternative program called the Academic Acceleration Recovery Center (AARC) helps students who need to acquire credits to graduate. In addition, there is a Career Technical Hub where AARC students get career counseling and help with job placement.
Focus for Improvement• Continue to build a college-bound culture on our campus and increase the number of students success-
fully completing the A-G course requirements.
• Focus staff development on improving teachers’ instructional strategies.
• Increase the number of students passing the California High School Exit the first time.
Oceanside Unified School District
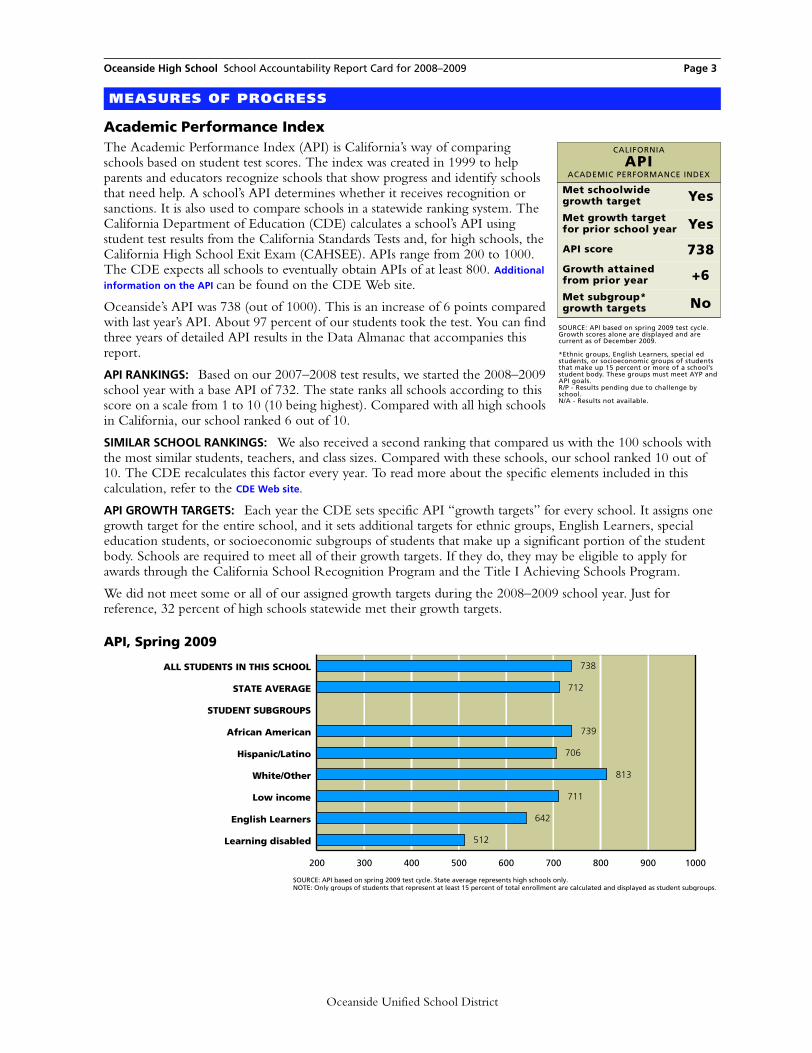
Oceanside High School School Accountability Report Card for 2008–2009 Page 3
Academic Performance IndexThe Academic Performance Index (API) is California’s way of comparing schools based on student test scores. The index was created in 1999 to help parents and educators recognize schools that show progress and identify schools that need help. A school’s API determines whether it receives recognition or sanctions. It is also used to compare schools in a statewide ranking system. The California Department of Education (CDE) calculates a school’s API using student test results from the California Standards Tests and, for high schools, the California High School Exit Exam (CAHSEE). APIs range from 200 to 1000. The CDE expects all schools to eventually obtain APIs of at least 800. Additional
information on the API can be found on the CDE Web site.
Oceanside’s API was 738 (out of 1000). This is an increase of 6 points compared with last year’s API. About 97 percent of our students took the test. You can find three years of detailed API results in the Data Almanac that accompanies this report.
API RANKINGS: Based on our 2007–2008 test results, we started the 2008–2009 school year with a base API of 732. The state ranks all schools according to this score on a scale from 1 to 10 (10 being highest). Compared with all high schools in California, our school ranked 6 out of 10.
SIMILAR SCHOOL RANKINGS: We also received a second ranking that compared us with the 100 schools with the most similar students, teachers, and class sizes. Compared with these schools, our school ranked 10 out of 10. The CDE recalculates this factor every year. To read more about the specific elements included in this calculation, refer to the CDE Web site.
API GROWTH TARGETS: Each year the CDE sets specific API “growth targets” for every school. It assigns one growth target for the entire school, and it sets additional targets for ethnic groups, English Learners, special education students, or socioeconomic subgroups of students that make up a significant portion of the student body. Schools are required to meet all of their growth targets. If they do, they may be eligible to apply for awards through the California School Recognition Program and the Title I Achieving Schools Program.
We did not meet some or all of our assigned growth targets during the 2008–2009 school year. Just for reference, 32 percent of high schools statewide met their growth targets.
MEASURES OF PROGRESS
CALIFORNIA
APIACADEMIC PERFORMANCE INDEX
Met schoolwide growth target YesMet growth target for prior school year Yes
API score 738Growth attained from prior year +6Met subgroup* growth targets No
SOURCE: API based on spring 2009 test cycle. Growth scores alone are displayed and are current as of December 2009.
*Ethnic groups, English Learners, special ed students, or socioeconomic groups of students that make up 15 percent or more of a school’s student body. These groups must meet AYP and API goals. R/P - Results pending due to challenge by school. N/A - Results not available.
200 300 400 500 600 700 800 900 1000
Learning disabled
English Learners
Low income
White/Other
Hispanic/Latino
African American
STUDENT SUBGROUPS
STATE AVERAGE
ALL STUDENTS IN THIS SCHOOL
API, Spring 2009
738
712
739
706
813
711
642
512
SOURCE: API based on spring 2009 test cycle. State average represents high schools only.NOTE: Only groups of students that represent at least 15 percent of total enrollment are calculated and displayed as student subgroups.
Oceanside Unified School District

Oceanside High School School Accountability Report Card for 2008–2009 Page 4
Adequate Yearly ProgressIn addition to California’s accountability system, which measures student achievement using the API, schools must also meet requirements set by the federal education law known as No Child Left Behind (NCLB). This law requires all schools to meet a different goal: Adequate Yearly Progress (AYP).
We met 19 out of 22 criteria for yearly progress. Because we fell short in three areas, we did not make AYP. Our school is also on the federal watchlist known as Program Improvement (PI). See the next page for background on this matter and an explanation of the consequences.
To meet AYP, high schools must meet four criteria. First, a certain percentage of students must score at or above Proficient levels on the California High School Exit Exam (CAHSEE): 44.5 percent on the English/language arts test and 43.5 percent on the math test. All significant ethnic and socioeconomic subgroups of students also must meet these goals. Second, the schools must achieve an API of at least 650 or increase their API by one point from the prior year. Third, 95 percent of tenth grade students must take the CAHSEE. Fourth, the graduation rate for the class of 2008 must be higher than 83.1 percent (or satisfy alternate improvement criteria).
If even one subgroup of students fails to meet just one of the criteria, the school fails to meet AYP. While all schools must report their progress toward meeting AYP, only schools that receive federal funding to help economically disadvantaged students are actually penalized if they fail to meet AYP goals. Schools that do not make AYP for two or more years in a row in the same subject enter Program Improvement (PI). They must offer students transfers to other schools in the district and, in their second year in PI, tutoring services as well.
The table at left shows our success or failure in meeting AYP goals in the 2008–2009 school year. The green dots represent goals we met; red dots indicate goals we missed. Just one red dot means that we failed to meet AYP.
Note: Dashes indicate that too few students were in the category to draw meaningful conclusions. Federal law requires valid test scores from at least 50 students for statistical significance.
FEDERAL
AYPADEQUATE YEARLY PROGRESS
Met AYP NoMet schoolwide participation rate YesMet schoolwide test score goals YesMet subgroup* participation rate YesMet subgroup* test score goals NoMet schoolwide API for AYP Yes
Met graduation rate YesProgram Improvement school in 2009
Yes
SOURCE: AYP is based on the Accountability Progress Report of December 2009. A school can be in Program Improvement based on students’ test results in the 2008–2009 school year or earlier.
*Ethnic groups, English Learners, special ed students, or socioeconomic groups of students that make up 15 percent or more of a school’s student body. These groups must meet AYP and API goals. R/P - Results pending due to challenge by school. N/A - Results not available.
Adequate Yearly Progress, Detail by Subgroup
● MET GOAL ● DID NOT MEET GOAL � NOT ENOUGH STUDENTS
English/Language Arts Math
DID 95%OF STUDENTS
TAKE THE CAHSEE?
DID 44.5%ATTAIN
PROFICIENCY ON THE
CAHSEE?
DID 95%OF STUDENTS
TAKE THE CAHSEE?
DID 43.5%ATTAIN
PROFICIENCY ON THE
CAHSEE?
SCHOOLWIDE RESULTS ● ● ● ●
SUBGROUPS OF STUDENTS
Low income ● ● ● ●
Students learning English ● ● ● ●
STUDENTS BY ETHNICITY
Hispanic/Latino ● ● ● ●
White/Other ● ● ● ●SOURCE: AYP release of September 2009, CDE.
Oceanside Unified School District
Oceanside High School School Accountability Report Card for 2008–2009 Page 5
Program Improvement, a Federal Intervention ProgramA BRIEF HISTORY OF OUR SCHOOL’S PLACEMENT IN PROGRAM IMPROVEMENT: Oceanside was placed on the list of schools needing improvement (also known as Program Improvement, or PI) for the first time in 2009. In California, 141 high schools were in stage 1 of PI as of December 2009.
THE STAGES OF PROGRAM IMPROVEMENT: Program Improvement is a five-stage process for monitoring, improving, and, if necessary, reorganizing any school that receives federal money under the Title I section of No Child Left Behind (NCLB). Schools in PI get extra attention from their district office to help them improve.
When a school misses even one of its goals for Adequate Yearly Progress, it is at risk of entering PI. If a school misses the same AYP goals two years in a row, it enters stage 1 of PI. Each subsequent year that a school misses any of its AYP goals, it goes one stage deeper into the process. Each stage results in increasingly severe consequences. The first stage gives parents the right to choose another school. In the second stage, students have the right to free tutoring in addition to the option to change schools. The last three stages can result in a change of staff and leadership, the conversion of the school to charter status, transferring the school to another district, or even the school’s closure.
CONSEQUENCESPARENTS: Because Oceanside is in stage (year) 1 of PI, parents of students have just one option. They can enroll their children in different schools in the district. To see the list of these schools, parents can contact either the principal or the district office staff.
SCHOOL: The school’s staff is revising its improvement plan. The staff is also using as much as ten percent of the school’s Title I (federal) funds for coaching teachers.
DISTRICT: The district is establishing a peer review group to evaluate the school’s annual improvement plan.
YEARPI
STAGE SUMMARY OF EVENTS FOR THIS YEARAYP GOALS NOT MET ■
AYP GOALS MET ■
2008 Not in PI
Oceanside met 21 of the 22 criteria for Adequate Yearly Progress established by the federal law known as No Child Left Behind (NCLB).
■■■■■■■■■■■■■■■■■■■■■■
2009 1 We met 19 of the 22 criteria for Adequate Yearly Progress, causing the school to enter the first stage of Program Improvement.
■■■■■■■■■■■■■■■■■■■■■■
SOURCE: PI status is based on the Accountability Progress Report of September 2009. A school can be in Program Improvement based on students’ test results in the 2008–2009 school year or earlier. Some schools were in Program Improvement prior to the passage of No Child Left Behind, when the definition of PI was significantly modified.
FEDERAL INTERVENTION PROGRAM
PIPROGRAM IMPROVEMENT
In PI since 2009
Stage of PI 1 of 5
Change in 2009 Entered PI
SOURCE: PI status is based on the Accountability Progress Report of September 2009. A school can be in Program Improvement based on students’ test results in the 2008–2009 school year or earlier.
Oceanside Unified School District
Oceanside High School School Accountability Report Card for 2008–2009 Page 6
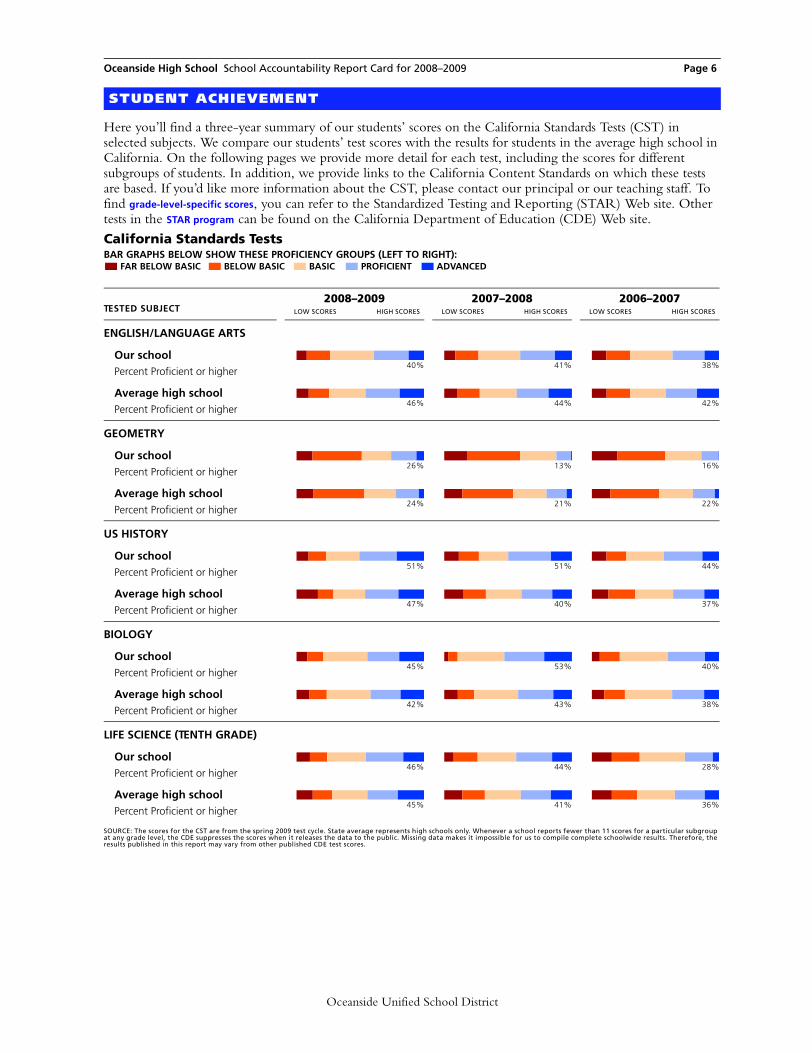
Here you’ll find a three-year summary of our students’ scores on the California Standards Tests (CST) in selected subjects. We compare our students’ test scores with the results for students in the average high school in California. On the following pages we provide more detail for each test, including the scores for different subgroups of students. In addition, we provide links to the California Content Standards on which these tests are based. If you’d like more information about the CST, please contact our principal or our teaching staff. To find grade-level-specific scores, you can refer to the Standardized Testing and Reporting (STAR) Web site. Other tests in the STAR program can be found on the California Department of Education (CDE) Web site.
STUDENT ACHIEVEMENT
BAR GRAPHS BELOW SHOW THESE PROFICIENCY GROUPS (LEFT TO RIGHT):FAR BELOW BASIC BELOW BASIC BASIC PROFICIENT ADVANCED
California Standards Tests
TESTED SUBJECT2008–2009
LOW SCORES HIGH SCORES
2007–2008 LOW SCORES HIGH SCORES
2006–2007 LOW SCORES HIGH SCORES
ENGLISH/LANGUAGE ARTS
Our schoolPercent Proficient or higher
40% 41% 38%
Average high schoolPercent Proficient or higher
46% 44% 42%
GEOMETRY
Our schoolPercent Proficient or higher
26% 13% 16%
Average high schoolPercent Proficient or higher
24% 21% 22%
US HISTORY
Our schoolPercent Proficient or higher
51% 51% 44%
Average high schoolPercent Proficient or higher
47% 40% 37%
BIOLOGY
Our schoolPercent Proficient or higher
45% 53% 40%
Average high schoolPercent Proficient or higher
42% 43% 38%
LIFE SCIENCE (TENTH GRADE)
Our schoolPercent Proficient or higher
46% 44% 28%
Average high schoolPercent Proficient or higher
45% 41% 36%
SOURCE: The scores for the CST are from the spring 2009 test cycle. State average represents high schools only. Whenever a school reports fewer than 11 scores for a particular subgroup at any grade level, the CDE suppresses the scores when it releases the data to the public. Missing data makes it impossible for us to compile complete schoolwide results. Therefore, the results published in this report may vary from other published CDE test scores.
Oceanside Unified School District
Oceanside High School School Accountability Report Card for 2008–2009 Page 7
Frequently Asked Questions About Standardized TestsWHERE CAN I FIND GRADE-LEVEL REPORTS? Due to space constraints and concern for statistical reliability, we have omitted grade-level detail from these test results. Instead we present results at the schoolwide level. You can view the results of far more students than any one grade level would contain, which also improves their statistical reliability. Grade-level results are online on the STAR Web site. More information about student test scores is available in the Data Almanac that accompanies this report.
WHAT DO THE FIVE PROFICIENCY BANDS MEAN? Test experts assign students to one of these five proficiency levels, based on the number of questions they answer correctly. Our immediate goal is to help students move up one level. Our eventual goal is to enable all students to reach either of the top two bands, Advanced or Proficient. Those who score in the middle band, Basic, have come close to attaining the required knowledge and skills. Those who score in either of the bottom two bands, Below Basic or Far Below Basic, need more help to reach the Proficient level.
HOW HARD ARE THE CALIFORNIA STANDARDS TESTS? Experts consider California’s standards to be among the most clear and rigorous in the country. Just 53 percent of elementary school students scored Proficient or Advanced on the English/language arts test; 59 percent scored Proficient or Advanced in math. You can review the California Content Standards on the CDE Web site.
ARE ALL STUDENTS’ SCORES INCLUDED? No. Only students in grades two through eleven are required to take the CST. When fewer than 11 students in one grade or subgroup take a test, state officials remove their scores from the report. They omit them to protect students’ privacy, as called for by federal law.
CAN I REVIEW SAMPLE TEST QUESTIONS? Sample test questions for the CST are on the CDE’s Web site. These are actual questions used in previous years.
WHERE CAN I FIND ADDITIONAL INFORMATION? The CDE has a wealth of resources on its Web site. The STAR Web site publishes detailed reports for schools and districts, and assistance packets for parents and teachers. This site includes explanations of technical terms, scoring methods, and the subjects covered by the tests for each grade. You’ll also find a guide to navigating the STAR Web site as well as help for understanding how to compare test scores.
WHY ARE ONLY SOME OF THE TEST RESULTS PRESENT? California’s test program includes many tests not mentioned in this report. For brevity’s sake, we’re reporting six CST tests usually taken by the largest number of students. We select at least one test from each core subject. For science, we’ve selected biology (an elective) and the tenth grade life science test. For math, we’ve selected two courses, both of them electives: Algebra I, which students take if they haven’t studied and passed it in eighth grade; and Geometry, often the most popular math course because it follows Algebra I. In social studies, we’ve selected US History, which is taken by all juniors (eleventh graders). English/language arts summarizes the results of students in grades nine through eleven.
Oceanside Unified School District
Oceanside High School School Accountability Report Card for 2008–2009 Page 8
The graph to the right shows how our students’ scores have changed over the years. We present each year’s results in a vertical bar, with students’ scores arrayed across five proficiency bands. When viewing schoolwide results over time, remember that progress can take many forms. It can be more students scoring in the top proficiency bands (blue); it can also be fewer students scoring in the lower two proficiency bands (brown and red).
You can read the California standards for English/
language arts on the CDE’s Web site.
BAR GRAPHS BELOW SHOW THESE PROFICIENCY GROUPS (LEFT TO RIGHT):FAR BELOW BASIC BELOW BASIC BASIC PROFICIENT ADVANCED
English/Language Arts (Reading and Writing)
GROUP LOW SCORES HIGH SCORES PROFICIENT OR
ADVANCED
STUDENTS TESTED
COMMENTS
SCHOOLWIDE AVERAGE 40% 95% SCHOOLWIDE AVERAGE: About six percent fewer students at our school scored Proficient or Advanced than at the average high school in California.
AVERAGE HIGH SCHOOL IN THE COUNTY
51% 98%
AVERAGE HIGH SCHOOL IN CALIFORNIA
46% 97%
BAR GRAPHS BELOW SHOW TWO PROFICIENCY GROUPS (LEFT TO RIGHT):
FAR BELOW BASIC, BELOW BASIC, AND BASIC PROFICIENT AND ADVANCED
Subgroup Test Scores
GROUP LOW SCORES HIGH SCORES PROFICIENT OR
ADVANCED
STUDENTS TESTED
COMMENTS
Boys 36% 912 GENDER: About nine percent more girls than boys at our school scored Proficient or Advanced.
Girls 45% 898
English proficient 51% 1,384 ENGLISH PROFICIENCY: English Learners scored lower on the CST than students who are proficient in English. Because we give this test in English, English Learners tend to be at a disadvantage. English Learners 4% 426
Low income 34% 1,040 INCOME: About 15 percent fewer students from lower-income families scored Proficient or Advanced than our other students.
Not low income 49% 769
Learning disabled 4% 172 LEARNING DISABILITIES: Students classified as learning disabled scored lower than students without learning disabilities. The CST is not designed to test the progress of students with moderate to severe learning differences. Not learning disabled 44% 1,637
African American 46% 137 ETHNICITY: Test scores are likely to vary among students of different ethnic origins. The degree of variance will differ from school to school. Measures of the achievement gap are beyond the scope of this report.Filipino 60% 40
Hispanic/Latino 32% 1,135
Pacific Islander 44% 64
White/Other 58% 373
SOURCE: The scores for the CST are from the spring 2009 test cycle. County and state averages represent high schools only. Whenever a school reports fewer than 11 scores for a particular subgroup at any grade level, the CDE suppresses the scores when it releases the data to the public. Missing data makes it impossible for us to compile complete schoolwide results. Therefore, the results published in this report may vary from other published CDE test scores.N/A: Not applicable. Either no students took the test, or to safeguard student privacy the CDE withheld all results because very few students took the test in any grade.N/S: Not statistically significant. While we have some data to report, we are suppressing it because the number of valid test scores is not large enough to be meaningful.
100
80
60
40
20
0
20
40
60
80
100
2007 2008 2009
Three-Year Trend:English/Language Arts
Perc
enta
ge
of
stu
den
ts
SOURCE: CDE STAR research file: 2007, 2008, and 2009.
Percentage of studentswho took the test:
2007: 96%
2008: 97%
2009: 95%
Oceanside Unified School District
Oceanside High School School Accountability Report Card for 2008–2009 Page 9
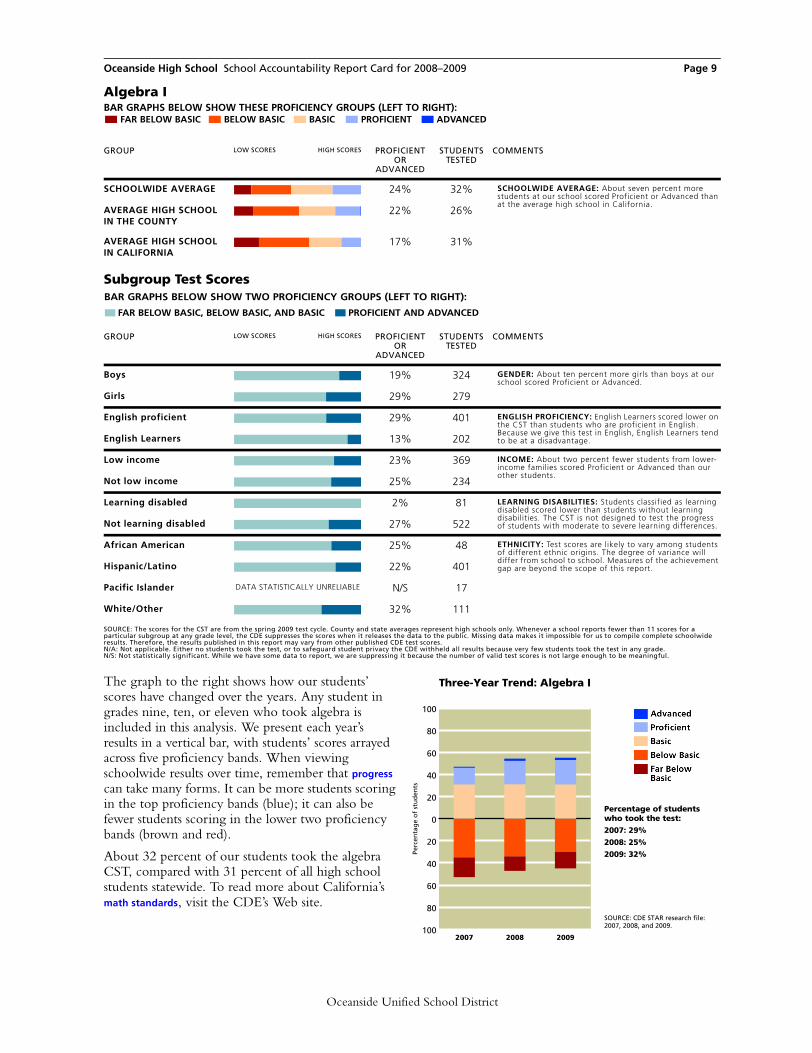
The graph to the right shows how our students’ scores have changed over the years. Any student in grades nine, ten, or eleven who took algebra is included in this analysis. We present each year’s results in a vertical bar, with students’ scores arrayed across five proficiency bands. When viewing schoolwide results over time, remember that progress can take many forms. It can be more students scoring in the top proficiency bands (blue); it can also be fewer students scoring in the lower two proficiency bands (brown and red).
About 32 percent of our students took the algebra CST, compared with 31 percent of all high school students statewide. To read more about California’s math standards, visit the CDE’s Web site.
BAR GRAPHS BELOW SHOW THESE PROFICIENCY GROUPS (LEFT TO RIGHT):FAR BELOW BASIC BELOW BASIC BASIC PROFICIENT ADVANCED
Algebra I
GROUP LOW SCORES HIGH SCORES PROFICIENT OR
ADVANCED
STUDENTS TESTED
COMMENTS
SCHOOLWIDE AVERAGE 24% 32% SCHOOLWIDE AVERAGE: About seven percent more students at our school scored Proficient or Advanced than at the average high school in California.
AVERAGE HIGH SCHOOL IN THE COUNTY
22% 26%
AVERAGE HIGH SCHOOL IN CALIFORNIA
17% 31%
BAR GRAPHS BELOW SHOW TWO PROFICIENCY GROUPS (LEFT TO RIGHT):
FAR BELOW BASIC, BELOW BASIC, AND BASIC PROFICIENT AND ADVANCED
Subgroup Test Scores
GROUP LOW SCORES HIGH SCORES PROFICIENT OR
ADVANCED
STUDENTS TESTED
COMMENTS
Boys 19% 324 GENDER: About ten percent more girls than boys at our school scored Proficient or Advanced.
Girls 29% 279
English proficient 29% 401 ENGLISH PROFICIENCY: English Learners scored lower on the CST than students who are proficient in English. Because we give this test in English, English Learners tend to be at a disadvantage. English Learners 13% 202
Low income 23% 369 INCOME: About two percent fewer students from lower-income families scored Proficient or Advanced than our other students.
Not low income 25% 234
Learning disabled 2% 81 LEARNING DISABILITIES: Students classified as learning disabled scored lower than students without learning disabilities. The CST is not designed to test the progress of students with moderate to severe learning differences. Not learning disabled 27% 522
African American 25% 48 ETHNICITY: Test scores are likely to vary among students of different ethnic origins. The degree of variance will differ from school to school. Measures of the achievement gap are beyond the scope of this report.Hispanic/Latino 22% 401
Pacific Islander DATA STATISTICALLY UNRELIABLE N/S 17
White/Other 32% 111
SOURCE: The scores for the CST are from the spring 2009 test cycle. County and state averages represent high schools only. Whenever a school reports fewer than 11 scores for a particular subgroup at any grade level, the CDE suppresses the scores when it releases the data to the public. Missing data makes it impossible for us to compile complete schoolwide results. Therefore, the results published in this report may vary from other published CDE test scores.N/A: Not applicable. Either no students took the test, or to safeguard student privacy the CDE withheld all results because very few students took the test in any grade.N/S: Not statistically significant. While we have some data to report, we are suppressing it because the number of valid test scores is not large enough to be meaningful.
100
80
60
40
20
0
20
40
60
80
100
2007 2008 2009
Three-Year Trend: Algebra I
Perc
enta
ge
of
stu
den
ts
SOURCE: CDE STAR research file: 2007, 2008, and 2009.
Percentage of studentswho took the test:
2007: 29%
2008: 25%
2009: 32%
Oceanside Unified School District
Oceanside High School School Accountability Report Card for 2008–2009 Page 10
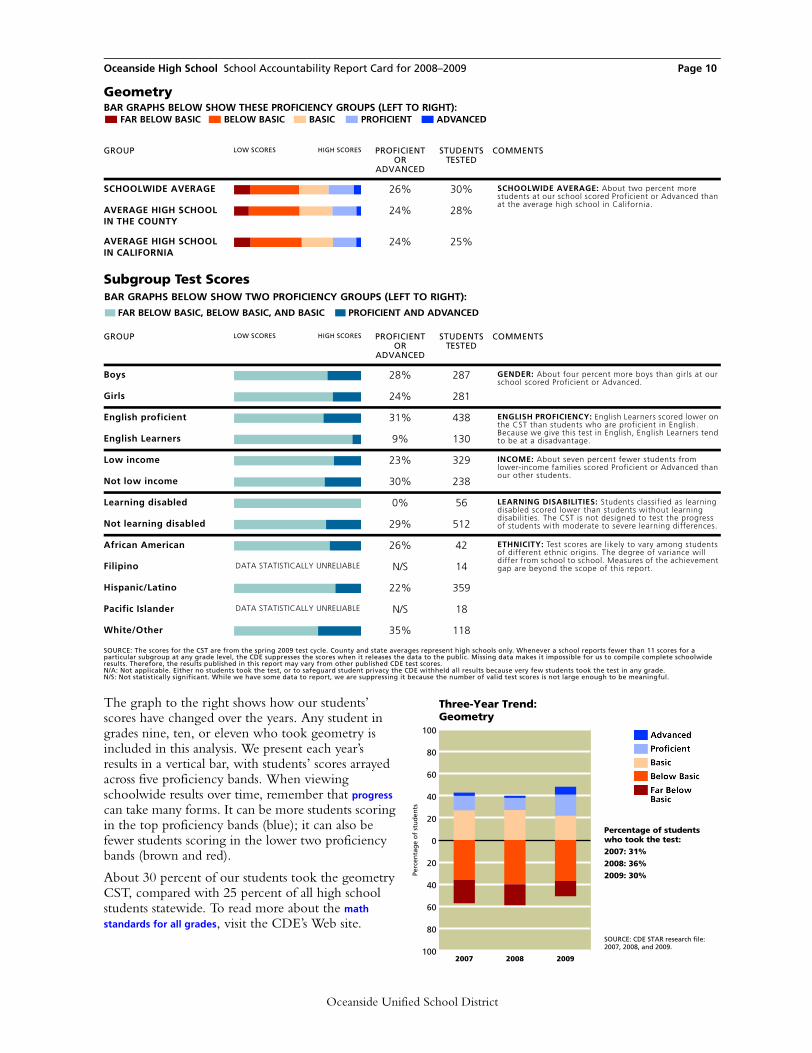
The graph to the right shows how our students’ scores have changed over the years. Any student in grades nine, ten, or eleven who took geometry is included in this analysis. We present each year’s results in a vertical bar, with students’ scores arrayed across five proficiency bands. When viewing schoolwide results over time, remember that progress can take many forms. It can be more students scoring in the top proficiency bands (blue); it can also be fewer students scoring in the lower two proficiency bands (brown and red).
About 30 percent of our students took the geometry CST, compared with 25 percent of all high school students statewide. To read more about the math
standards for all grades, visit the CDE’s Web site.
BAR GRAPHS BELOW SHOW THESE PROFICIENCY GROUPS (LEFT TO RIGHT):FAR BELOW BASIC BELOW BASIC BASIC PROFICIENT ADVANCED
Geometry
GROUP LOW SCORES HIGH SCORES PROFICIENT OR
ADVANCED
STUDENTS TESTED
COMMENTS
SCHOOLWIDE AVERAGE 26% 30% SCHOOLWIDE AVERAGE: About two percent more students at our school scored Proficient or Advanced than at the average high school in California.
AVERAGE HIGH SCHOOL IN THE COUNTY
24% 28%
AVERAGE HIGH SCHOOL IN CALIFORNIA
24% 25%
BAR GRAPHS BELOW SHOW TWO PROFICIENCY GROUPS (LEFT TO RIGHT):
FAR BELOW BASIC, BELOW BASIC, AND BASIC PROFICIENT AND ADVANCED
Subgroup Test Scores
GROUP LOW SCORES HIGH SCORES PROFICIENT OR
ADVANCED
STUDENTS TESTED
COMMENTS
Boys 28% 287 GENDER: About four percent more boys than girls at our school scored Proficient or Advanced.
Girls 24% 281
English proficient 31% 438 ENGLISH PROFICIENCY: English Learners scored lower on the CST than students who are proficient in English. Because we give this test in English, English Learners tend to be at a disadvantage. English Learners 9% 130
Low income 23% 329 INCOME: About seven percent fewer students from lower-income families scored Proficient or Advanced than our other students.
Not low income 30% 238
Learning disabled 0% 56 LEARNING DISABILITIES: Students classified as learning disabled scored lower than students without learning disabilities. The CST is not designed to test the progress of students with moderate to severe learning differences. Not learning disabled 29% 512
African American 26% 42 ETHNICITY: Test scores are likely to vary among students of different ethnic origins. The degree of variance will differ from school to school. Measures of the achievement gap are beyond the scope of this report.Filipino DATA STATISTICALLY UNRELIABLE N/S 14
Hispanic/Latino 22% 359
Pacific Islander DATA STATISTICALLY UNRELIABLE N/S 18
White/Other 35% 118
SOURCE: The scores for the CST are from the spring 2009 test cycle. County and state averages represent high schools only. Whenever a school reports fewer than 11 scores for a particular subgroup at any grade level, the CDE suppresses the scores when it releases the data to the public. Missing data makes it impossible for us to compile complete schoolwide results. Therefore, the results published in this report may vary from other published CDE test scores.N/A: Not applicable. Either no students took the test, or to safeguard student privacy the CDE withheld all results because very few students took the test in any grade.N/S: Not statistically significant. While we have some data to report, we are suppressing it because the number of valid test scores is not large enough to be meaningful.
100
80
60
40
20
0
20
40
60
80
100
2007 2008 2009
Three-Year Trend: Geometry
Perc
enta
ge
of
stu
den
ts
SOURCE: CDE STAR research file: 2007, 2008, and 2009.
Percentage of studentswho took the test:
2007: 31%
2008: 36%
2009: 30%
Oceanside Unified School District
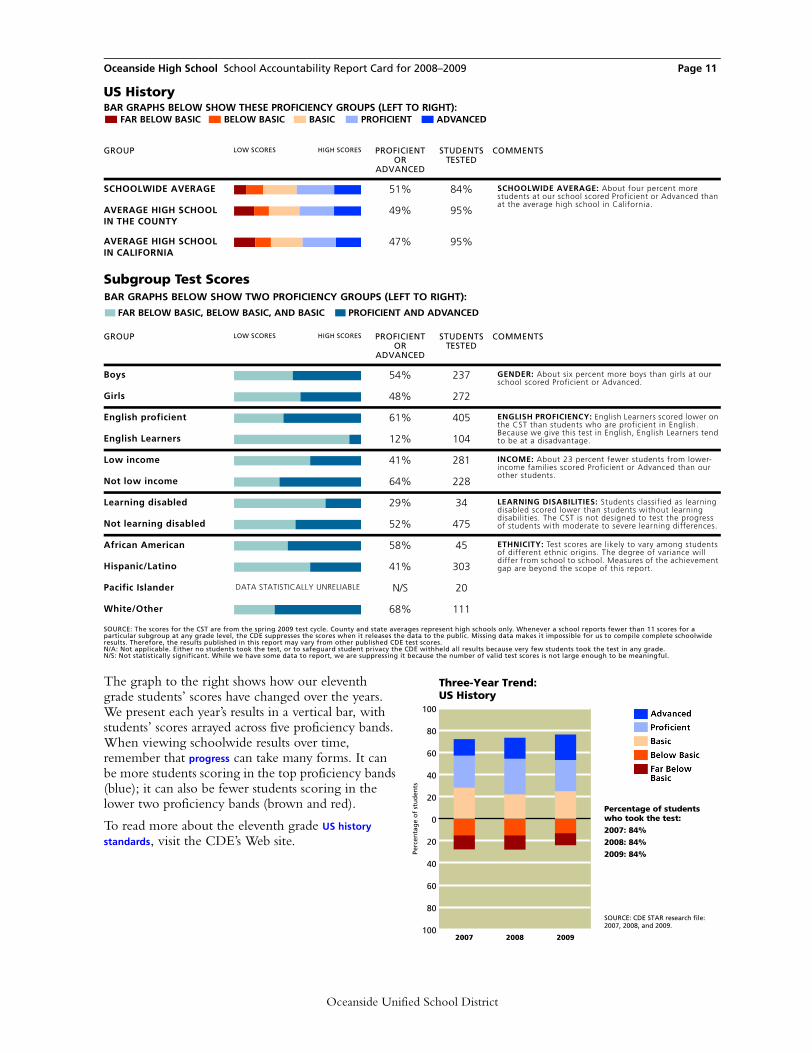
Oceanside High School School Accountability Report Card for 2008–2009 Page 11
The graph to the right shows how our eleventh grade students’ scores have changed over the years. We present each year’s results in a vertical bar, with students’ scores arrayed across five proficiency bands. When viewing schoolwide results over time, remember that progress can take many forms. It can be more students scoring in the top proficiency bands (blue); it can also be fewer students scoring in the lower two proficiency bands (brown and red).
To read more about the eleventh grade US history
standards, visit the CDE’s Web site.
BAR GRAPHS BELOW SHOW THESE PROFICIENCY GROUPS (LEFT TO RIGHT):FAR BELOW BASIC BELOW BASIC BASIC PROFICIENT ADVANCED
US History
GROUP LOW SCORES HIGH SCORES PROFICIENT OR
ADVANCED
STUDENTS TESTED
COMMENTS
SCHOOLWIDE AVERAGE 51% 84% SCHOOLWIDE AVERAGE: About four percent more students at our school scored Proficient or Advanced than at the average high school in California.
AVERAGE HIGH SCHOOL IN THE COUNTY
49% 95%
AVERAGE HIGH SCHOOL IN CALIFORNIA
47% 95%
BAR GRAPHS BELOW SHOW TWO PROFICIENCY GROUPS (LEFT TO RIGHT):
FAR BELOW BASIC, BELOW BASIC, AND BASIC PROFICIENT AND ADVANCED
Subgroup Test Scores
GROUP LOW SCORES HIGH SCORES PROFICIENT OR
ADVANCED
STUDENTS TESTED
COMMENTS
Boys 54% 237 GENDER: About six percent more boys than girls at our school scored Proficient or Advanced.
Girls 48% 272
English proficient 61% 405 ENGLISH PROFICIENCY: English Learners scored lower on the CST than students who are proficient in English. Because we give this test in English, English Learners tend to be at a disadvantage. English Learners 12% 104
Low income 41% 281 INCOME: About 23 percent fewer students from lower-income families scored Proficient or Advanced than our other students.
Not low income 64% 228
Learning disabled 29% 34 LEARNING DISABILITIES: Students classified as learning disabled scored lower than students without learning disabilities. The CST is not designed to test the progress of students with moderate to severe learning differences. Not learning disabled 52% 475
African American 58% 45 ETHNICITY: Test scores are likely to vary among students of different ethnic origins. The degree of variance will differ from school to school. Measures of the achievement gap are beyond the scope of this report.Hispanic/Latino 41% 303
Pacific Islander DATA STATISTICALLY UNRELIABLE N/S 20
White/Other 68% 111
SOURCE: The scores for the CST are from the spring 2009 test cycle. County and state averages represent high schools only. Whenever a school reports fewer than 11 scores for a particular subgroup at any grade level, the CDE suppresses the scores when it releases the data to the public. Missing data makes it impossible for us to compile complete schoolwide results. Therefore, the results published in this report may vary from other published CDE test scores.N/A: Not applicable. Either no students took the test, or to safeguard student privacy the CDE withheld all results because very few students took the test in any grade.N/S: Not statistically significant. While we have some data to report, we are suppressing it because the number of valid test scores is not large enough to be meaningful.
100
80
60
40
20
0
20
40
60
80
100
2007 2008 2009
Three-Year Trend: US History
Perc
enta
ge
of
stu
den
ts
SOURCE: CDE STAR research file: 2007, 2008, and 2009.
Percentage of studentswho took the test:
2007: 84%
2008: 84%
2009: 84%
Oceanside Unified School District

Oceanside High School School Accountability Report Card for 2008–2009 Page 12
The graph to the right shows how our students’ scores have changed over the years. Any student in grades nine, ten, or eleven who took biology is included in this analysis. We present each year’s results in a vertical bar, with students’ scores arrayed across five proficiency bands. When viewing schoolwide results over time, remember that progress can take many forms. It can be more students scoring in the top proficiency bands (blue); it can also be fewer students scoring in the lower two proficiency bands (brown and red).
About 34 percent of our students took the biology CST, compared with 36 percent of all high school students statewide. To read more about the California
standards for science visit the CDE’s Web site.
BAR GRAPHS BELOW SHOW THESE PROFICIENCY GROUPS (LEFT TO RIGHT):FAR BELOW BASIC BELOW BASIC BASIC PROFICIENT ADVANCED
Biology
GROUP LOW SCORES HIGH SCORES PROFICIENT OR
ADVANCED
STUDENTS TESTED
COMMENTS
SCHOOLWIDE AVERAGE 45% 34% SCHOOLWIDE AVERAGE: About three percent more students at our school scored Proficient or Advanced than at the average high school in California.
AVERAGE HIGH SCHOOL IN THE COUNTY
46% 32%
AVERAGE HIGH SCHOOL IN CALIFORNIA
42% 36%
BAR GRAPHS BELOW SHOW TWO PROFICIENCY GROUPS (LEFT TO RIGHT):
FAR BELOW BASIC, BELOW BASIC, AND BASIC PROFICIENT AND ADVANCED
Subgroup Test Scores
GROUP LOW SCORES HIGH SCORES PROFICIENT OR
ADVANCED
STUDENTS TESTED
COMMENTS
Boys 41% 302 GENDER: About seven percent more girls than boys at our school scored Proficient or Advanced.
Girls 48% 337
English proficient 55% 497 ENGLISH PROFICIENCY: English Learners scored lower on the CST than students who are proficient in English. Because we give this test in English, English Learners tend to be at a disadvantage. English Learners 10% 142
Low income 39% 355 INCOME: About 13 percent fewer students from lower-income families scored Proficient or Advanced than our other students.
Not low income 52% 283
Learning disabled 6% 77 LEARNING DISABILITIES: Students classified as learning disabled scored lower than students without learning disabilities. The CST is not designed to test the progress of students with moderate to severe learning differences. Not learning disabled 50% 562
African American 55% 53 ETHNICITY: Test scores are likely to vary among students of different ethnic origins. The degree of variance will differ from school to school. Measures of the achievement gap are beyond the scope of this report.Filipino DATA STATISTICALLY UNRELIABLE N/S 13
Hispanic/Latino 34% 376
Pacific Islander DATA STATISTICALLY UNRELIABLE N/S 18
White/Other 64% 159
SOURCE: The scores for the CST are from the spring 2009 test cycle. County and state averages represent high schools only. Whenever a school reports fewer than 11 scores for a particular subgroup at any grade level, the CDE suppresses the scores when it releases the data to the public. Missing data makes it impossible for us to compile complete schoolwide results. Therefore, the results published in this report may vary from other published CDE test scores.N/A: Not applicable. Either no students took the test, or to safeguard student privacy the CDE withheld all results because very few students took the test in any grade.N/S: Not statistically significant. While we have some data to report, we are suppressing it because the number of valid test scores is not large enough to be meaningful.
100
80
60
40
20
0
20
40
60
80
100
2007 2008 2009
Three-Year Trend: Biology
Perc
enta
ge
of
stu
den
ts
SOURCE: CDE STAR research file: 2007, 2008, and 2009.
Percentage of studentswho took the test:
2007: 35%
2008: 35%
2009: 34%
Oceanside Unified School District
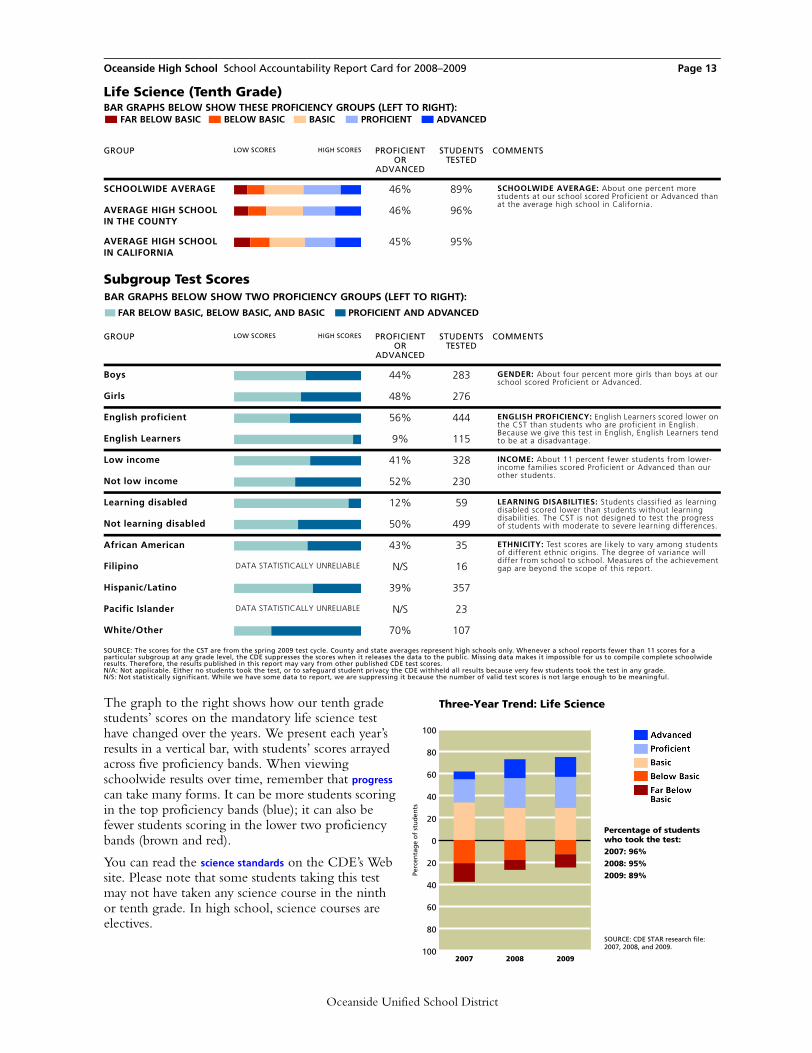
Oceanside High School School Accountability Report Card for 2008–2009 Page 13
The graph to the right shows how our tenth grade students’ scores on the mandatory life science test have changed over the years. We present each year’s results in a vertical bar, with students’ scores arrayed across five proficiency bands. When viewing schoolwide results over time, remember that progress can take many forms. It can be more students scoring in the top proficiency bands (blue); it can also be fewer students scoring in the lower two proficiency bands (brown and red).
You can read the science standards on the CDE’s Web site. Please note that some students taking this test may not have taken any science course in the ninth or tenth grade. In high school, science courses are electives.
BAR GRAPHS BELOW SHOW THESE PROFICIENCY GROUPS (LEFT TO RIGHT):FAR BELOW BASIC BELOW BASIC BASIC PROFICIENT ADVANCED
Life Science (Tenth Grade)
GROUP LOW SCORES HIGH SCORES PROFICIENT OR
ADVANCED
STUDENTS TESTED
COMMENTS
SCHOOLWIDE AVERAGE 46% 89% SCHOOLWIDE AVERAGE: About one percent more students at our school scored Proficient or Advanced than at the average high school in California.
AVERAGE HIGH SCHOOL IN THE COUNTY
46% 96%
AVERAGE HIGH SCHOOL IN CALIFORNIA
45% 95%
BAR GRAPHS BELOW SHOW TWO PROFICIENCY GROUPS (LEFT TO RIGHT):
FAR BELOW BASIC, BELOW BASIC, AND BASIC PROFICIENT AND ADVANCED
Subgroup Test Scores
GROUP LOW SCORES HIGH SCORES PROFICIENT OR
ADVANCED
STUDENTS TESTED
COMMENTS
Boys 44% 283 GENDER: About four percent more girls than boys at our school scored Proficient or Advanced.
Girls 48% 276
English proficient 56% 444 ENGLISH PROFICIENCY: English Learners scored lower on the CST than students who are proficient in English. Because we give this test in English, English Learners tend to be at a disadvantage. English Learners 9% 115
Low income 41% 328 INCOME: About 11 percent fewer students from lower-income families scored Proficient or Advanced than our other students.
Not low income 52% 230
Learning disabled 12% 59 LEARNING DISABILITIES: Students classified as learning disabled scored lower than students without learning disabilities. The CST is not designed to test the progress of students with moderate to severe learning differences. Not learning disabled 50% 499
African American 43% 35 ETHNICITY: Test scores are likely to vary among students of different ethnic origins. The degree of variance will differ from school to school. Measures of the achievement gap are beyond the scope of this report.Filipino DATA STATISTICALLY UNRELIABLE N/S 16
Hispanic/Latino 39% 357
Pacific Islander DATA STATISTICALLY UNRELIABLE N/S 23
White/Other 70% 107
SOURCE: The scores for the CST are from the spring 2009 test cycle. County and state averages represent high schools only. Whenever a school reports fewer than 11 scores for a particular subgroup at any grade level, the CDE suppresses the scores when it releases the data to the public. Missing data makes it impossible for us to compile complete schoolwide results. Therefore, the results published in this report may vary from other published CDE test scores.N/A: Not applicable. Either no students took the test, or to safeguard student privacy the CDE withheld all results because very few students took the test in any grade.N/S: Not statistically significant. While we have some data to report, we are suppressing it because the number of valid test scores is not large enough to be meaningful.
100
80
60
40
20
0
20
40
60
80
100
2007 2008 2009
Three-Year Trend: Life Science
Perc
enta
ge
of
stu
den
ts
SOURCE: CDE STAR research file: 2007, 2008, and 2009.
Percentage of studentswho took the test:
2007: 96%
2008: 95%
2009: 89%
Oceanside Unified School District
Oceanside High School School Accountability Report Card for 2008–2009 Page 14
Other Measures of Student AchievementOur teachers evaluate students’ skills using oral questioning, written tests, and project-based evaluations. Teachers use Edusoft, a data management system, to analyze student’s test results and progress toward state standards every six weeks. We report grades twice yearly, once each semester. We also mail out progress reports after the sixth and 12th week of each semester. Weekly grade-check forms are also available through the counseling office. In addition, we use School Loop, which sends parents and students a nightly email updating them on student progress in each class.
Oceanside Unified School District
Oceanside High School School Accountability Report Card for 2008–2009 Page 15
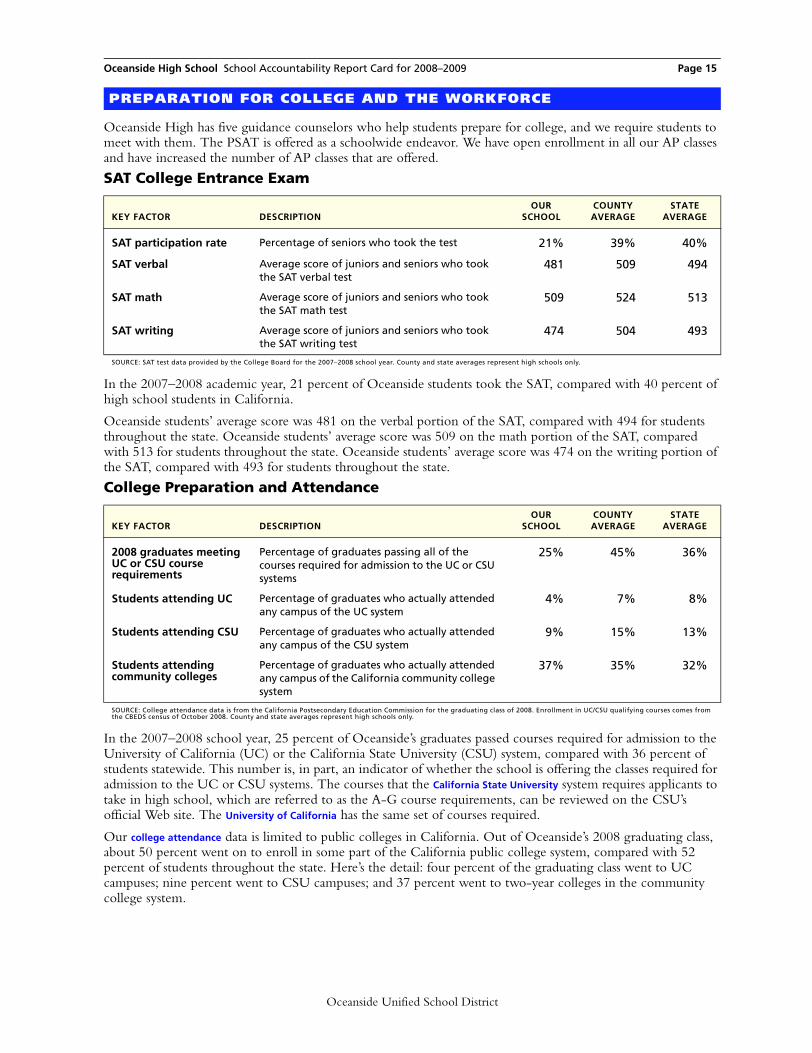
Oceanside High has five guidance counselors who help students prepare for college, and we require students to meet with them. The PSAT is offered as a schoolwide endeavor. We have open enrollment in all our AP classes and have increased the number of AP classes that are offered.
In the 2007–2008 academic year, 21 percent of Oceanside students took the SAT, compared with 40 percent of high school students in California.
Oceanside students’ average score was 481 on the verbal portion of the SAT, compared with 494 for students throughout the state. Oceanside students’ average score was 509 on the math portion of the SAT, compared with 513 for students throughout the state. Oceanside students’ average score was 474 on the writing portion of the SAT, compared with 493 for students throughout the state.
In the 2007–2008 school year, 25 percent of Oceanside’s graduates passed courses required for admission to the University of California (UC) or the California State University (CSU) system, compared with 36 percent of students statewide. This number is, in part, an indicator of whether the school is offering the classes required for admission to the UC or CSU systems. The courses that the California State University system requires applicants to take in high school, which are referred to as the A-G course requirements, can be reviewed on the CSU’s official Web site. The University of California has the same set of courses required.
Our college attendance data is limited to public colleges in California. Out of Oceanside’s 2008 graduating class, about 50 percent went on to enroll in some part of the California public college system, compared with 52 percent of students throughout the state. Here’s the detail: four percent of the graduating class went to UC campuses; nine percent went to CSU campuses; and 37 percent went to two-year colleges in the community college system.
PREPARATION FOR COLLEGE AND THE WORKFORCE
SAT College Entrance Exam
KEY FACTOR DESCRIPTIONOUR
SCHOOLCOUNTYAVERAGE
STATEAVERAGE
SAT participation rate Percentage of seniors who took the test 21% 39% 40%
SAT verbal Average score of juniors and seniors who took the SAT verbal test
481 509 494
SAT math Average score of juniors and seniors who took the SAT math test
509 524 513
SAT writing Average score of juniors and seniors who took the SAT writing test
474 504 493
SOURCE: SAT test data provided by the College Board for the 2007–2008 school year. County and state averages represent high schools only.
College Preparation and Attendance
KEY FACTOR DESCRIPTIONOUR
SCHOOLCOUNTYAVERAGE
STATEAVERAGE
2008 graduates meeting UC or CSU course requirements
Percentage of graduates passing all of the courses required for admission to the UC or CSU systems
25% 45% 36%
Students attending UC Percentage of graduates who actually attended any campus of the UC system
4% 7% 8%
Students attending CSU Percentage of graduates who actually attended any campus of the CSU system
9% 15% 13%
Students attending community colleges
Percentage of graduates who actually attended any campus of the California community college system
37% 35% 32%
SOURCE: College attendance data is from the California Postsecondary Education Commission for the graduating class of 2008. Enrollment in UC/CSU qualifying courses comes from the CBEDS census of October 2008. County and state averages represent high schools only.
Oceanside Unified School District
Oceanside High School School Accountability Report Card for 2008–2009 Page 16
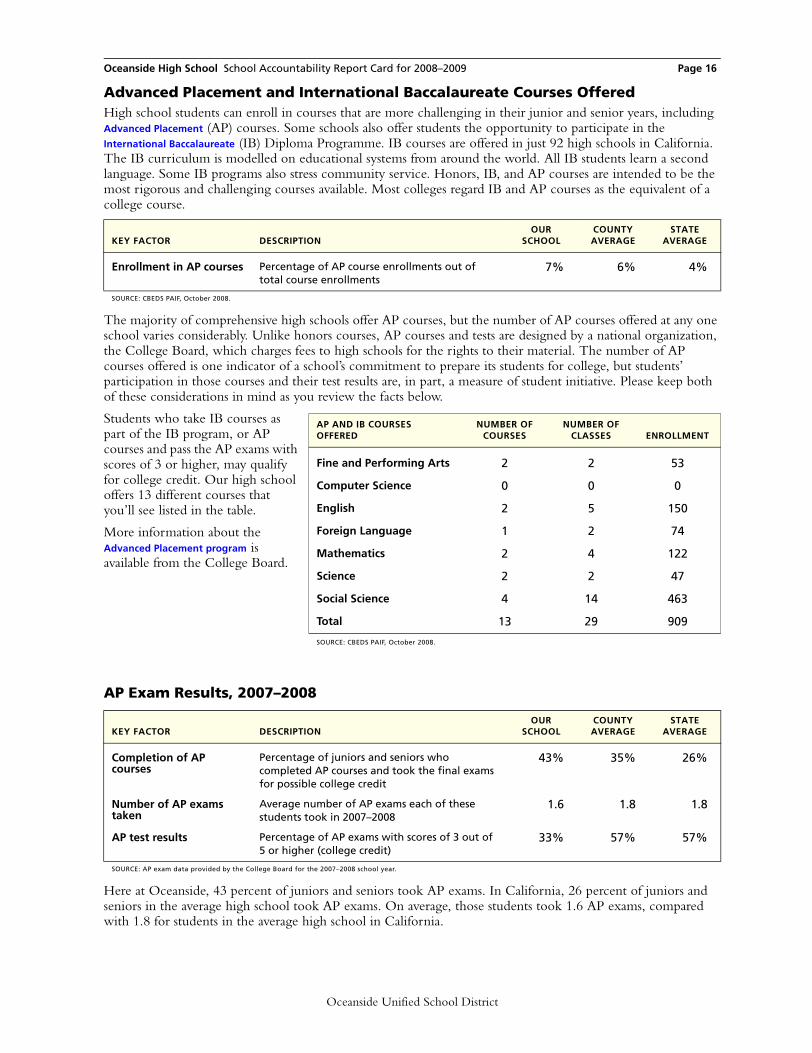
Advanced Placement and International Baccalaureate Courses OfferedHigh school students can enroll in courses that are more challenging in their junior and senior years, including Advanced Placement (AP) courses. Some schools also offer students the opportunity to participate in the International Baccalaureate (IB) Diploma Programme. IB courses are offered in just 92 high schools in California. The IB curriculum is modelled on educational systems from around the world. All IB students learn a second language. Some IB programs also stress community service. Honors, IB, and AP courses are intended to be the most rigorous and challenging courses available. Most colleges regard IB and AP courses as the equivalent of a college course.
The majority of comprehensive high schools offer AP courses, but the number of AP courses offered at any one school varies considerably. Unlike honors courses, AP courses and tests are designed by a national organization, the College Board, which charges fees to high schools for the rights to their material. The number of AP courses offered is one indicator of a school’s commitment to prepare its students for college, but students’ participation in those courses and their test results are, in part, a measure of student initiative. Please keep both of these considerations in mind as you review the facts below.
Students who take IB courses as part of the IB program, or AP courses and pass the AP exams with scores of 3 or higher, may qualify for college credit. Our high school offers 13 different courses that you’ll see listed in the table.
More information about the Advanced Placement program is available from the College Board.
Here at Oceanside, 43 percent of juniors and seniors took AP exams. In California, 26 percent of juniors and seniors in the average high school took AP exams. On average, those students took 1.6 AP exams, compared with 1.8 for students in the average high school in California.
KEY FACTOR DESCRIPTIONOUR
SCHOOLCOUNTYAVERAGE
STATEAVERAGE
Enrollment in AP courses Percentage of AP course enrollments out of total course enrollments
7% 6% 4%
SOURCE: CBEDS PAIF, October 2008.
AP Exam Results, 2007–2008
KEY FACTOR DESCRIPTIONOUR
SCHOOLCOUNTYAVERAGE
STATEAVERAGE
Completion of AP courses
Percentage of juniors and seniors who completed AP courses and took the final exams for possible college credit
43% 35% 26%
Number of AP exams taken
Average number of AP exams each of these students took in 2007–2008
1.6 1.8 1.8
AP test results Percentage of AP exams with scores of 3 out of 5 or higher (college credit)
33% 57% 57%
SOURCE: AP exam data provided by the College Board for the 2007–2008 school year.
AP AND IB COURSES OFFERED
NUMBER OF COURSES
NUMBER OF CLASSES ENROLLMENT
Fine and Performing Arts 2 2 53
Computer Science 0 0 0
English 2 5 150
Foreign Language 1 2 74
Mathematics 2 4 122
Science 2 2 47
Social Science 4 14 463
Total 13 29 909
SOURCE: CBEDS PAIF, October 2008.
Oceanside Unified School District
Oceanside High School School Accountability Report Card for 2008–2009 Page 17
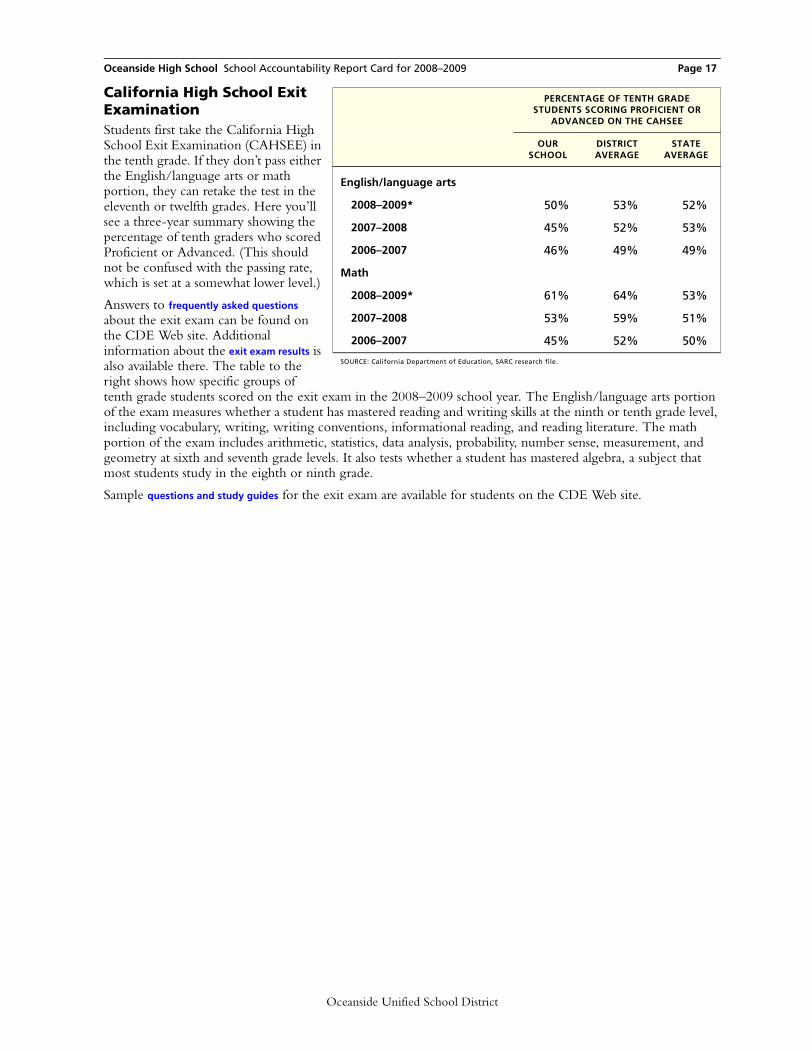
California High School Exit ExaminationStudents first take the California High School Exit Examination (CAHSEE) in the tenth grade. If they don’t pass either the English/language arts or math portion, they can retake the test in the eleventh or twelfth grades. Here you’ll see a three-year summary showing the percentage of tenth graders who scored Proficient or Advanced. (This should not be confused with the passing rate, which is set at a somewhat lower level.)
Answers to frequently asked questions about the exit exam can be found on the CDE Web site. Additional information about the exit exam results is also available there. The table to the right shows how specific groups of tenth grade students scored on the exit exam in the 2008–2009 school year. The English/language arts portion of the exam measures whether a student has mastered reading and writing skills at the ninth or tenth grade level, including vocabulary, writing, writing conventions, informational reading, and reading literature. The math portion of the exam includes arithmetic, statistics, data analysis, probability, number sense, measurement, and geometry at sixth and seventh grade levels. It also tests whether a student has mastered algebra, a subject that most students study in the eighth or ninth grade.
Sample questions and study guides for the exit exam are available for students on the CDE Web site.
PERCENTAGE OF TENTH GRADE STUDENTS SCORING PROFICIENT OR
ADVANCED ON THE CAHSEE
OUR SCHOOL
DISTRICT AVERAGE
STATE AVERAGE
English/language arts
2008–2009* 50% 53% 52%
2007–2008 45% 52% 53%
2006–2007 46% 49% 49%
Math
2008–2009* 61% 64% 53%
2007–2008 53% 59% 51%
2006–2007 45% 52% 50%
SOURCE: California Department of Education, SARC research file.
Oceanside Unified School District
Oceanside High School School Accountability Report Card for 2008–2009 Page 18
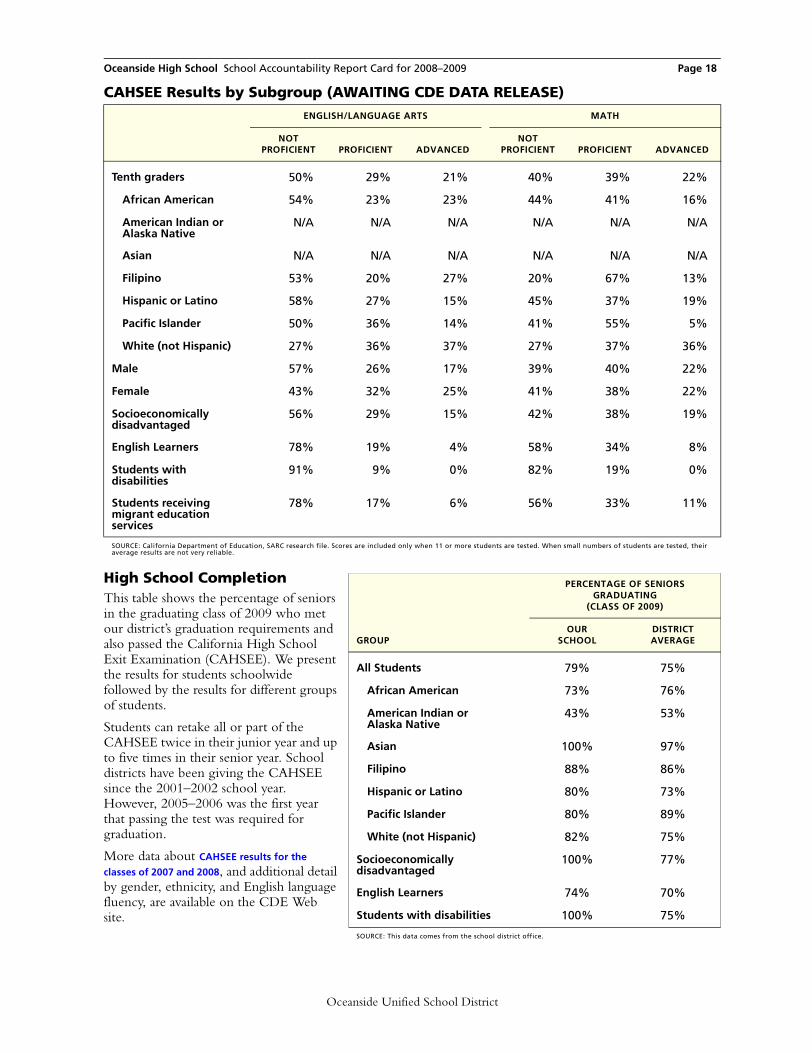
CAHSEE Results by Subgroup (AWAITING CDE DATA RELEASE)
High School CompletionThis table shows the percentage of seniors in the graduating class of 2009 who met our district’s graduation requirements and also passed the California High School Exit Examination (CAHSEE). We present the results for students schoolwide followed by the results for different groups of students.
Students can retake all or part of the CAHSEE twice in their junior year and up to five times in their senior year. School districts have been giving the CAHSEE since the 2001–2002 school year. However, 2005–2006 was the first year that passing the test was required for graduation.
More data about CAHSEE results for the
classes of 2007 and 2008, and additional detail by gender, ethnicity, and English language fluency, are available on the CDE Web site.
ENGLISH/LANGUAGE ARTS MATH
NOT PROFICIENT PROFICIENT ADVANCED
NOT PROFICIENT PROFICIENT ADVANCED
Tenth graders 50% 29% 21% 40% 39% 22%
African American 54% 23% 23% 44% 41% 16%
American Indian or Alaska Native
N/A N/A N/A N/A N/A N/A
Asian N/A N/A N/A N/A N/A N/A
Filipino 53% 20% 27% 20% 67% 13%
Hispanic or Latino 58% 27% 15% 45% 37% 19%
Pacific Islander 50% 36% 14% 41% 55% 5%
White (not Hispanic) 27% 36% 37% 27% 37% 36%
Male 57% 26% 17% 39% 40% 22%
Female 43% 32% 25% 41% 38% 22%
Socioeconomically disadvantaged
56% 29% 15% 42% 38% 19%
English Learners 78% 19% 4% 58% 34% 8%
Students with disabilities
91% 9% 0% 82% 19% 0%
Students receiving migrant education services
78% 17% 6% 56% 33% 11%
SOURCE: California Department of Education, SARC research file. Scores are included only when 11 or more students are tested. When small numbers of students are tested, their average results are not very reliable.
PERCENTAGE OF SENIORS GRADUATING
(CLASS OF 2009)
GROUPOUR
SCHOOLDISTRICT AVERAGE
All Students 79% 75%
African American 73% 76%
American Indian or Alaska Native
43% 53%
Asian 100% 97%
Filipino 88% 86%
Hispanic or Latino 80% 73%
Pacific Islander 80% 89%
White (not Hispanic) 82% 75%
Socioeconomically disadvantaged
100% 77%
English Learners 74% 70%
Students with disabilities 100% 75%
SOURCE: This data comes from the school district office.
Oceanside Unified School District
Oceanside High School School Accountability Report Card for 2008–2009 Page 19
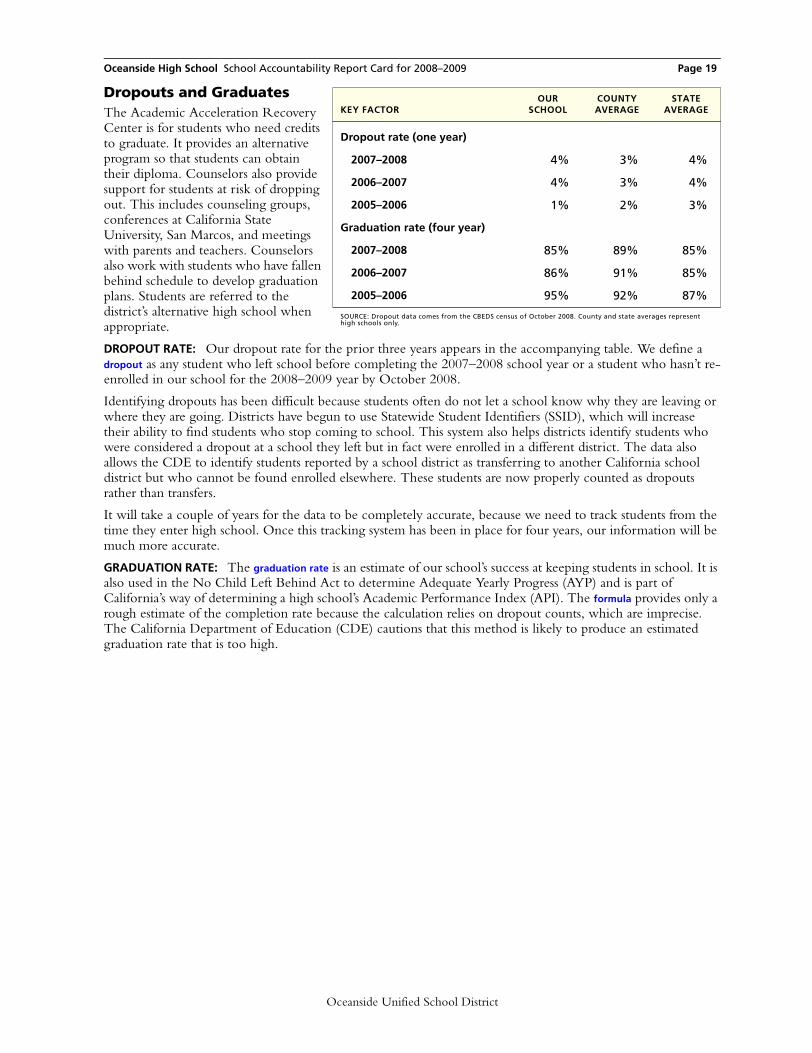
Dropouts and GraduatesThe Academic Acceleration Recovery Center is for students who need credits to graduate. It provides an alternative program so that students can obtain their diploma. Counselors also provide support for students at risk of dropping out. This includes counseling groups, conferences at California State University, San Marcos, and meetings with parents and teachers. Counselors also work with students who have fallen behind schedule to develop graduation plans. Students are referred to the district’s alternative high school when appropriate.
DROPOUT RATE: Our dropout rate for the prior three years appears in the accompanying table. We define a dropout as any student who left school before completing the 2007–2008 school year or a student who hasn’t re-enrolled in our school for the 2008–2009 year by October 2008.
Identifying dropouts has been difficult because students often do not let a school know why they are leaving or where they are going. Districts have begun to use Statewide Student Identifiers (SSID), which will increase their ability to find students who stop coming to school. This system also helps districts identify students who were considered a dropout at a school they left but in fact were enrolled in a different district. The data also allows the CDE to identify students reported by a school district as transferring to another California school district but who cannot be found enrolled elsewhere. These students are now properly counted as dropouts rather than transfers.
It will take a couple of years for the data to be completely accurate, because we need to track students from the time they enter high school. Once this tracking system has been in place for four years, our information will be much more accurate.
GRADUATION RATE: The graduation rate is an estimate of our school’s success at keeping students in school. It is also used in the No Child Left Behind Act to determine Adequate Yearly Progress (AYP) and is part of California’s way of determining a high school’s Academic Performance Index (API). The formula provides only a rough estimate of the completion rate because the calculation relies on dropout counts, which are imprecise. The California Department of Education (CDE) cautions that this method is likely to produce an estimated graduation rate that is too high.
KEY FACTOROUR
SCHOOLCOUNTYAVERAGE
STATEAVERAGE
Dropout rate (one year)
2007–2008 4% 3% 4%
2006–2007 4% 3% 4%
2005–2006 1% 2% 3%
Graduation rate (four year)
2007–2008 85% 89% 85%
2006–2007 86% 91% 85%
2005–2006 95% 92% 87%
SOURCE: Dropout data comes from the CBEDS census of October 2008. County and state averages represent high schools only.
Oceanside Unified School District
Oceanside High School School Accountability Report Card for 2008–2009 Page 20
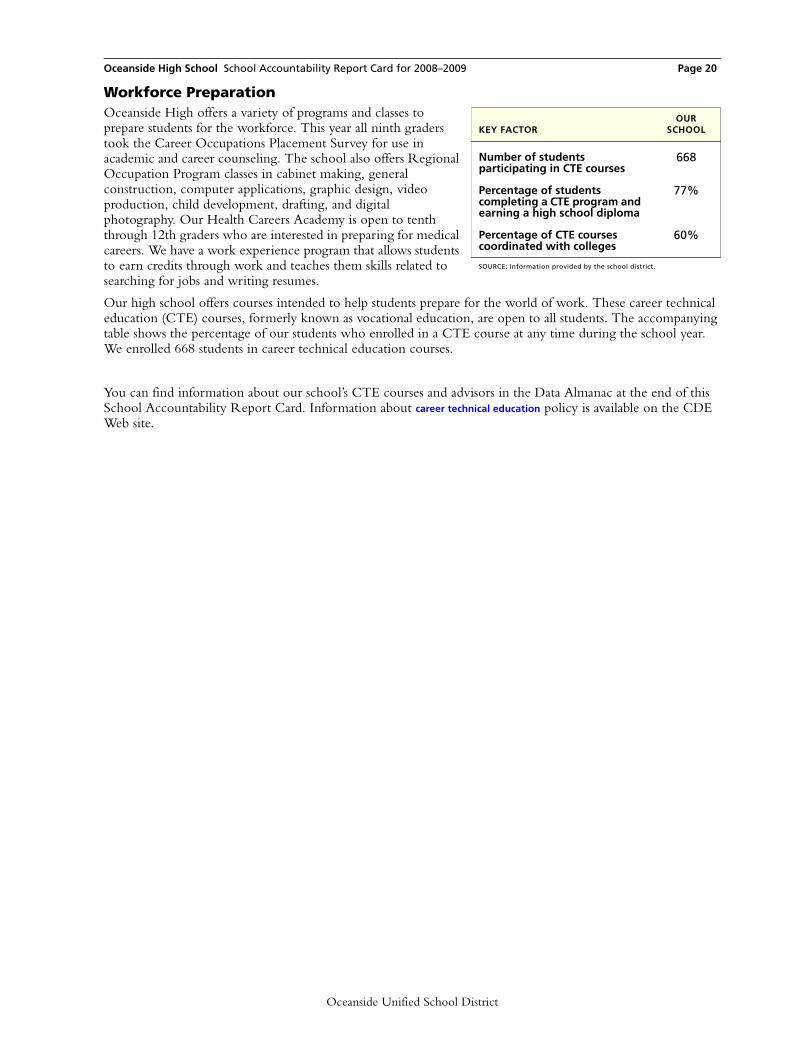
Workforce PreparationOceanside High offers a variety of programs and classes to prepare students for the workforce. This year all ninth graders took the Career Occupations Placement Survey for use in academic and career counseling. The school also offers Regional Occupation Program classes in cabinet making, general construction, computer applications, graphic design, video production, child development, drafting, and digital photography. Our Health Careers Academy is open to tenth through 12th graders who are interested in preparing for medical careers. We have a work experience program that allows students to earn credits through work and teaches them skills related to searching for jobs and writing resumes.
Our high school offers courses intended to help students prepare for the world of work. These career technical education (CTE) courses, formerly known as vocational education, are open to all students. The accompanying table shows the percentage of our students who enrolled in a CTE course at any time during the school year. We enrolled 668 students in career technical education courses.
You can find information about our school’s CTE courses and advisors in the Data Almanac at the end of this School Accountability Report Card. Information about career technical education policy is available on the CDE Web site.
KEY FACTOROUR
SCHOOL
Number of students participating in CTE courses
668
Percentage of students completing a CTE program and earning a high school diploma
77%
Percentage of CTE courses coordinated with colleges
60%
SOURCE: Information provided by the school district.
Oceanside Unified School District

Oceanside High School School Accountability Report Card for 2008–2009 Page 21
Students’ English Language SkillsAt Oceanside, 77 percent of students were considered to be proficient in English, compared with 86 percent of high school students in California overall.
Languages Spoken atHome by English LearnersPlease note that this table describes the home languages of just the 590 students classified as English Learners. At Oceanside, the language these students most often speak at home is Spanish. In California it’s common to find English Learners in classes with students who speak English well. When you visit our classrooms, ask our teachers how they work with language differences among their students.
EthnicityMost students at Oceanside identify themselves as Hispanic/Latino. In fact, there are about three times as many Hispanic/Latino students as White/European American/Other students, the second-largest ethnic group at Oceanside. The state of California allows citizens to choose more than one ethnic identity, or to select “multiethnic” or “decline to state.” As a consequence, the sum of all responses rarely equals 100 percent.
Family Income and EducationThe free or reduced-price meal subsidy goes to students whose families earned less than $39,220 a year (based on a family of four) in the 2008–2009 school year. At Oceanside, 48 percent of the students qualified for this program, compared with 46 percent of students in California.
The parents of 45 percent of the students at Oceanside have attended college and 16 percent have a college degree. This information can provide some clues to the level of literacy children bring to school. One precaution is that the students themselves provide this data when they take the battery of standardized tests each spring, so it may not be completely accurate. About 49 percent of our students provided this information.
STUDENTS
LANGUAGE SKILLSOUR
SCHOOLCOUNTYAVERAGE
STATEAVERAGE
English-proficient students 77% 86% 86%
English Learners 23% 14% 14%
SOURCE: Language Census for school year 2008–2009. County and state averages represent high schools only.
LANGUAGEOUR
SCHOOLCOUNTYAVERAGE
STATEAVERAGE
Spanish 98% 87% 84%
Vietnamese 0% 1% 2%
Cantonese 0% 0% 1%
Hmong 0% 0% 2%
Filipino/Tagalog 0% 2% 1%
Korean 0% 1% 1%
Khmer/Cambodian 0% 0% 1%
All other 2% 9% 8%
SOURCE: Language Census for school year 2008–2009. County and state averages represent high schools only.
ETHNICITYOUR
SCHOOLCOUNTYAVERAGE
STATEAVERAGE
African American 9% 7% 8%
Asian American/Pacific Islander
6% 11% 12%
Hispanic/Latino 61% 42% 45%
White/European American/Other
24% 40% 34%
SOURCE: CBEDS census of October 2008. County and state averages represent high schools only.
FAMILY FACTORSOUR
SCHOOLCOUNTYAVERAGE
STATEAVERAGE
Low-income indicator 48% 42% 46%
Parents with some college 45% 63% 56%
Parents with college degree 16% 39% 32%
SOURCE: The free and reduced-price lunch information is gathered by most districts in October. This data is from the 2008–2009 school year. Parents’ education level is collected in the spring at the start of testing. Rarely do all students answer these questions. County and state averages represent high schools only.
Oceanside Unified School District
Oceanside High School School Accountability Report Card for 2008–2009 Page 22
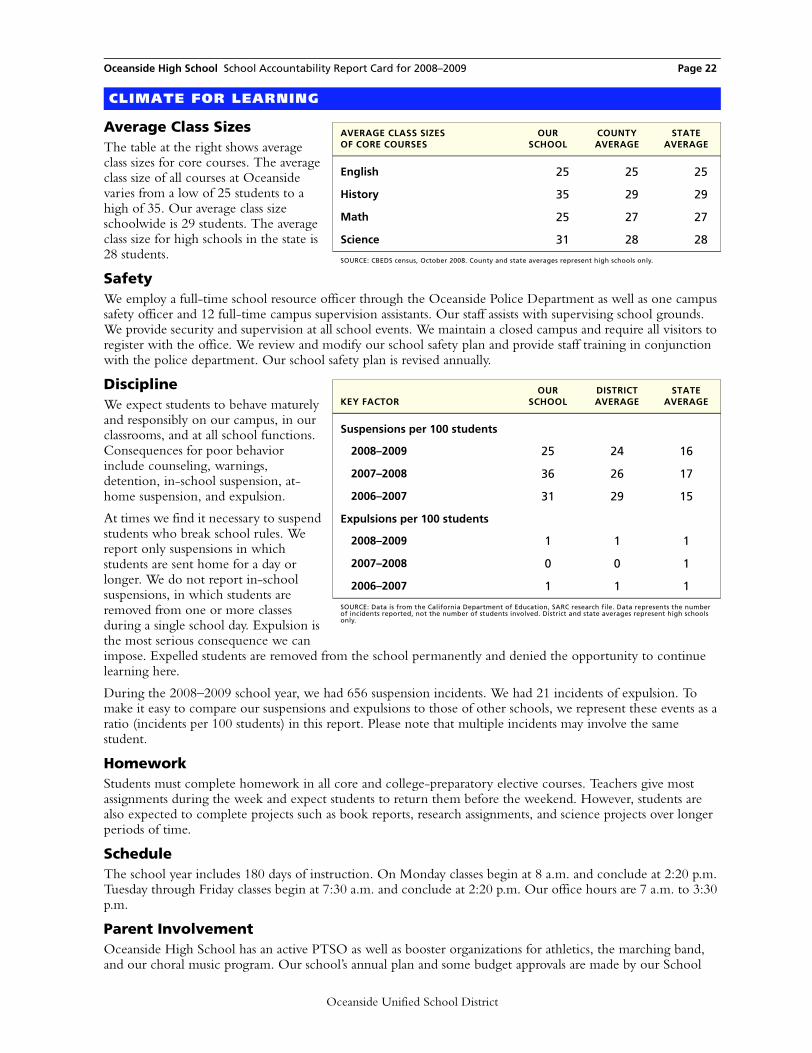
Average Class SizesThe table at the right shows average class sizes for core courses. The average class size of all courses at Oceanside varies from a low of 25 students to a high of 35. Our average class size schoolwide is 29 students. The average class size for high schools in the state is 28 students.
SafetyWe employ a full-time school resource officer through the Oceanside Police Department as well as one campus safety officer and 12 full-time campus supervision assistants. Our staff assists with supervising school grounds. We provide security and supervision at all school events. We maintain a closed campus and require all visitors to register with the office. We review and modify our school safety plan and provide staff training in conjunction with the police department. Our school safety plan is revised annually.
DisciplineWe expect students to behave maturely and responsibly on our campus, in our classrooms, and at all school functions. Consequences for poor behavior include counseling, warnings, detention, in-school suspension, at-home suspension, and expulsion.
At times we find it necessary to suspend students who break school rules. We report only suspensions in which students are sent home for a day or longer. We do not report in-school suspensions, in which students are removed from one or more classes during a single school day. Expulsion is the most serious consequence we can impose. Expelled students are removed from the school permanently and denied the opportunity to continue learning here.
During the 2008–2009 school year, we had 656 suspension incidents. We had 21 incidents of expulsion. To make it easy to compare our suspensions and expulsions to those of other schools, we represent these events as a ratio (incidents per 100 students) in this report. Please note that multiple incidents may involve the same student.
HomeworkStudents must complete homework in all core and college-preparatory elective courses. Teachers give most assignments during the week and expect students to return them before the weekend. However, students are also expected to complete projects such as book reports, research assignments, and science projects over longer periods of time.
ScheduleThe school year includes 180 days of instruction. On Monday classes begin at 8 a.m. and conclude at 2:20 p.m. Tuesday through Friday classes begin at 7:30 a.m. and conclude at 2:20 p.m. Our office hours are 7 a.m. to 3:30 p.m.
Parent InvolvementOceanside High School has an active PTSO as well as booster organizations for athletics, the marching band, and our choral music program. Our school’s annual plan and some budget approvals are made by our School
CLIMATE FOR LEARNING
AVERAGE CLASS SIZESOF CORE COURSES
OURSCHOOL
COUNTYAVERAGE
STATEAVERAGE
English 25 25 25
History 35 29 29
Math 25 27 27
Science 31 28 28
SOURCE: CBEDS census, October 2008. County and state averages represent high schools only.
KEY FACTOROUR
SCHOOLDISTRICTAVERAGE
STATEAVERAGE
Suspensions per 100 students
2008–2009 25 24 16
2007–2008 36 26 17
2006–2007 31 29 15
Expulsions per 100 students
2008–2009 1 1 1
2007–2008 0 0 1
2006–2007 1 1 1
SOURCE: Data is from the California Department of Education, SARC research file. Data represents the number of incidents reported, not the number of students involved. District and state averages represent high schools only.
Oceanside Unified School District

Oceanside High School School Accountability Report Card for 2008–2009 Page 23
Site Council, which always includes parent members. Parents also serve as members of our English Language Advisory Committee, which oversees the budget for our English Learner program. This year we began using a new computer program called School Loop, whereby parents can log on and check their children’s assignments and grades. We encourage parents who are interested in learning more about volunteer opportunities to contact Juli Coleman at (760) 722-8201.
Oceanside Unified School District

Oceanside High School School Accountability Report Card for 2008–2009 Page 24
LeadershipKimo Marquardt has been the principal of our school for eight years. He has been an administrator for 16 years and a teacher for six. As an Oceanside High School graduate, he works hard to maintain the strong tradition and academic excellence of his alma mater.
Our administrative team includes a principal, a coordinator, and two assistant principals. Teachers bring their concerns to the Relations by Objectives Team, which works to resolve any issues that have been brought forward. Our School Site Council includes the principal, parents, and faculty. It makes decisions about school goals and visions, and helps allocate resources to ensure that those goals are achieved. The English Language Advisory Committee (ELAC), which includes parents and administrators, meets regularly to discuss issues related to English Learners.
About eight percent of our teachers have fewer than three years of teaching experience, which is below the average for new teachers in other high schools in California. Our teachers have, on average, 12 years of experience. About 66 percent of our teachers hold only a bachelor’s degree from a four-year college or university. About 34 percent have completed a master’s degree or higher.
LEADERSHIP, TEACHERS, AND STAFF
Teacher Experience and Education
KEY FACTOR DESCRIPTIONOUR
SCHOOLCOUNTYAVERAGE
STATEAVERAGE
Teaching experience Average years of teaching experience 12% 13% 13%
Newer teachers Percentage of teachers with one or two years of teaching experience
8% 11% 12%
Teachers holding an MA degree or higher
Percentage of teachers with an MA or higher from a graduate school
34% 48% 41%
Teachers holding a BA degree alone
Percentage of teachers whose highest degree is a BA degree from a four-year college
66% 52% 59%
SOURCE: Professional Assignment Information Form (PAIF), October 2008, completed by teachers during the CBEDS census. County and state averages represent high schools only.
Oceanside Unified School District
Oceanside High School School Accountability Report Card for 2008–2009 Page 25
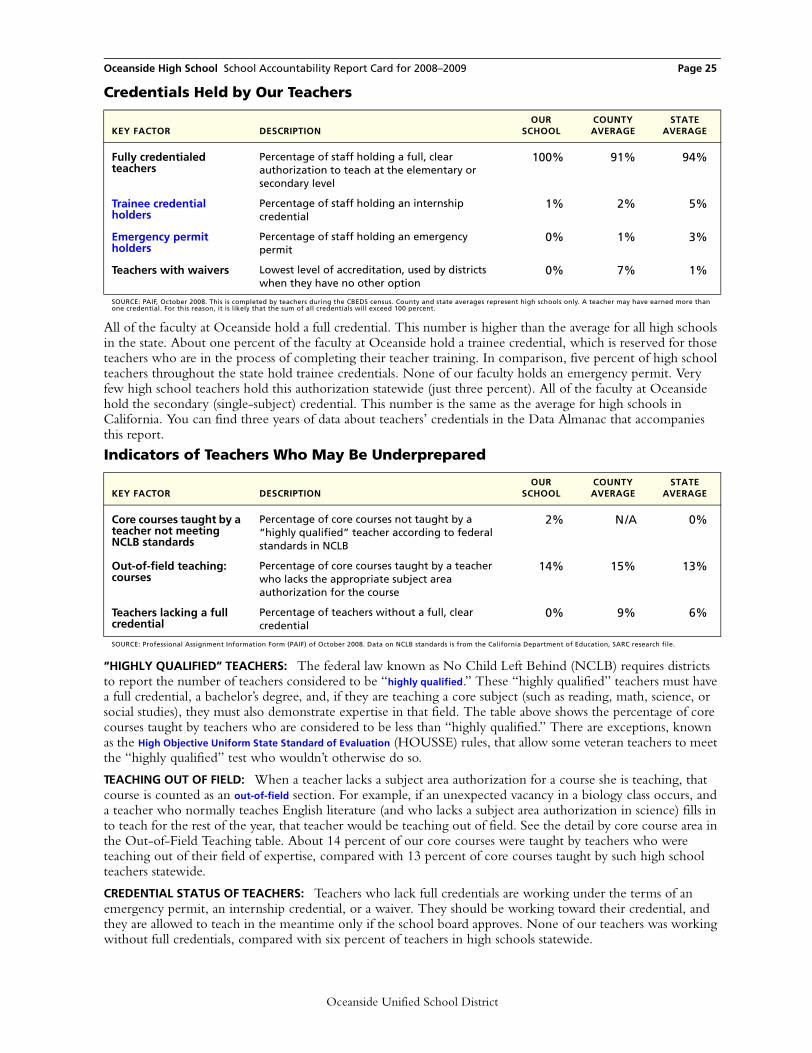
All of the faculty at Oceanside hold a full credential. This number is higher than the average for all high schools in the state. About one percent of the faculty at Oceanside hold a trainee credential, which is reserved for those teachers who are in the process of completing their teacher training. In comparison, five percent of high school teachers throughout the state hold trainee credentials. None of our faculty holds an emergency permit. Very few high school teachers hold this authorization statewide (just three percent). All of the faculty at Oceanside hold the secondary (single-subject) credential. This number is the same as the average for high schools in California. You can find three years of data about teachers’ credentials in the Data Almanac that accompanies this report.
“HIGHLY QUALIFIED” TEACHERS: The federal law known as No Child Left Behind (NCLB) requires districts to report the number of teachers considered to be “highly qualified.” These “highly qualified” teachers must have a full credential, a bachelor’s degree, and, if they are teaching a core subject (such as reading, math, science, or social studies), they must also demonstrate expertise in that field. The table above shows the percentage of core courses taught by teachers who are considered to be less than “highly qualified.” There are exceptions, known as the High Objective Uniform State Standard of Evaluation (HOUSSE) rules, that allow some veteran teachers to meet the “highly qualified” test who wouldn’t otherwise do so.
TEACHING OUT OF FIELD: When a teacher lacks a subject area authorization for a course she is teaching, that course is counted as an out-of-field section. For example, if an unexpected vacancy in a biology class occurs, and a teacher who normally teaches English literature (and who lacks a subject area authorization in science) fills in to teach for the rest of the year, that teacher would be teaching out of field. See the detail by core course area in the Out-of-Field Teaching table. About 14 percent of our core courses were taught by teachers who were teaching out of their field of expertise, compared with 13 percent of core courses taught by such high school teachers statewide.
CREDENTIAL STATUS OF TEACHERS: Teachers who lack full credentials are working under the terms of an emergency permit, an internship credential, or a waiver. They should be working toward their credential, and they are allowed to teach in the meantime only if the school board approves. None of our teachers was working without full credentials, compared with six percent of teachers in high schools statewide.
Credentials Held by Our Teachers
KEY FACTOR DESCRIPTIONOUR
SCHOOLCOUNTYAVERAGE
STATEAVERAGE
Fully credentialed teachers
Percentage of staff holding a full, clear authorization to teach at the elementary or secondary level
100% 91% 94%
Trainee credential holders
Percentage of staff holding an internship credential
1% 2% 5%
Emergency permit holders
Percentage of staff holding an emergency permit
0% 1% 3%
Teachers with waivers Lowest level of accreditation, used by districts when they have no other option
0% 7% 1%
SOURCE: PAIF, October 2008. This is completed by teachers during the CBEDS census. County and state averages represent high schools only. A teacher may have earned more than one credential. For this reason, it is likely that the sum of all credentials will exceed 100 percent.
Indicators of Teachers Who May Be Underprepared
KEY FACTOR DESCRIPTIONOUR
SCHOOLCOUNTYAVERAGE
STATEAVERAGE
Core courses taught by a teacher not meeting NCLB standards
Percentage of core courses not taught by a “highly qualified” teacher according to federal standards in NCLB
2% N/A 0%
Out-of-field teaching: courses
Percentage of core courses taught by a teacher who lacks the appropriate subject area authorization for the course
14% 15% 13%
Teachers lacking a full credential
Percentage of teachers without a full, clear credential
0% 9% 6%
SOURCE: Professional Assignment Information Form (PAIF) of October 2008. Data on NCLB standards is from the California Department of Education, SARC research file.
Oceanside Unified School District

Oceanside High School School Accountability Report Card for 2008–2009 Page 26
The table above shows the distribution of out-of-field teaching in each of the core subject areas. Please refer to the Data Almanac at the end of this report for data from the past three years.
More facts about our teachers, called for by the Williams legislation of 2004, are available on our Accountability Web page, which is accessible from our district Web site. You will find specific facts about misassigned teachers
and teacher vacancies in the 2009–2010 school year.
Districtwide Distribution of Teachers Who Are Not “Highly Qualified”Here, we report the percentage of core courses in our district whose teachers are considered to be less than “highly qualified” by NCLB’s standards. We show how these teachers are distributed among schools according to the percentage of low-income students enrolled.
The CDE has divided schools in the state into four groups (quartiles), based on the percentage of families who qualify and apply for free or reduced-price lunches. The one-fourth of schools with the most students receiving subsidized lunches are assigned to the first group. The one-fourth of schools with the fewest students receiving subsidized lunches are assigned to the fourth group. We compare the courses and teachers assigned to each of these groups of schools to see how they differ in “highly qualified” teacher assignments.
The average percentage of courses in our district not taught by a “highly qualified” teacher is three percent, compared with one percent statewide. For schools with the highest percentage of low-income students, this factor is zero percent, compared with zero percent statewide. For schools with the lowest percentage of low-income students, this factor is zero percent, compared with zero percent statewide.
Out-of-Field Teaching, Detail by Selected Subject Areas
CORE COURSE DESCRIPTIONOUR
SCHOOLCOUNTYAVERAGE
STATEAVERAGE
English Percentage of English courses taught by a teacher lacking the appropriate subject area authorization
9% 11% 11%
Math Percentage of math courses taught by a teacher lacking the appropriate subject area authorization
28% 15% 12%
Science Percentage of science courses taught by a teacher lacking the appropriate subject area authorization
10% 17% 16%
Social Science Percentage of social science courses taught by a teacher lacking the appropriate subject area authorization
10% 16% 17%
SOURCE: PAIF, October 2008. This is completed by teachers during the CBEDS census. County and state averages represent high schools only.
DISTRICT FACTOR DESCRIPTION
CORE COURSES
NOT TAUGHT BY
HQT IN DISTRICT
Districtwide Percentage of core courses not taught by “highly qualified” teachers (HQT)
3%
Schools with the most low-income students
First quartile of schools whose core courses are not taught by “highly qualified” teachers
0%
Schools with the fewest low-income students
Fourth quartile of schools whose core courses are not taught by “highly qualified” teachers
0%
SOURCE: Data is from the California Department of Education, SARC research file.
Oceanside Unified School District
Oceanside High School School Accountability Report Card for 2008–2009 Page 27
Staff DevelopmentThis year many of our teachers participated in intensive staff development provided by our site staff trainer. Our teachers receive training in all core areas to improve instructional strategies and student achievement, especially for students falling behind. The focus of staff training this year is on creating professional learning communities, a system that encourages teachers and the principal to continuously seek and share learning and then act on what they learn. Each Monday one hour is devoted to teacher collaboration based on the ideals of the professional learning communities.
Evaluating and Improving TeachersEach year, teachers set goals for themselves individually and as a group. Teacher evaluations are based on these goals, student performance on state tests, observation of teaching techniques, and the national and state teaching standards. We evaluate tenured teachers every other year and nontenured teachers annually. We assign a mentor to teachers who have been identified as needing extra help and also provide them with opportunities to take additional training courses.
Substitute TeachersOur district is fortunate to have a pool of qualified substitute teachers. When we cannot find a substitute for a class, the athletic director, assistant principal, curriculum coordinator, or principal steps in to teach. In some cases, a colleague will cover a class during a preparation period.
Specialized Resource StaffOur school may employ social workers, speech and hearing specialists, school psychologists, nurses, and technology specialists. These specialists often work part time at our school and some may work at more than one school in our district. Their schedules will change as our students’ needs change. For these reasons, the staffing counts you see here may differ from the staffing provided today in this school. For more details on statewide ratios of counselors, psychologists, or other pupil
services staff to students, see the California Department of Education (CDE) Web site. Library facts and frequently asked questions are also available there.
ACADEMIC GUIDANCE COUNSELORS: Our school has six full-time equivalent academic counselors, which is equivalent to one counselor for every 403 students. Just for reference, California districts employed about one academic counselor for every 412 high school students in the state. More information about counseling and student support is available on the CDE Web site.
YEARPROFESSIONAL
DEVELOPMENT DAYS
2008–2009 2.0
2007–2008 2.0
2006–2007 2.0
SOURCE: This information is supplied by the school district.
STAFF POSITIONSTAFF (FTE)
Counselors 6.4
Librarians 1.0
Psychologists 2.0
Social workers 0.0
Nurses 1.0
Speech/language/hearing specialists
1.0
Resource specialists 0.0
SOURCE: CBEDS census, October 2008.
Oceanside Unified School District
Oceanside High School School Accountability Report Card for 2008–2009 Page 28
Specialized Programs and StaffFive full-time guidance counselors, supported by a full-time guidance technician and secretary, help students plan for college and careers after graduation. We also have a College and Career Center that is staffed by one full-time technician. Students benefit from the services of a full-time librarian, a part-time school nurse, a full-time health clerk, and a part-time speech and language therapist. We also have two psychologists at our school.
GIFTED AND TALENTED EDUCATION (GATE): We offer a variety of programs and courses for GATE students. We also offer AP classes in English, math, social studies/history, art, and science.
SPECIAL EDUCATION PROGRAM: We offer a wide range of special education programs on our campus. Students are placed in a program based on their Individualized Education Program (IEP). It is our goal to include students in regular classrooms to the fullest extent possible.
ENGLISH LEARNER PROGRAM: Our program for English Learners has two primary goals: rapid acquisition of English and full access to required core content. All of our teachers who work with English Learners have been trained and fully credentialed. We have a School Community Advisory that serves as a liaison to our Spanish-speaking community. Our English Language Appraisal Team meets regularly to monitor student progress and provide necessary support for students who are not making progress.
Oceanside Unified School District

Oceanside High School School Accountability Report Card for 2008–2009 Page 29
BuildingsWe began comprehensive modernization and new construction of our school during the 2001–2002 school year. Modernization of the school’s gymnasium and locker rooms was completed in December 2005. Last year the Oceanside community passed a bond to build a new stadium and theater at OHS. A construction academy will also be built.
More facts about the condition of our school buildings are available in an online supplement to this report called for by the Williams legislation of 2004. What you will find is an assessment of more than a dozen aspects of our buildings: their structural integrity, electrical systems, heating and ventilation systems, and more. The important purpose of this assessment is to determine if our buildings and grounds are safe and in good repair. If anything needs to be repaired, this assessment identifies it and targets a date by which we commit to make those repairs. The guidelines for this assessment were written by the Office of Public School Construction (OPSC) and were brought about by the Williams legislation. You can look at the six-page Facilities Inspection Tool used for the assessment on the Web site of the OPSC.
LibraryThe school’s library was fully modernized in the 2001–2002 school year; it houses 34 Internet-connected computers for student use. It is staffed by a full-time librarian and a full-time library/media services clerk. During the school day, the library is available for classroom orientations, class visits, and small groups of students sent by their teachers. The library is also available before school, during lunch, and after school.
ComputersAll teachers on our campus have access to their own computers. Teachers use Grade Pro, Microsoft Word, Excel, PowerPoint, and other related software programs to track student progress and plan lessons. A school Web site is maintained by one of the teachers.
TextbooksWe choose our textbooks from lists that have already been approved by state education officials. For a list of some of the textbooks we use at our school, see the Data Almanac that accompanies this report.
We have also reported additional facts about our textbooks called for by the Williams legislation of 2004. This online report shows whether we had a textbook for each student in each core course during the 2009–2010 school year and whether those textbooks covered the California Content Standards.
CurriculumFor more than six years, panels of scholars have decided what California students should learn and be able to do. Their decisions are known as the California Content Standards, and they apply to all public schools in the state. The textbooks we use and the tests we give are based on these content standards, and we expect our teachers to be firmly focused on them. Policy experts, researchers, and educators consider our state’s standards to be among the most rigorous and challenging in the nation.
You can find the content standards for each subject at each grade level on the Web site of the California Department of Education (CDE).
Science LabsFacts about our science labs, called for by the Williams legislation, are available from the following link. What you will find is whether we had sufficient lab equipment and materials for our science lab courses during the 2009–2010 school year.
RESOURCES
Oceanside Unified School District

Oceanside High School School Accountability Report Card for 2008–2009 Page 30
Oceanside High School qualifies for federal and state funds for academic improvement as a Title I school. Approximately $288,000 in federal funds was made available to the school in 2008–2009 for programs for low-income students. In addition to these funds, the school’s PTSO, Oceanside Rotary Club, Target, Office Depot, and the Girard Prep Foundation made donations to our school.
Spending per Student (2007–2008)To make comparisons possible across schools and districts of varying sizes, we first report our overall spending per student. We base our calculations on our average daily attendance (ADA), which was 1,923 students.
We’ve broken down expenditures by the type of funds used to pay for them. Unrestricted funds can be used for any lawful purpose. Restricted funds, however, must be spent for specific purposes set out by legal requirements or the donor. Examples include funding for instructional materials, economic impact aid, and teacher- and principal-training funds.
Total Expenditures, by Category (2007–2008)Here you can see how much we spent on different categories of expenses. We’re reporting the total dollars in each category, not spending per student.
SCHOOL EXPENDITURES
TYPE OF FUNDS OUR SCHOOLDISTRICT AVERAGE
SCHOOL VARIANCE
STATE AVERAGE
SCHOOL VARIANCE
Unrestricted funds ($/student) $5,203 $6,344 -18% $5,495 -5%
Restricted funds ($/student) $677 $3,030 -78% $3,099 -78%
TOTAL ($/student) $5,880 $9,374 -37% $8,594 -32%
SOURCE: Information provided by the school district.
CATEGORYUNRESTRICTED
FUNDSRESTRICTED
FUNDS TOTALPERCENTAGE OF
TOTAL*
Teacher salaries $6,565,480 $441,118 $7,006,598 62%
Other staff salaries $1,251,687 $121,587 $1,373,274 12%
Benefits $1,806,464 $118,436 $1,924,900 17%
Books and supplies $142,020 $523,531 $665,552 6%
Equipment replacement N/A N/A N/A N/A
Services and direct support $240,926 $96,987 $337,913 3%
TOTAL $10,006,577 $1,301,659 $11,308,236
SOURCE: Information provided by the school district. * Totals may not add up to exactly 100% because of rounding.
Oceanside Unified School District
Oceanside High School School Accountability Report Card for 2008–2009 Page 31
Compensation per Staff with Teaching Credentials (2007–2008)The total of what our certificated staff members earn appears below. A certificated staff person is a school employee who is required by the state to hold teaching credentials, including full-time, part-time, substitute or temporary teachers, and most administrators. You can see the portion of pay that goes to salary and three types of benefits.
To make comparisons possible across schools and districts of varying sizes, we first report our compensation per full-time equivalent (FTE) certificated staff member. A teacher/administrator/pupil services person who works full time counts as 1.0 FTE. Those who work only half time count as 0.5 FTE. We had 82 FTE teachers working in our school.
Total Certificated Staff Compensation (2007–2008)Here you can see how much we spent on different categories of compensation. We’re reporting the total dollars in each category, not compensation per staff member.
CATEGORY OUR SCHOOLDISTRICT AVERAGE
SCHOOL VARIANCE
STATE AVERAGE
SCHOOL VARIANCE
Salaries $67,028 $72,177 -7% $69,840 -4%
Retirement benefits $6,957 $7,184 -3% $6,876 1%
Health and medical benefits $8,096 $8,308 -3% $10,978 -26%
Other benefits $2,674 $2,803 -5% $453 490%
TOTAL $84,755 $90,472 -6% $88,147 -4%
SOURCE: Information provided by the school district.
CATEGORY TOTALPERCENTAGE OF TOTAL*
Salaries $5,509,740 79%
Retirement benefits $571,845 8%
Health and medical benefits $665,482 10%
Other benefits $219,828 3%
TOTAL $6,966,896
SOURCE: Information provided by the school district. * Totals may not add up to exactly 100% because of rounding.
TECHNICAL NOTE ON DATA RECENCY: All data is the most current available as of December 2009. The CDE may releaseadditional or revised data for the 2008–2009 school year after the publication date of this report. We rely on the followingsources of information from the California Department of Education: California Basic Education Data System (CBEDS) (Octo-ber 2008 census); Language Census (March 2009); California Achievement Test and California Standards Tests (spring 2009 testcycle); Academic Performance Index (September 2009 growth score release); Adequate Yearly Progress (September 2009). DISCLAIMER: School Wise Press, the publisher of this accountability report, makes every effort to ensure the accuracy of thisinformation but offers no guarantee, express or implied. While we do our utmost to ensure the information is complete, wemust note that we are not responsible for any errors or omissions in the data. Nor are we responsible for any damages caused bythe use of the information this report contains. Before you make decisions based on this information, we strongly recommendthat you visit the school and ask the principal to provide the most up-to-date facts available.
rev20091216_37-73569-3735206h/21375
Oceanside Unified School District

Oceanside High School School Accountability Report Card for 2008–2009
»
Page 33
Adequacy of Key Resources
Here you’ll find key facts about our teachers, textbooks, and facilities during the school year in progress, 2009–2010. Please note that these facts are based on evaluations our staff conducted in accordance with the Williams legislation.
Oceanside Unified School District
Oceanside High School School Accountability Report Card for 2008–2009
Oceanside Unified School District
TEACHERS
Teacher Vacancies
The Williams legislation asked districts to disclose how frequently full-time teachers were not permanently assigned to a classroom. There are two general circumstances that can lead to the unfortunate case of a classroom without a full-time, permanently assigned teacher. Within the first 20 days of the start of school, we can be surprised by too many students showing up for school, or too few teachers showing up to teach. After school starts, however, teachers can also be surprised by sudden changes: family emergencies, injuries, accidents, etc. When that occurs, it is our school’s and our district’s responsibility to fill that teacher’s vacancy with a qualified, full-time and permanently assigned replacement. For that reason, we report teacher vacancies in two parts: at the start of school, and after the start of school.
KEY FACTOR 2007–2008 2008–2009 2009–2010
TEACHER VACANCIES OCCURRING AT THE BEGINNING OF THE SCHOOL YEAR
Total number of classes at the start of the year 485 460 484
Number of classes which lacked a permanently assigned teacher within the first 20 days of school
0 0 5
TEACHER VACANCIES OCCURRING DURING THE SCHOOL YEAR
Number of classes where the permanently assigned teacher left during the year
2 0 5
Number of those classes where you replaced the absent teacher with a single new teacher
1 0 0
NOTES: This report was completed on Wednesday, January 27, 2010.
Page 34
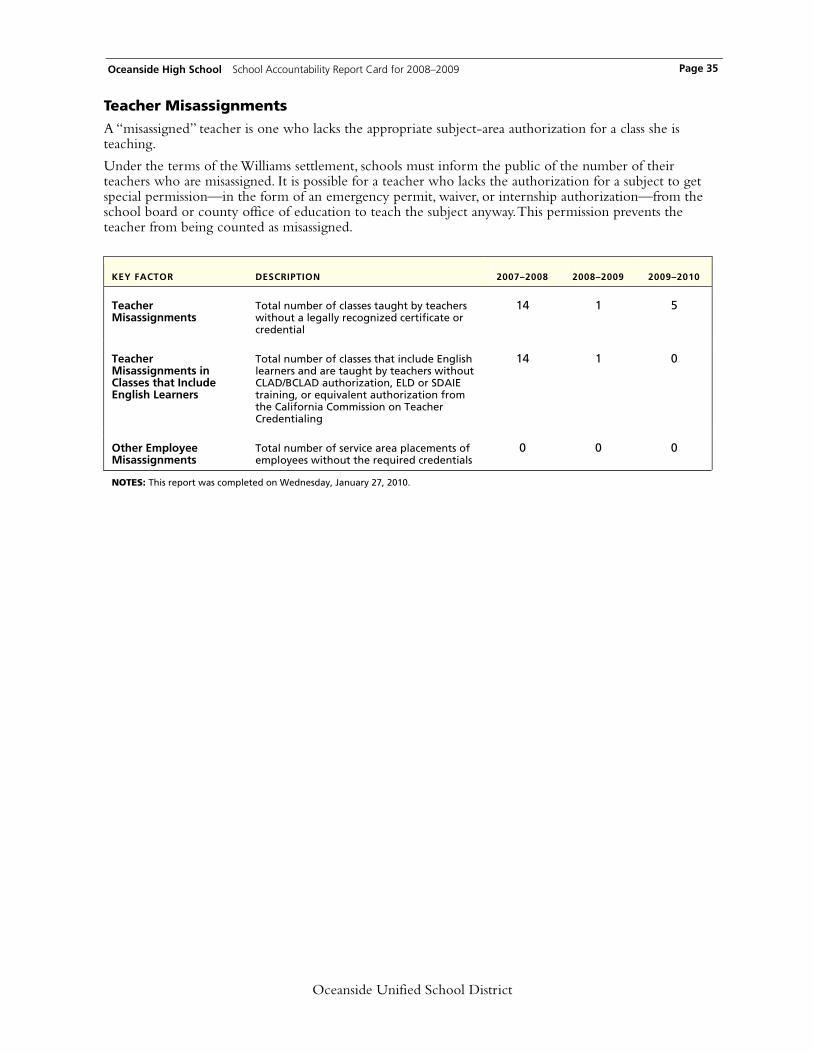
Oceanside High School School Accountability Report Card for 2008–2009
Oceanside Unified School District
Teacher Misassignments
A “misassigned” teacher is one who lacks the appropriate subject-area authorization for a class she is teaching.
Under the terms of the Williams settlement, schools must inform the public of the number of their teachers who are misassigned. It is possible for a teacher who lacks the authorization for a subject to get special permission—in the form of an emergency permit, waiver, or internship authorization—from the school board or county office of education to teach the subject anyway. This permission prevents the teacher from being counted as misassigned.
KEY FACTOR DESCRIPTION 2007–2008 2008–2009 2009–2010
Teacher Misassignments
Total number of classes taught by teachers without a legally recognized certificate or credential
14 1 5
Teacher Misassignments in Classes that Include English Learners
Total number of classes that include English learners and are taught by teachers without CLAD/BCLAD authorization, ELD or SDAIE training, or equivalent authorization from the California Commission on Teacher Credentialing
14 1 0
Other Employee Misassignments
Total number of service area placements of employees without the required credentials
0 0 0
NOTES: This report was completed on Wednesday, January 27, 2010.
Page 35

Oceanside High School School Accountability Report Card for 2008–2009
Oceanside Unified School District
TEXTBOOKS
The main fact about textbooks that the Williams legislation calls for described whether schools have enough books in core classes for all students. The law also asks districts to reveal whether those books are presenting what the California content standards calls for. This information is far more meaningful when viewed along with the more detailed description of textbooks contained in our School Accountability Report Card (SARC). There you’ll find the names of the textbooks used in our core classes, their dates of publication, the names of the firms that published them, and more.
ARE THERE TEXTBOOKS OR INSTRUCTIONAL MATERIALS IN USE?
ARE THERE ENOUGH BOOKS FOR EACH STUDENT?
SUBJECT STANDARDS ALIGNED?
OFFICIALLY ADOPTED? FOR USE IN CLASS?
PERCENTAGE OF STUDENTS HAVING
BOOKS TO TAKE HOME?
English Yes Yes Yes 100%
Math Yes Yes Yes 100%
Science Yes Yes Yes 100%
Social Studies Yes Yes Yes 100%
Foreign Languages Yes Yes Yes 100%
Health Sciences Yes Yes Yes 100%
Visual and Performing Arts
No No No N/A
NOTES: This report was completed on Friday, January 15, 2010. This information was collected on Friday, January 15, 2010.
Page 36
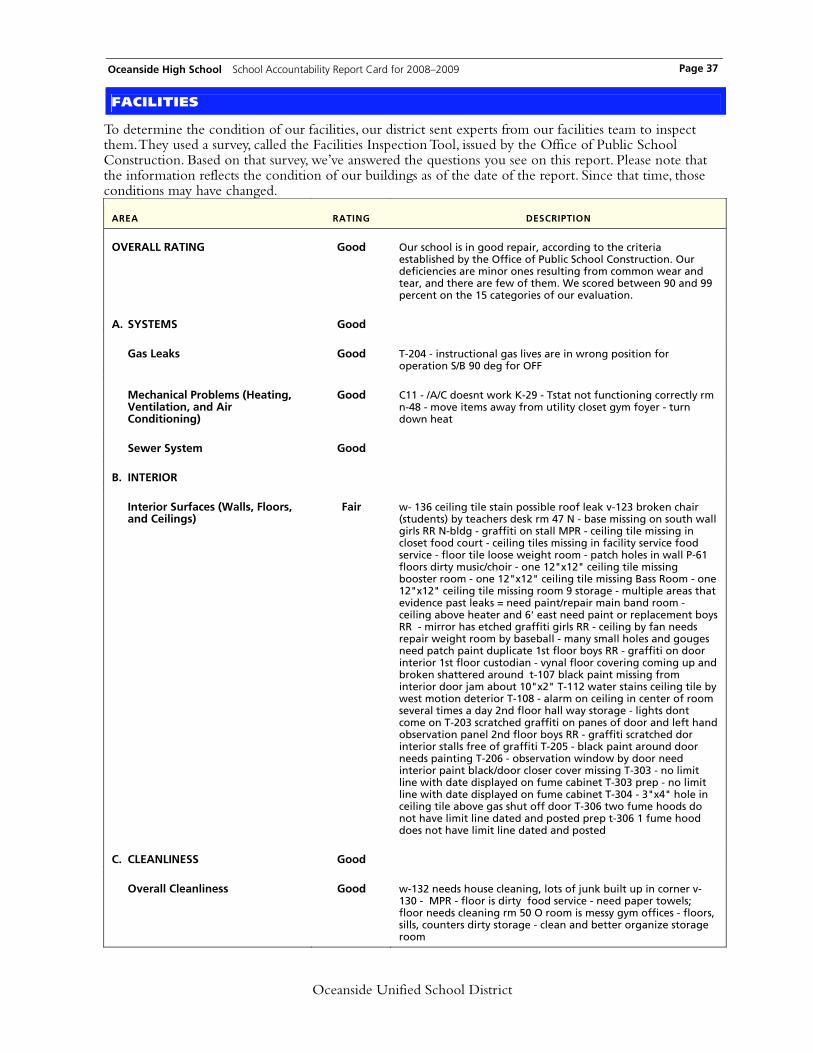
Oceanside High School School Accountability Report Card for 2008–2009
Oceanside Unified School District
FACILITIES
To determine the condition of our facilities, our district sent experts from our facilities team to inspect them. They used a survey, called the Facilities Inspection Tool, issued by the Office of Public School Construction. Based on that survey, we’ve answered the questions you see on this report. Please note that the information reflects the condition of our buildings as of the date of the report. Since that time, those conditions may have changed.
AREA RATING DESCRIPTION
OVERALL RATING Good Our school is in good repair, according to the criteria established by the Office of Public School Construction. Our deficiencies are minor ones resulting from common wear and tear, and there are few of them. We scored between 90 and 99 percent on the 15 categories of our evaluation.
A. SYSTEMS Good
Gas Leaks Good T-204 - instructional gas lives are in wrong position for operation S/B 90 deg for OFF
Mechanical Problems (Heating, Ventilation, and Air Conditioning)
Good C11 - /A/C doesnt work K-29 - Tstat not functioning correctly rm n-48 - move items away from utility closet gym foyer - turn down heat
Sewer System Good
B. INTERIOR
Interior Surfaces (Walls, Floors, and Ceilings)
Fair w- 136 ceiling tile stain possible roof leak v-123 broken chair (students) by teachers desk rm 47 N - base missing on south wall girls RR N-bldg - graffiti on stall MPR - ceiling tile missing in closet food court - ceiling tiles missing in facility service food service - floor tile loose weight room - patch holes in wall P-61 floors dirty music/choir - one 12"x12" ceiling tile missing booster room - one 12"x12" ceiling tile missing Bass Room - one 12"x12" ceiling tile missing room 9 storage - multiple areas that evidence past leaks = need paint/repair main band room - ceiling above heater and 6' east need paint or replacement boys RR - mirror has etched graffiti girls RR - ceiling by fan needs repair weight room by baseball - many small holes and gouges need patch paint duplicate 1st floor boys RR - graffiti on door interior 1st floor custodian - vynal floor covering coming up and broken shattered around t-107 black paint missing from interior door jam about 10"x2" T-112 water stains ceiling tile by west motion deterior T-108 - alarm on ceiling in center of room several times a day 2nd floor hall way storage - lights dont come on T-203 scratched graffiti on panes of door and left hand observation panel 2nd floor boys RR - graffiti scratched dor interior stalls free of graffiti T-205 - black paint around door needs painting T-206 - observation window by door need interior paint black/door closer cover missing T-303 - no limit line with date displayed on fume cabinet T-303 prep - no limit line with date displayed on fume cabinet T-304 - 3"x4" hole in ceiling tile above gas shut off door T-306 two fume hoods do not have limit line dated and posted prep t-306 1 fume hood does not have limit line dated and posted
C. CLEANLINESS Good
Overall Cleanliness Good w-132 needs house cleaning, lots of junk built up in corner v-130 - MPR - floor is dirty food service - need paper towels; floor needs cleaning rm 50 O room is messy gym offices - floors, sills, counters dirty storage - clean and better organize storage room
Page 37
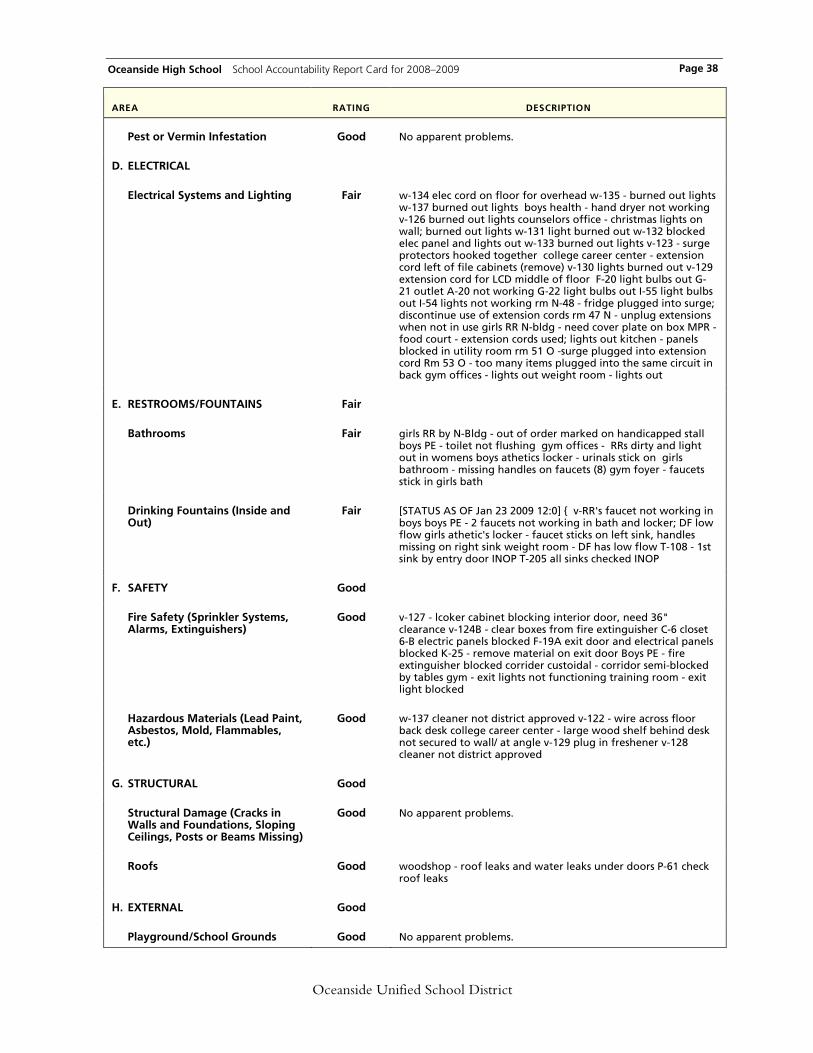
Oceanside High School School Accountability Report Card for 2008–2009
Oceanside Unified School District
AREA RATING DESCRIPTION
Pest or Vermin Infestation Good No apparent problems.
D. ELECTRICAL
Electrical Systems and Lighting Fair w-134 elec cord on floor for overhead w-135 - burned out lights w-137 burned out lights boys health - hand dryer not working v-126 burned out lights counselors office - christmas lights on wall; burned out lights w-131 light burned out w-132 blocked elec panel and lights out w-133 burned out lights v-123 - surge protectors hooked together college career center - extension cord left of file cabinets (remove) v-130 lights burned out v-129 extension cord for LCD middle of floor F-20 light bulbs out G-21 outlet A-20 not working G-22 light bulbs out I-55 light bulbs out I-54 lights not working rm N-48 - fridge plugged into surge; discontinue use of extension cords rm 47 N - unplug extensions when not in use girls RR N-bldg - need cover plate on box MPR - food court - extension cords used; lights out kitchen - panels blocked in utility room rm 51 O -surge plugged into extension cord Rm 53 O - too many items plugged into the same circuit in back gym offices - lights out weight room - lights out
E. RESTROOMS/FOUNTAINS Fair
Bathrooms Fair girls RR by N-Bldg - out of order marked on handicapped stall boys PE - toilet not flushing gym offices - RRs dirty and light out in womens boys athetics locker - urinals stick on girls bathroom - missing handles on faucets (8) gym foyer - faucets stick in girls bath
Drinking Fountains (Inside and Out)
Fair [STATUS AS OF Jan 23 2009 12:0] { v-RR's faucet not working in boys boys PE - 2 faucets not working in bath and locker; DF low flow girls athetic's locker - faucet sticks on left sink, handles missing on right sink weight room - DF has low flow T-108 - 1st sink by entry door INOP T-205 all sinks checked INOP
F. SAFETY Good
Fire Safety (Sprinkler Systems, Alarms, Extinguishers)
Good v-127 - lcoker cabinet blocking interior door, need 36" clearance v-124B - clear boxes from fire extinguisher C-6 closet 6-B electric panels blocked F-19A exit door and electrical panels blocked K-25 - remove material on exit door Boys PE - fire extinguisher blocked corrider custoidal - corridor semi-blocked by tables gym - exit lights not functioning training room - exit light blocked
Hazardous Materials (Lead Paint, Asbestos, Mold, Flammables, etc.)
Good w-137 cleaner not district approved v-122 - wire across floor back desk college career center - large wood shelf behind desk not secured to wall/ at angle v-129 plug in freshener v-128 cleaner not district approved
G. STRUCTURAL Good
Structural Damage (Cracks in Walls and Foundations, Sloping Ceilings, Posts or Beams Missing)
Good No apparent problems.
Roofs Good woodshop - roof leaks and water leaks under doors P-61 check roof leaks
H. EXTERNAL Good
Playground/School Grounds Good No apparent problems.
Page 38
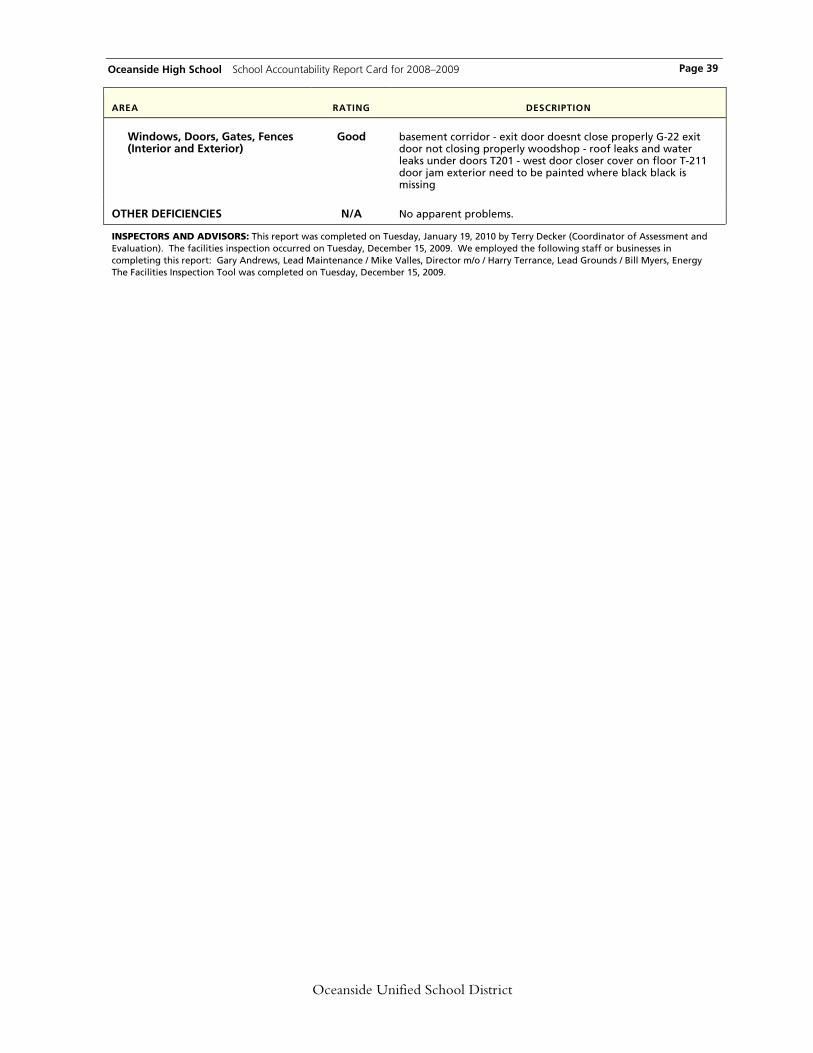
Oceanside High School School Accountability Report Card for 2008–2009
Oceanside Unified School District
AREA RATING DESCRIPTION
Windows, Doors, Gates, Fences (Interior and Exterior)
Good basement corridor - exit door doesnt close properly G-22 exit door not closing properly woodshop - roof leaks and water leaks under doors T201 - west door closer cover on floor T-211 door jam exterior need to be painted where black black is missing
OTHER DEFICIENCIES N/A No apparent problems.
INSPECTORS AND ADVISORS: This report was completed on Tuesday, January 19, 2010 by Terry Decker (Coordinator of Assessment and Evaluation). The facilities inspection occurred on Tuesday, December 15, 2009. We employed the following staff or businesses in completing this report: Gary Andrews, Lead Maintenance / Mike Valles, Director m/o / Harry Terrance, Lead Grounds / Bill Myers, Energy The Facilities Inspection Tool was completed on Tuesday, December 15, 2009.
Page 39
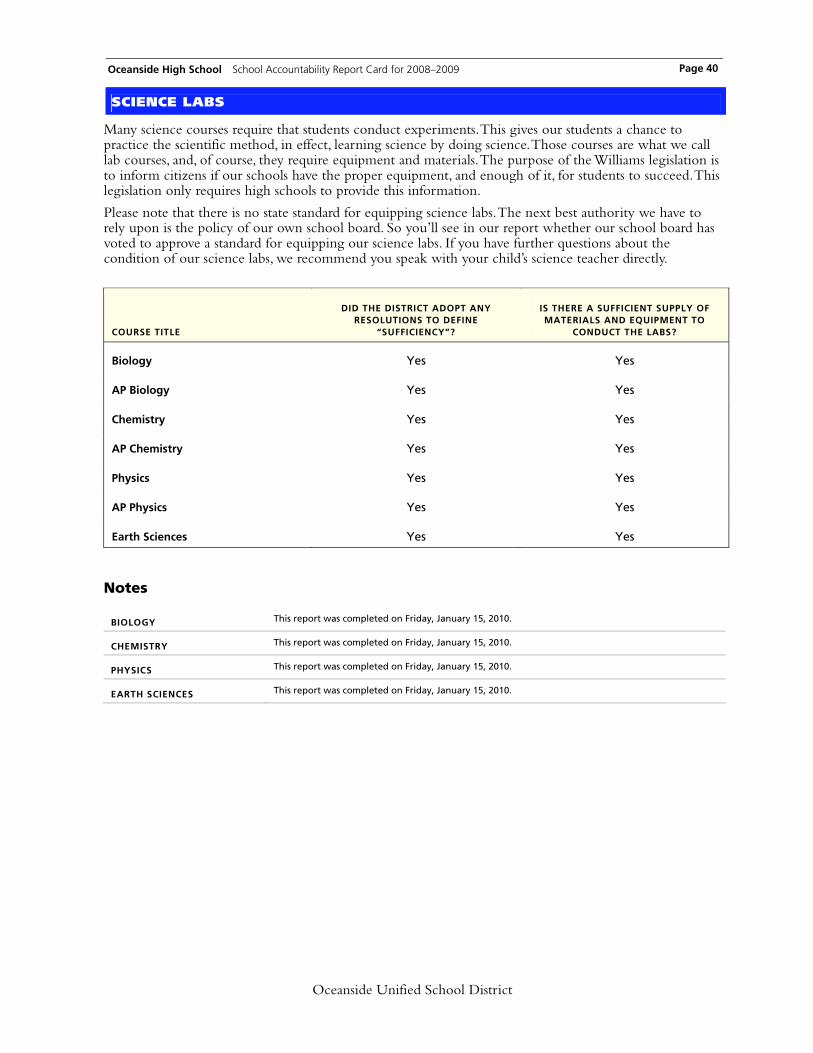
Oceanside High School School Accountability Report Card for 2008–2009
Oceanside Unified School District
SCIENCE LABS
Many science courses require that students conduct experiments. This gives our students a chance to practice the scientific method, in effect, learning science by doing science. Those courses are what we call lab courses, and, of course, they require equipment and materials. The purpose of the Williams legislation is to inform citizens if our schools have the proper equipment, and enough of it, for students to succeed. This legislation only requires high schools to provide this information.
Please note that there is no state standard for equipping science labs. The next best authority we have to rely upon is the policy of our own school board. So you’ll see in our report whether our school board has voted to approve a standard for equipping our science labs. If you have further questions about the condition of our science labs, we recommend you speak with your child’s science teacher directly.
COURSE TITLE
DID THE DISTRICT ADOPT ANY RESOLUTIONS TO DEFINE
“SUFFICIENCY”?
IS THERE A SUFFICIENT SUPPLY OF MATERIALS AND EQUIPMENT TO
CONDUCT THE LABS?
Biology Yes Yes
AP Biology Yes Yes
Chemistry Yes Yes
AP Chemistry Yes Yes
Physics Yes Yes
AP Physics Yes Yes
Earth Sciences Yes Yes
Notes
BIOLOGY This report was completed on Friday, January 15, 2010.
CHEMISTRY This report was completed on Friday, January 15, 2010.
PHYSICS This report was completed on Friday, January 15, 2010.
EARTH SCIENCES This report was completed on Friday, January 15, 2010.
Page 40
Oceanside High School School Accountability Report Card for 2008–2009
»
Page 41
Data Almanac
This Data Almanac provides more-detailed information than the School Accountability Report Card as well as data that covers a period of more than one year. It presents the facts and statistics in tables without narrative text.
Oceanside Unified School District
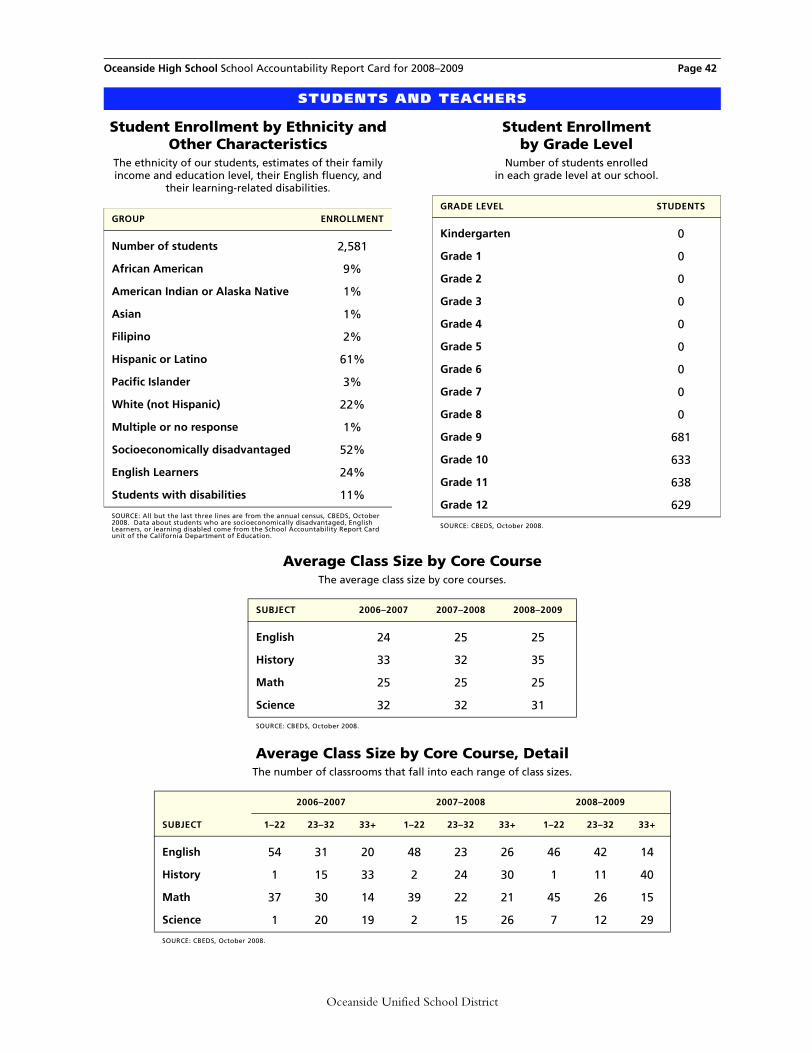
Oceanside High School School Accountability Report Card for 2008–2009 Page 42
Average Class Size by Core CourseThe average class size by core courses.
Average Class Size by Core Course, DetailThe number of classrooms that fall into each range of class sizes.
STUDENTS AND TEACHERS
Student Enrollment by Ethnicity and Other Characteristics
The ethnicity of our students, estimates of their family income and education level, their English fluency, and
their learning-related disabilities.
Student Enrollment by Grade Level
Number of students enrolled in each grade level at our school.
SUBJECT 2006–2007 2007–2008 2008–2009
English 24 25 25
History 33 32 35
Math 25 25 25
Science 32 32 31
SOURCE: CBEDS, October 2008.
2006–2007 2007–2008 2008–2009
SUBJECT 1–22 23–32 33+ 1–22 23–32 33+ 1–22 23–32 33+
English 54 31 20 48 23 26 46 42 14
History 1 15 33 2 24 30 1 11 40
Math 37 30 14 39 22 21 45 26 15
Science 1 20 19 2 15 26 7 12 29
SOURCE: CBEDS, October 2008.
GROUP ENROLLMENT
Number of students 2,581
African American 9%
American Indian or Alaska Native 1%
Asian 1%
Filipino 2%
Hispanic or Latino 61%
Pacific Islander 3%
White (not Hispanic) 22%
Multiple or no response 1%
Socioeconomically disadvantaged 52%
English Learners 24%
Students with disabilities 11%
SOURCE: All but the last three lines are from the annual census, CBEDS, October 2008. Data about students who are socioeconomically disadvantaged, English Learners, or learning disabled come from the School Accountability Report Card unit of the California Department of Education.
GRADE LEVEL STUDENTS
Kindergarten 0
Grade 1 0
Grade 2 0
Grade 3 0
Grade 4 0
Grade 5 0
Grade 6 0
Grade 7 0
Grade 8 0
Grade 9 681
Grade 10 633
Grade 11 638
Grade 12 629
SOURCE: CBEDS, October 2008.
Oceanside Unified School District
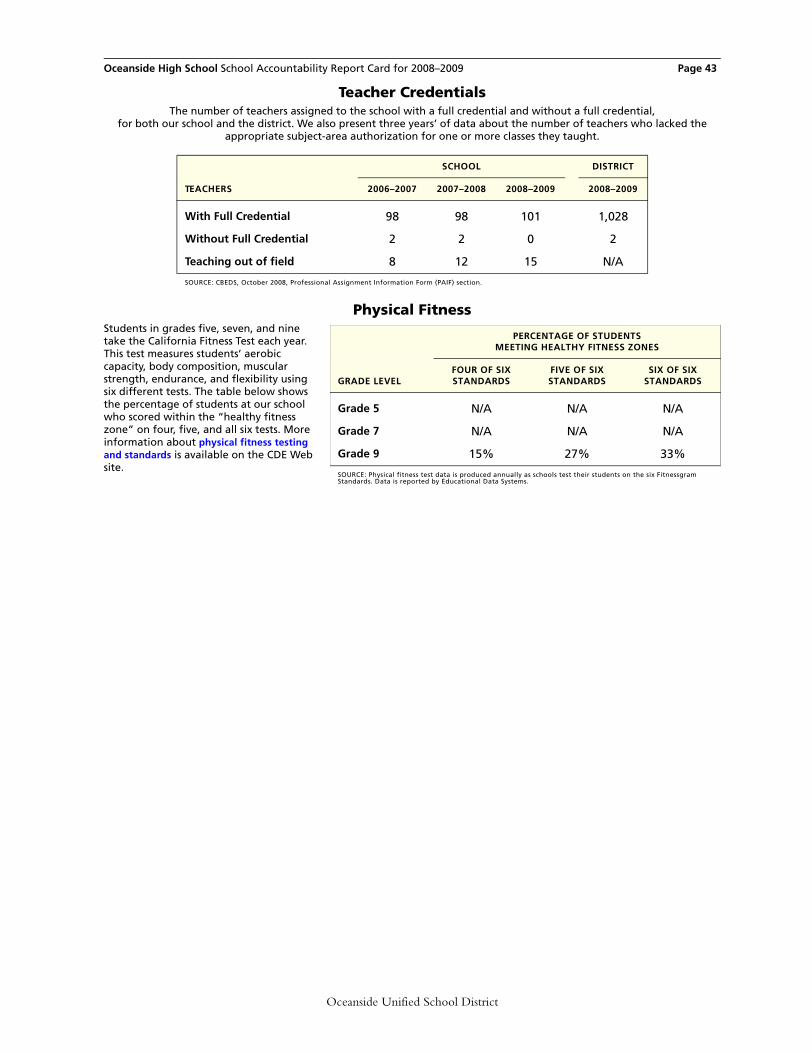
Oceanside High School School Accountability Report Card for 2008–2009 Page 43
Teacher CredentialsThe number of teachers assigned to the school with a full credential and without a full credential,
for both our school and the district. We also present three years’ of data about the number of teachers who lacked the appropriate subject-area authorization for one or more classes they taught.
Physical FitnessStudents in grades five, seven, and nine take the California Fitness Test each year. This test measures students’ aerobic capacity, body composition, muscular strength, endurance, and flexibility using six different tests. The table below shows the percentage of students at our school who scored within the “healthy fitness zone” on four, five, and all six tests. More information about physical fitness testing and standards is available on the CDE Web site.
SCHOOL DISTRICT
TEACHERS 2006–2007 2007–2008 2008–2009 2008–2009
With Full Credential 98 98 101 1,028
Without Full Credential 2 2 0 2
Teaching out of field 8 12 15 N/A
SOURCE: CBEDS, October 2008, Professional Assignment Information Form (PAIF) section.
PERCENTAGE OF STUDENTS MEETING HEALTHY FITNESS ZONES
GRADE LEVELFOUR OF SIX STANDARDS
FIVE OF SIX STANDARDS
SIX OF SIX STANDARDS
Grade 5 N/A N/A N/A
Grade 7 N/A N/A N/A
Grade 9 15% 27% 33%
SOURCE: Physical fitness test data is produced annually as schools test their students on the six Fitnessgram Standards. Data is reported by Educational Data Systems.
Oceanside Unified School District
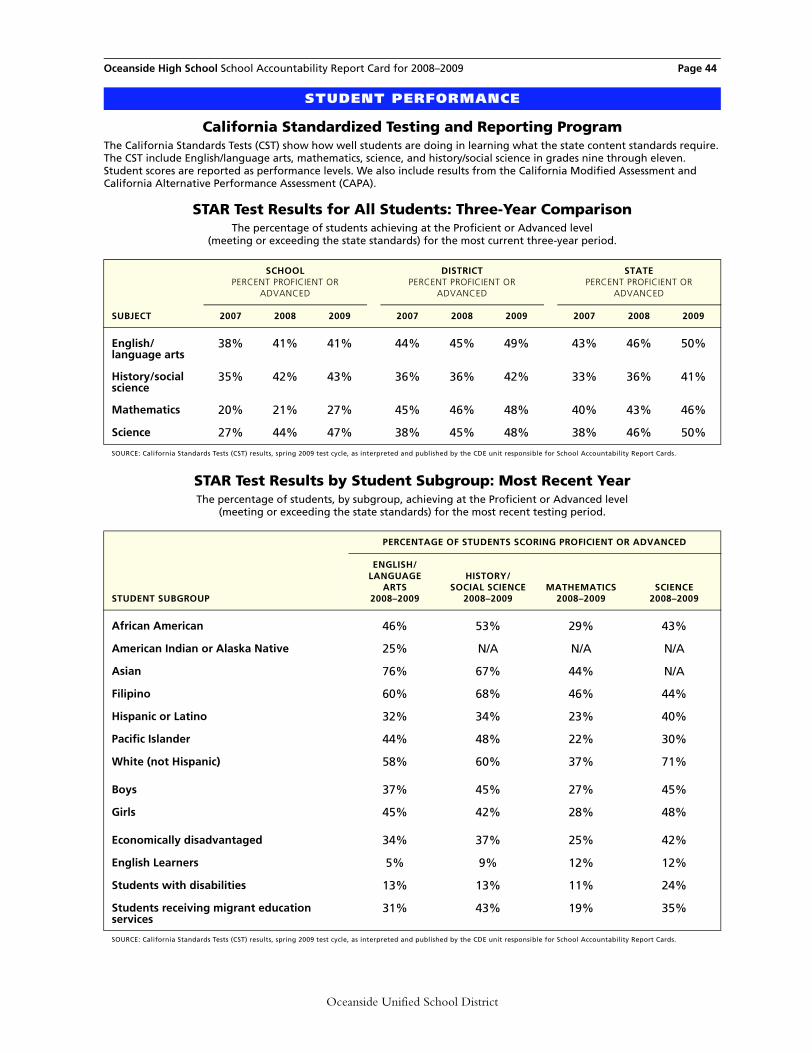
Oceanside High School School Accountability Report Card for 2008–2009 Page 44
California Standardized Testing and Reporting ProgramThe California Standards Tests (CST) show how well students are doing in learning what the state content standards require.The CST include English/language arts, mathematics, science, and history/social science in grades nine through eleven. Student scores are reported as performance levels. We also include results from the California Modified Assessment and California Alternative Performance Assessment (CAPA).
STAR Test Results for All Students: Three-Year ComparisonThe percentage of students achieving at the Proficient or Advanced level
(meeting or exceeding the state standards) for the most current three-year period.
STAR Test Results by Student Subgroup: Most Recent YearThe percentage of students, by subgroup, achieving at the Proficient or Advanced level
(meeting or exceeding the state standards) for the most recent testing period.
STUDENT PERFORMANCE
SCHOOLPERCENT PROFICIENT OR
ADVANCED
DISTRICTPERCENT PROFICIENT OR
ADVANCED
STATEPERCENT PROFICIENT OR
ADVANCED
SUBJECT 2007 2008 2009 2007 2008 2009 2007 2008 2009
English/language arts
38% 41% 41% 44% 45% 49% 43% 46% 50%
History/social science
35% 42% 43% 36% 36% 42% 33% 36% 41%
Mathematics 20% 21% 27% 45% 46% 48% 40% 43% 46%
Science 27% 44% 47% 38% 45% 48% 38% 46% 50%
SOURCE: California Standards Tests (CST) results, spring 2009 test cycle, as interpreted and published by the CDE unit responsible for School Accountability Report Cards.
PERCENTAGE OF STUDENTS SCORING PROFICIENT OR ADVANCED
STUDENT SUBGROUP
ENGLISH/LANGUAGE
ARTS2008–2009
HISTORY/SOCIAL SCIENCE
2008–2009MATHEMATICS
2008–2009SCIENCE
2008–2009
African American 46% 53% 29% 43%
American Indian or Alaska Native 25% N/A N/A N/A
Asian 76% 67% 44% N/A
Filipino 60% 68% 46% 44%
Hispanic or Latino 32% 34% 23% 40%
Pacific Islander 44% 48% 22% 30%
White (not Hispanic) 58% 60% 37% 71%
Boys 37% 45% 27% 45%
Girls 45% 42% 28% 48%
Economically disadvantaged 34% 37% 25% 42%
English Learners 5% 9% 12% 12%
Students with disabilities 13% 13% 11% 24%
Students receiving migrant education services
31% 43% 19% 35%
SOURCE: California Standards Tests (CST) results, spring 2009 test cycle, as interpreted and published by the CDE unit responsible for School Accountability Report Cards.
Oceanside Unified School District
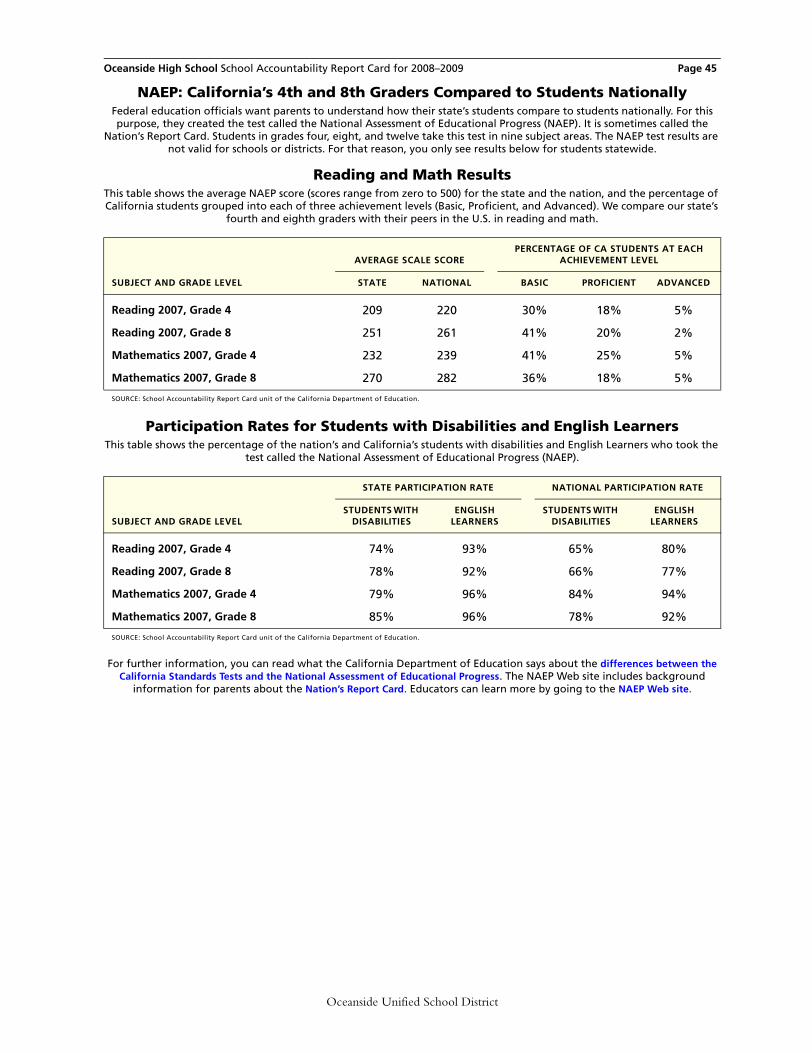
Oceanside High School School Accountability Report Card for 2008–2009 Page 45
NAEP: California’s 4th and 8th Graders Compared to Students NationallyFederal education officials want parents to understand how their state’s students compare to students nationally. For this purpose, they created the test called the National Assessment of Educational Progress (NAEP). It is sometimes called the
Nation’s Report Card. Students in grades four, eight, and twelve take this test in nine subject areas. The NAEP test results are not valid for schools or districts. For that reason, you only see results below for students statewide.
Reading and Math ResultsThis table shows the average NAEP score (scores range from zero to 500) for the state and the nation, and the percentage of California students grouped into each of three achievement levels (Basic, Proficient, and Advanced). We compare our state’s
fourth and eighth graders with their peers in the U.S. in reading and math.
Participation Rates for Students with Disabilities and English LearnersThis table shows the percentage of the nation’s and California’s students with disabilities and English Learners who took the
test called the National Assessment of Educational Progress (NAEP).
For further information, you can read what the California Department of Education says about the differences between the California Standards Tests and the National Assessment of Educational Progress. The NAEP Web site includes background
information for parents about the Nation’s Report Card. Educators can learn more by going to the NAEP Web site.
AVERAGE SCALE SCOREPERCENTAGE OF CA STUDENTS AT EACH
ACHIEVEMENT LEVEL
SUBJECT AND GRADE LEVEL STATE NATIONAL BASIC PROFICIENT ADVANCED
Reading 2007, Grade 4 209 220 30% 18% 5%
Reading 2007, Grade 8 251 261 41% 20% 2%
Mathematics 2007, Grade 4 232 239 41% 25% 5%
Mathematics 2007, Grade 8 270 282 36% 18% 5%
SOURCE: School Accountability Report Card unit of the California Department of Education.
STATE PARTICIPATION RATE NATIONAL PARTICIPATION RATE
SUBJECT AND GRADE LEVELSTUDENTS WITH
DISABILITIESENGLISH
LEARNERSSTUDENTS WITH
DISABILITIESENGLISH
LEARNERS
Reading 2007, Grade 4 74% 93% 65% 80%
Reading 2007, Grade 8 78% 92% 66% 77%
Mathematics 2007, Grade 4 79% 96% 84% 94%
Mathematics 2007, Grade 8 85% 96% 78% 92%
SOURCE: School Accountability Report Card unit of the California Department of Education.
Oceanside Unified School District
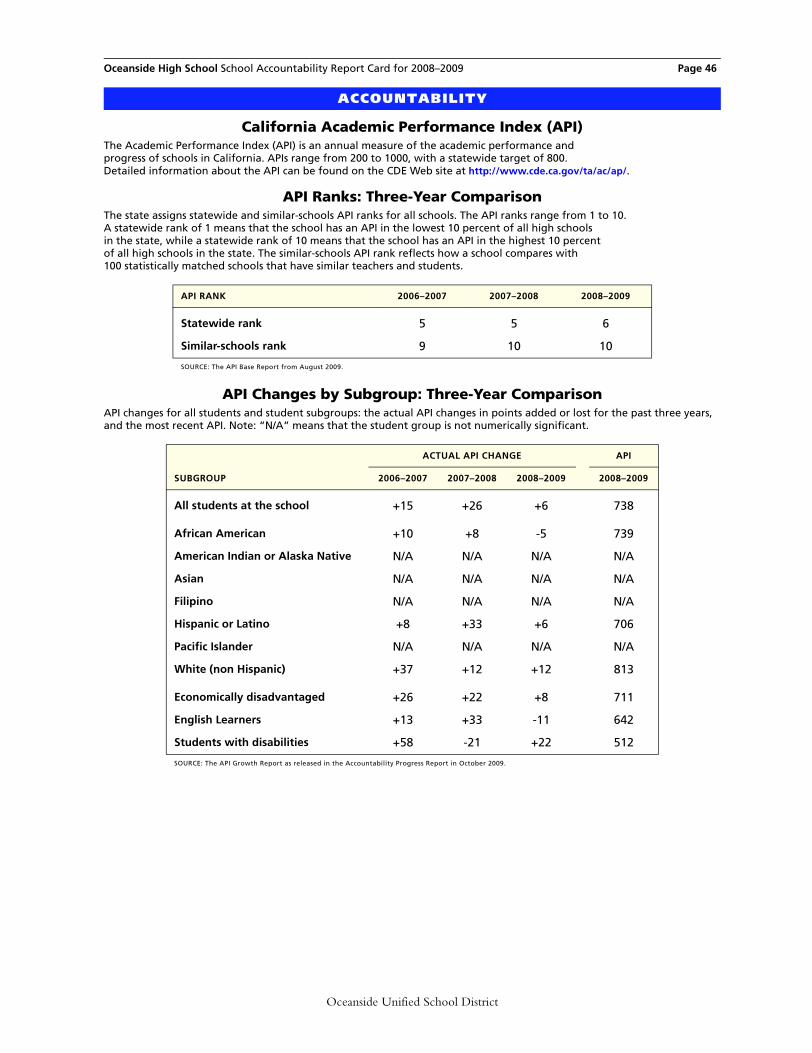
Oceanside High School School Accountability Report Card for 2008–2009 Page 46
California Academic Performance Index (API)The Academic Performance Index (API) is an annual measure of the academic performance and progress of schools in California. APIs range from 200 to 1000, with a statewide target of 800. Detailed information about the API can be found on the CDE Web site at http://www.cde.ca.gov/ta/ac/ap/.
API Ranks: Three-Year ComparisonThe state assigns statewide and similar-schools API ranks for all schools. The API ranks range from 1 to 10. A statewide rank of 1 means that the school has an API in the lowest 10 percent of all high schools in the state, while a statewide rank of 10 means that the school has an API in the highest 10 percent of all high schools in the state. The similar-schools API rank reflects how a school compares with 100 statistically matched schools that have similar teachers and students.
API Changes by Subgroup: Three-Year ComparisonAPI changes for all students and student subgroups: the actual API changes in points added or lost for the past three years, and the most recent API. Note: “N/A” means that the student group is not numerically significant.
ACCOUNTABILITY
API RANK 2006–2007 2007–2008 2008–2009
Statewide rank 5 5 6
Similar-schools rank 9 10 10
SOURCE: The API Base Report from August 2009.
ACTUAL API CHANGE API
SUBGROUP 2006–2007 2007–2008 2008–2009 2008–2009
All students at the school +15 +26 +6 738
African American +10 +8 -5 739
American Indian or Alaska Native N/A N/A N/A N/A
Asian N/A N/A N/A N/A
Filipino N/A N/A N/A N/A
Hispanic or Latino +8 +33 +6 706
Pacific Islander N/A N/A N/A N/A
White (non Hispanic) +37 +12 +12 813
Economically disadvantaged +26 +22 +8 711
English Learners +13 +33 -11 642
Students with disabilities +58 -21 +22 512
SOURCE: The API Growth Report as released in the Accountability Progress Report in October 2009.
Oceanside Unified School District
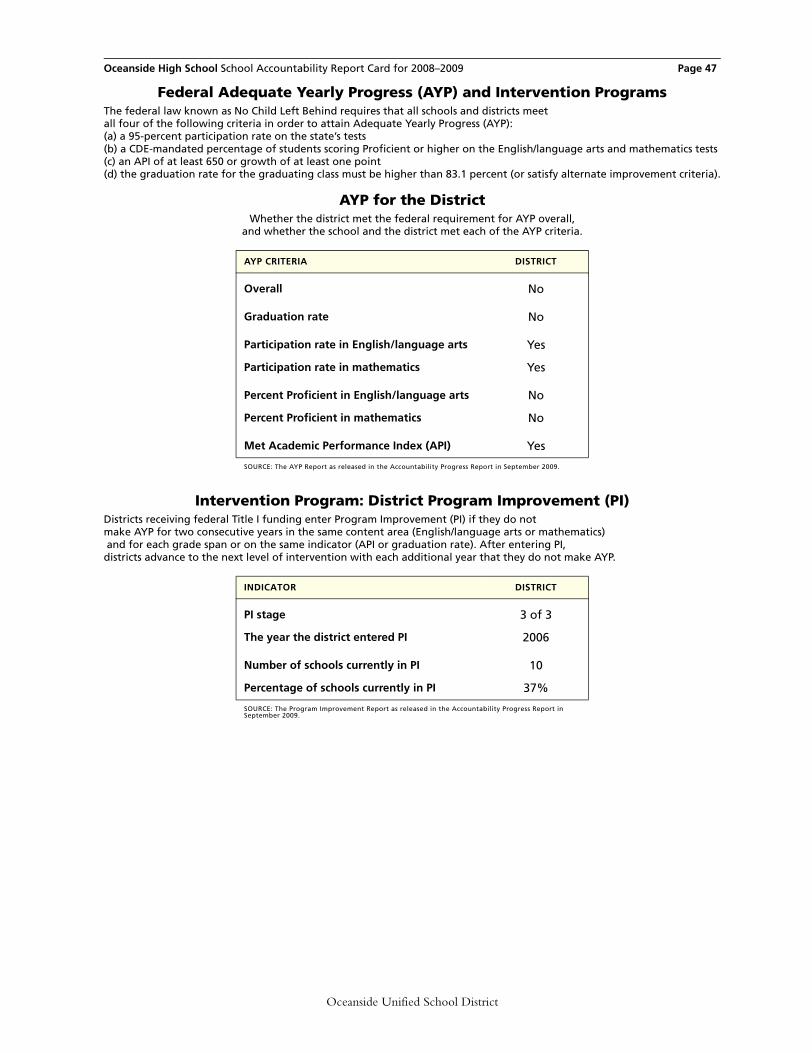
Oceanside High School School Accountability Report Card for 2008–2009 Page 47
Federal Adequate Yearly Progress (AYP) and Intervention ProgramsThe federal law known as No Child Left Behind requires that all schools and districts meet all four of the following criteria in order to attain Adequate Yearly Progress (AYP): (a) a 95-percent participation rate on the state’s tests (b) a CDE-mandated percentage of students scoring Proficient or higher on the English/language arts and mathematics tests (c) an API of at least 650 or growth of at least one point (d) the graduation rate for the graduating class must be higher than 83.1 percent (or satisfy alternate improvement criteria).
AYP for the DistrictWhether the district met the federal requirement for AYP overall,
and whether the school and the district met each of the AYP criteria.
Intervention Program: District Program Improvement (PI)Districts receiving federal Title I funding enter Program Improvement (PI) if they do not make AYP for two consecutive years in the same content area (English/language arts or mathematics) and for each grade span or on the same indicator (API or graduation rate). After entering PI, districts advance to the next level of intervention with each additional year that they do not make AYP.
AYP CRITERIA DISTRICT
Overall No
Graduation rate No
Participation rate in English/language arts Yes
Participation rate in mathematics Yes
Percent Proficient in English/language arts No
Percent Proficient in mathematics No
Met Academic Performance Index (API) Yes
SOURCE: The AYP Report as released in the Accountability Progress Report in September 2009.
INDICATOR DISTRICT
PI stage 3 of 3
The year the district entered PI 2006
Number of schools currently in PI 10
Percentage of schools currently in PI 37%
SOURCE: The Program Improvement Report as released in the Accountability Progress Report in September 2009.
Oceanside Unified School District
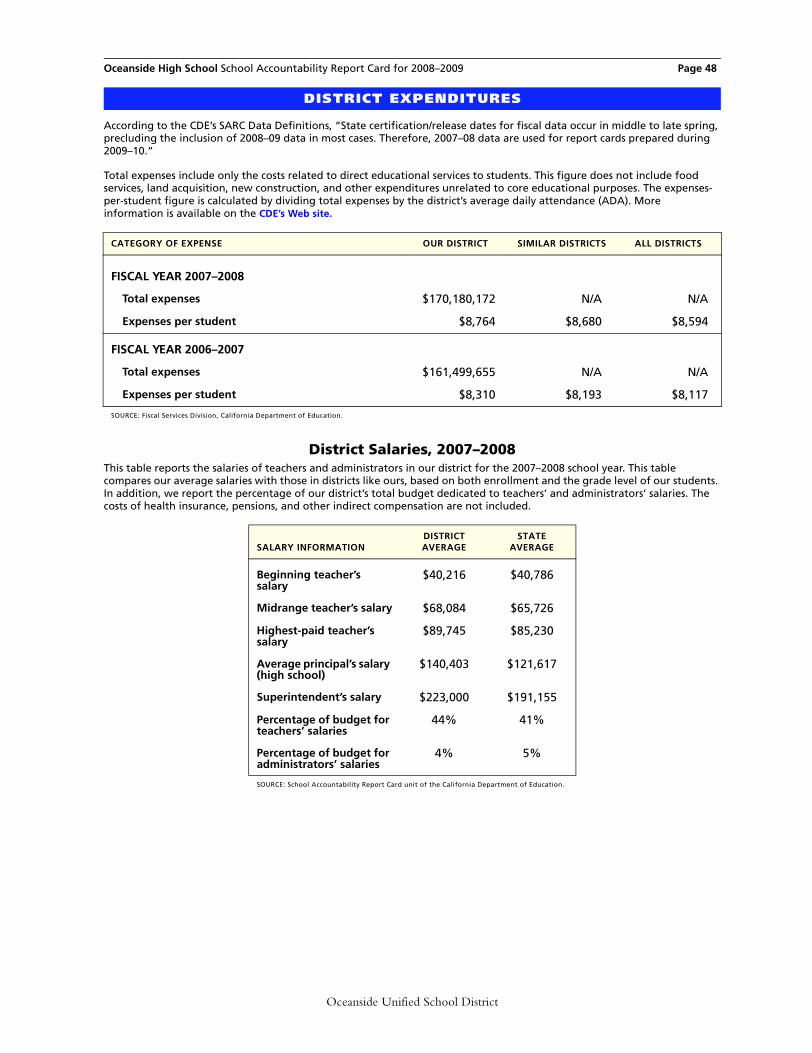
Oceanside High School School Accountability Report Card for 2008–2009 Page 48
According to the CDE’s SARC Data Definitions, “State certification/release dates for fiscal data occur in middle to late spring, precluding the inclusion of 2008–09 data in most cases. Therefore, 2007–08 data are used for report cards prepared during 2009–10.”
Total expenses include only the costs related to direct educational services to students. This figure does not include food services, land acquisition, new construction, and other expenditures unrelated to core educational purposes. The expenses-per-student figure is calculated by dividing total expenses by the district’s average daily attendance (ADA). More information is available on the CDE’s Web site.
District Salaries, 2007–2008This table reports the salaries of teachers and administrators in our district for the 2007–2008 school year. This table compares our average salaries with those in districts like ours, based on both enrollment and the grade level of our students. In addition, we report the percentage of our district’s total budget dedicated to teachers’ and administrators’ salaries. The costs of health insurance, pensions, and other indirect compensation are not included.
DISTRICT EXPENDITURES
CATEGORY OF EXPENSE OUR DISTRICT SIMILAR DISTRICTS ALL DISTRICTS
FISCAL YEAR 2007–2008
Total expenses $170,180,172 N/A N/A
Expenses per student $8,764 $8,680 $8,594
FISCAL YEAR 2006–2007
Total expenses $161,499,655 N/A N/A
Expenses per student $8,310 $8,193 $8,117
SOURCE: Fiscal Services Division, California Department of Education.
SALARY INFORMATIONDISTRICTAVERAGE
STATEAVERAGE
Beginning teacher’s salary
$40,216 $40,786
Midrange teacher’s salary $68,084 $65,726
Highest-paid teacher’s salary
$89,745 $85,230
Average principal’s salary (high school)
$140,403 $121,617
Superintendent’s salary $223,000 $191,155
Percentage of budget for teachers’ salaries
44% 41%
Percentage of budget for administrators’ salaries
4% 5%
SOURCE: School Accountability Report Card unit of the California Department of Education.
Oceanside Unified School District
Oceanside High School School Accountability Report Card for 2008–2009 Page 49
Dropout Rate and Graduation RateThe dropout rate is an estimate of the percentage of all students who drop out before the end of the school year (one-year rate). Graduation rate is an estimate of the four-year completion rate for all students.
Courses Required for Admission to the University of California or California State University Systems
Number and percentage of students enrolled in the A-G courses required for admission to the University of California (UC) or California State University (CSU).
College Entrance Exam Reasoning Test (SAT)The percentage of twelfth grade students (seniors) who voluntarily take the SAT Reasoning Test
to apply to college, and the average verbal, math, and writing scores of those students.
SCHOOL COMPLETION AND PREPARATION FOR COLLEGE
KEY FACTOR SCHOOL DISTRICT STATE
Dropout rate (one-year)
2007–2008 4% 3% 4%
2006–2007 4% 3% 4%
2005–2006 1% 1% 3%
Graduation rate (four-year)
2007–2008 85% 88% 85%
2006–2007 86% 90% 85%
2005–2006 95% 96% 87%
SOURCE: CBEDS October 2006–2008. District and state averages represent high schools only.
KEY FACTOR SCHOOL DISTRICT STATE
Percentage of students enrolled in courses required for UC/CSU admission
68% 67% 67%
Percentage of graduates from class of 2008 who completed all courses required for UC/CSU admission
0% 19% 36%
SOURCE: CBEDS, October 2008, for the class of 2008. District and state averages represent high schools only.
KEY FACTOR 2005–2006 2006–2007 2007–2008
Percentage of seniors taking the SAT 34% 25% 21%
Average verbal score 471 468 481
Average math score 504 498 509
Average writing score 469 463 474
SOURCE: Original data from the College Board, for the class of 2008, and republished by the California Department of Education. To protect student privacy, scores are not shown when the number of students tested is fewer than 11. The College Board first introduced the writing test in 2005–2006.
rev20100216_37-73569-3735206h/21375
Oceanside Unified School District
School Accountability Report Card for 2008–2009
Oceanside Unified School District
CAREER TECHNICAL EDUCATION
Programs and Courses Our district offers courses intended to help students prepare for the world of work.
These career technical education courses (CTE, formerly known as vocational education) are open to all students.
PROGRAM COURSE
AGENCY OFFERING COURSE
OFFERED THROUGH
ROC?
SATISFIES GRADUATION
REQUIREMENTS?
PART OF A-G
CURRICULUM?
Oceanside Unified School District
Accounting OUSD Yes Yes No
Oceanside Unified School District
Advanced Woodworking OUSD No Yes No
Oceanside Unified School District
American Sign Language I, II, III
OUSD Yes Yes Yes
Oceanside Unified School District
Animal Production OUSD No Yes No
Oceanside Unified School District
Veterinary Science OUSD No Yes Yes
Oceanside Unified School District
AP Computer Science OUSD Yes Yes Yes
Oceanside Unified School District
Architectural Design OUSD Yes Yes Yes
Oceanside Unified School District Oceanside Unified School District
Auto Engine Performance Auto Brakes, Steering & Suspension
OUSD
OUSD
Yes
Yes
Yes
Yes
No
No
Oceanside Unified School District
Beginning Auto OUSD No Yes No
Oceanside Unified School District
Business Math OUSD No Yes No
Oceanside Unified School District Oceanside Unified School District
Cabinetmaking Child Development
OUSD
OUSD
Yes
No
Yes
Yes
No
No
Oceanside Unified School District
Developmental Psychology of Children
OUSD Yes Yes Yes
Oceanside Unified School District
3-D Computer Animation OUSD Yes Yes Yes
Oceanside Unified School District
Computer Applications OUSD Yes Yes No
Oceanside Unified School District
Computer Programming OUSD Yes Yes Yes
Oceanside Unified School District
Green Construction OUSD Yes Yes No
Oceanside Unified School District
Graphic Design OUSD Yes Yes Yes
Oceanside Unified School District
Health Essentials OUSD No Yes No
Oceanside Unified School District
Intro to Computer Applications
OUSD No Yes No
Page 50
School Accountability Report Card for 2008–2009
Oceanside Unified School District
PROGRAM COURSE
AGENCY OFFERING COURSE
OFFERED THROUGH
ROC?
SATISFIES GRADUATION
REQUIREMENTS?
PART OF A-G
CURRICULUM?
Oceanside Unified School District
Intro to Multimedia OUSD No Yes No
Oceanside Unified School District
Medical Assisting, Admin.
OUSD Yes Yes No
Oceanside Unified School District
Medical Assisting, Clinical
OUSD Yes Yes No
Oceanside Unified School District
Medical Office Occupations/First Responder
OUSD Yes Yes No
Oceanside Unified School District
Medical Terminology OUSD Yes Yes No
Oceanside Unified School District
Parenting OUSD No Yes No
Oceanside Unified School District
Photographic Imaging OUSD Yes Yes Yes
Oceanside Unified School District
Pre-Engineering & Design
OUSD Yes Yes Yes
Oceanside Unified School District
TV Video Communication
OUSD Yes Yes No
Oceanside Unified School District
Virtual Enterprise OUSD Yes Yes Yes
Oceanside Unified School District
Web Design OUSD Yes Yes No
Oceanside Unified School District
Woodworking I & II OUSD No Yes No
Page 51

School Accountability Report Card for 2008–2009
Oceanside Unified School District
Advisors If you’d like more information about the programs our schools offer in career technical education,
please speak with our staff. More information about career technical education policy is available on the CDE Web site.
FIELD OR INDUSTRY ADVISOR PHONE EMAIL
Accounting Julie Johnson 760 757-8550
Accounting Toni Rodriquez 760 966-6308
Accounting Alice Sanchez 760 966-6309
Accounting Pia McAdams
Accounting Jacqueline Roberts [email protected]
Accounting Patricia Bell 760 966-6303
American Sign Language Judith Gail 760 757-8550
American Sign Language Kevin Struxness
American Sign Language Rebecca Himley [email protected]
American Sign Language Robert Crocker [email protected]
Auto Tech Kevin Carroll
Auto Tech Dave Cram
Auto Tech Gillian Cruz
Auto Tech Hector de la Fuente
Auto Tech Michael Donavan
Auto Tech Desha Esperonq
Auto Tech Mike forgione
Auto Tech Mario Garcia
Auto Tech Bob Hannibal
Auto Tech Tanna Hanibal
Auto Tech Bruce Kropp
Auto Tech Paul Katson
Auto Tech David Marhiand
Auto Tech Rick Nelson
Auto Tech Rodney Rainey
Auto Tech Dave Ramstad
Auto Tech Jerry Ratejsak
Auto Tech Al Rodriguez
Auto Tech Rick Torez
Auto Tech Steve Vail
Page 52
School Accountability Report Card for 2008–2009
Oceanside Unified School District
FIELD OR INDUSTRY ADVISOR PHONE EMAIL
Auto Tech Arnoldo Williams
Auto Tech Dan Zoren
Auto Tech John Schindel
Business & Computer App’s Larry O’Harra
Business & Computer App’s Natalie Wichert 760 722-3495
Business & Computer App’s Robert Gutierrez
Computer Technology Derek Cherred
Computer Technology Tony Shiffer
Computer Technology Ken Williams
Computer Technology Nick Wakiny
Computer Technology John Coughlin
Construction/ Cabinet Making Bert Richardson 858 569-6633 [email protected]
Construction/ Cabinet Making Phil Sheckler
Construction/ Cabinet Making Blair Reynolds 858 271-7758 [email protected]
Medical Assistant/Admin Donna Davis
Medical Assistant/Admin Maria Gutierrez 760 631-5000
Medical Assistant/Admin Joan Moore 760 757-2121
Medical Assistant/Admin Debi Workman 760 744-1150
Medical Assistant/Admin Emile LaGendijk 760 722-8000
Medical Assistant/Admin Joe Urban 760 435-4351
Medical Assistant/Admin Steward Sprung
Medical Assistant/Admin Ron Owens
Medical Assistant/Admin Bill Curtis
Medical Assistant/Admin Darcy Wright 760 940-3107
Medical Assistant/Admin Jean Kaput 760 602-0772
Page 53
School Accountability Report Card for 2008–2009
Oceanside Unified School District
FIELD OR INDUSTRY ADVISOR PHONE EMAIL
Medical Office/ Insurance Billing Rosalie Majid 714 484-7289 [email protected]
Medical Office/ Insurance Billing Barb Pinkowitz 714 484-7289 [email protected]
Medical Office/ Insurance Billing Dee Niedringhaus 714 502-5959 [email protected]
Medical Office/ Insurance Billing Donna Paine 310 374-3893
Medical Office/ Insurance Billing Kathleen Shaw 909 971-2360
Medical Office/ Insurance Billing Carol Wilhelm 949 551-4469 [email protected]
Medical Office/ Insurance Billing Linda Crumb 562 906-5742 [email protected]
Medical Office/ Insurance Billing Barbara Brawner 949 261-5000 [email protected]
Medical Office/ Insurance Billing Tamara Pantercirni 714 761-2373
Medical Office/ Insurance Billing Leslie Scarborough 959 764-8332 [email protected]
Medical Office/ Insurance Billing Janet James 949 824-5137 [email protected]
Medical Office/ Insurance Billing Niel Arauro 951 667-7080
Medical Office/ Insurance Billing Rebecca Gomez 714 484-7017 [email protected]
Phlebotomy Guillerma Baclig
Phlebotomy Gabriela Stellie
Phlebotomy J Michael
Phlebotomy Kanake Morparea
Phlebotomy Charlie Davidoskey
Virtual Enterprise Doug Thompson
Virtual Enterprise Dean Baldridge
Virtual Enterprise Jerry Kern
Virtual Enterprise Chris Yeomans
Virtual Enterprise Virginia Saenz
Virtual Enterprise Angela Legree
Virtual Enterprise Dana Kichijury
Page 54
School Accountability Report Card for 2008–2009
TITLE SUBJECTDATE OF
PUBLICATION ADOPTION
DATE
Glencoe/ McGraw-Hill Economics: Principles & Practices History/social Science 2005 2006
Glencoe/McGraw-Hill The American Vision (US) History/social Science 2006 2006
Glencoe/McGraw-Hill World History History/Social Science 2006 2006
Glencoe/McGraw-Hill Government History/Social Science 2006 2006
Holt Literature and Language Arts Series Language Arts 2003 2004
McDougal Littell Algebra 1 Concept & Skills Math 2001 2001
McDougal Littell Geometry Math 2001 2001
McDougal Littell Algebra 2 Math 2001 2007
UC Davis College Prep. Mathematics (Courses 1, 2, & 3) Math 2000 2000
Houghton Mifflin Pre-Calclulus with Limits Math 2007 2008
Glencoe Physics: Principles and Problems Science 2005 2005
McDougal Littell World of Chemistry Science 2002 2005
Prentice Hall Biology Science 2006 2005
TEXTBOOKS
Textbook Adoption List
Oceanside Unified School District
Page 55