Embed Size (px)
Citation preview
1
Using the Census to Evaluate Administrative Records and Vice Versa
J. David Brown, Jennifer H. Childs, and Amy O’Hara
U.S. Census Bureau
4600 Silver Hill Road Washington, DC 20233
Proceedings of the 2015 Federal Committee on Statistical Methodology (FCSM) Research Conference
1. Introduction
An ideal way of evaluating the accuracy and coverage of administrative records for use in census enumeration would be through a comparison to the actual occupancy and number of residents in each housing unit on Ap ril 1, 2010. While the 2010 Census provides information about this, not all Census enumerations are equally reliable. Censuses, like surveys, have some level of unit and item nonresponse as well as measurement error.
A common way to evaluate the quality of survey response data is by comparing it to information from administrative records on the same people. Meyer and Goerge (2011), for example, compare responses on food stamp receipt from both the American Community Survey (ACS) and the Current Population Survey (CPS) to administrative data on food stamps. With such an approach, however, one must determine the direction of quality comparison. Is comparing the two sources a measure of admin istrative record quality, survey or census response quality, both, or neither?
Sources of error in survey data collection have been well documented in the literature (see Groves et al., 2009). More recently, researchers have started documenting systematic errors within administrative records sources as well (Groen, 2012). At the Census Bureau, researchers have been using administrative records as a research tool to assess survey responses, allowing for the possibility that neither the census nor the records are perfect (Mulry et al., 2006). This paper follows that vein.
This paper posits that some census responses are likely of higher quality than a given admin istrative record , and others may be of worse quality. By exploring characteristics of census responses that we hypothesize are related to accuracy, we can make infe rences about how the census data compare to administrative record data with regard to accuracy.
Our specific problem - how can we evaluate the quality of administrative records fo r census enumeration when the main comparison source (the decennial census) is likely imperfect? - illustrates a general problem: how can researchers evaluate data quality when each source is likely imperfect?
To address this problem, we evaluate the quality, or fitness of use, of administrative records for decennial census enumeration purposes by comparing them to census responses. We segregate what we believe are the most trustworthy enumerations for comparison. Recognizing that administrative record quality varies both within and across sources, we assign quality scores that vary with characteristics within and across sources. We then evaluate the soundness of our “trustworthy” approach by comparing census counts in housing units captured in the independent Census Coverage Measurement (CCM) evaluation.
We aim to develop quality scores for administrative records and survey enumerations . The quality scoring can support decisions on when and how to use administrative records data in operations for the decennial census or surveys. Though there are many interesting aspects of data quality, this study focuses on the number of persons residing in a housing unit. For the decennial census, the housing unit population count is the foundation upon which higher-level population aggregates are built. Errors in a housing unit’s population count are associated with errors in other important data items, such as age, gender, race, and Hispanic orig in. Section 2 describes the data, Section 3 describes the methodology and results, and Section 4 concludes.

2
2. Data
The study employs data from three sources: (1) the 2010 decennial census person and housing unit response files , (2) administrative records sources, and (3) the 2010 Census Coverage Measurement (CCM) post-enumeration survey. The 2010 decennial census files include data on names, relat ionships, sex, age, Hispanic orig in, race, and usual residence elsewhere, how many people lived or stay in the house on April 1, whether there are additional people not included in the count, housing tenure, whether there are people included in the count who sometimes live elsewhere, telephone number, the enumeration mode, and whether a USPS Undeliverable As Addressed (UAA) notice was received. Table 1. Administrative Records Data Used in This Study Person-Address Sources Years IRS individual income tax returns (Form 1040)1 2008-2009 IRS information returns (Form 1099/W2) 2008-2009 Department of Housing and Urban Development Computerized Homes Underwrit ing Management System (HUD CHUMS)
2000-2010
Housing and Urban Development Public and Indian Housing Information Center (HUD PIC) 2009-2010 Housing and Urban Development Tenant Rental Assistance Certification System (TRACS) 2009-2010 Selective Service System (SSS) registration records 2009-2010 Medicare Enrollment records 2009-2010 Indian Health Service (IHS) Patient Registration System records 2009-2010 United States Postal Service National Change of Address (NCOA) records 2009-2010 New York Supplemental Nutrition Assistance Program (New York SNAP) records 2009-March
2010 Supplemental Security Record (SSR) data 2010 Experian End-Dated Records (Experian-EDR) 2010 Experian-Insource Records 2010 InfoUSA Records 2010 Melissa Data Records 2010 Targus-Consumer Records 2010 Targus-Wireless Records 2010 Veteran Service Group of Illinois Name and Address Res ource Consumer file (VSGI-NAR) Records
2010
Veteran Service Group of Illinois TrackerPlus (VSGI-TRK) Records 2010 Address-Only Sources Texas Supplemental Nutrition Assistance Program (Texas SNAP) records 2009 Targus National Address File (Targus NAF) Data Corelogic Records 2010 The administrative record sources vary in content. Some include marital status, household income, housing tenure, length of residence, home value, mortgage informat ion, investment property indicators, types of tax filing, and the extent of household roster turnover in the previous year.
For this analysis, we use the CCM population (P) sample.2 The CCM survey was conducted to assess the quality of the 2010 decennial census, producing measures of net coverage, the components of coverage (erroneous
1 We incorporate informat ion from the 2009 electronic filings, which contain dependents beyond the four included in the main 2009 file. 2 The P sample is a housing unit and person sample obtained independently from the Census for a sample of block clusters. See Mule (2008) for details about the survey design. The entire P-sample universe contains 178,696 observations. The analysis excludes observations from Puerto Rico (7,479 observations), livin g quarters classified as group quarters in the Census (nine observations), observations that could not be matched to the Census (6,154 observations), those with an unresolved P-sample housing unit status (39 observations), those with an unresolved P-sample match status (eight observations), those not interviewed in CCM (5,118 observations), those with a blank P-

3
enumerations and omissions), and coverage for demographic groups, geographic areas, and for key census operations. CCM operations make extra efforts to determine each person’s Census Day address by asking detailed follow-up questions and conducting additional interviews. It was conducted 4-5 months after Census Day, however, introducing error from recall b ias and people moving in and out of housing units . Being a survey, it may suffer from some of the same issues as the census itself. The primary purpose of the CCM was not to determine the housing unit population count, rather focusing on whether individuals were census day residents in the block or not.3 The CCM Census Day population count in this analysis is calculated by summing the counts of people reported as living in the selected housing units.4
For all three data sources, the addresses are linked using the Census Bureau’s address identifier called the Mas ter Address File ID, or MAFID. Person records in the decennial census, the CCM, and all the administrative record sources except Corelogic, Targus NAF, and Texas SNAP have also been assigned a common person ID, called a Protected Identification Key (PIK), by the Census Bureau’s Person Identification Validation System (PVS), so we can link the person records within and across sources .5 We merge in demographic information (age, gender, race, and Hispanic orig in) from a demographic file created by the Census Bureau’s Center for Admin istrative Records Research and Application (CARRA) using the most reliab le demographics for each person based on pre-2010 Census Bureau data, Social Security Administration (SSA) data, and other government sources. Information on deaths and citizenship status come from SSA.
3. Methodology and Results
This paper aims to evaluate quality in both administrative records and the census. We first divide 2010 census responses into more and less reliable groups based on potential observable enumeration errors . Next , we measure administrative records data quality using logistic regressions to predict whether the record and more reliable census enumerations place a person at the same housing unit. Using various federal, state, and commercial data sources , we construct a composite file of persons at the housing unit where he or she has the highest propensity score to reside. We sum the number of persons assigned to the housing unit, forming the admin istrative record population count for each address. We assign each housing unit’s administrative records a quality score.
We then evaluate the quality of census responses with potential observable errors by comparing them to administrative records in a set of housing units that both have potential errors and high estimated administrative record quality scores, using administrative record characteristics as predictors. Once each census enumerat ion has been assigned a quality score, we use the score as a dependent variable in models predicting census enumeration quality, separately estimated by enumeration mode. As a final evaluation of this methodology, we study correlations between estimated admin istrative record quality score, predicted census quality, and agreement rates among the CCM, the census, and administrative records.
3.1 Classifying Census Enumerations by Reliability
We have developed a list of “potential observable erro rs”, or POEs, in census enumerations based on research conducted for the 2010 Census Program for Evaluations and Experiments and 2020 Research and Testing Program. The existence of a POE casts doubt on the validity of an enumerat ion.6 We assume that enumerations without POEs are more reliab le and use them as the comparison for admin istrative records. Table 2 contains our list of POEs. Note
sample Census Day housing unit status (5,997 observations), those with unclassified persons (i.e., it could not be determined if the person lives at the housing unit on Census Day or not – 5,317 observations), and three errant records identified in microsimulat ion research. The usable P-sample universe fo r this pro ject contains 148,572 observations. 3 As a result, obtaining the Census Day address for persons who moved from one housing unit to another within the same block since Census Day was given a lower priority. 4 This is calculated as the sum of nonmovers, P-sample outmovers, non-P-sample outmovers, and unclassified outmovers. The CCM results are weighted using the unbiased P-sample weights. These have not been adjusted for the exclusion of some observations from the analysis. 5 See Wagner and Layne (2013) for details about the PVS system. 6 We recognize that enumerations without POEs may nonetheless be inaccurate, and those with POEs may actually be correct. We are assuming that those without POEs are more likely to be accurate.
4
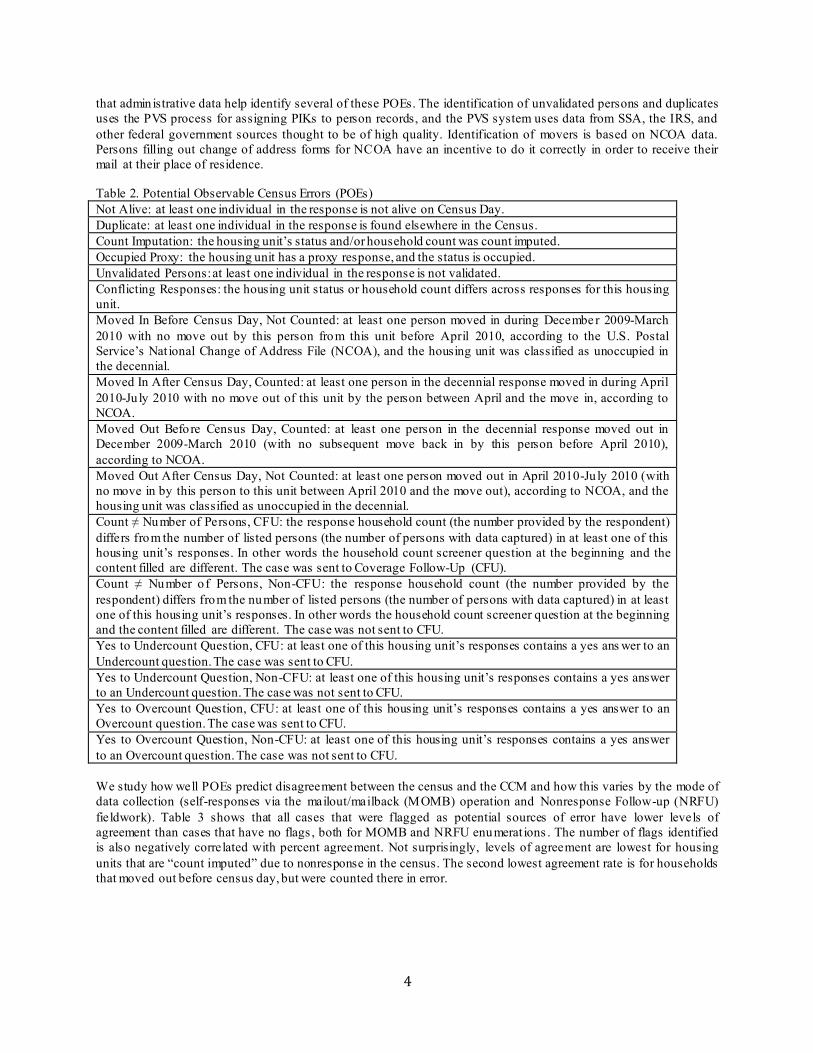
that admin istrative data help identify several of these POEs. The identification of unvalidated persons and duplicates uses the PVS process for assigning PIKs to person records, and the PVS system uses data from SSA, the IRS, and other federal government sources thought to be of high quality. Identification of movers is based on NCOA data. Persons filling out change of address forms for NCOA have an incentive to do it correctly in order to receive their mail at their place of residence.
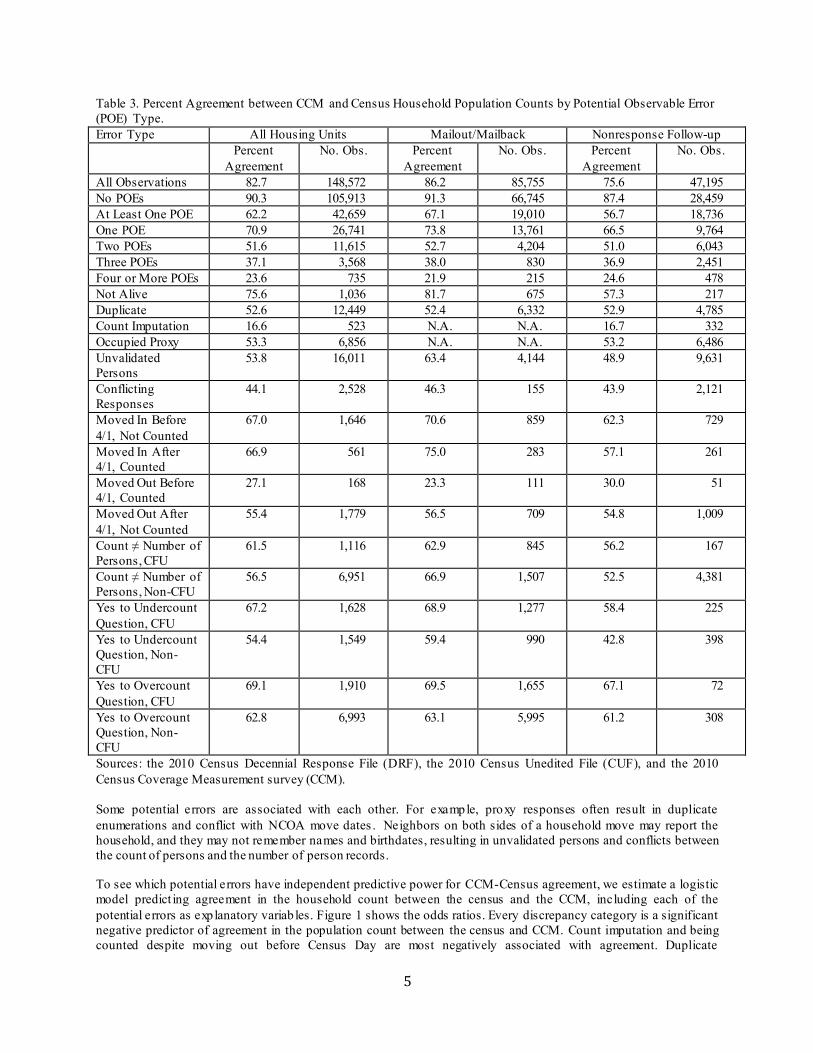
Table 2. Potential Observable Census Errors (POEs) Not Alive: at least one individual in the response is not alive on Census Day. Duplicate: at least one individual in the response is found elsewhere in the Census. Count Imputation: the housing unit’s status and/or household count was count imputed. Occupied Proxy: the housing unit has a proxy response, and the status is occupied. Unvalidated Persons: at least one individual in the response is not validated. Conflicting Responses: the housing unit status or household count differs across responses for this housing unit. Moved In Before Census Day, Not Counted: at least one person moved in during Decembe r 2009-March 2010 with no move out by this person from this unit before April 2010, according to the U.S. Postal Service’s Nat ional Change of Address File (NCOA), and the housing unit was classified as unoccupied in the decennial. Moved In After Census Day, Counted: at least one person in the decennial response moved in during April 2010-Ju ly 2010 with no move out of this unit by the person between April and the move in, according to NCOA. Moved Out Before Census Day, Counted: at least one person in the decennial response moved out in December 2009-March 2010 (with no subsequent move back in by this person before April 2010), according to NCOA. Moved Out After Census Day, Not Counted: at least one person moved out in April 2010-Ju ly 2010 (with no move in by this person to this unit between April 2010 and the move out), according to NCOA, and the housing unit was classified as unoccupied in the decennial. Count ≠ Number of Persons, CFU: the response household count (the number provided by the respondent) differs from the number of listed persons (the number of persons with data captured) in at least one of this housing unit’s responses. In other words the household count screener question at the beginning and the content filled are different. The case was sent to Coverage Follow-Up (CFU). Count ≠ Number o f Persons, Non-CFU: the response household count (the number provided by the respondent) differs from the number of listed persons (the number of persons with data captured) in at least one of this housing unit’s responses. In other words the household count screener question at the beginning and the content filled are different. The case was not sent to CFU. Yes to Undercount Question, CFU: at least one of this housing unit’s responses contains a yes ans wer to an Undercount question. The case was sent to CFU. Yes to Undercount Question, Non-CFU: at least one of this housing unit’s responses contains a yes answer to an Undercount question. The case was not sent to CFU. Yes to Overcount Question, CFU: at least one of this housing unit’s responses contains a yes answer to an Overcount question. The case was sent to CFU. Yes to Overcount Question, Non-CFU: at least one of this housing unit’s responses contains a yes answer to an Overcount question. The case was not sent to CFU. We study how well POEs predict disagreement between the census and the CCM and how this varies by the mode of data collection (self-responses via the mailout/mailback (MOMB) operation and Nonresponse Follow-up (NRFU) fieldwork). Table 3 shows that all cases that were flagged as potential sources of error have lower levels of agreement than cases that have no flags , both for MOMB and NRFU enumerat ions . The number of flags identified is also negatively correlated with percent agreement. Not surprisingly, levels of agreement are lowest for housing units that are “count imputed” due to nonresponse in the census. The second lowest agreement rate is for households that moved out before census day, but were counted there in error.
5
Table 3. Percent Agreement between CCM and Census Household Population Counts by Potential Observable Error (POE) Type. Error Type All Housing Units Mailout/Mailback Nonresponse Follow-up Percent
Agreement No. Obs. Percent
Agreement No. Obs. Percent
Agreement No. Obs.
All Observations 82.7 148,572 86.2 85,755 75.6 47,195 No POEs 90.3 105,913 91.3 66,745 87.4 28,459 At Least One POE 62.2 42,659 67.1 19,010 56.7 18,736 One POE 70.9 26,741 73.8 13,761 66.5 9,764 Two POEs 51.6 11,615 52.7 4,204 51.0 6,043 Three POEs 37.1 3,568 38.0 830 36.9 2,451 Four or More POEs 23.6 735 21.9 215 24.6 478 Not Alive 75.6 1,036 81.7 675 57.3 217 Duplicate 52.6 12,449 52.4 6,332 52.9 4,785 Count Imputation 16.6 523 N.A. N.A. 16.7 332 Occupied Proxy 53.3 6,856 N.A. N.A. 53.2 6,486 Unvalidated Persons
53.8 16,011 63.4 4,144 48.9 9,631
Conflicting Responses
44.1 2,528 46.3 155 43.9 2,121
Moved In Before 4/1, Not Counted
67.0 1,646 70.6 859 62.3 729
Moved In After 4/1, Counted
66.9 561 75.0 283 57.1 261
Moved Out Before 4/1, Counted
27.1 168 23.3 111 30.0 51
Moved Out After 4/1, Not Counted
55.4 1,779 56.5 709 54.8 1,009
Count ≠ Number of Persons, CFU
61.5 1,116 62.9 845 56.2 167
Count ≠ Number of Persons, Non-CFU
56.5 6,951 66.9 1,507 52.5 4,381
Yes to Undercount Question, CFU
67.2 1,628 68.9 1,277 58.4 225
Yes to Undercount Question, Non-CFU
54.4 1,549 59.4 990 42.8 398
Yes to Overcount Question, CFU
69.1 1,910 69.5 1,655 67.1 72
Yes to Overcount Question, Non-CFU
62.8 6,993 63.1 5,995 61.2 308
Sources: the 2010 Census Decennial Response File (DRF), the 2010 Census Unedited File (CUF), and the 2010 Census Coverage Measurement survey (CCM). Some potential errors are associated with each other. For example, proxy responses often result in duplicate enumerations and conflict with NCOA move dates . Neighbors on both sides of a household move may report the household, and they may not remember names and birthdates, resulting in unvalidated persons and conflicts between the count of persons and the number of person records.
To see which potential errors have independent predictive power for CCM-Census agreement, we estimate a logistic model predict ing agreement in the household count between the census and the CCM, including each of the potential errors as exp lanatory variab les. Figure 1 shows the odds ratios. Every discrepancy category is a significant negative predictor of agreement in the population count between the census and CCM. Count imputation and being counted despite moving out before Census Day are most negatively associated with agreement. Duplicate

6
enumerations, unvalidated persons, and conflicting responses are also strongly negatively associated with agreement.
Figure 1. Using Potential Error Scenarios to Predict CCM and Census Household Population Count Agreement
Sources: the 2010 Census Decennial Response File (DRF), the 2010 Census Unedited File (CUF), and the 2010 Census Coverage Measurement survey (CCM). The oods ratios come from a logistic regression with a dependent variable equal to one when the census and the CCM have the same population count for a housing unit and zero otherwise.
We conduct sensitivity analysis involving the move-in/move-out potential error scenarios using the NCOA data. We examine the relative incidence of NCOA household moves near Census Day to assess whether enumeration errors are more likely to occur in conjunction with moves . These results are shown in Appendix A. We find that outmovers have a heightened incidence of potential errors, consistent with there being outmovers just before Census Day that neighbors report having lived there on Census Day in proxy responses, while the outmovers themselves or their subsequent neighbors also report them liv ing at their destination address. Analogously, inmovers just after Census Day may have new neighbors reporting them as having lived there on Census Day, while the inmovers or their former neighbors report them liv ing at their prev ious address. Such patterns provide support for the accuracy of the NCOA data and reasonableness of the potential error flags.
3.2 Estimating Administrative Record Quality Scores
Next, we produce administrative record quality scores. We drop records that fail to receive a PIK in the PVS process to include validated persons and avoid duplication in the administrative record enumerat ion. Unduplicating persons across admin istrative record sources is critically important as new sources are added, because there is considerable overlap in coverage (e.g., same person may be in IRS 1040 and Experian data). It is also necessary to unduplicate within sources, as many sources retain historical records in the data.7 In addition, persons not alive on Census Day
7 There are two drawbacks to the PVS validation constraint. The first is that some U.S. residents cannot be validated, because they do not have an SSN or ITIN. A lternatively, they have such an I.D. but do not appear in any of the federal administrative sources used as reference files in the PVS process. A second drawback is that the PVS process
0
0.1
0.2
0.3
0.4
0.5
0.6
0.7
0.8
Od
ds
Rat
io o
f C
CM
-Ce
nsu
s H
ou
sin
g U
nit
P
op
ula
tio
n C
ou
nt
Agr
ee
me
nt

7
are removed from the pool of eligib le records. Dates of birth and death are checked by linking the PIKs to SSA’s Death Master File and Numident data. The one exception is Individual Taxpayer Identificat ion Numbers (ITINs), which are not found in SSA data: a being alive requirement is not imposed on ITINs here.
Taking the unduplicated set of PIKs alive on Census Day, we assess admin istrative records quality using the record’s probability of placing the person at the same address as a decennial census enumera tion without POEs. Focusing on housing units enumerated during NRFU with none of the POEs,8 we execute this via two stages of person-place logistic regressions. 9 The first-stage regressions predict quality variation within individual administrative record sources. A separate first-stage regression is run for each administrative record source, using the subset of addresses both in the source and which meet the above sample restrict ions. The dependent variable is equal to one if the administrative record source places the person at the same address as the decennial census, and it is zero otherwise. Explanatory variables vary across source regressions depending on availability. All sources except Texas SNAP, Targus NAF, and Corelogic contain person-address data, allowing us to include the fo llowing as explanatory variab les: the shares of the persons with different demographic characteristics (deceased, gender, age categories, race categories, Hispanic orig in, citizenship status, number of validated persons, and number of unvalidated persons). Most regressions include variables indicating the data vintage. Some include marital status, household income, owner vs. renter, length of residence, home value, mortgage information, investment property indicators, types of tax filing, and the extent of household roster turnover in the previous year (IRS 1040).
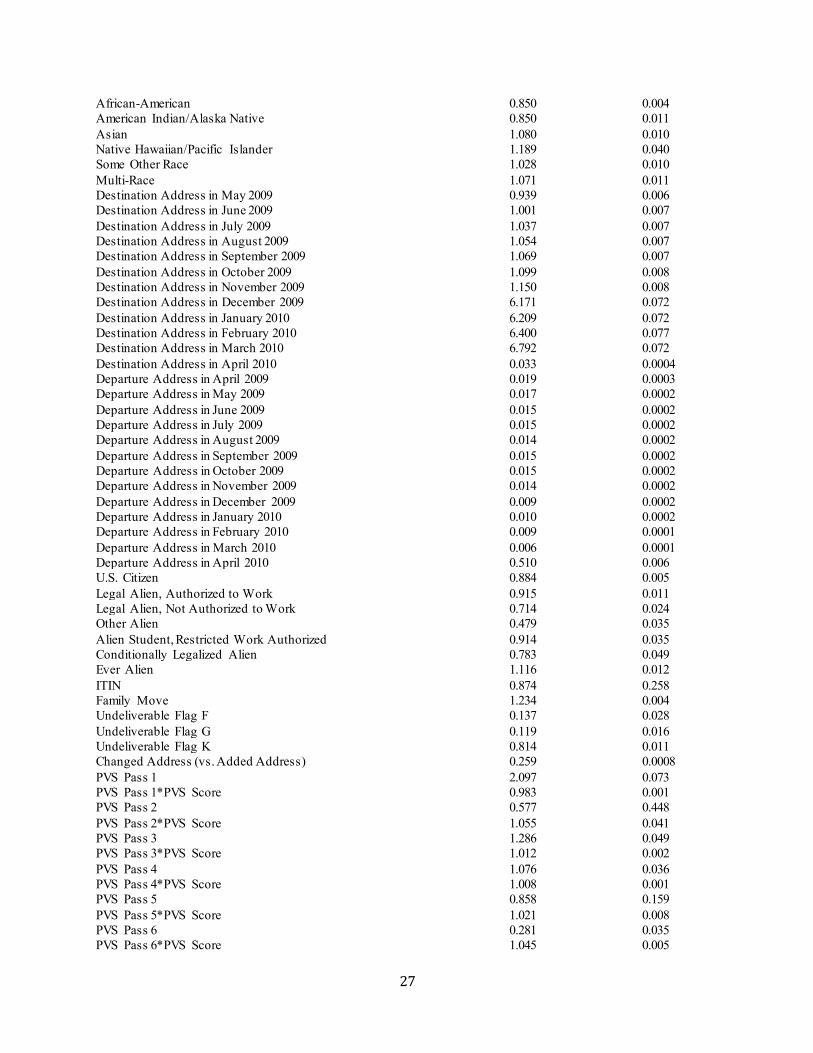
Table 4 shows selected results from the first-stage person-place regressions for the IRS 1040, NCOA, and VSGI-TRK sources; full results for these sources are in Appendix Tables B1, B2, and B3.10 The results suggest that administrative records addresses for males and minorities are less likely to match the Census address, while those of young children, persons found in 2008 and 2009 IRS 1040 returns at this address, persons on married-filing-jo intly returns, and those with higher income, owner-occupancy, and longer-term residence are more likely to match. NCOA records with a destination address just before Census Day have a very high probability o f being a match, while a departure address before Census Day and a destination address after Census Day has an extremely low probability of being a match, as expected. Scores capturing the reliab ility of the PVS process identifying the right person generally increases the probability that the administrative record’s address matches the Census address.11
Table 4. First-Stage Person-Place Regression Findings for Selected Administrative Records Sources Variable Odds Ratio Standard Error IRS 1040 Male 0.812 0.004 IRS 1040 Age 0-2 2.870 0.039 IRS 1040 Age 3-17 2.884 0.029 IRS 1040 Age 18-24 0.731 0.005 IRS 1040 Age 45-64 1.096 0.007 IRS 1040 Age 65-74 0.677 0.008 IRS 1040 Age 75+ 0.450 0.006 IRS 1040 Hispanic 0.800 0.006 IRS 1040 African-American 0.592 0.003 IRS 1040 American Indian/Alaska Native 0.787 0.015 IRS 1040 Asian 0.967 0.013 IRS 1040 Native Hawaiian/Pacific Islander 0.885 0.047 IRS 1040 Some Other Race 1.020 0.013
can sometimes assign mult iple persons the same PIK, resulting in the erroneous removal of records when unduplicating by PIK. 8 We limit the sample to NRFU housing units, because we are part icularly interested in evaluating admin istrative record fitness for enumerating non-responding housing units. 9 Theoretically, this could be done in a single regression, but this is not feasible due to computer processing constraints. 10 Results for the other sources are available upon request. Note that some caution is warranted in interpret ing the results, since the regressions contain many variables and may thus have some mult icollinearity. The purpose of the regressions is prediction rather than interpretation of the factors affecting match rates. 11 The PVS process involves seven different attempts (called passes) to link person records, and the NCOA file includes the pass number used for linking each particular record. The table shows results separately by pass.

8
IRS 1040 Multi-Race 1.035 0.016 IRS 1040 Married Filing Jointly 2.792 0.020 IRS 1040 Married Filing Separately 1.092 0.016 IRS 1040 Filing as Household Head 1.121 0.008 IRS 1040 Filing as Widow 2.304 0.177 IRS 1040 Both 2008 & 2009 1040 Return Here 2.289 0.011 NCOA Destination Address in May 2009 0.939 0.006 NCOA Destination Address in June 2009 1.001 0.007 NCOA Destination Address in July 2009 1.037 0.007 NCOA Destination Address in August 2009 1.054 0.007 NCOA Destination Address in September 2009 1.069 0.007 NCOA Destination Address in October 2009 1.099 0.008 NCOA Destination Address in November 2009 1.150 0.008 NCOA Destination Address in December 2009 6.171 0.072 NCOA Destination Address in January 2010 6.209 0.072 NCOA Destination Address in February 2010 6.400 0.077 NCOA Destination Address in March 2010 6.792 0.072 NCOA Destination Address in April 2010 0.033 0.0004 NCOA Departure Address in April 2009 0.019 0.0003 NCOA Departure Address in May 2009 0.017 0.0002 NCOA Departure Address in June 2009 0.015 0.0002 NCOA Departure Address in July 2009 0.015 0.0002 NCOA Departure Address in August 2009 0.014 0.0002 NCOA Departure Address in September 2009 0.015 0.0002 NCOA Departure Address in October 2009 0.015 0.0002 NCOA Departure Address in November 2009 0.014 0.0002 NCOA Departure Address in December 2009 0.009 0.0002 NCOA Departure Address in January 2010 0.010 0.0002 NCOA Departure Address in February 2010 0.009 0.0001 NCOA Departure Address in March 2010 0.006 0.0001 NCOA Departure Address in April 2010 0.510 0.006 NCOA PVS Pass 1 2.097 0.073 NCOA PVS Pass 1*PVS Score 0.983 0.001 NCOA PVS Pass 2 0.577 0.448 NCOA PVS Pass 2*PVS Score 1.055 0.041 NCOA PVS Pass 3 1.286 0.049 NCOA PVS Pass 3*PVS Score 1.012 0.002 NCOA PVS Pass 4 1.076 0.036 NCOA PVS Pass 4*PVS Score 1.008 0.001 NCOA PVS Pass 5 0.858 0.159 NCOA PVS Pass 5*PVS Score 1.021 0.008 NCOA PVS Pass 6 0.281 0.035 NCOA PVS Pass 6*PVS Score 1.045 0.005 NCOA PVS Pass 7 0.056 0.187 NCOA PVS Pass 7*PVS Score 1.145 0.190 VSGI-NAR Owner 1.510 0.003 VSGI-NAR Renter 0.583 0.002 VSGI-NAR Log Length of Residence 1.206 0.0008 VSGI-NAR Income <$20,000 0.531 0.002 VSGI-NAR Income $20,000-29,999 0.585 0.002 VSGI-NAR Income $30,000-39,999 0.648 0.002 VSGI-NAR Income $40,000-49,999 0.705 0.002 VSGI-NAR Income $50,000-74,999 0.788 0.002 VSGI-NAR Income $75,000-99,999 0.907 0.003 VSGI-NAR Income $100,000-124,999 0.963 0.003 VSGI-NAR Income $125,000-149,999 0.918 0.004

9
Notes: Sources include 2008-2009 IRS 1040 records, 2009-2010 USPS NCOA records, and 2010 Veteran Service Group of Illinois TrackerPlus (VSGI-TRK) Records. The odds ratios and robust standard errors are from logistic regressions with a dependent variable equal to one if the administrative record address is the same as the census address, and it is zero otherwise. The base categories are 25-44 for IRS 1040 age, white for IRS 1040 race, single filer for IRS 1040 filing status, destination address in April 2010 for NCOA address, $150,000 and above for VSGI-NAR income, and missing tenure for VSGI-NAR tenure.
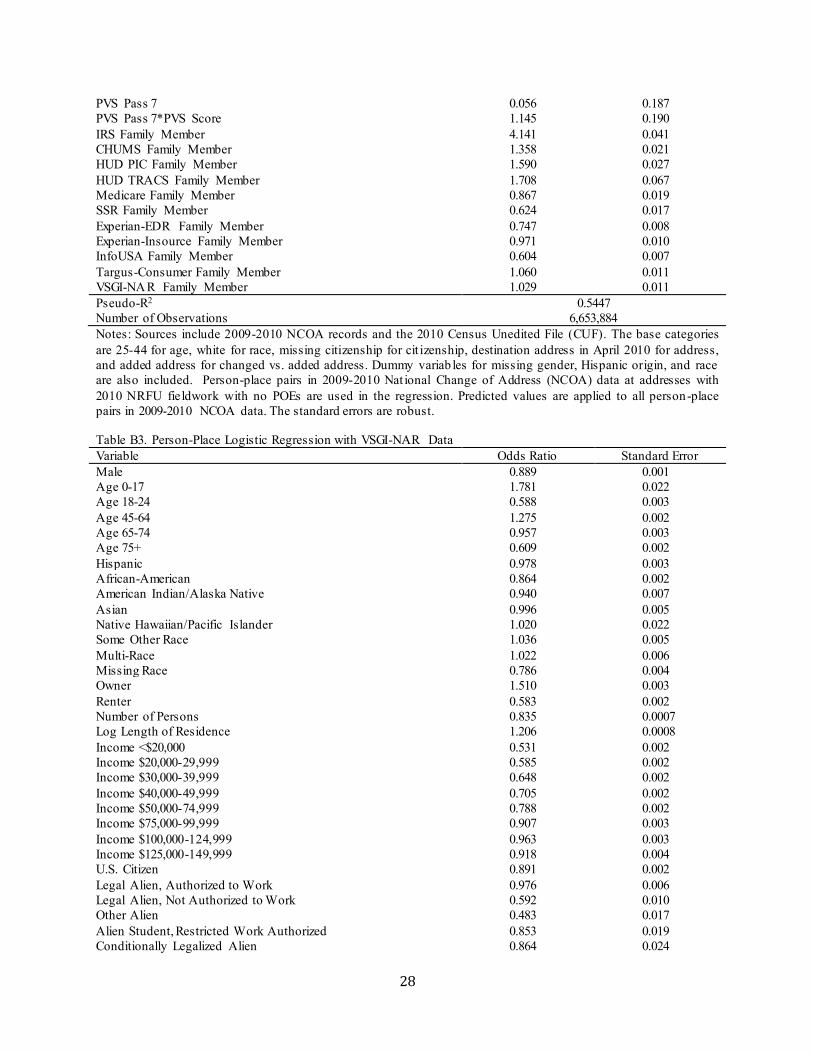
A second-stage regression predicts the person-place match propensity for each person-address pair found in at least one of the sources used in the first-stage regressions. The regression incorporates information from the first-stage regressions by including variab les indicating whether the person record is in each particular administrative record source at this address or a different one, plus interactions between these dummy variables and the individual match propensities obtained from the first-stage regression corresponding to the variable source for the particular person-place pair.12 In addition, the regression contains variables regarding the housing structure and decennial census paradata. Selected findings are presented in Table 5 below; full results are presented in Appendix Table B4.
Table 5. Second-Stage Person-Place Match Logistic Regression Findings Variable Odds Ratio Standard Error Mobile or Other Housing Structure 1.030 0.013 2-4-Unit Housing Structure 0.863 0.014 5-9-Unit Housing Structure 1.055 0.020 10-19-Unit Housing Structure 1.101 0.018 20-49-Unit Housing Structure 1.070 0.017 50+-Unit Housing Structure 1.066 0.015 Residential, Excluded from Delivery Statistics 0.472 0.021 In 2000 Census Here 1.168 0.010 In 2000 Census Elsewhere 1.280 0.007 Same Race for All Persons in Housing Unit 1.079 0.007 Same Hispanic Origin for All Persons in Housing Unit 1.022 0.009 Two Adrec PIKs in Housing Unit 0.891 0.009 Three Adrec PIKs in Housing Unit 0.646 0.007 Four Adrec PIKs in Housing Unit 0.608 0.007 Five Adrec PIKs in Housing Unit 0.570 0.007 Six Adrec PIKs in Housing Unit 0.514 0.006 Seven Adrec PIKs in Housing Unit 0.466 0.006 Eight Adrec PIKs in Housing Unit 0.439 0.007 Nine Adrec PIKs in Housing Unit 0.391 0.007 Ten or More Adrec PIKs in Housing Unit 0.271 0.007 IRS1040 Here 1.751 0.014 IRS 1040 Here*1st-Stage Match Propensity 3.522 0.036 IRS 1040 Elsewhere 0.537 0.004 IRS 1040 Elsewhere*1st-Stage Match Propensity 0.421 0.004 NCOA Here 0.102 0.002 NCOA Here*1st-Stage Match Propensity 90.056 2.736 NCOA Elsewhere 1.454 0.013 NCOA Elsewhere*1st-Stage Match Propensity 0.143 0.003 VSGI-NAR Here 1.511 0.056 VSGI-NAR Here*1st-Stage Match Propensity 0.850 0.047 VSGI-NAR Elsewhere 1.136 0.043 VSGI-NAR Elsewhere*1st-Stage Match Propensity 0.844 0.048
12 The rat ionale for the interactions is that the location where a source lists a person should carry more weight if the first-stage match propensity is high. For the three sources without person informat ion in 2010, dummy variables are included for whether the source has at least one record for the housing unit and interactions between those dummy variables and their first-stage occupancy probability from a housing unit status multinomial logit model.

10
Notes: Sources include all those listed in Table 1, the 2010 Census Unedited File (CUF), and the January 2011 Master Address File (MAF). This is a logistic regression with a dependent variable equal to one if the administrative record address is the same as the census address for the person, and it is zero otherwise. The base categories include single-unit structure for housing structure type and not in the 2000 Census for 2000 Census person categories. The first-stage occupancy propensities for Texas SNAP, Targus National Address File, and Corelogic come from the occupancy models described in footnote 16. The first-stage match propensity is the person-place pair’s predicted value from the first-stage regression corresponding to the source the propensity is being interacted with. A 10 percent random sample of person-place pairs is drawn, and the ones that are at addresses with no U.S. Postal Service Undeliverab le As Addressed (UAA) received after the questionnaire mailing and with 2010 NRFU fieldwork with no POEs are used in the regression. A random sample is taken due to computer processing constraints. The standard errors are cluster-adjusted at the housing-unit level.
Characteristics predicting a d iscrepancy between a person being at the administrative record address versus the census address include being in a small, multi-unit housing structure, an address excluded from the USPS Delivery Sequence File (DSF) delivery statistics, reporting mixed races or Hispanic origins across persons assigned to the housing unit by administrative records, persons not found in the 2000 Census, and large numbers of persons with this address in administrative records.
For most administrative record sources for a person, having a record from that source at this address is a more powerful predictor of an administrative record-census person-place match when this person-place’s match propensity from that source’s first-stage regression is high. In addit ion, if the person has a record from the source at a different address from the one being examined, and the person-place match propensity at the other address is high (low), then the person’s match propensity at the examined address is reduced (raised). The fact that these results for individual sources remain highly significant even when controlling for other sources suggests that agreement among the sources improves the probability that the person is enumerated at that address. Each source contributes predictive power despite the large number of sources with heterogeneous perceived quality ex ante.13
Using out-of-sample predict ions, the second-stage regression produces a propensity for the person to be at a particular address for all PIKs alive on Census Day and at an address in the census.14 We use these results to create an admin istrative records composite, selecting the address with the highest propensity for each person’s PIK.15 We sum these records to construct the administrative record population count for each housing unit. We use the minimum propensity among persons assigned to the housing unit as the housing unit’s administrative records quality score.16
3.3 Predicting Census Enumeration Quality
With these preparations complete – POEs flagged on the census records and quality scores on the administrative records – we can calculate a quality score for each census enumeration. The score is set to one if the enumeration has no POEs. For enumerations with POEs, the score equals the mean agreement rate between the census and high-quality administrative records17 for the particular combination of POEs the housing unit has in 2010.18
13 For example, one might assume prior to study that tax records are more reliable than commercial records. 14 This implicit ly assumes that the administrative record characteristics predicting the address match propensity at addresses where the census enumeration has no potential errors are the same as the ones predicting the propensity for the administrative records to place the person at the correct Census Day address in cases where the census enumeration has potential errors and/or had a self-response. 15 Each person is assigned a single address, because the decennial census aims to count each person once in a single residence. For datasets with multiple implicates, such as the Longitudinal Employer-Household Dynamics (LEHD) program, one could consider assigning fractions of persons to each of the addresses found for the person in administrative records, with weights based on the relative propensities to match to the census. 16 We have also tried using the mean propensity among persons assigned to the housing unit to rank housing units, and that ranking is highly correlated with the minimum propensity score ranking. 17 High-quality administrative records are defined as follows. High-quality USPS Undeliverable As Addressed (UAA) for vacancy reasons (UAA-vacant) and non-UAA housing units have an occupancy probability of two percent or less or a likelihood that the admin istrative record population count matches the census count of 90 percent or more, while h igh-quality UAA for other reasons (UAA-other) housing units have an occupancy probability of
11
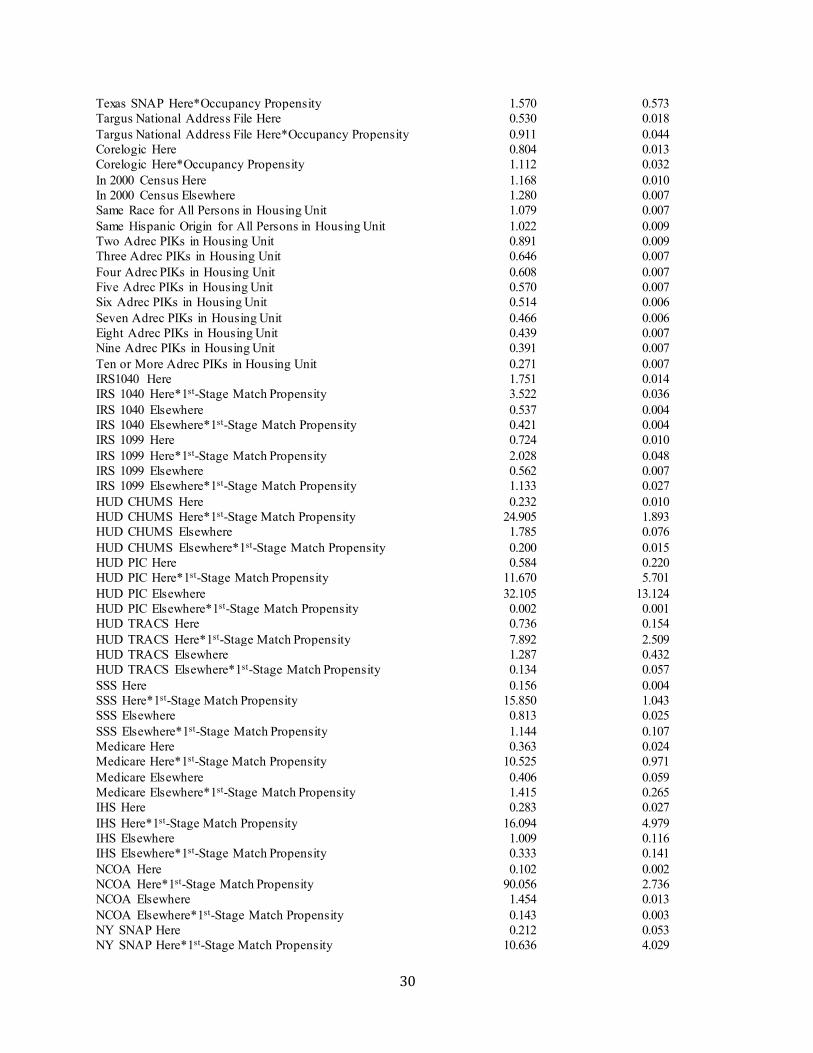
We then use these enumeration quality scores as the dependent variable in models predicting the quality of census enumerations by mode (self-response or NRFU fieldwork). 19 We employ a quasi-likelihood function, using a binomial family variance with a logistic link, since the dependent variable takes on values in the 0-1 interval.20 Housing units with a self-response in 2010 are eligible to be included in the self-response logistic regression models for this dependent variable. The exp lanatory variables are aggregated to the housing unit level, using shares of individuals having each characteristic (e.g., in a particular age category). The coefficients are applied to all housing units. Analogously, NRFU housing units are eligib le to be in the NRFU logistic regression models. As is the case in the person-place models above, the second-stage models include dummy variab les for whether each source has any records for the housing unit, plus interactions between those variables and the first-stage propensities from those sources.
Full results are shown in Appendix C. In the first-stage self-response enumeration quality regressions for IRS 1040, NCOA, and VSGI-NAR, we find the following variables are positively associated with a h igh-quality census enumeration via self-response:
Persons aged 65-74, Married couples, High stability of the household roster across the 2008 and 2009 IRS 1040 filings, and Middle income.
The following variables are associated with low-quality census enumeration via self-response:
Deceased individuals, Males, Persons aged 18-24, Minorities, Persons with Schedule C filings, Persons on an IRS 1040 return as a dependent at one address and on another return as a non-dependent at a
second address, Unvalidated records, Frequent moves, and particularly moves near Census Day.
Results for the second-stage regression are shown in Appendix Table C4. The following characteristics are associated with poor-quality self-responses:
mobile homes and small multi-unit structures, addresses deleted or with imputed responses in the 2000 Census,
five percent or less or a population count match likelihood of 80 percent or more. The values are less strict for UAA-other, because too few UAA-other housing units meet the more strict criteria to be able to produce reliable estimates. Occupancy probabilities come from a series of multinomial logit regression models using occupied vs. vacant vs. delete in the Census as the dependent variable, focusing on housing units without potential errors. As with the person-place models, we first run separate occupancy regressions by admin istrative record source to obtain propensities for each source-address pair, then run a second-stage regression using dummies for present at this address, present interacted with the vacant propensity from the first-stage regression, and present interacted with the delete propensity from the first-stage regression as explanatory variab les, along with various characteristics from the MAF. 18 We calculate means for each pairwise combination o f potential erro rs , provided they have at least 100 observations. For housing units with more than two potential errors, we use the min imum value from among their pairwise potential error combinations’ means . 19 Not reported here, we have also estimated separate models by NRFU fieldwork contact attempt number and for proxy responses. The NRFU results shown here are for all NRFU contact attempt numbers, and they include household member and proxy responses. 20 Wedderburn (1974) was the first to suggest this model for such dependent variables. Hardin and Hilbe (2007) show how to implement it in Stata.

12
excluded from DSF delivery statistics, 2010 address canvassing or otherwise added addresses, addresses with an additional questionnaire sent, bilingual questionnaires, and low first-stage response quality propensities.
Appendix D d isplays regression results for fieldwork enumeration quality. Unlike with self-response quality, deceased persons and addresses not in the DSF delivery statistics are highly positively associated with fieldwork quality. People may self-respond in March, then pass away before Census Day, leading to an enumerat ion error. In contrast, NRFU fieldwork occurs after the person’s death, and neighbors are likely to know about the person’s passing. Persons 75 or over are more strongly positively associated with fieldwork quality than self-response quality, possibly because they are more homebound than other age groups. Higher-income and owner-occupied households are also more strongly positively associated with fieldwork quality than self -response quality. Otherwise, the patterns are similar to those for self-response quality.
3.4 Comparing Administrative Record and Enumeration Quality Predictions Against a Post-Enumeration Survey
We calculate agreement rates among the administrative record count, census count, and the CCM count for housing units grouped by potential errors , focusing on housing units with high-quality admin istrative records . These results, displayed in Table 6, exh ibit h igher CCM-census agreement rates than those in Table 3 that also include housing units with lower-quality administrative records , suggesting that survey-style enumeration quality is positively correlated with administrative record quality. As is the case in Table 3, these results show that all cases flagged as potential sources of error have lower levels of agreement across sources than cases that have no flags. The number of potential errors is also negatively correlated with percent agreement. 21 Of special interest is that addresses with household moves have lower agreement rates between either the CCM or the census and admin istrative records than between the CCM and the census. The CCM and the census, which are both survey-style sources, may well suffer from the same measurement error; the CCM appears to have particular d ifficulty handling moves, possibly due to the several month lag between Census Day and the fieldwork.
Application of the average CCM-census agreement rates for each POE or combination of POEs to non-CCM housing units with those POEs could be considered as an alternative approach to assessing housing unit-level census enumeration quality. The CCM is a relatively s mall survey, however, resulting in a s mall number o f observations for each particular type of POE and thus estimates with a low level of confidence. And the apparent correlation in census and CCM enumeration difficulties may make admin istrative records with high predicted quality a preferable benchmark.
21 Agreement here means the two sources have the same housing unit population count.

13
Table 6. Percent Agreement between CCM, Census, and Administrative Record Household Counts by Potential Observable Error (POE) Type, High-Quality Administrative Records Sample Error Type CCM-
Administrative Record Agreement
Rate
Census-Administrative
Record Agreement Rate
CCM-Census Agreement Rate
Number of Observations
All Observations 93.6 94.9 94.9 15,743 No POEs 95.6 97.7 97.2 13,773 At Least One POE 78.6 74.6 79.0 1,970 One POE 81.6 81.8 86.3 1,451 Two or More POEs 69.2 52.4 56.6 519 Not Alive 90.7 86.7 83.5 124 Duplicate 68.0 55.2 65.1 410 Occupied Proxy 77.1 69.2 69.4 293 Unvalidated Persons 70.4 52.8 66.5 481 Conflicting Responses
66.4 60.9 60.8 79
Moved In Before 4/1, Not Counted
47.0 56.7 73.5 78
Moved Out After 4/1, Not Counted
73.6 79.3 81.8 50
Count ≠ Number of Persons, CFU
85.7 71.2 72.0 61
Count ≠ Number of Persons, Non-CFU
85.0 79.6 79.2 264
Yes to Undercount Question, CFU
71.3 66.5 78.8 84
Yes to Overcount Question, CFU
86.9 71.9 69.8 90
Yes to Overcount Question, Non-CFU
82.4 84.8 82.8 512
Sources: all person-address admin istrative record sources in Table 1, the 2010 Census Decennial Response File (DRF), the 2010 Census Unedited File (CUF), and the 2010 Census Coverage Measurement survey (CCM). These are weighted using CCM weights. Only housing units with high-quality admin istrative records and in the CCM are included here.
Finally, we examine the usefulness of our administrative record quality scores for predict ing agreement among administrative records, Census, and CCM housing unit population counts. We do this by sorting housing units by their predicted admin istrative record-census agreement rates. Here the predicted admin istrative record-census agreement rate is the mean agreement between admin istrative records and Census enumerations without POEs separately for 100 administrative record quality score one percentage point bins , using all housing units with at least one admin istrative record and no POEs for these calculations.22 For 17 groups of these predicted agreement rates (0-9.99, 10-19.99, 20-24.99,…, 85-89.99, 90-100), 23 we calculate the actual agreement rates among admin istrative record counts, census counts, and CCM counts for the housing units in our CCM sample, and we display them in Figures 2-4. The X-axis represents the 17 predicted administrative record-census agreement rate groups in ascending order (each value on the X-axis is displayed at the upper value of the range for each group). The Y-axis is the percent of the housing units with the same population count across the two or three sources. In addit ion to pair-wise
22 These agreement rates are monotonically increasing in the quality score. 23 We use five-percentage-point groups here, as single-percentage-point bins have too few observations. Values in the tails are particularly scarce, so we group together 0-9.99, as well as 90-100.

14
and three-way agreement among the administrative record composite, the CCM, and the census, we also display predicted Census enumeration quality produced by the model in the previous subsection.24
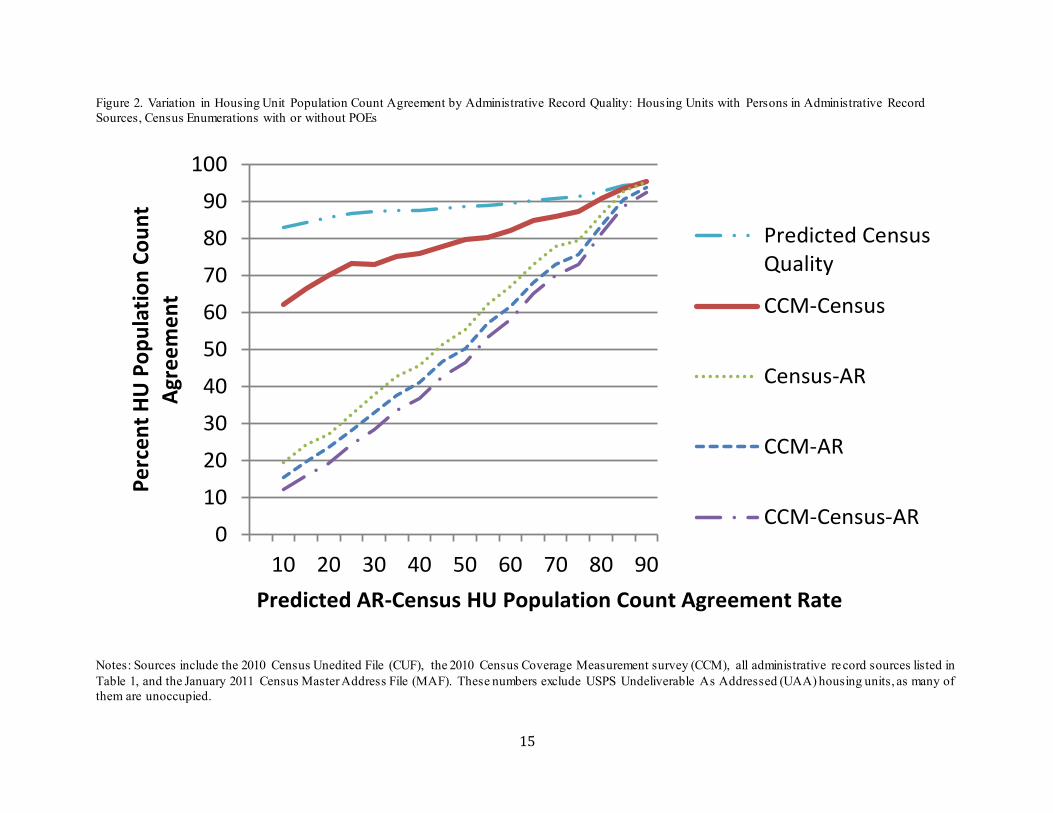
Figure 2, which includes housing units both with and without census POEs, shows that the agreement rates involving administrative records range from the teens to the 90’s, increasing monotonically with the administrative record quality score. The CCM -census agreement rate also increases with admin istrative record quality, with a variation of over 30 percentage points across the administrative record quality score distribution.
Predicted census enumeration quality is also monotonically increasing in administrative record quality scores, again suggesting that census enumeration and admin istrative record enumeration both tend to be more difficult in the same housing units. The census quality line has a much more gradual slope than that of the CCM-census agreement rate, reflecting the difficu lty the models have at predicting which housing units are likely to have poor-quality census enumerations. The gap between the two lines is roughly half the distance between the CCM -census agreement rate and 100 percent in the lower part of the admin istrative record quality range. If one were to assume that when the CCM and the census disagree, each is “correct” half the time (rather than both being “incorrect”), then this gap is about right.
Predicted census enumerat ion quality and especially the CCM-census agreement rate are much lower when the census enumeration has at least one POE (Figure 3) than it is for those with none (Figure 4). The actual administrative record agreement rates are less strongly associated with predicted administrative record-census agreement when the census enumeration has at least one POE. At the 90 percent predicted admin istrative record-census agreement level, the CCM-administrative record agreement rate is 96 percent without POEs in the census enumeration, but it is only 80 percent when there is at least one potential erro r in the Census. This again suggests that the census and the CCM tend to have enumeration difficulties in the same housing units .
Note, however, that the models are estimated using census enumerations without POEs, so the predictions in Figure 3 are all out of sample. A potential weakness of our application of non-POE housing units to study associations between various characteristics and census-admin istrative record agreement to POE housing units is that there may be unobservable systematic differences between POE and non-POE housing units (e.g., POE housing units may have a higher rate of household moves not captured in admin istrative records than non-POE housing units do). The fact that all the agreement rates in Figure 3 are monotonically increasing in administrative record quality suggests that the models’ administrative record-census predicted agreement rates are still highly relevant for POE housing units.
24 This is predicted self-response quality for housing units with a self-response in 2010 and predicted fieldwork quality for all other housing units.
15
Figure 2. Variation in Housing Unit Population Count Agreement by Administrative Record Quality: Housing Units with Persons in Administrative Record Sources, Census Enumerations with or without POEs
Notes: Sources include the 2010 Census Unedited File (CUF), the 2010 Census Coverage Measurement survey (CCM), all administrative re cord sources listed in Table 1, and the January 2011 Census Master Address File (MAF). These numbers exclude USPS Undeliverable As Addressed (UAA) housing units, as many of them are unoccupied.
0
10
20
30
40
50
60
70
80
90
100
10 20 30 40 50 60 70 80 90
Per
cen
t H
U P
op
ula
tio
n C
ou
nt
Agr
eem
ent
Predicted AR-Census HU Population Count Agreement Rate
Predicted CensusQuality
CCM-Census
Census-AR
CCM-AR
CCM-Census-AR

16
Figure 3. Variation in Housing Unit Population Count Agreement by Administrative Record Quality: Housing Un its with Persons in Administrative Records, Census Enumerations with At Least One POE
Notes: Sources include the 2010 Census Unedited File (CUF), the 2010 Census Coverage Measurement survey (CCM), all administrative re cord sources listed in Table 1, and the January 2011 Census Master Address File (MAF). These numbers exclude USPS Undeliverable As Addressed (UAA) housing units, as many of them are unoccupied.
0
10
20
30
40
50
60
70
80
90
100
10 20 30 40 50 60 70 80 90
Per
cen
t H
U P
op
ula
tio
n C
ou
nt
Agr
eem
ent
Predicted AR-Census HU Population Count Agreement Rate
Predicted CensusQuality
CCM-Census
Census-AR
CCM-AR
CCM-Census-AR

17
Figure 4. Variation in Housing Unit Population Count Agreement by Administrative Record Quality: Housing Units with Persons in Administrative Records, Census Enumerations with No POEs
Notes: Sources include the 2010 Census Unedited File (CUF), the 2010 Census Coverage Measurement survey (CCM), all administra tive record sources listed in Table 1, and the January 2011 Census Master Address File (MAF). These numbers exclude USPS Undeliverable As Addressed (UAA) housing units, as many of them are unoccupied.
0
10
20
30
40
50
60
70
80
90
100
10 20 30 40 50 60 70 80 90
Pe
rce
nt
HU
Po
pu
lati
on
Co
un
t A
gre
em
en
t
Predicted AR-Census HU Population Count Agreement Rate
Predicted CensusQuality
CCM-Census
Census-AR
CCM-AR
CCM-Census-AR

18
4. Conclusion This paper demonstrates mult iple methods to assess data quality and to exp lore the accuracy of respondent -provided data, proxy-provided data, and administrative records. Our findings focus on the decennial census , but our processes can be applied to other surveys or evaluations.25 Future research may extend our study of potential observable errors, particu larly for the timing of enumerat ions. Potential errors associated with move t iming can help understand whether respondents (or administrative records) engage in a de jure vs. de facto census. Our administrative record quality scores can serve as housing-unit-level hard-to-count scores. These scores may inform decisions about whether to use admin istrative records or fieldwork to enumerate individual housing units. Finally, our approach to forming an admin istrative record composite can assist research and planning for decennial census and adaptive design applications, providing a rigorous, repeatable process to compile multiple sources .
25 Note that our evaluation of these methods is limited to housing unit population count, while surveys collect many other types of data as well. We leave analysis of how well administrative records can help with collection of other data items to future research.
19
References Groen, J.A. (2012). Sources of Error in Survey and Administrative Data: The Importance of Reporting Procedures. Journal of Official Statistics, Vol. 28, No. 2, 2012, pp. 173-198. Groves, R.M., Fowler, F.J., Couper, .P., Lepkowski, J.M., Singer, E., and Tourangeau, R. (2009). Survey Methodology (2nd edn). Hoboken, NJ: John Wiley & Sons. Hardin, James W., and Joseph M. Hilbe, 2007. Generalized Linear Models and Extensions, Second Edit ion. College Station, Texas: Stata Press. Mulry, M.H., Bean, S.L., Bauder, D.M., Wagner, D., Mule, T., and Petroni, R.J. (2006). Evaluation of Estimates of Census Duplication Using Administrative Records Information. Mule, Tom, 2008. “2010 Census Coverage Measurement Estimat ion Methodology.” DSSD 2010 Census Coverage Measurement Memorandum Series #2010-E-18.
Pritts, Mary, 2013. “2010 Census: Comparisons of Unit Status and Household Size Between Census and Census Coverage Measurement Addresses.” DSSD 2010 Decennial Census Memorandum Series #J-15.
Breyer, Stephen G. 2002. “Utah et al., Appellants v. Donald L. Evans, Secretary of Commerce, et al.,” Majority Opinion. Downloaded from http://www.law.cornell.edu/supct/html/01-714.ZS.html on June 7, 2013.
Meyer, Bruce D., and Robert M. Goerge, 2011. “Errors in Survey Reporting and Imputation and their Effects on Estimates of Food Stamp Program Participation,” working paper.
Mule, Thomas, 2012. “Census Coverage Measurement Estimation Report: Summary of Estimates of Coverage for Persons in the United States,” DSSD 2010 Census Coverage Measurement Memorandum Series #2010-G-01.
Rastogi, Sonya, and Amy O’Hara. 2012. “2010 Cens us Match Study.” 2010 Census Planning Memorandum Series, No. 247.
Wedderburn, Robert W.M., 1974. “Quasi-likelihood Functions, Generalized Linear Models, and the Gauss -Newton Method.” Biometrika 61(3): 439-447.
20
Appendix A: Associations Between Potential Observable Errors (POEs) and NCOA Moves
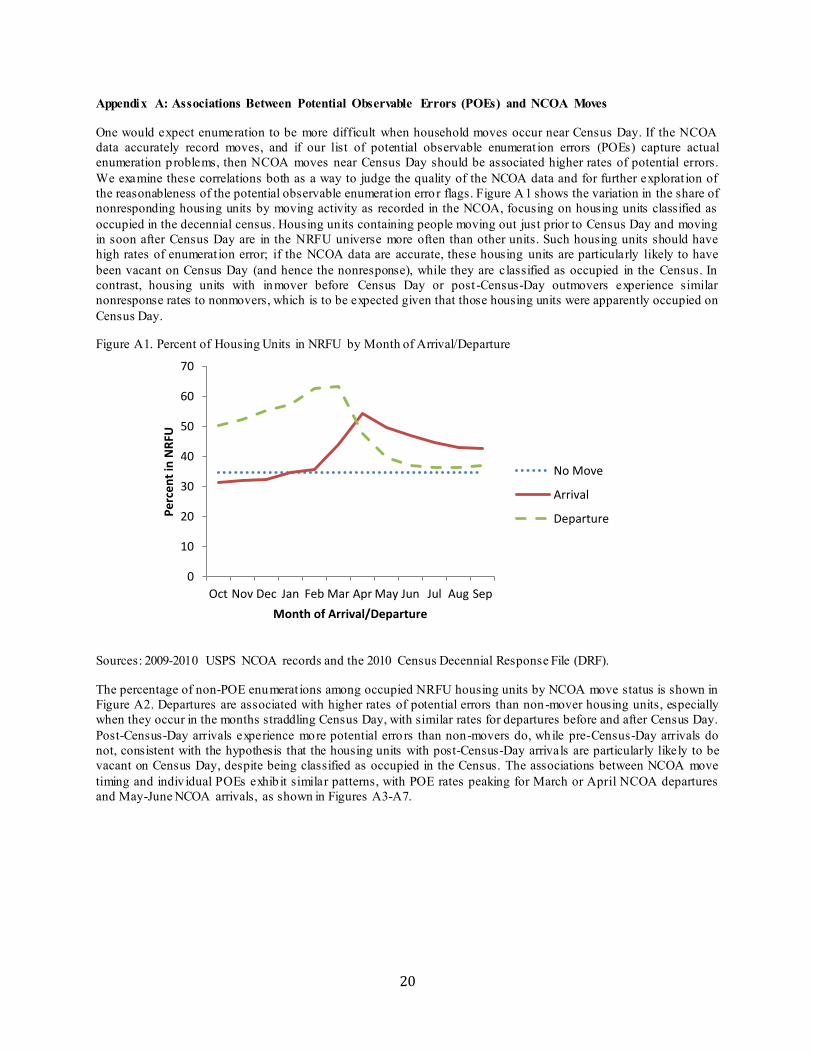
One would expect enumeration to be more difficult when household moves occur near Census Day. If the NCOA data accurately record moves, and if our list of potential observable enumerat ion errors (POEs) capture actual enumeration p roblems, then NCOA moves near Census Day should be associated higher rates of potential errors. We examine these correlations both as a way to judge the quality of the NCOA data and for further explorat ion of the reasonableness of the potential observable enumerat ion erro r flags. Figure A1 shows the variation in the share of nonresponding housing units by moving activity as recorded in the NCOA, focusing on housing units classified as occupied in the decennial census. Housing units containing people moving out just prior to Census Day and moving in soon after Census Day are in the NRFU universe more often than other units. Such housing units should have high rates of enumerat ion error; if the NCOA data are accurate, these housing units are particularly likely to have been vacant on Census Day (and hence the nonresponse), while they are classified as occupied in the Census. In contrast, housing units with inmover before Census Day or post -Census-Day outmovers experience similar nonresponse rates to nonmovers, which is to be expected given that those housing units were apparently occupied on Census Day.
Figure A1. Percent of Housing Units in NRFU by Month of Arrival/Departure
Sources: 2009-2010 USPS NCOA records and the 2010 Census Decennial Response File (DRF).
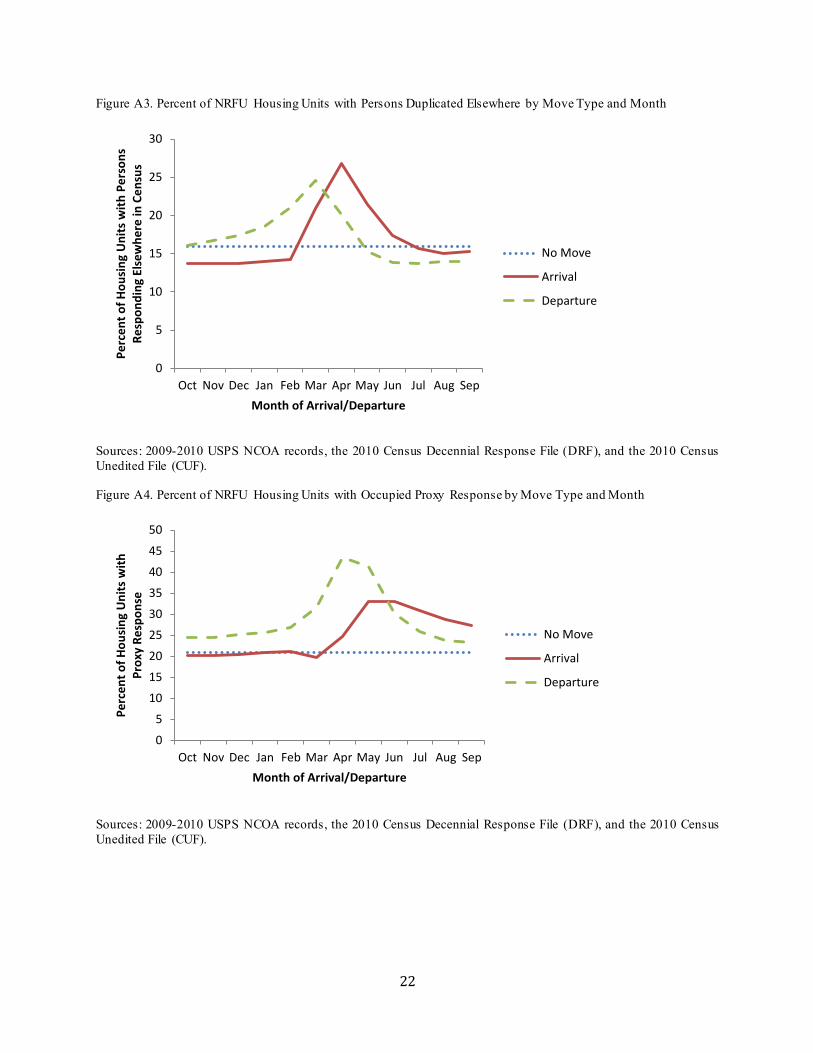
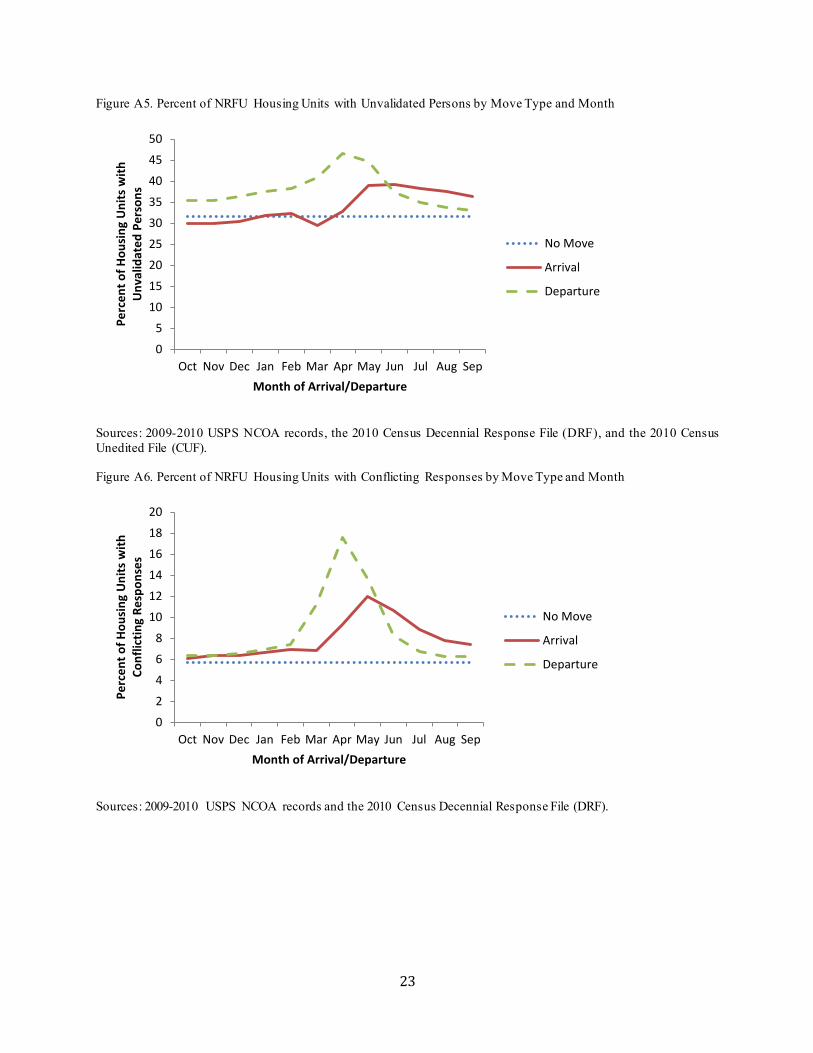
The percentage of non-POE enumerat ions among occupied NRFU housing units by NCOA move status is shown in Figure A2. Departures are associated with higher rates of potential errors than non-mover housing units, especially when they occur in the months straddling Census Day, with similar rates for departures before and after Census Day. Post-Census-Day arrivals experience more potential erro rs than non-movers do, while pre-Census-Day arrivals do not, consistent with the hypothesis that the housing units with post-Census-Day arrivals are particularly likely to be vacant on Census Day, despite being classified as occupied in the Census. The associations between NCOA move timing and indiv idual POEs exhib it similar patterns, with POE rates peaking for March or April NCOA departures and May-June NCOA arrivals, as shown in Figures A3-A7.
0
10
20
30
40
50
60
70
Oct Nov Dec Jan Feb Mar Apr May Jun Jul Aug Sep
Pe
rce
nt
in N
RFU
Month of Arrival/Departure
No Move
Arrival
Departure

21
Figure A2. Percent of Non-POE NRFU Housing Units by Move Type and Month
Sources: 2009-2010 USPS NCOA records and the 2010 Census Decennial Response File (DRF).
0
5
10
15
20
25
30
35
40
45
50
Oct Nov Dec Jan Feb Mar Apr May Jun Jul Aug Sep
Pe
rce
nt
No
n-P
OE
Month of Arrival/Departure
No Move
Arrival
Departure
22
Figure A3. Percent of NRFU Housing Units with Persons Duplicated Elsewhere by Move Type and Month
Sources: 2009-2010 USPS NCOA records, the 2010 Census Decennial Response File (DRF), and the 2010 Census Unedited File (CUF).
Figure A4. Percent of NRFU Housing Units with Occupied Proxy Response by Move Type and Month
Sources: 2009-2010 USPS NCOA records, the 2010 Census Decennial Response File (DRF), and the 2010 Census Unedited File (CUF).
0
5
10
15
20
25
30
Oct Nov Dec Jan Feb Mar Apr May Jun Jul Aug Sep
Pe
rce
nt
of
Ho
usi
ng
Un
its
wit
h P
ers
on
s R
esp
on
din
g El
sew
he
re in
Ce
nsu
s
Month of Arrival/Departure
No Move
Arrival
Departure
0
5
10
15
20
25
30
35
40
45
50
Oct Nov Dec Jan Feb Mar Apr May Jun Jul Aug Sep
Pe
rce
nt
of
Ho
usi
ng
Un
its
wit
h
Pro
xy R
esp
on
se
Month of Arrival/Departure
No Move
Arrival
Departure
23
Figure A5. Percent of NRFU Housing Units with Unvalidated Persons by Move Type and Month
Sources: 2009-2010 USPS NCOA records, the 2010 Census Decennial Response File (DRF), and the 2010 Census Unedited File (CUF).
Figure A6. Percent of NRFU Housing Units with Conflicting Responses by Move Type and Month
Sources: 2009-2010 USPS NCOA records and the 2010 Census Decennial Response File (DRF).
0
5
10
15
20
25
30
35
40
45
50
Oct Nov Dec Jan Feb Mar Apr May Jun Jul Aug Sep
Pe
rce
nt
of
Ho
usi
ng
Un
its
wit
h
Un
valid
ate
d P
ers
on
s
Month of Arrival/Departure
No Move
Arrival
Departure
0
2
4
6
8
10
12
14
16
18
20
Oct Nov Dec Jan Feb Mar Apr May Jun Jul Aug Sep
Pe
rce
nt
of
Ho
usi
ng
Un
its
wit
h
Co
nfl
icti
ng
Re
spo
nse
s
Month of Arrival/Departure
No Move
Arrival
Departure

24
Figure A7. Percent of NRFU Housing Units with Different Household Count and Number of Listed Persons by Move Type and Month
Sources: 2009-2010 USPS NCOA records, the 2010 Census Decennial Response File (DRF), and the 2010 Census Unedited File (CUF).
0
2
4
6
8
10
12
14
16
18
20
Oct Nov Dec Jan Feb Mar Apr May Jun Jul Aug Sep
Pe
rce
nt
of
Ho
usi
ng
Un
its
wh
ere
Co
un
t an
d N
um
be
r o
f Li
ste
d P
ers
on
s ar
e
Un
eq
ual
Month of Arrival/Departure
No Move
Arrival
Departure

25
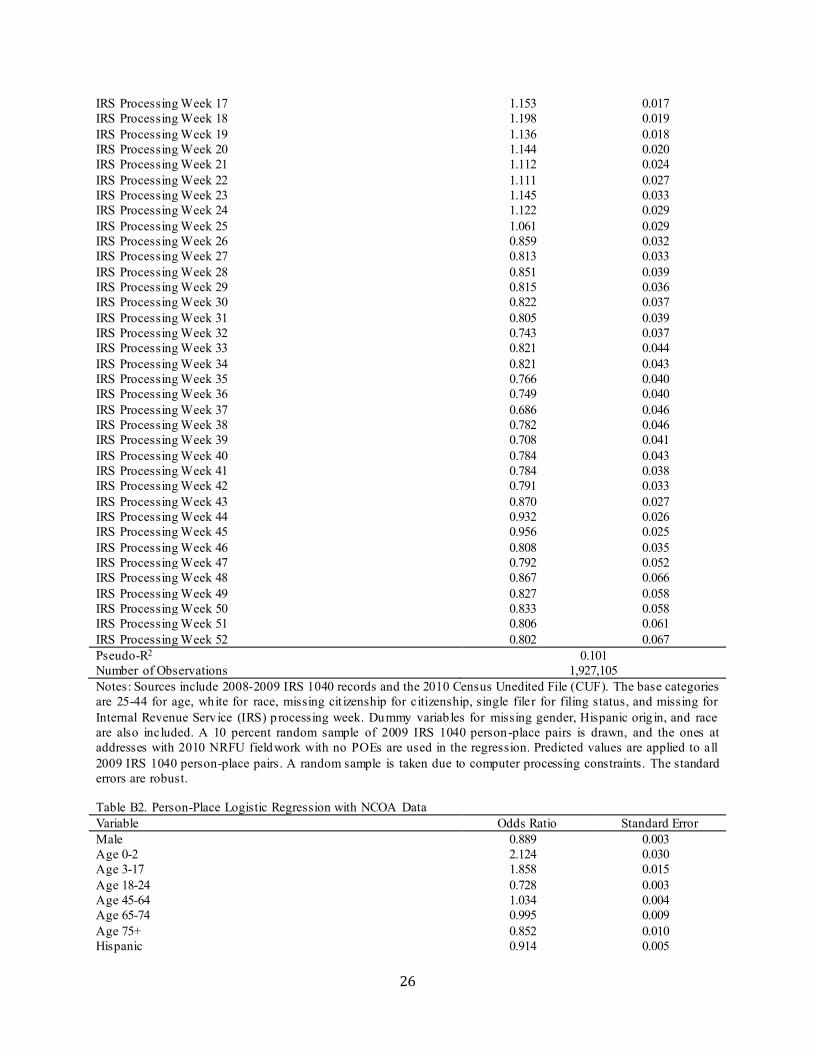
Appendix B: Person-Place Logistic Regressions Table B1. Person-Place Logistic Regression with IRS 1040 Data Variable Odds Ratio Standard Error Male 0.812 0.004 Age 0-2 2.870 0.039 Age 3-17 2.884 0.029 Age 18-24 0.731 0.005 Age 45-64 1.096 0.007 Age 65-74 0.677 0.008 Age 75+ 0.450 0.006 Hispanic 0.800 0.006 African-American 0.592 0.003 American Indian/Alaska Native 0.787 0.015 Asian 0.967 0.013 Native Hawaiian/Pacific Islander 0.885 0.047 Some Other Race 1.020 0.013 Multi-Race 1.035 0.016 Married Filing Jointly 2.792 0.020 Married Filing Separately 1.092 0.016 Filing as Household Head 1.121 0.008 Filing as Widow 2.304 0.177 Return has Secondary Filer 0.692 0.008 Return has At Least One Dependent 1.606 0.015 Is Secondary Filer 0.735 0.005 Is Dependent 0.423 0.004 Return has Child Away 0.766 0.026 Is Dependent*Return has Child Away 0.262 0.014 Return Contains Schedule C 1.023 0.009 Return Contains Schedule D 1.028 0.009 Return Contains Schedule E 0.901 0.008 Return Contains Schedule F 0.859 0.018 Return Contains Schedule SE 0.848 0.008 U.S. Citizen 0.866 0.007 Legal Alien, Authorized to Work 0.760 0.014 Legal Alien, Not Authorized to Work 0.534 0.021 Other Alien 0.225 0.012 Alien Student, Restricted Work Authorized 0.951 0.067 Conditionally Legalized Alien 0.645 0.044 Ever Alien 0.885 0.013 ITIN 1.448 0.764 Both 2008 & 2009 1040 Return Here 2.289 0.011 Electronic Filer 0.974 0.007 IRS Processing Week 4 0.519 0.006 IRS Processing Week 5 0.610 0.006 IRS Processing Week 6 0.693 0.006 IRS Processing Week 7 0.759 0.007 IRS Processing Week 8 0.820 0.010 IRS Processing Week 9 0.879 0.011 IRS Processing Week 10 0.909 0.012 IRS Processing Week 11 0.958 0.014 IRS Processing Week 12 1.030 0.016 IRS Processing Week 13 1.067 0.018 IRS Processing Week 14 1.087 0.018 IRS Processing Week 15 1.084 0.018 IRS Processing Week 16 1.164 0.015
26
IRS Processing Week 17 1.153 0.017 IRS Processing Week 18 1.198 0.019 IRS Processing Week 19 1.136 0.018 IRS Processing Week 20 1.144 0.020 IRS Processing Week 21 1.112 0.024 IRS Processing Week 22 1.111 0.027 IRS Processing Week 23 1.145 0.033 IRS Processing Week 24 1.122 0.029 IRS Processing Week 25 1.061 0.029 IRS Processing Week 26 0.859 0.032 IRS Processing Week 27 0.813 0.033 IRS Processing Week 28 0.851 0.039 IRS Processing Week 29 0.815 0.036 IRS Processing Week 30 0.822 0.037 IRS Processing Week 31 0.805 0.039 IRS Processing Week 32 0.743 0.037 IRS Processing Week 33 0.821 0.044 IRS Processing Week 34 0.821 0.043 IRS Processing Week 35 0.766 0.040 IRS Processing Week 36 0.749 0.040 IRS Processing Week 37 0.686 0.046 IRS Processing Week 38 0.782 0.046 IRS Processing Week 39 0.708 0.041 IRS Processing Week 40 0.784 0.043 IRS Processing Week 41 0.784 0.038 IRS Processing Week 42 0.791 0.033 IRS Processing Week 43 0.870 0.027 IRS Processing Week 44 0.932 0.026 IRS Processing Week 45 0.956 0.025 IRS Processing Week 46 0.808 0.035 IRS Processing Week 47 0.792 0.052 IRS Processing Week 48 0.867 0.066 IRS Processing Week 49 0.827 0.058 IRS Processing Week 50 0.833 0.058 IRS Processing Week 51 0.806 0.061 IRS Processing Week 52 0.802 0.067 Pseudo-R2 0.101 Number of Observations 1,927,105 Notes: Sources include 2008-2009 IRS 1040 records and the 2010 Census Unedited File (CUF). The base categories are 25-44 for age, white for race, missing cit izenship for citizenship, single filer for filing status, and missing for Internal Revenue Serv ice (IRS) p rocessing week. Dummy variab les for missing gender, Hispanic orig in, and race are also included. A 10 percent random sample of 2009 IRS 1040 person-place pairs is drawn, and the ones at addresses with 2010 NRFU fieldwork with no POEs are used in the regression. Predicted values are applied to all 2009 IRS 1040 person-place pairs. A random sample is taken due to computer processing constraints. The standard errors are robust.
Table B2. Person-Place Logistic Regression with NCOA Data Variable Odds Ratio Standard Error Male 0.889 0.003 Age 0-2 2.124 0.030 Age 3-17 1.858 0.015 Age 18-24 0.728 0.003 Age 45-64 1.034 0.004 Age 65-74 0.995 0.009 Age 75+ 0.852 0.010 Hispanic 0.914 0.005
27
African-American 0.850 0.004 American Indian/Alaska Native 0.850 0.011 Asian 1.080 0.010 Native Hawaiian/Pacific Islander 1.189 0.040 Some Other Race 1.028 0.010 Multi-Race 1.071 0.011 Destination Address in May 2009 0.939 0.006 Destination Address in June 2009 1.001 0.007 Destination Address in July 2009 1.037 0.007 Destination Address in August 2009 1.054 0.007 Destination Address in September 2009 1.069 0.007 Destination Address in October 2009 1.099 0.008 Destination Address in November 2009 1.150 0.008 Destination Address in December 2009 6.171 0.072 Destination Address in January 2010 6.209 0.072 Destination Address in February 2010 6.400 0.077 Destination Address in March 2010 6.792 0.072 Destination Address in April 2010 0.033 0.0004 Departure Address in April 2009 0.019 0.0003 Departure Address in May 2009 0.017 0.0002 Departure Address in June 2009 0.015 0.0002 Departure Address in July 2009 0.015 0.0002 Departure Address in August 2009 0.014 0.0002 Departure Address in September 2009 0.015 0.0002 Departure Address in October 2009 0.015 0.0002 Departure Address in November 2009 0.014 0.0002 Departure Address in December 2009 0.009 0.0002 Departure Address in January 2010 0.010 0.0002 Departure Address in February 2010 0.009 0.0001 Departure Address in March 2010 0.006 0.0001 Departure Address in April 2010 0.510 0.006 U.S. Citizen 0.884 0.005 Legal Alien, Authorized to Work 0.915 0.011 Legal Alien, Not Authorized to Work 0.714 0.024 Other Alien 0.479 0.035 Alien Student, Restricted Work Authorized 0.914 0.035 Conditionally Legalized Alien 0.783 0.049 Ever Alien 1.116 0.012 ITIN 0.874 0.258 Family Move 1.234 0.004 Undeliverable Flag F 0.137 0.028 Undeliverable Flag G 0.119 0.016 Undeliverable Flag K 0.814 0.011 Changed Address (vs. Added Address) 0.259 0.0008 PVS Pass 1 2.097 0.073 PVS Pass 1*PVS Score 0.983 0.001 PVS Pass 2 0.577 0.448 PVS Pass 2*PVS Score 1.055 0.041 PVS Pass 3 1.286 0.049 PVS Pass 3*PVS Score 1.012 0.002 PVS Pass 4 1.076 0.036 PVS Pass 4*PVS Score 1.008 0.001 PVS Pass 5 0.858 0.159 PVS Pass 5*PVS Score 1.021 0.008 PVS Pass 6 0.281 0.035 PVS Pass 6*PVS Score 1.045 0.005
28
PVS Pass 7 0.056 0.187 PVS Pass 7*PVS Score 1.145 0.190 IRS Family Member 4.141 0.041 CHUMS Family Member 1.358 0.021 HUD PIC Family Member 1.590 0.027 HUD TRACS Family Member 1.708 0.067 Medicare Family Member 0.867 0.019 SSR Family Member 0.624 0.017 Experian-EDR Family Member 0.747 0.008 Experian-Insource Family Member 0.971 0.010 InfoUSA Family Member 0.604 0.007 Targus-Consumer Family Member 1.060 0.011 VSGI-NAR Family Member 1.029 0.011 Pseudo-R2 0.5447 Number of Observations 6,653,884 Notes: Sources include 2009-2010 NCOA records and the 2010 Census Unedited File (CUF). The base categories are 25-44 for age, white for race, missing citizenship for cit izenship, destination address in April 2010 for address, and added address for changed vs. added address. Dummy variab les for missing gender, Hispanic origin, and race are also included. Person-place pairs in 2009-2010 Nat ional Change of Address (NCOA) data at addresses with 2010 NRFU fieldwork with no POEs are used in the regression. Predicted values are applied to all person-place pairs in 2009-2010 NCOA data. The standard errors are robust.
Table B3. Person-Place Logistic Regression with VSGI-NAR Data Variable Odds Ratio Standard Error Male 0.889 0.001 Age 0-17 1.781 0.022 Age 18-24 0.588 0.003 Age 45-64 1.275 0.002 Age 65-74 0.957 0.003 Age 75+ 0.609 0.002 Hispanic 0.978 0.003 African-American 0.864 0.002 American Indian/Alaska Native 0.940 0.007 Asian 0.996 0.005 Native Hawaiian/Pacific Islander 1.020 0.022 Some Other Race 1.036 0.005 Multi-Race 1.022 0.006 Missing Race 0.786 0.004 Owner 1.510 0.003 Renter 0.583 0.002 Number of Persons 0.835 0.0007 Log Length of Residence 1.206 0.0008 Income <$20,000 0.531 0.002 Income $20,000-29,999 0.585 0.002 Income $30,000-39,999 0.648 0.002 Income $40,000-49,999 0.705 0.002 Income $50,000-74,999 0.788 0.002 Income $75,000-99,999 0.907 0.003 Income $100,000-124,999 0.963 0.003 Income $125,000-149,999 0.918 0.004 U.S. Citizen 0.891 0.002 Legal Alien, Authorized to Work 0.976 0.006 Legal Alien, Not Authorized to Work 0.592 0.010 Other Alien 0.483 0.017 Alien Student, Restricted Work Authorized 0.853 0.019 Conditionally Legalized Alien 0.864 0.024

29
Ever Alien 1.017 0.006 ITIN 0.967 0.018 Pseudo-R2 0.0480 Number of Observations 9,388,414 Notes: Sources include 2010 Veteran Service Group of Illinois Name and Address Resource Consumer file (VSGI-NAR) records and the 2010 Census Unedited File (CUF). The base categories are 25-44 for age, white for race, missing citizenship for citizenship, $150,000 and above for income, and missing tenure for tenure. Dummy variables for missing race and length of residence are also included. Person-place pairs in VSGI-NAR records at addresses with 2010 NRFU fieldwork with no POEs are used in the regression. Predicted values are applied to all person-place pairs in 2010 VSGI-NAR records. The standard errors are robust.
Table B4. Second-Stage Person-Place Match Logistic Regression Variable Odds Ratio Standard Error Update/Leave 0.845 0.015 Military 1.032 0.081 Urban Update/Leave 0.781 0.018 City-Style, No DSF 0.363 0.102 City-Style, Some DSF 0.394 0.108 City-Style, All DSF 0.421 0.116 City-Style and Noncity-Style, no DSF 0.229 0.061 City-Style (95-99.99%) and Noncity-Style, some DSF 0.408 0.112 City-Style (90-94.99%) and Noncity-Style, some DSF 0.388 0.106 City-Style (85-89.99%) and Noncity-Style, some DSF 0.379 0.103 City-Style (80-84.99%) and Noncity-Style, some DSF 0.358 0.097 City-Style (75-79.99%) and Noncity-Style, some DSF 0.338 0.092 City-Style (70-74.99%) and Noncity-Style, some DSF 0.348 0.094 City-Style (<70%) and Noncity-Style, some DSF 0.282 0.075 Assorted Noncity-Style, No DSF 0.232 0.062 Mobile or Other Housing Structure 1.030 0.013 2-4-Unit Housing Structure 0.863 0.014 5-9-Unit Housing Structure 1.055 0.020 10-19-Unit Housing Structure 1.101 0.018 20-49-Unit Housing Structure 1.070 0.017 50+-Unit Housing Structure 1.066 0.015 Housing Unit Not in 2000 Decennial 1.031 0.009 Housing Unit Unoccupied in 2000 Decennial 0.979 0.020 Spring 2010 DSF Deliverable Flag 1.267 0.142 Spring 2010 DSF X Flag 1.368 0.190 6-Month Periods Since Last DSF Deliverable Flag 1.011 0.005 Never Had DSF Deliverable Flags 1.012 0.067 Had DSF Deliverable Flag Every Time Since Fall 2008 0.793 0.014 2000 LUCA Address 1.059 0.022 Post-2000 LUCA Address 1.035 0.070 2010 Address Canvassing Address 1.930 0.066 2010 Decennial Added Address 1.180 0.155 Targeted Block, Additional Form Sent 0.933 0.008 Targeted Block, Additional Form Not Sent 1.075 0.010 Block Blanketed with Second Forms 0.879 0.007 Bilingual Form 0.959 0.009 Business Address 1.029 0.204 Residential, Excluded from Delivery Statistics 0.472 0.021 Built After 2000 1.199 0.097 Has Location Description in MAF 0.934 0.018 Missing DSF Route 1.193 0.110 MAF Valid Unit Status 3.940 0.215 Texas SNAP Here 0.731 0.172
30
Texas SNAP Here*Occupancy Propensity 1.570 0.573 Targus National Address File Here 0.530 0.018 Targus National Address File Here*Occupancy Propensity 0.911 0.044 Corelogic Here 0.804 0.013 Corelogic Here*Occupancy Propensity 1.112 0.032 In 2000 Census Here 1.168 0.010 In 2000 Census Elsewhere 1.280 0.007 Same Race for All Persons in Housing Unit 1.079 0.007 Same Hispanic Origin for All Persons in Housing Unit 1.022 0.009 Two Adrec PIKs in Housing Unit 0.891 0.009 Three Adrec PIKs in Housing Unit 0.646 0.007 Four Adrec PIKs in Housing Unit 0.608 0.007 Five Adrec PIKs in Housing Unit 0.570 0.007 Six Adrec PIKs in Housing Unit 0.514 0.006 Seven Adrec PIKs in Housing Unit 0.466 0.006 Eight Adrec PIKs in Housing Unit 0.439 0.007 Nine Adrec PIKs in Housing Unit 0.391 0.007 Ten or More Adrec PIKs in Housing Unit 0.271 0.007 IRS1040 Here 1.751 0.014 IRS 1040 Here*1st-Stage Match Propensity 3.522 0.036 IRS 1040 Elsewhere 0.537 0.004 IRS 1040 Elsewhere*1st-Stage Match Propensity 0.421 0.004 IRS 1099 Here 0.724 0.010 IRS 1099 Here*1st-Stage Match Propensity 2.028 0.048 IRS 1099 Elsewhere 0.562 0.007 IRS 1099 Elsewhere*1st-Stage Match Propensity 1.133 0.027 HUD CHUMS Here 0.232 0.010 HUD CHUMS Here*1st-Stage Match Propensity 24.905 1.893 HUD CHUMS Elsewhere 1.785 0.076 HUD CHUMS Elsewhere*1st-Stage Match Propensity 0.200 0.015 HUD PIC Here 0.584 0.220 HUD PIC Here*1st-Stage Match Propensity 11.670 5.701 HUD PIC Elsewhere 32.105 13.124 HUD PIC Elsewhere*1st-Stage Match Propensity 0.002 0.001 HUD TRACS Here 0.736 0.154 HUD TRACS Here*1st-Stage Match Propensity 7.892 2.509 HUD TRACS Elsewhere 1.287 0.432 HUD TRACS Elsewhere*1st-Stage Match Propensity 0.134 0.057 SSS Here 0.156 0.004 SSS Here*1st-Stage Match Propensity 15.850 1.043 SSS Elsewhere 0.813 0.025 SSS Elsewhere*1st-Stage Match Propensity 1.144 0.107 Medicare Here 0.363 0.024 Medicare Here*1st-Stage Match Propensity 10.525 0.971 Medicare Elsewhere 0.406 0.059 Medicare Elsewhere*1st-Stage Match Propensity 1.415 0.265 IHS Here 0.283 0.027 IHS Here*1st-Stage Match Propensity 16.094 4.979 IHS Elsewhere 1.009 0.116 IHS Elsewhere*1st-Stage Match Propensity 0.333 0.141 NCOA Here 0.102 0.002 NCOA Here*1st-Stage Match Propensity 90.056 2.736 NCOA Elsewhere 1.454 0.013 NCOA Elsewhere*1st-Stage Match Propensity 0.143 0.003 NY SNAP Here 0.212 0.053 NY SNAP Here*1st-Stage Match Propensity 10.636 4.029

31
NY SNAP Elsewhere 0.736 0.143 NY SNAP Elsewhere*1st-Stage Match Propensity 0.368 0.117 SSR Here 0.392 0.035 SSR Here*1st-Stage Match Propensity 13.139 1.867 SSR Elsewhere 0.562 0.071 SSR Elsewhere*1st-Stage Match Propensity 0.323 0.073 Experian-EDR Here 0.428 0.012 Experian-EDR Here*1st-Stage Match Propensity 8.806 0.926 Experian-EDR Elsewhere 0.907 0.023 Experian-EDR Elsewhere*1st-Stage Match Propensity 1.342 0.133 Experian-Insource Here 0.636 0.017 Experian-Insource Here*1st-Stage Match Propensity 2.760 0.113 Experian-Insource Elsewhere 0.881 0.018 Experian-Insource Elsewhere*1st-Stage Match Propensity 0.767 0.024 InfoUSA Here 0.339 0.004 InfoUSA Here*1st-Stage Match Propensity 6.932 0.129 InfoUSA Elsewhere 0.876 0.007 InfoUSA Elsewhere*1st-Stage Match Propensity 0.588 0.010 Melissa Here 0.424 0.007 Melissa Here*1st-Stage Match Propensity 4.618 0.133 Melissa Elsewhere 0.817 0.011 Melissa Elsewhere*1st-Stage Match Propensity 1.227 0.033 Targus-Consumer Here 2.200 0.078 Targus-Consumer Here*1st-Stage Match Propensity 0.966 0.050 Targus-Consumer Elsewhere 0.640 0.018 Targus-Consumer Elsewhere*1st-Stage Match Propensity 1.592 0.070 Targus-Wireless Here 0.614 0.025 Targus-Wireless Here*1st-Stage Match Propensity 1.794 0.146 Targus-Wireless Elsewhere 1.329 0.057 Targus-Wireless Elsewhere*1st-Stage Match Propensity 0.653 0.057 VSGI-NAR Here 1.511 0.056 VSGI-NAR Here*1st-Stage Match Propensity 0.850 0.047 VSGI-NAR Elsewhere 1.136 0.043 VSGI-NAR Elsewhere*1st-Stage Match Propensity 0.844 0.048 VSGI-TRK Here 0.571 0.012 VSGI-TRK Here*1st-Stage Match Propensity 0.904 0.042 VSGI-TRK Elsewhere 0.974 0.023 VSGI-TRK Elsewhere*1st-Stage Match Propensity 0.414 0.021 Pseudo-R2 0.433 Number of Observations 2,487,841 Notes: Sources include all those listed in Table 1, the 2010 Census Unedited File (CUF), and the January 2011 Master Address File (MAF). The base category for address characteristic type includes the following: non -residential only, description, assorted noncity-style with some U.S. Postal Service Delivery Sequence File (DSF), assorted noncity-style with all DSF, P.O. Box, ru ral route with some DSF, rural route with all DSF, and no addresses found. Other base categories include single-unit structure for housing structure type, no spring 2010 DSF flag for spring DSF flag type, other source (main ly addresses in the Master Address File (MAF) prior to 2000) for address origin, and not in the 2000 Census for 2000 Census person categories. The first-stage occupancy propensities for Texas SNAP, Targus National Address File, and Corelogic come from the occupancy models described in footnote 11. The first-stage match propensity is the person-place pair’s predicted value from the first-stage regression corresponding to the source the propensity is being interacted with. A 10 percent random sample person-place pairs is drawn, and the ones that are at addresses with no U.S. Postal Serv ice Undeliverable As Addressed (UAA) received after the questionnaire mailing and with 2010 NRFU fieldwork with no POEs are used in the regression. A random sample is taken due to computer processing constraints. The standard errors are cluster-adjusted at the housing unit level.

32
Appendix C: Self-Response Quality Quasi-Likelihood Regressions Table C1. Self-Response Quality Quasi-Likelihood Regression with IRS 1040 Data Variable Coefficient Standard Error Deceased -0.437 0.020 Male -0.192 0.004 Age 0-2 0.404 0.014 Age 3-17 0.047 0.008 Age 18-24 -0.548 0.005 Age 45-64 0.021 0.004 Age 65-74 0.085 0.005 Age 75+ -0.071 0.006 Hispanic -0.299 0.005 African-American -0.242 0.004 American Indian/Alaska Native -0.286 0.013 Asian -0.205 0.007 Native Hawaiian/Pacific Islander -0.272 0.039 Some Other Race -0.137 0.008 Multi-Race -0.181 0.010 U.S. Citizen -0.213 0.004 Legal Alien, Authorized to Work -0.204 0.013 Legal Alien, Not Authorized to Work -0.059 0.034 Other Alien -0.130 0.054 Alien Student, Restricted Work Authorized 0.121 0.052 Conditionally Legalized Alien -0.406 0.057 Ever Alien -0.249 0.011 ITIN -0.082 0.026 Married Filing Jointly 0.442 0.004 Married Filing Separately 0.134 0.009 Filing as Household Head -0.368 0.005 Filing as Widow 0.124 0.039 Return Contains Schedule C -0.076 0.004 Return Contains Schedule D 0.073 0.003 Return Contains Schedule E -0.169 0.003 Return Contains Schedule F -0.067 0.009 Return Contains Schedule SE 0.024 0.005 IRS Processing Week 0.028 0.001 IRS Processing Week Squared -0.002 0.00006 IRS Processing Week Cubed 0.00002 0.000001 One PVSed Person 0.221 0.045 Two PVSed Persons -0.012 0.045 Three PVSed Persons -0.236 0.045 Four PVSed Persons -0.288 0.045 Five PVSed Persons -0.445 0.045 Six PVSed Persons -0.584 0.045 Seven or More PVSed Persons -0.735 0.045 One Non-PVSed Record -0.282 0.010 Two Non-PVSed Records 0.017 0.014 Three Non-PVSed Records -0.315 0.026 Four Non-PVSed Records -0.115 0.023 Five or More Non-PVSed Records 0.200 0.017 Dependent PIK Elsewhere for Non-Dependent PIK Here -0.208 0.010 Non-Dependent PIK Elsewhere for Dependent PIK Here -0.238 0.016 2008 IRS 1040 Return at HU -0.128 0.004 Share of IRS 2008, 2009 PIKs in Both Years 0.541 0.003 Electronic Filer -0.008 0.002

33
Pseudo-R2 6,566,713 Number of Observations Notes: Sources include 2008-2009 IRS 1040 records, the 2010 Census Unedited File (CUF), and the 2010 Census Decennial Response File (DRF). This is a quasi-likelihood function using a binomial family variance with a logistic link. The base categories are 25-44 for age, white for race, missing citizenship for citizenship, and single filer for filing status. Dummy variables for missing gender, age, Hispanic orig in, and race are also included. A 10 percent random sample of housing units containing 2009 Internal Revenue Service (IRS) 1040 records is drawn. Of those, responding housing units are included in the regression. Predicted values are applied to all housing units with 2009 IRS 1040 records. A random sample is taken due to computer processing constraints. The st andard errors are robust.
Table C2. Self-Response Quality Quasi-Likelihood Regression with National Change of Address Data Variable Coefficient Standard Error Deceased -0.201 0.345 Male 0.015 0.002 Age 0-2 -0.496 0.026 Age 3-17 -0.487 0.010 Age 18-24 -0.105 0.003 Age 45-64 -0.071 0.003 Age 65-74 -0.036 0.006 Age 75+ -0.205 0.006 Hispanic -0.305 0.004 African-American -0.373 0.003 American Indian/Alaska Native -0.162 0.010 Asian -0.164 0.007 Native Hawaiian/Pacific Islander -0.231 0.027 Some Other Race -0.176 0.007 Multi-Race -0.122 0.008 U.S. Citizen -0.039 0.004 Legal Alien, Authorized to Work -0.044 0.009 Legal Alien, Not Authorized to Work 0.007 0.026 Other Alien -0.175 0.047 Alien Student, Restricted Work Author. 0.196 0.034 Conditionally Legalized Alien -0.240 0.044 Ever Alien -0.161 0.007 ITIN -0.735 0.014 One PVSed Person -0.223 0.004 Two PVSed Persons -0.237 0.005 Three PVSed Persons -0.214 0.006 Four PVSed Persons -0.237 0.007 Five or More PVSed Persons -0.238 0.009 Number of Non-PVSed Records -0.088 0.001 Departure Address in April 2009 2.076 0.011 Departure Address in May 2009 2.057 0.011 Departure Address in June 2009 2.082 0.011 Departure Address in July 2009 2.079 0.011 Departure Address in August 2009 2.055 0.011 Departure Address in September 2009 2.063 0.011 Departure Address in October 2009 2.077 0.011 Departure Address in November 2009 2.085 0.011 Departure Address in December 2009 1.939 0.011 Departure Address in January 2010 1.867 0.011 Departure Address in February 2010 1.796 0.011 Departure Address in March 2010 0.804 0.011 Departure Address in April 2010 0.782 0.012 Destination Address in April 2009 2.410 0.016 Destination Address in May 2009 2.575 0.015
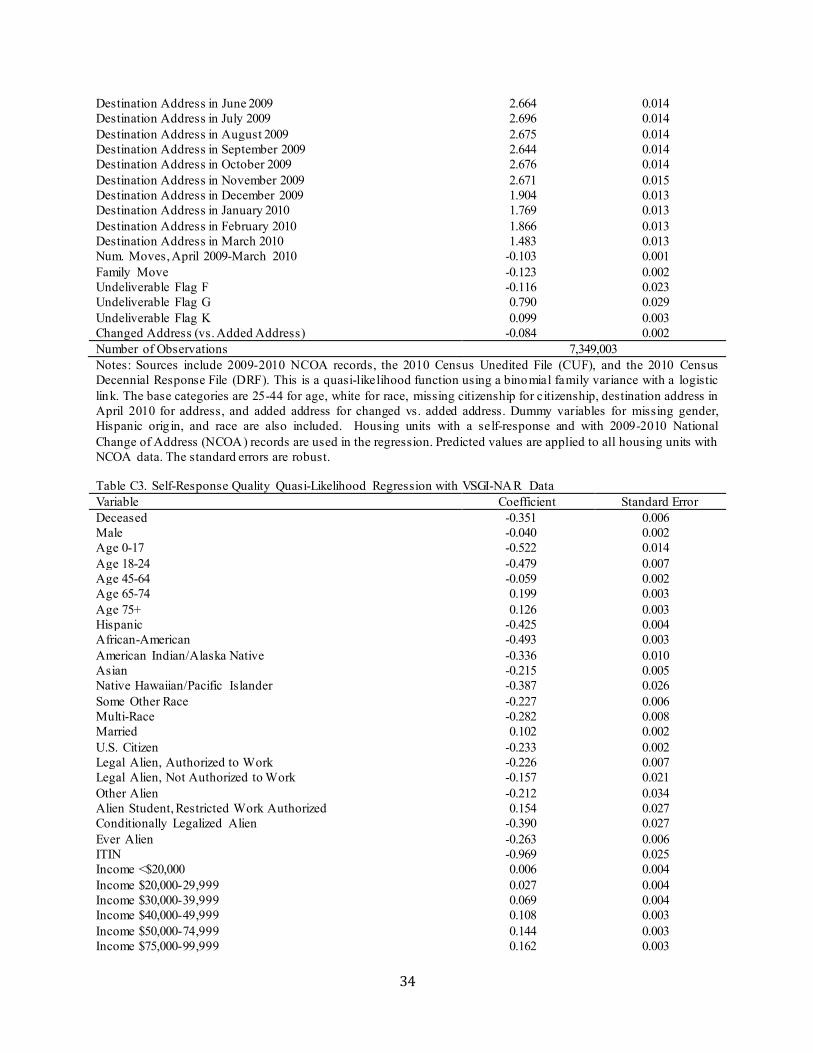
34
Destination Address in June 2009 2.664 0.014 Destination Address in July 2009 2.696 0.014 Destination Address in August 2009 2.675 0.014 Destination Address in September 2009 2.644 0.014 Destination Address in October 2009 2.676 0.014 Destination Address in November 2009 2.671 0.015 Destination Address in December 2009 1.904 0.013 Destination Address in January 2010 1.769 0.013 Destination Address in February 2010 1.866 0.013 Destination Address in March 2010 1.483 0.013 Num. Moves, April 2009-March 2010 -0.103 0.001 Family Move -0.123 0.002 Undeliverable Flag F -0.116 0.023 Undeliverable Flag G 0.790 0.029 Undeliverable Flag K 0.099 0.003 Changed Address (vs. Added Address) -0.084 0.002 Number of Observations 7,349,003 Notes: Sources include 2009-2010 NCOA records, the 2010 Census Unedited File (CUF), and the 2010 Census Decennial Response File (DRF). This is a quasi-likelihood function using a binomial family variance with a logistic link. The base categories are 25-44 for age, white for race, missing citizenship for citizenship, destination address in April 2010 for address, and added address for changed vs. added address. Dummy variables for missing gender, Hispanic orig in, and race are also included. Housing units with a self-response and with 2009-2010 National Change of Address (NCOA) records are used in the regression. Predicted values are applied to all housing units with NCOA data. The standard errors are robust.
Table C3. Self-Response Quality Quasi-Likelihood Regression with VSGI-NAR Data Variable Coefficient Standard Error Deceased -0.351 0.006 Male -0.040 0.002 Age 0-17 -0.522 0.014 Age 18-24 -0.479 0.007 Age 45-64 -0.059 0.002 Age 65-74 0.199 0.003 Age 75+ 0.126 0.003 Hispanic -0.425 0.004 African-American -0.493 0.003 American Indian/Alaska Native -0.336 0.010 Asian -0.215 0.005 Native Hawaiian/Pacific Islander -0.387 0.026 Some Other Race -0.227 0.006 Multi-Race -0.282 0.008 Married 0.102 0.002 U.S. Citizen -0.233 0.002 Legal Alien, Authorized to Work -0.226 0.007 Legal Alien, Not Authorized to Work -0.157 0.021 Other Alien -0.212 0.034 Alien Student, Restricted Work Authorized 0.154 0.027 Conditionally Legalized Alien -0.390 0.027 Ever Alien -0.263 0.006 ITIN -0.969 0.025 Income <$20,000 0.006 0.004 Income $20,000-29,999 0.027 0.004 Income $30,000-39,999 0.069 0.004 Income $40,000-49,999 0.108 0.003 Income $50,000-74,999 0.144 0.003 Income $75,000-99,999 0.162 0.003
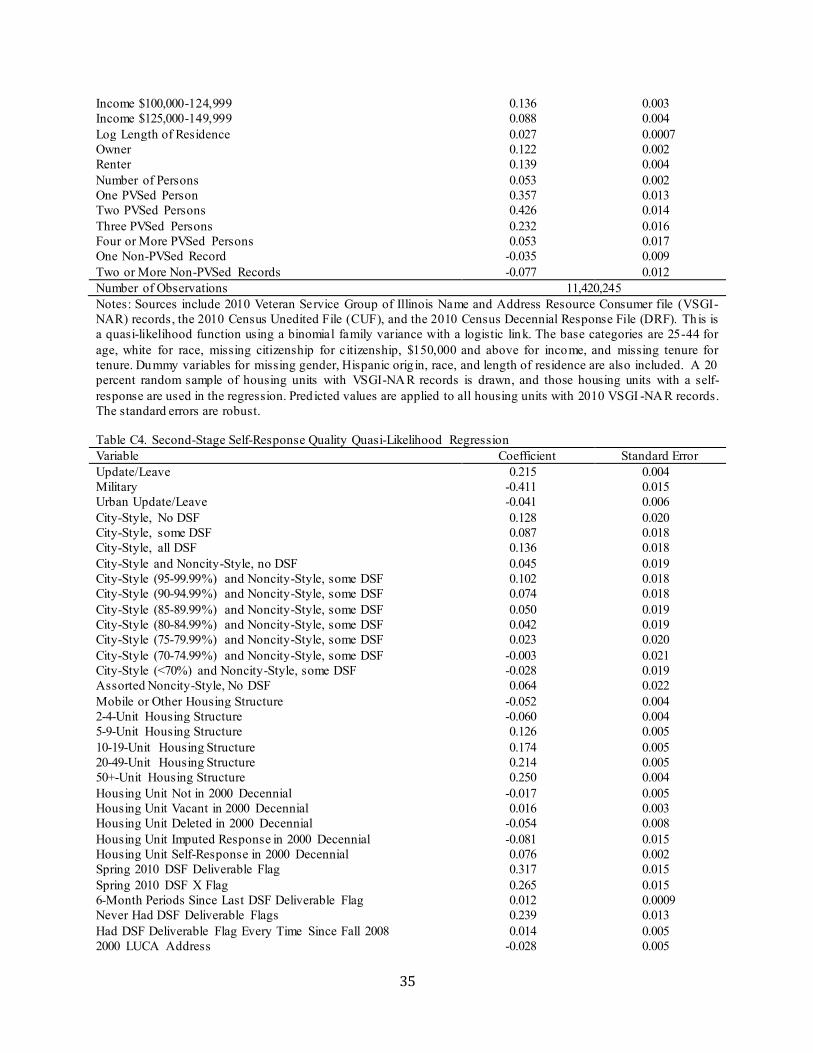
35
Income $100,000-124,999 0.136 0.003 Income $125,000-149,999 0.088 0.004 Log Length of Residence 0.027 0.0007 Owner 0.122 0.002 Renter 0.139 0.004 Number of Persons 0.053 0.002 One PVSed Person 0.357 0.013 Two PVSed Persons 0.426 0.014 Three PVSed Persons 0.232 0.016 Four or More PVSed Persons 0.053 0.017 One Non-PVSed Record -0.035 0.009 Two or More Non-PVSed Records -0.077 0.012 Number of Observations 11,420,245 Notes: Sources include 2010 Veteran Service Group of Illinois Name and Address Resource Consumer file (VSGI-NAR) records, the 2010 Census Unedited File (CUF), and the 2010 Census Decennial Response File (DRF). Th is is a quasi-likelihood function using a binomial family variance with a logistic link. The base categories are 25-44 for age, white for race, missing citizenship for citizenship, $150,000 and above for income, and missing tenure for tenure. Dummy variables for missing gender, Hispanic orig in, race, and length of residence are also included. A 20 percent random sample of housing units with VSGI-NAR records is drawn, and those housing units with a self-response are used in the regression. Pred icted values are applied to all housing units with 2010 VSGI -NAR records. The standard errors are robust.
Table C4. Second-Stage Self-Response Quality Quasi-Likelihood Regression Variable Coefficient Standard Error Update/Leave 0.215 0.004 Military -0.411 0.015 Urban Update/Leave -0.041 0.006 City-Style, No DSF 0.128 0.020 City-Style, some DSF 0.087 0.018 City-Style, all DSF 0.136 0.018 City-Style and Noncity-Style, no DSF 0.045 0.019 City-Style (95-99.99%) and Noncity-Style, some DSF 0.102 0.018 City-Style (90-94.99%) and Noncity-Style, some DSF 0.074 0.018 City-Style (85-89.99%) and Noncity-Style, some DSF 0.050 0.019 City-Style (80-84.99%) and Noncity-Style, some DSF 0.042 0.019 City-Style (75-79.99%) and Noncity-Style, some DSF 0.023 0.020 City-Style (70-74.99%) and Noncity-Style, some DSF -0.003 0.021 City-Style (<70%) and Noncity-Style, some DSF -0.028 0.019 Assorted Noncity-Style, No DSF 0.064 0.022 Mobile or Other Housing Structure -0.052 0.004 2-4-Unit Housing Structure -0.060 0.004 5-9-Unit Housing Structure 0.126 0.005 10-19-Unit Housing Structure 0.174 0.005 20-49-Unit Housing Structure 0.214 0.005 50+-Unit Housing Structure 0.250 0.004 Housing Unit Not in 2000 Decennial -0.017 0.005 Housing Unit Vacant in 2000 Decennial 0.016 0.003 Housing Unit Deleted in 2000 Decennial -0.054 0.008 Housing Unit Imputed Response in 2000 Decennial -0.081 0.015 Housing Unit Self-Response in 2000 Decennial 0.076 0.002 Spring 2010 DSF Deliverable Flag 0.317 0.015 Spring 2010 DSF X Flag 0.265 0.015 6-Month Periods Since Last DSF Deliverable Flag 0.012 0.0009 Never Had DSF Deliverable Flags 0.239 0.013 Had DSF Deliverable Flag Every Time Since Fall 2008 0.014 0.005 2000 LUCA Address -0.028 0.005
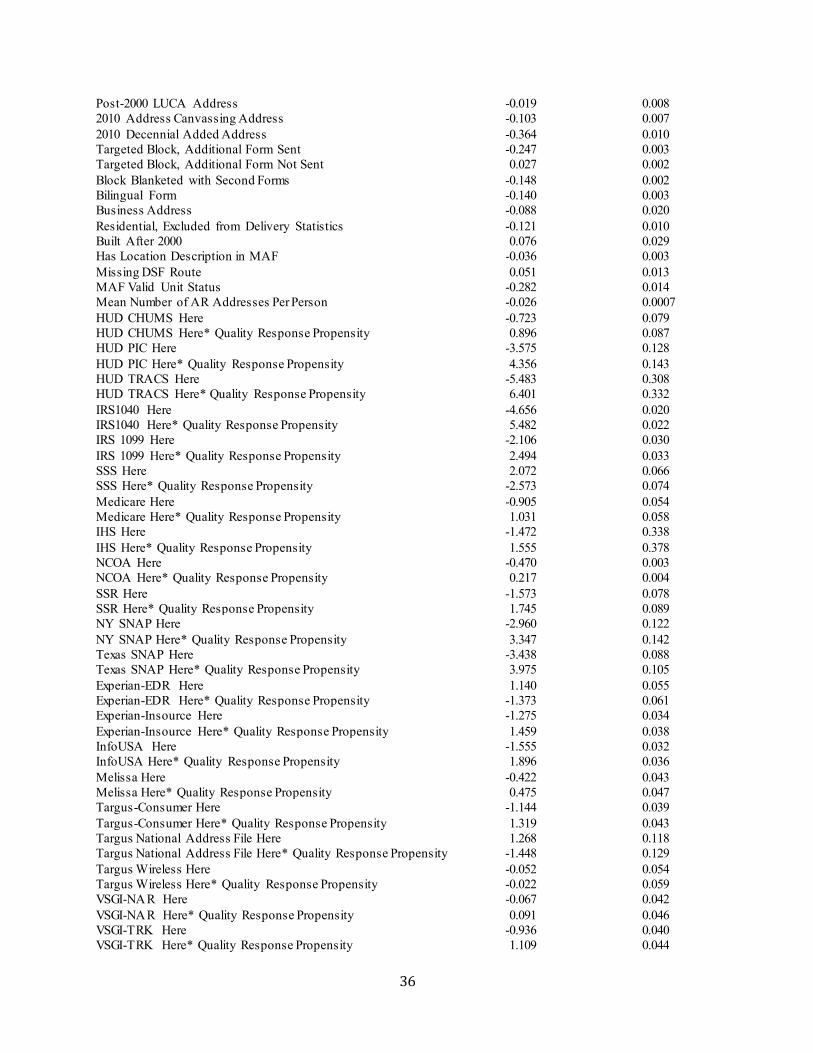
36
Post-2000 LUCA Address -0.019 0.008 2010 Address Canvassing Address -0.103 0.007 2010 Decennial Added Address -0.364 0.010 Targeted Block, Additional Form Sent -0.247 0.003 Targeted Block, Additional Form Not Sent 0.027 0.002 Block Blanketed with Second Forms -0.148 0.002 Bilingual Form -0.140 0.003 Business Address -0.088 0.020 Residential, Excluded from Delivery Statistics -0.121 0.010 Built After 2000 0.076 0.029 Has Location Description in MAF -0.036 0.003 Missing DSF Route 0.051 0.013 MAF Valid Unit Status -0.282 0.014 Mean Number of AR Addresses Per Person -0.026 0.0007 HUD CHUMS Here -0.723 0.079 HUD CHUMS Here* Quality Response Propensity 0.896 0.087 HUD PIC Here -3.575 0.128 HUD PIC Here* Quality Response Propensity 4.356 0.143 HUD TRACS Here -5.483 0.308 HUD TRACS Here* Quality Response Propensity 6.401 0.332 IRS1040 Here -4.656 0.020 IRS1040 Here* Quality Response Propensity 5.482 0.022 IRS 1099 Here -2.106 0.030 IRS 1099 Here* Quality Response Propensity 2.494 0.033 SSS Here 2.072 0.066 SSS Here* Quality Response Propensity -2.573 0.074 Medicare Here -0.905 0.054 Medicare Here* Quality Response Propensity 1.031 0.058 IHS Here -1.472 0.338 IHS Here* Quality Response Propensity 1.555 0.378 NCOA Here -0.470 0.003 NCOA Here* Quality Response Propensity 0.217 0.004 SSR Here -1.573 0.078 SSR Here* Quality Response Propensity 1.745 0.089 NY SNAP Here -2.960 0.122 NY SNAP Here* Quality Response Propensity 3.347 0.142 Texas SNAP Here -3.438 0.088 Texas SNAP Here* Quality Response Propensity 3.975 0.105 Experian-EDR Here 1.140 0.055 Experian-EDR Here* Quality Response Propensity -1.373 0.061 Experian-Insource Here -1.275 0.034 Experian-Insource Here* Quality Response Propensity 1.459 0.038 InfoUSA Here -1.555 0.032 InfoUSA Here* Quality Response Propensity 1.896 0.036 Melissa Here -0.422 0.043 Melissa Here* Quality Response Propensity 0.475 0.047 Targus-Consumer Here -1.144 0.039 Targus-Consumer Here* Quality Response Propensity 1.319 0.043 Targus National Address File Here 1.268 0.118 Targus National Address File Here* Quality Response Propensity -1.448 0.129 Targus Wireless Here -0.052 0.054 Targus Wireless Here* Quality Response Propensity -0.022 0.059 VSGI-NAR Here -0.067 0.042 VSGI-NAR Here* Quality Response Propensity 0.091 0.046 VSGI-TRK Here -0.936 0.040 VSGI-TRK Here* Quality Response Propensity 1.109 0.044

37
Corelogic Here 0.364 0.106 Corelogic Here* Quality Response Propensity -0.464 0.115 Number of Observations 8,694,606 Notes: Sources include all those listed in Table 1, the 2010 Census Unedited File (CUF), and the January 2011 Master Address File (MAF). Th is is a quasi-likelihood function using a binomial family variance with a logistic link. The base category for address characteristic type includes the following: non -residential only, description, assorted noncity-style with some U.S. Postal Service Delivery Sequence File (DSF), assorted noncity-style with all DSF, P.O. Box, rural route with some DSF, ru ral route with all DSF, and no addresses found. Other base categories include single-unit structure for housing structure type, no spring 2010 DSF flag for spring DSF flag type, and other source (mainly addresses in the Master Address File (MAF) prior to 2000) for address origin. The 1st-stage nondiscrepant response propensity is the predicted value for the housing unit from the 1st-stage regression corresponding to the source the propensity is being interacted with. A 10 percent random sample of housing units is drawn, and those housing units with a self -response are used in the regression. Pred icted values are applied to all housing units. The standard errors are robust.
Appendix D: Fieldwork Response Quality Quasi-Likelihood Regressions Table D1. Fieldwork Response Quality Quasi-Likelihood Regression with IRS 1040 Data Variable Coefficient Standard Error Deceased 0.424 0.022 Male -0.028 0.003 Age 0-2 0.101 0.011 Age 3-17 -0.003 0.007 Age 18-24 -0.142 0.005 Age 45-64 0.046 0.004 Age 65-74 0.027 0.007 Age 75+ 0.046 0.008 Hispanic -0.134 0.004 African-American -0.116 0.003 American Indian/Alaska Native -0.101 0.012 Asian -0.127 0.008 Native Hawaiian/Pacific Islander -0.190 0.030 Some Other Race -0.081 0.008 Multi-Race -0.075 0.009 U.S. Citizen -0.047 0.005 Legal Alien, Authorized to Work -0.049 0.013 Legal Alien, Not Authorized to Work 0.046 0.032 Other Alien 0.082 0.052 Alien Student, Restricted Work Authorized 0.040 0.047 Conditionally Legalized Alien -0.145 0.056 Ever Alien -0.122 0.011 ITIN -0.020 0.021 Married Filing Jointly 0.244 0.004 Married Filing Separately 0.103 0.009 Filing as Household Head -0.022 0.004 Filing as Widow 0.132 0.041 Return Contains Schedule C -0.026 0.005 Return Contains Schedule D 0.039 0.004 Return Contains Schedule E -0.048 0.004 Return Contains Schedule F 0.003 0.012 Return Contains Schedule SE -0.001 0.005 IRS Processing Week -0.005 0.001 IRS Processing Week Squared 0.0002 0.00006 IRS Processing Week Cubed -0.0000016 0.0000009 One PVSed Person 0.135 0.034 Two PVSed Persons 0.059 0.034
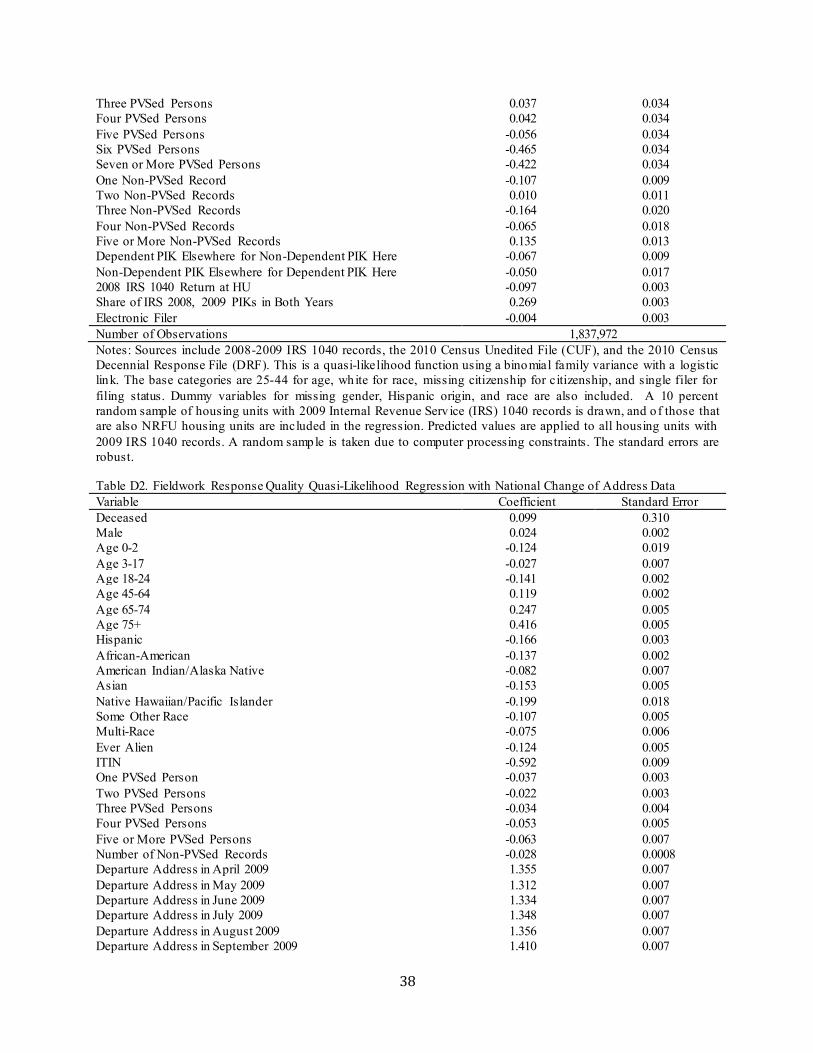
38
Three PVSed Persons 0.037 0.034 Four PVSed Persons 0.042 0.034 Five PVSed Persons -0.056 0.034 Six PVSed Persons -0.465 0.034 Seven or More PVSed Persons -0.422 0.034 One Non-PVSed Record -0.107 0.009 Two Non-PVSed Records 0.010 0.011 Three Non-PVSed Records -0.164 0.020 Four Non-PVSed Records -0.065 0.018 Five or More Non-PVSed Records 0.135 0.013 Dependent PIK Elsewhere for Non-Dependent PIK Here -0.067 0.009 Non-Dependent PIK Elsewhere for Dependent PIK Here -0.050 0.017 2008 IRS 1040 Return at HU -0.097 0.003 Share of IRS 2008, 2009 PIKs in Both Years 0.269 0.003 Electronic Filer -0.004 0.003 Number of Observations 1,837,972 Notes: Sources include 2008-2009 IRS 1040 records, the 2010 Census Unedited File (CUF), and the 2010 Census Decennial Response File (DRF). This is a quasi-likelihood function using a binomial family variance with a logistic link. The base categories are 25-44 for age, white for race, missing citizenship for citizenship, and single filer for filing status. Dummy variables for missing gender, Hispanic origin, and race are also included. A 10 percent random sample of housing units with 2009 Internal Revenue Serv ice (IRS) 1040 records is drawn, and of those that are also NRFU housing units are included in the regression. Predicted values are applied to all housing units with 2009 IRS 1040 records. A random sample is taken due to computer processing constraints. The standard errors are robust.
Table D2. Fieldwork Response Quality Quasi-Likelihood Regression with National Change of Address Data Variable Coefficient Standard Error Deceased 0.099 0.310 Male 0.024 0.002 Age 0-2 -0.124 0.019 Age 3-17 -0.027 0.007 Age 18-24 -0.141 0.002 Age 45-64 0.119 0.002 Age 65-74 0.247 0.005 Age 75+ 0.416 0.005 Hispanic -0.166 0.003 African-American -0.137 0.002 American Indian/Alaska Native -0.082 0.007 Asian -0.153 0.005 Native Hawaiian/Pacific Islander -0.199 0.018 Some Other Race -0.107 0.005 Multi-Race -0.075 0.006 Ever Alien -0.124 0.005 ITIN -0.592 0.009 One PVSed Person -0.037 0.003 Two PVSed Persons -0.022 0.003 Three PVSed Persons -0.034 0.004 Four PVSed Persons -0.053 0.005 Five or More PVSed Persons -0.063 0.007 Number of Non-PVSed Records -0.028 0.0008 Departure Address in April 2009 1.355 0.007 Departure Address in May 2009 1.312 0.007 Departure Address in June 2009 1.334 0.007 Departure Address in July 2009 1.348 0.007 Departure Address in August 2009 1.356 0.007 Departure Address in September 2009 1.410 0.007
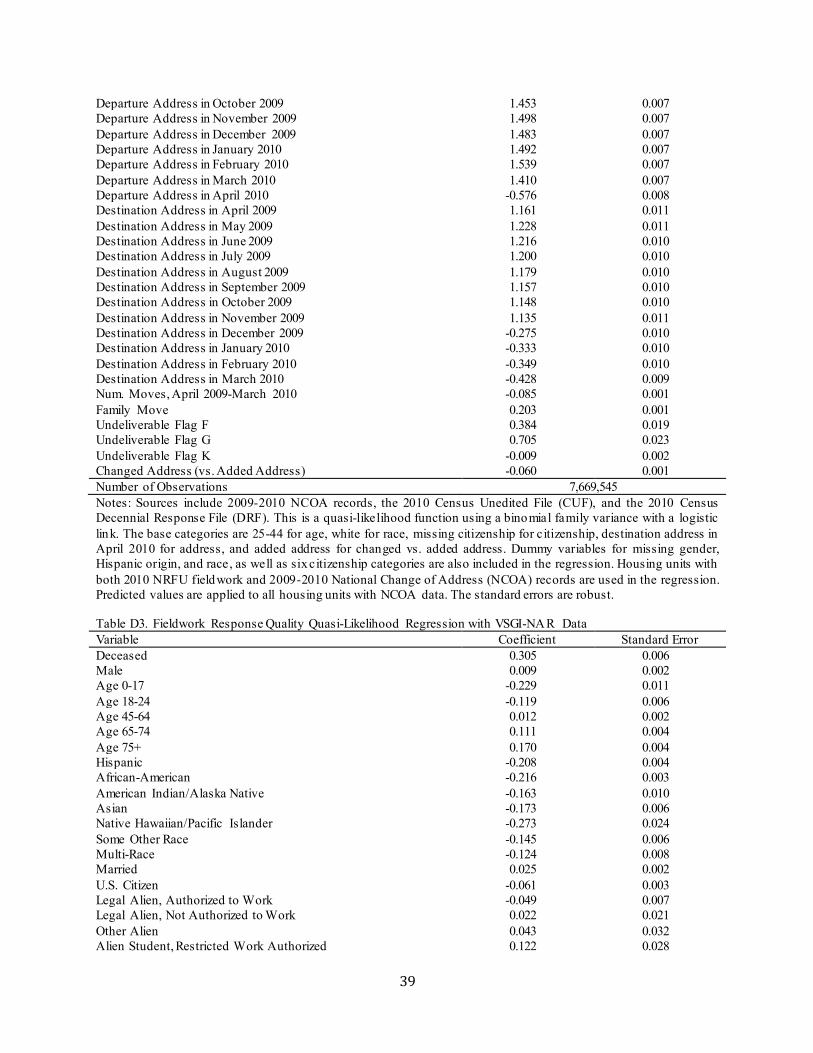
39
Departure Address in October 2009 1.453 0.007 Departure Address in November 2009 1.498 0.007 Departure Address in December 2009 1.483 0.007 Departure Address in January 2010 1.492 0.007 Departure Address in February 2010 1.539 0.007 Departure Address in March 2010 1.410 0.007 Departure Address in April 2010 -0.576 0.008 Destination Address in April 2009 1.161 0.011 Destination Address in May 2009 1.228 0.011 Destination Address in June 2009 1.216 0.010 Destination Address in July 2009 1.200 0.010 Destination Address in August 2009 1.179 0.010 Destination Address in September 2009 1.157 0.010 Destination Address in October 2009 1.148 0.010 Destination Address in November 2009 1.135 0.011 Destination Address in December 2009 -0.275 0.010 Destination Address in January 2010 -0.333 0.010 Destination Address in February 2010 -0.349 0.010 Destination Address in March 2010 -0.428 0.009 Num. Moves, April 2009-March 2010 -0.085 0.001 Family Move 0.203 0.001 Undeliverable Flag F 0.384 0.019 Undeliverable Flag G 0.705 0.023 Undeliverable Flag K -0.009 0.002 Changed Address (vs. Added Address) -0.060 0.001 Number of Observations 7,669,545 Notes: Sources include 2009-2010 NCOA records, the 2010 Census Unedited File (CUF), and the 2010 Census Decennial Response File (DRF). This is a quasi-likelihood function using a binomial family variance with a logistic link. The base categories are 25-44 for age, white for race, missing citizenship for citizenship, destination address in April 2010 for address, and added address for changed vs. added address. Dummy variables for missing gender, Hispanic origin, and race, as well as six citizenship categories are also included in the regression. Housing units with both 2010 NRFU fieldwork and 2009-2010 National Change of Address (NCOA) records are used in the regression. Predicted values are applied to all housing units with NCOA data. The standard errors are robust.
Table D3. Fieldwork Response Quality Quasi-Likelihood Regression with VSGI-NAR Data Variable Coefficient Standard Error Deceased 0.305 0.006 Male 0.009 0.002 Age 0-17 -0.229 0.011 Age 18-24 -0.119 0.006 Age 45-64 0.012 0.002 Age 65-74 0.111 0.004 Age 75+ 0.170 0.004 Hispanic -0.208 0.004 African-American -0.216 0.003 American Indian/Alaska Native -0.163 0.010 Asian -0.173 0.006 Native Hawaiian/Pacific Islander -0.273 0.024 Some Other Race -0.145 0.006 Multi-Race -0.124 0.008 Married 0.025 0.002 U.S. Citizen -0.061 0.003 Legal Alien, Authorized to Work -0.049 0.007 Legal Alien, Not Authorized to Work 0.022 0.021 Other Alien 0.043 0.032 Alien Student, Restricted Work Authorized 0.122 0.028
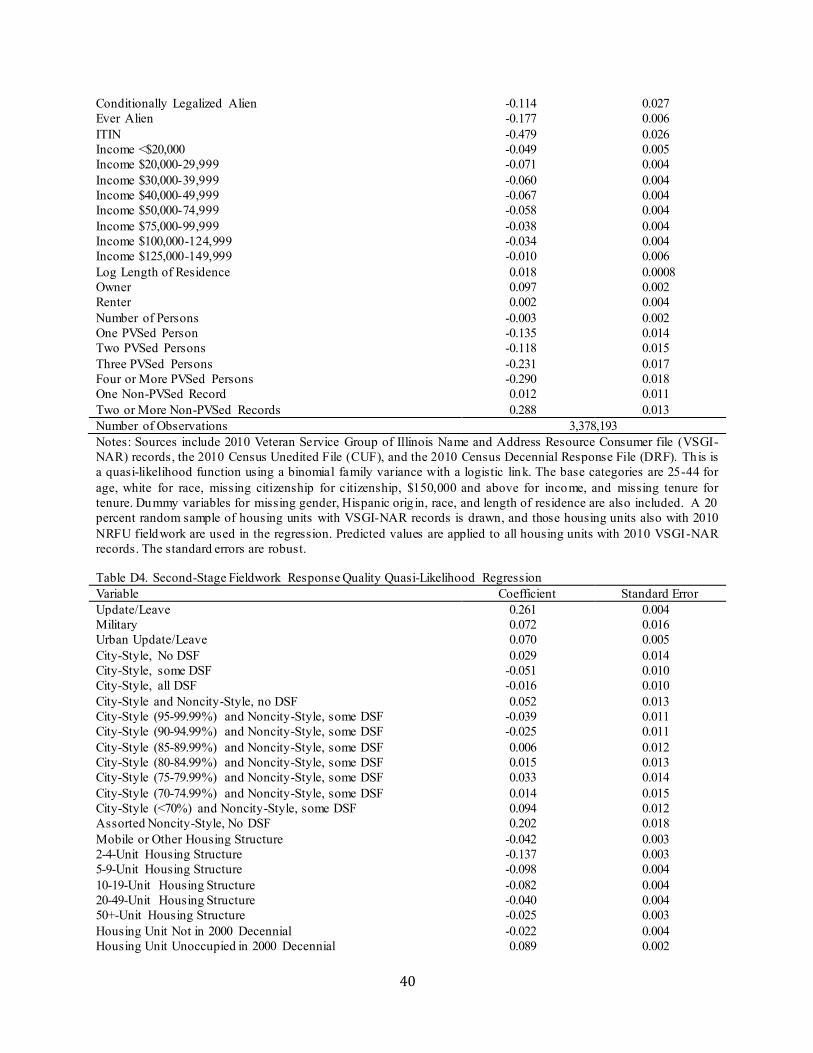
40
Conditionally Legalized Alien -0.114 0.027 Ever Alien -0.177 0.006 ITIN -0.479 0.026 Income <$20,000 -0.049 0.005 Income $20,000-29,999 -0.071 0.004 Income $30,000-39,999 -0.060 0.004 Income $40,000-49,999 -0.067 0.004 Income $50,000-74,999 -0.058 0.004 Income $75,000-99,999 -0.038 0.004 Income $100,000-124,999 -0.034 0.004 Income $125,000-149,999 -0.010 0.006 Log Length of Residence 0.018 0.0008 Owner 0.097 0.002 Renter 0.002 0.004 Number of Persons -0.003 0.002 One PVSed Person -0.135 0.014 Two PVSed Persons -0.118 0.015 Three PVSed Persons -0.231 0.017 Four or More PVSed Persons -0.290 0.018 One Non-PVSed Record 0.012 0.011 Two or More Non-PVSed Records 0.288 0.013 Number of Observations 3,378,193 Notes: Sources include 2010 Veteran Service Group of Illinois Name and Address Resource Consumer file (VSGI-NAR) records, the 2010 Census Unedited File (CUF), and the 2010 Census Decennial Response File (DRF). Th is is a quasi-likelihood function using a binomial family variance with a logistic link. The base categories are 25-44 for age, white for race, missing citizenship for citizenship, $150,000 and above for income, and missing tenure for tenure. Dummy variables for missing gender, Hispanic orig in, race, and length of residence are also included. A 20 percent random sample of housing units with VSGI-NAR records is drawn, and those housing units also with 2010 NRFU fieldwork are used in the regression. Predicted values are applied to all housing units with 2010 VSGI-NAR records. The standard errors are robust.
Table D4. Second-Stage Fieldwork Response Quality Quasi-Likelihood Regression Variable Coefficient Standard Error Update/Leave 0.261 0.004 Military 0.072 0.016 Urban Update/Leave 0.070 0.005 City-Style, No DSF 0.029 0.014 City-Style, some DSF -0.051 0.010 City-Style, all DSF -0.016 0.010 City-Style and Noncity-Style, no DSF 0.052 0.013 City-Style (95-99.99%) and Noncity-Style, some DSF -0.039 0.011 City-Style (90-94.99%) and Noncity-Style, some DSF -0.025 0.011 City-Style (85-89.99%) and Noncity-Style, some DSF 0.006 0.012 City-Style (80-84.99%) and Noncity-Style, some DSF 0.015 0.013 City-Style (75-79.99%) and Noncity-Style, some DSF 0.033 0.014 City-Style (70-74.99%) and Noncity-Style, some DSF 0.014 0.015 City-Style (<70%) and Noncity-Style, some DSF 0.094 0.012 Assorted Noncity-Style, No DSF 0.202 0.018 Mobile or Other Housing Structure -0.042 0.003 2-4-Unit Housing Structure -0.137 0.003 5-9-Unit Housing Structure -0.098 0.004 10-19-Unit Housing Structure -0.082 0.004 20-49-Unit Housing Structure -0.040 0.004 50+-Unit Housing Structure -0.025 0.003 Housing Unit Not in 2000 Decennial -0.022 0.004 Housing Unit Unoccupied in 2000 Decennial 0.089 0.002
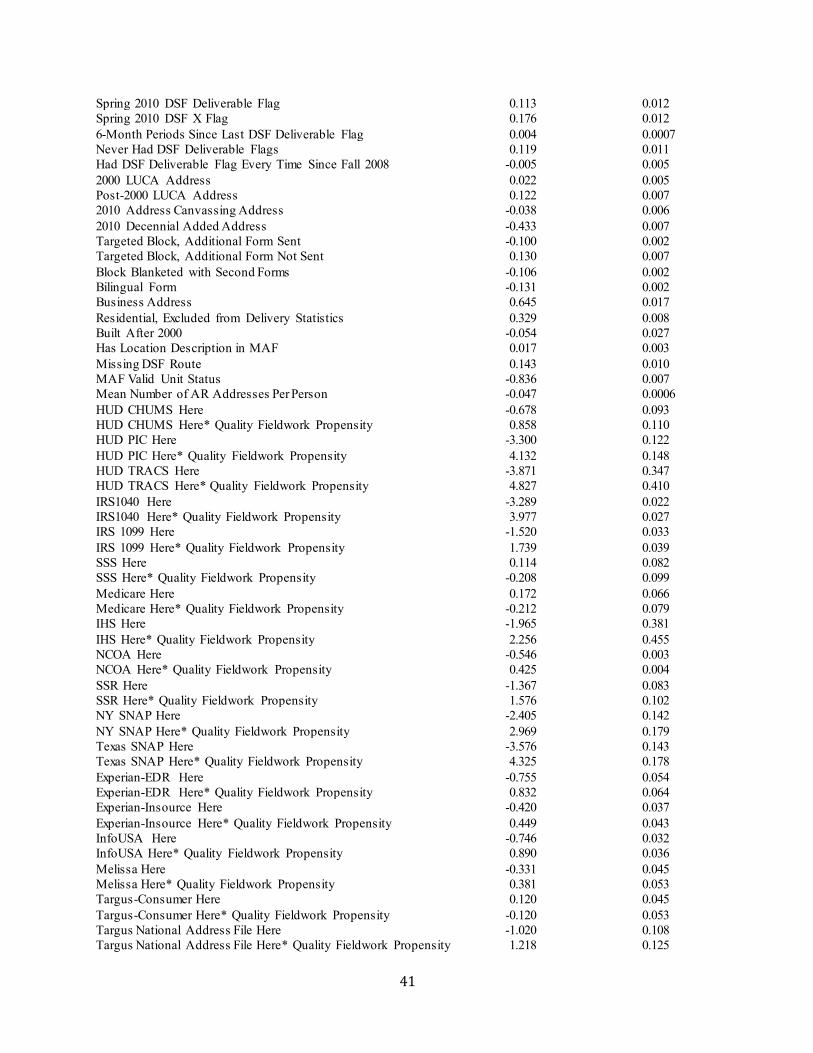
41
Spring 2010 DSF Deliverable Flag 0.113 0.012 Spring 2010 DSF X Flag 0.176 0.012 6-Month Periods Since Last DSF Deliverable Flag 0.004 0.0007 Never Had DSF Deliverable Flags 0.119 0.011 Had DSF Deliverable Flag Every Time Since Fall 2008 -0.005 0.005 2000 LUCA Address 0.022 0.005 Post-2000 LUCA Address 0.122 0.007 2010 Address Canvassing Address -0.038 0.006 2010 Decennial Added Address -0.433 0.007 Targeted Block, Additional Form Sent -0.100 0.002 Targeted Block, Additional Form Not Sent 0.130 0.007 Block Blanketed with Second Forms -0.106 0.002 Bilingual Form -0.131 0.002 Business Address 0.645 0.017 Residential, Excluded from Delivery Statistics 0.329 0.008 Built After 2000 -0.054 0.027 Has Location Description in MAF 0.017 0.003 Missing DSF Route 0.143 0.010 MAF Valid Unit Status -0.836 0.007 Mean Number of AR Addresses Per Person -0.047 0.0006 HUD CHUMS Here -0.678 0.093 HUD CHUMS Here* Quality Fieldwork Propensity 0.858 0.110 HUD PIC Here -3.300 0.122 HUD PIC Here* Quality Fieldwork Propensity 4.132 0.148 HUD TRACS Here -3.871 0.347 HUD TRACS Here* Quality Fieldwork Propensity 4.827 0.410 IRS1040 Here -3.289 0.022 IRS1040 Here* Quality Fieldwork Propensity 3.977 0.027 IRS 1099 Here -1.520 0.033 IRS 1099 Here* Quality Fieldwork Propensity 1.739 0.039 SSS Here 0.114 0.082 SSS Here* Quality Fieldwork Propensity -0.208 0.099 Medicare Here 0.172 0.066 Medicare Here* Quality Fieldwork Propensity -0.212 0.079 IHS Here -1.965 0.381 IHS Here* Quality Fieldwork Propensity 2.256 0.455 NCOA Here -0.546 0.003 NCOA Here* Quality Fieldwork Propensity 0.425 0.004 SSR Here -1.367 0.083 SSR Here* Quality Fieldwork Propensity 1.576 0.102 NY SNAP Here -2.405 0.142 NY SNAP Here* Quality Fieldwork Propensity 2.969 0.179 Texas SNAP Here -3.576 0.143 Texas SNAP Here* Quality Fieldwork Propensity 4.325 0.178 Experian-EDR Here -0.755 0.054 Experian-EDR Here* Quality Fieldwork Propensity 0.832 0.064 Experian-Insource Here -0.420 0.037 Experian-Insource Here* Quality Fieldwork Propensity 0.449 0.043 InfoUSA Here -0.746 0.032 InfoUSA Here* Quality Fieldwork Propensity 0.890 0.036 Melissa Here -0.331 0.045 Melissa Here* Quality Fieldwork Propensity 0.381 0.053 Targus-Consumer Here 0.120 0.045 Targus-Consumer Here* Quality Fieldwork Propensity -0.120 0.053 Targus National Address File Here -1.020 0.108 Targus National Address File Here* Quality Fieldwork Propensity 1.218 0.125
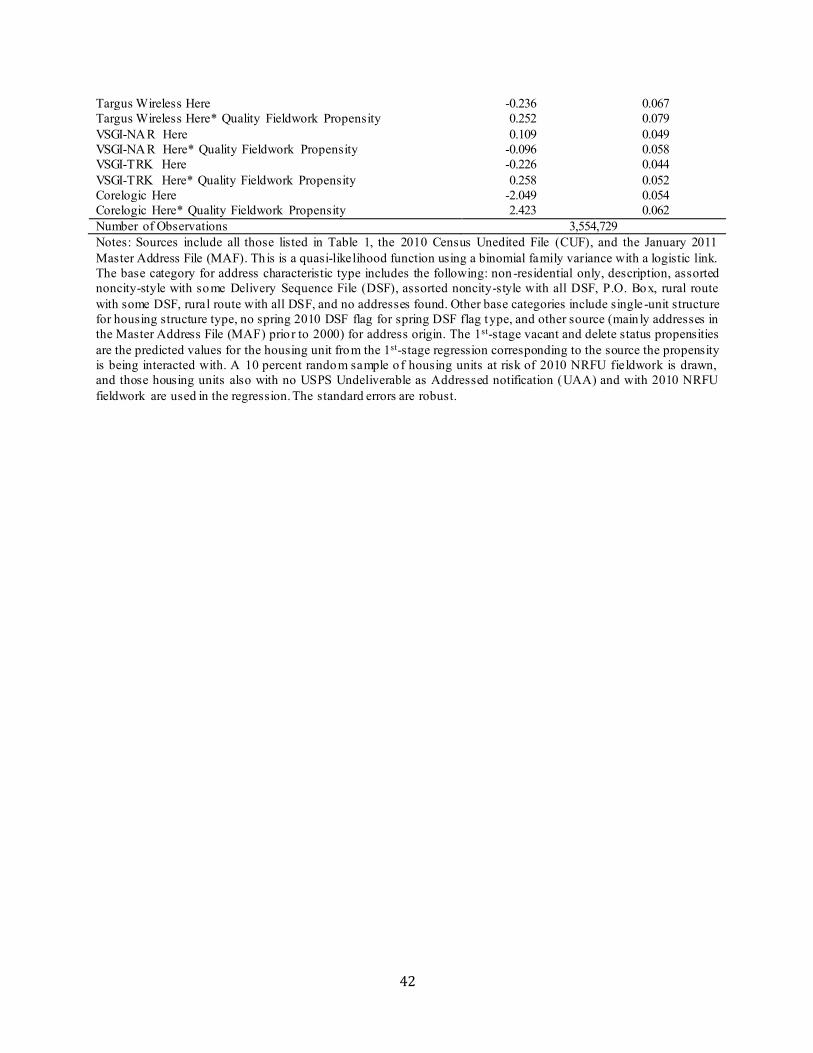
42
Targus Wireless Here -0.236 0.067 Targus Wireless Here* Quality Fieldwork Propensity 0.252 0.079 VSGI-NAR Here 0.109 0.049 VSGI-NAR Here* Quality Fieldwork Propensity -0.096 0.058 VSGI-TRK Here -0.226 0.044 VSGI-TRK Here* Quality Fieldwork Propensity 0.258 0.052 Corelogic Here -2.049 0.054 Corelogic Here* Quality Fieldwork Propensity 2.423 0.062 Number of Observations 3,554,729 Notes: Sources include all those listed in Table 1, the 2010 Census Unedited File (CUF), and the January 2011 Master Address File (MAF). Th is is a quasi-likelihood function using a binomial family variance with a logistic link. The base category for address characteristic type includes the following: non -residential only, description, assorted noncity-style with some Delivery Sequence File (DSF), assorted noncity-style with all DSF, P.O. Box, rural route with some DSF, rural route with all DSF, and no addresses found. Other base categories include single -unit structure for housing structure type, no spring 2010 DSF flag for spring DSF flag type, and other source (main ly addresses in the Master Address File (MAF) prio r to 2000) for address origin. The 1st-stage vacant and delete status propensities are the predicted values for the housing unit from the 1st-stage regression corresponding to the source the propensity is being interacted with. A 10 percent random sample o f housing units at risk of 2010 NRFU fieldwork is drawn, and those housing units also with no USPS Undeliverable as Addressed notification (UAA) and with 2010 NRFU fieldwork are used in the regression. The standard errors are robust.