Embed Size (px)
Citation preview

Copyright © 2014 Nielsen Catalina Solutions • Confidential & Proprietary 1
Using single source data to precisely target and measure advertising’s
impact on sales to drive ROI
WAIC Conference – May 1, 2014 Nielsen Catalina Solutions

Copyright © 2014 Nielsen Catalina Solutions • Confidential & Proprietary 2
What we’ll cover
• Purchaser-centric approach
• Single source data
• Buyergraphics vs. demographics
• Driving retail sales and ROAS
• Case studies

Copyright © 2014 Nielsen Catalina Solutions • Confidential & Proprietary 3
Nielsen Catalina Solutions (NCS)Combining strengths of two industry leaders

Copyright © 2014 Nielsen Catalina Solutions • Confidential & Proprietary 4
TV Watch Data Nielsen Media Data +Millions of computer screens, Televisions, mobile phones
Buy Data Catalina Frequent Shopper Card Data
Nielsen Homescan All-Outlet DataClient Proprietary Sales Data
70 MM HH
ANONYMOUS SINGLE SOURCE HHs
WATCH
Matching what consumers watch and buy
Single Source
Households

Copyright © 2014 Nielsen Catalina Solutions • Confidential & Proprietary 5
STB4.3 MM
Households
Catalina FSD70 MM Households
HomeScan
100,000
NPM + MM
37,000
1.4 Million
NCS TV Single Source: Big, Smart Data
Quality = Scale & Representivity

Copyright © 2014 Nielsen Catalina Solutions • Confidential & Proprietary 6
Online portals & publishers
~100 MM HH
Catalina FSD70 MM HH
HomeScan
100,000
NOL100,000
16 Million
NCS Digital Single Source: Big, Smart Data
Quality = Scale & Representivity

Copyright © 2014 Nielsen Catalina Solutions • Confidential & Proprietary 7
Survey = Claimed Single Source
Households Demographics
Life Stage & Lifestyle
Increase in Data Precision
“Place an X by the product if youhave used it in the last 6 months”
ACTUAL CONSUMER RETAIL SALES DATA+ ACTUAL TV VIEWING
Survey BasedPurchaser
vs.
Single source provides greatest precision & ROAS
Single Source

Copyright © 2014 Nielsen Catalina Solutions • Confidential & Proprietary 8
47% of the brand’s volume reached by demographic target 53% of the brand’s volume is outside
the demographic target
BRANDVOLUME
53%
Today’s reality…demographic approach can miss over half your buyers
WOMEN
25-54 47%
Copyright © 2014 Nielsen Catalina Solutions • Confidential & Proprietary 9
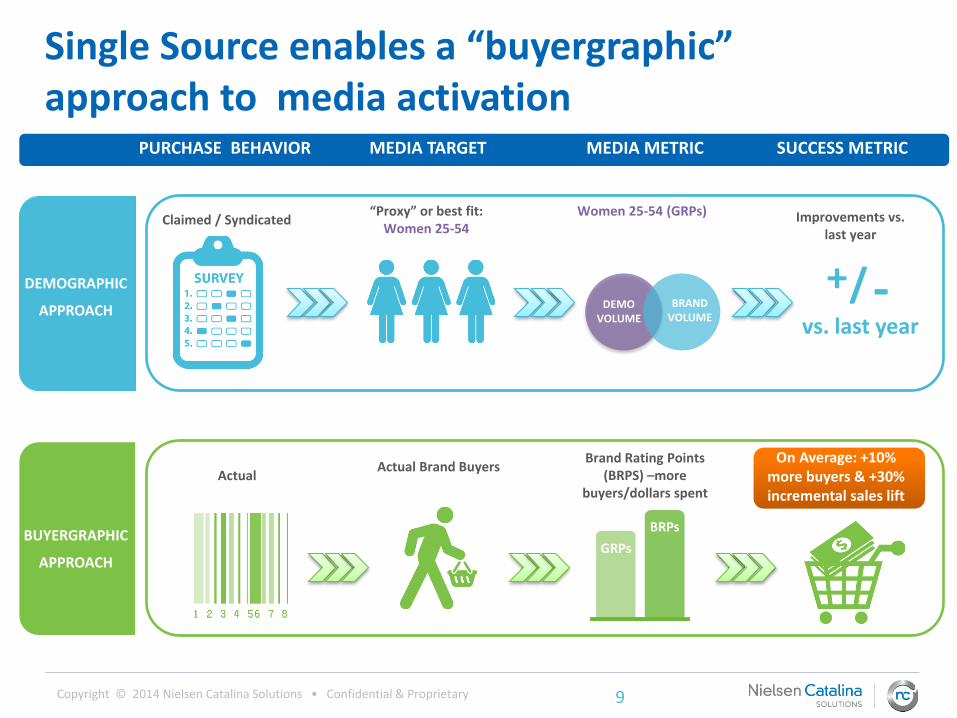
DEMOGRAPHIC
APPROACH
MEDIA TARGET
“Proxy” or best fit:Women 25-54
PURCHASE BEHAVIOR
Claimed / Syndicated
MEDIA METRIC
Women 25-54 (GRPs)
SUCCESS METRIC
Improvements vs. last year
BUYERGRAPHIC
APPROACH
Actual Brand BuyersActual
Brand Rating Points (BRPS) –more
buyers/dollars spent
On Average: +10%more buyers & +30% incremental sales lift
DEMOVOLUME
BRANDVOLUME
+ -/vs. last year
Single Source enables a “buyergraphic”approach to media activation

Copyright © 2014 Nielsen Catalina Solutions • Confidential & Proprietary 10
ASSESSDELIVERY
Post-buy analysis basedon purchasers
OPTIMIZEPLAN
Buyergraphics identify buyer-rich media for plans/allocations
SUPPORTACTIVATION
Support agency planning/buying
systems
SalesEffect
Studies
MEASURE SALES IMPACT
AdVantics™
Based onpurchase behavior
DEFINEAUDIENCE
Continuous Media Optimization Process

Copyright © 2014 Nielsen Catalina Solutions • Confidential & Proprietary 11
Case Studies
Copyright © 2014 Nielsen Catalina Solutions • Confidential & Proprietary 12
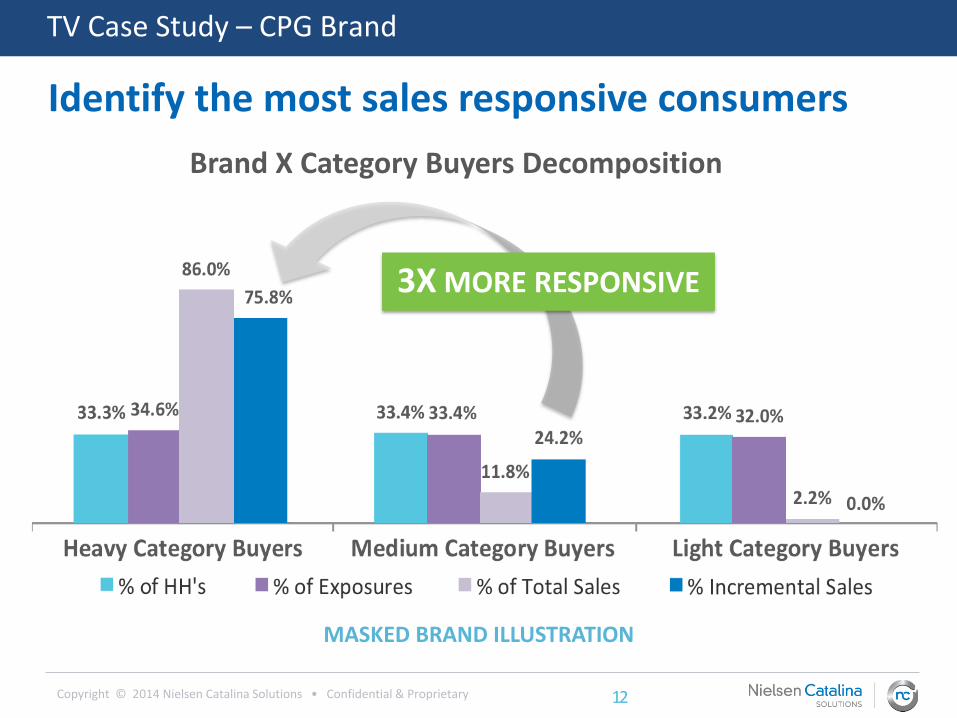
MASKED BRAND ILLUSTRATION
Brand X Category Buyers Decomposition
3X MORE RESPONSIVE
TV Case Study – CPG Brand
Identify the most sales responsive consumers

Copyright © 2014 Nielsen Catalina Solutions • Confidential & Proprietary 13
13%
TV Case Study – CPG Brand
TV-driven incremental sales increased by 20%
OriginalDemographic Based
$13,276 MM
Brand A
Original
20%
OptimizedBuyer Based
$15,931 MM
Optimized

Copyright © 2014 Nielsen Catalina Solutions • Confidential & Proprietary 14
Buyergraphic Optimization
BRAND X BUYERS
# Network Rating
1 ABC Family 0.51
2 E! 0.50
3 TBS 0.42
3 HGTV 0.42
5 TNT 0.37
6 WEtv 0.34
7 A&E 0.32
8 TLC 0.31
9 Bravo 0.29
10 Food Network 0.28
11 Lifetime 0.25
185 index
80% FEMALE
Source: Nielsen Media Research AdViews (4Q 2012-2Q 2013)
DemographicSelection
WOMEN 18-49
# Network Rating
1 TBS 0.57
2 ABC Family 0.47
3 A&E 0.43
3 TNT 0.43
5 TLC 0.38
6 Bravo 0.36
7 HGTV 0.35
7 Lifetime 0.35
9 Food Network 0.34
10 BET 0.29
11 E! 0.27
Case Study – TV Network
Finding Brand X buyers on Cable Networks

Copyright © 2014 Nielsen Catalina Solutions • Confidential & Proprietary 15
TV Case Study – CPG
TV campaign increased sales by >10%
Actual ROASD
EPLO
Y M
EDIA
CO
NTI
NU
OU
S M
EDIA
OP
TIM
IZA
TIO
N
Three strong Buyer Segments identified
Original
Network NBC CBS
HH GRP’s 2.9 3.0
Buyer Index
67 79
Har
ry’s
La
w
Ho
w I
Met
You
r M
oth
er67
79
TV schedule under-delivered buyer segments
Revised
Network NBC CBS
HH GRP’s 3.6 5.7
Buyer Index
126 108
The
Off
ice
Surv
ivo
r:O
ne
Wo
rld
126
108
Programs were shifted to reach buyers
Bu
yer
Segm
ent
A
Bu
yer
Segm
ent
B
~210 index
~400 index
Bu
yer
Segm
ent
C
~175 index
Buyer Index
> 10% Incremental Lift in
TV Driven Sales
Ori
gin
alD
emo
grap
hic
Bas
ed
Op
tim
ize
dB
uye
r B
ased
>10%
ID HIGH POTENTIAL BUYER SEGMENTS
OPTIMIZE MEDIA TO REACH BUYERS
MEASURE RESULTS

Copyright © 2014 Nielsen Catalina Solutions • Confidential & Proprietary 16
TV Case Study: Multiple CPG Brands
Marketing Situation:
• BRAND LOYALTY was DECLINING
• PURCHASE ON DEAL was INCREASING
• TV ROI was DECLINING
Problem: How to improve the TV ROI across entire Brand portfolio?
needs graphic design work

Copyright © 2014 Nielsen Catalina Solutions • Confidential & Proprietary 17
Buyergraphic targets were developed for each brand. Existing TV inventory was reallocated to better match programs with targets
Brands Original TV Target NCS Buyer-Based Target
Brand A A 25 – 39 Heavy Buyers of Brands w/ Similar Flavor and Type
Brand B A 35 – 49 Heavy Buyers of Competitive Brands
Brand C A 18 – 34 Heavy Buyers of Brands w/ Similar Flavor
Brand D A 18 – 34 Heavy Buyers of Category
Brand E M 25 – 34 Category Switchers

Copyright © 2014 Nielsen Catalina Solutions • Confidential & Proprietary 18
Media Results: 21% more BRPs were delivered to the entire brand portfolio after re-allocation
4,466 4,4664,989
6,046
Original Delivery NCS Re-AllocationGRPs BRPs
Q2 2013 National TV Inventory Re-Allocation
+21% BRPs

Copyright © 2014 Nielsen Catalina Solutions • Confidential & Proprietary 19
BRAND A BRAND B BRAND C BRAND D BRAND E
Q2 Original Delivery BRPs Q2 NCS Re-Allocation BRPs
% Increase 38% 22% 58% 32% 17%
Media Results: Each brand delivered more buyers after re-allocation
Copyright © 2014 Nielsen Catalina Solutions • Confidential & Proprietary 20
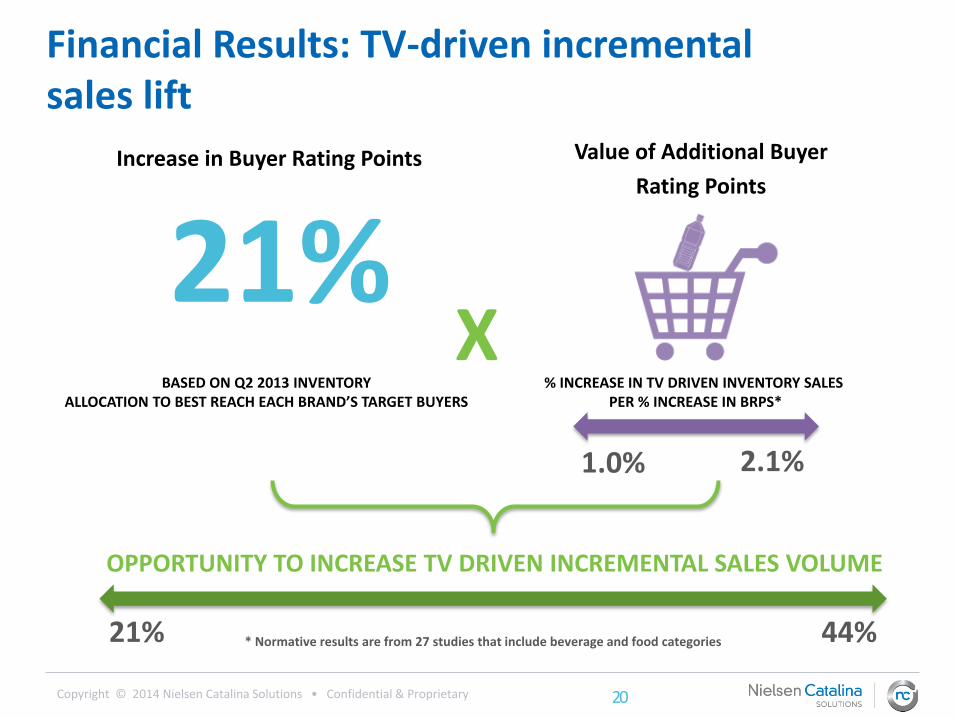
Financial Results: TV-driven incrementalsales lift
* Normative results are from 27 studies that include beverage and food categories
X
21% 44%
OPPORTUNITY TO INCREASE TV DRIVEN INCREMENTAL SALES VOLUME
Value of Additional Buyer
Rating Points
1.0% 2.1%
% INCREASE IN TV DRIVEN INVENTORY SALESPER % INCREASE IN BRPS*
Increase in Buyer Rating Points
21%BASED ON Q2 2013 INVENTORY
ALLOCATION TO BEST REACH EACH BRAND’S TARGET BUYERS

Copyright © 2014 Nielsen Catalina Solutions • Confidential & Proprietary 21
What’s driving sales?
TV
TV Driven Sales for Brand
BrandIncremental Sales due to
TV (MM)
% Increase in BRPs
Range in Incremental Sales Gain
(MM)
LowRange
HighRange
Brand A $21.9 38% $8.3 $11.8
Brand B $18.5 22% $4.1 $7.1
Brand C $25.8 40% $10.3 $14.4
Brand D $71.8 32% $22.9 $34.5
Brand E $2.7 17% $0.5 $0.9
Total Portfolio $140.7 $46.1 $68.7
Financial Results: Annual incremental sales increased $46MM – $69MM using buyerbased TV targeting
---
Marketing Mix

Copyright © 2014 Nielsen Catalina Solutions • Confidential & Proprietary 22
$43.5MMMedia
Spending
7,690HH GRPs
90%Reach
$199MM Incremental Sales$4.57 ROAS
4.5% Sales Uplift
ImpactExecution
NCS Holiday Campaign Sales Effect Measurement
TV Case Study – Retailer
TV campaign drove retailer’s sales at holiday

Copyright © 2014 Nielsen Catalina Solutions • Confidential & Proprietary 23
Digital Case Study – Ad Payback
Online Ads generate $3 for every $1 spend on advertising using purchaser information

Copyright © 2014 Nielsen Catalina Solutions • Confidential & Proprietary 24
Radio Case Study – Ad Payback
Radio is effective for driving sales!
Radio Payback per $1 Ad Investment
Ratio of incremental sales revenue per thousand to advertising cost per thousand = PaybackSource: Nielsen Catalina Solutions, Radio Ad Norms 2014
$11.15
Retail A
$6.21
All - Category Average
$1.81Breakfast Bar
$7.33Snacks A $4.17
Beer
$3.81Soft Drink A
$4.33Snacks B $23.21
Retail B
$1.38Soft Drink B
$3.12Candy
$1.97Soft Drink C

Copyright © 2014 Nielsen Catalina Solutions • Confidential & Proprietary 25
Compilation of 1,000+ studies across multiple categories
Control Exposed
+24%
Control Exposed
+22%
NCS Purchase-based Targeted Campaign
NCS Purchase-based Targeted Campaign
Case Study Compilation – Digital and TV
TV CampaignAverage Dollars Per Household
Control
+18%
Exposed
Digital CampaignAverage Dollars Per Household
Control
+17%
Exposed
Non-NCS Targeted Campaign
Demo-Targeted Campaign
NCS “buyergraphics” ~30% incremental retail sales lift

Copyright © 2014 Nielsen Catalina Solutions • Confidential & Proprietary 26
Single source data with purchaser-based targetscan drive sales and increase ROAS for all media

Copyright © 2014 Nielsen Catalina Solutions • Confidential & Proprietary 27
Final Thoughts --
TBD
TBD
TBD
TBD

Copyright © 2014 Nielsen Catalina Solutions • Confidential & Proprietary 28
Thank you!To learn more, contact:
Leslie [email protected]
www.ncsolutions.com