Embed Size (px)
Citation preview

USING PROBLEM BASED LEARNING AND GUIDED INQUIRY IN A HIGH SCHOOL ACID-BASE CHEMISTRY UNIT
By
Katie McKinley
A THESIS
Submitted to Michigan State University
in partial fulfillment of the requirements for the degree of
MASTER OF SCIENCE
Biological Sciences - Interdepartmental
2012

ABSTRACT
USING PROBLEM BASED LEARNING AND GUIDED INQUIRY IN A HIGH SCHOOL ACID-BASE CHEMISTRY UNIT
By
Katie McKinley
The purpose of this investigation was to determine if incorporating problem based learning
and guided inquiry would improve student achievement in an acid base unit for high school
chemistry. The activities and labs in the unit were modified to be centered around the problem of a
fish kill that students investigated. Students also participated in guided inquiry labs to increase the
amount of critical thinking and problem solving being done in the classroom. The hypothesis was
that the implementation of problem based learning and guided inquiry would foster student
learning.
Students took a pre-test and post-test on questions covering the objectives of the acid base
unit. These assessments were compared to determine the effectiveness of the unit. The results
indicate that the unit was effective in increasing student performance on the unit test. This study
also analyzed the process of problem based learning. Problem based learning can be an effective
method of engaging students in inquiry. However, designing an effective problem based learning
unit requires careful design of the problem and enough structure to assure students learn the
intended content.

ACKNOWLEDGEMENTS
I would like to acknowledge Dr. Merle Heidemann for her continual support and guidance.
I would also like to thank Dr. Ken Nadler for his assistance in developing labs and Dr. Chuck
Elzinga for sharing his enthusiasm for the great outdoors.
iii

TABLE OF CONTENTS
LIST OF TABLES……………………………………………………………………….. vi
LIST OF FIGURES……………………………………………………………………… viii
INTRODUCTION………………………………………………………………………. 1 Rationale and Statement of Problem……………………………………………. 1 PBL and Guided Inquiry in the Literature………………………………………. 3 Challenges with PBL in the High School Classroom…………………………… 12 Solutions………………………………………………………………………… 17 Class Description and Demographics…………………………………………… 18 Summary of Science Concepts………………………………………………….. 19
IMPLEMENTATION…………………………………………………………………... 22 General Implementation…………………………………..……………………. 22 Activity #1: Ion Testing Lab…………………………………..………………... 25 Activity #2: Read about fish kill in textbook and brainstorm what to test for….. 26 Activity #3: Riverwood data analysis…………………………………..………. 26 Activity #4: Modeling acid rain formation: inquiry mini-lab…………………... 27 Activity #5: Acid rain micro-titration…………………………………..………. 28 Activity #6: Buffer inquiry lab and the affects on acid rain……………………. 28 Activity #7: Limestone buffer tube demonstration…………………………..…. 29
RESULTS AND EVALUATION……………………………………………………….. 31 Objective Data Analysis: Multiple Choice Pre-Test and Post-Test……………... 31 Selected Item Analysis: Multiple Choice……………………………………….. 33 Objective Data Analysis: Short Answer Pre-Test and Post-Test………………… 35 Selected Item Analysis: Short Answer………………………………………….. 36 Analysis of Labs and Activities ………………………………………………… 39 Subjective Data Analysis: Post-unit Survey…………………………………….. 41
DISCUSSION/CONCLUSION………………………………………………………… 48 General Discussion……………………………………………………………… 48 Discussion of Labs and Activities………………………………………………. 50 Implementation Limitations and Potential Solutions…………………………… 57 Conclusions……………………………………………………………………… 62 APPENDICES…………………………………………………………………………… 65 Appendix A: Lab Activities……………………………………………………… 66 Appendix B: Unused Labs………………………………………………………. 85 Appendix C: Articles for Students………………………………………………. 119
iv

Appendix D: Consent Form, Assessments and Survey…………………………. 133
REFERENCES………………………………………………………………………….. 147
v

LIST OF TABLES
Table 1: Levels of Inquiry (Blanchard et al, 2010) …………………………………….. 8
Table 2: Acid Base Unit Outline ………………………………………………………... 23
Table 3: Pre-test vs. Post-test Multiple Choice Comparison……………………………. 32
Table 4: Pre-test vs. Post-test Short Answer Comparison………………………………. 36
Table 5: Activity Number Key………………………………………………………….. 42
Table 6: Calcium Ion (Ca2+) Test……………………………………………………….. 70
Table 7: Iron (III) Ion (Fe3+) Test……………………………………………………….. 70
Table 8: Chloride Ion (Cl-) Test…………………………………………………………. 71
Table 9: Sulfate Ion (SO42-) Test………………………………………………………… 71
Table 10: Riverwood Data………………………………………………………………. 74
Table 11: Microtitration Sample Data…………………………………………………… 80
Table 12: Average Height of Radishes in Soil…………………………………………… 93
Table 13: Average Height of Radishes on cotton ball in test tube (cm)…………………. 94
Table 14: Titration Data Table…………………………………………………………… 99
Table 15: Antacid Microtitration Data Table……………………………………………. 104
Table 16: Antacid Class Data……………………………………………………………. 105
Table 17: Antacid Microtitration Sample Data………………………………………….. 109
Table 18: Antacid Titration Data Table………………………………………………….. 112
Table 19: Antacid Titration Class Data………………………………………………….. 113
Table 20: Antacid Titration Sample Data……………………………………………….. 115
vi

Table 21: Comparing the pH of Three Solutions……………………………………….. 139
vii

LIST OF FIGURES
Figure 1: Multiple Choice Test Comparison……………………………………………. 32
Figure 2: Short Answer Test Comparison……………………………………………….. 36
Figure 3: Survey Analysis: Activities Ranked as Most or Least Interesting……………. 43
Figure 4: Survey Analysis: Activities Ranked as Learning Most or Least From……….. 44
Figure 5: Survey Analysis: Activities Ranked as Most or Least Mentally Engaging…... 45
Figure 6: Range of Tolerance for Dissolved Oxygen in Fish…………………………… 73
Figure 7: Radish Growth at Various pHs……………………………………………….. 95
Figure 8: Radish Growth at pHs 3 to 6…………………………………………………. 95
Figure 9: Radish Growth at pHs 7 to 11………………………………………………... 96
Figure 10: Radish Growth in Test Tubes……………………………………………….. 96
Figure 11: Radish Growth in Test Tubes at pHs 7 to 12.3……………………………… 97
Figure 12: Radish Growth at pHs 10 to 14……………………………………………... 97
Figure 13: “Fox River Fish Kill” Article……………………………………………….. 120
Figure 14: “Lakes and Streams Taking Time To Recover From Acid Rain” Article…… 129
viii

Introduction
Rationale and Statement of Problem
As educators, our goal is to assist students in developing into competent, confident adults
who will find solutions to the problems of the future and keep our country heading in the right
direction. A large part of this development, must focus on developing the ability to be critical
thinkers and problem solvers in an ever changing world. Students also must learn to work
cooperatively with others while they are in school so they will be ready to participate in a
collaborative workforce.
Educators in secondary schools are charged with preparing all students to be college and
workplace ready by incorporating activities and exercises that foster critical thinking and problem
solving skills. The state government and school administrators will judge student preparedness for
a successful future based on the results of standardized tests such as the Michigan Merit Exam,
MME, and American College Testing or the ACT. Legislation passed in 2011 to judge how
effective teachers are based on their students performance on these tests. More and more pressure
is put on schools and teachers to continue to improve on standardized tests every year while still
covering the state content expectations. The current focus in the school in which this study takes
place, due to the new common core standards, is to incorporate literacy through reading, writing
and discussing, in all classrooms and content areas.
In order to prepare students for standardized tests, college coursework and the job force,
teachers must incorporate more inquiry based activities, problem solving tasks, and literacy
activities involving reading and writing. The ACT requires students to read for information and
analyze data. Little to no science content knowledge is required to answer the questions. All
1

information necessary is in the passage and students must be able to comprehend the passage and
analyze the data to answer the questions. Science colleagues in the target school used in this study
have focused on incorporating more reading to improve students’ comprehension and ability to
analyze data.
There are many ways in which the target school’s science teachers have incorporated data
analysis. Students have interpreted lab results and written their own conclusions based on evidence.
Students also have studied graphs to find trends in data and have applied that information to new
problems. Even with these practices in place, there is still a need to incorporate more reading into
the curriculum and also activities that foster critical thinking and problem solving skills. “Teachers
need to be equipped to facilitate investigations and conversations that help students to analyze
instead of recall, to justify instead of define, and to formulate instead of list….Whatever terms
chosen, for students to excel in tomorrow’s world, they must be equipped to solve complex
problems instead of just memorizing algorithms or definitions….the data indicate that our nation’s
schools and classrooms have not been successful in helping most students become better critical
thinkers and problem solvers” (Marshall et. al, 2011).
Tony Wagner is the Innovation Education Fellow at the Technology & Entrepreneurship
Center at Harvard and has been widely published. His most recent publication is entitled “Creating
Innovators: The Making of Young People Who Will Change The World”. On his website, (http://
www.tonywagner.com/7-survival-skills) Wagner discusses how employees of the 21st century need
critical thinking and problem solving skills. Companies want to hire employees who can generate
new ideas and improve upon the way things have always been done. Students will need the skill of
determining what they need to know and being able to find answers to these questions. Students
2

should practice thinking on their own rather than following instructions or memorizing facts.
Science and technology are growing fields and students must be able to find solutions to inquiries
they have and design the technological tools they need to solve the problems our society will face in
the future (Haury, 2002). These skills can be developed with problem based learning and inquiry, in
which learners have a hands-on experience with the content, leading to better understanding and
retention of the material. Rather than just being told information, students must think deeply to
investigate problems, design experiments, and come to conclusions based on evidence (Haury,
1994). The hypothesis of this study was that by incorporating problem-based learning and inquiry
labs students would show learning gains.
Problem Based Learning and Guided Inquiry in the Literature
Problem based learning (PBL) and guided inquiry address many of the challenges facing
educators. Lehman et al. (2006) state that “Calls for reform in science education stress the need for
inquiry-based, integrative methods that provide students with opportunities to solve authentic
problems”. These problem-centered inquiry approaches utilize a driving question based on a real-
world problem in which students work in collaborative groups and use technology to gather
information.
Constructivism, also referred to as discovery learning, is an instructional approach in which
students actively build meaning for themselves through first hand experience and observations
(Mayer, 2004). Constructivist approaches such as PBL and inquiry claim that knowledge is not
passed directly between people but has to be built actively by the student doing the discovering for
themselves. Inquiry is an instructional approach that has varying degrees of freedom with the
3

general goal that students will evaluate data to make a conclusion about natural phenomena
(Blanchard et al, 2010).
PBL is a method of instruction in which students are presented with a complex, everyday
problem that does not have one single correct answer. Students engage in self-directed learning and
work in collaborative groups to work through the process of solving the problem. Self-directed
learning in PBL means students will take an active role in planning, monitoring and evaluating the
learning process (Kang et al, 2009). Self-directed learning results in students who can think for
themselves and find the necessary information to solve problems more independently than those
students told how to do things (Hmelo-Silver, 2004).
Students begin the PBL process by examining their prior knowledge of the subject and
identifying what else they need to know. By relating new knowledge to what they already know,
students construct a deeper understanding of incoming information. This step if often done in
groups and students analyze the information and generate learning issues to be investigated.
Students then research and gather data to solve the problem. Once data have been gathered,
students reconvene with the group to present their findings and come to a conclusion together. The
cycle begins again as students re-evaluate the original problem and determine what else they need
to know (Hmelo-Silver, 2004).
Problem based learning provides students with a relevant problem to investigate. Relevance
makes learning more interesting for students and thereby acts as a motivating force. Students can
relate to the everyday problem and are more engaged than in a traditional lecture where they sit
back and take notes without really processing the information. The problem increases student
motivation as it is realistic and needs to be answered, but may not have a single correct solution.
4

The problem needs to be reasonable for the students to be able to answer, but complex enough to
keep them interested in solving it.
The teacher acts as a facilitator throughout this process. Rather than directly instructing
students what they need to know, the teacher guides students through the problem solving process
by asking students questions and providing them with small amounts of information as needed
(Mergendoller et al., 2006). The role of the facilitator is to scaffold learning, or break it into
manageable chunks, using modeling and coaching. This modeling and coaching typically is
accomplished through questioning of students to assist them in processing a problem, developing
questions, and determining what to research (Hmelo-Silver, 2004). The facilitator models thinking
strategies for students and directs specific questions to students when they need to further explain or
explore a concept. The facilitator moves throughout the classroom going from group to group,
listening to their progress. If students are not making enough progress the facilitator may intervene
to get them back on track, but must be careful not to provide too much information, thereby
undermining the self-directed learning taking place. “The PBL facilitator (a) guides the
development of higher order thinking skills by encouraging students to justify their thinking and (b)
externalizes self-reflection by directing appropriate questions to individuals” (Hmelo-Silver, 2004).
Cooperative learning is a big part of PBL and students develop the skills needed to work
with others as they will do in the workplace. “Students work in collaborative groups, actively
constructing their understanding of content and developing a range of inquiry skills as they explore
the problem” (Goodnough and Cashion, 2003). Students often split up the topics to be researched
and become experts in their area. They then share their “expert” information with each other and
discuss potential solutions to the problem. These discussions foster critical thinking and problem
5

solving skills as students must think through and process information and relate it back to the
original problem. Students develop their own solutions which leads to a deeper understanding of
the content than just memorizing “factoids” (Blosser, 1993).
Sockalingam et al. (2011) aimed to determine characteristics of problems in problem based
learning. The researchers had biomedical students reflect on what makes for a good problem that
will result in desirable learning outcomes. The problem is defined as the instructional materials,
text, photographs or computer simulations that trigger learning. The problem generally takes the
form of natural phenomena in need of resolution. The quality of the problem is crucial for
producing learning as it serves to initiate the learning process. One of the characteristics valued
most by the students in this study was that the problem needed to be clear and comprehensible so
the students could identify the learning issues. This indicates that the students preferred to have the
problem given to them with clues for a direction of study implanted in the problem. Referring to
Table 1, this automatically places the PBL preferred by these students into one of the first three
more guided levels.
Another problem characteristic valued by the students in Sockalingam et al.’s (2011) study
was that the problem needed to have “clue words” that will direct students towards terminology
they need to research in reference to the problem. The use of pictures, stories, examples, analogies
and metaphors were also identified as useful parts of the problem. Students also suggested that the
difficulty of the problem affected the level of critical thinking achieved. Students also commented
that the problem should be interesting and stimulate their desire to solve the problem. A boring
problem leads to minimal effort if students do not care about finding the solution. Interest in the
problem includes not only the topic being investigated but also the types of learning activities
6

involved. Students decide how hard they will work after evaluating the problem for clarity,
direction, difficulty, interest and type of learning activities. If a problem is unclear, lacks direction
or appropriate difficulty or is boring, students are more likely to input less effort in researching a
solution to the problem.
Walker and Leary (2009) discuss PBL problems as existing on a spectrum with one extreme
being a highly structured problem which focuses on arriving at an expected solution. On the other
end of the spectrum are the ill-structured problems in which evaluation is based on evidence of
reasoning rather than finding a solution, which might not exist. These researchers go on to say that
variability of problem complexity in different studies is so high that they chose not to try to relate
complexity to problem type.
Barrows (1986) created a taxonomy that classified PBL methods. The lecture-based case
method is teacher-directed and provides students with everything they need to know. Students are
taught whatever knowledge or skills they need to solve the problem prior to presentation of the
case. Students still determine a solution to the problem, but there is no free inquiry. Similar to the
previous method, the case method provides students with the information needed, but then there is a
blend of student-directed and teacher-directed discussion after students analyze the data. Modified
case methods add one more dimension to the case method in that they provide opportunities for
inquiry. However, the inquiry is often cued and limited in that there is a direction provided. The
modified case method seems to align most with the approaches used in this study. The aim would
be to allow for free inquiry by using the problem based approach in which the teacher acts as the
facilitator and the students direct the process. The “best” method of PBL, according to Walker and
Leary (2009), is the closed loop problem based approach. This is the same as the problem based
7

method described previously, but adds a layer as students revisit the problem to reflect on their
conclusions and identify questions for further investigation.
By nature, PBL goes hand in hand with inquiry as students pose a problem, investigate that
problem, and use evidence to support their conclusion in both types of learning. PBL and inquiry
learning are so similar that Hmelo-Silver et al. claim that there are no clear features that distinguish
the two instructional methods (2007). There are various types of inquiry ranging from level 0 or
verification inquiry to level 3 or open inquiry. Table 1 was adapted from Blanchard et al. 2010 and
differentiates between the various types of inquiry. Blanchard et al. referenced Abrams et al., 2007
and Schwab (1962) and Colburn (2000b) as the source of this table.
Table 1: Levels of Inquiry (Blanchard et al, 2010)
Inquiry Type Source of Question Data Collection Methods
Interpretation of Results
Level 0: Verification Given by teacher Given by teacher Given by teacher
Level 1: Structured Given by teacher Given by teacher Open to student
Level 2: Guided Given by teacher Open to student Open to student
Level 3: Open Open to student Open to student Open to student
PBL corresponds closely to level 3 or open inquiry. The PBL unit implemented in this study
would fall between the structured and guided categories as the questions and data collection
methods were often provided. Blanchard et al. (2010) states “It is important to recognize that there
is no optimal form of inquiry that extends across all content or context. Instead, the goal a teacher
has for inquiry, characteristics of her teaching context, skill level of the student and the materials
available each shape the level of inquiry that can be optimally employed. Thus, we must move
away from viewing or describing Level 3 inquiry or “open inquiry” as the “ideal” way to teach
8

science (Settlage, 2007); instead the optimal level of inquiry will vary according to the classroom
context and the demands of the material”.
Blanchard et al. (2010) goes on to say that “Open inquiries typically require prior
experiences with inquiry and as well as some prior knowledge and skills, and therefore only are
appropriate to teach and learn certain types of content”. It is noted that successful inquiry requires
guidance from the teacher at points where students may need re-direction or instruction to proceed.
Mayer (2004) states that much research supports guided discovery as more effective than open
discovery when it comes to learning and transferring knowledge to new questions. This is because
students need to be challenged to actively think about what they are learning, but also need to be
provided with enough guidance that they will be able to construct meaning out of their experiences.
Investigation of the natural world develops critical thinking skills as well as many other
beneficial skills like graphing and interpreting data, problem solving, understanding the scientific
process and literacy. These types of skills are what science education has been aiming to develop in
students for decades, and inquiry has been a main focus of science education as it develops these
skills (Haury, 1993). Research on the effectiveness of inquiry based instruction shows mixed
results. However, the vast majority of research supports inquiry as an equal or better method of
instruction when compared to traditional approaches in a lecture style classroom (Blanchard, et al,
2010).
Kirschner et al. (2006) claim that open-ended inquiry and problem based methods of
teaching are ineffective as students need guidance through the learning process. They state that
“Controlled experiments almost uniformly indicate that when dealing with novel information,
learners should be explicitly shown what to do and how to do it”. They go on to say that unguided
9

instruction has failed since the 1950s. Each time the method fails it is renamed (starting as
discovery learning, then experiential learning, then problem-based and inquiry learning, and now
constructivism) and the process of being used and tested repeats itself.
Although it is true that complete open inquiry with no teacher guidance is likely to lead to
confusion and disengagement of students, guided inquiry can be a favorable teaching method with
enough structure and guidance. What Kirschner et al. fail to address is the varying levels of inquiry
that provide students with the guidance needed to succeed based on their skill level. In Hmelo-
Silver’s et al. (2007) response to Kirschner et al. they state that “Scaffolded inquiry and problem-
based environments present learners with opportunities to engage in complex tasks that would
otherwise be beyond their current abilities. Scaffolding makes the learning more tractable for
students by changing complex and difficult tasks in ways that make these tasks accessible,
manageable, and within student’s zone of proximal development”. With structure, inquiry is
possible, and can be a favorable learning method that provides students with opportunities to be
challenged mentally and take responsibility for their own learning.
In guided inquiry, the goal is to have students analyze a data set, then generate a hypothesis,
test that hypothesis and use data to support their claims. (Farrell et al. 1999). This is essentially the
same process used in PBL. The only difference would be that the students are generating
hypotheses and often designing experiments to test their ideas, whereas in PBL, experiments may
not be part of the learning activities involved. PBL involves research using all sorts of sources
ranging from internet searches to interviewing community members. In some forms of guided
inquiry, students analyze provided data to solve problems. This is still similar to experimental
10

inquiry, but shifts the focus from performing an experiment to integrating new information to
understand the concepts being asked about.
Farrell et al. (1999) use guided inquiry worksheets and labs to teach a general chemistry
college course. In guided inquiry, students work in groups to solve critical thinking questions based
on the data provided. Professors give no lectures, and only act as facilitators to guide students
through this process. Labs are also performed in groups with students generating and testing
hypotheses. These researchers report a lower dropout rate in the guided inquiry class compared to
the traditionally taught, lecture based course. They also report students having a very positive
attitude and preference for the guided inquiry course. They state that “..every student from a first
semester GI (guided inquiry) section who intended to take the second-semester course elected to
stay with the GI approach”.
Inquiry is not limited to labs, worksheets, or in-class activities, but can be broadened to
include reading. While reading, students problem solve and learn independently as they draw
conclusions about the information presented in a passage and use evidence to support their claims.
Cervetti et al. (2005) state that “science and literacy share a set of core meaning making strategies”
and that “Comprehension strategies similarly represent an approach to questioning and making
sense around text”. Reading is a type of inquiry as students engage in metacognitive thought
processes to make sense of what they read. These processes include questioning, predicting,
clarifying, and relating incoming information to prior knowledge.
11

Challenges with Problem Based Learning in the High School Classroom
There are mixed results on the effectiveness of PBL. Research on the influence of PBL
shows some evidence that PBL improves students’ abilities to problem-solve and reason (Hmelo-
Silver, 2004) and perform higher on standardized tests (Blanchard et al, 2010). However, some
studies show no significant difference between achievement outcomes for PBL as compared to
direct instruction (Albano et al., 1996; Blake et al., 2000). Mayer (2004) says that his research into
the effectiveness of discovery learning showed guided discovery to be a more effective method of
learning and transfer of knowledge than pure discovery. He claims that for students to arrive at the
expected conclusion a certain level of guidance must be in place.
Savery (2006) reports that “A meta-analysis of 20 years of PBL evaluation studies was
conducted by Albanese and Mitchell (1993), and also by Vernon and Blake (1993), concluded that a
problem-based approach to instruction was equal to traditional approaches in terms of conventional
tests of knowledge (i.e., test scores on medical board examinations), and that students who studied
using PBL exhibited better clinical problem-solving skills”. Marshall and Horton (2011) state that
there is a strong positive correlation linking time spent exploring concepts and cognitive level. He
claims that just explaining concepts is not producing the critical thinking that instructors aim for.
Students actively process information as they explore it. What Marshall and Horton (2011) fail to
mention is that students can actively process and think critically without having to explore
anything. Simply providing students with data or information to analyze will result in the higher
order thinking skills sought after.
Most research done on PBL has centered around medical students, as that is where PBL has
been developed and most used. Assuming that PBL will work well in secondary schools because it
12

has been shown to have benefits in medical schools is a dangerous generalization to make. It is the
aim of this study to provide some insight into ways to successfully implement PBL in high school
where teachers face issues that medical schools do not. Class size is one issue, as well as academic
level and motivation being much lower for high school students than medical students. Medical
students are an elite, highly intellectual group that have chosen to be in school and a direct
comparison to high school students is not possible. (Hmelo-Silver, 2004; and Mergendoller et al.,
2006). Mergendoller et al. (2006) report that “...no empirical studies suggest that PBL is an
effective instructional approach for lower ability high school students. In fact, the opposite may be
true”. Lower level students lack the extensive hypothetical deductive reasoning skills that most
medical students have mastered prior to participating in a PBL unit.
Sanson-Fisher and Lynaugh (2005) concluded that “Available evidence, although
methodologically flawed, offers little support for the superiority of PBL over traditional curricula”.
A few studies done on the effectiveness of PBL in high school reported PBL as being less effective
than lecture based insturction. A study done by Mergendoller et al. (2000) on a high school
economics class showed no significant difference between PBL and lecture based classrooms in
terms of learning within individual units. However, they did find a significant difference in
knowledge from the start to the end of the semester with the PBL students claiming to have learned
less and having lower motivation than the lecture based course. A high school genetics course
study compared PBL and lecture-based instructional methods and found that PBL students reported
less motivation and learning but more confidence than lecture based students (Mergendoller et al.,
2006).
13

Savery (2006) states that part of the issues with PBL being ineffective in some cases is it’s
widespread implementation in multiple contexts ranging from medical education, engineering,
architecture, economics and teacher preparation programs. Confusion over how to effectively
design and implement PBL may contribute to poor outcomes where students perform at or below
the level of those in traditional classrooms. Some of the issues Savery sees as leading to
ineffective use of PBL include “lack of research and development on the nature and type of
problems to be used; insufficient investment in the design, preparation and ongoing renewal of
learning resources; and inappropriate assessment methods which do not match the learning
outcomes sought in problem-based programs…”.
In medical schools one facilitator works with one group. In a high school setting, one
facilitator may have 10 or more groups to monitor depending on class size. It can be very difficult
to get around to all the groups and monitor their progress. Also, it can be difficult for the teacher to
transition from the role of knowledge provider to tutor/guidance provider. Facilitators must be
careful not to provide too much information, but must also keep all groups headed forward and
progressing. One strategy to assist the teacher in keeping groups on task and progressing is the use
of group roles such as presenter, recorder and manager. When students have assigned roles this can
improve the involvement of all students in the discussion (Hmelo-Silver, 2004).
Another question that needs further study is how effective PBL will be with unmotivated
students. PBL has shown to be effective in medical schools with highly motivated students. Can
we expect all high school students to engage in self-directed learning in which they reflect on their
own progress and identify topics that need further investigation? It is highly unlikely that all
students will succeed in an open-ended PBL unit without some definite form of guidance from the
14

instructor. Many high school students need constant reminders of what they are supposed to be
doing and often need help in determining how to do assignments. Open-ended PBL in which
students are expected to determine what is it they need to learn to solve a complex problem will
likely result in confusion and off-task behaviors for many students.
In PBL students are supposed to engage primarily in self-directed learning in which they
identify the problem and what needs to be addressed, and they investigate the answers themselves
with little instruction from the teacher. Hmelo-Silver noted in her study that students in the PBL
class had some misunderstandings at the end of the unit. Hemlo-Silver also commented that there
may be a need for some direct instruction when students come to a point that they need to know
some content (Hmelo-Silver, 2004). Hmelo-Silver states “For students who are poor self-regulated
learners, PBL is likely to pose difficulties without appropriate scaffolding for students trying to
develop self-directed learning skills….It is not at all certain how to structure PBL for less mature
learners” (Hmelo-Silver, 2004). It may prove difficult to provide the right type of scaffolding to
make PBL successful in a traditional high school classroom. In the study reported here a lot of
scaffolding was provided by pulling the class back for discussions and clear directions.
Currently, students are required to take three years of science in Michigan to earn their high
school diploma. Those three years must include biology, chemistry and physics or physical science.
Teachers of these required courses are responsible for covering state mandated content and
preparing students for high stakes standardized tests. If PBL was used as the major method of
teaching in a high school science classroom it would be very difficult to cover all the benchmarks in
the time allotted and ensure that all students are learning the required content. There are many
topics in chemistry for which high school sophomores have no prior knowledge, which makes it
15
difficult for them to be able to generate the questions or “learning issues” they need to investigate in
an open ended, self directed learning environment. Student-driven, open-ended PBL may lend itself
more to lower grades or elective high school courses that have fewer required standards to cover,
thereby allowing students the freedom to research what they like. Elective courses have more
choice in what to teach as they may not have a state mandated curriculum. Courses such as
environmental science may have more topics that center around real world problems that need to be
solved still such as pollution and sustainability. These topics easily lend themselves to the PBL
style of learning. The topics in biology and chemistry don’t always clearly relate to everyday life in
an obvious concrete way that students will recognize. This makes it more difficult for teachers to
design open ended PBL for more abstract concepts involving the unseen nanoscale world such as
atomic bonding, intermolecular forces, or protein synthesis.
Many chemistry labs can not easily be conducted as open-ended inquiry labs as students
must be taught procedures for new lab techniques such as titrations. Open-ended inquiry and PBL
will not be able to fully replace traditional instruction, which also has an important place in a
classroom. However, inquiry and PBL can be used to supplement the curriculum after students
have been taught the procedures for labs. In PBL, students must be given enough information in
the problem for them to generate many questions they need to investigate.
Also, PBL takes more time than direct teaching. “The major challenge for the teacher was
finding time in a content-bound curriculum to implement a student-centered approach. For all its
acknowledged benefits, PBL is necessarily “messy” and more time-consuming than the lecture and
note-taking method” (Goodnough and Cashion, 2003). Yet another issue is that not all content that
needs to be covered lends itself easily to a “real-world problem” in which students can be given free
16

rein to investigate and learn everything they need to know about the content by doing so. High
school students will surely need more scaffolding and guidance than medical students to keep them
on the right track.
Solutions
One solution to some of the issues with PBL is to make the PBL more teacher-directed in
which there is less self-directed learning and the teacher provides some direct instruction as needed
during the problem solving process. Self directed learning is a feature unique to PBL. “In PBL,
students become responsible for their own learning, which necessitates reflective, critical thinking
about what is being learned” (Hmelo-Silver, 2004). A challenge of PBL is the focus on self-
directed learning and the responsibility of learning being put on the learner. Can we expect most
general education students to really reflect on and monitor their own learning and understanding?
This is a barrier to implementing PBL in secondary schools according to the model used primarily
in medical schools.
The PBL unit reported here was more teacher-directed to ensure that students would learn
the desired content in the short amount of time allotted. Students were guided through the PBL
process and provided with the river data needed to analyze multiple potential causes of the fish kill.
Some laboratory procedures were provided for labs that required instructions. Short lecture and
note-taking periods, practice worksheets, and guided inquiry labs were also be used in order to
cover all the required content. The hypothesis of this study was that by incorporating problem-
based learning and inquiry labs there would be an increase in students’ academic performance on
17

the post-test when compared to the pre-test.
Class Description and Demographics
This study was conducted at Mattawan High School with a sophomore chemistry class.
Mattawan is located west of Kalamazoo, Michigan and is a rural community. The high school
currently consists of 1,145 students. Mattawan Consolidated Schools is a school of choice and has
some students attend from surrounding districts. The high school’s student body is composed of
about 94% White, 3% Hispanic, 0.7% American Indian or Alaska Native, 1.5% Asian, and 2%
Black or African American. The drop-out rate in 2010 was 2% with 98% of students staying
enrolled at Mattawan or an alternate school until graduation. Approximately 20% of Mattawan
High School students are on free and reduced lunch. At the 2011 graduation, 88% of seniors
indicated they were going to attend a 2 or 4 year college.
The chemistry class was introductory level and was required for graduation, so all students
must take the course whether or not they are interested in the sciences. Some students in the study
are at academic risk or have IEP or 504 plans. There was also an honors chemistry class offered for
sophomores to take if they did well in biology. Students that scored an A in biology were placed in
honors chemistry and students that scored a B or lower in biology took the introductory chemistry
class. It should be noted that the students participating in this study were representatives from the
portion of the sophomore class that scored a B or less in biology as a freshman. This class was
chosen for research as it required improvement in the curriculum and instruction. Four chemistry
classes participated in this study. There were a total of 108 students in these four classes, and 88
consented to participate in the study.
18

The acid-base unit was chosen for research for a few reasons. Previously this unit was split
into two parts, one of which was taught in first semester and the second part was not taught until
several months later in second semester. The large time gap between these units made it difficult
for students to remember what they had learned the previous semester. Time was lost by re-
teaching what was learned in the first semester so that students could begin the rest of the acid-base
unit. The PBL unit developed for this thesis combined these previously separated parts of the acid
base unit and was taught towards the end of the first semester. The topics taught prior to this unit
were solubility, polarity and intermolecular forces. The topics following this unit include periodic
trends and electron configuration.
The acid base unit was also chosen because it needed to be made more relevant to students’
lives. Labs were developed that linked back to the original problem (acid rain that caused a fish
kill). Students investigated the effects of acid rain throughout the unit and also learned how to
titrate in the context of a real-world problem. All of the activities in the unit linked into acid rain
and it’s effects on the environment. The unit flowed smoothly as each activity was an extension of
the original problem to further investigate acid rain in the environment.
Summary of Science Concepts
In the acid base unit students were expected to learn about acid rain formation and it’s
effects on the environment. Students also learned about the pH scale, pH calculations, molarity,
neutralization reactions and dissociation reactions. Acid rain is defined as rain with a pH less than
5.6, as rain is naturally acidic. Acid rain forms when sulfur oxides from factories and nitrous oxides
from car exhaust combine with water to form sulfuric and nitric acids. Strong acids can exist in
19

acid rain without burning people because they are very dilute. Acid rain can negatively impact the
environment by killing fish eggs, harming plants and eroding limestone and metal statues and
monuments. Factories have tried to reduce sulfur oxide emissions by using low sulfur coal and
scrubbers to remove the sulfur oxides from smoke leaving the factory. Little has been done to
reduce nitrous oxide emissions from vehicles. Buffers are substances that resist a change in pH.
Limestone in lake beds acts as a natural buffer that neutralizes incoming acid from acid rain.
Bronsted-Lowry acids have a pH less than 7 and bases have a pH greater than 7. In this
definition acids give off hydronium ions in water. Bases give off hydroxide ions when dissociating.
When acids and bases are combined in a neutralization reaction they form a salt and water. For
example, hydrochloric acid and sodium hydroxide react to form water and sodium chloride, or table
salt.
The concentration of strong acids and bases is measured in molarity or moles of substance
dissolved in a certain volume. When trying to determine the unknown concentration of an acid or
base, one can perform a titration. In a titration, the concentration of either the acid or base must be
known. Then one adds the standard concentration of base to the unknown acid until the endpoint of
the titration is reached. At the endpoint, all of the acid has been neutralized by the base, the pH is
neutral and salt and water are formed. The concentration of the unknown can be determined using
the equation: M1V1 = M2V2. The pH of a solution is equal to the negative logarithm of the
hydrogen ion concentration. The hydrogen ion concentration is calculated by taking ten to the
negative pH. The pH added to the pOH is equal to 14. The hydrogen ion concentration times the
hydroxide ion concentration is equal to 1 x 10-14.
20

Concentration varies depending on amount of solute dissolved. A strong acid or base is one
that dissociates fully into ions whereas a weak acid or base partially dissociates into ions and
partially remains as the original acid or base. A strong concentrated solution would be the most
dangerous while the weak dilute solution is the least dangerous. Acid rain would be an example of
a strong dilute solution as it contains strong acids such as sulfuric and nitric acid, however, it is very
dilute and therefore not harmful to humans.
21

Implementation
General Implementation
The acid base unit was implemented over three weeks in the Fall of 2011 right before
holiday break. Each class period lasted 60 minutes. At the beginning of the unit students
completed the pre-assessment which consisted of 15 multiple choice questions and a page of short
answer questions (Appendix D). This assessment was also used for the post-test that was conducted
at the end of the experiment. The test consisted of questions that had been developed by the
chemistry department at the study school and used in previous years. This test was used by the
other chemistry teachers that taught this class at the study school. The short answer questions were
modified in order to test for the effectiveness of the activities developed for this study. A survey
(Appendix D) was also completed at the end of the unit to gather student opinions of the activities
and effectiveness of the unit.
The new technique incorporated in this unit was problem based learning. This unit was
designed around the problem of a fish kill. The problem was introduced at the beginning of the unit
and then students got into groups to brainstorm potential causes of the fish kill and what they
wanted to test the water for. Students tested the water for various ions and then brainstormed what
else to test the water. For brainstorming, students used their own prior knowledge and also
information they learned while reading “The Fox River Fish Kill” article earlier in the year
(Appendix C). In groups, students were provided with data to analyze (Appendix A) and then come
to a conclusion about what killed the fish based on the data. After students determined the cause of
the fish kill to be acid rain, they read about acid rain in the textbook and investigated what causes
acid rain through a mini-lab (Appendix A) simulating the formation of acid rain from smoke mixing
22

with water. Students were given additional questions to investigate through the microtitration lab
(Appendix A) and the buffer lab (Appendix A) such as: “How concentrated is the acid in acid
rain?”, “What is a buffer?” and “How does acid rain affect the environment?”. Students also
learned about acids and bases through the use of short lectures and they practiced pH and molarity
concentrations through use of worksheets.
Incorporating inquiry into the labs was also a goal of the unit. The buffer lab (Appendix A)
was inquiry based as students were challenged to design their own procedures for the lab. When
modeling acid rain formation with test tubes, students were given instructions for the mini-lab but
were expected to determine what happened in the test tubes without much help from the teacher.
Table 2 shows a timeline for the implementation of the activities and lessons in the unit.
Table 2: Acid Base Unit Outline
Day Activities Sequence Objective
1 month prior to
unit
Ion Testing Lab Test water for presence of various ions.
Day 1 *Acid base pre-assessment*Read about Riverwood fish kill in text*Brainstorm and discuss what to test water for
Set the scene for the fish kill and brainstorm potential causes.
Day 2 *Riverwood Data AnalysisAcid Base pH Notes
Analyze data from the fish kill to determine potential causes.
Day 3 Arrhenius Acids and Bases NotesNaming Acids and Bases
Name and identify Arrhenius acids and bases.
23

Table 2 (cont’d)
Day Activities Sequence Objective
Day 4 Modeling Acid Rain Formation: Inquiry Mini-LabRead text and complete reading guide about what causes acid rain, it’s affects on the environment, and what is being done to prevent acid rain
Explain how acid rain forms, what causes it, and it’s consequences.
Day 5 Bronsted Lowry definition of acids and bases notesBronsted Lowry acid base worksheet
Name and identify Bronsted Lowry acids and bases.
Day 6 Practice writing dissociation equationsMolar Concentration Notes on calculating molarity
Write dissociation equations for acids and bases and calculate molarity.
Day 7 Molarity practice worksheet Practice calculating molarity.
Day 8 Neutralization equation notes and practice Solve problems using the neutralization equation M1V1 = M2V2
Day 9 *Acid rain microtitration lab Determine the concentration of acid in an “acid rain” sample.
Day 10 pH calculations notes and practice worksheetStrong versus weak, concentrated versus dilute notes
Calculate pH when given hydrogen ion concentration. Differentiate between the terms weak, strong, concentrated and dilute in reference to a solution.
Day 11 *Buffer inquiry lab and testing the affects of acid rain
Determine what a buffer is through experimentation.
Day 12 *Demo: Limestone buffer tubeExtra practice for molarity and neutralization
Observe the buffering abilities of limestone and relate to lakes.
Day 13 Study Guide work time Review the acid base unit.
24

Table 2 (cont’d)
Day Activities Sequence Objective
Day 14 Review Day Review by going over the study guide.
Day 15 *Acid Base Post-Assessment *Unit Survey
Assessment of knowledge.
*Denotes an activity that is new to this unit. All laboratory and problem based activities developed for this unit can be found in Appendix A.
Analysis of Activities
Activity #1: Ion testing lab (Appendix A)
This lab ideally would have been implemented at the beginning of this PBL unit. However,
it fit into the earlier unit on ion formation better than the acid base unit, so it was implemented
about a month before the rest of the unit. Students were reminded of the results of this experiment
when doing the Riverwood data analysis. Before implementing the lab, students were given the
fish kill scenario at the start of class and given three minutes to generate ideas about what to test for
if you were the mayor of Riverwood. Students were directed to form small groups and write three
ideas down on a whiteboard. The instructor moved about the room checking in with different
groups to see what they came up with and provided suggestions or hints to groups in need of
direction. Then we had a class discussion of these ideas. After discussing what tests to perform
students did the ion testing lab the next day to determine what ions were in the river water.
Students found that sulfate was in the river water while the water tested negative for iron,
calcium and chlorine. The lab went as expected and most students came to the conclusion that
sulfate was in the river water. A few groups found one of the other ions in the river water instead of
25

sulfate, which could have been due to improper execution of the experiment or cross-contamination
of the water samples. If time had permitted, it would have been nice to allow the students time to
generate questions to research regarding the sulfate in the river such as “Where did the sulfate come
from?” and “Why did the sulfate kill the fish?”. These questions were not addressed or discussed in
any depth until later in the unit when we discussed the Riverwood data.
Activity #2: Read about fish kill in textbook and brainstorm what to test for
The problem of the fish kill was introduced to the students by having them read about the
fish kill on pages 4 and 5 in the textbook “Chemistry in the Community” 5th edition. Then students
were instructed to form groups of 3 or 4 and brainstorm on whiteboards three ideas of what else to
test for besides the four ions we tested for in the water testing lab. We then discussed their ideas as a
class. Some groups came up with good ideas such as testing for pH, and water temperature but
many groups had to be directed to be more specific as they would put down things like “test for
chemicals”. The instructor would then prompted them with “Test for what chemicals?” Many
groups simply did not know much about what to test the water for.
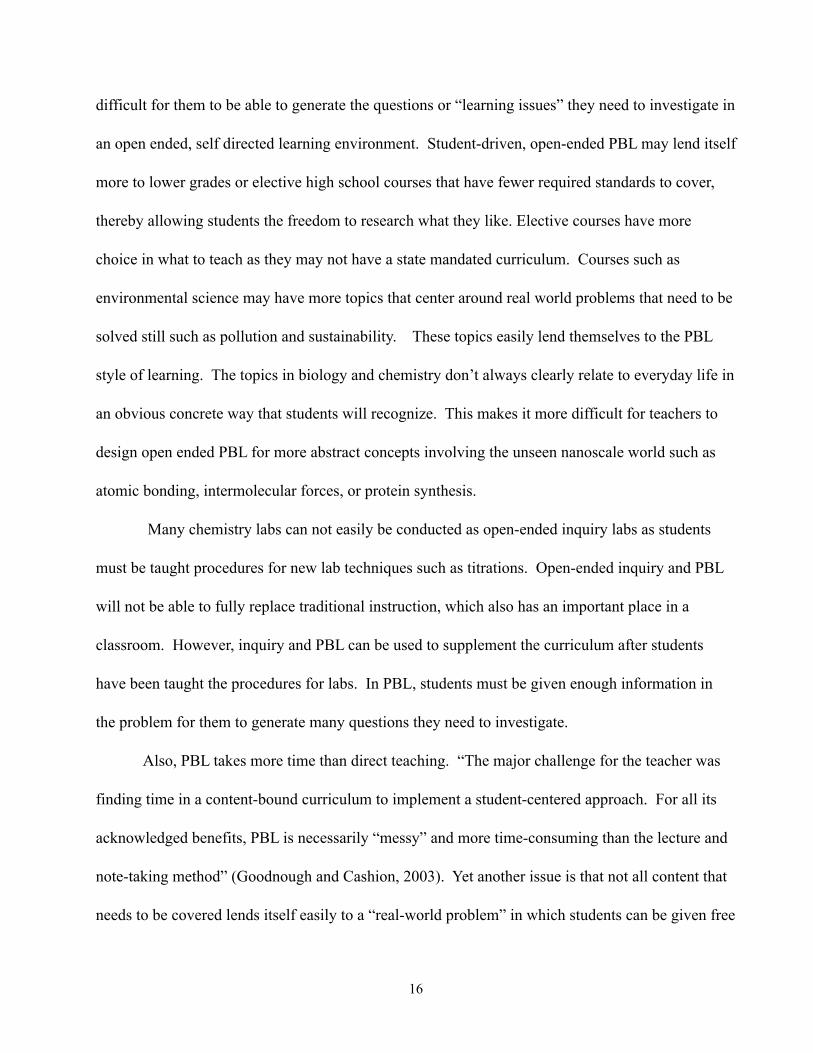
Activity #3: Riverwood data analysis (Appendix A)
Students were given Riverwood data containing values for water temperature, dissolved
oxygen, rainfall, pH and nitrates. Students broke into cooperative learning groups in which each
person chose a water quality variable on which to become an expert. Then the groups jigsawed by
splitting into groups of experts sharing the same variable. Each group of experts investigated their
variable to determine if it could be linked to the fish kill. After being in the expert group, students
26

were instructed to return to their original groups and share what they found and then decide as a
group what killed the fish. Then a whole class discussion took place about each factor and whether
the factor was within acceptable limits for fish. Some students had determined that rainfall was
high and pH was low indicating the rain was acidic. Other students needed more guidance in
linking the factors to one another and determining the cause of the fish kill. Even though some
groups did not independently come to the conclusion that the pH was low due to high rainfall and
acid rain, in the end the class discussion led everyone to that conclusion.
Activity #4: Modeling acid rain formation: inquiry mini-lab (Appendix A)
In this exercise, changes in universal indicator from yellow to red indicated the water turned
acidic when smoke mixed with it. Students answered the following questions after making these
observations:
1. What did the color change indicate? (that the water turned acidic)
2. What does the match simulate in the real world? (smoke from factories and cars)
3. How does acid rain form? (sulfur oxides, nitric oxides and carbon oxides combine with
water to make acid rain)
These questions were discussed as a class. The students came up with good answers with a little
prompting. Some weren’t sure what the smoke was supposed to simulate in the real world so the
instructor asked them what some sources of smoke were. Several students volunteered answers such
as fires, factories, and car exhaust.
27

Activity #5: Acid rain micro-titration (Appendix A)
Students determined the concentration of acid in the rain via micro-titration. Students
titrated “acid rain” water and then used their data to calculate the molarity of acid in the water. The
lab worked well and students were able to easily collect data. The majority of students had to be
told exactly how to set-up the algorithm to solve for the molarity of acid even though they had done
molarity and neutralization practice problems together the day before. Students seem to be very
unfamiliar with setting up equations, entering the data correctly, and then using algebra to solve the
problem. It was surprising how much the students struggled with simple molarity and
neutralization problems even with multiple examples and practice.
Activity # 6: Buffer inquiry lab and the affects on acid rain (Appendix A)
In the buffer inquiry lab, students were challenged to develop their own procedure for
determining what a buffer is. This lab shows how acid rain affects buffered lake water and regular
lake water differently. Students also tested the effect of acid on magnesium ribbon and limestone or
chalk to simulate how acid rain corrodes statues and monuments. This lab is simple enough that
many groups were able determine the procedure on their own. Students had prior knowledge of
acids, bases and indicators from the acid rain micro-titration, which made designing this procedure
easy for them. The lab results were very clear showing that regular water had a much quicker color
change when acid is added while the buffer resisted a pH change. Since this result was so clear, it
was conducive to charging students with determining an appropriate definition for a buffer based on
their observations in lab.
28

Activity #7: Limestone buffer tube demonstration (Appendix A)
The final activity in the unit was a limestone tube demonstration that was executed after
discussing the buffer lab. One question in the buffer lab asked, “If you were a fish living in a region
with a lot of acid rain, would you prefer to live in a limestone or granite bottom lake?” Most
students answered limestone since it would neutralize the acid. This demonstration simulates acid
rain hitting limestone in a lake. A beaker containing 0.1 M HCl and universal indicator was poured
through the limestone tube column several times until there was a noticeable color change. The
acid started out reddish and then ended up green after being run through the column about four
times. The class was asked what the color change indicated and what caused the color change.
They knew from the buffer lab that the hydrochloric acid was neutralized by the calcium carbonate
in the limestone.
Due to time constraints, some of the activities developed for this unit were not used. These
include the following labs that can be found in Appendix B: “The effect of pH on plant
growth” (inquiry-based), “Acid Rain Titration” (full scale), “What does an Antacid do?”, “Antacids
Microtitration”, “Antacids Titration”, and the “Acid-Base Chemistry Review Activities” (inquiry
based). There were also some articles (Appendix C) chosen that related to the unit including: “The
Fox River Fish Kill”, which was used prior to the unit of study, and “Lakes and Streams Take Time
to Recover from Acid Rain”, which was unused.
The “The Fox River Fish Kill” article was included earlier in the year and the students were
told that they would be investigating a fish kill in a later unit. Ideally, this article would be woven
directly into the PBL unit. This article provides students with results of a real experiment. Students
analyzed the data provided in the article to determine the cause of the fish kill. This article has
29

questions at the end of it that require students to comprehend what they read and be able to analyze
the graphs in the article. Reading comprehension and graphical analysis are both skills that are
being focused on by our school for standardized test preparation. In the future it would be
preferable to include the “Lakes and Streams Take Time to Recover from Acid Rain” article in the
acid rain PBL unit as it relates well to the problem of acid rain killing fish that this unit was
centered around.
30

Results/Evaluation
Objective data included scores from a pre-test and post-test (Appendix D) that contained
two parts: a 15 question multiple choice test and a 23 point short answer section. The short answer
test consisted of 9 questions, some with two parts. Questions varied from 2 to 3 points for the
majority of the questions. Partial points were awarded for answers that were not fully correct but
had some correct component. On questions involving mathematical calculations, half a point was
awarded for a correct numerical answer without the correct unit or visa versa. Half of a point was
awarded on dissociation equations if the correct ion was written with the incorrect charge.
Subjective data consisted of a post-unit survey (Appendix D) that students took at the end of the
unit. A paired t-test was used to determine if differences between pre-test and post-test scores were
statistically significant.
Objective Data Analysis: Multiple Choice Pre-Test and Post-Test
Eighty-eight students consented to participate in the study. Students came into this unit as
sophomores who had biology the previous year. Students had very little prior knowledge of acid-
base chemistry except for the small amount of time spent in biology class covering the basic
definition of acids and bases and their location on the pH scale. The biology class does not cover
the concepts that students were tested on in this test, so it was expected that students would know
very little on the pre-test.
The average score (n=88) on the multiple choice section of the pre-test was 34% with a
standard deviation of 20.3. The average on the post-test was 77.7% with a standard deviation of
23.5. The difference between these averages, or the mean difference, was 43.7%. A paired t-test
31

was run on this data giving a p-value of 8.83 E-7. This indicates that the difference in these
averages is statistically significant, suggesting that the unit had an effect on student learning. The
null hypothesis that the lessons in the unit would have no effect on student learning was rejected.
Figure 1: Multiple Choice Test Comparison
For interpretation of the references to color in this and all other figures, the reader is referred to the electronic version of this thesis.
Table 3: Pre-test vs. Post-test Multiple Choice Comparison
Pre-test Post-test
mean percent correct 34% 77.7%
standard deviation 20.3 23.5
n = 88 students participating in the study for all tables and graphs
0102030405060708090
100
1 2 3 4 5 6 7 8 9 10 11 12 13 14 15
Multiple Choice Pre-Test and Post-Test Comparison
Perc
ent C
orre
ct
Question Number
Pre-Test Post-Test
32

Selected Item Analysis: Multiple Choice
On the multiple choice pre-test, the average score was less than 50% on all questions except
for questions 1 and 3 (Figure 1). Question 1 asked what the pH of a solution would be if it
contained a hydrogen ion concentration of 1.0 x 10⁻⁸ M. Had this been a short answer question the
pre-test score would probably have been much lower, but on the multiple choice students had four
choices: 4, 8, 6 or 7. Based on the question containing the 8 as a superscript, most students
correctly guessed the answer to be 8. Students probably guessed and did not actually know the
answer to this question, as they indicated when taking the pre-test that they had no idea about any
of the questions with the exception the last few on acid rain. In the future, to avoid guessing the
correct answer, this question could be a short answer question rather than multiple choice. The
short answer question could ask for the concentration of hydrogen ion when given the pH of 8.
Question 3 had a pre-test average of 64% correct and a post-test average of 95%, which was
the highest score on the post-test for any of the questions. The question asked “Why are lakes with
limestone beds less affected by acid rain than lakes with granite beds?” The correct answer is that
limestone acts as a buffer that neutralizes the acid. Compared to the other questions, this question
did not require any mathematical equations or knowledge of dissociation equations. Students seem
to do better on more conceptual questions in this unit and struggle with the calculations and writing
ions correctly in dissociation equations.
The rest of the pre-test multiple choice questions had averages much lower than questions 1
and 3 with a range of 4% to 44%. Question 5 was the lowest on the pre-test with an average of 4%
of the students answering correctly. On the post-test students scored an average of 83% on this
same question. Question 5 asked “If the hydroxide ion concentration of a solution is 1 x 10⁻³ what
33

is the pH of the solution?” The correct answer is 11 as the hydrogen ion concentration would be 1 x
10-11. It was interesting to note that this was very similar to question 1, in which students scored
79% correct on the pre-test. The only difference between questions 1 and 5 was that question 5
gave the hydroxide ion concentration rather than the hydrogen ion concentration. This clearly
indicates that during the pre-test students did not know they needed to change from hydroxide ion
concentration into hydrogen ion concentration to find pH, nor did they know how. On the post-test,
the majority of students did know how to do this. This question will not be changed in the future as
it was beneficial in showing what students understood prior to and after the unit.
The next lowest average score on the pre-test multiple choice was question 7, which asked
“If the pH of the solution is 11, what is the pOH of the solution?” The average on the pre-test for
this question was 12% and on the post-test it went up to 85%. This further indicates that students
did not know how to do pH calculations prior to this unit, but most did learn how to do them during
the unit.
Question 6 had a pre-test average score of 17% answering correctly and a post-test average
of 89%. The question asked “Which of the following are acidic: egg white - pH 7.5, blood - pH 7.4,
ammonia - pH 11, or milk - pH 6.7.” This result indicates that prior to the unit students did not
understand that acids have a pH less than 7, but 89% of the students knew this after the unit.
Question 8 had a pre-test average score of 20% and a post-test average of 62%. The
question asked students to identify the picture that depicted a strong, dilute solution. It is clear that
students did not know this concept prior to the unit and this is a weakness of the unit. It is not
surprising that the post-test score was low for this concept as students struggled to differentiate
between the terms weak, strong, concentrated and dilute during the unit.
34

The average percent gain from the pre-test to the post-test on the multiple choice section
was 43%. Questions 2, 4, 9 and 10 had pre-test scores ranging from 35% to 45% and post-test
scores ranging from 78% to 95%. These four questions had gains ranging from 38% to 57%. These
questions were conceptual questions that did not require any calculations. The scores and percent
gain on questions 11 through 15 were lower than the scores on questions 2, 4, 9 and 10. Questions
11 through 15 had pre-test scores ranging from 24% to 37% and post-test scores ranging from 50%
to 72%. The gains on these questions ranged from 13% to 43%. Questions 11 through 15 did
involve calculations and asked about weak and strong acids. These are both areas that students
struggled with and are areas for improvement in the future.
Objective Data Analysis: Short Answer Pre-Test and Post-Test
The average score (n=88) on the short answer section of the pre-test was 5.8% with a
standard deviation of 13.5. The average on the post-test was 68.4% with a standard deviation of
19.3. The mean difference was 62.6%. A paired t-test was run on this data giving a p-value of 8.43
E-16. This indicates that the difference in these averages is statistically significant, suggesting that
the unit had an effect on student learning. The null hypothesis that the lessons in the unit would
have no effect on student learning was rejected.
35

Figure 2: Short Answer Test Comparison
Table 4: Pre-test vs. Post-test Short Answer Comparison
Pre-test Post-test
mean percent correct 5.8% 68.4%
standard deviation 13.5 19.3
Selected Item Analysis: Short Answer
The short answer section of the test included nine questions, each question ranging from one
to three possible points. The short answer rubric (Appendix D) shows the point numbers that
correspond to each question as well as what each point was awarded for. Half of a point was
0102030405060708090
100
1 2 3 4 5 6 7 8 9 10 11 12 13 14 15 16 17 18 19 20 21 22 23
Short Answer Pre-Test and Post-Test Comparison
Perc
ent C
orre
ct
Point Number
Pre-Test Post-Test
36

awarded for answers that provided half of the answer, such as writing OH without the negative
charge for the hydroxide ion. The short answer questions included writing neutralization reactions
and dissociation equations, calculating molarity, identifying acids and bases, and the environmental
effects of acid rain. Students were instructed to try their best on the short answer pre-test, however
to their lack of prior knowledge very few even wrote answers for the majority of the questions on
the pre-test. Figure 2 shows no bars for the pre-test scores on many questions, indicating the
average score of 0% on these questions. Some students put down guesses on these questions, but
no one was awarded any points for point 1 through 9, 11, 12, 14, 15, 18 and 19.
There were a few questions at the end of the test, point numbers 21 through 23, that the
students had a little prior knowledge on and therefore were able to put down an answer on the pre-
test. These questions asked about the effects of acid rain on the environment. These points
correspond to questions 8 and 9 on the short answer test. Question 8 asked students to explain at
least two ways that acid rain affects the environment. This was a two point question, one point for
each way that acid rain affects the environment. Many students earned credit for responding that
acid rain can harm plants and animals. On the pre-test 51.1% of students got at least 1 point (point
21 on the figure), and 35.2% of students got a second point (point 22 on the figure). Students
scored well on this question on the post-test with an average of 88.6% on point 21 and 73.9% on
point 22. Question 9 was one point (point 23 on the figure). On the pre-test 31.8% of students got
this point correct. Question 9 asked students to list one specific source that contributes to acid rain.
Accepted answers included factories, car exhaust and air pollution. On the post-test 80.7% of
students got this question correct.
A common mistake on the post-test was that many students did not write charges on the ions
37

for point numbers 2, 3, 14, 15, 18 and 19. Another common mistake was to leave the units off of
the final answer when solving for molarity in question 3 (point number 7) and when solving the
neutralization problem in question 4 (point number 9).
Point numbers 4 and 9 scored the lowest on the post-test with respective averages of 43.2%
and 48.9%. Point number 4 was writing the hydroxide ion with a negative charge as a product of
the dissociation of barium hydroxide. Many students left off the charge and several did not write
down hydroxide, but put down things like water or hydronium instead. Another common mistake
was to write in charges on compounds that have no charge, such as water or potassium bromide.
This weakness is an area that could be improved on in the future when teaching this unit. Perhaps
more practice is needed in writing dissociation equations and determining charges and when to use
them.
Point number 9 was providing the correct answer with units after solving for the molarity of
an acid in a neutralization problem. As indicated above, many students left off the unit in the final
answer. Also, many students were not able to solve the equation to find the correct molarity. This
could be due to a lack of algebra problem solving skills. Many students needed to be taught how to
solve for the unknown molarity after plugging the information into the problem.
Students also struggled with determining how to correctly set up the equation to solve a
neutralization problem. Setting up the neutralization equation properly corresponds to point number
8, which only 56.8% of the class could do correctly. This indicates that another weakness of the
unit was getting students to set up and solve neutralization equations. This was a more difficult
concept for students, as math is not a strong point for some of them. In the future, this is an area for
improvement when teaching this unit.
38

Question 5 corresponds to points 10 through 12 and students scored very high on these post
instruction. Point number 10 had an average of 90.9%, which is the highest scored of all the points.
Point 10 was correctly writing down KOH + HBr as the reactants for the neutralization reaction. It
is not surprising students scored high on this as KOH and HBr were written in the question. On
average, 85.2% of students correctly wrote H2O as a product and 85.2% correctly wrote KBr as a
product.
Analysis of Labs and Activities
The average score for all four classes on acid rain micro-titration lab (Appendix A) was 7.5
out of 10 points possible or 75%. The average score for all four classes on the buffer inquiry
(Appendix A) lab was 8.37 out of 12 points possible or 69.8%. The students scored somewhat
lower on the buffer inquiry lab. This can be attributed to the lack of detail in the students’ lab
procedures and observations. The lack of detail often led to an incomplete definition of a buffer.
40% of students incorrectly answered that a buffer never changes pH, while 45% correctly stated
that a buffer resists change in pH or stated that it is a neutralizer. 15% of the students provided
other answers that didn’t fall into the previous two categories. Also, 58% of the students failed to
provide evidence to support their definition of a buffer, while 42% did provide accurate evidence to
support their definition. Students had to analyze their observations to determine what a buffer was.
These results show evidence of some metacognitive thought associated with inquiry and PBL, but
also show that many students fell short of fully analyzing the data to come to a conclusion
supported by evidence gathered in the lab.
39

In the buffer inquiry lab, a common mistake made when students wrote their procedure was
to leave out specifics on how much of each solution to add. Also, some students said to add
indicator after adding acid and base, and did not fully understand that they needed to see how
quickly the solutions changed color, which could not be accomplished without adding the indicator
prior to adding acid or base to the water.
One buffer inquiry lab question was: “How does buffered lake differ from regular lake water
when acid rain is added? What is a buffer?” Most groups didn’t determine what a buffer is without
some guiding questions. The facilitator went around to each group and asked “What is a buffer?” If
they didn’t have any ideas the facilitator would follow up with “What color was the buffer solution
originally? Did that color change? (no) So what is a buffer then? If they were still confused the
facilitator asked, “If the color didn’t change, what does that tell us about the pH? Did it
change?” (no). Many groups answered that a buffer is something that neutralizes pH, since the pH
remained neutral. This is a tricky concept since the buffer does neutralize incoming acid or base,
but the solution does not end up with a neutral pH. It was difficult for some students to differentiate
between a buffer’s ability to neutralize and the fact that the pH did not have to be 7 for a solution to
be a buffer.
The instructor had to inform the groups that the buffer just happened to have a neutral pH,
but other buffers have various pHs. The instructor asked several groups what would happen to the
pH of the buffer if it was a pH 4 buffer? Some knew that it wouldn’t change and some had to be
informed of that. This concept was reviewed the next day while discussing the lab. Next time
instead of having to tell them this, students can experiment with a pH 4 buffer to determine what a
buffer really is. A few students said that a buffer is a base since it neutralized acid. The instructor
40

followed up with “What was the original pH of our buffer?” Since it was a neutral buffer they
realized that a buffer is not a base.
A question on the acid rain micro-titration lab asked why humans aren’t harmed by acid rain
since it contains strong acids such as sulfuric acid. Some students remembered that the instructor
had told them that acid rain is too dilute to harm humans, while many responded that acid rain isn’t
harmful because the rain water neutralizes the acid. Other students said acid rain doesn’t contain
strong acids, even though the question states that it does. These students were confusing dilute
solutions with weak solutions. This misconception was addressed when the lab was discussed in
class the next day. The class had not yet learned the difference between “strong and concentrated”,
and “weak and dilute”, so it is not surprising that some students got this wrong.
Another question on the micro-titration lab asked why it was important to stop adding
NaOH when the solution turns pink. Many got the answer correct by saying it would overshoot the
endpoint and make the solution basic, while some said the solution would become over-saturated.
These students were confusing this question with the previous unit on solubility.
Subjective Data Analysis: Post-unit Survey
The survey (Appendix D) was administered at the end of the unit following the post-test.
Students were asked to tell which labs and activities they found the most and least interesting,
mentally engaging and from which they learned the most or least. These results are shown in Table
5 and Figures 3, 4 and 5. It should be noted that not all students responded with one answer for
every question. Some students wrote which activity they liked the most but not which they found
the least helpful in some categories, while some other students wrote down two labs as most or least
41

engaging instead of one. Also, some students commented that they didn’t remember some of the
activities and therefore couldn’t give a real opinion of the activities. This could slightly skew the
results.
Table 5: Activity Number Key (for all three figures below)
Activity Number
Activity Name
1 Ion Water Testing Lab
2 Brainstorming on whiteboards what to test water for
3 Riverwood Data Analysis
4 Modeling Acid Rain in test tubes
5 Acid Rain Microtitration
6 Buffer Inquiry Lab
7 Buffer Limestone Tube Demo
42

Figure 3: Survey Analysis: Activities Ranked by Students as Most or Least Interesting
Figure 3 shows that most students found the Modeling Acid Rain and Buffer Inquiry Labs to
be the most interesting. Very little attention was given to the Acid Rain Microtitration lab with no
students responding it was the most interesting and two students saying it was the least interesting.
The Riverwood Data Analysis had the highest number of students scoring it as least interesting,
with the Buffer Inquiry Lab following close behind.
0
5
10
15
20
25
30
1 2 3 4 5 6 7
Most or Least Interesting ActivityN
umbe
r of S
tude
nts
Activity Number
most least
43

Figure 4: Survey Analysis: Activities Ranked by Students as Learning Most or Least From
Figure 4 shows the majority of students finding the Buffer Inquiry lab to have been the
activity from which they learned the most. The other activities do not stand out from one another,
with a handful of students grading each activity as most or least learning from that activity. The
Buffer Limestone Tube Demo was the second highest scoring for most learning.
0
4
8
12
16
20
1 2 3 4 5 6 7
Most or Least Learning By ActivityN
umbe
r of S
tude
nts
Activity Number
most least
44

Figure 5: Survey Analysis: Activities Ranked by Students as Most or Least Mentally Engaging
Figure 5 shows the majority of students ranking the Buffer Inquiry Lab as the most mentally
engaging activity in the unit. The other activities do not stand out as they each have a handful of
students responding that they were most or least mentally engaging. Overall, the Buffer Inquiry
Lab scored highest in two of the three categories for being most mentally engaging and the lab that
students learned the most from. The Buffer Inquiry Lab scored second to highest for being the most
interesting. It is apparent that students like the Buffer Inquiry Lab the best.
When asked about the inquiry-based buffer lab in which they had to design their own
experiment some students responded favorably while at the same time others disliked it and felt it
was confusing. One student commented that inquiry “helps with problem solving, which can be a
great challenge.” While another student stated that inquiry “was very hard, we didn’t know where to
start or how to do things so we got a bad grade on that lab.” One student commented “I did not like
0
5
10
15
20
25
30
1 2 3 4 5 6 7
Most or Least Mentally Engaging Activity
Num
ber o
f Stu
dent
s
Activity Number
most least
45

it (designing their own experiment) but it did give me some benefits because I learned skills on how
to problem solve.” Another student commented “It made me think a lot, and made me try
something new. I liked it, it had a lot of thinking moments.” It is interesting to see the contrasting
viewpoints of students depending on their learning styles and preferences for types of activities.
Many students commented negatively about inquiry being difficult and confusing, while many
students liked the challenge to have to really think about what they were doing rather than
following a step-by-step procedure that was given to them.
One student preferred the buffer inquiry in terms of being interesting, mentally engaging
and learning the most from it. He/she commented on the survey that “The most interesting was the
buffer inquiry lab because we, as the students, got to experiment without step by step
procedures….we had to learn from our own mistakes when doing the lab.” When asked how they
felt about designing their own experiment in the buffer lab this same student replied “I love the idea
personally. As a student I was able to think on my own about what should be done. The benefit is
you learn from mistakes made when doing the lab, the only challenge is putting what you did in
words.”
When asked about the problem-based learning approach to this unit one student replied that
they liked the problem based learning approach since it related to solving a real-world problem.
Another student commented “I liked that everything went back to acid rain to give you an idea of
how serious it can really be.” Some students commented that the problem of the fish kill was too
long and drawn out. One student commented “I didn’t like that everything was about the fish kill
and acid rain because it became boring quickly.” Having a shorter PBL on the fish kill may have
kept students more interested and made it more clear how labs were connected back to the fish kill.
46

When asked about what they liked or disliked about the unit in general, many students
commented that they didn’t like “molarity” because it was hard for them and they didn’t really
understand it. One student said “I didn’t like how brief the study of molarity equations was, I was
completely unprepared for that section.” Another commented that “Molarity was kind of frustrating,
but I learned to do it.” Molarity and neutralization equations are more challenging than much of the
other content because they involve setting up and solving algebraic equations, with which many of
the students struggled. In the future more practice worksheets could improve the students’
understanding and ability to solve these problems.
47

Conclusion and Discussion
General Discussion
The null hypothesis that the unit incorporating problem based learning would not have an
effect on student learning was not supported. Statistical analysis of data from the pre-test and post-
test showed that the difference between the test averages was statistically significant for both parts
of the test (multiple choice and short answer). The p-values comparing test averages for both the
multiple choice and short answer were close to zero. This indicates that the acid-base unit had a
positive impact on student learning.
Although the test scores increased, indicating that the PBL unit was effective, it was difficult
to directly measure whether PBL had an impact on the student’s ability to think critically, solve
problems, and be self-directed learners. It is very difficult to measure these kinds of skills. To
measure metacognitive skills the results, in the form of student written responses, of the buffer
inquiry lab were analyzed. There was some evidence of problem solving and critical thinking in the
answers students provided in this lab. As discussed in the results, 45% of the students showed the
ability to conclude what a buffer is based on their observations and 42% supported this conclusion
with data based evidence.
Another method used to determine the students’ problem solving abilities was through the
short answer questions to the unit test in which students needed to solve for molarity or pH of a
solution. However, this is a different type of problem solving than is sought for in PBL. PBL aims
for students to be able to solve larger scale complex problems, which is not the type of questions
that were asked on the short answer portion of this assessment. As Savery (2006) states, part of the
issue with determining the effectiveness of PBL is finding an appropriate way to assess the skills
48

developed using this learning method. As Walker et al. (2009) point out, an appropriate assessment
to measure the effectiveness of PBL may be to use application rather than content questions. This
allows for the measurement of the goals of PBL, which are not content specific. Rather, the goals of
PBL, as reported by Walker et al. (2009) are: “1) structuring knowledge of all types in a way that
supports problem solving, 2) a reasoning process for
problem solving, 3) self-directed learning skills, and 4) increased motivation”.
To assess whether the goals of PBL have been met, a better assessment may include a more
complex problem that would require students to piece together information. Students would work
on one complex problem that would require them to generate their own questions, investigate those
questions, and analyze their results. A potential problem that could be used is providing students
with water quality data such as pH, temperature, dissolved oxygen and nitrate levels and having
them determine if the water quality is acceptable for the town or if something needs to be done
about it. Students would be challenged to identify what, if any, variables are not within acceptable
limits and discuss potential impacts on the ecosystem and town members. This would require
students to use their prior knowledge from the acid-base and water quality units to investigate and
discuss their findings. Students could then present their findings and make suggestions as to what
needs to be done.
Students would need to record the questions they developed, the research collected and the
conclusions drawn based on their research. The assessment would be based on the quality of this
recorded work. This could be considered a test or a final project to demonstrate their problem
solving abilities. This could potentially even be done in groups. Having students report their
questions, research and conclusions would allow the teacher to track the students’ progress through
49

the problem solving process. This would mirror what is done in the real science industry in
research and development. This would also allow the teacher to determine if students are actually
reflecting on what they have found so far and determining on their own where they need to go next.
Thirty-three students commented (see results for sample comments) on the survey that they
liked the problem based learning approach to the unit since it related to a real-world issue. Student
interest and motivation tend to increase when lessons can be made relevant by relating to real-world
issues. Hands-on activities and labs also increase student engagement and motivation. Having labs
and data to analyze to come to your own conclusion is often more intellectually engaging than
sitting and listening to a lecture.
Discussion of Labs and Activities
The labs and activities in this unit were successful and the instructor plans to use them
again. Part of the problem-based learning approach was for students to form small groups to
brainstorm ideas about what could kill the fish and what to test the water for. Twenty-two students
commented that they didn’t learn much from brainstorming in groups because they often did not
stay on task but used the time to socialize instead. This is a difficulty with many groups and only
one teacher to monitor which groups are actually talking about the prescribed activities. This
brainstorming activity was not successful, as many groups put down very vague answers and some
groups were off task and used the time to socialize rather than really think about the question. One
issue was the students’ lack of prior knowledge about what to test the water for. Perhaps providing
students more time and computers to research what types of water tests are available and what
factors affect fish would enhance this activity.
50

Preferably, the original brainstorming around the problem would have been more student
driven and given students more time to research the original questions. In the future case study
handouts could be used to give more information about the problem to set the scene and give
students ideas about what they could investigate. This information could be written in a case study
style, which has more structure, and would give students leads for generating questions and
investigations. Providing students with case study handouts would take the weight off the teacher
to continually provide the links between activities, and place the responsibility on the students to
generate the questions.
The Riverwood data analysis went well. Although some groups struggled in piecing
together the data, as a class there was a productive discussion that led to the conclusion that acid
rain lowered the pH and heavy rainfall had washed fertilizers into the river causing a spike in
nitrates and sulfates. In the future it would be preferable for the students to generate questions that
still need answering to fully understand the problem of the fish kill. Desired questions include
“What is an acid? What causes acid rain and how does it form?” One difficulty experienced when
implementing this PBL is the challenge of getting students to ask good questions, and ask questions
that relate to state standards. Teachers are required to cover specific content, but in a PBL format
are supposed to have the students determine the questions to direct the learning process. Student
generated questions rarely aligned with state standards. This is where the class discussion comes
into play. Students can generate questions on their own or in groups and then as a class we can
share the questions and decide which to investigate further. This would be one way to ensure that
students are spending time investigating things they actually need to learn. Another question
generation strategy could be to have students work in groups and each student write their own
51

question. Then they share their questions within the group and choose the best question to share
with the rest of the class. They also explain why that question was chosen.
It is difficult to believe that students will end up learning the state content standards if given
the freedom to decide what to investigate. Maybe if there is a project unrelated to state standards,
then students can be given the flexibility to research what they please, but in an introductory
chemistry course required for graduation there is little time for total freedom and exploration due to
the number of requirements to be taught. The state standards are currently changing and the new
common core standards are said to contain fewer standards and require more inquiry and literacy to
be taught in the classroom. If this is true, then PBL will be a great fit for the future chemistry
classroom. Currently, it appears there isn’t time to do many PBL’s that are true open-ended inquiry
without major intervention and direct instruction from the teacher. One alternative to this open-
ended inquiry is to provide students with the questions to be investigated such as in a case study.
This will get students started investigating something related to the content they need to learn.
Modeling acid rain in test tubes tied in well when introducing the concept of acid rain.
Students had not yet been told how acid rain forms, and they were to determine for themselves what
the color change in the test tube indicated and what caused that color change. Students answered
some questions after the activity and then gathered as a class to interpret the results. With some
guiding questions from the instructor, the students were able to determine that the water turned
acidic when it mixed with the smoke. The students also seemed to enjoy this activity as it was
hands-on and allowed them to experience acid rain formation first hand.
The acid rain microtitration also worked well, however many students did not fully
understand titrations. Many students struggled with the math when using the neutralization
52

equation, and had to be told which equation to use and what data to place where in the equation.
Even after being told where to place the data, many students did not know how to properly solve
the equation due to a lack of math problem-solving abilities. To improve upon the students’
mathematical abilities in the future more in-class examples and practice problems could be
incorporated prior to running the microtitration lab. This would strengthen the students’
mathematical problem-solving skills prior to asking them to apply that skill to a lab.
The link between the acid rain microtitration lab and the problem of acid rain was not very
clear. The idea was to determine the concentration of acid in the acid rain. One question directly
asked why acid rain isn’t harmful to humans, and many students were able to correctly answer that
it is so dilute that it doesn’t harm you even though it contains strong acids. However, there were
also many students that incorrectly answered this question as well as question 7 on the short
answer post-test about the difference between “weak and strong acids and bases” and “concentrated
and dilute” solutions. To improve on this weakness in the future, students would benefit from more
practice with these concepts. Playing a whiteboard game in which students draw “weak and strong
acids and bases” and “concentrated and dilute” solutions may improve on their understanding of
these concepts. The connection between the microtitration lab and the PBL was weak and an area
that could be improved on in the future. Perhaps more class discussion about the lab and analyzing
the results together would be one way to improve upon this.
Preferably, the original brainstorming around the problem would be more student driven and
would have given students more time to research the original questions. Another improvement
would be to provide time for students to determine what else they need to know about the fish kill.
Students could work in groups to list other factors that could affect the fish and what else they need
53

to investigate. The instructor could guide their discussions as needed and have a whole class
discussion of what else needs to be tested for. This would allow for students to generate the idea to
test for the concentration of acid in the water. This brainstorm session would need to take place
after discussing the terms concentrated and dilute, so that students would have some prior
knowledge with which to determine what to test for.
Another way to ensure that students generate desired questions for investigation would be
to provide them with an informational sheet about the fish kill that they would need to read and then
generate questions from. This information would provide students with leads about what to
investigate by stating that the concentration of acid is a factor in fish health. By providing this
information, students will be more likely to generate the desired question, “How concentrated is the
acid in the water?”. This question would directly tie the microtitration lab to the PBL.
One thing that stood out when analyzing the results of the post-unit student survey was the
number of students who preferred the Buffer Inquiry Lab over the other activities in the unit. This
was surprising as most students usually dislike inquiry-based labs since they are more challenging
and require students to think for themselves to determine the procedure. While some of the students
did feel that the lab was confusing due to the lack of directions, many enjoyed thinking for
themselves. Since the expected procedure to this lab was very simple, it was not very difficult to
determine what to do. The simplicity of the basic procedure was a major reason for the lab’s
success. Had this procedure been more complex, many more students probably would have become
confused and frustrated. One weakness in the Buffer Inquiry Lab was that many students answered
that a buffer must have a neutral pH. To remedy this misunderstanding in the future, the lab could
use buffers with pH’s different than 7.
54

It is important to realize when designing inquiry-based labs that the lab procedure needs to
be something the students can come up with mostly on their own. This allows for the inquiry to fall
into level 2 or 3 from Table 1 in which the data collection methods are open to the student. If the
procedure is too difficult, and is provided by the teacher, the inquiry becomes more constrained and
falls into level 0 or 1, which are verification and structured inquiry, respectively (Blanchard et al,
2010). If the procedure is complex, having done a similar lab before would provide students with
the necessary knowledge to apply their lab skills to a new problem. If a new lab technique is going
to be incorporated into an inquiry lab, it needs to be taught to the students. For example, one can
not expect students to determine the procedure for a titration. Students can not just be tossed into a
chemical lab and told to perform some experiments due to the hazards in a chemical lab. Students
need some guidance and instruction particularly when it comes to safety measures to follow in the
lab. With proper safety guidelines, and a well designed question, inquiry can be a rewarding
experience that gets students to think critically and problem solve.
The buffer limestone tube demo went as expected with the acidic water being neutralized as
it was poured through the limestone chip tube. This demo provided closure to the unit to relate acid
rain’s effects on lakes back to the concept of buffers, which had just been investigated in the buffer
lab. The class discussed what happened to the acidic water as it ran through the buffer tube and
how the limestone was able to neutralize the acid. Many students scored this demo low and
commented that it wasn’t very engaging for them since they already knew what would happen
based on their prior knowledge from the buffer lab. Nonetheless, it was a worthwhile demo that
tied together the affect of acid rain on the environment.
55

Another weakness on the short answer post-test was writing the products of a dissociation or
neutralization reaction and writing ions with the appropriate charge. It was common for students to
write the chemical formula for water or hydronium instead of hydroxide when writing the
dissociation equation for barium hydroxide on question 1 part b of the short answer post-test. A
common mistake on question 5 of the short answer post-test was to write charges on neutral
compounds such as water or potassium bromide. To improve on this in the future more time needs
to be spent reviewing the difference between ions and compounds. Also, reviewing how to
determine if there is a charge on a molecule may improve upon this weakness.
Some limitations in the implementation of the acid base unit were time constraints. This
unit was conducted in the three and a half weeks before the holiday break. There was little spare
time to spend on anything as we had to get through the entire unit before break. Due to time
limitations some of the intended activities were not included. Many of the unused labs would have
been repeat titrations in which students could have been expected to know how to design a titration
after already performing one in lab.
In the future, the problem based learning part of the unit could be shortened and the fish kill
linked back to fewer labs as the students and the instructor felt this was too long and drawn out.
Perhaps splitting the problem into two separate parts, one for determining the cause of the fish kill
and then a separate problem focusing on other effects acid rain has on the environment, might be a
favorable way to improve upon this unit.
56

Implementation Limitations and Potential Solutions
The unit flowed well and links back to acid rain and the original problem of the fish kill.
However, not enough time was given for students to generate the questions themselves and research
the answers. Given the lack of time and amount of content in the unit, student led discussion and
brainstorming sessions had were limited. This led to the unit being more teacher-driven than
intended. Part of this was due to a lack of foresight on what types of information students would
need in order to generate desired questions such as “What causes acid rain?”, “What is an acid?”
and “What is the concentration of acid in the river?”. The problem of the fish kill failed to trigger
these questions and thus the questions were presented by the instructor. The problem of the fish kill
needs to have more information with clues as to what could potentially relate to the fish kill. As
Sockalingam et al. (2011) concluded, problems need to be clear and provide students with clues
about what to research.
Also, the fish kill failed to motivate many of the students. Several students commented in
the survey that the fish kill topic was boring and they weren’t interested in solving the problem.
Some students were interested in the problem, but it would be preferable to have more students
motivated to find the solution. As Sockalingam et al. (2011) stated, the more interested students are
in the problem, the more motivated they will be to work hard on solving the problem. No PBL
problem will interest all students, but the aim of the PBL designer should be to create a problem
that will interest the majority of the students. Not only does the topic of the problem impact student
interest, but also the types of learning activities involved in solving the problem. The hands-on
activities and labs used in this study interested most students and enhanced their motivation.
57

Another aspect of the limitations placed on brainstorming and student led discussions
stemmed from knowing how much we had to cover and not wanting students to diverge too far off
the content they needed to be understanding. The instructor felt the need to provide guidance to the
students in order for them to learn the required content. Had the curriculum been more open-ended
with fewer standards to teach, then students could have been given the freedom to take the problem
wherever they wanted it to go. The method used in this PBL study would fall under Barrow’s
(1986) taxonomy as a “modified case method” as chances were provided for students to engage in
inquiry. However, the inquiry was constrained and cued by the instructor and there was an expected
conclusion to arrive at. To make this study more “problem-based”, according to Barrows, it would
need to provide students with more opportunities to take charge of their own learning and have the
instructor take on the role of the facilitator.
The PBL design appears to enhance student motivation and improve upon critical thinking
skills. However, it was difficult to let students direct the learning process as they may not come up
with the expected questions that address the content that needs to be learned. To make this unit
more “problem based” and less “case based”, some modifications will need to be made. Perhaps
having several smaller PBL projects would allow for students to have freedom in determining what
to research. For example, the first PBL in the unit could be condensed into analyzing the river data
and ion testing lab to determine the cause of the fish kill. Then, the next PBL would focus on a new
case to determine the impact of acid rain on statues and monuments. Chunking the unit into several
smaller PBL’s would make the problems more manageable and allow for more student freedom.
These smaller PBLs need to contain enough information for students to generate further
questions on their own rather than the instructor generating the follow-up questions from each
58

activity. Each PBL could be presented as case study informational sheets that provide students with
a problem and enough relevant background information for them to generate desired questions
from. Each problem could contain more information with key words that would lend to students
asking the desired questions. The problems could also be enhanced by adding pictures, examples,
stories and analogies (Sockalingam et al., 2011).
Case study informational sheets could give students more information about acid rain each
day to prompt quality questions to be generated. These case study sheets could change the topic
from the fish kill to other applications of acid as time goes on to prevent drawing out the fish kill
for too long and losing student interest. This would also increase motivation as there would be a
new topic to investigate. Other topics include the effect of acid rain on plant growth, the effect of
acid rain on statues, the differing affects of acid rain on buffered water versus regular water, and the
use of antacids in neutralizing stomach acids. These topics all relate to labs already developed for
this unit, but the fish kill could be removed from the focus after the first few days of studying acid
rain.
Choosing different problems to investigate rather than trying to link everything in the acid-
base unit back to the fish kill could also improve upon another problem of the unit feeling
disconnected. This disconnection was felt during the unit as time was spent lecturing and teaching
concepts before moving on to the next part of the PBL problem. The water testing lab was run
several weeks before the PBL unit, rather than right at the beginning of it when students had
generated ideas of what to test the water for. It seemed as though acid rain and the fish kill were
brought up repeatedly, rather than being the overarching theme connecting the concepts. Having a
few case study problems to investigate could remedy this problem. Given lack of time, there
59

probably would not be time for more than a few case study problems, so all parts of the unit may
not fall under the umbrella of the fish kill. Although it is nice for all of the concepts in a unit to link
together, it is not always feasible. Also, shorter case studies can still provide students with the
desired problem-solving and critical thinking skills sought for in PBL.
Another option to make the PBL flow better would be to teach the concepts needed to
understand the PBL prior to introducing the problem so that the parts of the unit that directly related
to the PBL could be run back to back. This approach may be preferable as it would also lend itself
better to students proposing the questions to be investigated and then actually performing those
investigations the following day rather than tabling questions for a few days. However, this takes
away from the purpose of even doing PBL in the first place, which is to have students direct their
own learning and determine what content they need to know, and then find answers to these
questions through research and or laboratory investigations.
Goodnough and Cashion (2003) conducted a study of a PBL done in a high school biology
classroom. The PBL in this study was successful in allowing for self-directed learning as students
explored the problem of an unborn baby with cystic fibrosis. Students assumed the role of the
doctor and were told to research cystic fibrosis and provide information and suggestions to the
parents. What makes this PBL more ideal than the fish kill PBL is that it is shorter and more
focused on understanding cystic fibrosis and making recommendation to the parents. Also, the
problem was presented as a letter from the parents to the doctor asking for information on cystic
fibrosis. This practically generates the question for the students, “What is cystic fibrosis? What are
the symptoms?” The instructor also provided students with a chart to fill out. This chart had three
columns to assist students in processing the information provided and generating questions: facts
60

(listing facts given), learning issues (What do we need to know?), and the action plan (How will we
answer our questions?). Providing students with a chart like this at the start of a PBL is an excellent
way to structure the discussion and provide direction to students, particularly if they haven’t done a
PBL yet.
The facilitator’s role in this PBL was limited due to lack of time for students to generate
learning issues and analyze the Riverwood data. In the future students need more time to work
collaboratively on their problem to give them a chance to practice self-directed learning that is so
often lacking in post-secondary education. The skills of self-monitoring, questioning one’s own
understanding, reflecting on what is known and what is left to be discovered, are all important skills
that will serve students well in the future (Goodnough and Cashion, 2003).
Taking on the role of a facilitator requires much practice prior to becoming comfortable in
backing off and asking students enough guiding questions to keep them on track, but not providing
the correct answers. The role of a facilitator is complex and vital in keeping the discussion focused
and making progress. In a study done by Hmelo-Silver and Barrows (2006), strategies used by an
effective facilitator were laid out. These strategies included using open-ended questions to push
students for an explanation, revoicing what students said, asking quiet students to summarize what
is known so far as a way to check for group understanding, assisting in the generation and
evaluation of hypotheses, and monitoring and cleaning up information recorded on the whiteboard
to keep a clear focus and direction of study. These authors state “The facilitator’s questions built on
student thinking and placed responsibility for sense-making on them…”. This self-responsibility is
an invaluable skill that will serve students in all domains of further education.
61

Conclusions
As noted by Hmelo-Silver et al. (2007), “it is still unclear how to balance IL (inquiry
learning) and PBL with direct instructional guidance…..As a field we need to develop deeper and
more detailed understandings of the interrelationships between the various instructional approaches
and their impact on learning outcomes in different contexts”. There exists a fine line on providing
just enough structure that students will be able to generate the desired questions, gather relevant
information and come to some sort of evidence based conclusion. Not enough structure leads to
confusion and disengagement of students. Too much structure removes the opportunity for self-
directed learning in which students develop critical thinking skills.
Where that fine line exists may not be something that can be perfectly defined. Each group
of students presents the instructor with a different set of background knowledge and abilities. It
will be up to the facilitator to determine where that line is by actively evaluating the progress of the
students. This will take skill and experience on the part of the facilitator. This is not to say that
PBL is too labor intensive for high school or that a general format for PBLs can’t be created ahead
of time. It is imperative that the PBL question be well designed to provide enough information for
students to generate questions. However, the facilitator will have to be flexible as each PBL will
likely vary from class to class as each student brings unique experiences into the classroom.
One pitfall of many PBLs is the idea that students have to be “active”. This leads to the
notion that students will be doing some sort of behavioral activity or lab to gather information for
responding to a problem. Mayer (2004) rejects this idea of “behavioral activity” being a necessity
for achieving the critical thinking and problem solving abilities sought after in PBL. Mayer states
“Overall, the constructivist view of learning may be best supported by methods of instruction that
62

involve cognitive activity rather than behavioral activity, instructional guidance rather than pure
discovery, and curricular focus rather than unstructured exploration”. Mayer goes on to state that
being cognitively active does not require one to be behaviorally active. Cognitive activity includes
selecting, organizing and integrating knowledge, which can be accomplished in a number of ways
including reading, writing, and guided instruction. Mayer states that the challenge for educational
research today is to find ways to promote processing and cognitive activity in students rather than
using group discussions and hands-on activities simply for the sake of being behaviorally active.
The fish kill PBL reported here incorporated articles to be read and provided data for being
analyzed. These activities did not engage students behaviorally, but did engage them mentally.
Mayer (2004) makes his case against pure open ended discovery learning stating that too
much freedom may result in students not identifying what it is they need to know. He states “In
many ways, guided discovery appears to offer the best method for promoting constructivist
learning. The challenge of teaching by guided discovery is to know how much and what kind of
guidance to provide and to know how to specify the desired outcome of learning. In some cases,
direct instruction can promote the cognitive processing needed for constructivist learning, but in
others some mixture of guidance and exploration is needed”. Where that line exists between
providing structure via direct instruction and the “discovery learning” that takes place during PBL is
something that needs more research. Also, more research is needed on the finer points of how to
design and implement a successful PBL. There are various methods and question types to be
weighed. There are also considerations for how much structure to provide while still allowing for
inquiry to occur. It will take practice and experience for a facilitator to hone their skills and tweak
63

the PBL to strike a desirable balance that promotes inquiry yet teaches the required standards in the
time allowed.
The fish kill PBL unit, although more teacher-driven and structured than intended, was
successful in keeping students on the right track to learn the prescribed content and determine the
cause of the fish kill. In the future there are many things that could be done to give students more
freedom in the PBL process. Some of these include allotting more time for group discussion to
generate and research questions, providing more case based questions that are focused on for a
shorter time frame, and the facilitator improving their skills. Overall, this PBL unit was effective
and utilized guided inquiry to structure the learning process to ensure students learned not only the
required content but also gained vital learning skills that will serve them well in the future.
64

APPENDICES
65

APPENDIX A
LAB ACTIVITIES
66

Ion Testing Lab
Label your well-platePlace the well-plate on a blank piece of paper and label the columns and rows as follows:column 1: blank row 1: calcium ion testcolumn 2: positive test row 2: iron ion testcolumn 3: tap water row 3: chloride ion testcolumn 4: creek water row 4: sulfate ion testcolumn 5: pond water
Fill the wells with the needed solutions
1. Place 20 drops of distilled water in each of the 4 wells under the “blank” column.2. Place 20 drops of the positive test solution in the wells under the “positive test” column. Note
that each ion has a different positive test solution, so be sure to pick the correct one (example: in
Ca2+row, put the solution that says Ca2+ test solution).3. Place 20 drops of tap water in each of the 4 wells under the “tap water” column.4. Place 20 drops of creek water in each of the 4 wells under the “creek water” column.5. Place 20 drops of pond water in each of the 4 wells under the “pond water” column.
Do the ion tests and record results
Calcium Ion (Ca2+) Test: Ca2+
(aq) + CO32-
(aq) --> CaCO3(s)
1. Add three drops of sodium carbonate (Na2CO3) solution into each of the wells in the Ca2+
row. If Ca2+ ions are present, there should be a change in the appearance of the solution. The positive test solution should change to show what the expected “positive” result it.
2. Record your observations, including the color and if a solid formed.3. Decide whether Ca2+ cations are present and record your results.
**HINT**: Move the well plate off of the paper and put it on the black table to give a black background. This makes it easier to see some of the changes. After recording results, put the well plate back on your labeled white paper.
**NOTE**: If the solution turns PINK, you can record this in your data table as a color change, but this is NOT a positive result for any of the ions being tested for. The appearance of a pink color comes from some residue left on the well plate and not thoroughly cleaned off from previous experiments.
67

**Check**: Your positive test solution for Ca2+ should have changed. If you see no change, call over your teacher. Iron (III) Ion (Fe3+) Test:
Fe3+(aq) + SCN-
(aq) --> (FeSCN)2-(aq)
1. Add three drops of potassium thiocyanate (KSCN) solution into each of the wells in the Fe3+ row. If Fe3+ ions are present, there should be a change in the appearance of the solution. The positive test solution should change to show what the expected “positive” result it.
2. Record your observations, including the color and if a solid formed.3. Decide whether Fe3+ cations are present and record your results.
Chloride Ion (Cl-) Test
Cl-(aq) + Ag+(aq) --> AgCl(s)
1. Add three drops of silver nitrate (AgNO3) solution into each of the wells in the Cl- row. If Cl-
ions are present, there should be a change in the appearance of the solution. The positive test solution should change to show what the expected “positive” result it.
2. Record your observations, including the color and if a solid formed.
3. Decide whether Cl- anions are present and record your results.
Sulfate Ion (SO42-) Test
SO42-
(aq) + Ba2+(aq) --> BaSO4(s)
1. Add three drops of barium chloride (BaCl2) solution into each of the wells in the SO42- row. If
SO42- ions are present, there should be a change in the appearance of the solution. The positive
test solution should change to show what the expected “positive” result it.2. Record your observations, including the color and if a solid formed.3. Decide whether SO4
2- anions are present and record your results.
Clean-Up1. All solutions in the well plate can be put down the drain with water. Wash your well plate with tap water. Replace the cap on the deionized water bottle and then rinse the well-plate with deionized water. Turn it over and let it drip dry on a paper towel.2. Pour your samples of tap, creek, and pond water down the sink.
68

Questions:1. What ions were present in... a. tap water b. Riverwood river water c. pond water2. What do the ions found in the river water indicate? Could any potentially be linked to the fish kill?3. These tests cannot absolutely confirm the absence of an ion. Why?4. How might your observations have changed if you had not cleaned your wells thoroughly after each tests?5. Why was a positive test solution needed?6. Why was a blank used?7. Explain the difference between cations and anions. Give a few examples from this lab for each. Refer to page 39 in the textbook if you forgot the terms cation/anion.
Lab adapted from “Chemistry in the Community” 5th edition textbook by W. H. Freeman and Company Unit 1 Sec B11 on June 29, 2011
69

DATA
Table 6: Calcium Ion (Ca2+) Test:
Solution Observations: Color?Formation of a solid?
Result (Is the ion present?)
Positive Test Solution (Reference)
Blank (Control)
Tap Water
River Water
Pond Water
Table 7: Iron (III) Ion (Fe3+) Test:
Solution Observations: Color?Formation of a solid?
Result (Is the ion present?)
Positive Test Solution (Reference)
Blank (Control)
Tap Water
River Water
Pond Water
70

Table 8: Chloride Ion (Cl-) Test
Solution Observations: Color?Formation of a solid?
Result (Is the ion present?)
Positive Test Solution (Reference)
Blank (Control)
Tap Water
River Water
Pond Water
Table 9: Sulfate Ion (SO42-) Test
Solution Observations: Color?Formation of a solid?
Result (Is the ion present?)
Positive Test Solution (Reference)
Blank (Control)
Tap Water
River Water
Pond Water
71

Teacher Notes for lab set-up:river water = tap water and FeSO4 to test positive for sulfate ion
pond water = tap water and Ca(NO3)2 to test positive for Ca iontap water = 2 options to make it: 1. plain= potentially no positive test (give students option to bring in own water to check for iron (well water may have) or chlorine (city water) 2. add something to tap water to create a positive test result – add Fe(NO3)3 if want it to test positive for iron, or CaCl2 to test positive for Ca and Cl
Questions Key1. What ions were present in... a. tap water very little calcium and chloride b. Riverwood river water very little calcium and sulfate (forms sulfuric acid with water) c. pond water little calcium
2. What do the ions found in the river water indicate? Could any potentially be linked to the fish kill?The river water has calcium and sulfate ions in it. The sulfate ion reacts with water to form sulfuric acid, making the river water acidic. The sulfate ion is from acid rain containing sulfuric acid and also could be from fertilizer runoff into the river making it even more acidic.
3. These tests cannot absolutely confirm the absence of an ion. Why?These tests are not accurate enough to confirm the complete absence of an ion since the tests do not detect extremely small amounts of ions that may be in the water samples. Thus the water samples probably contain trace amounts of some of the ions that tested negative in this experiment.
4. How might your observations have changed if you had not cleaned your wells thoroughly after each test?Contamination could lead to false positives.
5. Why was a positive test solution needed?As a reference to know what the positive result for the ion would show.
6. Why was a blank used?To make sure the experiment was set up correctly. If the blank tested positive then something was wrong in the set up and the other results are unreliable.
7. Explain the difference between cations and anions. Give a few examples from this lab for each. Refer to page 39 in the textbook if you forgot the terms cation/anion.Cations = positively charged ions Ex. Fe3+, Ca2+
anions = negatively charged ions Ex. Sulfate ion, chlorine ion
72

Riverwood Data Analysis
Get into groups of 5 and each person in the group will choose one of the water quality variables below. You will become the expert on the variable you chose. Analyze the data for the variable you chose and get into a group with other “experts” that are analyzing the same variable. Then report back to your original group the following:
• explain what factor you analyzed and give some background information on what it is (see below for hints) use your text or the internet to find additional background information on your factor.
• explain how this factor can have an impact on aquatic life such as fish• describe the trends in your data • explain whether or not your data shows any patterns or trends that may have been involved in
the fish kill
Water temperature affects dissolved oxygen and fish metabolism (see C.13 for details). Address how changes in temperature change DO levels in your presentation.
Dissolved oxygen is discussed in C12 and C13. Address how changes in DO levels affect fish. Discuss how temperature affects DO and why it does this.
Figure 6: Range of Tolerance for Dissolved Oxygen in Fish
http://www.water-research.net/Watershed/dissolvedoxygen.htmFor interpretation of the references to color in this and all other figures, the reader is referred to the electronic version of this thesis.
Rainfall affects water flow and can increase potentially hazardous fertilizer or heavy metal runoff from farms and mines. Look at your data and decide if there has been heavy rainfall any time recently. If there has, then this increases amounts of orthophosphate, nitrate, sulfates, PCBs, and pesticides. Heavy rainfall can mean large amounts of those substances being washed into the river.
73
pH – discussed in C9. Address what pH is, how high pH levels can harm fish, and how low pH levels can harm fish.
Nitrates – used primarily as fertilizers and can be washed off into rivers by rain and snow. They can negatively affect aquatic life if concentration becomes too large. These are most likely to get into the waterways after heavy rainfall since they wash off of fertilized fields into the water.
Table 10: Riverwood Data
DateWater
Temperature (˚C)
Dissolved Oxygen (mg/L) Rainfall (mm) pH Nitrate
(ppm)
Sept 1 11.2 8.0 0.3 7.1 0.5
Sept 2 11.5 9.2 0.1 7.0 1.0
Sept 3 11.9 8.3 0.2 7.1 0.5
Sept 4 11.7 9.4 0.3 7.1 1.0
Sept 5 12.5 10.2 0.5 7.2 1.5
Sept 6 11.0 11.7 1.2 6.9 1.0
Sept 7 10.9 12.1 2.2 7.1 2.0
Sept 8 10.7 12.3 2.8 6.8 2.5
Sept 9 10.3 12.5 2.6 6.2 3.0
Sept 10 10.5 12.7 3.0 5.1 4.0
FISH KILL on Sept 10
Acceptable Levels for Fish:Temp: -4 ˚C to 20 ˚CDO: 4 to 13 mg/L, see chart on front pageAverage Daily Rainfall in Riverwood: 0.2 mmpH: 6 to 8Nitrates: 0 to 10 ppm
74

Lab adapted from “Chemistry in the Community” 5th edition textbook by W.H. Freeman and Company on June 25, 2011
Modeling Acid Rain
1. Rinse your test tube with water. Dump out the excess water, but don't shake it out – you need a small amount of water in the bottom.2. Add 2 drops of universal indicator, drip one down the side and one drop straight into the bottom3. Light two matches and quickly drop the match into the tube (flame side up). Put the stopper in the tube. 4. Make observations.
Questions:1. What did the color change indicate?2. What does the match simulate in the real world?3. How does acid rain form?
Mini-lab adapted from Jody Tuls at Mattawan High School on June 29, 2011
Teacher NotesTakes 10 minutes
Key to Questions:1. universal indicator (that’s the name of the indicator, it is a combo of indicators) - turns yellow indicating the water turned acidic due to mixing with the smoke.2. match smoke simulates factory smoke and car exhaust (sulfur oxides, nitric oxides, carbon oxides combine with water to make acid rain)3. see above
75

Acid Rain Micro-titration
Goal: To determine the concentration of HCl in a sample of water from the Riverwood River. NaOH (sodium hydroxide) and HCl (hydrochloric acid) neutralize each other. The hydroxide ion (OH-) from the NaOH and the hydrogen ion (H+) combine to form water (a neutral substance)...or, in other words one mole of NaOH neutralizes one mole of HCl.
Materials: 0.03 M NaOH, Riverwood river water containing unknown concentration of HCl, two 10 mL graduated cylinders, 12 or 24-well plate, transfer pipettes, phenolphthalein indicator
Safety: Acids and bases are used in this lab. SAFETY GOGGLES MUST BE WORN!!!
Procedure:I. In order to know the volumes of sodium hydroxide and hydrochloric acid that react in the well plate, the volume of one drop of each must be determined.
1. Take up HCl into a pipette.2. Holding the pipette in a vertical position, drop the HCl into a 10 mL graduated cylinder.
Make sure to count the drops.3. Record the total volume after 100 drops. Determine the average volume per drop. (Example:
if you get 5 mL for 100 drops, that means that each drop is 5/100 of a mL)4. Repeat this with the sodium hydroxide.
II. Finding the molarity of acid in the Riverwood water1. Create a data table to record your titration data. Include the following headers on
your data table: # of drops of acid, volume of acid (mL), molarity of acid, # of drops of base, volume of base (mL), molarity of base. Include two trials under each heading.
2. Place the wellplate on a white piece of paper.3. Add 15 drops of the acidic river water to 3 wells on the well plate (15 drops per each well).4. Add 2 drops of the indicator and stir each well using a toothpick.5. Using a different pipette, drop NaOH into one of the wells, making sure to count the drops.
Stir while dropping. When a faint pink color stays around for at least 20 seconds, stop dropping, and record the number of drops used. Then repeat this process for 2 more wells using the same set-up.
6. Repeat this procedure as a second trial. Record all of your data
Data and Analysis:HCl acid river water CalibrationVolume of 100 drops of HCl _____________________
Average volume/drop HCl _______________________
76

NaOH CalibrationVolume of 100 drops of NaOH _____________________
Average volume/drop NaOH _______________________
Questions:
1. Write the equation for the neutralization of HCl by NaOH.
2. Phenolphthalein changes color when it loses or gains a hydrogen ion. This color change happens fairly close to a pH of 7, making phenolphthalein a highly used indicator. a) Why do you think it is important to stop dropping NaOH into the well as the solution
starts to turn pink?
b) What is present in the solution at this point of the titration (the equivalence point)?
3. Using averages from your data, determine the concentration (molarity) of HCl in the river water. Show how you set up this calculation along with your answer.
4. Acid rain contains some strong acids such as nitric acid and sulfuric acid. Why doesn't acid rain burn you? Relate the concentration of HCl found in the river water (ques 3 above) to your answer.
5. See the map of acid rain levels in the United States on page 364 in the text. Which region of the US has the most acidic rain? List a few reasons why this region might have the most acidic rain.
6. Describe 2 precautions that should be taken to ensure a precise titration.
77

a) b)
Teacher Notes:Riverwood water: 0.01 M HCl (less than 1 M HCl is not that dangerous unless there is massive amounts of it, if it rains acid then less than 0.1 M is not a big deal, acid rain is probably less than 0.01 M and because it is so dilute (mostly water) it is not harmful even though it contains strong acids although it did cause the fish kill because it caused the pH of the river to go too low since it's a strong acid, it still maintains the same pH even when diluted, and SO42- from fertilizer runoff). Even if you dropped 3 M or 6 M HCl on you it will be okay if you just rinse it off right away (may burn a little).
To dilute concentrated acid or base use M1V1 = M2V2 and make up the final solution to the desired volume. Example: To make 50 mL of 0.01 M HCl using 1 M HCl50 mL x 0.01 M = V x 1 MV = 0.5 mL of 1 M HCl, add to water already in a graduated cylinder (always add acid to water) then make up to 50 mL by adding more water
To make NaOH from solid pellets: (final desired volume) x (molarity desired) x (molecular weight of NaOH) = mass of NaOH to make up to final desired volume
0.1 L x 0.03 mol/L x 40 g/mol = 0.12 g NaOH and add water in beaker or volumetric flask until reach 0.1L and then add stir bar and put on stir plate until pellets dissolve.
-check molarities of prepared solutions of HCl and NaOH using the micro-titration neutralization below: (results students should get)M1V1 = M2V2
(0.03 M NaOH) x V NaOH = 15 drops x 0.01 M HClV NaOH = 5 drops
-instead of students finding volume of a drop could just assume one drop of HCl is equivalent in volume to one drop of NaOH and not have to convert from drops to volume and confuse students further (use drops instead of mL in M1V1 = M2V2)
0.03M NaOH: 2 mL / 43 drops = 0.047 mL / drop or 5 mL/ 107 drops = 0.046 mL/ drop
0.01 HCl: 2 mL / 44 drops = 0.045 mL / drop
78

Adapted from Acid Base Neutralization lab from Mattawan High School chemistry department on June 29, 2011
Answer Key to Questions:
1. Write the equation for the neutralization of HCl by NaOH. HCl + NaOH ---> H2O + NaCl
2. Phenolphthalein changes color when it loses or gains a hydrogen ion. This color change happens fairly close to a pH of 7, making phenolphthalein a highly used indicator.
a) Why do you think it is important to stop dropping NaOH into the well as the solution starts to turn pink?
To not overshoot the equivalence point (neutral solution containing equimolar amounts of NaOH and HCl)
b) What is present in the solution at this point of the titration (the equivalence point)? moles of acid = moles of base
3. Using your data, determine the concentration (molarity) of HCl in the river water. Show how you set p this calculation along with your answer. 15 drops HCl x M HCl = 5 drops NaOH x 0.03 M NaOH M HCl = 0.01 M *5 drops NaOH needed to neutralize the acid
4. Acid rain contains some strong acids such as nitric acid and sulfuric acid. Why doesn't acid rain burn you? Relate the concentration of HCl found in the river water (ques 3 above) to your answer. It is such a low concentration (0.01 M HCl) of the strong acid that it is not harmful. There is much more water in the rain than acid. (very dilute)
5. See the map of acid rain levels in the United States on page 364 in the text. Which region of the US has the most acidic rain? List a few reasons why this region might have the most acidic rain. East coast, pH ranges from 4.3-4.6. Wind carries air pollutants such as sulfur oxides and nitric oxides from power plants and factories in central US to the east coast where it reacts with water vapor to form acid rain.
6. Describe 2 precautions that should be taken to ensure a precise titration. a) clean and dry equipment
b) slowly and carefully count the drops (add drop-wise)
79

Table 11: Microtitration Sample Data
# of drops of HCl M of HCl # of drops NaOH M NaOH
15 drops 0.01 M 5 drops 0.03 M
80

Buffer Inquiry Lab
Goal: To determine what a buffer is by comparing how acid rain and NaOH affect buffered lakes versus regular lake water.
Procedure: Develop your own procedure to determine what a buffer is using the materials below. Write your procedure in the space below. This should be a numbered list of steps specifically describing what you did.
Materials: wellplate on white paper, eyedropper pipets, 0.1 M NaOH, 0.1 M HCl (simulates acid rain), buffered lake water, regular lake water, universal indicator or cabbage juice indicator, toothpick, universal indicator chart
Safety: Wear GOGGLES throughout this lab. Caution: The solutions used in this activity are corrosive. If you splash anything on your skin, wash the area thoroughly with water and tell the teacher right away.
Observations : Use the space below to record the color of your water samples and if they change throughout the lab. Record whether these colors indicate the solution remaining neutral or turning acidic or basic. Note: The lake water is close to neutral to start with.
Clean-up: Rinse the wellplate in the sink and put back at your lab station upside down on a piece of paper towel to dry.
Questions 1. What is a buffer? What evidence do you have to support your claim?
2. How did the buffered water differ from the regular water when acid rain is added? When a base is added?
3. Limestone acts as a buffer in lakes. If you were a fish living in an area with a lot of acid rain, would you rather live in the limestone bed lake or a regular lake? Why?
Adapted from “Chemistry in the Community” 5th edition by W. H. Freeman and Company pg. 378 on June 30, 2011
81

Teacher Notes for Buffer Lab
Suggested Procedure:1. Place a well plate on top of a sheet of white paper.2. Add 20 drops of buffer solution to one of the wells, and 20 drops of regular tap water to one of the wells.3. Add one drop of universal indicator to each well. If cabbage juice indicator is used then add 5 drops to each well.4. Record the initial color of the solutions.5. Add 5 drops of 0.1 M NaOH to each well. Note and record the color produced.6. Repeat the above procedure and add 5 drops of 0.1 M HCl to each well after the water and indicator are added. Note and record the color produced. OR instead of starting with fresh buffer and water in new wells, one could add the HCl to the 2 wells used previously as long as the well doesn't overflow.
Expected Results : The buffered water will resist change in pH as acid or base is added. The color of the buffered water will remain the original color of the indicator indicating it is still neutral (green), but the regular tap water color turns red when acid is added and blue/purple when base is added (depending on which indicator is used, universal indicator is originally green and turns orange/red in acid and blue/purple in base). Handout chart below for students. NOTE: Cabbage juice indicator is purple and turns red in acid and green in base (unlike the universal indicator solution which turns blue/purple in base).
Inquiry: Prep students by saying that it will take a bit to figure out the procedure but it's important to do inquiry labs to build critical thinking and problem solving skills. Remind students that indicators change color to indicate pH (acidic or basic).
Making the buffer (0.1 M sodium hydrogen phosphate and 0.1 M sodium dihydrogen phosphate : See page 378 in “Chemistry in the Community” textbook. Dissolve 5.36 g Na2HPO4 x 7 H2O and 2.76 g NaH2PO4 x H2O in 200 mL water
Dilution of HCl or NaOH : use M1V1 = M2V2 to find the volume of the concentrated acid to use and make up to the final desired volume by adding water. Ex. To dilute 6 M HCl to 100 mL of 0.1 M HCl solve for V of 6 M HCl to add to water and make up to 100 mL.
Dissolving NaOH: 0.1 M NaOH is 0.4 g NaOH in 100 mL of solution
82

The Effects of Acid Rain
Goal: To determine the affect of acid rain (0.1 M HCl) on metal and chalk. Note: 0.1 M HCl is used to simulate acid rain and make the affects observable in a short amount of time. Actual acid rain is less concentrated.
Materials: 1 cm piece of magnesium, 0.5 cm long chunk of chalk, 0.1 M HCl (simulating acid rain), 2 test tubes, eyedropper, test tube rack
Safety: Safety goggles must be worn throughout this experiment!
Procedure: 1. Obtain a small piece of magnesium and drop it in a clean test tube.2. Drop 5 to 10 drops of 0.1 M HCl into the test tube. Write down your observations in the space below.3. In another test tube drop a small chunk of chalk.4. Drop 5 to 10 drops of 0.1 M HCl into the test tube. Write down your observations in the space below.5. Clean-up: Pour the HCl into the waste beaker provided by the teacher. Rinse your test tubes with water and place upside down in the test tube rack. Observations and Questions:1. What happened when HCl was dropped on the metal and chalk?
2. How might acid rain affect your car over long periods of time? (Keep in mind the acid we used in this lab was more concentrated than acid rain).
3. Chalk is composed of calcium carbonate (CaCO3), which is also found in limestone. Old
headstones in cemeteries and gargoyles on buildings are also made of limestone. Explain how acid rain affects them over long periods of time.
Adapted from “Chemistry in the Community” 5th edition by W. H. Freeman and Company pg. 378 on June 30, 2011
83

Limestone Buffer Tube DemoMaterialsMarble chips (calcium carbonate), 150 g Cotton balls, 3Sulfuric acid, 0.1 M, 3-5 mL Graduated cylinder, 10 mLUniversal indicator solution, 3 mL Pipets or eyedroppersWater, distilled or deionized Rubber stopper to fit tube (two hole)Beaker, 250 mL Stirring rod Beaker, 400 mL Support stand and buret clampClear demonstration tube, 2 cm x 60 cm
PreparationPart A. Constructing the Column1. Place three cotton balls loosely bunched into one end of the long glass demonstration tube. Stopper this end of the demonstration tube with a two-hole rubber stopper.2. Fill the glass demonstration tube about three-quarters full with 150 g of marble chips.3. Using a single buret clamp, attach the demonstration tube vertically to a support stand so that the stoppered end of the tube is at the bottom and the open end is at the top.4. Place a 250 mL beaker under the stoppered end of the tube. Rinse the column of marble chips with tap water until the water leaving the column is clear (not cloudy), then rinse the column a second time with distilled or deionized water.5. Discard the rinse water in the 250 mL beaker and clean the beaker before replacing it back under the column.
Part B. Preparing the “Acid Rainfall” Solution6. In a 400 mL beaker, combine 250 mL of deionized water and 3 mL of universal indicator.7. Using a Beral-type pipet, add 1-2 drops of 0.1 M sulfuric acid to the indicator solution until it turns red (pH less than or equal to 4).
Procedure1. Slowly pour the “acid rainfall” solution into the demonstration column filled with marble chips.2. Observe the rainbow spectrum of color changes as the acid rain solution slowly filters through the column. 3. Pour the filtrate through the tube again a few times until the filtrate turns green to indicate a neutral pH.4. Using a Beral-type pipet, slowly add more acid rain solution to the filtrate in the beaker. Stir the filtrate with a stirring rod or using a magnetic stirrer. Observe the indicator color of the “naturally buffered lake” created in the beaker.
Adapted from Flinn Scientific December, 2011.
84

APPENDIX B
UNUSED LABS
85

Effect of pH on Plant Growth Work with a group and follow the outline below to design an experiment to determine the effect of various pHs on plant growth. The outline will guide you step by step through the scientific method which is used by scientists when designing experiments to investigate questions they have. In an experiment there is no right or wrong answer. As the scientist, you are observing the experiment, and then analyzing the results or data you collect.
Research Question: write a question or statement describing exactly what is being tested in the experiment.
Hypothesis and explanation: Be sure to explain the reasoning for your hypothesis. Write in the space below.
Variables: a. Independent Variable: (what you choose to vary in the experiment)
_____________________________________________________
b. Dependent Variable: (What you measure as data)
_____________________________________________________
c. Constants: (must be kept the same throughout the experiment)
_______________________________________________________
d. Control group: (serves as a standard for comparison)
_______________________________________________________
e. Experimental group: (group that receives experimental treatment)
______________________________________________________
86

Materials: Write this out on a separate sheet of paper. List materials. Procedure: On a separate sheet on paper list procedural steps needed to set up this experiment. Number the steps. Be specific! Data Table: On a separate sheet of paper set up a data table to record your observations each
day. Be sure to include units!
Results: You must make one graph per group showing your results. Underneath your graph write at least three complete sentences explaining what your graph is showing you in terms of how various pHs effect plant growth.
Conclusion: Answer the following 5 questions in complete sentences in the space provided. 1. Do your results support or not support your original hypothesis? How do you know? Use numbers from your data to support your answer.
2. a.) What do your results tell you about the effect various pHs have on plant growth? b.) Is there a difference in how acids and bases affect plant growth? c.) Did you get any unexpected results? If so what were they? Why do you think this happened? d.) What is the optimal pH range for plant growth? a.
b.
c.
87

d.
3. a.) Compare your results with another group that set up their experiment differently than you (if you used a cotton ball then find someone that used soil and compare results with them and vise versa). What differences did you find in plant height/ growth? What might have caused this difference? Where does the mass of the plant come from when growing on a cotton ball? b.) Acid rain is defined as precipitation with a pH less than 5.6, which is the average pH of natural precipitation. How would acid rain affect plant growth? c.) In southwest Michigan the average pH of rain is 4.7. Why don’t all of our crops, plants and flowers die? (Relate back to part a). a.
b.
c.
4. What are two sources of error in your experiment? (Do not say, "I was sloppy when recording data," or, "I should have asked the teacher for help." - sources of error should be based on things that went wrong during the experiment or things wrong with the experimental setup or data collection.) Be as specific as you can!
5. Describe at least two ways you could fix the errors made in your experiment. These suggestions should describe ways to improve the experimental design. Do not include vague human error such as, “I should have tried harder, asked for help, or been more careful.”
88

Radish Seed Growth Teacher Notes One could have students research background info on plants, soil pH, acid rain and how various pHs affect plant growth. Then students could write an introduction containing this background information and turn it in separately from this sheet. One could also have students type up materials, procedure, data table and graph on computer. Optimally, this unit should include more of the inquiry based activities that were developed. One inquiry based lab developed but went unused was “The Effect of pH on Plant Growth.” In this lab students design their own experiment to determine the affect of various pH’s on plant growth. This would extend the concepts learned in the PBL to further investigate the affect of acid rain on the environment by applying the study to plants. The results gained (see photographs in Appendix B) when this lab was tested in the summer of 2011 clearly showed that plants can survive within a certain pH range. Radish seeds were used for this lab as they germinate within a few days. Several methods of growing the seeds were tested including placing seeds in petri dishes lined with moist paper towel, using cotton balls in test tubes and also rolling filter paper and sliding it into the test tube. All three methods worked for growing the seeds, and this could be an option left open to the students. The method I found most useful was growing the seeds on cotton balls in test tubes. This method allowed the radishes to grow straight upward thereby providing a clear comparison of the height of the seeds grown at various pHs. The rolled filter paper provided another interesting alternate way to watch the seeds grow. What I liked about this method is that the root of the plant could also be seen, however, this is not necessary for collecting data. It was noted that the radish growth was more affected by acidic pHs than basic. Radishes grown on cotton balls soaked with a pH of 5.7 or less did not grow at all, while a pH of 11 seemed to have minimal affects on plant growth. This may be due to the base being non-buffered, and it could have been neutralized by the carbon dioxide in the air. Buffered bases of 10 and 12.3 showed little to no plant growth. Growing seeds in soil was also tested but gave poor results due to the buffering capacity of soil. In soil, seeds were able to grow at all pHs tested. In the future, I would like to experiment more with this lab to fine tune what methods work best including what buffers work best. I would like to provide students with the freedom to design their own experiments. I believe this would be an ideal lab to do open-ended inquiry with as the students have enough background knowledge of plant growth to be able to determine an experimental set-up. It is not always possible to have students design their own labs, particularly when labs involve techniques such as titrations that students need to be taught how to do ahead of time.
Lab Prep:Making Bases:pH 14 is 1 M NaOH
ph 11 is 0.001 M NaOH (plants still grew in soil and cotton, should use buffer instead)Dilute 1 M NaOH (pH 14) to make it using the following:M1V1=M2V21 M x V = 0.001 M x 200 mL
89

V = 0.2 mL of 1 M NaOH, make up to 200 mL of 0.001 M (multiply by 5 to make 1 L)
pH 9 is 0.00001 M NaOHDilute the solution made above using the following:0.001 M x V = 0.00001 M x 200 mLV = 2 mL of 0.001 M NaOH made up to 200 mL
*Test solutions made with pH paper and add drops of 1 M NaOH to the solutions as needed to adjust the pH.
Bleach can be used as a base with pH 12.63/4 is pH 10.5half bleach and water is pH 101/32 is pH 9
-----------------------------------------------------------------------------------------------------------------Using Vinegar as an acid source (vinegar kills the plants), vinegar is 5% acetic acid, pH 2.4, vinegar added to soil will bubble a lot due to neutralization reaction between acid and bicarb in soil
1/32 vinegar to water is about pH 5.51/16 vinegar to water is about pH 4.51/4 vinegar to water is about pH 3.5pure vinegar is about pH 2.4
------------------------------------------------------------------------------------------------------------------
Making acids (acetate buffer)Use 0.1 M acetic acid and 0.1 M sodium acetate and combine in the following ratios to get the desired pH buffers below.
pH 2.7 ratio of base (or salt) to acid is 0.01 = base/acid = 1 mL base/100 mL acid
pH 3.7 ratio of b/a = 0.1 = 10 mL sodium acetate/100 mL acetic acid
pH 4.7 ratio of b/a = 1 = 100 mL/100 mL
pH 5.7 ratio of b/a = 10 = 100 mL/10 mL
To find these ratios the Henderson Hasselbach equation was used:Ex. for pH 2.7desired pH = pKa + log (base/acid)2.7 = 4.7 + log (base/acid)
90

-2 = log b/a10^ -2 = b/a0.01 = b/a = 1 mL base/ 100 mL acid
To make the 0.1 M acetic acid use M1V1=M2V2 to dilute a more concentrated acetic acid:Ex. 600 mL x 0.1 M = 1 M x V V = 60 mL of 1 M acid, make up to 600 mL
Making 400 mL of 0.1 M sodium acetate from pellets:(molecular weight) x (molarity desired) x (volume desired) = grams of substance needed to make up to desired volume
(82.03 g/mol) x (0.1 mol/L) x (0.4 L) = 3.3 g of sodium acetate make up to 400 mL
Making 0.1 M carbonate buffer (pH 10 and pH 12 - plants in soil grew with this due to buffer but not plants on cotton ball)pH = pKa + log base/acid base = Na2CO3 acid = NaHCO3, pKa = 10.33pH 10.33 10.33 = 10.33 + log b/a0 = log b/a1 = b/a = 50 mL base/50 mL acid
pH 12.3312.33 = 10.33 + log b/a2 = log b/a10^ 2 = b/a100 = b/a = 100 mL base/1mL acid
Radish Set-up:Soak seeds in water for a few hours before giving them to the students to plant. Germination time: 1 dayAfter germination it take about 2 days for the seeds to sprout out of soil.
*Easiest method of set-up is putting the radishes in large test tubes (about 5 seeds per tube) after a half a cotton ball is stuffed in the bottom of the tube. Petri dishes with paper towel did not work as well as the lid on the petri dish prevented plants from growing up straight, thus making it difficult to measure their heights.
-Give students the option to set-up the lab using soil in small short cups or pots, or cotton balls in test tubes. (Show the options for setting up and tell them how to set up using test tubes, soil and cotton balls). Have about half and half of the class do the set-up in different ways so they can compare results (soil buffers the acid so acid plants grow better in soil than on cotton
91

balls). Relates to question 3a below on acid rain killing plants in Michigan - even though our pH here is 4.7 plants do not die because soil is a buffer and helps maintain a constant pH.
3. a.) Compare your results with another group that set up their experiment differently than you (if you used a cotton ball then find someone that used soil and compare results with them and vise versa). What differences did you find? What might have caused this difference? b.) Acid rain is defined as precipitation with a pH less than 5.6, which is the average pH of natural precipitation. How would acid rain affect plant growth? c.) In southwest Michigan the average pH of rain is 4.7. Why don’t all of our crops, plants and flowers die? (Relate back to part a). a. soil buffers the acid so acid plants grow better in soil than on cotton balls, also plants growing on cotton balls do not grow as tall as ones in soil due to lack of nutrients. the mass of the plant on cotton balls comes from water and CO2 atoms used in photosynthesis to produce carbsb. plants growth will decrease as acidity increasesc. even though our pH here is 4.7 plants do not die because soil is a buffer and helps maintain a constant pH
Results were similar regardless of set-up. Planting in soil, paper towel in petri dishes, filter paper in test tube or cotton ball in test tube all yielded the acid killing the plants and the bases not harming the plants.
Planted Wednesday July 6 (had germinated already from being soaked in paper towel for a few days). Watered 15 mL when planted, planted shallow (about 1 cm deep in loose soil)
Sprouted out of soil on Friday July 8.
Radish Results: Acids below pH 5.7 killed the plants in no soil, but only slowed growth of plants in soil. This is due to the buffering ability of soil. Diluted NaOH bases did not kill any plants in soil or in cotton ball. Buffered carbonate bases did not kill plants in soil but did prevent growth of plants on cotton balls. Using the buffered base is preferable and shows students that the soil is a buffer and prevents the base from killing the plant like it did on the cotton ball.
92

Table 12: Average Height of Radishes in Soil
pH July 8 July 11 July 13 pH July 14 July 15 July 18
2.7 buffer
1 cm 4 cm 6 cm 14(1 M NaOH)
0 cm 0 cm 0 cm
3.7 buffer
1 cm 3 cm 4 cm 10 carb buffer
1 cm 1 cm 1.5 cm
4.7 buffer
1 cm 4.5 cm 5 cm 12.3 carb buffer
1 cm 1.5 cm 3 cm
5.7 buffer
1 cm 5.5 cm 6.5 cm
7 1.5 cm 7 cm 8 cm
9 NaOH 1.5 cm 7 cm 9.5 cm
11 NaOH
1.5 cm 6 cm 7 cm
*watered only as needed with the pH solutions. Watered if the soil on top dried out a little.
93

Table 13: Average Height of Radishes on cotton ball in test tube (cm)
pH July 11 July 13 July 14 July 15 July 18
2.7 buffer
0 0 0 0 0
3.7 buffer
0 0 0 0 0
4.7 buffer
0 0 0 0 0
5.7 buffer
0 0 0 0 0
7 2.7 4 4.5 4.7 4.7
9 NaOH 2.7 4 4 4.3 4.3
11 NaOH
2.5 3 3 3.5 3.5
14 NaOH
N/A 0 0 0 0
10 buffer
N/A 0 0.5 cm for 1 of 4 seeds
0.5 for 1 seed
0 sprouted seed dead
12.3 buffer
N/A 0 0 0 0
94

Sample Results
Figure 7: Radish Growth at Various pHs
Figure 8: Radish Growth at pHs 3 to 6
Acids stunted growth noticeably in soil
95

Figure 9: Radish Growth at pHs 7 to 11
Non-buffered bases grew well.
Figure 10: Radish Growth in Test Tubes
96

Figure 11: Radish Growth in Test Tubes at pHs 7 to 12.3
Buffered base caused no growth on cotton and little growth in soil while non-buffered base (dilute NaOH, pH 9 and 11) grew well (might have been neutralized by CO2 in air)
Figure 12: Radish Growth at pHs 10 to 14
97

Acid Rain Titration
Goal: To determine the concentration of HCl in a sample of water from the Riverwood River.
NaOH (sodium hydroxide) and HCl (hydrochloric acid) neutralize each other. The hydroxide ion (OH-) from the NaOH and the hydrogen ion (H+) combine to form water (a neutral substance)...or, in other words one mole of NaOH neutralizes one mole of HCl.
Materials: 0.03 M NaOH in a 50 mL beaker, Riverwood river water containing unknown concentration of HCl, buret, 250 mL erlenmeyer flask, phenolphthalein indicator, ring stand, 50 mL waste beaker, 25 mL graduated cylinder
Safety: Acids and bases are used in this lab. SAFETY GOGGLES MUST BE WORN!!!
Procedure:Finding the molarity of acid in the Riverwood water:
1. Attach the buret to the ring stand.2. Rinse the buret with distilled water letting it drain into a 50 mL waste beaker.3. Put 5 mL of NaOH into the buret and let about 3 mL drain into the 50 mL waste beaker.
Make sure there are no air bubbles in the tip of the buret.4. Dump the contents of the waste beaker down the sink and run the water.5. Obtain 25 mL of acid river water in a graduated cylinder and pour into the erlenmeyer flask.6. Put 3 drops of phenolphthalein indicator into the erlenmeyer flask. 7. Place your erlenmeyer flask under the buret so that the tip of the buret goes down into the
erlenmeyer flask about 1 inch. Put a white sheet of paper under the flask.8. Rinse your graduated cylinder with water and then obtain 25 mL of NaOH in a beaker and
pour all of it into the buret (make sure the buret stopper is closed first).9. Record the initial volume of the NaOH in the buret and record it in the data table.10. Drop NaOH into the erlenmeyer flask. Swirl the flask while dropping. When a faint pink
color stays around for at least 20 seconds, stop dropping, and record the final volume of NaOH in the buret on the line below. Be careful not to overshoot the endpoint.
11. Calculate the volume of NaOH used to complete the titration. 12. Pour the contents of the flask down the sink while running the water and then rinse out the
flask. 13. Repeat this titration a second time and switch partners so each person titrates once.
98

Table 14: Titration Data Table
NaOH volume (mL): Trial 1 Trial 2Volume initial (first reading on buret)Volume final (buret reading after titration)Volume used
Average volume of NaOH used (use for calculation): _______mL
Data Analysis: 1. Write the equation for the neutralization of HCl by NaOH.
2. Phenolphthalein changes color when it loses or gains a hydrogen ion. This color change happens fairly close to a pH of 7, making phenolphthalein a highly used indicator. a) Why do you think it is important to stop dropping NaOH into the well as the solution
starts to turn pink?
b) What is present in the solution at this point of the titration (the equivalence point)?
3. Using the average volume of NaOH used, determine the concentration (molarity) of HCl in the river water. Show how you set up this calculation along with your answer. Put a square around your answer.
4. Acid rain contains some strong acids such as nitric acid and sulfuric acid. Why doesn't acid rain burn you? Relate the concentration of HCl found in the river water (ques 3 above) to your answer.
5. See the map of acid rain levels in the United States on page 364 in the text. Which region of the US has the most acidic rain? List a few reasons why this region might have the most acidic rain.
99

6. Describe 2 precautions that should be taken to ensure a precise titration. a)
b)
Lab based on widely used titration techniques.
Teacher Notes(same as micro-titration notes, same answer key to questions as well) – could have students do the titration both ways and compare their results to see which is more accurate or just choose either the micro-scale titration or full scale titration depending on time available.
Expected answers to ques 3:V NaOH used in titration: 8 mLM1V1=M2V2(25 mL HCl) x M = (0.03 M NaOH) x (8 mL NaOH)M of HCl = 0.01 M
Riverwood water: 0.01 M HCl (less than 1 M HCl is not that dangerous unless there is massive amounts of it, if it rains acid then less than 0.1 M is not a big deal, acid rain is probably less than 0.01 M and because it is so dilute (mostly water) it is not harmful even though it contains strong acids although it did cause the fish kill because it caused the pH of the river to go too low since it's a strong acid, it still maintains the same pH even when diluted, and SO4 from fertilizer runoff). To dilute concentrated acid or base use M1V1=M2V2 and make up the final solution to the desired volume. Example: To make 50 mL of 0.01 M HCl using 1 M HCl50 mL x 0.01 M = V x 1 MV = 0.5 mL of 1 M HCl, add to water already in a graduated cylinder (always add acid to water) then make up to 50 mL by adding more water
To make NaOH from solid pellets: (final desired volume) x (molarity desired) x (molecular weight of NaOH) = mass of NaOH to make up to the final desired volume.
0.1 L x 0.03 mol/L x 40 g/mol = 0.12 g NaOH and add water in beaker or volumetric flask until reach 0.1L and then add stir bar and put on stir plate until pellets dissolve.-check molarities of prepared solutions of HCl and NaOH using the microtitration neutralization below: (results students should get)M1V1=M2V2(0.03 M NaOH) x V NaOH = 15 drops x 0.01 M HClV NaOH = 5 drops
100

What Does an Antacid Do?
WEAR GOGGLES!!!You will only receive 2 piece of litmus paper and one antacid tablet. Use them as indicated!
Procedure:1. Pour 100 mL of water into a 150 mL beaker. Use a plastic pipet to add vinegar one drop at a
time while stirring with a glass stirring rod. Keep a piece of blue litmus paper dipped in the solution, and record the number of drops needed to make the solution turn the litmus paper pink.
Number of drops _______________
2. Break an antacid tablet into a 150 mL beaker and add 100 mL of water. Stir until the tablet is at least mostly dissolved.
3. Add vinegar dropwise to the antacid solution and monitor the solution by using another
piece of blue litmus paper. Record the number of drops needed to turn the litmus paper pink.
Number of drops _______________
Analysis:1. Which solution required more acid to turn the blue litmus paper pink: the water or the
antacid solution?
2. Propose how an antacid might work to counteract excess stomach acid?
Adapted from Jody Tuls at Mattawan High School on June 27, 2011.
101

Antacids Microtitration—How do you spell Relief?
Overview: Gastric Juice has a high content of HCl, with a pH close to 1. This pH rises to about 2.0 when mucus and food are added to the stomach. The glands that secrete gastric juice can be over stimulated by excessive ingestion or eating spicy foods. This excess in acid is what leads to heart burn.
We treat heartburn and other discomforts of the stomach by taking antacids which are claimed to take care of the excess acid. This is accomplished by bases in antacids neutralizing the acid. Complete the reactions of some commonly sold antacids below:
Tums® CaCO3 + 2HCl
Alka-Selzer® NaHCO3 + HCl
Maalox® Mg(OH)2 +2HCl
One way to determine how much acid is neutralized by an antacid is to perform a back titration. First we will add an excess amount of HCl to a solution of antacid. Then we will titrate the remaining un-neutralized acid with a known concentration of NaOH. This will tell you how much acid is neutralized by the NaOH; the remaining hydrochloric acid was neutralized by the antacid.
Different Brands of antacid will be titrated to determine which brand is most effective per gram to neutralize HCl. ** Even though we will be determining the effectiveness of an antacid based on how much HCl is neutralized remember that there are other factors such as dosage that are given on the packages and tested by medical researchers. Even if a single dose is more effective it may have a more limited dosage than the others.
Pre-lab problems 1. How many moles of HCl are in 34mL of 0.5 M HCl?
2. If an antacid tablet weighs 2.50g and it contains 400mg of magnesium hydroxide what % of the tablet is magnesium hydroxide?
3. Antacid A has 1700mg of sodium bicarbonate, antacid B has 500mg Calcium Carbonate. Which tablet is capable of neutralizing the most acid and why? (think moles)Materials:
102

small wellplatetoothpick0.5 M HCl1 M NaOHphenolphthalein3 to 4 different antacids (Tums, Maalox, Rolaids, Meijer brand)mortar and pestleelectronic balanceweigh boatspatula2 eyedroppers
Procedure: • Weigh out the mass of one antacid tablet for each brand and record on the data table.• Use a mortar and pestle to grind up the antacid tablet.• Weigh out 0.05 g antacid and place into the well plate.• Add 30 drops of 0.5 M HCl and 1 drop of phenolphthalein.• Stir with a toothpick.• Add 1 M NaOH drop-wise and stir after each drop with a toothpick.• Continue adding NaOH drop-wise until a pink color appears and remains pink after stirring.• Count the number of drops needed to neutralize the acid.• Repeat this procedure two more times for a total of three trials per antacid brand.• Repeat this procedure with each antacid brand.
Calculations: Show your work here! Write the formula for neutralization and show how you solved it. Assume one drop of HCl or NaOH equals 0.05 mL/drop.
103

Table 15: Antacid Microtitration Data Table Antacid
Active ingredient
Mass of active ingredient per tabletMass of Tablet (g) measured% Active ingredient# drops of NaOH Trial 1 Trial 2 Trial 3 Trial 1 Trial 2 Trial 3 Trial 1 Trial 2 Trial 3# drops of NaOH
Average # drops of NaOH used in titration
# drops of HCl neutralized by NaOH (find using calculation)# drops of HCl neutralized by antacidMoles of HCl neutralized by antacid
104

Table 16: Antacid Class DataAntacid Brand
# drops of HCl used by each group
Average # drops HCl neutralized Average # of moles HCl neutralized
Post-Lab
1. Which antacid was the most effective at neutralizing HCl?
2. How many moles of HCl can be neutralized by a single tablet of the most effective antacid? How many moles would be neutralized by two tablets?
3. Do you think this antacid is necessarily the best one to take? (Look at dosage limitations on all antacids) If not, which one do you think would be the best one?
105

4. If the antacid did not dissolve completely in the 0.5M HCl solution, what is the implication for your stomach? Would this be a good product to take?
5. Directions for antacid tablets may direct the user to take 2-3 tablets for reduction of stomach acid. Assuming that a particular individual’s stomach contains 1L of 0.1M HCl and that the antacid has 500mg of calcium carbonate per tablet, what would the final pH of this individual’s stomach contents be after taking 2 tablets?
6. Did you encounter any difficulties with the titration? If so, what were they?
106

Antacids Micro-titration Teacher Notes
Tums® CaCO3 + 2HCl ----> CaCl2 + H2CO3
Alka-Selzer® NaHCO3 + HCl ---> NaCl + H2CO3
Maalox® Mg(OH)2 +2HCl --->MgCl2 + 2 H2O
**choose antacid tablets that are white or yellow, not pink or purple or else you won’t see the
color change.
Pre-lab problems
1. How many moles of HCl are in 34mL of 0.5 M HCl? 0.034 L x 0.5 mol/L = 0.017 mol
2. If an antacid tablet weighs 2.50g and it contains 400mg of magnesium hydroxide what % of the tablet is magnesium hydroxide? 0.4 g/2.5 g= 16%
3. Antacid A has 1700mg of sodium bicarbonate, antacid B has 500mg Calcium Carbonate. Which tablet is capable of neutralizing the most acid and why? (think moles)
sodium bicarb: 1.7 g x (1 mol/84g NaHCO3) x (1 mol HCl/ 1 mol NaHCO3) = 0.02 mol HCl neutralized
calcium carbonate:0.5 g x (mol/100g CaCO3) x (2 mol HCl/1 mol CaCO3) = 0.01 mol HCl neutralized
Post-Lab
1. Which antacid was the most effective at neutralizing HCl? Rolaids
2. How many moles of HCl can be neutralized by a single tablet of the most effective antacid? How many moles would be neutralized by two tablets?
see data table, moles of HCl neutralized.
107

3. Do you think this antacid is necessarily the best one to take? (Look at dosage limitations on all antacids) If not, which one do you think would be the best one?
rolaids: take 2-4 tabs in 1 hr, max of 12 tabs in 24 hour tums: take 2-4 tabs in 1 hr, max of 15 tabs in 24 hr maalox: take 1-2 tabs in 1 hr, max of 8 tabs in 24 hr meijer: take 2-4 tabs in 1 hr, max of 16 tabs in 24 hr
Rolaids is the best, Maalox second best but can’t take as many tabs
4. If the antacid did not dissolve completely in the 0.5M HCl solution, what is the implication for your stomach? Would this be a good product to take?
might not dissolve fully in stomach, probably didn’t neutralize as much as others
5. Directions for antacid tablets may direct the user to take 2-3 tablets for reduction of stomach acid. Assuming that a particular individual’s stomach contains 1L of 0.1M HCl and that the antacid has 500mg of calcium carbonate per tablet, what would the final pH of this individual’s stomach contents be after taking 2 tablets?
1) 0.1 mol/L HCl x 1 L = 0.1 mol HCl in stomach 2) 0.5 g CaCO3 x 2 tabs x (mol/100g CaCO3) x (2 mol HCl/mol CaCO3) = 0.02 mol HCl will be neutralized by the tabs 3) (0.1 mol HCl in stomach) - (0.02 mol HCl neutralized) = 0.08 mol HCl unneutralized 4) pH = - log (0.08 M) pH = 1.1 with antacid
pH = - log (0.1 M HCl) = 1 before antacid
Adapted from Amanda Hosteter on June 30, 2011, widely used technique
SAMPLE DATA-Could have students determine set-up, make it inquiry based, if they have already done a similar titration.
0.05 mL/drop for NaOH and HCl, assume equal volume/ drop to simplify lab.
Molarity of HCl 0.5 MMolarity of NaOH 1 M
108

Table 17: Antacid Microtitration Sample DataSee antacids titration data sheet for background info on % active ingredient.
Antacid Tums Rolaids Maalox Meijer brand
Average # drops of NaOH used in titration
6 drops 6 drops 11 drops 15 drops
# drops HCl neutralized by NaOH (find using calculation)
12 drops 12 drops 22 drops 30 drops
# drops of HCl neutralized by antacid
18 dropsBEST ANTACID
18 dropsBEST ANTACID
8 drops 0 drops
Moles of HCl neutralized by antacid
4.5 E-5 mol 4.5 E-5 mol 2 E-5 mol 0 mol
Calculations:
# drops HCl neutralize by NaOH:M1V1 = M2V20.5 M HCl x V = 1 M NaOH ( 6 drops NaOH with Tums)V = 12 drops
# drops HCl neutralized by antacid:30 drops HCl in well - 12 drops neutralized by NaOH = 18 drops neutralized by antacid
Moles of HCl neutralized by antacid:18 drops x 0.00005 L/drop x 0.05 mol/L = 4.5 E-5 mol HCl neutralized
109

Antacids Titration—How do you spell Relief?
Overview: Gastric Juice has a high content of HCl, with a pH close to 1. This pH rises to about 2.0 when mucus and food are added to the stomach. The glands that secrete gastric juice can be over stimulated by excessive ingestion or eating spicy foods. This excess in acid is what leads to heart burn.
We treat heartburn and other discomforts of the stomach by taking antacids which are claimed to take care of the excess acid. This is accomplished by bases in antacids neutralizing the acid. Complete the reactions of some commonly sold antacids below:
Tums® CaCO3 + 2HCl
Alka-Selzer® NaHCO3 + HCl
Maalox® Mg(OH)2 +2HCl
One way to determine how much acid is neutralized by an antacid is to perform a back titration. First we will add an excess amount of HCl to a solution of antacid. Then we will titrate the remaining un-neutralized acid with a known concentration of NaOH. This will tell you how much acid is neutralized by the NaOH; the remaining hydrochloric acid was neutralized by the antacid.
Different Brands of antacid will be titrated to determine which brand is most effective per gram to neutralize HCl. ** Even though we will be determining the effectiveness of an antacid based on how much HCl is neutralized remember that there are other factors such as dosage that are given on the packages and tested by medical researchers. Even if a single dose is more effective it may have a more limited dosage than the others.
Pre-lab problems 1. How many moles of HCl are in 34mL of 0.5 M HCl?
2. If an antacid tablet weighs 2.50g and it contains 400mg of magnesium hydroxide what % of the tablet is magnesium hydroxide?
3. Antacid A has 1700mg of sodium bicarbonate, antacid B has 500mg Calcium Carbonate. Which tablet is capable of neutralizing the most acid and why? (think moles)Materials:
110

Buret100mL graduated cylinderErlenmeyer flaskAntacidsMortar and pestleBeaker0.5 M HCl1 M NaOHPhenolphthaleinHot plateWatch glassSpatula
Procedure: • Thoroughly wash Erlenmeyer flask, rinse with distilled water• Pulverize an antacid tablet using mortar and pestle• Record the Name of the antacid in Table 1• Take the mass of the antacid on the balance and record in Table 1• Record the mass of the active ingredient in Table 1• Scrape the pulverized antacid out of the mortar and pestle and into the Erlenmeyer flask
using a spatula• Add 34 mL of 0.5 molar HCl to the Erlenmeyer flask• Swirl the flask until the bubbling stops• Add three drops of phenolphthalein and swirl flask• Run a small amount of distilled water through the buret into the waste beaker• Then rinse the buret with no more than 5 mL of the NaOH solution. Let this run into the
waste beaker.• Pour contents of the waste beaker down the sink an rinse the beaker with water. • Fill the buret with NaOH and record the Molarity of the solution. • Run a small amount of NaOH out of the buret into a waste beaker. Make sure there are no
air bubbles in the tip. • Take an initial buret reading and record two decimal places in Table 1• Titrate. Be careful not to overshoot the end point! • Record the final buret reading to two decimal places in Table 1• Run a second trial and then repeat for two other antacids. • All left over solutions should be dumped down the sink• Calculate the volume of HCl neutralized by the antacid in Table 1• Calculate the amount of HCl neutralized by the NaOH in moles in Table 1• Share your data with the class and record class data in Table 2• Record the amounts from each group and calculate the average amount of HCl that each
antacid neutralized in Table 2• Record the average # of moles neutralized in Table 2
111

DATA SHEET (Show your work) Molarity of HCl _________Molarity of NaOH __________
Table 18: Antacid Titration Data TableAntacid
Active ingredient
Mass of active ingredient per tabletMass of Tablet (g) measured% Active ingredientFinal Buret reading Trial 1 Trial 2 Trial 1 Trial 2 Trial 1 Trial 2Final Buret reading
Initial Buret Reading
Volume of NaOH used in titrationAverage Volume of NaOH used in titration
Volume of HCl neutralized by NaOH (find using calculation)Volume of HCl neutralized by antacidMoles of HCl neutralized by antacid
Calculations: Show your work here! Write the formula for neutralization and show how you solved it.
112

Table 19: Antacid Titration Class DataAntacid Brand
Volumes of HCl used by each group
Average volume HCl neutralized Average # of moles HCl neutralized
Post-Lab
1. Which antacid was the most effective at neutralizing HCl?
2. How many moles of HCl can be neutralized by a single tablet of the most effective antacid? How many moles would be neutralized by two tablets?
3. Do you think this antacid is necessarily the best one to take? (Look at dosage limitations on all antacids) If not, which one do you think would be the best one?
4. If the antacid did not dissolve completely in the 0.5M HCl solution, what is the implication for your stomach? Would this be a good product to take?
113

5. Directions for antacid tablets may direct the user to take 2-3 tablets for reduction of stomach acid. Assuming that a particular individual’s stomach contains 1L of 0.1M HCl and that the antacid has 500mg of calcium carbonate per tablet, what would the final pH of this individual’s stomach contents be after taking 2 tablets?
6. Did you encounter any difficulties with the titration? If so, what were they?
Antacids Titration Teacher Notes
Tums® CaCO3 + 2HCl ----> CaCl2 + H2CO3
Alka-Selzer® NaHCO3 + HCl ---> NaCl + H2CO3
Maalox® Mg(OH)2 +2HCl --->MgCl2 + 2 H2O
**choose antacid tablets that are white or yellow, not pink or purple or else you
won’t see the color change.
Pre-lab problems
1. How many moles of HCl are in 34mL of 0.5 M HCl? 0.034 L x 0.5 mol/L = 0.017 mol
2. If an antacid tablet weighs 2.50g and it contains 400mg of magnesium hydroxide what % of the tablet is magnesium hydroxide? 0.4 g/2.5 g= 16%
3. Antacid A has 1700mg of sodium bicarbonate, antacid B has 500mg Calcium Carbonate. Which tablet is capable of neutralizing the most acid and why? (think moles)
sodium bicarb: 1.7 g x (1 mol/84g NaHCO3) x (1 mol HCl/ 1 mol NaHCO3) = 0.02 mol HCl neutralized
calcium carbonate:0.5 g x (mol/100g CaCO3) x (2 mol HCl/1 mol CaCO3) = 0.01 mol HCl neutralizedSAMPLE DATA (KEY)Molarity of HCl 0.5 MMolarity of NaOH 1 M
114

Table 20: Antacid Titration Sample DataAntacid Meijer extra
strength antacidMaalox Rolaids Tums
Active ingredient
aluminum hydroxide and MgCO3
calcium carbonate and simethicone
calcium carbonate and Mg(OH)2
calcium carbonate
Mass of active ingredient per tablet
Al(OH)3 = 160 mgMgCO3 = 105 mg
CaCO3 = 1000 mgSimethicone = 60 mg
CaCO3 = 550 mgMg(OH)2 = 110mg
CaCO3 = 500 mg
Mass of Tablet (g) measured
1.6 g 2.24 g 1.51 g 1.32 g
% Active ingredient
16.5% 47% 44% 38%
Final Buret reading
26.7 12.5 29 46.3
Initial Buret Reading
12.5 8.6 26.7 39.5
Volume of NaOH used in titration
14.2 3.9 2.3 6.8
Volume of HCl neutralized by NaOH (find using calculation M1V1 = M2V2)
28.4 7.8 4.6 13.6
Volume of HCl neutralized by antacid (34 mL - V neutralized by NaOH)
5.6 26.2 29.4BEST antacid
20.4
Moles of HCl neutralized by antacid
0.0028 0.0131 0.0147 0.0102
**choose antacid tablets that are white or yellow, not pink or purple or else you won’t see the color change.To find V of HCl neutralized by NaOH:(V of NaOH used in titration) x (1 M NaOH) = (V of HCl neutralized by NaOH) x (0.5 M HCl)
115

Ex. Maalox: (3.9 mL) x (1 M NaOH) = (V acid) x (0.5 M HCl)V acid = 7.8 mL
To find moles of HCl neutralized:moles HCl = (0.5 M HCl) x (V of HCl neutralized by antacid)Ex. Maalox: 0.5 M x 0.0262 L = 0.0131 moles
Post-Lab1. Which antacid was the most effective at neutralizing HCl?
Rolaids
2. How many moles of HCl can be neutralized by a single tablet of the most effective antacid? How many moles would be neutralized by two tablets?
see data table, moles of HCl neutralized.
3. Do you think this antacid is necessarily the best one to take? (Look at dosage limitations on all antacids) If not, which one do you think would be the best one?
rolaids: take 2-4 tabs in 1 hr, max of 12 tabs in 24 hour tums: take 2-4 tabs in 1 hr, max of 15 tabs in 24 hr maalox: take 1-2 tabs in 1 hr, max of 8 tabs in 24 hr meijer: take 2-4 tabs in 1 hr, max of 16 tabs in 24 hr Rolaids is the best, Maalox second best but can’t take as many tabs
4. If the antacid did not dissolve completely in the 0.5M HCl solution, what is the implication for your stomach? Would this be a good product to take?
might not dissolve fully in stomach, probably didn’t neutralize as much as others
5. Directions for antacid tablets may direct the user to take 2-3 tablets for reduction of stomach acid. Assuming that a particular individual’s stomach contains 1L of 0.1M HCl and that the antacid has 500mg of calcium carbonate per tablet, what would the final pH of this individual’s stomach contents be after taking 2 tablets?
1) 0.1 mol/L HCl x 1 L = 0.1 mol HCl in stomach 2) 0.5 g CaCO3 x 2 tabs x (mol/100g CaCO3) x (2 mol HCl/mol CaCO3) = 0.02 mol HCl will be neutralized by the tabs 3) (0.1 mol HCl in stomach) - (0.02 mol HCl neutralized) = 0.08 mol HCl unneutralized 4) pH = - log (0.08 M) pH = 1.1 with antacid pH = - log (0.1 M HCl) = 1 before antacidAdapted from Amanda Hosteter on June 30, 2011, widely used technique
116

Acid-Base Chemistry Review Activities
1. Antacid Analysis Lab (5 points) Open-Ended LabYou must determine the efficiency of antacids by comparing their neutralization ability with other antacids using a titration technique. You will be provided with 3 to 4 different antacids, 0.1 M HCL (to simulate conditions in the stomach), 0.1 M NaOH for titrating, buret, ring-stand apparatus, Erlenmeyer flask, phenolphthalein indicator, syringe, beaker. You must develop your own way to solve the problem. You must write up your lab and include Title, Purpose, Materials, Procedure, Data and Conclusions.
2. Soda Titration (5 points) Open-Ended LabYou must determine which soda has the highest concentration of acid in it. You will be provided with 3 different clear soda’s, 0.1 M NaOH for titrating, buret, ring-stand apparatus, Erlenmeyer flask, phenolphthalein indicator, beaker. You must develop your own way to solve the problem. You must write up your lab and include Title, Purpose, Materials, Procedure, Data and Conclusions.
3. Natural Indicators Lab Activity (3 points)There are many substances in the natural world that can serve as indicators. Your job is to find 3 to 4 natural indicators and develop a lab to test how these substances are effective for testing for the presence of an acid/base or both. You must turn in a lab write up that includes background information about the natural indicators, results of tests performed by you, conclusion/analysis about how your results confirm the function of the natural indicators and how this activity relates to what we have discussed about properties of acids and bases.
4. Uses for Acids and/ or Bases (3 points)Research information about uses for acids and bases, you must find a minimum of 3 sources. Write a paper about the information you find. Your paper must be typed, double spaced, 12-font, min. 1.5 pgs/ max 4 pages. Plagiarism will result in a grade of zero.
5. pHun Art (You may select ONE of the following)a. Acid/Base/Neutral Collage (3 points)Using magazine cut-outs, create a collage to show the differences and similarities between acidic, basic and neutral substances. The collage shoudl include properties of each, pH scale, various indicator, and common examples.
b. Acids/Bases Story Book (3 points)Create a story about acids and bases that incorporates such things as pH scale, strength/weakness, titrations, reactions, indicators, and/or general properties discussed in class.
c. Acid/Base Poem or Song (3 points)Create a poem or lyrics for a song that incorporates such things as pH scale, strength/weakness, titrations, reactions, indicators, and/or general properties discussed in class.
117

POINTS GRADE 3 C-D 5-8 A-B
Labs adapted from Betsy Collins on June 20, 2011.
118

APPENDIX C
ARTICLES FOR STUDENTS
119

Figure 13: “Fox River Fish Kill” Article
120

Figure 13 (cont’d)
121

Figure 13 (cont’d)
122

Figure 13 (cont’d)
123

Fox River Fish Kill Name: _____________________ Date: ___________ Hr: _______
1. What are some natural causes of fish kills?
2. Why was the Oshkosh community worried about the fish kill since it has been occurring annually in the past?
3. Why is the threat of suffocation greater for fish during the nighttime than during daytime?
4. How were the sewage treatment plants eliminated as possible causes of the fish kill?
5. How can carbon monoxide lead to death in animals?
6. Why was it unlikely that carbon monoxide poisoning was causing the fish kill? What does soluble mean?
7. The CO-Oximeter measures: a. concentration of gases in a solution b. transmission of light wavelengths through blood c. concentration of carbon monoxide only d. concentration of oxygen only
8. In the carbon monoxide experiment what was the control? Why is a control needed in experiments?
9. What did Ecker find as a result of testing the fish blood for carbon monoxide?
10. What was the result of the experiment in which caged live fish were placed next to the outboard motor tests in the Fox River?
124

11. Why was it important for Ecker and Ball to conduct the carbon monoixde experiment even though previous experiments had shown that carbon monoxide was NOT a threat to fish?
12. What was the culprit of the fish kills? Why did the kills suddenly increase in the last few years?
13. What did the company do to make their testing more environmentally friendly?
14. Refer to the graph on the last page of the article. a. What would be a good title for this graph?
b. How does the amount of light absorbed in blood saturated with carbon monoxide differ from the amount of light absorbed in blood saturated with oxygen?
c. Which color of visible light is absorbed the most by fish blood?
d. Why does blood appear red? Is the red light being absorbed or reflected? Use the graph to confirm your answer.
15. What happens to the amount of dissolved oxygen in the lake as the temperature increases? Why does this happen?
16. How does the concentration of dissolved oxygen affect fish?
125

Fox River Fish Kill Answers
1. What are some natural causes of fish kills? Stress of spawning or a lack of dissolved oxygen due to overabundance of algae or decaying plants. Usually occur once or twice each year for one to three days
2. Why was the Oshkosh community worried about the fish kill since it has been occurring annually in the past? Unnaturally large numbers of dead fish ongoing for a few years: 30,000 white bass and sheepshead died, and there were regular levels of dissolved oxygen so that couldn't be causing it.
3. Why is the threat of suffocation greater for fish during the nighttime than during daytime? Algae slow oxygen production at night when photosynthesis slows
4. How were the sewage treatment plants eliminated as possible causes of the fish kill? Several tests for toxic chemicals including chlorine tests in which fish were hung in path of the plant's discharge – but the fish survived
5. How can carbon monoxide lead to death in animals? CO is a colorless, odorless gas that upon inhalation attaches itself to the hemoglobin molecule in the blood, preventing hemoglobin from binding enough oxygen. CO forms a tighter bond with hemoglobin than oxygen. The result is suffocation from oxygen deprivation. 6. Why was it unlikely that carbon monoxide poisoning was causing the fish kill? What does soluble mean? CO is not very soluble in water and disperses rapidly into the air, so it is unlikely that fish would take it up. Soluble means the ability to dissolve the gas into solution.
7. The CO-Oximeter measures: a. concentration of gases in a solution B. transmission of light wavelengths through blood c. concentration of carbon monoxide only d. concentration of oxygen only
8. In the carbon monoxide experiment what was the control? Why is a control needed in experiments? Fish not exposed to carbon monoxide. Need a control as a standard for comparison.
9. What did Ecker find as a result of testing the fish blood for carbon monoxide? Killed fish had 60-70% saturation of CO Control fish had less than 10% saturation of CO 10. What was the result of the experiment in which caged live fish were placed next to the
126

outboard motor tests in the Fox River? The fish outside the outboard motor tests were dead or dying within 8 hours and their blood CO saturation was between 50 and 80%. The control fish were healthy.
11. Why was it important for Ecker and Ball to conduct the carbon monoixde experiment even though previous experiments had shown that carbon monoxide was NOT a threat to fish? Science knowledge is continually improving, and our current understanding of things can change. Also, it's important to be aware of limitations in experiments and note how the phenomenon being investigated differs from the published experiments. The more times experiments are run the more reliable the results are.
12. What was the culprit of the fish kills? Why did the kills suddenly increase in the last few years? Outboard motor exhaust expelling carbon monoxide into the lake. The company has been there for 30 years but had recently started running more powerful motors, which injected more carbon monoxide into the water.
13. What did the company do to make their testing more environmentally friendly? The company installed an exhaust venting system of pipes which prevents the carbon monoxide from getting into the water. The pipes disperse the gases into the air high above the city.
14. Refer to the graph on the last page of the article. a. What would be a good title for this graph? Light Absorbed in Fish Blood at Various Wavelengths of Light
b. How does the amount of light absorbed in blood saturated with carbon monoxide differ from the amount of light absorbed in blood saturated with oxygen? Blood saturated with oxygen absorbs less light at most wavelengths
c. Which color of visible light is absorbed the most by fish blood? yellow
d. Why does blood appear red? Is the red light being absorbed or reflected? Use the graph to confirm your answer. Red light is reflected, not absorbed
15. What happens to the amount of dissolved oxygen in the lake as the temperature increases? Why does this happen? As Temp increases, DO decreases. As Temp increases the solubility of gases decreases (because there isn’t enough air pressure to keep the gas in solution when the gas is warmer and has higher molecular motion and more energy) causing there to be less DO
127

in the water. 16. How does the concentration of dissolved oxygen affect fish? Too low of a DO concentration can lead to the suffocation of the fish
128

Figure 14: “Lakes and Streams Taking Time To Recover From Acid Rain” Article
129

Figure 14 (cont’d)
130

Lakes and Streams Taking Time to Recover from Acid Rain
1. What are the two main compounds which contribute to the formation of acid rain?
2. The article states that “acid-neutralizing capacity” results from the weathering of rocks and soil. What compound would need to be present in the rocks/soil around a lake for there to be acid-neutralizing capacity?
3. What is the term for a substance that resists changes in pH, whether an acid or a base is added?
4. What are some examples of tests the scientists could have done to determine whether the water was acidic or basic?
5. What would be the range of pH levels the scientists found in Maine's surface waters?
6. What determines whether a lake is considered to be in “recovery”?
7. The scientists may have been surprised to find that Maine's lakes and streams were still acidifying. Why?
8. Make a graph showing the general trend in fish spawning as water acidity increases beyond average levels.
131

Lakes and Streams Taking Time to Recover from Acid Rain
1. What are the two main compounds which contribute to the formation of acid rain?Nitrogen oxides and sulfur oxides
2. The article states that “acid-neutralizing capacity” results from the weathering of rocks and soil. What compound would need to be present in the rocks/soil around a lake for there to be acid-neutralizing capacity?Limestone/ calcium carbonate
3. What is the term for a substance that resists changes in pH, whether an acid or a base is added?Buffer
4. What are some examples of tests the scientists could have done to determine whether the water was acidic or basic?pH litmus paper, indicators like phenolphthalein and universal indicator
5. What would be the range of pH levels the scientists found in Maine's surface watersThey were found to be acidic, so anything less than 7
6. What determines whether a lake is considered to be in “recovery”?Whether it has returned to pre-industrial levels of acidity and other chemicals which counteract acidity
7. The scientists may have been surprised to find that Maine's lakes and streams were still acidifying. Why? There has been a decline in sulfuric acid in precipitation
8. Make a graph showing the general trend in fish spawning as water acidity increases beyond average levels.Graph should show a trend of decreased spawning as acidity increases
132

APPENDIX D
CONSENT FORM AND ASSESSMENTS
133

PARENTAL CONSENT AND STUDENT ASSENT FORM
Dear Students and Parents/Guardians:
I am working on a master’s degree at Michigan State University’s Department of Science and Mathematics Education (DSME). For my research thesis I have modified the acid base unit to incorporate problem based learning and some inquiry based activities. Using guided inquiry provides students with a chance to build critical thinking and problem solving skills they will need to solve real world problems in the future. My goal is to increase student achievement and understanding of chemistry by incorporating these activities.
Participation in my research is voluntary and any data or information about students will remain confidential and student names will not appear in the thesis anywhere. All students in my class will complete the same class work and activities regardless of their participation in this study. Students participating in the study will not be doing any extra work. I will be administering a pre-test and post-test to determine how effective this teaching approach is. I am asking for permission from both students and parents/guardians (one parent/guardian is sufficient) to use student test scores, opinion surveys, and samples of student work from the acid base unit for my research purposes. Student’s names will not be linked to their test scores, surveys or sample work and all information about students will remain confidential. I am also asking for permission to use pictures of students for presentation of my thesis. These pictures would show students working on the activities developed for the acid base unit. Students name would not be linked to their pictures.
There are no foreseeable risks associated with participating in the study. Another person will store the consent forms in a locked file cabinet that will not be opened until after I have assigned the grades for this unit of instruction. That way I will not know who agrees to participate in the research until after grades are issued. In the meantime, I will save your pre-test and post-test scores for the unit. Later I will analyze the data only for students who have agreed to participate in the study and whose parents/guardians have consented.
The results of this research will be presented in my master’s thesis and may contribute to finding better ways to include guided inquiry and problem based learning in the classroom. This project is anticipated to take place during November or December, 2011. All information about you will remain completely confidential. Students’ names will not be reported in my master’s thesis or in any other results of this research. After I analyze the data and choose samples of student work for presentation in the thesis, I will destroy the copies of student’s original assignments, tests, etc. Data will be stored on password protected computers and in locked filing cabinets. The only people who will have access to the data are me, my thesis committee at MSU, and the Institutional Review Board at MSU.
Participation in this research is completely voluntary. You have the right to say “no” with no penalties. You may change your mind at any time and withdraw. If either the student or parent/guardian requests to withdraw, the student’s information will not be used in this study. If you choose to withdraw you may tell or email Andy Beall, [email protected], to remove your consent form. By telling Andy Beall, he will remove your consent form so you will not be included in the study. I will not know that you withdrew until after grades have been issued for the semester.
134

If you have concerns or questions about this study please contact me, Katie McKinley by email at [email protected] or by phone, 269-668-3361 x 1101. You may also contact Dr. Merle Heidemann with questions by email at [email protected], by phone 517-432-2152 x 107 or by mail at 118 North Kedzie Lab , Michigan State University, East Lansing, MI 48824.
If you have questions or concerns about your role and rights as a research participant, or would like to register a complaint about this study, you may contact, anonymously if you wish, the Michigan State University’s Human Research Protection Program at 517-355-2180, Fax 517-432-4503, or e-mail [email protected] or regular mail at 207 Olds Hall, MSU, East Lansing, MI 48824.
Please complete the attached consent form indicating if you will be participating in this study. Both the student and parent/guardian must sign the form. Please return the form to Andy Beall (the teacher next door to my room) by Friday, September 9, 2011.
Thank you,
Ms. Katie McKinley
Chemistry Teacher
Mattawan High School
135

Thesis Research Consent FormMattawan High SchoolMs. McKinley’s Chemistry Class
Please print student name here: _______________________________________
Please check all that apply:
___________ I voluntarily agree to allow my chid to participate in this study.
___________ I give Ms. McKinley permission to use data generated from my child’s work in this class for her thesis project. All data from my child shall remain anonymous and confidential.
___________ I give Ms. McKinley permission to use pictures of my child during her work on this thesis project. My child will not be identified in these pictures.
Signatures:
I agree to allow my child to participate in this research project:
_______________________________________________ ____________ (Parent/Guardian Signature) (Date)
I (the student) voluntarily agree to participate in this thesis project:
________________________________________________ ____________(Student Signature) (Date)
***Important***
Please return this form to Andy Beall (next door) by September 9, 2011.
136

PRE-TEST AND POST-TEST
Unit 4 Section C Test: Acids and Bases
Multiple Choice: Please mark your answers on your scantron.
1. If [H+] = 1.0 x 10⁻⁸ M, what is the pH of the solution? a) 4 b) 8 c) 6 d) 7
2. Why do sulfur oxide and nitrogen oxide pollutants contribute to acid rain? a) They react with water to form sulfuric and nitric acids. b) They react with water to form sulfur and nitrogen hydroxide. c) They react with carbon dioxide to form sulfuric and nitric acids. d) They react with carbon dioxide to form sulfur and nitrogen hydroxide.
3. Why are lakes with limestone beds less effected by acid rain than lakes with granite beds? a) Granite is a buffer that neutralizes the acid.. b) Granite naturally has a high pH. c) Limestone is a buffer that neutralizes the acid. d) Limestone forms an acid.
4. What are the products of a neutralization reaction between H2SO4 and NaOH?a) H2O and Na2SO4b) NaH and OHSO4c) NaH2SO4 and OHd) H2SO4 and NaOH
5. If the hydroxide ion concentration of a solution is 1 x 10⁻³ what is the pH of the solution?a) 3 b) 11 c) 14 d) 1
6. Which of the following is acidic?a) egg white - pH 7.5b) blood - pH 7.4c) ammonia - pH 11d) milk - pH 6.7
7. If the pH of the solution is 11, what is the pOH of the solution?a) 11 b) 10 c) 14 d) 3
137

8. Which diagram best depicts a strong, dilute solution?a) c)
b) d)
9. A buffer _____________________.a) is an acid c) always has a pH of exactly 7b) is a base d) resists changes in pH
10. Which of the following is the hydronium ion?a) H+ b) OH- c) H3O + d) C2H3O2-
11. If [OH-] = 1.0 x 10⁻² M for a solution, what is [H3O+] ?
a) 1 x 10⁻² M b) 2 c) 12 d) a) 1 x 10-12 M
12. At the endpoint of a titration the pH of the solution will be:a) acidic b) basic c) neutral d) can’t tell
13. With a strong acid the reaction is shifted towards the a) product b) reactant c) it goes equally in both directions
14. What makes something a weak acid?a) it fully dissociatesb) it partially dissociatesc) there are many ions in solutiond) there are few ions in solution
138

15. You use a pH meter to determine the pH of 3 different solutions as you add an acid to them. The following table shows your data.
Table 21: Comparing the pH of Three SolutionsAmount of Acid
Added (mL)pH of solution A pH of solution B pH of solution C
5 7.0 10.0 4.0
10 4.3 6.9 3.9
15 1.1 3.6 3.9
Which of the solutions contains a buffer?a) solution A b) solution B c) solution C d) none of the solutions
139

Acid Base Test Unit 4C NAME: _______________________Short Answer HR: _________ DATE: _________ 1. Write the the dissociation reaction for:
a) HNO3
b) Ba(OH)2
2. Write the equation for molarity on the blank. ______________________
3. How many moles of NaCl would be needed to produce 1.5 L of 5 M solution? Show your work and units on everything to receive credit. CIRCLE your final answer.
4. Ima Acid has an unknown acid. She took a 25 mL sample of the acid and neutralized it using 13 mL of a 0.2 M NaOH solution. What is the molarity of the unknown acid? Show your work and units on everything for full credit. CIRCLE your final response.
5. Write the neutralization reaction for KOH and HBr in the space below.
140

6. a. Write the dissociation equation for HF in water. Be sure to include charges where appropriate. Write water in as part of the equation.
b. For each compound written in your answer above identify the acid, base, conjugate acid and conjugate base by labeling each compound.
7. In the square below draw what is in solution when NaOH dissociates. Label each ion or create a key to identify each ion. Do not include water in this drawing.
8. Explain at least two ways that acid rain affects the environment.
9. List one specific source that contributes to acid rain (where do the chemicals come from)?
141

Acid Base Test Unit 4C RUBRIC Multiple Choice
1. B2. A3. C4. A5. C6. D7. D8. A9. D10. C11. D12. C13. A14. B15. C
Short Answer RUBRICpoint # in front of points
1. Write the the dissociation reaction for: a) HNO3
#1) 1 point H+
#2) 1 point NO3-
b) Ba(OH)2
#3) 1 point Ba2+
#4) 1 point OH-
EC 1 pt for the 2 in front of OH-
2. Write the equation for molarity on the blank. #5) 1 point for M = mol/L
3. How many moles of NaCl would be needed to produce 1.5 L of 5 M solution? Show your work and units on everything to receive credit. CIRCLE your final answer.
#6) 1 point for showing set-up: 5 M = x/1.5 L #7) 1 pt for answer x = 7.5 mol
4. Ima Acid has an unknown acid. She took a 25 mL sample of the acid and neutralized it using 13
142

mL of a 0.2 M NaOH solution. What is the molarity of the unknown acid? Show your work and units on everything for full credit. CIRCLE your final response. #8) 1 pt for set-up: 25 mL x M = 13 mL x 0.2 M #9) 1 pt for answer: M = 0.1 M
5. Write the neutralization reaction for KOH and HBr in the space below. #10) 1 pt for KOH + HBr ----> #11) 1 pt for H2O #12) 1 pt for KBr
6. a. Write the dissociation equation for HF in water. Be sure to include charges where appropriate. Write water in as part of the equation. #13) 1 pt for HF + H2O #14) 1 pt for H3O+
#15) 1 pt for F-
b. For each compound written in your answer above identify the acid, base, conjugate acid and conjugate base by labeling each compound. #16) 1 pt for HF being acid and H2O being base #17) 1 pt for H3O+ being conjugate acid and F- conj. Base
7. In the square below draw what is in solution when NaOH dissociates. Label each ion or create a key to identify each ion. Do not include water in this drawing.
#18) 1 pt for Na+ written properly #19) 1 pt for OH- written properly #20) 1 pt for fully dissociated
8. Explain at least two ways that acid rain affects the environment. (2 pts)#21) first reason #22) second reason1 pt for each reason, several potential answers such as breaking down limestone statues or metals, causing bodies of water to have lower pH, killing plants or animals 9. List one specific source that contributes to acid rain (where do the chemicals come from?) (1 pt)#23) 1 pt for source: factories, car exhaust, air pollution
143

Acid Base Unit SurveyThis survey will be used to gather information on student opinions of the unit and activities. Your answers will remain anonymous as you do not need to write your name on this sheet. Please answer the following questions honestly so that the information is useful for the research study.
List of unit activities: Ion Testing Lab, Riverwood Data Analysis (graphing), Modeling Acid Rain, Acid Rain Titration, Buffer Inquiry Lab, Preventing Acid Rain Discussion Questions, Antacids Titration, Plant pH Lab, Acid-Base Chemistry Activities, Science Articles (“Fox River Fish Kill” and “Lakes and Streams Take Time to Recover from Acid Rain”) 1. Which of the activities in this unit were the most interesting? Which were the least? Explain why you feel this way.
2. Which activities in this unit did you feel you learned the most from? The least? Explain why you feel this way.
3. Which activities were the most mentally engaging and got you thinking about the science and trying to understand it? Which were the least? Explain why you feel this way.
144

4. What did you like or dislike about the problem based learning approach to this unit in which we focused on determining the cause of the fish kill?
5. What did you like or dislike about the more inquiry based labs like the buffer lab in which you designed your own experiment or the pH affect on plant growth lab?
6. How do you feel designing your own experiment (buffer lab and plant pH lab) affected your learning? What were some challenges or benefits of designing your own experiment?
7. What did you feel you learned from reading the science articles? Did you find the articles interesting or mentally engaging (did they make you think and analyze information)?
8. What did you like or dislike about the unit in general?
145

REFERENCES
146

REFERENCES
Albanese, M.A., & Mitchell, S. 1993. Problem-based learning: A review of the literature on its outcomes and implementation issues. Academic Medicine, 68 (1), 52-81.
Albano, M.G., Cavallo, F., Hoogenboom, R., Magni, F., Majoor, G., Manenti, F., Schuwirth, L., Stiegler, I., and van der Vleuten, C. 1996. An international comparison of knowledge levels of medical students: The Maastricht Progress Test. Medical Education, 30, 239-245.
Barrows, H. S. 1986. A taxonomy of problem-based learning methods. Medical Education, 20(6), 481-486.
Black, Harvey. October, 1990. Fox River Fish Kill. Chem Matters Magazine, 8 (3), 6-9.
Blake, R.L., Hosokawa, M.C., & Riley, S.L. 2000. Student performances on Step 1 and Step 2 of the United States Medical Licensing Examination following implementation of a problem-based learning curriculum. Academic Meicine, 75, 66-70.
Blanchard, M., S. Southerland, J. Osborne, V. Sampson, L. Annetta, E. Granger. 2010. Is Inquiry Possible in Light of Accountability?: A Quantitative Comparison of the Relative Effectiveness of Guided Inquiry and Verification Laboratory Instruction. Science Education, 94 (4), 577-616.
Blosser, Patricia E. 1993. Using Cooperative Learning in Science Education. ERIC Clearinghouse for Science, Mathematics and Environmental Education. ED351207, Columbus, OH.
Cervetti, Gina, P. Pearson, M. Bravo, and J. Barber. 2005. Reading and Writing in the Service of Inquiry-Based Science. http://seedsofscience.org/pdfs/science&literacy.pd Accessed on July 19, 2011.
D’Arcangelo, Marcia. 2002. The Challenge of Content-Area Reading. Reading and Writing in the Content Areas, 60 (3), 12-15.
Farrell, J., Moog, R., Spencer, J. 1999. A Guided Inquiry General Chemistry Course. Journal of Chemical Education, 76 (4), 570-574.
Francisco, Joseph, Nicoll, G., Trautmann, M. 1998. Integrating Multiple Teaching Methods into a General Chemistry Classroom. Journal of Chemical Education, 75 (2), 210.
Goodnough, K., & Cashion, M. 2003. Fostering Inquiry through Problem-Based Learning. The Science Teacher, 70 (9), 21-25.
Haury, David. 1993. Teaching Science Through Inquiry. ERIC Clearinghouse for Science, Mathematics and Environmental Education. ED359048, Columbus, OH.
147

Haury, David. 2002. Learning Science Through Design. Haury, David. 1993. Teaching Science Through Inquiry. ERIC Clearinghouse for Science, Mathematics and Environmental Education. ED359048, Columbus, OH.
Haury, David & Rillero, Peter. 1994. Perspectives of Hands-On Science Teaching. ERIC Clearinghouse for Science, Mathematics and Environmental Education. ED372926, Columbus, OH.
Haury, David & Rillero, Peter. 1994. Perspectives of Hands-On Science Teaching. ERIC Clearinghouse for Science, Mathematics and Environmental Education. EDO-SE-02-06, Columbus, OH.
Hmelo-Silver, Cindy. 2004. Problem-Based Learning: What and How Do Students Learn? Educational Psychology Review, 16 (3), 235-266.
Hmelo-Silver, C., Barrows, H. 2006. Goals and Strategies of a Problem-based Learning Facilitator. The Interdisciplinary Journal of Problem-based Learning, 1 (1), 21-39.
Hmelo-Silver, C., Duncan, R., Chinn, C. 2006. Scaffolding and Achievement in Problem-Based and Inquiry Learning: A Response to Kirschner, Sweller, and Clark (2006). Educational Psychologist, 42 (2), 99-107.
Houtman, N., Kahl, S. University of Maine. October, 1999. Lakes and Streams Taking Time To Recover From Acid Rain. Science Daily Magazine. Accessed September, 2010 http://www.sciencedaily.com/releases/1999/10/991007101057.htm
Kang, Weiqun Courtney; Jordan, Elizabeth; and Porath, Marion. 2009. "Problem-Oriented Approaches in the Context of Health Care Education: Perspectives and Lessons," Interdisciplinary Journal of Problem-based Learning: Vol. 3: Iss. 2, Article 5.Available at: http://docs.lib.purdue.edu/ijpbl/vol3/iss2/5
Kirschner, P., Sweller, J., Clark, R. 2006. Why Minimal Guidance During Instruction Does Not Work: An Analysis of the Failure of Constructivist, Discovery, Problem-Based, Experiential, and Inquiry-Based Teaching. Educational Psychologist, 41 (2), 75-86.
Lehman, J., George, M., Buchanan, P., Rush, M. 2006. Preparing Teachers to Use Problem-centered, Inquiry-based Science: Lessons from a Four-Year Professional Development Project. The Interdisciplinary Journal of Problem-based Learning, 1 (1) 76-99.
Marshall, Jeff and R. Horton. 2011. The Relationship of Teacher-facilitated, Inquiry-based Instruction to Student Higher-order Thinking. School Science and Mathematics, 111 (3), 93-99.
148

Mayer, Richard E. 2004. Should There Be a Three-Strikes Rule Against Pure Discovery Learning? American Psychologist, 59 (1), 14-19.
Mergendoller, J., Maxwell, N., Bellisimo, Y. 2000. Comparing problem-based learning and traditional instruction in high school economics. Journal of Educational Research, 93, 374-382.
Mergendoller, J., Maxwell, N., Bellisimo, Y. 2006. The Effectiveness of Problem-based Instruction: A Comparative Study of Instructional Methods and Student Characteristics. The Interdisciplinary Journal of Problem-based Learning, 1 (2), 49-69.
Panasan, M., Nuangchalerm, P. 2010. Learning Outcomes of Project-Based and Inquiry-Based Learning Activities. Journal of Social Sciences, 6 (2), 252-255.
Sanson-Fisher R.W., & Lynagh, M.,C. 2005. Problem-based learning: A dissemination success story? Medical Journal of Australia, 183 (5), 258-260.
Savery, John R. 2006. Overview of Problem-based Learning: Definitions and Distinctions. Interdisciplinary Journal of Problem-based Learning, 1 (1), Article 3. Available at: http://docs.lib.purdue.edu/ijpbl/vol1/iss1/3
Settlage, J. 2007. Demythologizing science teacher education: Conquering the false ideal of open inquiry. Journal of Science Teacher Education, 18, 461–467.
Sockalingam, Nachamma and Schmidt, Henk G. 2011. "Characteristics of Problems for Problem-Based Learning: The Students’ Perspective," Interdisciplinary Journal of Problem-based Learning: Vol. 5: Iss. 1, Article 3. Available at: http://docs.lib.purdue.edu/ijpbl/vol5/iss1/3
Tang, Xiaowei & Coffey, Janet E. 2010. The Scientific Method and Scientific Inquiry: Tensions in Teaching and Learning. Science Education, 94 (1), 29-47.
Vernon, D., & Blake, R. 1993. Does problem-based learning work? A meta-analysis of evaluation research. Academic Medicine, 68 (7), 550-563.
Wagner, Tony. 2008. The Global Achievement Gap. Basic Books, New York, NY. Available at: www.tonywagner.com/7-survival-skills. Accessed in October, 2011.
Walker, Andrew and Leary, Heather. 2009. "A Problem Based Learning Meta Analysis: Differences Across Problem Types, Implementation Types, Disciplines, and Assessment Levels," Interdisciplinary Journal of Problem-based Learning: Vol. 3: Iss. 1, Article 3.Available at: http://docs.lib.purdue.edu/ijpbl/vol3/iss1/3
149