Embed Size (px)
Citation preview

Using perf On Arm platformsLeo Yan & Daniel Thompson
Linaro Support and Solutions Engineering

Introductionperf is a performance analysis tools for Linux, it covers hardware level features and software features for performance profiling with the high efficiency.
We will review the fundamental mechanism for perf, then go through different usages delivered by perf, mainly for Arm related hardware features. We will conclude the session by discussing an examples.
We will finish this material in 50 minutes.

Agenda● Statistical profiling on Arm platforms
○ Fundamental mechanism (for statistical profiling)○ Profile with timer○ Profile with PMU
● Using perf with tracing tools○ Profile with ftrace○ Profile with probes○ Profile with CoreSight
● Debugging stories

perf - a family of useful tools perf is a powerful profiling tool; primarily it exploits the CPU performance counters but can also gather information from other sources (including hrtimers, static tracepoints and dynamic probes).
perf is a family of useful tools collected into a single binary; it is a profiling tool to gather statistics info and report the result, it can act as a wrapper for ftrace and eBPF, it also includes the benchmark suites for memory, scheduling performance testing, etc.
perf top perf stat perf record
perf probe perf listperf ftrace
perf report perf annotate
perf data perf diff perf evlist
perf script
perf bench
Profiling and tracing
Reports
Benchmark suites
perf sched
perf inject
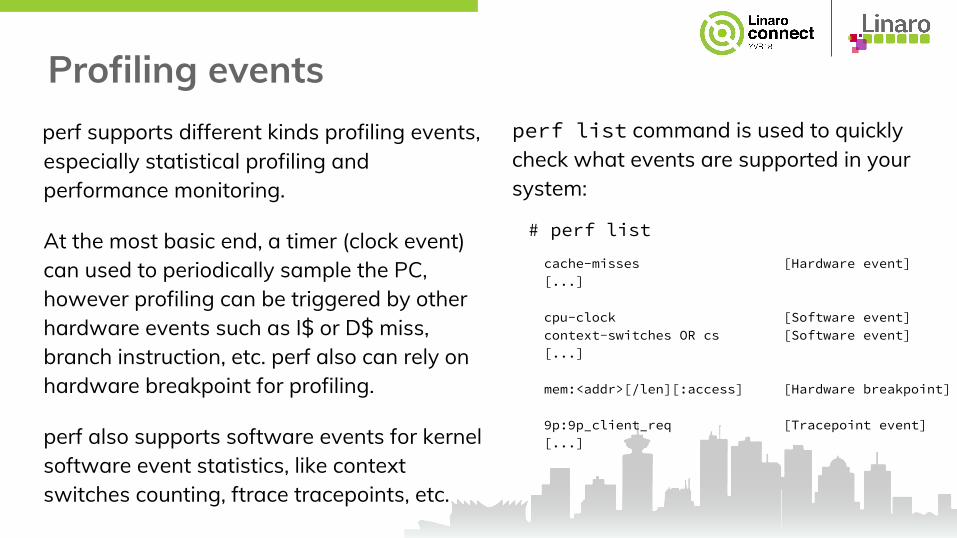
Profiling events perf supports different kinds profiling events, especially statistical profiling and performance monitoring.
At the most basic end, a timer (clock event) can used to periodically sample the PC, however profiling can be triggered by other hardware events such as I$ or D$ miss, branch instruction, etc. perf also can rely on hardware breakpoint for profiling.
perf also supports software events for kernel software event statistics, like context switches counting, ftrace tracepoints, etc.
perf list command is used to quickly check what events are supported in your system:
# perf list
cache-misses [Hardware event] [...]
cpu-clock [Software event] context-switches OR cs [Software event] [...]
mem:<addr>[/len][:access] [Hardware breakpoint] 9p:9p_client_req [Tracepoint event] [...]
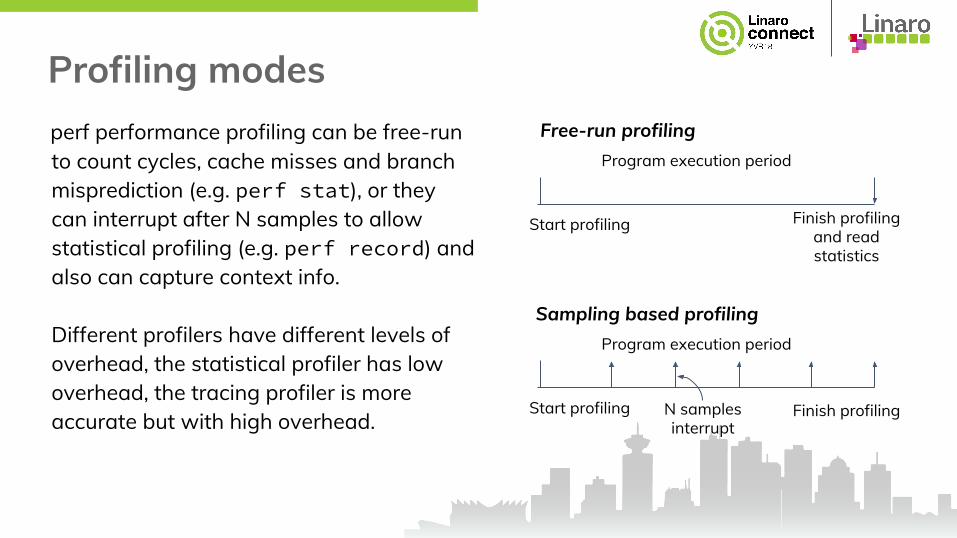
Profiling modes perf performance profiling can be free-run to count cycles, cache misses and branch misprediction (e.g. perf stat), or they can interrupt after N samples to allow statistical profiling (e.g. perf record) and also can capture context info.
Different profilers have different levels of overhead, the statistical profiler has low overhead, the tracing profiler is more accurate but with high overhead.
Free-run profiling
Start profiling Finish profiling and read statistics
Program execution period
Sampling based profiling
Start profiling Finish profiling
Program execution period
N samples interrupt

Interfaces between kernel and user space The user space program uses the system call perf_event_open() to open event and uses fcntl() to set the blocking mode; A read() on a counter returns the current value of the counter and this is used to read free-running counters (e.g. perf stat).
The sampling counter generates events and store them in the ring buffer, which is available to user space using mmap(). The data can be saved into perf.data file with perf record.
Interfaces between kernel and user space
User spaceKernel
sys_perf_event_open mmap
Events
read
Softwareevent
Hardwareevent
Interrupt
samples
ID
PID
…...
perf stat -e 'cycles' ls
perf record -e 'cycles' ls
perf.data

Control tracing scope for counters perf organizes counters as the counter group, a counter group is scheduled to the CPU as a unit, so the values of the member counters can be meaningfully compared, added, divided (to get ratios), etc.
perf events can be system wide, or they can be attached to specific CPUs with specific tasks; it can profile per-thread wise or per-cpu wise; perf events also can be restricted to the times when the CPU is in user, kernel or hypervisor mode.
perf record -e cs_etm/@826000.etr/u --per-thread ./main
Counters organization metrics
CPU0 CPU1
task0
task1
task0Per thread profiling
Per CPU profiling
User mode
Kernel mode
Hypervisor

Profiling result analysis The perf data can be investigated by perf report. It explores the tracer configuration info and sample data in the perf file and connect with Dynamic Shared Object (DSO) for analysis.
DSOs are referred by build id and cached in the folder ~/.debug/ and they can be archived by perf archive, the tar file can be used by another platform for cross-analysis.
Example for statistics result
# Samples: 32K of event 'cache-misses'# Event count (approx.): 14284599## Overhead Command Shared Object Symbol # ........ .......... ................. ........................#
67.20% sched-pipe [kernel.kallsyms] [k] _raw_spin_unlock_irqrestore 3.19% sched-pipe [kernel.kallsyms] [k] pipe_read 2.28% sched-pipe [kernel.kallsyms] [k] mutex_lock 2.15% sched-pipe [kernel.kallsyms] [k] copy_page_from_iter 1.99% sched-pipe [kernel.kallsyms] [k] el0_svc_naked
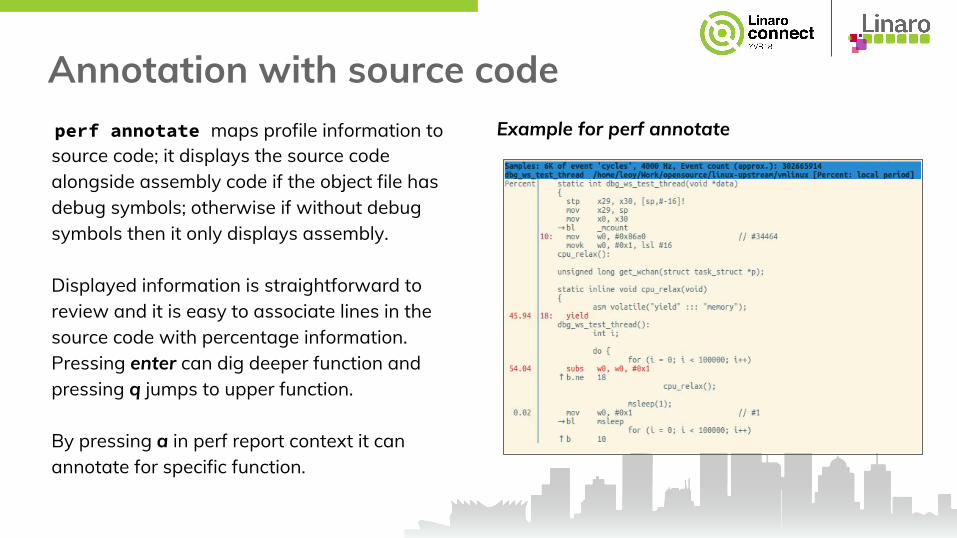
Annotation with source code perf annotate maps profile information to source code; it displays the source code alongside assembly code if the object file has debug symbols; otherwise if without debug symbols then it only displays assembly.
Displayed information is straightforward to review and it is easy to associate lines in the source code with percentage information. Pressing enter can dig deeper function and pressing q jumps to upper function.
By pressing a in perf report context it can annotate for specific function.
Example for perf annotate

Post process with scripts perf script reads the input file and displays the detailed trace of the workload with specified fields, e.g. pid, cpu and time, etc.
perf script -F cpu,event,ip
Furthermore, perf provides support for post process with python or perl scripts that aggregates and extracts useful information from a raw perf stream.
perf script -s syscall-enter.py
Example for dump syscall invoking
import osimport sys
from perf_trace_context import *from Core import *
def trace_begin():print "in trace_begin"
def trace_end():print "in trace_end"
def raw_syscalls__sys_enter(event_name, context, common_cpu, common_secs, common_nsecs, common_pid, Common_comm, id, args):
print "id=%d, args=%s\n" % (id, args)

Profile with timer perf includes support for time based profiling using hrtimers, it’s intuitive to understand how the code consumes time.
perf provide two time based profilers cpu-clock and task-clock; cpu-clock is wall-clock based and samples are taken at regular intervals relative to walltime; task-clock is to sample the specific task run time.
# perf top -F 99 -ns comm,dso
59.62% 22 perf [kernel] 36.15% 12 perf perf 3.72% 28 swapper [kernel] 0.51% 14 kworker/1:1 [kernel]
# perf record -e task-clock -F 99 uname
Profile with CPU clock at 99Hz
Profile with task clock at 99Hz
If sampling frequency is the same as some repeating event within the profiled code, then the profile will be misleading since the interrupt will always hit the same bit of code. Deliberately selecting a rate that is not a multiple of 10 (nor a power-of-2) 99 makes this unlikely.
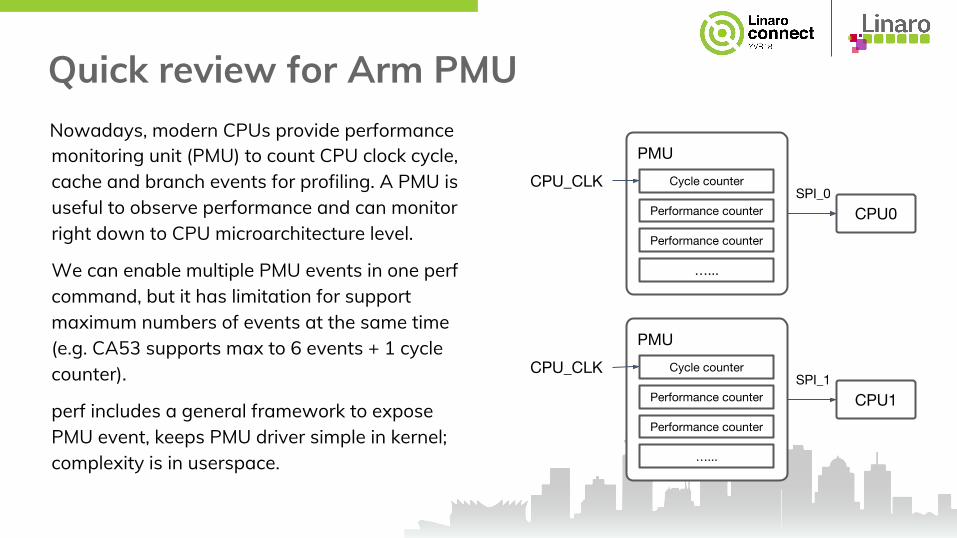
Quick review for Arm PMU Nowadays, modern CPUs provide performance monitoring unit (PMU) to count CPU clock cycle, cache and branch events for profiling. A PMU is useful to observe performance and can monitor right down to CPU microarchitecture level.
We can enable multiple PMU events in one perf command, but it has limitation for support maximum numbers of events at the same time (e.g. CA53 supports max to 6 events + 1 cycle counter).
perf includes a general framework to expose PMU event, keeps PMU driver simple in kernel; complexity is in userspace.
PMU
Cycle counter
Performance counter
…...
Performance counter
PMU
Cycle counter
Performance counter
…...
Performance counter
CPU_CLK
CPU_CLK
CPU0
CPU1
SPI_0
SPI_1

Profile with PMU perf have defined standard event names for instruction, cache and branch related hardware events profiling.
perf state -a -e \ cache-references,cache-misses -- sleep 10
perf provides comparison between metrics so can easily get the ratio, e.g. comparing ‘cache-misses’ to ‘cache-references’ for cache missing percentage.
Performance counter stats for 'system wide':
5756626419 cache-references 233027636 cache-misses # 4.048 % of all cache refs
10.004134787 seconds time elapsed
perf standard events don’t cover all available hardware events provided by PMU; we can use the raw mode to explore more hardware events, e.g. we can directly access CA53 events with raw ID number: 03 for ‘L1 Data cache refill’ and 04 is for ‘L1 data cache access’.
perf stat -a -e r04,r03 -- sleep 10
Arm platform refers to cache profiling with L1 cache level with standard event. For L2 cache profiling, we can use raw mode to access related events and aggregate all related CPUs statistics shared with the same L2 cache.

Example for profiling hotspot with PMUStep 1: use ‘top’ to browse which program consumes more CPU bandwidth than expected:
# top PID USER PR NI VIRT RES SHR S %CPU %MEM TIME+ COMMAND 582 root 20 0 0 0 0 D 2.3 0.0 0:02.70 cpu_hl_t1
Step 2: Gather profiling data with ‘cycles’ event with attaching to task with pid=582:
# perf record -e cycles -p 582 -- sleep 20
Step 3: Generate perf report and find hotspot functions:
# perf report # Overhead Command Shared Object Symbol # ........ ......... ................. ............................... # 93.00% cpu_hl_t1 [kernel.kallsyms] [k] test_thread 1.94% cpu_hl_t1 [kernel.kallsyms] [k] _raw_spin_unlock_irqrestore 1.67% cpu_hl_t1 [kernel.kallsyms] [k] _raw_spin_unlock_irq
if the the CPU is dynamic frequency scaling; rather than time based profiling, we can rely on PMU cycle counter for more accurate profiling.

Agenda● Statistical profiling on Arm platforms
○ Fundamental mechanism (for statistical profiling)○ Profile with timer○ Profile with PMU
● Using perf with tracing tools○ Profile with ftrace○ Profile with probes○ Profile with CoreSight
● Debugging stories

Profile with ftrace perf can work with ftrace as wrapper to enable function or function_graph tracer for function tracing; the another mode is to enable the tracepoint and statistics trace events:
perf ftrace -a --trace-funcs __kmalloc perf record -e kmem:kmalloc -- sleep 5
Based on ftrace, perf provides advanced tool perf sched to trace and measure scheduling latency. perf sched record -- sleep 1
perf sched latency
# perf sched latency ----------------------------------------------------------------------------------------------------------------- Task | Runtime ms | Switches | Average delay ms | Maximum delay ms | Maximum delay at | ----------------------------------------------------------------------------------------------------------------- kworker/1:1-eve:46 | 0.913 ms | 22 | avg: 0.039 ms | max: 0.043 ms | max at: 5824.869919 s kworker/2:1-eve:44 | 1.542 ms | 42 | avg: 0.038 ms | max: 0.042 ms | max at: 5824.833924 s kworker/3:1-eve:95 | 0.924 ms | 23 | avg: 0.037 ms | max: 0.043 ms | max at: 5824.845919 s kworker/0:1-eve:100 | 0.209 ms | 3 | avg: 0.034 ms | max: 0.043 ms | max at: 5824.881921 s perf:3172 | 4.130 ms | 1 | avg: 0.025 ms | max: 0.025 ms | max at: 5825.800291 s rcu_preempt:10 | 0.035 ms | 5 | avg: 0.020 ms | max: 0.050 ms | max at: 5824.825915 s sleep:3173 | 4.780 ms | 5 | avg: 0.012 ms | max: 0.032 ms | max at: 5825.798935 s ----------------------------------------------------------------------------------------------------------------- TOTAL: | 12.667 ms | 105 | ---------------------------------------------------

Profile with probes Kprobes/Uprobes is dynamic event tracing in kernel and user space app irrespectively, the probes can be added or removed on the fly.
Though we can use Ftrace SysFS node to enable probes, but perf probe is more convenient to enable probes without disassembly and easily connect the tracing with source code for analysis.
perf probe --line command is convenient to check available probes mapping to source code: # perf probe --line "update_min_vruntime" \ -s $KERNEL_SRC
Example for perf probe --line

Profile with probes - cont.perf probe --vars tells available variables at given probe point.
By complying probe syntax we can define probe points with command perf probe --add; in the example it enables probe by specifying function name and relative offset.

Integrate CoreSight with perf CoreSight is a hardware IP which can trace program flow and thus can facilitate hardware assisted tracing and profiling.
To integrate Coresight with the perf framework, CoreSight framework registers Embedded Trace Macrocell (ETM) as a PMU event cs_etm to the perf core; Using perf command to specify a sink to indicate where to record the trace data.
OpenCSD libraries need to be linked with the perf building for CoreSight trace decoding.
http://connect.linaro.org/resource/las16/las16-210/
ETM
Core1 ETM
funnel
ETR
ETF
Core0
perf record -e cs_etm/@826000.etr \ --per-thread ./main
perf report
OpenCSDDecoding

Limitations for CoreSight profiling CoreSight ETM is used to trace program flow for branch instructions, exception and return instructions, etc. So perf tool can decode the Coresight trace data to know the program flow.
CoreSight ETM supports limitation for tracing with perf options, e.g. -k and -u to specify only for kernel space or user space; and support option --filter to specify tracing address range:
perf record -e cs_etm/@826000.etr/k \ --filter 'filter 0xffffff800856bc50/0x60' \ --per-thread ./main
Currently ETM can only support --per-thread mode; when the task is scheduled on the CPU then its ETM is enabled, after the task is scheduled out, the corresponding ETM will be disabled.
perf record -e cs_etm/@826000.etr \ --per-thread ./main
Currently we are working on support for CPU-wide trace scenarios, before this is completed we can manually open all tracing source for all CPUs from SysFS nodes.

Decode trace data with OpenCSD Comparing to general PMU device, CoreSight trace outputs compressed data thus perf cannot directly generate sample based structure.
At the runtime perf saves compressed data into perf file alongside metadata for ETM configure informations. During report the Coresight trace data, perf decodes the trace data to packets and generate synthesize samples. Finally the samples can be used for statistics.
header ... CoreSightmeta data ... CoreSight
trace data ...
perf.data for CoreSight
packetpacketpacketpacket
……
perf reportperf script OpenCSD
IDPID
…...
branch sample
end_addrstart_addr
packet
Decoding
Synthesize samples

Profiling with CoreSightAfter decoding CoreSight trace data, perf tool is straightforward to generate branch samples with branch end address and next start address; so the branch samples can be used for profiling.
# perf record -e cs_etm/@825000.etf/k --filter 'start 0xffffff80089278e8,stop 0xffffff8008928084' \ --per-thread ./timectxsw
# perf report --vmlinux=./userdata/vmlinux# Samples: 328K of event 'instructions:k'# Event count (approx.): 1624347## Children Self Command Shared Object Symbol # ........ ........ ......... ................. ......................# 1.26% 1.26% timectxsw [kernel.kallsyms] [.] 0xffffff80080eb994 0.99% 0.99% timectxsw [kernel.kallsyms] [.] 0xffffff800812ec44 0.91% 0.91% timectxsw [kernel.kallsyms] [.] 0xffffff80080eb9d4 0.89% 0.89% timectxsw [kernel.kallsyms] [.] 0xffffff80080ea8cc
CoreSight works like a normal PMU device mode and output result with commands perf report and perf script.

Post process CoreSight trace data
# perf script -s arm-cs-trace-disasm.py -F cpu,event,ip,addr,sym -- -d objdump -k ./vmlinuxARM CoreSight Trace Data Assembler Dump ffff000008a5f2dc <etm4_enable_hw+0x344>: ffff000008a5f2dc: 340000a0 cbz w0, ffff000008a5f2f0 <etm4_enable_hw+0x358> ffff000008a5f2f0 <etm4_enable_hw+0x358>: ffff000008a5f2f0: f9400260 ldr x0, [x19] ffff000008a5f2f4: d5033f9f dsb sy ffff000008a5f2f8: 913ec000 add x0, x0, #0xfb0 ffff000008a5f2fc: b900001f str wzr, [x0] ffff000008a5f300: f9400bf3 ldr x19, [sp, #16] ffff000008a5f304: a8c27bfd ldp x29, x30, [sp], #32 ffff000008a5f308: d65f03c0 ret
perf script can send the CoreSight sampling stream to python script so utilize python script flexibility to post process trace data, e.g. disassembly with trace data with symbol files to get readable program flow.
Branch sample
end_addr
start_addr
Python script
objdump
vmlinux
packet
packet
……

Agenda● Statistical profiling on Arm platforms
○ Fundamental mechanism (for statistical profiling)○ Profile with timer○ Profile with PMU
● Using perf with tracing tools○ Profile with ftrace○ Profile with probes○ Profile with CoreSight
● Debugging stories

The story - perf works with compiler for optimization
I want to optimize the performance for my program and especially for some small piece codes for algorithm.
Does there have some advanced methods for performance optimization on Arm platform?
● The algorithm code might have complex logic, so it have many branch instructions and dependency when execution.
● Compiler is good at instruction scheduling and reordering at compilation time and it provides options -O3 for static optimization.
● Compiler is absent to know the program execution runtime info, so perf profiling data can be used as feedback by compiler and explore more advanced optimization method.

Bubble sort example code https://gcc.gnu.org/wiki/AutoFDO/Tutorial
#define ARRAY_LEN 30000
void bubble_sort (int *a, int n) { int i, t, s = 1;
while (s) { s = 0; for (i = 1; i < n; i++) { if (a[i] < a[i - 1]) { t = a[i]; a[i] = a[i - 1]; a[i - 1] = t; s = 1; } } }}
7 2 5 4 3
2 5 4 3 7
2 4 3 5 7
……
Optimization with compiler flag -O3
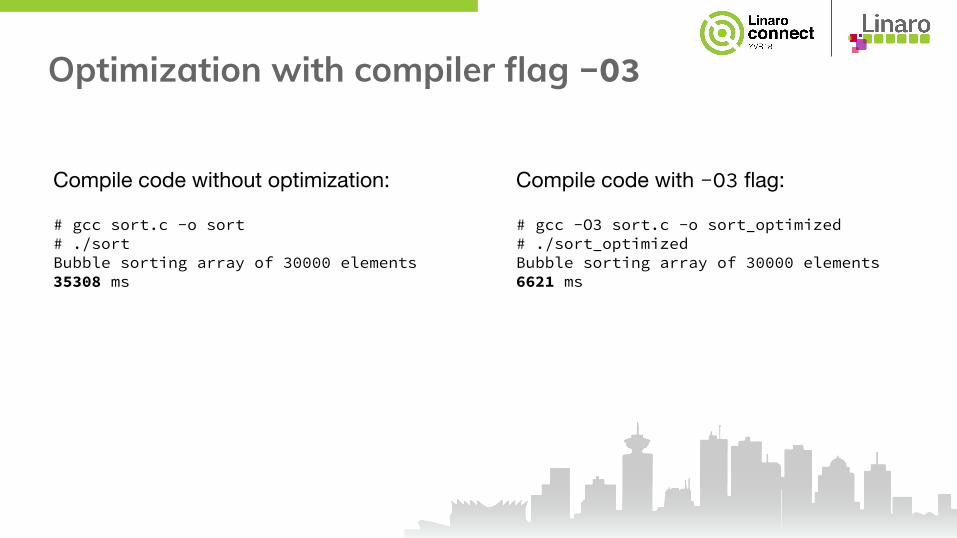
Compile code without optimization:
# gcc sort.c -o sort# ./sortBubble sorting array of 30000 elements35308 ms
Compile code with -O3 flag:
# gcc -O3 sort.c -o sort_optimized# ./sort_optimizedBubble sorting array of 30000 elements6621 ms

Feedback-Directed OptimizationFeedback-Directed Optimization (FDO):
Build an instrumented version of the program for profiling:
# gcc sort.c -o sort_instrumented \ -fprofile-generate
Run the instrumented binary and collect the execution profile:
# ./sort_instrumentedBubble sorting array of 30000 elements45105 ms
Rebuild the program with feedback:
# gcc -O3 sort.c -o sort_fdo \ -fprofile-use=sort.gcda# ./sort_fdo Bubble sorting array of 30000 elements6613 ms
FDO needs the instrumentation build and run with poor performance to generate the training data set, thus this is difficult for applying in production.
Alternatively, the compiler can rely on profiling data at the runtime as feedback, this can avoid instrumentation build.

AutoFDO with perf
Automatic feedback-directed optimization (AutoFDO) is to simplify deployment of FDO by using the sampling of hardware performance monitor.
Since perf can collect the branch related information; the samples can be converted to gcov format training data and at the end this can be used by the compiler for AutoFDO with low overhead.
Instrumented binary
Collection *.gcda
Rebuild binary
FDO
perf profiling Convert to *.gcov
Rebuild binary
perf + AutoFDO

Arm doesn’t have last branch stack records ...Statistical profiling helps identify a particular code block is bottleneck, but it has no idea what the code paths execution to cause the bottleneck.
perf record provides -b for sampling branch stack to log continuously branches, this feature requires hardware support, e.g. Intel CPU last branch records (LBR); this can be used for feedback optimization.
# perf record -b -e cycles:u ./sort # create_gcov --binary=./sort \ --profile=perf.data --gcov=sort.gcov \ -gcov_version=1
Though Arm PMU provides branch statistical profiling, it doesn’t provide branch stack sampling, as result it misses to support -b option for last branch records.
static int armpmu_event_init(struct perf_event *event){ [ ... ]
/* does not support taken branch sampling */ if (has_branch_stack(event)) return -EOPNOTSUPP;
if (armpmu->map_event(event) == -ENOENT) return -ENOENT;
return __hw_perf_event_init(event);}

Inject samples for CoreSight trace data By decoding the branch packets, perf inject can generate instruction samples with N interval with option --itrace=iN. Besides the instruction samples, it also can artificially add last branch stack with option --itrace=ilN.
# perf report --itrace=i100il16 -k ./vmlinux --stdio# Samples: 2K of event 'instructions'# Event count (approx.): 2359## Overhead Command Source Shared Object Source Symbol Target Symbol Basic Block Cycles# ........ ....... .................... ................................. ................................. ..................# 8.82% ls ls [.] 0x0000aaaaaf096d10 [.] 0x0000aaaaaf096d40 - 8.82% ls ls [.] 0x0000aaaaaf096f24 [.] 0x0000aaaaaf096ce8 - 8.82% ls ls [.] 0x0000aaaaaf0971e0 [.] 0x0000aaaaaf096f18 - 8.77% ls ls [.] 0x0000aaaaaf0969e8 [.] 0x0000aaaaaf0971b8 - 8.77% ls ls [.] 0x0000aaaaaf096d6c [.] 0x0000aaaaaf0969d0 -
…...
Branch sample
end_addr
start_addr
…...
Last branch stack sample
Branch stack
…...
Instruction sample
ip
packetpacket
……
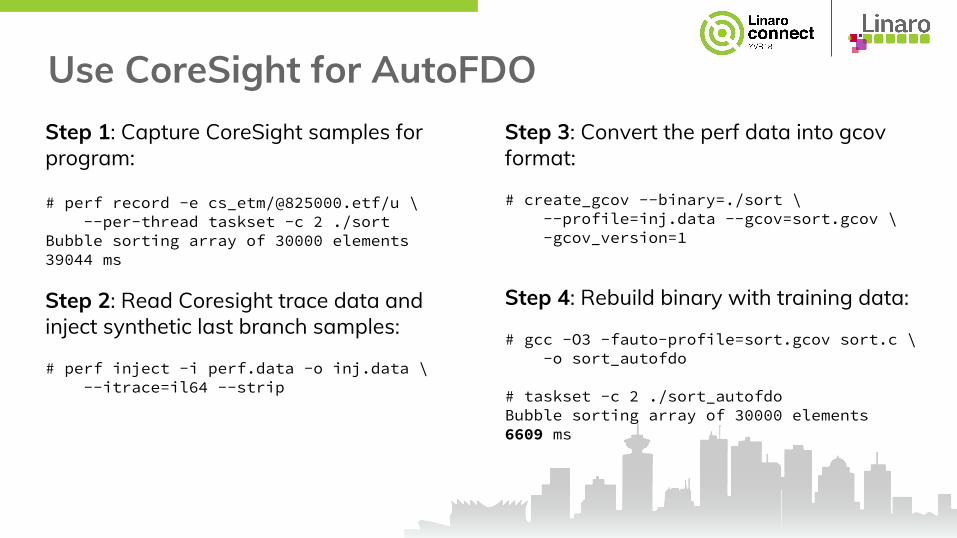
Use CoreSight for AutoFDOStep 1: Capture CoreSight samples for program:
# perf record -e cs_etm/@825000.etf/u \ --per-thread taskset -c 2 ./sortBubble sorting array of 30000 elements39044 ms
Step 2: Read Coresight trace data and inject synthetic last branch samples:
# perf inject -i perf.data -o inj.data \ --itrace=il64 --strip
Step 3: Convert the perf data into gcov format:
# create_gcov --binary=./sort \ --profile=inj.data --gcov=sort.gcov \ -gcov_version=1
Step 4: Rebuild binary with training data:
# gcc -O3 -fauto-profile=sort.gcov sort.c \ -o sort_autofdo
# taskset -c 2 ./sort_autofdoBubble sorting array of 30000 elements6609 ms

Thank YouFor further information: www.linaro.org
This training presentation comes with a lifetime warranty.
All trainees here today can send any questions about today’ssession, at any point in the future, to [email protected] .
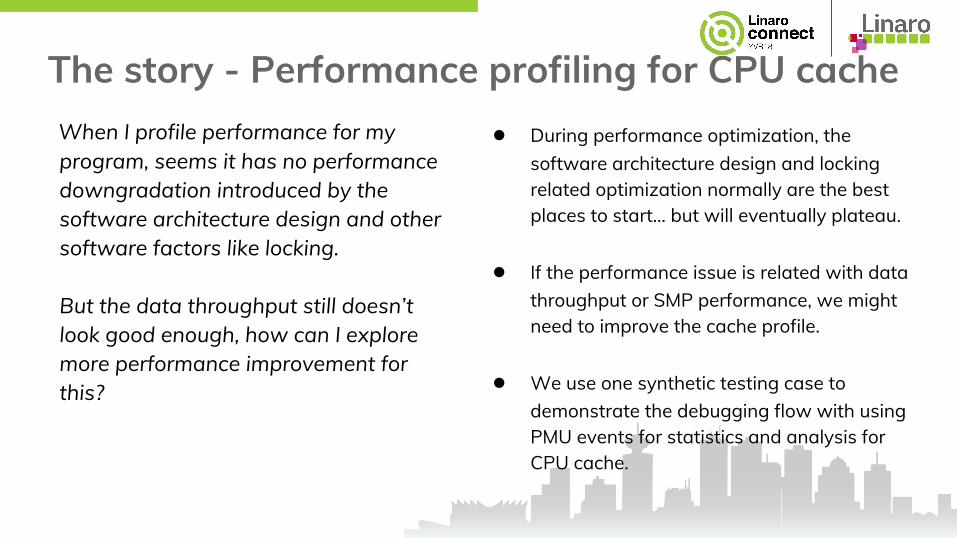
The story - Performance profiling for CPU cache When I profile performance for my program, seems it has no performance downgradation introduced by the software architecture design and other software factors like locking.
But the data throughput still doesn’t look good enough, how can I explore more performance improvement for this?
● During performance optimization, the software architecture design and locking related optimization normally are the best places to start… but will eventually plateau.
● If the performance issue is related with data throughput or SMP performance, we might need to improve the cache profile.
● We use one synthetic testing case to demonstrate the debugging flow with using PMU events for statistics and analysis for CPU cache.

Statistics for cache hardware events
# perf stat -a -e cache-references,cache-misses -- sleep 10
Performance counter stats for 'system wide':
5756626419 cache-references 233027636 cache-misses # 4.048 % of all cache refs
10.004134787 seconds time elapsed
We can use the event ‘cache-references’ to count cache accessing times during the 10 seconds; the event ‘cache-misses’ is used to count cache missing times. The big amount of counting numbers indicate the case has big pressure for cache.
Due the two events are enabled in the same group, their value can be compared and perf reports the ratio for cache missing percentage: 4.048%. This means it’s about one cache missing in average of 25 times cache accessing.

Record and report cache event samples
# perf report --stdio# Samples: 80K of event 'cache-references'# Event count (approx.): 5818036534## Overhead Command Shared Object Symbol # ........ ............... ........................ ...........................................# 54.39% cpu_hl_t1 [kernel.kallsyms] [k] cpu_thread1 45.17% cpu_hl_t2 [kernel.kallsyms] [k] cpu_thread2 0.09% swapper [kernel.kallsyms] [k] _raw_spin_unlock_irqrestore
# Samples: 47K of event 'cache-misses'# Event count (approx.): 220719660## Overhead Command Shared Object Symbol # ........ ............... ........................ ......................................# 99.41% cpu_hl_t1 [kernel.kallsyms] [k] cpu_thread1 0.23% swapper [kernel.kallsyms] [k] _raw_spin_unlock_irqrestore 0.08% cpu_hl_t2 [kernel.kallsyms] [k] cpu_thread2
Step 1: Record perf data for cache miss# perf record -a -e cache-references,cache-misses -- sleep 10
Step 2: Generate report for every eventFrom the ‘cache-references’ samples, it can locate the two threads ‘cpu_thread1’ and ‘cpu_thread2’ are mainly consumers for cache.
From the ‘cache-misses’ samples, it can locate the thread ‘cpu_thread1’ are heavily suffered by cache miss.

Review data structure
static int cpu_thread1(void *data){ unsigned int val;
do { val = shared.a; (void)val; } while(1);
return 0;}
static int cpu_thread2(void *data){ unsigned int val, i = 0;
do { shared.b += i; i++; } while(1);
return 0;}
volatile struct share_struct { unsigned int a; unsigned int b;} shared;
‘cpu_thread1’ and ‘cpu_thread2’ threads access data in the same structure. If these two threads on different CPUs then rely on snooping for cache coherency, ‘cpu_thread1’ will see cache invalidation after data modification by ‘cpu_thread2’, this results in ‘cpu_thread1’ sees many cache missing.

Optimization cache line alignmentvolatile struct share_struct { unsigned int a; unsigned int b ___cacheline_aligned;} shared;
Add attribute ___cacheline_aligned for item b in the structure so can allocate separate cache line for item b.
# perf stat -a -e cache-references,cache-misses -- sleep 10
Performance counter stats for 'system wide':
10669660594 cache-references 833994 cache-misses # 0.008 % of all cache refs
10.008088798 seconds time elapsed
Cache miss percentage decreases from 4.048% to 0.008%.

Aside: Build perf toolMethod 1: Compilation perf on Debian/ARM64 platform
# apt-get install flex bison libelf-dev libaudit-dev libdw-dev libunwind* \ python-dev binutils-dev libnuma-dev libgtk2.0-dev libbfd-dev libelf1 \ libperl-dev libnuma-dev libslang2 libslang2-dev libunwind8 libunwind8-dev \ binutils-multiarch-dev elfutils libiberty-dev libncurses5-dev
# git clone https://github.com/Linaro/OpenCSD # cd OpenCSD/decoder/build/linux/ # make DEBUG=1 LINUX64=1 & make install
# cd $KERNEL_DIR # make VF=1 -C tools/perf/
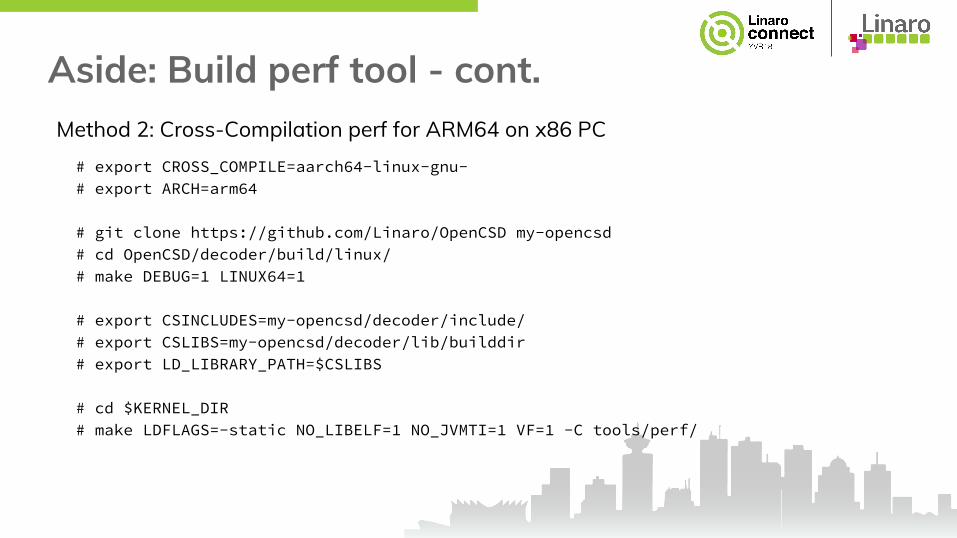
Aside: Build perf tool - cont.Method 2: Cross-Compilation perf for ARM64 on x86 PC
# export CROSS_COMPILE=aarch64-linux-gnu- # export ARCH=arm64
# git clone https://github.com/Linaro/OpenCSD my-opencsd # cd OpenCSD/decoder/build/linux/ # make DEBUG=1 LINUX64=1
# export CSINCLUDES=my-opencsd/decoder/include/ # export CSLIBS=my-opencsd/decoder/lib/builddir # export LD_LIBRARY_PATH=$CSLIBS
# cd $KERNEL_DIR # make LDFLAGS=-static NO_LIBELF=1 NO_JVMTI=1 VF=1 -C tools/perf/