Embed Size (px)
Citation preview


Using Mortality to Comparethe Health of Populations
by James W. Vaupel
Max Planck Institute for Demographic Research, Rostock, Germany,
University of Southern Denmark, Odense, Denmark
Mortality Past and Present: Celebrating Graunt
Gresham College, London 29 November 2012

10/33
Age
The Postponement of Senescence: Evidence from Sweden
Data Source: Calculations based on Human Mortality Database by Elisabetta Barbi and Giancarlo Camarda (unpublished)
30 40 50 60 70 80 90
0.0001
0.001
0.01
0.1
11950
1980
2010
57 6863
Swedish FemalesAge 30-90
Ris
k o
f D
eath

11/33
Age
Equivalent Age 50 Years Ago
Female Male
France Sweden
USA Japan France Sweden
USA Japan
50 42 40 44 23 44 43 44 39
60 49 52 53 43 51 53 51 50
70 59 62 63 53 59 62 60 57
80 71 72 74 67 71 73 73 70
90 83 85 85 79 84 87 85 81
Current age and age of equivalent mortality 50 years ago.

Old age and advanced old age, for France

The duration of advanced old age for females and males in various countries
Females Malese(X10)
1960
e(X10)
recent
e(X10)
1960
e(X10)
recent
UK 6.0 5.9 6.3 6.1
France 5.9 5.7 6.1 5.7
USA 6.1 5.7 6.3 5.9
Japan 6.1 5.7 6.2 6.0
Russia 6.8 6.0 7.1 6.7
Belarus 6.7 5.9 6.4 6.6


Equivalent ages from 1900 to present in France (solid) and Sweden (dashed) for q(x)=1%, e(x)=20, ecohort(x)=20.

Equivalent ages,1950 to present in Japan.q(x)=0.1% in red, e(x)=40 in blue, ec(x)=40 in purple

Equivalent ages,1950 to the present in France.
Top: q(x)=1% (red), e(x)=20 (blue) and ec(x)=20 (purple). Bottom: q(x)=0.1% and e(x)=ec(x)=40.

Equivalent ages,1950 to present for women in Japan (solid) vs. the U.S. (dashed), for q(x)=1%, e(x)=ec(x)=20

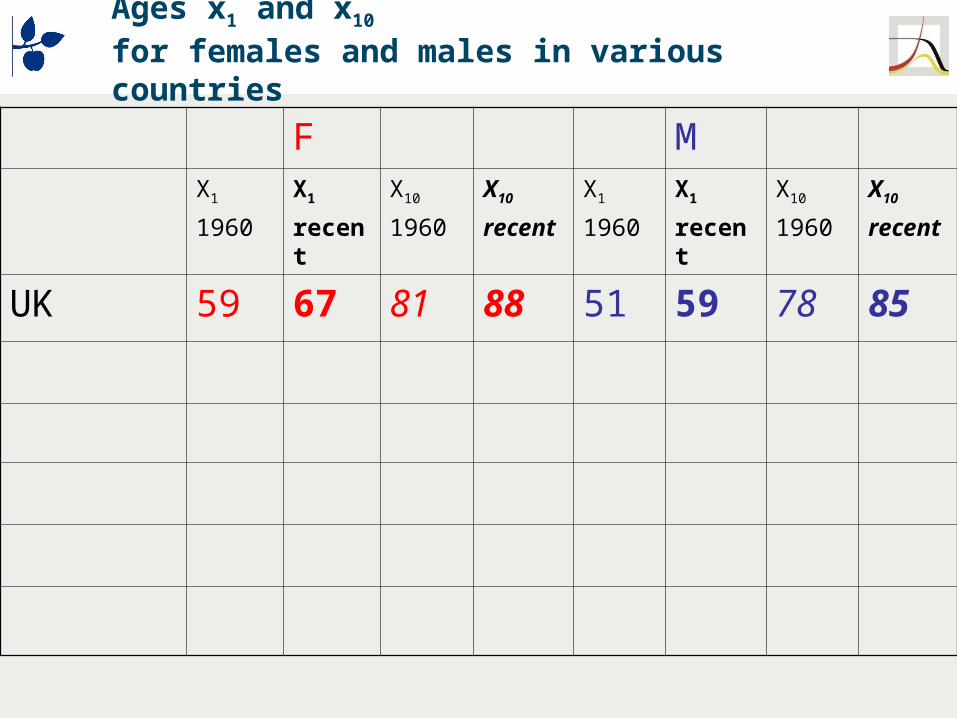
Ages x1 and x10 for females and males in various countries
F MX1
1960
X1
recent
X10
1960
X10
recent
X1
1960
X1
recent
X10
1960
X10
recent
UK 59 81 51 78
Ages x1 and x10 for females and males in various countries
F MX1
1960
X1
recent
X10
1960
X10
recent
X1
1960
X1
recent
X10
1960
X10
recent
UK 59 67 81 88 51 59 78 85

Ages x1 and x10 for females and males in various countries
F MX1
1960
X1
recent
X10
1960
X10
recent
X1
1960
X1
recent
X10
1960
X10
recent
UK 59 67 81 88 51 59 78 85
France 59 81 51 78

Ages x1 and x10 for females and males in various countries
F MX1
1960
X1
recent
X10
1960
X10
recent
X1
1960
X1
recent
X10
1960
X10
recent
UK 59 67 81 88 51 59 78 85
France 59 71 81 88 51 59 78 88

Ages x1 and x10 for females and males in various countries
F MX1
1960
X1
recent
X10
1960
X10
recent
X1
1960
X1
recent
X10
1960
X10
recent
UK 59 67 81 88 51 59 78 85
France 59 71 81 88 51 59 78 88
USA 58 82 50 79

Ages x1 and x10 for females and males in various countries
F MX1
1960
X1
recent
X10
1960
X10
recent
X1
1960
X1
recent
X10
1960
X10
recent
UK 59 67 81 88 51 59 78 85
France 59 71 81 88 51 59 78 88
USA 58 64 82 88 50 58 79 85

Ages x1 and x10 for females and males in various countries
F MX1
1960
X1
recent
X10
1960
X10
recent
X1
1960
X1
recent
X10
1960
X10
recent
UK 59 67 81 88 51 59 78 85
France 59 71 81 88 51 59 78 88
USA 58 64 82 88 50 58 79 85
Japan 57 79 52 76

Ages x1 and x10 for females and males in various countries
F MX1
1960
X1
recent
X10
1960
X10
recent
X1
1960
X1
recent
X10
1960
X10
recent
UK 59 67 81 88 51 59 78 85
France 59 71 81 88 51 59 78 88
USA 58 64 82 88 50 58 79 85
Japan 57 72 79 90 52 62 76 86

Ages x1 and x10 for females and males in various countries
F MX1
1960
X1
recent
X10
1960
X10
recent
X1
1960
X1
recent
X10
1960
X10
recent
UK 59 67 81 88 51 59 78 85
France 59 71 81 88 51 59 78 88
USA 58 64 82 88 50 58 79 85
Japan 57 72 79 90 52 62 76 86
Russia 58 82 50 78

Ages x1 and x10 for females and males in various countries
F MX1
1960
X1
recent
X10
1960
X10
recent
X1
1960
X1
recent
X10
1960
X10
recent
UK 59 67 81 88 51 59 78 85
France 59 71 81 88 51 59 78 88
USA 58 64 82 88 50 58 79 85
Japan 57 72 79 90 52 62 76 86
Russia 58 58 82 82 50 43 78 78

Ages x1 and x10 for females and males in various countries
F MX1
1960
X1
recent
X10
1960
X10
recent
X1
1960
X1
recent
X10
1960
X10
recent
UK 59 67 81 88 51 59 78 85
France 59 71 81 88 51 59 78 88
USA 58 64 82 88 50 58 79 85
Japan 57 72 79 90 52 62 76 86
Russia 58 58 82 82 50 43 78 78
Belarus 60 86 54 82

Ages x1 and x10 for females and males in various countries
F MX1
1960
X1
recent
X10
1960
X10
recent
X1
1960
X1
recent
X10
1960
X10
recent
UK 59 67 81 88 51 59 78 85
France 59 71 81 88 51 59 78 88
USA 58 64 82 88 50 58 79 85
Japan 57 72 79 90 52 62 76 86
Russia 58 58 82 82 50 43 78 78
Belarus 60 58 86 83 54 43 82 77

Grip Strength at x1 and x10

Normalized physical weakness for females(based on grip strength)

Normalized measures of health for males and females in the EU and in the US

Comparative baseline:gauging mortality reduction
0 20 40 60 80
0.0
00
10
.00
10
.01
0.1
1
Hunter-gatherersHunter-gatherer, lowest mortality
Age
An
nu
al p
rob
ab
ility
of d
ea
th
Mostly flatish
Hunter-gatherer data: Gurven and Kaplan 2007
Siler fits
average of 5 populations of full time foragers
This average is the comparative evolutionary baseline
-lowest mortality

Comparative baseline:gauging mortality reduction
0 20 40 60 80
0.0
00
10
.00
10
.01
0.1
1
Hunter-gatherersHunter-gatherer, lowest mortalitySweden, 1750-2010, 10 yr intervals
Age
An
nu
al p
rob
ab
ility
of d
ea
th
Hunter-gatherersHunter-gatherer, lowest mortalitySweden, 1750-2010, 10 yr intervals
(Human mortality database)
Pile up-lowest mortality
How much should we expect?

Equivalent age:72 is the new 30
0 20 40 60 80 100
020
4060
8010
0
30
72
6080
15
63
30
71
Hunter-gatherer age
Equ
ival
ent a
ge
(Burger et al. 2012)
0 20 40 60 80 100
0.00
001
0.00
010.
001
0.01
0.1
1
Japan 2010Japan 1947Sweden 2010Sweden 1900Sweden 1800hunter-gathererAcculturated h-gsTrinidad slaves Wild chimpsCaptive chimps
Age
Ann
ual p
roba
bilit
y of
dea
th

Ratio improvement:Population distance > species distance
0 20 40 60 80
12
510
2050
100
200
Hunter-gatherers to Japan 2010
Wild chimps to hunter-gatherers
Hunter-gatherers to Sweden2010
1950
1900
Age
Rat
io o
f mor
talit
y ris
ks
NOTE: Human hunter-gatherers have exceptionally low mortality

Lowest mortality across the lifespan
1750 1800 1850 1900 1950 2000
Year
Min
imu
m p
rob
ab
ility
of d
ea
th a
cro
ss th
e li
fetim
e
SwedenFranceJapan
Hunter-gatherer
0.0
00
10
.00
10
.01
0.1
~6.6 million years
~150 years
1750 1800 1850 1900 1950 2000
Year
Min
imu
m p
rob
ab
ility
of d
ea
th a
cro
ss th
e li
fetim
e
SwedenFranceJapan
Hunter-gatherer
Chimpanzee
Acculturated HG
0.0
00
10
.00
10
.01
0.1
(Burger et al. 2012)