Embed Size (px)
Citation preview

USING LMI DATA TO INFORM STRATEGY

Analyzed
• Labor Market Information –Industry & Occupation Growth, Job Openings
• Training Programs –Training Offered by CSCF, Participant Completion & Employment Outcomes
• Average Costs of Training
Learned
• Trained Career Seekers Were Gaining Employment but Not Necessarily Related to the Training
• Limited Alignment of Trained Talent Ready to Meet Industry Needs
• No Method of Tracking Financial Investment to Understand Impact
HOW DID WE START?C a r e e r S o u r c e C e n t r a l F l o r i d a Th r e e Ye a r An a l ys i s

CSCF STRATEGIC PRIORITY
30
0
50
0
50
0
57
025
0
25
0
25
0
25
0
31
5
31
5
25
0
25
0
✓ $10.3M Investment In Training Services; 2,000 Career Seekers Employed in HGIs at an Average Wage of $15/hr.
$2.5M $2.5M
$1.325M $1.325M $1.325M$1.3M
$2.9M
$1.325M
$1.725M $1.725M
$0
$500,000
$1,000,000
$1,500,000
$2,000,000
$2,500,000
$3,000,000
$3,500,000
Construction Healthcare AdvancedManufacturing
IT/Finance Hospitality Trade, Logistics,Utilities
Previous Annual Goal
30
0
50
0
50
0
57
025
0
25
0
25
0
25
0
31
5
31
5
25
0
25
0
IMPACT MODEL
Adjusted Training Investment Model Approved By Board, December 2018

LABOR MARKET INFORMATION TO INFORM STRATEGY
• Created a Scorecard to Communicate, Track and Manage Strategic Priorities
• Aligned Business Outreach Strategies to the High Growth Industries; Resulting In New Industry Mix
• Engaged High Growth Industry Leaders and Businesses to Identify New Talent Development Strategies
• Utilized State Skills Gap Report to Support Discussion with Industry Leaders

• Current High Growth Industries Will Continue to Grow in Orlando, The Villages MSAs
• Greatest Growth Projected in Construction (21%) & Healthcare (20%)
• Smallest Gains in Utilities (3%)
INDUSTRY GROWTH: 2018 – 2026
0%
5%
10%
15%
20%
25%
0
5,000
10,000
15,000
20,000
25,000
30,000
Per
cen
t o
f G
row
th
Nu
mb
er o
f Jo
bs
2018 - 2026 Change 2018 - 2026 % Change
Source: EMSI, FL Department of Economic Opportunity
W h e r e Ar e We G o i n g ?

• All Occupations Projected to Grow By 13%
• Top 15 Occupational Groups Align High Growth Industries
• Overall Average Hourly Wage of All Occupations $20.97
OCCUPATIONAL GROWTH: 2018-2026
Description 2018 Jobs 2026 Jobs2018 - 2026 %
Change
Median Hourly
Earnings
Avg. Hourly
Earnings
Healthcare Support Occupations 32,800 39,536 21% $13.40 $14.84
Construction and Extraction Occupations 66,544 79,512 19% $16.59 $18.37
Computer and Mathematical Occupations 34,040 40,643 19% $35.44 $37.80
Healthcare Practitioners and Technical
Occupations67,491 80,296 19% $28.74 $37.33
Education, Training, and Library Occupations 61,408 72,910 19% $20.71 $23.15
Architecture and Engineering Occupations 17,234 20,115 17% $32.49 $36.11
Community and Social Service Occupations 17,806 20,712 16% $18.79 $20.07
Management Occupations 59,375 68,812 16% $41.86 $49.93
Business and Financial Operations
Occupations70,479 80,810 15% $28.32 $32.53
Personal Care and Service Occupations 57,816 66,224 15% $10.74 $12.13
Food Preparation and Serving Related
Occupations159,623 182,013 14% $10.49 $12.90
Transportation and Material Moving Occupations 85,450 97,003 14% $14.01 $17.23
Protective Service Occupations 33,397 37,421 12% $15.07 $17.70
Building and Grounds Cleaning and
Maintenance Occupations72,717 81,434 12% $11.23 $12.04
Installation, Maintenance, and Repair
Occupations52,369 58,542 12% $18.29 $20.32
*Bold indicates current occupations CSCF
provides training
W h e r e Ar e We G o i n g ?
Source: EMSI, FL Department of Economic Opportunity

MOVING FORWARD
CONTINUE
• Investment Strategy to Target High Growth Industries
• Analyzing Board Strategic Goals, Economic and Labor Market Trends
2 0 1 9 - 2 0 2 0 S t r a t e g y
ENHANCEMENTS
• Develop New Action Plans for Talent Development
• Intentionally Create Strategies for Staff to Cultivate Middle Career Focus
• Set Targets for Business Engagement and Services
• Develop Additional Key Performance Metrics to Monitor Placement Timeframe (Training Completed to Gaining Employment)

New Data for Measuring Non-Degree, Professional Credentials
Jaleel Reed
Center for Regional Economic Competitiveness
LMI Institute
Arlington, VA
8

LMI Institute: About Us
• A resource for supporting the development, interpretation, and use of labor market information
• Providing support and promoting the production and use of high-quality workforce and employment information
• Membership organization
9

Context
• Pilot project, 2015 estimates for California
• Compare to U.S. Averages
• Estimates for all 50 states, plus D.C.
• Annual monthly average, pooled over three years (2016-19)
• Demographics (race, sex, educational attainment)
• Industry and occupational groups
• Prevalence, employment rates, wages
10

History
Interagency Working Group on Expanded Measures of Enrollment and Attainment (GEMEnA)
• Formed 2009, continued to 2016
• Developed questions to better understand the landscape and labor market impact of nondegree credentials
• Proposed questions to BLS Technical Advisory Committee
• Added questions to Current Population Survey --Monthly National Survey ~60,000 households
11

What would we like to know?
• What proportion of workers hold a certification or license?
• Are professional credentials concentrated in particular industries and occupations?
• How are labor market outcomes (employment, earnings) impacted by credentials?
12

Value of Credential Data
Understand training
needs and areas for
curriculum improvement
Learn current occupational
supply
Career planning & preparation
Improve targeted outreach efforts to partners
13

The Data
• 12 tables • Table 1. Certification and licensing status of the civilian non-institutional population
• Table 2. Employment status of the civilian non-institutional population by certification and licensing status and selected characteristics
• Table 3. Certification and licensing status of employed persons 16 years and over by selected characteristics
• Table 4. Certification and licensing status of the employed by industry and class of worker
• Table 5. Certification and licensing status of the employed by occupation
• Table 6. Median weekly earnings of full-time wage and salary workers by certification and licensing status and selected characteristics
• Table 7. Median weekly earnings of full-time wage and salary workers by certification and licensing status and occupation
• Table 8. Unemployment rates and median weekly earnings by occupational groups, educational attainment and certification and licensing status
• Table 9. Unemployment Rates and Median Weekly Earnings by Age Group, Educational Attainment and Certification and Licensing Status
• Table 10. Unemployment Rates and Median Weekly Earnings by Race and Hispanic Origin, Educational Attainment and Certification and Licensing Status
• Table 11. Unemployment Rates and Median Weekly Earnings by Sex and Educational Attainment
• Table 12. Median weekly earnings of full-time wage and salary workers by certification and licensing status and major industry
14

The Data Cont
15

State Summary Results
Certification/Licensure Rates by Occupation Group,2015
16

State Summary ResultsFigure 2: Certification/licensure rates by major Industry Sector, California and the U.S., 2015 annual averages. Source: Bureau of Labor Statistics.
Certification/Licensure Rates by Industry Sector,2015
17

State Summary Results
18

State Summary Results
19

Benchmarking
• Possible to use CPS data to measure attainment of program goals
• Could be broken down by sub-populations of interest, given sample limitations
20

Accessing the State Certifications and Licenses Data Tables• The state tables are available to LMI Institute Members at the
following levels:• Research Professional Members: Access to the national data file
• Organizational Members: Access to the national data file and the file for their local state
• Premium Organizational Members: Access to the national data file, as well as all 50 individual state files
• More information about membership can be found here (http://www.lmiontheweb.org/WhatWeDo/state-certs-and-licenses/)
21

Thank you!
Questions?
Program Manager
Jaleel Reed
703.522.4980 x2002
22

Using Certifications and Licenses Data to Inform Decision-Making
23

.
Certifications and Labor Market Status
24

.
25
Data Tool

.
Certifications by Industry
26

27
Occupational Licensing
Source: Current Population Survey, calculations by The Council for Community and Economic Research.

28
Licensed Workers Have Better Labor Market Outcomes
Source: Current Population Survey, calculations by The Council for Community and Economic Research.
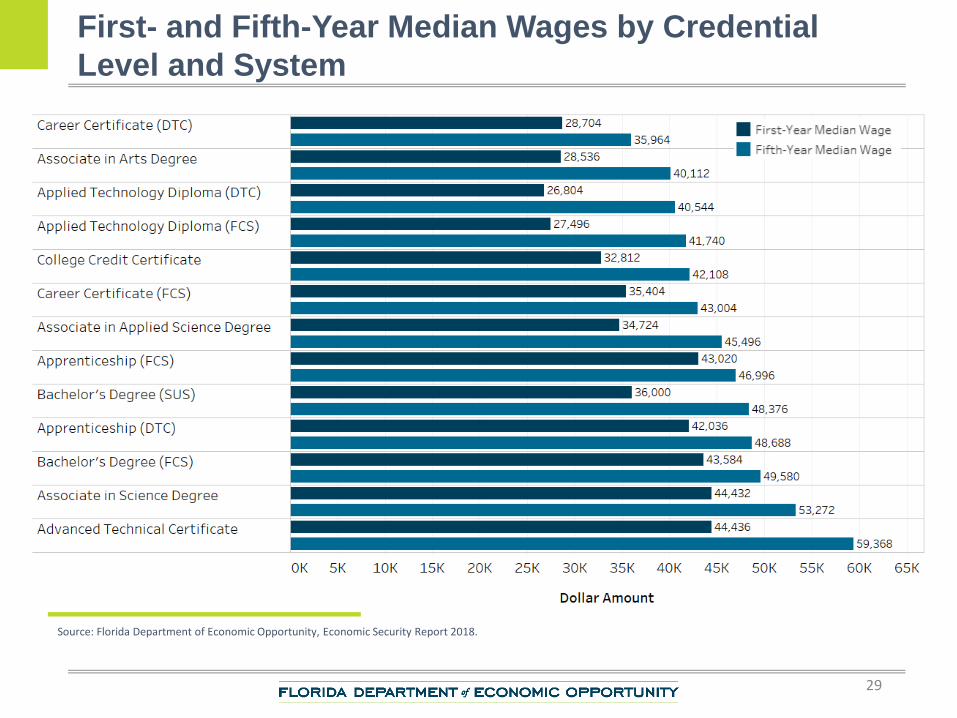
First- and Fifth-Year Median Wages by Credential
Level and System
Source: Florida Department of Economic Opportunity, Economic Security Report 2018.
29

30
Source: Skills Gap and Job Vacancy Survey, Florida Department of Economic Opportunity, Bureau of Labor Market Statistics
http://lmsresources.labormarketinfo.com/skills_gap

Job Vacancies by Industry and Occupation
31

Vacancy Characteristics - Statewide
32
Employers were asked to provide detailed
requirements for each job vacancy.

Skills Gap and Job Vacancy Survey
33
Source: Skills Gap and Job Vacancy Survey, Florida Department of Economic Opportunity, Bureau of Labor Market Statistics

Skills Gap and Job Vacancy Survey
34

Skills Gap and Job Vacancy Survey
35

Thank You.
Contact Information
DEO Bureau of Workforce Statistics and Economic Research
Adrienne Johnston: 850-245-7257
If you have questions or comments about this presentation or need to
discuss a future project; please contact Adrienne Johnston.
Visit: floridajobs.org/workforce-statistics
36


![~V4 ffi~~~~~@ti~T~ ~~~~~(g~ ©©lMi]lMi]~[M[Q) …](https://img.dokumen.tips/doc/110x75/61cc5ca722583c59e2144e35/v4-ffitit-g-lmilmimq-.jpg)