Embed Size (px)
Citation preview

2013 BC Silviculture
Labour Market Information (LMI) and Training Needs
Report
Funding provided through the Canada-British Columbia Labour Market Development Agreement

Page 2 of 170
Prepared by:
Dialogue Research
#21 Dallas Rd
Victoria, British Columbia, Canada, V8V 4Z9
http://www.dialogueresearch.com/directions
March 31, 2014
Page 3 of 170
Contents List of Tables ................................................................................................................................................ 6
Acknowledgements ................................................................................................................................... 11 Background ................................................................................................................................................ 12
Executive Summary ................................................................................................................................... 13 Structure of Report .................................................................................................................................... 19 Methodology ............................................................................................................................................. 20
1. Instrumentation ......................................................................................................................... 20
2. Sampling .................................................................................................................................... 20
3. Incentives ................................................................................................................................... 23
4. Sample Management ................................................................................................................. 24
5. Data Cleaning Notes ................................................................................................................... 24
6. Data Reporting Notes ................................................................................................................. 24
Section 1 Workforce Supply and Demand ................................................................................................. 27 A. EMPLOYMENT ................................................................................................................................ 28
1. Survey Based Employment Estimates ........................................................................................ 28
2. Employment of Field Workers and Crew Bosses ....................................................................... 28
3. Field Workers By Types of Activity ............................................................................................. 29
B. EMPLOYMENT PRODUCTION STANDARDS .................................................................................... 29
1. Tree Planting .............................................................................................................................. 29
2. Brushing and Spacing ................................................................................................................. 31
3. Wildfire Fighting ......................................................................................................................... 35
C. ESTIMATED BC SILVICULTURE WORKFORCE .................................................................................. 37
1. Approach #1 – Using Provincial Production Data ...................................................................... 37
2. Approach #2 – Extrapolation Based on Coverage Rates by Size of Employer ............................ 38
D. BC SILVICULTURE WORKFORCE DEMAND DRIVERS AND OUTLOOK .............................................. 39
1. Tree Planting .............................................................................................................................. 39
2. Brushing and Spacing ................................................................................................................. 40
3. Wildfire Fighting ......................................................................................................................... 41
E. HISTORICAL WORKFORCE SUPPLY ................................................................................................. 41
Section 2 Employee Profile (Respondents) ................................................................................................ 43 F. DEMOGRAPHICS ............................................................................................................................ 44
1. Age ............................................................................................................................................. 44
2. Gender ....................................................................................................................................... 44
3. Educational Status ..................................................................................................................... 45

Page 4 of 170
4. First Nations Status .................................................................................................................... 46
G. CAREER HISTORY ............................................................................................................................ 47
1. Total Years of Experience ........................................................................................................... 47
2. Years of Experience by Type Worker ......................................................................................... 47
3. Employer History ....................................................................................................................... 48
H. 2013 EXPERIENCE ........................................................................................................................... 49
1. Roles and Responsibilities .......................................................................................................... 49
2. Subsector Activity ...................................................................................................................... 54
3. Locations Worked ...................................................................................................................... 54
4. Accommodations and Camp Services ........................................................................................ 56
5. Employer History 2013 ............................................................................................................... 58
6. Employee Injuries ...................................................................................................................... 59
7. Income ....................................................................................................................................... 60
8. Technology Access ..................................................................................................................... 65
Section 3 Employer Profile (Respondents) ................................................................................................ 67 1. Employer Population ................................................................................................................. 68
I. CORPORATE INFORMATION .......................................................................................................... 68
1. Activity by Subsector .................................................................................................................. 68
2. Years of Operation in Silviculture .............................................................................................. 69
3. Revenues By Sector .................................................................................................................... 69
4. Revenues By Type of Client ........................................................................................................ 69
5. Revenues By Activity .................................................................................................................. 71
6. Revenues By Region ................................................................................................................... 72
7. Operations -‐ BC Regions ............................................................................................................. 72
8. Incorporated versus Unincorporated ........................................................................................ 73
9. Number of Operated Businesses ............................................................................................... 74
10. Employer Years of Experience ................................................................................................ 75
11. Employer Roles and Responsibilities ...................................................................................... 75
J. WORKFORCE .................................................................................................................................. 76
1. Crew Sizes .................................................................................................................................. 76
2. Diversity of Workers .................................................................................................................. 76
K. OPINIONS AND OUTLOOK .............................................................................................................. 76
1. 2013 Revenue ............................................................................................................................ 76
2. Future Revenue .......................................................................................................................... 77
3. Future Expenditures by Customers ............................................................................................ 78
Page 5 of 170
4. Business Operations Outlook ..................................................................................................... 79
5. Expansion Plans ......................................................................................................................... 80
6. Fate of Operations ..................................................................................................................... 80
7. Reasons for Exit .......................................................................................................................... 81
8. Sector Associations .................................................................................................................... 82
Section 4 Recruitment & Retention Findings ............................................................................................. 83 L. RECRUITMENT PRIORITIES ............................................................................................................. 84
M. CURRENT PRACTICES ..................................................................................................................... 85
1. Employer Recruitment and Evaluation ...................................................................................... 85
2. Employee Entrance to Sector ..................................................................................................... 89
3. Employee Exit from Sector ......................................................................................................... 90
4. Employer Support to Employees ............................................................................................... 93
N. KEY DRIVER ANALYSIS .................................................................................................................... 94
1. Key Driver Analysis – Willingness to Recommend Employer ..................................................... 98
O. DERIVED VERSUS STATED IMPORTANCE ..................................................................................... 100
1. Action Areas to Improve Employee Workday Experience. ...................................................... 100
P. TRAINING ..................................................................................................................................... 103
1. About employee training ......................................................................................................... 103
Q. GENERAL FINDINGS ...................................................................................................................... 104
1. Employer’s Perspective on their Workforce ............................................................................ 104
2. Workforce Social Network ....................................................................................................... 105
Appendix 1 – Personality Assessments (GRIT) ......................................................................................... 106 Appendix 2 – Why workers enter/exit sector (summary) ........................................................................ 107 Appendix 3 – Employee Survey ................................................................................................................ 109
Appendix 4 – Employee Quality Assurance Survey .................................................................................. 133 Appendix 5 – Employer Initial Survey Invite ............................................................................................ 137 Appendix 6 – Employer Survey ................................................................................................................ 138
Appendix 7– Accuracy of BCFSC SAFE Companies Classifications ............................................................ 170

Page 6 of 170
List of Tables
TABLE 1: SAMPLE FRAME LIST COUNTS BASED ON BCFSC SAFE COMPANIES CERTIFICATION PROFILES 21 TABLE 2: SURVEY PAGE DROP OFF 23 TABLE 3: AVERAGE NUMBER OF EMPLOYEES, BC, 2013 28 TABLE 5: FIELD WORKER EFFORT BY ACTIVITY, BC, 2013 29 TABLE 6: TREE PLANTING ACTIVITIES: EMPLOYER SURVEY, BC, 2013 29 TABLE 7: TREE PLANTING ACTIVITY BY MONTHS ACTIVE, BC, 2013 30 TABLE 8: TREE PLANTING IN BC, 2008/09 TO 2012/13 30 TABLE 9: TREE PLANTING ACTIVITIES: BC INDUSTRY OVERALL, 2012/2013 31 TABLE 10: BRUSHING AND SPACING ACTIVITIES (EMPLOYER SURVEY), BC, 2013 31 TABLE 11: BRUSHING AND SPACING ACTIVITY BY MONTHS ACTIVE, BC, 2013 32 TABLE 12: BRUSHING ACTIVITIES (EMPLOYER SURVEY), BC, 2013 33 TABLE 13: BRUSHING ACTIVITIES IN BC, 2008/09 TO 2012/13 33 TABLE 14: BRUSHING ACTIVITIES: BC INDUSTRY OVERALL, 2012/13 33 TABLE 15: SPACING ACTIVITIES (EMPLOYER SURVEY), BC, 2013 34 TABLE 16: JUVENILE SPACING ACTIVITIES IN BC, 2008/09 TO 2012/13 34 TABLE 17: SPACING ACTIVITIES: BC INDUSTRY OVERALL, 2013 35 TABLE 18: WILDFIRE FIGHTING ACTIVITIES (EMPLOYER SURVEY), BC, 2013 35 TABLE 19: WILDFIRE FIGHTING ACTIVITY BY MONTHS ACTIVE, BC, 2013 36 TABLE 20: NUMBER, HECTARES, AND COST OF FOREST FIRES FOUGHT IN BC, 2005-‐2012 36 TABLE 21: APPROACH #1: BASED ON PROVINCIAL PRODUCTION DATA 37 TABLE 22: ESTIMATE COVERAGE OF THE TREE PLANTING, BRUSHING AND SPACING SUB-‐SECTORS 38 TABLE 23: APPROACH #2: PROJECTIONS BASED ON EMPLOYER POPULATION LISTS 39 TABLE 24: HISTORICAL SILVICULTURE WORKFORCE SUPPLY, 2008/09 TO 2012/13 42 TABLE 25: AGE OF WORKER 44 TABLE 26: AGE GROUPS 44 TABLE 27: GENDER 44 TABLE 28: EMPLOYEE REGISTERED IN EDUCATIONAL ACTIVITY 45 TABLE 29: ENROLLED EMPLOYEES -‐ TYPE OF EDUCATIONAL ACTIVITY 45 TABLE 30: ENROLLED EMPLOYEES – YEARS LEFT IN PROGRAM 46 TABLE 31: EMPLOYEES – FIRST NATIONS 46 TABLE 32: FIRST NATIONS – BAND MEMBERSHIP 46 TABLE 33: YEARS OF EXPERIENCE 47 TABLE 34: YEARS OF EXPERIENCE BY TYPE RESPONSIBILITY – FIELD WORKER 47 TABLE 35: YEARS OF EXPERIENCE BY TYPE RESPONSIBILITY – LEAD HAND 47 TABLE 36: YEARS OF EXPERIENCE BY TYPE RESPONSIBILITY – SUPERVISION OR CREW BOSS 47 TABLE 37: YEARS OF EXPERIENCE BY TYPE RESPONSIBILITY – PROJECT MANAGER 48 TABLE 38: NUMBER OF EMPLOYERS DURING CAREER 48 TABLE 39: TRANSIENT EMPLOYEE 48 TABLE 40: ROLES AND RESPONSIBILITIES – ALL SILVICULTURE EMPLOYEES 49 TABLE 41: COUNT OF POSITIONS -‐ ALL SILVICULTURE EMPLOYEES 49 TABLE 42: ROLES AND RESPONSIBILITIES – LEAD HAND 49 TABLE 43: COUNT OF POSITIONS – LEAD HAND 50 TABLE 44: ROLES AND RESPONSIBILITIES – LEAD HAND 50

Page 7 of 170
TABLE 45: COUNT OF POSITIONS – LEAD HAND 50 TABLE 46: ROLES AND RESPONSIBILITIES – SUPERVISOR OR CREW BOSS 51 TABLE 47: COUNT OF POSITIONS – SUPERVISOR OR CREW BOSS 51 TABLE 48: ROLES AND RESPONSIBILITIES – PROJECT MANAGER 51 TABLE 49: COUNT OF POSITIONS – PROJECT MANAGER 51 TABLE 50: TREE PLANTERS: SUBSECTORS WORKED IN 52 TABLE 51: TREE PLANTERS: POSITIONS HELD 52 TABLE 52: BRUSHING & SPACING EMPLOYEES: SUBSECTORS WORKED IN 52 TABLE 53: BRUSHING & SPACING: POSITIONS WORKED IN 53 TABLE 54: WILDFIRE FIGHTING EMPLOYEES: SUBSECTORS WORKED IN 53 TABLE 55: WILDFIRE FIGHTING: POSITIONS WORKED IN 53 TABLE 56: EMPLOYEE SUBSECTOR ACTIVITY 54 TABLE 57: NUMBER OF SUBSECTORS WORKED IN BY AN SILVICULTURE EMPLOYEE 54 TABLE 58: WORK PROVINCE -‐ ALL SILVICULTURE EMPLOYEES 54 TABLE 59: NUMBER OF BC REGIONS WORKED IN 2013 55 TABLE 60: WORK REGION -‐ BC 55 TABLE 61: NUMBER OF BC REGIONS WORKED IN 55 TABLE 62: TOTAL NUMBER OF LOCATIONS STAYED AT 56 TABLE 63: NUMBER OF LOCATIONS CORRELATION WITH… 56 TABLE 64: TYPE ACCOMMODATION 56 TABLE 65: TYPES OF ACCOMMODATIONS CORRELATION WITH… 57 TABLE 66: LENGTH OF STAY AT CAMPS 57 TABLE 67: LENGTH OF STAY AT HOTELS 57 TABLE 68: LENGTH OF STAY AT HOUSE RENTALS 57 TABLE 69: CAMP INTERNET ACCESS 58 TABLE 70: CAMP CELL PHONE COVERAGE 58 TABLE 71: NUMBER OF 2013 EMPLOYERS 58 TABLE 72: DURATION WITH EMPLOYER 2013 58 TABLE 73: NUMBER OF 2013 EMPLOYERS CORRELATION WITH YEARS LEFT IN CAREER 59 TABLE 74: DAYS MISSED DUE TO INJURY 59 TABLE 75: EMPLOYEE TYPE INJURY 59 TABLE 76: EMPLOYEE TYPE INJURY 60 TABLE 77: PAYMENT METHODS -‐ ALL SILVICULTURE EMPLOYEES 60 TABLE 78: PAYMENT METHODS BY TYPE POSITION 60 TABLE 79: SILVICULTURE INCOME 61 TABLE 80: ACTUAL DAILY WAGE AND EXPECTED SILVICULTURE INCOME 61 TABLE 81: ACTUAL DAILY WAGE AND EXPECTED SILVICULTURE INCOME 61 TABLE 82: DAILY WAGE RELATIONSHIP TO KEY OUTCOMES 62 TABLE 83: SILVICULTURE INCOME 62 TABLE 84: ACTUAL VERSUS INTERNET ACCESS 62 TABLE 85: TOTAL SILVICULTURE INCOME RELATIONSHIP TO KEY OUTCOMES 63 TABLE 86: OTHER INCOME 63 TABLE 87: SILVICULTURE INCOME AS % OF TOTAL INCOME 63 TABLE 88: INCOME DEPENDENCY RELATIONSHIP TO KEY OUTCOMES 63 TABLE 89: WHAT LIMITS YOUR SILVICULTURE INCOME (NUMBER OF EMPLOYEE WHO SELECTED EACH FACTOR) 64
Page 8 of 170
TABLE 90: WHAT LIMITS YOUR SILVICULTURE INCOME (WHEN SELECTED) 64 TABLE 91: COUNT OF PAYMENT METHODS -‐ ALL SILVICULTURE EMPLOYEES 64 TABLE 92: SATISFACTION WITH PAYROLL 65 TABLE 93: TYPE MOBILE PHONE 65 TABLE 94: SOCIAL MEDIA SITES & SERVICES 66 TABLE 95: EMPLOYER POPULATION LISTS 68 TABLE 96: SILVICULTURE SUB SECTOR ACTIVITIES, BC 2013 68 TABLE 97: YEARS OF OPERATION (N=51) 69 TABLE 98: YEARS OF OPERATION, GROUPED 69 TABLE 99: SOURCES OF REVENUE: FORESTRY VS. NON-‐FORESTRY SECTOR, BC, 2013 69 TABLE 100: SOURCES OF REVENUE: GOVERNMENT VS. PRIVATE SECTOR, BC, 2013 70 TABLE 101: OTHER REVENUE SOURCES, BC, 2013 70 TABLE 102: COMPANIES THAT HAD WORK (CONTRACTS) IN PARTNERSHIP WITH FIRST NATIONS, BC, 2013 71 TABLE 103: SOURCES OF REVENUE: ACTIVITIES AND SERVICES, BC, 2013 71 TABLE 104: SOURCES OF REVENUE: IN BC VS. OUTSIDE OF BC, 2013 72 TABLE 105: NUMBER OF BC REGIONS WORKED (N=51) 72 TABLE 106: WORK REGION -‐ BC 73 TABLE 107: TYPE OF BUSINESS, 2013 73 TABLE 108: NUMBER OF SILVICULTURE BUSINESSES OPERATED, 2013 74 TABLE 109: NUMBER OF SILVICULTURE BUSINESSES OPERATED, 2013 74 TABLE 110: EMPLOYER YEARS OF SILVICULTURE EXPERIENCE (N=54) 75 TABLE 111: EMPLOYER YEARS OF SILVICULTURE EXPERIENCE, GROUPED 75 TABLE 112: RESPONDENT ROLES AND RESPONSIBILITIES 75 TABLE 113: CREW SIZES (FIELD WORKERS), BC, 2013 76 TABLE 114: TYPES OF EMPLOYEES, BC, 2013 76 TABLE 115: 2013 BUSINESS INCOME EXPECTATIONS 77 TABLE 116: EXPECTED BUSINESS PERFORMANCE IN 2014 77 TABLE 117: YEAR OVER YEAR BUSINESS INCOME COMPARED (2012 TO 2013) 77 TABLE 118: OPTIMISTIC ABOUT SECTOR 78 TABLE 119: FUTURE GOVERNMENT EXPENDITURE 78 TABLE 120: FUTURE PRIVATE SECTOR EXPENDITURES 79 TABLE 121: YEARS EXPECTED TO OPERATE 79 TABLE 122: EXPECTING TO OPERATE NEXT SEASON (IF EXPECT TO OPERATE < 6 YEARS) 79 TABLE 123: BUSINESSES THAT WOULD PURSUE EXPANSION 80 TABLE 124: FACTORS THAT LIMIT BUSINESS EXPANSION 80 TABLE 125: BUSINESS CONTINUITY 81 TABLE 126: BUSINESS CONTINUITY BY OPERATING YEARS EXPECTED 81 TABLE 127: REASONS COMPANY CLOSES OPERATIONS -‐ TOTAL TIMES CHOSEN (1ST, 2ND OR 3RD) 81 TABLE 128: WHEN CHOSEN 82 TABLE 129: RATING INDUSTRY ASSOCIATIONS 82 TABLE 130: HIRING CHALLENGES 84 TABLE 131: HIRING OF ROOKIES 84 TABLE 132: HIRING OF FIELD WORKERS 84 TABLE 133: EMPLOYEE RECRUITMENT STRATEGY 85 TABLE 134: SECTOR PROMOTION – POPULATION PRIORITIES 85
Page 9 of 170
TABLE 135: SECTOR PROMOTION – WHO SHOULD LEAD THE WAY? 86 TABLE 136: EMPLOYEE SCREENING 87 TABLE 137: NEW HIRE EVALUATION PRACTICES 87 TABLE 138: RELATIONSHIP BETWEEN EMPLOYEE GRIT SCORE AND SELECTED KEY OUTCOMES: 88 TABLE 139: ROLE OF INFORMATION SOURCES 89 TABLE 140: WHY EMPLOYEES QUIT WORKING IN THE SECTOR 91 TABLE 147: AGE GROUPS 92 TABLE 148: RELATIONSHIP BETWEEN YEARS OF EXPERIENCE AND…: 92 TABLE 141: EMPLOYEE SUPPORT BY EMPLOYER? 93 TABLE 142: GOING THE EXTRA MILE CORRELATION WITH KEY OUTCOMES 93 TABLE 143: RELATIONSHIPS – KEY DRIVER AND ACTION AREAS 95 TABLE 144: RELATIONSHIPS – KEY DRIVERS AND ACTION AREAS 97 TABLE 145: OVERALL EMPLOYER PROFESSIONALISM SATISFACTION 99 TABLE 146: DERIVED VERSUS STATED IMPORTANCE CORRELATIONS 101 TABLE 149: WHO NEEDS TRAINING? 103 TABLE 150: WHAT WORRIES YOU ABOUT TRAINING? 103 TABLE 151: EMPLOYEE THOUGHTS ABOUT WHO TO TRAIN 104 TABLE 152: EMPLOYEE REPORTED OVERALL SATISFACTION 104 TABLE 153: EMPLOYEE ACTUAL EMPLOYEE SATISFACTION (0 TO 10) 104 TABLE 154: EMPLOYER PERCEPTION OF EMPLOYEE SATISFACTION (0 TO 10) 104 TABLE 155: SOCIAL CONNECTIONS WITH OTHER EMPLOYEES 105 TABLE 156: RELATIONSHIP BETWEEN SOCIAL CONNECTIONS AND LIKELIHOOD TO RETURN TO THE SECTOR IN 2014
105 TABLE 157: GRIT SUMMARY STATISTICS – SILVICULTURE EMPLOYEES 106 TABLE 158: GRIT QUESTIONS FOR SILVICULTURE EMPLOYEES 106 TABLE 159: SUMMARY OF WHAT ATTRACTED WORKERS TO SECTOR 107 TABLE 160: SUMMARY OF REASONS EMPLOYEE WILL LEAVE SECTOR 108

Page 10 of 170
List of Figures
FIGURE 1: SEEDLINGS PLANTED BY RESPONSIBILITY .................................................................................................. 40 FIGURE 2: TREE PLANTER WORKFORCE DEMAND ...................................................................................................... 40 FIGURE 3: SPACING VOLUMES – 2014 TO 2050 .......................................................................................................... 41 FIGURE 4: HISTORIC BC SILVICULTURE WORKFORCE SUPPLY – 2008 TO 2013 ........................................................... 42 FIGURE 5: OTHER INFORMATION SOURCES ............................................................................................................... 86 FIGURE 6: OTHER INFORMATION SOURCES ............................................................................................................... 90 FIGURE 7: REASONS WORKERS ENTERED THE SILVICULTURE SECTOR ....................................................................... 91 FIGURE 8: PLOTTED ACTION AREAS BASED ON DERIVED VERSUS STATED IMPORTANCE ANALYSIS ....................... 102

Page 11 of 170
Acknowledgements
The BC Silviculture Workforce Initiative (BCSWI) is grateful for the commitment and expertise of the Project Committee members who provided their insight and guidance to this labour market research:
• Jake Roos, Loki Tree Service
• John Lawrence, Brinkman Group of Companies
• Natalia Hautala -‐Tree planter
• Sylvia Fenwick-‐Wilson, silviculture worker and instructor
• Carly Zenzen/Crawford Young, Spectrum Resource Group Inc
• Jonathan "Scooter" Clark, Folklore Contracting, Replant.ca
• Chris Akehurst, Akehurst and Galvani Reforestation Ltd
• Sean Ardis, silviculture worker
• John Betts, Western Silvicultural Contractors' Association
• Keith Atkinson, BC First Nations Forestry Council
The BCSWI would like to thank all those employees and employers who participated in the survey. Your participation was essential in creating a better understanding of the silviculture sector labour market
and in the ongoing efforts to keep the silviculture sector a good and rewarding place to work.
The BCSWI achieved its goals through the essential leadership and contributions of its Chair, Suzanne Christensen.
This report was written by Dialogue Research, in partnership with Krista Bax and Ference Weicker and Company.

Page 12 of 170
Background
The actual number of BC silviculture sector employers and employees was unknown. Two years ago, the estimated number of employers working in BC silviculture sector was estimated to be as high as 400 and employees estimates were as much a ± 10,000, none were within ± 1,000. An understanding of the workforce has primarily been based on firsthand experience and qualitative in nature; quantitative survey based information about the workforce has been collected since 2011, but is typically based on sub-‐sets of the sector and not a representative sample. Given these factors, the current and future workforce demand and supply has been unknown.
During the fall of 2013, the BC Silviculture Workforce Initiative (BCSWI) continued and strengthened their labour market information collection efforts for the sector and undertook a multi-‐year labor market information (LMI) research project. This research provides evidence that can be used to confidently estimate the number of employer and employees; as well as, provide quantitative estimates of employer and employee characteristics used to create workforce supply and demand models and inform recruitment and retention plans
Dialogue Research was engaged to perform the labour market information research project and their efforts have been guided by the Chair and Project Committee.
Guiding the research was the goal of answering the following questions:
Research Question Related Content
What is the current size of the workforce for BC’s silviculture subsectors tree planting, wildfire fighting and brush and spacing?
Pg. 37
What has been the historical workforce for the last 5 years for BC’s silviculture subsectors; tree planting, wildfire fighting and brush and spacing?
Pg. 41
What is anticipated required workforce for the next 10 years for BC’s silviculture subsectors; tree planting, wildfire fighting and brush and spacing?
Pg. 39
What are the drivers of workforce demand for BC’s silviculture subsectors; tree planting, wildfire fighting and brush and spacing?
Pg. 39
What is the anticipated growth rate for the next 10 years for BC’s silviculture subsectors; tree planting, wildfire fighting and brush and spacing?
Pg. 39
What is the workforce outlook (difference between supply and demand) for the next 10 years for BC’s silviculture subsectors; tree planting, wildfire fighting and brush and spacing?
2014 LMI report
What is the qualitative description of the workforce of each of BC’s silviculture subsectors; tree planting, wildfire fighting and brush and spacing?
Pg. 43
What are the factors attracting workers to BC’s silviculture subsectors tree planting, wildfire fighting and brush and spacing?
Pg.89
What are the factors retaining workers to BC’s silviculture subsectors tree planting, wildfire fighting and brush and spacing?
Pg. 90, 93, 94, 98,
Can training play a positive role in better recruitment and retention to the BC’s silviculture subsectors tree planting, wildfire fighting and brush and spacing?
Pg. 103
What are factors that can increase an employer’s recruitment success to the BC’s silviculture subsectors tree planting, wildfire fighting and brush and spacing?
Pg. 98
What are the factors that can increase long term retention to BC’s silviculture sector? Pg. 93, 98 What are the current, active successful retention strategies in BC’s silviculture sector? 2014 LMI report

Page 13 of 170
Executive Summary The executive summary includes highlights from the report’s four sections: Section 1: BC Silviculture
Workforce Supply and Demand, Section 2: Employee Profile, Section 3: Employer Profile, and Section 4: Recruitment and Retention.
Section 1: BC Silviculture Workforce Supply and Demand
The BC silviculture workforce supply (2013) is estimated at 7,482 workers – 3,439 tree
planting workers, 1,205 brushing, 96 spacing, 1,634 wildfire fighting (534 industry and 1,100 government) and 1,108 other workers defined
as workers employed by silviculture firms not involved in field duties.
Sub-‐sectors # of Workers
Tree planting 3,439 Brushing 1,205 Spacing 96 Wildfire fighting (industry) 534 Wildfire fighting (gov’t) 1,100 Total Field Staff 6,374 Other Workers 1,108 Total Employment 7,482
Historically, workforce supply has fluctuated for all activities over the past 5 years where the
tree planting workforce has seen a 41% variance, brushing a 27% variance, spacing a 380% variance, and wildfire fighting a 2600%
variance.
Labour demand for tree planting work is primarily driven by the annual allowable cut (AAC) of private licensees and BC Timber Sales (BCTS) and provincial reforestation programs such as Forests for
Tomorrow (FFT) and the Forest Stand Management Fund (FSMF).
The 2013/14 tree planting estimates are at 241.7 million tree seedlings requiring 3,492 workers and the 2014/15 tree planting estimates are at 243.1 million tree seedlings requiring 3,512 workers. Thereafter,
labour demand will decrease over the long term. Sector estimates are for 200 million tree seedlings to be planted per year for the next 10 years until 2023/24, requiring 2,890 workers annually. In 2024/25, due to the reduction of AAC, planting volumes are estimated to be 160 million tree seedlings requiring
2,312 workers annually and will remain so until 2030.

Page 14 of 170
Planting volumes after 2030 are estimated to drop again to 145 million seedlings per year for the next 20 years until 2050 due to a drop in FFT levels because at this point natural regeneration of Mountain
Pine Beetle (MPB) impacted stands should have advanced enough that starting over would be less effective than letting these stands grow.
Labour demand for brushing and spacing work is driven by licensee practices and government budgets for incremental silviculture activities. Government budgets for spacing are estimated to remain steady
to 2040, suggesting that workforce estimates would remain at 2013 levels (1,205 brushing, 96 spacing).
Labour demand for wildfire fighting work is primarily dependent on weather and fuel accumulation on the forest floor. With climate change and an increase in extreme weather conditions and human presence in the backcountry, the labour demand for wildfire fighting is expected to steadily increase
over the long term. It is difficult to estimate the extent of the increase.
Section 2: Employee Profile
Responses were received from all types of worker types including field workers (92%), lead hands (9%), supervisors/crew bosses (14%), and project managers (4%), with some respondents holding more than 1 position.
The workforce is fairly young -‐ the average age of a silviculture worker is 27 years and 90% of all
employees are 36 years or less. Younger workers indicated they are more likely to continue work in the sector. Gender distribution is three male workers for every two female workers. There are almost an equal number of students and non-‐students working in the sector. Seventy-‐five percent of the students
are enrolled in a program that that is not directly related to a career in silviculture.
BC silviculture workers have an average of 6 years’ experience. Half of the workers surveyed had 3 years’ experience or less and 90% have 14 or less years.
Average years of experience varied with each job – 5 years for field workers, 11 years for lead hands, 13 years for supervisors/crew bosses, and 16 years for project managers. Experience proves necessary to
advance from a field worker.
34923512
2890
2312
0
500
1000
1500
2000
2500
3000
3500
4000
Tree Planting Workers -‐ Demand

Page 15 of 170
Employees reported working for on average 3 employers in their career and 90% reported working for no more than 7 employers during their careers, thus employers should be prepared that workers move from employer to employer.
Given that ninety percent of the workforce owns a smartphone and all have an email account,
employers should consider this medium as effective means of communications related to recruitment of new workers and retentions of existing workers during the off season.
With respects to 2013 work activities:
-‐ All of the workers surveyed said they performed tree planting activities in 2013. More than four out of five workers of were involved in two or more activities.
-‐ Piece count is the common practice of compensation. Nearly 9 out of ten workers (87%) reported being paid on piece count. Approximately 30% of lead hands, supervisor/crew bosses and project managers reported being paid on an hourly basis.
-‐ The average daily wage earned by a worker was $261, lower than their average expected fair daily wage of $299.
-‐ The majority of workers (86%) reported being satisfied with the accuracy of their payroll.
-‐ Nearly two out of five workers (37%) reported having at least one type of injury (overuse/exertion injury or other injury) in 2013, with the average days off work being 5 days.
-‐ One in four workers reported being involved in a “near miss” situation that could have caused
injury. -‐ Workers earned an average of $15,137 from silviculture activities and had an average gross income
of $23,939. Almost all employees (90%) earned $30,000 or less.
-‐ Four out of five workers (82%) reported that their employer went the “extra mile” to ensure workers were as happy and as productive as possible.
Section 3: Employer Profile
There are an estimated total of 188 private firms conducting silviculture work in BC -‐ 78 employers that perform tree planting activities, 80 employers that perform brushing and spacing activities, and 43
private employers that conduct wildfire fighting activities. Some firms have activities in more than on area.
Approximately 80 % of employers reported being involved in two or more activities. Employers reported working on average in 2 regions, but 50% of all employers worked only in one region.
Silviculture employers reported average annual earnings of $2.3 million and median annual earnings of
$1.5 million in 2013. As suggested by the number of activities they report, most also reported generating revenue from more than one type of activity. 20% of employers reported earnings from outside of BC. Most BC revenue (82%) was earned from work performed on forest lands and come from
private sector clients (68%) compared to government (32%) contracts. Non-‐forest sector revenue came
Page 16 of 170
from a number of different clients ranging from utilities to mining, municipalities, and oil and gas sector. Overall, 30% of employers reported work undertaken in partnership with First Nations.
Business results (revenue) for almost half of employers was below expectations in 2013. Half of employers look forward to better operations in 2014. The majority of employers (58%) reported being
optimistic about the next 3-‐5 years primary due to strong lumber prices. Employers that don’t share this bright outlook are concerned about the competition from other firms and thin profit margins.
With respect to 2013 activities and workforce composition, employers reported
-‐ The majority of their time (82%) was performing tree planting activities. -‐ They employed an average of 1 crew boss for every 7.4 field workers and 1 rookie for every 4
experienced staff employed. -‐ Crew size can range considerably and is a function of type work and company employee counts. The
average size of crew reported as small is 5 field workers. The average for larger crews is 18 field
workers. -‐ Approximately one-‐half of employers reported employing First Nations people and rarely employed
foreign workers.
Almost 66% of employers reported they would expand if possible. Limiting factors to expansion cited
were associated with revenue (availability of contracts and competition within the sector) and ability to find skilled supervisors/crew bosses.
All employers reported plans to conduct business in 2014 and almost half (47%) expected their business to continue for 10 or more years. When an owner plans to exit the sector, 40% reported not being sure
what will happen to their business and 26% anticipate it will be taken over by an existing employee. Sixteen percent think the doors will simply shut. The two leading reasons for exiting the sector are lack of work/contracts and retirement.
A small majority of employers think industry associations are doing a good job representing their
interests. One out of three businesses would say they are doing a poor job and only 8% would say they are doing a very good job. The main area of dissatisfaction is that the associations do not represent all of the industry. Suggestions to improve include increasing membership, advocating for common standards
for business practices and improving sector wide communication.
Section 4: Recruitment and Retention
Current Practices
Supervisor and crew bosses are a recruitment priority for 33% of employer respondents. Employers have limited problems with recruiting entry level field workers, and furthermore, even if they were available only 1 in 10 employers (11%) reported they would have hired additional rookies.
Page 17 of 170
Raising awareness with high school students of the career opportunities in silviculture is a good investment for expanding the pool of potential employees according to employer respondents. A clear majority of employers (80%) think an industry association should lead the way on any effort to promote
the sector.
Almost all employers (98%) reported recruiting through existing employees but less than half (42%) agree it’s very effective. Almost 1 in 3 employers (60%) don’t use job fairs or similar events and only 7% agree that is an effective method to recruit employees. When evaluating rookies, the most common
practice (55%) was an in-‐person interview. The most common evaluation tool was a reference check for evaluating experienced workers. Over half (57%) of workers said that a contact in the sector led to their first silviculture job. Information available on the internet was used by some leading up to finding a job,
but not many said this played an important role in how they looked to find work in the sector. Traditional employer recruitment methods such as newspaper job postings and career fairs were viewed by employers as inefficient in recruiting new entrants to the workforce.
Key Drivers
Each of the drivers we tested has a statistically significant correlation with an employee’s willingness to
recommend an employer. Satisfaction with employer professionalism can explain 35% of variance in how likely an employee was to recommend their employer. The next best explanatory driver is satisfaction with an employee’s overall accommodation followed by their workday experience. Overall
satisfaction with income was the least powerful predictor of how likely an employee is to recommend working for their employer
-‐ Employer professional satisfaction is mainly driven by fairness of treatment of workers by an employer.
-‐ Accommodation satisfaction is mainly driven by safety and security at camp, cleanliness, and living mates, and size of sleeping quarters (room or tent).
-‐ Workday experience satisfaction is mainly driven by fairness of assigned tasks, and supervisor/crew
boss organization. -‐ Dissatisfaction with income is associated with employees' experience with tree prices, injuries, and
available work days.
Overall, those employee that think their employer goes the extra mile to ensure employees are as happy
and as productive as possible, that are younger in age, and have more years’ experience are more likely to return to the sector to work the next season.
Training
Training can be a key recruitment and retention tool. Employees felt that their employers would gain the greatest benefit from training delivered to rookies followed by workers in supervisory or
management roles. Seventy five percent or more of employees perceive that their organizations would benefit from training delivered to any of these groups of employees.

Page 18 of 170
More employers agree than disagree (80%) that training for supervisors/crew bosses is where there is greatest need. More businesses agree than disagree that change is needed when it comes to meeting the training needs of employees.
The greatest concerns about training for workers are who determines content, what content is
developed, and any duplication of existing resources. Slightly less of a concern is that new training will replace their less costly and effective training followed by worries about enforcement. Employers cited training opportunities in the areas of existing training such as ATV training, resource road training,
chainsaw training, and new training in productive planting techniques, additional wildfire fighting modules, and supervisor crew and organization skills.
More detailed research findings are provided in the following sections of the report.

Page 19 of 170
Structure of Report This report provides a background to the project and an overview to the research methodology followed
by 4 main sections.
Section 1 provides findings related to BC Silviculture Workforce Supply and Demand and includes information of total employment, employment production standards, current workforce estimates,
future workforce demand projections, as well as a historical workforce supply picture.
Section 2 provides findings related to BC Silviculture Employee Profile and includes information on demographics, career history, and 2013 work experience details from the employees that responded to the survey.
Section 3 provides findings related to BC Silviculture Employer Profile and includes information on the
sector employer population, corporate information such as subsector activity, revenue, years in business, workforce composition, and opinions and outlook, such as future revenue expectations, sector optimism, and reasons for exiting the sector..
Section 4 provides research findings related to recruitment and retention in the sector and includes
information on employer recruitment priorities, current recruitment practices, key drivers of employee satisfaction, employees who are at risk to leave the sector, opinion on future training priorities, as well as additional general findings.
Appendices follow and include employer and employee surveys.

Page 20 of 170
Methodology
1. Instrumentation
The employer and employee survey question were developed based on analysis of the associated 2012 survey results and input from the BC Silviculture Workforce Committee. Ference Weicker and Company
provided content expertise for all questions required for workforce supply and demand analysis. Survey questions were pre-‐tested using a cognitive interviewing methodology. The employee survey questionnaire was structured to support Key Driver Analysis and Derived versus Stated Importance
Analysis. The employee survey also included an optional set of questions to measure personality type based on the GRIT scale1.
2. Sampling
The principle behind estimation based on survey sample is that each person in the sample "represents", besides himself or herself, several other persons not in the sample. The quality of a sample based
estimate is dependent upon how complete the list sampled from is (Sample Frame) and how representative the people providing feedback are to the total population of interest. The preferred method of ensuring representativeness is to select a “random” sample from the list to minimize
potential selection bias.
Sample Frame –Private Sector Employers The sample frame used for selecting businesses to participate contained 188 business thought to represent all BC silviculture employers. In almost all population based studies there is no such thing as a completely accurate sample frame. Most have issues associated with under and over coverage.
The sample frame used for this study contained 188 private employers. The employers identified as
working in the BC silviculture sector -‐ 78 employers that perform tree planting activities, 80 employers that perform brushing and spacing activities, and 43 employers that have wildfire fighting activity. Firms can have activity in more than one area. These firms were identified using various employer listings such
as BC Forest Safety Council SAFE Certified List, WorkSafeBC (WSBC) COR certified list2, existing BCSWI contractor database, BC Bid award notices from MOFN and BCTS, and MOFR Fire Protection Branch-‐ Standing Offer List for fire crews. Lists were cross referenced for data integrity to create our BC
silviculture employer population sample.
To estimate over coverage we tracked how many employers contacted did not meet the study requirements of having activity in BC Tree Planting, Brushing and Spacing or Wildfire fighting subsectors. Only 1% of the sample contacted employers was classified as over coverage. These were firms that
provided support and planning type service to the sector.
1 Duckworth, A.L., Peterson, C., Matthews, M.D., & Kelly, D.R. (2007). Grit: Perseverance and passion for long-‐term goals. Journal of Personality and Social Psychology, 9, 1087-‐1101. 2 See Appendix 9 for our assessment of the accuracy of business classifications.

Page 21 of 170
Sample frame under coverage is harder to determine. The fact that our model for projected number of workers that uses the estimated count of employers as part of its calculation is within 500 of the estimate based on our model based on production data suggest we have an accurate estimate of the
number of employers in the silviculture sector.
Sample Frame – Private Sector Employees There is no known complete list of silviculture employees that can be used as a sample frame. Three
strategies are used reach a representative sample of employees. Stratified random sampling; respondent driven sampling and census approaches were all attempted with employees. Our stratified random sampling uses the list of employers as the first strata, employees contacted through selected
employers is the second strata. Respondent driven sampling is a relatively new and innovative approach developed for hard to reach study populations (for instance, drug addicts) and uses non-‐random selected employees as the starting point for reaching a representative sample. Census approaches are
convenience samples in that the employees self-‐select to participate.
Sample Selection - Employer Two strategies were used to recruit employers to participate in the survey. A random selected sub-‐set of employers was selected for priority effort in recruitment. This random sample of 19 employers (10%) was selected to assist with evaluating the representativeness of our census approach. We obtained a
68% response rate to our random sample participants (n=13). These 13 employers represent 27% of all respondents in our final sample (n=48).
The total sample is n=48 represents a 25% response rate for all employers in our sample frame of 188
listed businesses.
Both the random sample response rate and the overall response rate are above the survey research industry norms. Norms for random sample based research of employers is less than 5%. It jumps to
15% when the respondent has a known and credible relationship with a respondent, such as when the respondent is a business to business customer relationship.
Table 1: Sample Frame List counts based on BCFSC SAFE Companies Certification Profiles
Whose experience is reflected in the responses to this survey? One way to answer that question is to say the feedback we report is based on employers who represent…:
3 Not all 48 employers in our sample answered all survey questions.
Sample Frame Random Sample Final Sample BCFSC Classifications Count % Count % Count % Not BCFSC Certified 55 29% 5 26% na na IOO 3 2% 1 5% 1 2% ISEBASE (2 to 5) 15 8% 2 10% 18 10% SEBASE (6 to 19) 87 46% 8 42% 87 60% BASE (20+) 28 15% 3 18% 28 19% Total 188 99% 19 101% 463 99%
Page 22 of 170
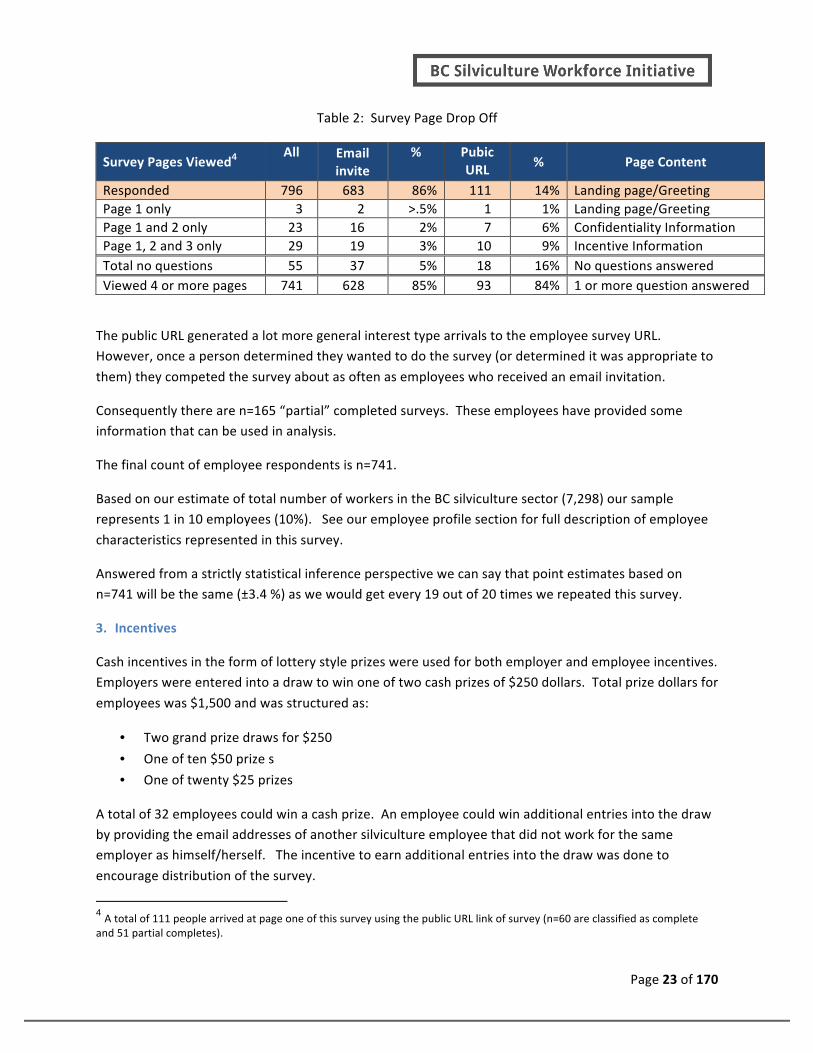
• Coverage in terms of total employment = 79% of all employees • Coverage in terms of volume of trees planted = 56% of total planted • Coverage in terms of volume of Brushing & Spacing = 25% of Hectares Brushed/Spaced
Answered from a strictly statistical inference perspective we can say that point estimates based on n=48
will be the same (± 12.24%) as we would get every 19 out of 20 times we repeated this survey.
Sample Selection -Employee Three approaches where used to reach a representative sample of BC Silviculture employees. A
stratified random sampling approach was attempted by asking the random sample of employers (Strata 1) to invite all their employees (strata 2) to participate in the employee survey. All participating employers (13 randomly selected and 35 non-‐ random selected) were asked to participate as our strata
1 list of employers. A total of 16 (33%) requested information about sending invites to their employees; only 6 (12%) of our sampled employers actually provided employee contact information. The total
count of employees contacted through this method was 1,249 with an approximate 48% response rate.
The second approach (respondent driven sampling) asked employees who completed the survey to help recruit others. While n=148 employee respondents expressed interest in recruiting other employees the final count of employees that provided emails was n=3 for total of 9 additional email invitations.
The third approach (Census) was to promote the survey using various social media tools and make the
survey publicly available for any employee to access.
A total of 796 people arrived at the surveys landing page, that explained what the survey was about and who it was directed to. Three (3) people advanced no further in the survey and a total of 55 stopped participating in the survey after viewing the first 3 pages. These first 3 pages are informational, and
asked no questions. Employees advanced through the survey after page 4 based on their profile so could legitimately visit as few as 4 pages if they were terminated as not part of the silviculture sector and the most number of pages (screens) was 37. A total of n= 576 are classified as “complete” and
viewed the appropriate number of pages based on their answers to questions in the survey.
Page 23 of 170
Table 2: Survey Page Drop Off
Survey Pages Viewed4 All Email
invite % Pubic
URL % Page Content
Responded 796 683 86% 111 14% Landing page/Greeting Page 1 only 3 2 >.5% 1 1% Landing page/Greeting Page 1 and 2 only 23 16 2% 7 6% Confidentiality Information Page 1, 2 and 3 only 29 19 3% 10 9% Incentive Information Total no questions 55 37 5% 18 16% No questions answered Viewed 4 or more pages 741 628 85% 93 84% 1 or more question answered
The public URL generated a lot more general interest type arrivals to the employee survey URL. However, once a person determined they wanted to do the survey (or determined it was appropriate to
them) they competed the survey about as often as employees who received an email invitation.
Consequently there are n=165 “partial” completed surveys. These employees have provided some information that can be used in analysis.
The final count of employee respondents is n=741.
Based on our estimate of total number of workers in the BC silviculture sector (7,298) our sample represents 1 in 10 employees (10%). See our employee profile section for full description of employee
characteristics represented in this survey.
Answered from a strictly statistical inference perspective we can say that point estimates based on n=741 will be the same (±3.4 %) as we would get every 19 out of 20 times we repeated this survey.
3. Incentives
Cash incentives in the form of lottery style prizes were used for both employer and employee incentives. Employers were entered into a draw to win one of two cash prizes of $250 dollars. Total prize dollars for
employees was $1,500 and was structured as:
• Two grand prize draws for $250
• One of ten $50 prize s
• One of twenty $25 prizes
A total of 32 employees could win a cash prize. An employee could win additional entries into the draw by providing the email addresses of another silviculture employee that did not work for the same employer as himself/herself. The incentive to earn additional entries into the draw was done to
encourage distribution of the survey.
4 A total of 111 people arrived at page one of this survey using the public URL link of survey (n=60 are classified as complete and 51 partial completes).
Page 24 of 170
Another incentive used with employees was the offer to send personalized reports, including the option to receive the results of their GRIT score. A total of 488 employees provided their email address for the purposed of sending them a personal report or notification of a prize win.
Employers were given a similar incentive for completing the survey. Employers had the option of
receiving a custom benchmark report. Half (50%) of our employer respondents (24) requested a benchmarking report. In addition, if they provided a list of employee emails to Dialogue Research they could receive additional insight in their benchmark report based on employee responses. A total of 16
employers (33%) asked to be contacted regarding this option. Only 6 employers (12% of all employer respondents) provided employee email lists.
4. Sample Management
Employers were sent an initial invite on November 13, 2013. The public version of the employer survey was available the same day. The first email invites to employees was sent December 3, 2013 and the
public version of the employee survey was available the same day. The reason for gap between sending employer employee surveys was to allow employers some time to consider having Dialogue Research send invites directly to their employees.
The employer and employee surveys were closed to new respondents on January 6, 2014. Employee
respondents had approximately 34 days (4.5 weeks) to participate in the survey. Employer respondents had approximately 53 days (7.5 weeks) to participate.
Employees received a maximum of 4 reminder emails. Likewise, an employer that was not part of the employer random selection received a maximum of 5 reminder emails. Employers in the random
sample received up to 16 email reminders. In addition, these employers also received at least one telephone call, some received up to 4 telephone calls in attempts to reach them and encourage participation.
5. Data Cleaning Notes
Once it was determined which respondents would be included in the samples, a data cleaning process
was undertaken to prepare the data for statistical analysis. The data cleaning entailed converting text responses to quantitative questions to numerical responses, as well as reviewing responses within and across questions for logic. For example, where respondents were asked to identify the percentage of
their revenues that were generated from different activities, the figures were checked if the responses added up to 100%. In cases were responses were not logical or missing, where possible, we attempted to fill in the gaps. If it was not possible to determine the logical response or if there were any doubts,
the response was identified as “missing” and excluded from the analysis of that question.
6. Data Reporting Notes
Anywhere data is reported with “*” or “**” it signifies the result is statistically significant. Statistically significant does not mean important; rather, it means the result should not be explained away as

Page 25 of 170
chance. The “*” means a one tail test of statistical significance and the “**” means a two tail test of statistical significance. One-‐tailed tests are considered more powerful than two-‐tailed tests and “*” suggest almost no coincidental result due to chance.
In order to determine the quality of an estimate using both small (employer) and large (employee) samples we have used the coefficient of variation (CV). The CV of a variable or the CV of a prediction model for a variable can be considered as a reasonable measure and is particularly useful in the interpretation of relative levels of precision, especially when widely varying quantities are being compared.
Higher values indicate higher variability and thus more potential for error.
Example: In a province there may be an estimated 50,000 people unemployed with a margin of error of 1,300 people. At the same time, that province's estimated unemployment rate is 8% with a margin of error of 0.2%. It is difficult to compare these numbers directly. However, the CV of the estimated number of unemployed is 2.6%, while the CV of the estimated unemployment rate is 2.5%. (They need not be equal.) This shows that the two estimates have essentially the same level of precision.
USA Census interpretation guidelines.
• High reliability: Coefficient of Variation (CV) of 0.0 to 15%
• Medium Reliability: CV between 15%-‐30%.
• Low Reliability: CV over 30%.
The cut-‐off depends on the application of the data – CV beyond 30% may be acceptable for very general
portraits or profiles.

Page 26 of 170
Example Report Tables Example employer table used in report
Sample All Employers3
Where did you work this year? Count Percent Count CV
A -‐ West Coast Region 21 43% 81 25.5
B -‐ Skeena Region 14 29% 54 42.2
C -‐ Omineca Region 7 14% 26 87.4
D -‐ Northeast Region 10 21% 39 58.3
E -‐ Cariboo Region 19 39% 73 31.4
F -‐ South Coast Region 6 12% 17 102.0
G -‐ Thompson/Okanagan Region 10 21% 39 58.3
H -‐ Kootenay/Boundary Region 19 39% 73 31.4
Total 48 188
Example employee table used in report
Sample All Employees3
Where did you work this year? Count Percent Count CV
Under 25 years of age 257 46% 3,268 8.6
26 to 29 years of age 179 32% 2,274 12.4
30 to 33 years of age 51 9% 640 44.0
34 to 39 years of age 37 7% 497 56.6
40 years or older 39 7% 497 56.6
Total 563 100% 7,105
Estimated count of actual
number of employers
Estimated count of actual number of employees

Page 27 of 170 Section 1: Workforce Supply and Demand
Section 1 Workforce Supply and Demand
Calculating how many workers, how many days, how much revenue

Page 28 of 170 Section 1: Workforce Supply and Demand
A. EMPLOYMENT
1. Survey Based Employment Estimates
The maximum number of private sector workers that was employed by our sample during the course of
2013 was 3,306. Our production based extrapolation model estimates total non-‐government payroll counts were 6,382 during 20135. Government employees add an additional 1,100 workers placing the total estimated number of BC silviculture workers at 7,482. A second method for calculating the
projected number or workers was also designed based on our Employer Population list and employee counts reported by employers. That estimate for BC Silviculture workers is 6,995. The estimate differs by only 487 employees.
2. Employment of Field Workers and Crew Bosses
In terms of field staff, the employers surveyed reported employing 314 crew bosses and 2,331 field
workers (a ratio of 1 per 7.4 field workers). Of these field workers, 1,881 had previously worked in the sector while 475 were rookie field workers (ratio of 1 rookie for every 4 experienced worker). Not all employers reported having rookie staff in 2013. Most employers (78% or 35 of the 45 providing a
breakdown) reported employing at least some rookies.
Table 3: Average Number of Employees, BC, 2013
Employers Employees
Type of Worker Reporting Mean Count Total % of Total
Crew Boss Employees 45 7.0 314 12% Field Workers 45 51.8 2,331 88% -‐ Rookie Field Worker 35 13.6 475 18% -‐ Experienced Field Worker 44 42.8 1,881 71% Total Crew Bosses and Filed Workers 45 59.4 2,645 100% Maximum @ Any Time (n=46) 3,306 100%-‐
5 Total of Tree Planting, Brushing, Spacing, Wildfire Fighting (Industry) and Other Workers. Wildfire Fighting (Government) is not included in this total.

Page 29 of 170 Section 1: Workforce Supply and Demand
3. Field Workers By Types of Activity
Each employer was asked to estimate the percentage of time that their silviculture field workers spent on each of the various types of silviculture activities. The percentages were then multiplied by the number of the field workers that they reported to develop an estimate of the allocation of field staff
across the activities. As indicated, silviculture field staff employed by the employers surveyed spend most of their time engaged in tree planting activities (82%).
Table 4: Field Worker Effort by Activity, BC, 2013
Sample BC Silviculture
Sector
Field Workers Count % Estimate
Tree Planting 1,917 82% 5,826
Brushing and Spacing 298 13% 924
Wildfire Fighting (private) 116 5% 355
Total Field Workers 2,331 100% 7,105
B. EMPLOYMENT PRODUCTION STANDARDS
1. Tree Planting
Overall, 29 out of the 48 employers surveyed (60%) indicated they were involved in tree planting, 26 of these reported revenues (as shown in the table below), and 23 provided estimates of the number of
trees their workers planted in 2013. These 23 employers reported that their field staff planted 120,378,298 trees in 2013. The average number of trees planted per field worker per day varied across these 23 employers from a minimum of 450 trees planted per day to a maximum of 2,700 trees planted
per day. The average across all employers reporting was 1,442 trees planted per day.
Table 5: Tree Planting Activities: Employer Survey, BC, 2013
Indicator Total Mean
Revenues (n=26) $35,984,500 $1,384,019 Trees Planted 120,379,298 5,233,883 Average Trees Planted Per Day 1,442 1,442 Tree Planting Worker Days 83,481 3,630 Number of Tree Planting Workers 1,749 76 Number of Days Planting Per Worker 48 48
An estimate of the worker days spent planting can be derived by dividing the total number of trees
planted by the 23 employers by the average of 1,442 trees per worker day; planting the 120 million trees required 83,481 worker days. On average, the 23 employers had 76 field workers active in tree planting (a total of 1,749 workers employed by the 23 employers). Dividing the total worker days by the

Page 30 of 170 Section 1: Workforce Supply and Demand
total workers active in tree planting, the average number of days worked per field staff member is equal to about 48 days. Employers were most commonly active in tree planting activities in April, May, and June, as shown in the table below.
Table 6: Tree Planting Activity By Months Active, BC, 2013
Sample
Month # of
Employers % Active
January 2 9%
February 5 22%
March 9 39%
April 18 78%
May 19 83%
June 17 74%
July 12 52%
August 7 30%
September 8 35%
October 6 26%
November 0 0%
December 0 0%
According to the BC Ministry of Forests, Lands and Natural Resource Operations, 238,000,000 trees were planted on Crown and private land in 2012/13, as indicated below. The number of trees planted on
Crown and private land per year over the past five years has varied from about 179 million in 2010/11 to 253 million in 2008/09.6
Table 7: Tree Planting in BC, 2008/09 to 2012/13
Fiscal Year Trees Planted
2008/2009 252,600,000
2009/2010 210,200,000
2010/2011 179,000,000
2011/2012 199,900,000
2012/2013 238,000,000
5-‐Year Average 215,940 ,000 Source: BC Ministry of Forests, Lands and Natural Resource Operations. Seedling Requests by Planting Year from 1994 to 2014
6 BC Ministry of Forests, Lands and Natural Resource Operations. Seedling Requests by Planting Year from 1994 to 2014. Accessed March 11, 2014 from: https://www.for.gov.bc.ca/hti/spar/statistics.htm.

Page 31 of 170 Section 1: Workforce Supply and Demand
By dividing number of trees planted on Crown and private land in BC in 2012/13 by the average number of trees planted per day from the survey findings (1,442 trees per day), we estimate that 165,049 worker planting days were required. Dividing this figure by the average number of days worked per
worker calculated from the survey (48 days), we estimate that 3,439 tree planting workers were employed in the industry in 2013.
Table 8: Tree Planting Activities: BC Industry Overall, 2012/2013
Indicator Total
Trees Planted (2012/13) 238,000,000
Tree Planting Worker Days 165,049
Number of Tree Planting Workers 3,439
According to the Ministry, there were 241,700,000 seedlings requested in 2013/14 and 243,100,000
seedlings requested in 2014/15. Using the figures obtained from the survey, this level of planting would require about 167,614 worker days and 3,492 tree planting workers in 2013/14 and 168,585 worker days and 3,512 workers in 2014/15.
2. Brushing and Spacing
In total, 37 out of the 48 employers surveyed (77%) indicated that they were involved in at least some
brushing and spacing activities. Of these 37 employers, 19 reported revenues, 31 reported number of days and workers brushing and spacing, 27 provided estimates of the number of hectares they brushed, and 6 provided estimates of the number they spaced.
On average crews were in the field for 86 days performing brushing and spacing activities (2,667 days
total). Employers reported that the average number of workers on payroll for those activities was 10 workers. Multiplying the total number of days brushing and spacing by the average number of workers per employer, we estimate that field staff worked 26,670 days brushing and spacing.
Table 9: Brushing and Spacing Activities (Employer Survey), BC, 2013
Indicator Total Mean
Revenues $7,072,500 $228,145 Days in Field Brushing and Spacing 2,667 86 Brushing and Spacing Workers 310 10
Brushing and Spacing Worker Days 26,670 860
Page 32 of 170 Section 1: Workforce Supply and Demand
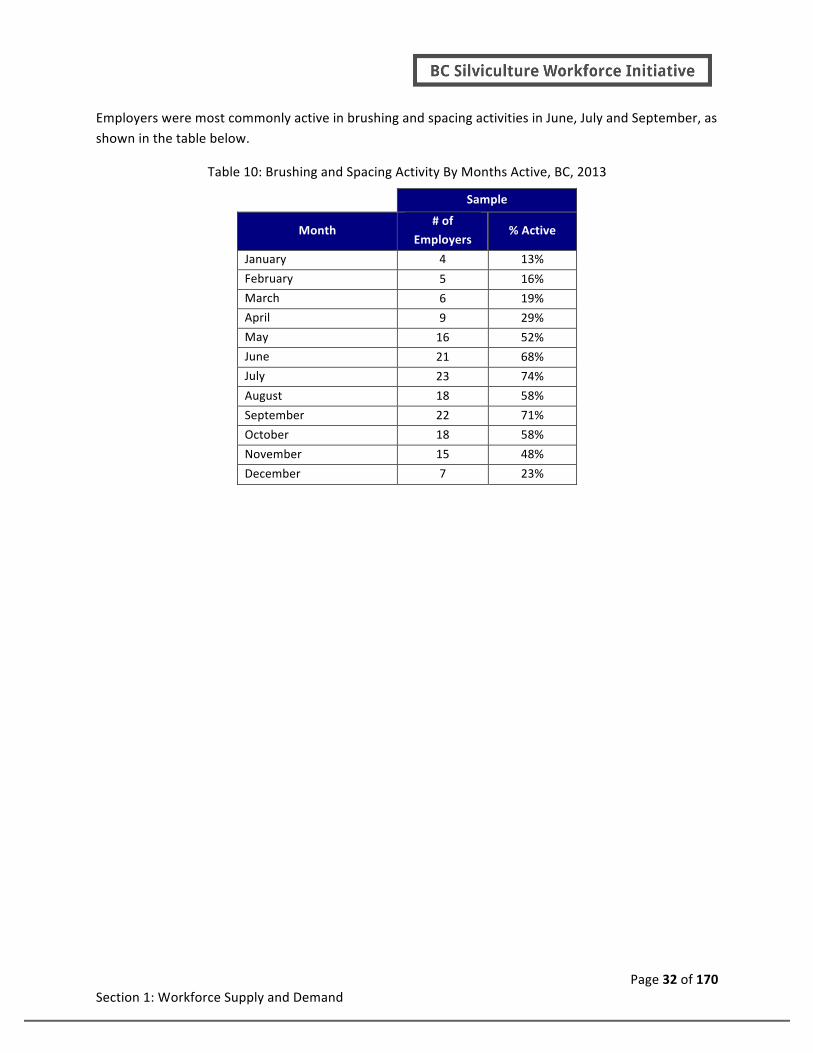
Employers were most commonly active in brushing and spacing activities in June, July and September, as shown in the table below.
Table 10: Brushing and Spacing Activity By Months Active, BC, 2013
Sample
Month # of
Employers % Active
January 4 13%
February 5 16%
March 6 19%
April 9 29%
May 16 52%
June 21 68%
July 23 74%
August 18 58%
September 22 71%
October 18 58%
November 15 48%
December 7 23%

Page 33 of 170 Section 1: Workforce Supply and Demand
Brushing
The 27 employers that provided estimates of the number of hectares brushed reported brushing a total of 7,465 hectares (an average of 277 hectares per employer). Employers reported an average of 3.1 worker days per hectare brushed. Multiplying the total number of hectares brushed by the average
number of worker days per hectare, the total number of brushing worker days comes to 23,141 brushing worker days, as shown in the table below.
Table 11: Brushing Activities (Employer Survey), BC, 2013
Indicator Total Mean
Number of Hectares Brushed 7,465 277 Average Days Per Hectare Brushed 3.1 3.1 Brushing Worker Days 23,141 859
As indicated below, 33,428 hectares of Crown Land were brushed in BC in 2012/13.7
Table 12: Brushing Activities in BC, 2008/09 to 2012/13
Fiscal Year Area (ha)
2008/2009 32,220
2009/2010 28,084
2010/2011 35,635
2011/2012 33,337
2012/2013 33,428
5-‐Year Average 32,541 Source: BC Ministry of Forests and Range. 2012/13 Annual Report Silviculture Tables and Graphs (Graphs 1 to 9).
Multiplying the total number of hectares brushed in BC in 2012/13 by the average worker days per hectare brushed, the total number of brushing worker days would come to 103,627. Dividing the number of brushing worker days by the estimated number of days spent in the field brushing and spacing from
the survey results (86 days) yields an estimated 1,205 brushing workers.
Table 13: Brushing Activities: BC Industry Overall, 2012/13
Indicator Total
Hectares Brushed (2012/13) 33,428
Brushing Worker Days 103,627
Number of Brushing Workers 1,205
7 BC Ministry of Forests, Lands and Natural Resource Operations, 2012/13 Annual Report Silviculture Tables and Graphs (Graphs 1 to 9). Accessed February 12, 2014 from: http://www.for.gov.bc.ca/hfp/silviculture/statistics/2012-‐13.htm.

Page 34 of 170 Section 1: Workforce Supply and Demand
Spacing
Of the 6 employers that provided estimates of the number of hectares they spaced, employers reported spacing a total of 920 hectares (an average of 153 per employer). Employers reported an average of 2.5 worker days per hectares spaced. Multiplying the total number of hectares spaced by the average
workers days per hectare, the total number of spacing worker days comes to 2,300 spacing worker days, as indicated below.
Table 14: Spacing Activities (Employer Survey), BC, 2013
Indicator Total Mean
Number of Hectares Spaced 920 153 Average Days Per Hectare Spaced 2.5 2.5 Spacing Worker Days (Aggregate) 2,300 383
As indicated below, 3,298 hectares of Crown Land were brushed in BC in 2012/13.8
Table 15: Juvenile Spacing Activities in BC, 2008/09 to 2012/13
Fiscal Year Area (ha)
2008/2009 691
2009/2010 2,813
2010/2011 1,930
2011/2012 2,804
2012/2013 3,298
5-‐Year Average 2,307 Source: BC Ministry of Forest, Lands and Natural Resource Operations. Annual Report Silviculture Tables and Graphs (Graphs 1 to 9).
Multiplying the total number of hectares spaced in BC in 2012/13 by the average days per hectare
spaced, the total number of spacing worker days would come to 8,245 spacing worker days. Dividing the number of spacing worker days by the average estimated number of days in the field spent brushing and spacing from the survey results (86 days), comes to 96 spacing workers.
8 BC Ministry of Forests, Lands and Natural Resource Operations, 2012/13 Annual Report Silviculture Tables and Graphs (Graphs 1 to 9). Accessed February 12, 2014 from: http://www.for.gov.bc.ca/hfp/silviculture/statistics/2012-‐13.htm.

Page 35 of 170 Section 1: Workforce Supply and Demand
Table 16: Spacing Activities: BC Industry Overall, 2013
Indicator Total
Hectares Spaced (2012/13) 3,298
Spacing Worker Days 8,245
Number of Spacing Workers 96
3. Wildfire Fighting
In total, 23 out of the 48 employers9 surveyed (48%) indicated that they were involved in wildfire fighting activities. Of these 23 employers, 19 reported revenues and 20 reported number of days and
workers wildfire fighting.
On average, private crews were in the field for 23 days performing wildfire fighting activities in 2013 (452 days total). Employers reported that the average number of workers on payroll for those activities was about 9 workers (total of 183 workers across the 20 employers). Multiplying the total number of
days wildfire fighting by the average number of workers per employer, comes to about 4,068 wildfire fighting worker days.
Table 17: Wildfire Fighting Activities (Employer Survey), BC, 2013
Indicator Total Mean
Revenues $3,461,500 $182,184 Days in Field Wildfire Fighting 452 23 Wildfire Fighting Workers 183 9 Wildfire Fighting Worker Days 4,068 203
The above estimate of 183 wildfire fighting workers were based on response of 8 of the 44 employers
that indicated they were active in wildfire fighting. Based on responses to other questions in the survey, 23 out of the 48 employers responded they indicated they had some involvement in wildfire fighting activities. Based on this estimate, estimates were bumped up from the 183 wildfire fighting workers by
the average workers per firm times the number of firms that are active in wild firefighting, but were not included in the survey question (9 workers)*(36 not surveyed (44-‐8) + 3 that did not respond to the question) = (9 workers*39) = 351 + 183 = 534 wildfire fighting workers.
9 Private wildfire fighting firms supplement the government’s wildfire fighting activities when activity volumes are higher than the government workforce can handle.

Page 36 of 170 Section 1: Workforce Supply and Demand
Employers were most commonly active in wildfire fighting activities in August, as shown in the table below.
Table 18: Wildfire Fighting Activity By Months Active, BC, 2013
Sample
Month # of
Employers % Active
January 0 0%
February 0 0%
March 0 0%
April 1 5%
May 1 5%
June 1 5%
July 6 30%
August 17 85%
September 4 20%
October 6 30%
November 4 20%
December 1 5%
The reported employment in wildfire fighting activities does not include those employed by the BC Ministry of Forests, Lands and Natural Resource Operations. It is estimated that approximately 1,000 workers are employed annually, on a seasonal basis, by the Wildfire Management Branch.
The non-‐government contractors tend to be most busy in years where the level of forest fires in BC is
high. As indicated below, the level of activity can vary widely from year to year.
Table 19: Number, Hectares, and Cost of Forest Fires Fought in BC, 2005-‐2012
Year Fires Total Hectares Total Cost ($ millions)
2005 976 34,588 $47.2
2006 2,570 139,265 $159.0
2007 1,606 29,440 $98.8
2008 2,023 13,240 $82.1
2009 3,064 247.419 $382.1
2010 1,673 337.149 $212.2
2011 655 12,604 $53.5
2012 1,659 102,123 $133.6 Source: Ministry of Forest, Lands and Natural Resource Operations

Page 37 of 170 Section 1: Workforce Supply and Demand
C. ESTIMATED BC SILVICULTURE WORKFORCE
Two approaches have been taken in using the survey results to estimate the total level of employment
in the silviculture sector in BC. The first method relied primarily on using provincial production data (for tree planting, brushing and spacing) and employment production standards to estimate employment by type of activity while the second method used business size data to extrapolate from the survey results
to the known population of employers. The results vary from about 6,995 workers to 7,482 workers.
1. Approach #1 – Using Provincial Production Data
The following table utilizes the employment figures developed in the previous section for tree planning, brushing and spacing. Employment in the wildfire fighting sub-‐sector was developed by extrapolating the employment reported by wildfire fighting firms surveyed to the broader population of employers
(the survey included 8 of the 44 employers in the employer population list believed active in wildfire fighting) and includes the estimated number of seasonal workers employed by the Wildfire Management Branch. It should be noted that the number of private firm workers employed in wildfire
fighting will vary widely from year to year depending upon the level of activity. The survey results were also used to develop an estimate of the workers employed by silviculture firms who are not active in silviculture field activities (e.g. administrative staff or those active in other types of field activities). As
indicated in next table, using this methodology, the number of workers in the sector is estimated to be 7,48210.
Table 20: Approach #1: Based on Provincial Production Data
Sub-‐sector Number of Workers
Tree planting 3,439
Brushing 1,205
Spacing 96
Wildfire Fighting (Industry) 534
Wildfire Fighting (Government) 1,100
Total Field Staff 6,374
Other Workers11 1,108
Total Employment 7,482
10 The strength of this approach is that it relies on provincial production data from the most recent year available (2012/13) and production standards calculated from the survey. According to an online review, the production standards derived from the survey are on-‐par with production standards reported in the literature. The weakness of this approach is that extrapolation was not possible for all types of workers (e.g., other workers and wildfire fighting workers). 11 Note that Other Workers was calculated by subtracting the average number of crew bosses and field workers (59.4) from the average maximum number of workers (71.9), then taking the ratio of Other Workers to Maximum Workers (i.e., 12.5/71.9) and multiplying it by the total field staff in BC (6,374). Some firms reported employing ‘other workers’ who are not active in silviculture field activities (e.g. administrative staff or those active in other types of non silviculture field activities). The 2014 LMI report will collect data to better understand and report who these workers are and the work they perform.

Page 38 of 170 Section 1: Workforce Supply and Demand
These projections suggest that there are over twice as many people equivalents employed in tree planting in BC (3,439) than in brushing and spacing combined (1,301). However, in the survey, employers reported that they had about six times as many workers employed in tree planting (1,917)
than they did in brushing and spacing (298). This occurs because employers that are active in brushing and spacing appear to be under-‐represented in the survey. While the employers surveyed account for 51% of the reported number of trees planted in BC (comparing 2013 data to available 2012/13 data),
they only account for 22% of the hectares brushed and 28% of the hectares spaced.
Table 21: Estimate Coverage of the Tree Planting, Brushing and Spacing Sub-‐sectors
Survey (2013) BC Overall (2012/13) % of BC Overall
Coverage in Terms of Volume
Trees Planted 120,379,298 2389,000,000 51%
Hectares Brushed 7,465 33,428 22%
Hectares Spaced 920 3,298 28%
Coverage in Terms of Employment
Tree Planting 1,917 3,439 56%
Brushing 298
1,161 24%
Spacing 95
2. Approach #2 – Extrapolation Based on Coverage Rates by Size of Employer
A second estimate of the total level of employment in the sector was developed using the coverage rates by size of employer. A population list of 188 private sector employers (in additional to one
government employer) was developed for this project, of which 133 were certified by the BC Forest Safety Council. As part of the certification, the BCFSC publishes data on the size of the employer.
Employment reported in the survey was extrapolated to the total population by multiplying the number of employers within a given size category by the average size of employers surveyed in that category. For those that are not certified, the projection was based on the average size of all the employers
surveyed. As indicated below, using this methodology, the number of workers in the sector is estimated to be 6,995.

Page 39 of 170 Section 1: Workforce Supply and Demand
Table 22: Approach #2: Projections Based on Employer Population Lists
Size of Employer BCFSC Data Number Surveyed
Surveyed Employment
Average Employment
Total Employment
Individual Owner Operator 3 1 1 1 3 2 to 5 employees (ISEBASE) 15 5 18 4 60 6 to 19 employees (SEBASE) 87 13 160 12 1,044 > 20 employees (BASE) 28 27 3,127 116 3,248 Subtotal (BCFSC certified) 133 46 3,306 -‐-‐-‐ 4,355
Not BCFSC certified12 55 -‐-‐ -‐-‐ 28 1,540 Government (Wildfire) 1 -‐-‐ -‐-‐ 1,100 1,100 Total 189 46 3,306 -‐-‐ 6,995
D. BC SILVICULTURE WORKFORCE DEMAND DRIVERS AND OUTLOOK
1. Tree Planting
Labour demand for tree planting is primarily driven by the annual allowable cut (AAC) of private
licensees and BC Timber Sales (BCTS) and provincial programs such as Forests for Tomorrow (FFT) and the Forest Stand Management Fund (FSMF).
According to the Ministry of Forests, Lands and Natural Resource Operations, there were 241,700,000
seedlings requested in 2013/14 and 243,100,000 seedlings requested in 2014/15. Using the figures obtained from the survey, this level of planting would require about 167,614 worker days and 3,492 tree planting workers in 2013/14 and 168,585 worker days and 3,512 workers in 2014/15 using Approach
#1.13
Thereafter, Seedling planting estimates14 are for 200 million seedlings per for the next 10 years, requiring 2,89015 worker annual using Approach #1.
12 Majority of not BCFSC certified employers are involved in wildfire fighting activities as there is not SAFE certification requirement from the Ministry to be considered for work. 13 BC Ministry of Forests, Lands and Natural Resource Operations. Seedling Requests by Planting Year from 1994 to 2014. Accessed March 11, 2014 from: https://www.for.gov.bc.ca/hti/spar/statistics.htm. 14 Ministry of Forests, lands, and Natural Resources Operation, Resource Practice Branch – Lorne Bedford Presentation, Feb 22, 2013 in Prince George 15 (200,000,000 trees planted / 1,442 trees planted per day = 138,696 worker days 138,696 worker days / 48 days = 2,890 tree planting workers)

Page 40 of 170 Section 1: Workforce Supply and Demand
Figure 1: Seedlings planted by responsibility
In 2024/25, due to the reducing AAC, planting volumes are estimated to be 160 million tree seedlings requiring 2,312 workers annually and will remain so until 2030. Planting volumes after 2030 are estimated to drop again to 145 million seedlings per year for the next 20 years until 2050 due to a drop
in FFT levels because at this point natural regeneration of Mountain Pine Beetle (MPB) impacted stands should have advanced enough that starting over would be less effective than letting these stands grow.
Figure 2: Tree Planter Workforce Demand
2. Brushing and Spacing
Labour demand for brushing and spacing are driven by government policies or funding and is seen in licensee practices and government budgets for incremental silviculture activities. These types of
silviculture choices are often influenced by disturbances (e.g., timber harvests, fires, insects, diseases and reforestation failures), public expectations, and market demands. Government budgets for spacing16 have been estimated to be remain steady to 2040 thus the workforce estimates would remain 16 Ministry of Forests, Lands, and Natural Resource Operations,– Lorne Bedford presentation, Feb/13 in Prince George
34923512
2890
2312
0
500
1000
1500
2000
2500
3000
3500
4000
Tree Planting Workers -‐ Demand

Page 41 of 170 Section 1: Workforce Supply and Demand
at 96 spacing workers for the foreseeable future. Further information will need to be collected with respect to the outlook on brushing activities; however, a steady outlook would require 1,205 brushing workers annually.
Figure 3: Spacing Volumes – 2014 to 2050
3. Wildfire Fighting
Labour demand for wildfire fighting is primarily dependent on weather and fuel accumulation on the forest floor. With climate change and an increase in extreme weather conditions and human presence in the backcountry, the labour demand for wildfire fighting is expected to steadily increase over the long
term. It is difficult to estimate the extent of the increase
E. HISTORICAL WORKFORCE SUPPLY
Over the last 5 years, cumulative silviculture workforce supply in BC has fluctuated. Tree planting
workforce supply has ranged from a low of 2,586 (2010/11) to 3,650 (2008/09) workers, a 41% variance. Brushing workforce supply has ranged from a low of 1,012 (2009/10) to 1,285 (2010/11) workers, a 27% variance. Spacing workforce supply has ranged from a low of 20 (2008/09) to 96 (2012/13) workers, a
380% variance. Wildfire fighting workforce supply has ranged somewhat from 1,314 (2011/12) to 2,627 (2009/10), a 100% variance. Other silviculture workers have ranged from 954 (2011/12) to 1,175 (2009/10) workers, a 23% variance.
-‐
5,000
10,000
15,000
20,000
25,000
30,000
35,000 Area (ha)
Fer{liza{on Spacing
Spacing Volumes – 2014-‐2050

Page 42 of 170 Section 1: Workforce Supply and Demand
Table 23: Historical Silviculture Workforce Supply, 2008/09 to 2012/13
Year Tree Planting Brushing Spacing Wildfire
Fighting Other Total Workers
2008/2009 3,650 1,161 20 1,428 1,088 7,347 2009/2010 3,037 1,012 82 2,627 1,175 7,933 2010/2011 2,586 1,285 56 1,948 1,021 6,896 2011/2012 2,888 1,202 82 1,314 954 6,440 2012/2013 3,439 1,205 96 1,634 1,108 7,482
Historical data on trees planted, hectares brushed and spaced, and hectares with wildfires was used to calculate the historical workforce projections using Approach #1 (https://www.for.gov.bc.ca/hfp/silviculture/statistics/2012-‐13.htm) and https://www.for.gov.bc.ca/hti/spar/statistics.htm).
Figure 4: Historic BC Silviculture Workforce Supply – 2008 to 2013
7,347
7,933
6,896
6,440
7,482
0
1,000
2,000
3,000
4,000
5,000
6,000
7,000
8,000
9,000
Tree Plan{ng
Brushing
Spacing
Wildfire Figh{ng
Other
Total Workers

Page 43 of 170 Section 2: Employee Profile
Section 2 Employee Profile (Respondents)
Characteristics of employees responding to survey
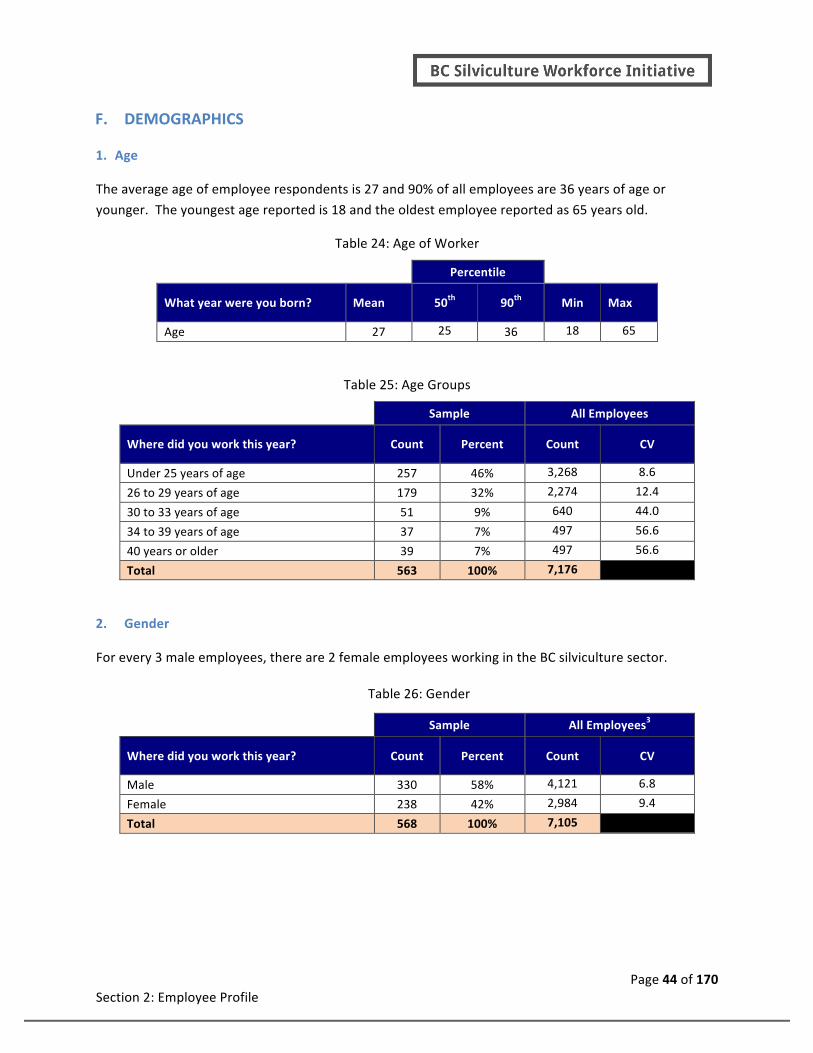
Page 44 of 170 Section 2: Employee Profile
F. DEMOGRAPHICS
1. Age
The average age of employee respondents is 27 and 90% of all employees are 36 years of age or
younger. The youngest age reported is 18 and the oldest employee reported as 65 years old.
Table 24: Age of Worker
Percentile
What year were you born? Mean 50th 90th Min Max
Age 27 25 36 18 65
Table 25: Age Groups
Sample All Employees
Where did you work this year? Count Percent Count CV
Under 25 years of age 257 46% 3,268 8.6
26 to 29 years of age 179 32% 2,274 12.4
30 to 33 years of age 51 9% 640 44.0
34 to 39 years of age 37 7% 497 56.6
40 years or older 39 7% 497 56.6
Total 563 100% 7,176
2. Gender
For every 3 male employees, there are 2 female employees working in the BC silviculture sector.
Table 26: Gender
Sample All Employees3
Where did you work this year? Count Percent Count CV
Male 330 58% 4,121 6.8
Female 238 42% 2,984 9.4
Total 568 100% 7,105
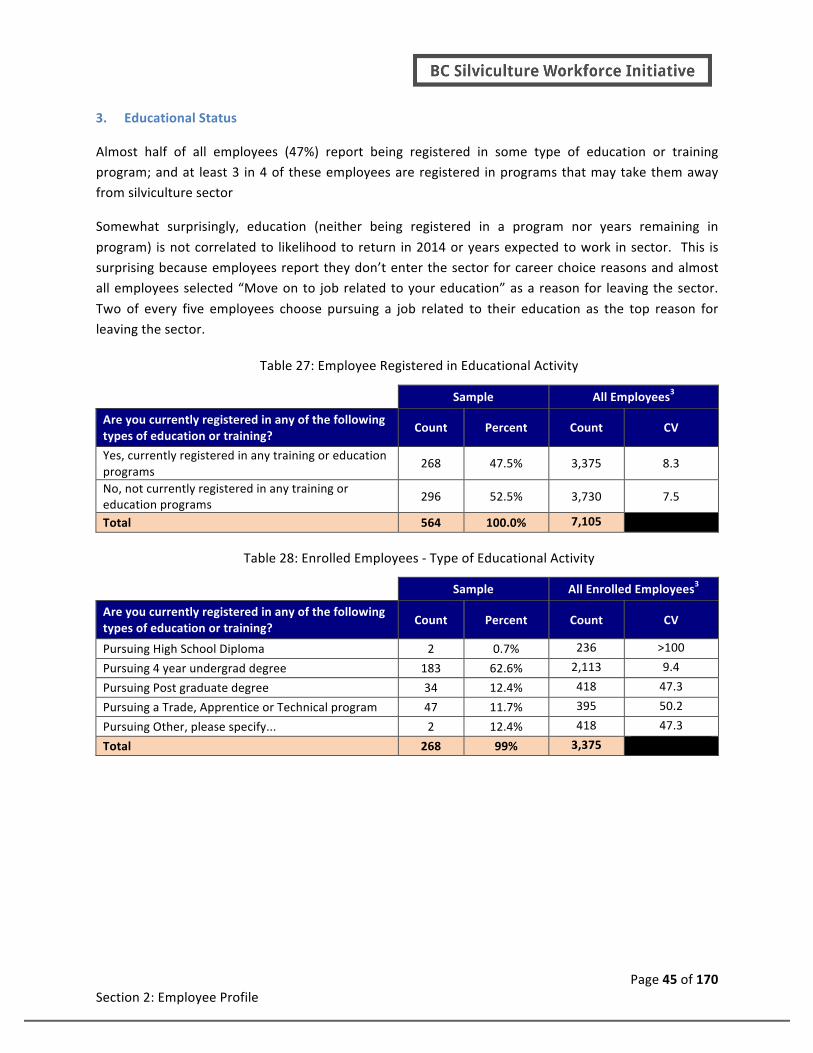
Page 45 of 170 Section 2: Employee Profile
3. Educational Status
Almost half of all employees (47%) report being registered in some type of education or training program; and at least 3 in 4 of these employees are registered in programs that may take them away from silviculture sector
Somewhat surprisingly, education (neither being registered in a program nor years remaining in
program) is not correlated to likelihood to return in 2014 or years expected to work in sector. This is surprising because employees report they don’t enter the sector for career choice reasons and almost all employees selected “Move on to job related to your education” as a reason for leaving the sector.
Two of every five employees choose pursuing a job related to their education as the top reason for leaving the sector.
Table 27: Employee Registered in Educational Activity
Sample All Employees3
Are you currently registered in any of the following types of education or training?
Count Percent Count CV
Yes, currently registered in any training or education programs
268 47.5% 3,375 8.3
No, not currently registered in any training or education programs
296 52.5% 3,730 7.5
Total 564 100.0% 7,105
Table 28: Enrolled Employees -‐ Type of Educational Activity
Sample All Enrolled Employees3
Are you currently registered in any of the following types of education or training?
Count Percent Count CV
Pursuing High School Diploma 2 0.7% 236 >100
Pursuing 4 year undergrad degree 183 62.6% 2,113 9.4
Pursuing Post graduate degree 34 12.4% 418 47.3
Pursuing a Trade, Apprentice or Technical program 47 11.7% 395 50.2
Pursuing Other, please specify... 2 12.4% 418 47.3
Total 268 99% 3,375

Page 46 of 170 Section 2: Employee Profile
About 1 in 10 employees that say they have finished their program of study (11%) also say they will not
return to work in silviculture sector next season.
Table 29: Enrolled Employees – Years left in program
Sample All Enrolled Employees3
How many years do you have left before you complete your education or training?
Count Percent Count CV
None 38 14.6 493 39.7
1 year 106 40.6 1,370 14.3
2 year 75 28.7 969 20.2
3 year 24 9.2 310 63.0
4 year 16 6.1 205 95.1
More than 4 years 2 0.8 270 >100
Total 261 100% 3,375
4. First Nations Status
Canada’s 2011 census suggests that First Nations people represent about 4% of total Canadian population and almost 5% of the BC population. This survey finds about 4% of respondents reported they are First Nations or Metis; and, about half of First Nations/Metis employees say they are a member
of an Indian Band/First Nation.
Table 30: Employees – First Nations
Sample All Employees3
Are you a First Nations person, that is, First Nations (North American Indian), Metis, or Inuk (Inuit)?
Count Percent Count CV
No, not an Aboriginal person 531 95.8% 6,807 4.2
First Nations (North American Indian) 13 2.4% 170 >100
Metis 10 1.8% 128 >100
Total 554 100% 7,105
Table 31: First Nations – Band Membership
Sample All First Nation Employees3
Are you a member of an Indian Band/First Nation? Count Percent Count CV
No 12 52% 155 37.9
Yes 11 48% 143 41.0
Total 23 100% 298

Page 47 of 170 Section 2: Employee Profile
G. CAREER HISTORY
1. Total Years of Experience
Half of all employees reported 3 or less years of experience working in the silviculture sector and 90%
have 14 or fewer years of experience. The average years of experience is 6 years because of a few employees with much higher years of experience. The longest years of experience was reported by a 65 year old employee working in Tree Planting Sector, holding the position supervisor or crew boss.
Table 32: Years of Experience
Percentile
Please tell us how many years of experience you have in the silviculture sector?
Mean 50th 90th Min Max
Years of experience 6 3 14 1 43
2. Years of Experience by Type Worker
Field workers reported less than half of the years of experience of workers with management and
supervision type responsibilities.
Table 33: Years of Experience by Type responsibility – Field Worker
Percentile
Please tell us how many years of experience you have in the silviculture sector? Mean 50th 90th Min Max
Years of experience 5 3 11 1 33
Table 34: Years of Experience by Type responsibility – Lead Hand
Percentile
Please tell us how many years of experience you have in the silviculture sector? Mean 50th 90th Min
Max
Years of experience 11 9 20 1 30
Table 35: Years of Experience by Type responsibility – Supervision or Crew Boss
Percentile
Please tell us how many years of experience you have in the silviculture sector? Mean 50th 90th Min Max
Years of experience 13 10 30 1 43

Page 48 of 170 Section 2: Employee Profile
Table 36: Years of Experience by Type responsibility – Project manager
Percentile
Please tell us how many years of experience you have in the silviculture sector? Mean 50th 90th Min Max
Years of experience 16 13 31 5 35
3. Employer History
On average employees report having 3 employers during their career and 90% of all employees report fewer than 7 employers during their career. The maximum number of employers reported was 21. This number of employers was reported by a 57 year old field worker reporting to work in Tree Planting
and Brushing and Spacing subsectors.
Table 37: Number of Employers during career
Percentile
How many different Silviculture employers have you worked for? Mean 50th 90th Min Max
Years of experience 3 2 7 1 21
Transient Score
For analysis purposes we created a variable called transient score. Employees that have more years of
experience than number of employers are likely to have different experience and opinion than those who have a serial employer type history.
Table 38: Transient Employee
Sample All Employees3
Type of employee Count Percent Count CV
More years of experience than employers 383 63% 4,476 6.3
Number of employer = years of experience 168 29% 2,060 13.6
Number of employers > than years of experience 49 8% 568 49.5
Total 100% 7,105
No statistically significant relationships were found between an employee’s transient score and desired outcomes17.
17 The desired outcomes used in our analysis are outlined in the Key Driver section of this report; they include -‐ satisfaction with the employees work day, willingness to recommend employer, willingness to recommend working in the Silviculture Sector, how many years employee expects to continue doing silviculture work, career satisfaction.

Page 49 of 170 Section 2: Employee Profile
H. 2013 EXPERIENCE
1. Roles and Responsibilities
Ninety two percent of employee respondents classified themselves as a field worker. Many employers
held several different positions in the 2013 season.
Table 39: Roles and Responsibilities – All Silviculture Employees
Sample All Employees3
During 2013 what positions (responsibilities) did you hold? (n=648)
Count Percent Count CV
Field Worker 610 94% 6,678 3.9
Lead hand-‐responsible for single crew/multi crew 56 9% 639 40.7
Supervisor or Crew boss 94 14% 995 26.2
Project manager 26 4% 284 91.7
Total 648 7,105
Table 40: Count of Positions -‐ All Silviculture Employees
Sample All Employees3
During 2013 what positions (responsibilities) did you hold?
Count Percent Count CV
Only one position 547 83% 5,897 4.4
Two positions 84 13% 924 28.2
Three positions 22 3% 213 >100
Four positions 7 1% 71 >100
Total 638 100 % 7,105
Field Workers
Table 41: Roles and Responsibilities – Lead Hand
During 2013 what positions (responsibilities) did you hold? # of
Employees % of
Employees
Field Worker 597 100%
Lead hand-‐responsible for a single crew in a multi crew 44 7%
Supervisor or Crew boss 54 9%
Project manager 11 2%

Page 50 of 170 Section 2: Employee Profile
Table 42: Count of Positions – Lead Hand
During 2013 what positions (responsibilities) did you hold? # of
Employees % of
Employees
Only one position 498 83%
Two positions 71 12%
Three positions 21 3%
Four positions 7 1%
Total 93 100%
Lead Hand (n=56)
Table 43: Roles and Responsibilities – Lead Hand
During 2013 what positions (responsibilities) did you hold? # of
Employees % of
Employees
Field Worker 44 79%
Lead hand-‐responsible for a single crew in a multi crew 56 100%
Supervisor or Crew boss 27 48%
Project manager 6 11%
Table 44: Count of Positions – Lead Hand
During 2013 what positions (responsibilities) did you hold? # of
Employees
% of
Employees
Only one position 7 12%
Two positions 26 46%
Three positions 16 29%
Four positions 7 12%
Total 93 100%

Page 51 of 170 Section 2: Employee Profile
Supervisor or Crew Boss (n=93)
Table 45: Roles and Responsibilities – Supervisor or Crew Boss
During 2013 what positions (responsibilities) did you hold? # of
Employees
% of
Employees
Field Worker 54 58%
Lead hand-‐responsible for a single crew in a multi crew 27 29%
Supervisor or Crew boss 93 100%
Project manager 19 20%
Table 46: Count of Positions – Supervisor or Crew Boss
During 2013 what positions (responsibilities) did you hold? # of
Employees % of
Employees
Only one position 25 27%
Two positions 29 42%
Three positions 32 24%
Four positions 7 7%
Total 93 100%
Project Manager (n=26)
Table 47: Roles and Responsibilities – Project Manager
During 2013 what positions (responsibilities) did you hold? # of
Employees % of
Employees
Field Worker 11 42%
Lead hand-‐responsible for a single crew in a multi crew 6 23%
Supervisor or Crew boss 19 73%
Table 48: Count of Positions – Project Manager
During 2013 what positions (responsibilities) did you hold? # of
Employees
% of
Employees
Only one position 5 19%
Two positions 11 42%
Three positions 5 19%
Four positions 5 19%
Total 26 100%

Page 52 of 170 Section 2: Employee Profile
Tree Planters
Table 49: Tree Planters: Subsectors worked in
What types of silviculture activities did you do in BC during 2013? =
Tree Planter (n=678)
# of
Employees
% of
Employees
Tree Planting 678 100%
Brushing and Spacing 73 11%
Wildfire Fighting 46 7%
None of above, specify* 0 0%
1 Subsector Only 584 86%
2 Subsectors 69 10%
3 Subsectors 25 4%
Table 50: Tree Planters: Positions held
What types of silviculture activities did you do in BC during 2013? =
Tree Planter (n=678)
# of
Employees
% of
Employees
Field Worker 597 88%
Lead hand-‐responsible for a single crew in a multi crew 56 8%
Supervisor or Crew boss 93 14%
Project manager 26 4%
Other, not listed above 34 5%
Only one position 544 80%
Two positions 84 12%
Three positions 22 3%
Four positions 7 1%
Brushing & Spacing
Table 51: Brushing & Spacing Employees: Subsectors worked in
What types of silviculture activities did you do in BC during 2013? = Brushing & Spacing (n=73)
# of Employees
% of Employees
Tree Planting 73 100%
Brushing and Spacing 73 100%
Wildfire Fighting 25 34%
None of above, specify* 18 25%
1 Subsector Only 0 0%
2 Subsectors 48 66%
3 Subsectors 25 34%

Page 53 of 170 Section 2: Employee Profile
Table 52: Brushing & Spacing: Positions worked in
What types of silviculture activities did you do in BC during 2013? = Brushing & Spacing (n=73)
# of Employees
% of Employees
Field Worker 63 86%
Lead hand-‐responsible for a single crew in a multi crew 10 14%
Supervisor or Crew boss 24 33%
Project manager 12 16%
Other, not listed above 1 1%
Only one position 45 61%
Two positions 18 25%
Three positions 7 10%
Four positions 2 3%
Wildfire Fighting
Table 53: Wildfire Fighting Employees: Subsectors worked in
What types of silviculture activities did you do in BC during 2013? = Wildfire Fighting (n=46)
# of Employees
% of Employees
Tree Planting 46 100%
Brushing and Spacing 25 54%
Wildfire Fighting 46 100%
None of above, specify* 0 0%
1 Subsector Only 0 0%
2 Subsectors 21 46%
3 Subsectors 25 54%
Table 54: Wildfire Fighting: Positions worked in
What types of silviculture activities did you do in BC during 2013? = Wildfire Fighting (n=46)
# of Employees
% of Employees
Field Worker 39 85%
Lead hand-‐responsible for a single crew in a multi crew 7 15%
Supervisor or Crew boss 20 43%
Project manager 7 15%
Other, not listed above 1 2%
Only one position 26 56%
Two positions 13 28%
Three positions 6 13%
Four positions 1 2%

Page 54 of 170 Section 2: Employee Profile
2. Subsector Activity
All employees reported working in the Tree Planting subsector; close to 1 in 10 employees also reported working in the Brushing and Spacing subsector. Only 6% of these employees reported they worked in the Wildfire Fighting sector.
Table 55: Employee Subsector Activity
What types of silviculture activities did you do in BC during 2013? (n=669)
# of Employees
% of Employees
Tree Planting 668 100
Brushing and Spacing 73 11%
Wildfire Fighting 46 7%
None of above, specify 0 0%
Three out of every 4 employees (76%) worked in only one subsector and 85% worked in total of two
subsectors. Only 3% of the workforce reported working in all three subsectors.
Table 56: Number of Subsectors worked in by an silviculture employee
What types of silviculture activities did you do in BC during 2013? # of
Employees % of
Employees
1 Subsector Only 602 76%
2 Subsectors 69 9%
3 Subsectors 25 3%
Total 794 100%
3. Locations Worked
Fifty percent of the BC Silviculture workforce reported working in other jurisdictions outside of BC, with 45% reported working in Alberta.
Table 57: Work Province -‐ All Silviculture Employees
Where did you work this year? (n=649) # of Employees
% of Employees
British Columbia 669 100%
Alberta 304 45%
Other Canadian Province 40 6%
Other Country 20 2%
About 9 in 10 employees (91%) reported working in three or fewer BC regions. The average number of
regions worked in was 2 while a very few employees (>2%) worked in 6 or more BC regions.

Page 55 of 170 Section 2: Employee Profile
Table 58: Number of BC regions worked in 2013
Avr 90th
percentile Max
Regions 2 3 8
Most reported working in the Cariboo Region (46%) followed by Ominica (35%), Thompson/Okanagan Region (29%), West Coast Region (25%), Skeena (21%), Northeast (18%), Kootenay/Boundary (14%).
Less than 1 in 10 employees (7%) reported working in the South Coast Region.
Table 59: Work Region -‐ BC
Where did you work this year? (n=649) # of Employees
% of Employees
A -‐ West Coast Region 159 25%
B -‐ Skeena Region 134 21%
C -‐ Omineca Region 228 35%
D -‐ Northeast Region 120 18%
E -‐ Cariboo Region 301 46%
F -‐ South Coast Region 43 7%
G -‐ Thompson/Okanagan Region 187 29%
H -‐ Kootenay/Boundary Region 93 14%
Table 60: Number of BC Regions worked in
Where did you work this year? (n=649) # of Employees
% of Employees
Only 1 Region 224 37%
2 regions 206 34%
3 regions 124 20%
4 regions 39 6%
5 regions 9 1%
6 regions 4 >1%
7 regions 0 0%
8 regions 4 >1%
Neither region worked in nor the number of regions worked in is statistically correlated with key outcomes such as willingness to recommend employer; satisfaction with 2013 work day; likelihood of recommending silviculture sector; or years employees expect to continue doing silviculture work.

Page 56 of 170 Section 2: Employee Profile
4. Accommodations and Camp Services
On average an employee worked in five different geographical regions during a season.
Table 61: Total Number of locations stayed at
How many different [type accommodation] locations did you stay at during the 2013 season? Avr
90th percentile
Min Max
Count 5 9 1 30
The number of locations stayed at is statistically correlated to how likely they are to return in 2014.
Table 62: Number of locations Correlation with…
Pearson’s r R2
How likely are you to return to silviculture work in 2014? .135* .162
Type of Accommodation
About half of all employees experience only one type of accommodation while 41% report two types of
accommodation during the season. About 10% of employees experience 3 or more different types of accommodation during the season.
Table 63: Type Accommodation
First, we need to know about the different types of accommodation
you experienced during 2013 silviculture season. (n=582) # of
Employees % of
Employees
Camp 517 80%
Hotel 300 46%
House Rental 65 10%
Stayed in own home* 48 7%
Total Type Accommodation
Only one type 290 50%
2 types 239 41%
3 types 50 9%
4 types 3 >1% Total 582
*Only 8 employees (1%) reported living at home as the only type of accommodation used during season.
The number of different types of accommodations experienced is statistically correlated to how likely employees report they are to return in 2014 and their overall satisfaction with their work day.
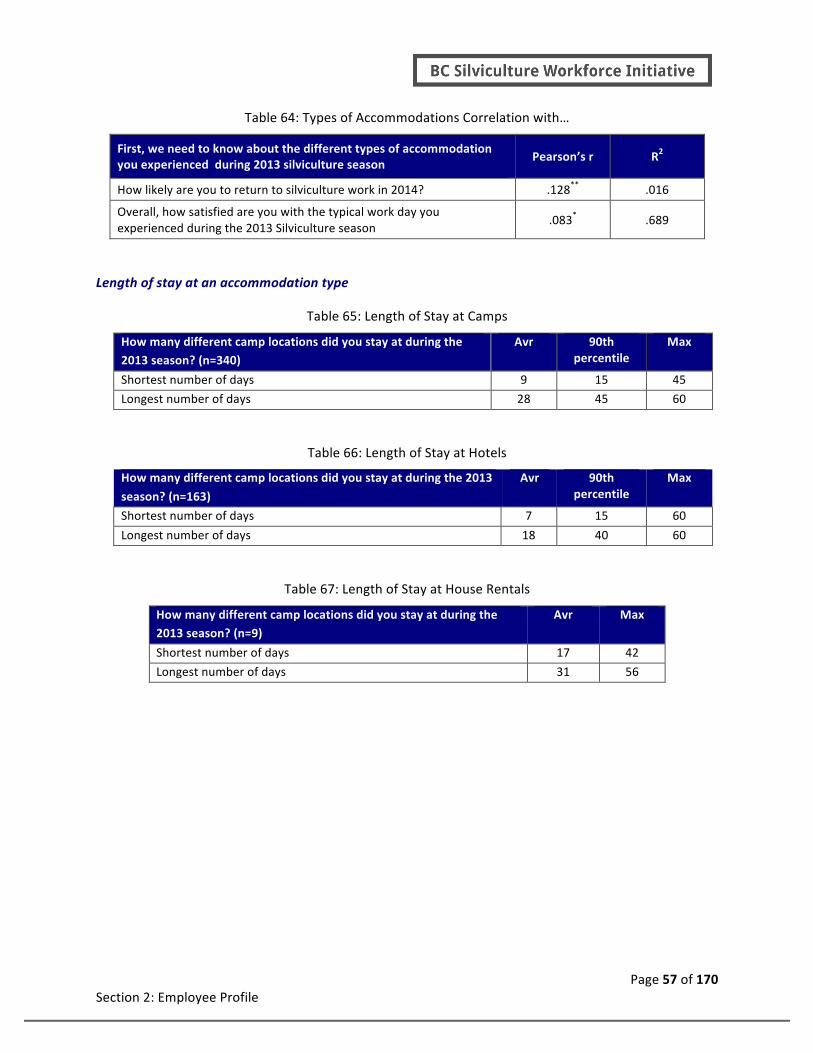
Page 57 of 170 Section 2: Employee Profile
Table 64: Types of Accommodations Correlation with…
First, we need to know about the different types of accommodation you experienced during 2013 silviculture season
Pearson’s r R2
How likely are you to return to silviculture work in 2014? .128** .016
Overall, how satisfied are you with the typical work day you experienced during the 2013 Silviculture season
.083* .689
Length of stay at an accommodation type
Table 65: Length of Stay at Camps
How many different camp locations did you stay at during the 2013 season? (n=340)
Avr 90th percentile
Max
Shortest number of days 9 15 45
Longest number of days 28 45 60
Table 66: Length of Stay at Hotels
How many different camp locations did you stay at during the 2013
season? (n=163)
Avr 90th percentile
Max
Shortest number of days 7 15 60
Longest number of days 18 40 60
Table 67: Length of Stay at House Rentals
How many different camp locations did you stay at during the 2013 season? (n=9)
Avr Max
Shortest number of days 17 42
Longest number of days 31 56

Page 58 of 170 Section 2: Employee Profile
Camp Internet and Cell Phone Coverage
Table 68: Camp Internet Access
Did you have internet access at your camp? # of Employees
% of Employees
Yes 180 35%
No 328 65%
Total 508 100%
Table 69: Camp Cell Phone Coverage
Did you have cell phone coverage at your camp? # of Employees
% of Employees
Yes 205 40%
No 303 60%
Total 508 100%
5. Employer History 2013
Most employees reported working for only one employer during 2013 season and 90% of all employees
reported 2 or fewer employers. Three employees reported working for 5 different employers during the season. Two of these employees said the fewest number of days with an employer was 6 days, the
other employee reported the fewest days as 14.
Table 70: Number of 2013 Employers
How many different Silviculture employers have you
worked for? Avr
90th percentile
Minx Max
Number of employers 1 2 5
Table 71: Duration with Employer 2013
How many different camp locations did you stay at during the 2013 season? (n=340)
Avr 90th
percentile Min Max
Shortest number of days 22 40 6 120
Longest number of days 67 115 6 210
The number of employers an employee reported was correlated with two key outcomes -‐how many years the employee expected to continue doing silviculture work and the likelihood the employee would
return for the 2014 season.

Page 59 of 170 Section 2: Employee Profile
Table 72: Number of 2013 Employers Correlation with years left in career
Pearson’s r R2
How many years do you expect to continue doing silviculture work? .155** .024
How likely are you to return to silviculture work in 2014? .155* .024
6. Employee Injuries
A total of 214 employees reported they had at least one type of injury (37%). Average number of days
lost due to injury is 5 days. Number of days lost due to injury was not statistically correlated to any of the key outcome questions.
Table 73: Days missed due to injury
Avr
90th percentile
Min Max
Days Missed 5 10 1 60
About 1 of every 3 employees (34%) report missed days due to overuse, strain or exertion type injury
while about 1 in 10 reported missed days due to an actual incident. The average number of days increased to 6 days for employees that say they experienced lost days due to an actual incident.
Table 74: Employee type injury
Type Injury # of Employees
% of Employees
(A) Yes -‐ Overuse, strain or exertion related injury N=573 198 34%
(B) Yes -‐ ACTUAL INCIDENTS N=569 70 12%
At least one type 214 37%
(A) Only overuse, strain or exertion related injury 142 25%
(B) Only ACTUAL INCIDENTS 16 3%
Both type injury 54 9%
Either A or B 214 37%

Page 60 of 170 Section 2: Employee Profile
Of possible concern is that almost 1 in 4 employees (23%) say they were involved in a near miss type
incident that almost resulted in personal injury.
Table 75: Employee type injury
Were you involved in any NEAR MISS INCIDENTS that almost resulted in injury to you?
# of Employees
% of Employees
Yes 132 23%
No 442 77%
Total 574 100%
7. Income
Given the fact that all workers were involved in the Tree Planting activities it is not surprising to find that
almost all say they were paid based on piece count.
Table 76: Payment Methods -‐ All Silviculture Employees
How was your pay calculated? # of
Employees % of
Employees
Paid based on piece count 564 87%
Paid an hourly rate 76 12%
Paid based on a completion rate 11 2%
Total 651 100%
Thirty six percent of supervisors report pay based on hourly rate compared to 11% for field workers. Lead hand was the employee type most likely to be paid based on completion rate.
Table 77: Payment methods by type position
How was your pay calculated? %
Field %
Lead Hand %
Supervisor
% Project Manager
Paid based on piece count 87% 61% 58% 68%
Paid an hourly rate 11% 30% 36% 27%
Paid based on a completion rate 2% 9% 6% 4%
Daily wages earned
The average daily wage earned by employees is $261 and almost all (90%) earn $364 or less. The
difference between the average perceived fair daily wage and actual daily wage is $38.

Page 61 of 170 Section 2: Employee Profile
Table 78: Silviculture Income
Average
90th percentile
Min* Max
Fair Daily Wage $299 $400 $60 $650
Actual Daily Wage $261 $364 $75 $675
Each employee wage differential was calculated by subtracting their fair daily wage from actual daily wage (Daily Wage Earned – Fair Daily Wage). The average difference (mean and median) across all
employees for this variable is $40 and ranged widely between negative $350 and plus $400. The wage difference variable was used to test what impact earning more/less than is perceived as a fair daily wage has on what employees report as expected total silviculture income and overall satisfaction with
income.
Table 79: Actual daily wage and expected silviculture income
Daily wage
Where your DAILY gross earnings what you expected to earn during 2013 Silviculture season?
% Below Fair
% Match Fair
% Above Fair
Daily Wage: Earned more this season then I expected (n=53) 17% 40% 43%
Daily Wage Earned about what I expected (n=329) 7% 27% 66% Daily Wage Earned less than what I expected (n=224) 85% 11% 4%
Not surprisingly we see in the above table that all the employees that say they earned less daily wage
then expected also report that their daily wage was below what they think is a fair daily wage (85%). In contrast, only 17% of employees that say the earned higher daily wage than expected also report their actual daily wage is below what they feel is a fair daily wage.
Employees that say their daily wage is about what they expected report their daily wage was above
what they report as a fair daily wage (66%). Only 7% of employees that report their daily wage matched what they expected also report their daily wage falling below what they report as fair daily wage. This
group might be those employees that went into the season with low expectations and had those expectations become a reality.
Table 80: Actual daily wage and expected silviculture income
Overall, how satisfied are you with the income you earned \ work in the Silviculture Sector in 2013?
Daily wage – Fair daily wage % Dissatisfied ( 0 – 3)
% Neither (4-‐6)
% Satisfied ( 7 – 10)
Daily wage lower than fair daily wage (n=418) 7% 36% 9% Daily wage matches fair daily wage (n=132) 0% 20% 80% Daily wage higher than fair daily wage (n=42) 5% 45% 50%
An interesting finding is that overall satisfaction with income is greatest when employees' actual daily
wage matched what they perceive to be a fair daily wage (80% satisfied). When employees' daily wage

Page 62 of 170 Section 2: Employee Profile
is less than what they report as a fair daily wage they are most likely to report being neither satisfied nor dissatisfied (36%). Employees with a daily wage greater than what they report as a fair wage are roughly split between satisfied (50%) and neither satisfied/dissatisfied (45%). Perhaps this later group would
have liked to have had more opportunity to earn income while their daily wage was higher than what they expected.
Employee daily wage is correlated with four key outcomes.
Table 81: Daily Wage relationship to key outcomes
Pearson’s r R2
Overall, how satisfied are you with the income you earned from work in the Silviculture Sector in 2013?
.233** .054
How many years do you expect to continue doing silviculture work? .203** .041
How likely are you to return to silviculture work in 2014? .157** .025
Reflecting on those years, how satisfied or dissatisfied are you with your experience doing silviculture work?
.147** .022
Total Silviculture Income
The average income earned by employees is $15,137 and almost all (90%) earn $30,000 or less. One
employee reporting $1,300 of silviculture income but other income from employment insurance for total income of $9,000.
Table 82: Silviculture Income
Average 90th
percentile
Min Max
Silviculture Income $15,137 $30,000 $1,300 $60,000
Half of all employees (51%) said they earned about what they expected, while about 2 of every 5 said they earned less than expected. About 1 in 10 employees report earning more than expected.
Table 83: Actual versus Internet Access
Was the total amount you earned close to what you expected from
working in the 2013 Silviculture season?
# of
Employees
% of
Employees
Earned more this season then I expected 54 9%
Earned about what I expected 304 51%
Earned less than what I expected 235 39%
Total 593 100%
Totalsilviculture income is correlated with two key outcomes – years expected to continue doing silviculture work and overall satisfaction with income.

Page 63 of 170 Section 2: Employee Profile
Table 84: Total Silviculture Income relationship to key outcomes
Pearson’s r R2
How many years do you expect to continue doing silviculture work? .274** .075
Overall, how satisfied are you with the income you earned from work in the Silviculture Sector in 2013?
.111* .012
Total Other Income
The average income earned by employees is $15,137 and almost all (90%) earn $30,000 or less. One
employee reported $1,500 total income but no income from silviculture. This income was reported as coming from employment insurance.
Table 85: Other Income
What do you estimate will be your total gross earnings from all sources in 2013?
Average 90th percentile Min Max
Other Income $23,939 $42,000 $1,500 $65,000
Silviculture Income as percent of total Income
Silviculture income is an important source of income to employees, but as noted previously it is not their only source of income. On average silviculture income represents 63% of an employee’s total income.
Only 7% of employees report that silviculture income represents 100% of their total income.
Table 86: Silviculture Income as % of Total Income
Avr 90th percentile
Min Max
Silviculture Income as % total income 63% 94% 10% 100%
Dependency on silviculture income is correlated with how likely an employee is to return to work next
season and how likely they are to recommend working in the silviculture sector. Income dependency does not correlate with overall satisfaction with income.
Table 87: Income dependency relationship to key outcomes
Pearson’s r R2
How likely are you to return to silviculture work in 2014? .201** .040
How likely is it that you would recommend working in the Silviculture Sector?
-‐.091* .008
Factors that limit income
Given the importance of income we asked employees to provide. Low prices per tree was selected as a reason by almost half (48%) of employees. When selected it was first choice 59%, second choice 25%

Page 64 of 170 Section 2: Employee Profile
and third choice 16% of the time. While low prices per tree may be a function of the employer's contract, other factors listed (such as injuries, availability of work days, travel time to work site, and employer disorganization) are all areas for operational improvement.
Table 88: What limits your silviculture income (number of employee who selected each factor)
What factors limit your ability to maximize the income you earn from silviculture?
# Employees % Employees
Low prices per tree for type of ground 284 48%
Injuries taking their toll on your body 97 16%
Availability of work days 77 13%
Too much time traveling from muster station to work site 54 9%
Disorganization of employer 39 7%
Poor sleep 23 4%
Poor food/nutrition 15 2%
Poor equipment 2 >1%
Table 89: What limits your silviculture income (when selected)
Listed below are some of the more common ways that people found their first Silviculture job.
% 1st Choice
% 2nd Choice
% 3rd Choice
Low prices per tree for type of ground 59% 25% 16%
Injuries taking their toll on your body 30% 34% 36%
Availability of work days 35% 33% 33%
Too much time traveling from muster station to work site 20% 44% 37%
Disorganization of employer 19% 41% 40%
Poor sleep 19% 27% 54%
Poor food/nutrition 28% 41% 31%
Poor equipment 6% 39% 54%
While 87% of employees receive pay based on only one method we found that about 1 in 10 receive
payment based on two methods and a small proportion (2%) received pay based on all three methods.
Table 90: Count of Payment Methods -‐ All Silviculture Employees
How was your pay calculated? # of
Employees % of
Employees
Only one method 564 87%
Two methods 76 12%
Three methods 11 2%
Total 651 100%

Page 65 of 170 Section 2: Employee Profile
A majority of employees report being satisfied with accuracy, timeliness of payroll, and availability of
advances. Just over 1 in 10 employee report being dissatisfied with these same attributes of payroll.
Table 91: Satisfaction with payroll
How was your pay calculated? % Not
Satisfied %
Satisfied
Accuracy of your payroll stub information 14% 86%
Timely payment of wages 12% 88%
Availability of advances 12% 88%
8. Technology Access
Given the age profile and mobility of the workforce, it is not surprising to find that 90% of employees own a cell or smart phone.
Table 92: Type Mobile Phone
Which of the following technology do you own # of
Employees
% of
Employees
Cell Phone 128 22%
Smart Phone (e.g. IPhone, Android smart phone, etc) 371 65%
Both Cell and Smart Phone 14 2%
No phone 57 10%
Total 570 99%
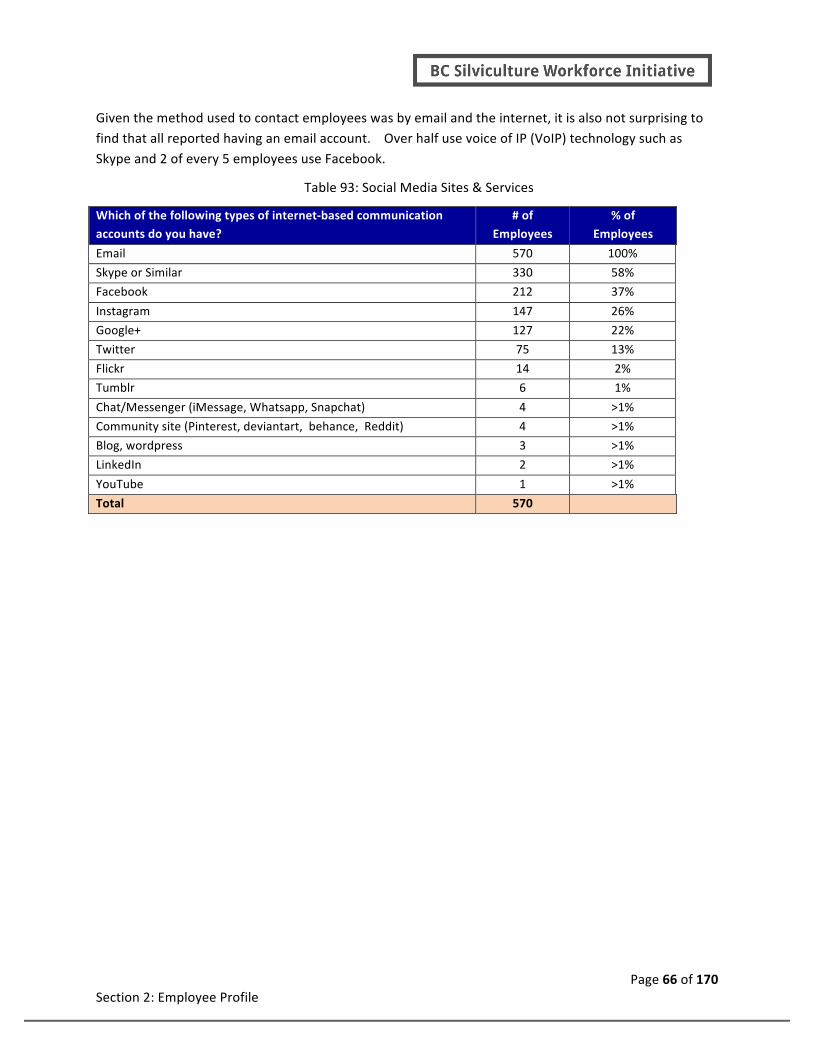
Page 66 of 170 Section 2: Employee Profile
Given the method used to contact employees was by email and the internet, it is also not surprising to find that all reported having an email account. Over half use voice of IP (VoIP) technology such as Skype and 2 of every 5 employees use Facebook.
Table 93: Social Media Sites & Services
Which of the following types of internet-‐based communication accounts do you have?
# of Employees
% of Employees
Email 570 100%
Skype or Similar 330 58%
Facebook 212 37%
Instagram 147 26%
Google+ 127 22%
Twitter 75 13%
Flickr 14 2%
Tumblr 6 1%
Chat/Messenger (iMessage, Whatsapp, Snapchat) 4 >1%
Community site (Pinterest, deviantart, behance, Reddit) 4 >1%
Blog, wordpress 3 >1%
LinkedIn 2 >1%
YouTube 1 >1%
Total 570

Page 67 of 170 Section 3: Employer Profile
Section 3 Employer Profile (Respondents)
Characteristics of businesses responding to survey
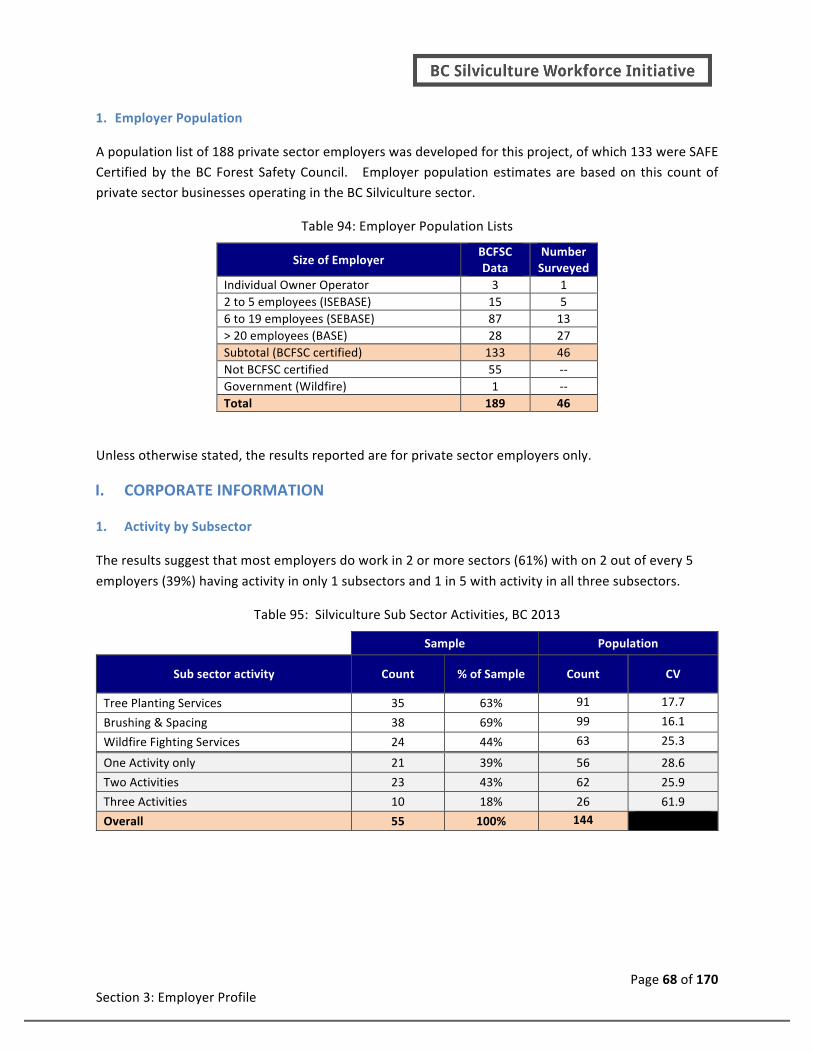
Page 68 of 170 Section 3: Employer Profile
1. Employer Population
A population list of 188 private sector employers was developed for this project, of which 133 were SAFE Certified by the BC Forest Safety Council. Employer population estimates are based on this count of private sector businesses operating in the BC Silviculture sector.
Table 94: Employer Population Lists
Size of Employer BCFSC Data
Number Surveyed
Individual Owner Operator 3 1 2 to 5 employees (ISEBASE) 15 5 6 to 19 employees (SEBASE) 87 13 > 20 employees (BASE) 28 27 Subtotal (BCFSC certified) 133 46 Not BCFSC certified 55 -‐-‐ Government (Wildfire) 1 -‐-‐ Total 189 46
Unless otherwise stated, the results reported are for private sector employers only.
I. CORPORATE INFORMATION
1. Activity by Subsector
The results suggest that most employers do work in 2 or more sectors (61%) with on 2 out of every 5
employers (39%) having activity in only 1 subsectors and 1 in 5 with activity in all three subsectors.
Table 95: Silviculture Sub Sector Activities, BC 2013
Sample Population
Sub sector activity Count % of Sample Count CV
Tree Planting Services 35 63% 91 17.7
Brushing & Spacing 38 69% 99 16.1
Wildfire Fighting Services 24 44% 63 25.3
One Activity only 21 39% 56 28.6
Two Activities 23 43% 62 25.9
Three Activities 10 18% 26 61.9
Overall 55 100% 144

Page 69 of 170 Section 3: Employer Profile
2. Years of Operation in Silviculture
The average number of years that an employer has been active is 23 with half of all employers being active for 21 or less years and 90% of all employers having 40 or fewer years of activity. The most years of activity reported is 44 while the employers with least number of years activity reported 3 years.
Table 96: Years of operation (N=51)
Percentile
How many years has this business been active in the Silviculture sector?
Mean. 50th 90th Min Max
Years of activity 23 21 40 3 44
About 1 in 5 silviculture employers (18%) have 10 years or less activity.
Table 97: Years of operation, Grouped
Sample Population
Years Experience Count % Sample Count CV
10 years or less 9 18% 26 65.3
11 to 20 years 15 29% 42 40.5
21 to 30 years 15 29% 42 40.5
30 or more years 12 23% 33 51.1
Overall 51 99% 143
3. Revenues By Sector
Amongst the 38 employers surveyed that provided a breakdown, most of their revenue earned in BC
(85%) was earned from work performed on forest lands (e.g., the provincial government, forest license holders, private land owners, First Nations or others managing forest lands in BC), as shown in the table below.
Table 98: Sources of Revenue: Forestry vs. Non-‐Forestry Sector, BC, 2013
Source Count Total
Revenues % of Sample Revenues
BC Forestry Sector 37 $60,813,000 82% BC Non-‐Forestry Sector 15 $12,917,000 18% Overall 38 $73,730,000 100%
4. Revenues By Type of Client
Forty of the 48 employers provided a breakdown of revenues by type of client. As the table below indicates, most of the revenues earned in BC were earned from private sector clients (68%) compared to
government (32%) contracts. Within the private sector, most revenues were earned from contracts with
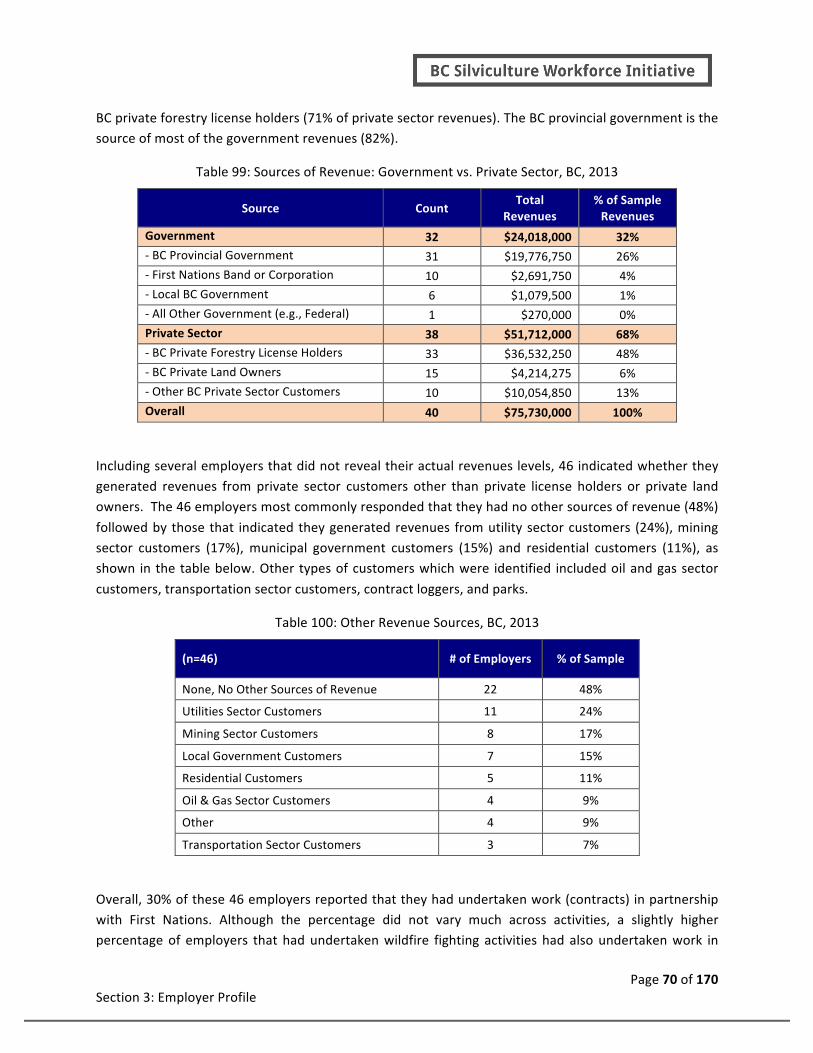
Page 70 of 170 Section 3: Employer Profile
BC private forestry license holders (71% of private sector revenues). The BC provincial government is the source of most of the government revenues (82%).
Table 99: Sources of Revenue: Government vs. Private Sector, BC, 2013
Source Count Total
Revenues % of Sample Revenues
Government 32 $24,018,000 32% -‐ BC Provincial Government 31 $19,776,750 26% -‐ First Nations Band or Corporation 10 $2,691,750 4% -‐ Local BC Government 6 $1,079,500 1% -‐ All Other Government (e.g., Federal) 1 $270,000 0% Private Sector 38 $51,712,000 68% -‐ BC Private Forestry License Holders 33 $36,532,250 48% -‐ BC Private Land Owners 15 $4,214,275 6% -‐ Other BC Private Sector Customers 10 $10,054,850 13% Overall 40 $75,730,000 100%
Including several employers that did not reveal their actual revenues levels, 46 indicated whether they generated revenues from private sector customers other than private license holders or private land owners. The 46 employers most commonly responded that they had no other sources of revenue (48%)
followed by those that indicated they generated revenues from utility sector customers (24%), mining sector customers (17%), municipal government customers (15%) and residential customers (11%), as shown in the table below. Other types of customers which were identified included oil and gas sector
customers, transportation sector customers, contract loggers, and parks.
Table 100: Other Revenue Sources, BC, 2013
(n=46) # of Employers % of Sample
None, No Other Sources of Revenue 22 48%
Utilities Sector Customers 11 24%
Mining Sector Customers 8 17%
Local Government Customers 7 15%
Residential Customers 5 11%
Oil & Gas Sector Customers 4 9%
Other 4 9%
Transportation Sector Customers 3 7%
Overall, 30% of these 46 employers reported that they had undertaken work (contracts) in partnership with First Nations. Although the percentage did not vary much across activities, a slightly higher percentage of employers that had undertaken wildfire fighting activities had also undertaken work in

Page 71 of 170 Section 3: Employer Profile
partnership with First Nations (43%) compared to those that had engaged in tree planting (30%) and brushing and spacing (32%).
Table 101: Companies That Had Work (Contracts) in Partnership With First Nations, BC, 2013
Tree Planting Wildfire Fighting Brushing and
Spacing Sample Total
Yes 8 30% 9 43% 11 32% 14 30%
No 19 70% 12 57% 23 68% 32 70%
Total 27 100% 21 100% 34 100% 46 100%
5. Revenues By Activity
The employers were also asked to provide a breakdown of their revenues by type of services (e.g. tree
planting, brushing and spacing, firefighting, other silviculture and non-‐silviculture services). Of the 40 employers that provided data on revenues by type of service, about half of their BC revenues were earned from tree planting activities (48%), followed by services or products not related to silviculture
(28%) as shown in the table below. Revenues outside of the silviculture sector related to activities such as timber market development and logging (reported by 3 employers), utility corridor slashing (2), training (2), vine planting, vegetation maintenance, road building, trail building, land clearing,
equipment rental, recreation site maintenance, hand falling, forestry work for sawmills, forestry layout work, engineering, mapping, forest tenure and resource management with First Nations, a community forest license, native species restoration and riparian restoration/erosion control with urban
environments. Amongst the employers surveyed, only 9% of revenues were generated from brushing and spacing activities and 5% were generated from wildfire fighting services.
Table 102: Sources of Revenue: Activities and Services, BC, 2013
Activity Count Total
Revenues % of Sample Revenues
Tree Planting Services 26 $35,984,500 48% Other Non-‐Silviculture Services or Products 13 $21,337,000 28% Other Silviculture Services or Products 16 $7,874,500 10% Brushing & Spacing 31 $7,072,500 9% Wildfire Fighting Services 19 $3,461,500 5% Overall 40 $75,730,000 100%
Most employers generate revenues from more than one type of activity. All 48 employers surveyed
provided a percentage breakdown of the proportion of their revenue by type of service. About one fifth of these employers were involved in tree planting, wildfire fighting and brushing and spacing. Of those employers, 70% were also involved in other silviculture activities or products. Only one employer was
involved in all five activity areas. In addition, there is not much of a relationship between the level of

Page 72 of 170 Section 3: Employer Profile
revenues and the diversity in types of activities undertaken. Interestingly, there were no employers involved in wildfire fighting and tree planting that were not also involved in bushing and spacing and other activities.
6. Revenues By Region
Of the 48 employers that were interviewed, 40 provided data on their revenues. Taken together, the 40
employers reported revenues totaling $93 million, of which 81% was generated from work performed in BC. Fewer than 20% of the employers surveyed reported earning revenues from work performed outside of BC. Employers reported earning an average of $2.3 million and a median of $1.5 million in
revenue in 2013.
Table 103: Sources of Revenue: In BC vs. Outside of BC, 2013
Source Count Median Revenues
Mean Revenues
Total Revenues
% of Sample Revenues
Work Performed in BC
40 $1,350,000 $1,893,250 $75,730,000 81%
Work Performed Outside BC
9 $250,000 $1,941,111 $17,470,000 19%
Overall 40 $1,500,000 $2,330,000 $93,200,000 100%
7. Operations -‐ BC Regions
About 9 in 10 employers (90%) reported working in 4 or fewer BC regions, a majority (59%) work in only one region.. The average number of regions worked in was 2 but 50% of all employers worked in only 1
region. Almost 2 in 5 employers (18%) reported working in all 8 BC regions.
Table 104: Number of BC Regions worked (N=51)
Percentile
What BC forest regions did the activity take place in Mean 50th 90th Min Max
Number of regions with activity 2 1 4 1 8
Most employers worked in West Coast Region (41%) followed by Cariboo and Kootenay/Boundary Regions (37%). Number of employers reporting operations in Skeena Region (27%). One in five or less
employers reported operation in the West Coast and Thompson/Okanagan Region (20%), Omineca Region (14%), South Coast Region (12%).

Page 73 of 170 Section 3: Employer Profile
Table 105: Work Region -‐ BC
Sample Population
Where did you work this year? Count % of Sample Count CV
A -‐ West Coast Region 21 41% 59 28.6
B -‐ Skeena Region 14 27% 39 43.5
C -‐ Omineca Region 7 14% 20 83.9
D -‐ Northeast Region 10 20% 29 58.7
E -‐ Cariboo Region 19 37% 53 31.7
F -‐ South Coast Region 6 12% 17 97.9
G -‐ Thompson/Okanagan Region 10 20% 29 58.9
H -‐ Kootenay/Boundary Region 19 37% 53 31.7
Only 1 Region 30 59% 85 19.9
2 regions 8 16% 23 73.4
3 regions 4 8% 11 >100
4 regions 4 8% 11 >100
5 regions 1 2% 3 >100
6 regions 2 4% 6 >100
7 regions 1 2% 3 >100
8 regions 1 2% 3 >100
Total 51 100% 14518
8. Incorporated versus Unincorporated
About 3 out of every 4 employers operating in this sector are incorporated (74%) while about 1 in 10 are unincorporated (12%). First Nations Band or corporation represent about 1 out of every 20 firms (6%).
Table 106: Type of Business, 2013
Which of the following best describes the organization you are responding for?
Count % of Sample
Incorporated Company 40 74%
Unincorporated (i.e. partnership or sole proprietorship) 7 12%
First Nations Band or corporation 3 6%
Government (Federal, Provincial, Local Area), please specify... 2 4%
Industry Stakeholder Organization 1 2%
Other, please specify... 1 2%
Overall 54 100%
18 Some estimates will sum to under/over 100% due to rounding.

Page 74 of 170 Section 3: Employer Profile
Responses to this question suggest that not all respondents understand the terminology used to describe business types. One respondent selected “other” to the options given then specified “consulting firm” suggesting that they might not have understood that a consulting firm did not fall into
either incorporated or unincorporated.
9. Number of Operated Businesses
A complicating factor found while conducting this research is that some employers are actually a
composite of more than one business. During the pretesting stage of this survey we found one respondent who had difficulty answering questions that were written on the pretext that questions pertained to a single business entity. The following question was added to the survey to assist
respondents’ frame of reference for survey questions and to gauge how prevalent this dynamic was across the silviculture sector.
Table 107: Number of Silviculture Businesses Operated, 2013
Do you have responsibilities associated with running or owning more than one business that operates in the silviculture sector.
Count % of Sample
Yes 14 25%
No 41 75%
Overall 55 100%
Of the employers that reported activity in only one subsector (n=21) about 19% reported having
responsibilities associated with running or owning more than one business in the silviculture sector. The result suggests that response to this question is not a function of businesses operating in two or more subsectors. One interpretation of this finding is that approximately 1 in 4 silviculture employers may
be composed of multiple distinct business areas with associated revenue/cost centers.
Respondents were given a choice to answer the survey questions based on their businesses combined operations, only one operation; or, they could tell us they were unsure what operations were reflected in their answers.
Table 108: Number of Silviculture Businesses Operated, 2013
Would you like your responses in this survey to be associated with all businesses combined or for only one of the operations.
Count
Combined operations 5 Only one operation 5 Unsure/Can’t Say 3 Missing/Skipped 1 Overall 14

Page 75 of 170 Section 3: Employer Profile
10. Employer Years of Experience
Half of all employers have 28 or less years of experience working in the silviculture sector and 90% have 38 or fewer years of experience. The average years of experience is 26.
Table 109: Employer Years of Silviculture Experience (n=54)
Percentile
How many years have you personally been working in the Silviculture sector?
Mean. 50th 90th Min Max
Respondent Years of experience 26 28 38 1 44
Only 7 employers (13%) reported 10 years or less silviculture sector experience. A majority (65%) reported 21 years or more experience. One in five employers have 11 to 20 years of experience.
Table 110: Employer Years of Silviculture Experience, Grouped
Years of Experience Count % of Sample
10 years or less 7 13% 11 to 20 years 11 20% 21 to 30 years 20 36% 30 or more years 16 29% Overall 51 100%
11. Employer Roles and Responsibilities
Almost all 9 in 10 respondents (87%) said they were a business owner. Hands on business ownership typifies the sector with only 8 business owners (15%) reporting they had no other role or responsibility.
Respondents that selected business owner and at least one other role or responsibility were most likely to select manager, supervisor (97%) as the other responsibility.
Table 111: Respondent Roles and Responsibilities
During 2013 what types of responsibilities did you personally have for this organization?
Count % of Sample
Business Owner 47 87% Manager, Supervisory (field and/or office) 43 80% Administrative (office, not in field) 21 40% Field Worker 18 33% Other (Specify)* 1 2% Total 54 Only 1 role 12 22% 2 roles 17 31% 3 roles 17 31% 4 roles (All listed, plus other) 8 15% *Every Aspect of the Organization

Page 76 of 170 Section 3: Employer Profile
J. WORKFORCE
1. Crew Sizes
Employers were asked to indicate the range in size of their field crews. Employers reported that their
smallest crews averaged 5 field workers and their largest crews averaged 18 field workers as shown below. As most of the respondents had tree planting operations, this crew size is like most reflective of that activity.
Table 112: Crew Sizes (Field Workers), BC, 2013
Count Mean Min Max Sample Total
Smallest Crew 42 5.2 1 20 217
Largest Crew 41 18.3 2 100 751
2. Diversity of Workers
Approximately one-‐half of the employers (23 of 45) reported employing one or more First Nations people. These workers accounted for 7% of the sample. Employers reported employing very few temporary foreign workers (0.2% of total employees) and foreign students (0.3%).
Table 113: Types of Employees, BC, 2013
Business Workers
Count Mean Total % of Sample
First Nations Status 23 8.0 185 7% Temporary Foreign Workers who obtained a work visa under TFWP
3 1.3 4 0.2%
Foreign Students, Working Student Visa 2 3.5 7 0.3%
K. OPINIONS AND OUTLOOK
1. 2013 Revenue
Slightly less than half (48%) of the employer respondents felt the income earned in 2013 was below expectations, about in in 3 report income came in as expected and about 1 in 5 firms (18%) report
income above expectations for 2013.

Page 77 of 170 Section 3: Employer Profile
Table 114: 2013 Business Income Expectations
Would you say the net income earned by your BC operations in the last year was...
Count % of
Respondents
Employer Respondent 8 17% Slightly below expectations 15 31% As expected 16 33% Slightly above expectations 5 10% Considerably above expectations 4 8% Total 48 100%
Approximately 1 of every 3 employers (64%) do not see any changes in operations for 2014 and 2 of every 4 look forward to better operations. Only 13% of employers think business operations will be
worse next season.
Table 115: Expected Business Performance in 2014
Thinking of BC operations, do you expect the business situation of your company in 2014 to be...
Count % of
Respondents
About the Same 30 64% Better 11 23% Worse 6 13% Total 47 100%
Looking forward to 2014 about 1 in 5 (19%) expect earnings to be worse while almost 2 in 5 (37%) are expecting income to be better. Slightly fewer than half (44%) expect income to be about the same in
2014.
Table 116: Year over year business income compared (2012 to 2013)
Would you say the net income earned by your BC operations in the last year was...
Count % of
Respondents
About the Same 21 44% Better 18 37% Worse 9 19% Total 48 100%
2. Future Revenue
Employers also seem optimistic about the future of the sector, with a majority agreeing that they are
optimistic that businesses in the BC silviculture sector will be able to earn the income they require to stay in operation.

Page 78 of 170 Section 3: Employer Profile
Table 117: Optimistic about sector
Ability to earn income
Over the next three to five years, how optimistic are you that businesses in the BC silviculture sector will be able to earn the income they require to stay in operation.
% (A) optimistic
% (B) pessimistic
% (A – B)
Employer Respondent 58% 42% 16%
The optimism is primary due to strong lumber prices. Those employers that don’t share the bright outlook are concerned about the competition from other firms and thin profit margins.
3. Future Expenditures by Customers
Slightly more employers see government expenditure on tree planting to increase (27%) than decrease (23%) while the other 50% see expenditures staying the same. The outlook is slightly better for wildfire fighting with 45% feeling government expenditures will increase compared to 30% who feel it will
decrease, 1 in 4 feel it will stay the same (25%). The outlook for Brushing and Spacing expenditures is less optimistic with more employer respondents feeling expenditures will decrease (44%) than increase (27%).
Table 118: Future Government Expenditure
Challenge
Over the next three to five years, do you think that the amount of money that the provincial government (including provincial ministries, BC Timber Sales, crown corporations and agencies) will spend contracting the following services is going to increase, decrease or stay the same
% Increase
% Stay Same
% Decrease
Tree Planting 27% 50% 23%
Wildfire fighting 45% 25% 30%
Brushing and Spacing 27% 29% 44%
More businesses see private sector expenditure on tree planting to increase (37%) than decrease (30%) while 1 in 3 (33%) see expenditures staying the same. The outlook is about the same for wildfire
fighting with 20% feeling private sector expenditures will increase compared to 15% who feel it will decrease. The majority, about 2 in 3, feel it will stay the same (65%). The outlook for Brushing and Spacing expenditures is less optimistic with more businesses feeling expenditures will decrease (32%)
than increase (23%).

Page 79 of 170 Section 3: Employer Profile
Table 119: Future Private Sector Expenditures
Challenge
Over the next three to five years, do you think that the amount of money that the BC private sector (including private forestry license holders and private land owners) will spend contracting the following services is going to increase, decrease or stay the same?
% Increase
% Stay Same
% Decrease
Tree Planting 37% 33% 30%
Wildfire fighting 20% 65% 15%
Brushing and Spacing 23% 44% 32%
4. Business Operations Outlook
Over half of the businesses (52%) expect to be doing business for 10 or more years. About 1 in 3 expect
to be doing business for 6 to 10 years and only 14% expect to be in business for less than 5 years.
Table 120: Years Expected to operate
How many years do you expect this business to continue in the industry?
Count % of
Businesses
Less than 5 years 7 14%
6 to 10 years 17 34%
10 or more years 26 52%
Total 50 100%
For those who expect their business to continue for less than 5 years, all said they are likely to be active
during the 2014 silviculture season.
Table 121: expecting to operate next season (if expect to operate < 6 years)
How likely is it that this business will be active in the 2014 Silviculture season?
Count % of
Businesses
Not Likely 0 0%
Likely 2 29%
Very Likely 5 71%
Total 7 100%

Page 80 of 170 Section 3: Employer Profile
5. Expansion Plans
Slightly less than half (48%) felt the income earned in 2013 was below expectations, about in in 3 report
income came in as expected and about 1 in 5 firms (18%) report income above expectations for 2013.
Table 122: Businesses that would pursue expansion
Would your organization pursue expansion in this sector if the opportunity presented itself?
Count % of Sample
No, not at all 3 11% Yes, would expand if possible 17 63% Unsure or Can't Say 7 26% Total 27 100%
The top two factors that respondents most often select as a limiting factor to expansion are associated
with revenue (competition in own sector and availability of contracts). The third most limiting factor selected is availability of skilled people to fill supervisor and crew boss positions. Other limiting factors cited were available AAC, impact of the MPB, and the nature of seasonality making it hard to retain
workers.
Table 123: Factors that limit business expansion
Respondent n = 28
Which of the following factors limit the ability of your business to expand?
Count %
Competition in own sector 14 50% Shortage of available contracts 12 43% Shortage of skilled people to fill supervisor or crew boss positions 11 39% Rate of return on investment 9 32% Shortage of entry level field workers 4 14% Cost of labour 3 11% Cost of materials 2 7% Access to bank credit 2 7% Cost of finance (i.e. interest rates) 0 0% Lack of equipment 0 0% Total 57
6. Fate of Operations
When it does come time for the business to wind up its operations results indicate that 1 in 5 (20%) are unsure what will happen to operations. About 1 in 10 employers foresee a family member taking over the business while 1 in 4 foresee an employee taking over the business. Only 8% foresee the business
being sold to someone who is not family or an employee and the same number foresee the business just closing its doors and no longer operating.

Page 81 of 170 Section 3: Employer Profile
Business who don’t expect to be operation more than 5 years feel their business will no longer operate after that time (71%) compared to only 7% of business who expect to be in operations 6 or more years.
Table 124: business continuity
When the current owners are no longer involved in this business, do you anticipate that:
Count % of
Businesses
It will no longer operate 8 16%
It will be taken over by a family member 5 10%
It will be taken over by an existing employee 13 26%
It will be purchased and operated by someone else 4 8%
I’m not sure 20 40%
Total 50 100%
Table 125: business continuity by operating years expected
Expected Years of Operation
When the current owners are no longer involved in this business, do you anticipate that:
% < 6yrs. % 6 yrs +
It will no longer operate 71% 7%
It will be taken over by a family member 0% 12%
It will be taken over by an existing employee 0% 30%
It will be purchased and operated by someone else 14% 7%
I’m not sure 14% 44%
7. Reasons for Exit
Slightly more than half of employers feel they can earn better return for their effort or that it is too
difficult to find employees as reasons they will eventually close doors. About half (49%) of employers choose not enough work as a reason. Planning to retire was the selected by 29% of employers while 24% selected physical hardship and only 14% choose isolation as a reason.
Table 126: Reasons company closes operations -‐ Total times chosen (1st, 2nd or 3rd)
Should the silviculture company close operations, what are the most likely reasons it will close?
Count N=55
%
Better return for my risk and effort elsewhere 29 53%
Too difficult to find people willing to work in the field 28 51%
Not enough work around here 27 49%
I'm planning on retiring 16 29%
Physical hardships associated with the work 13 24%
Isolation from family or friends 8 14%
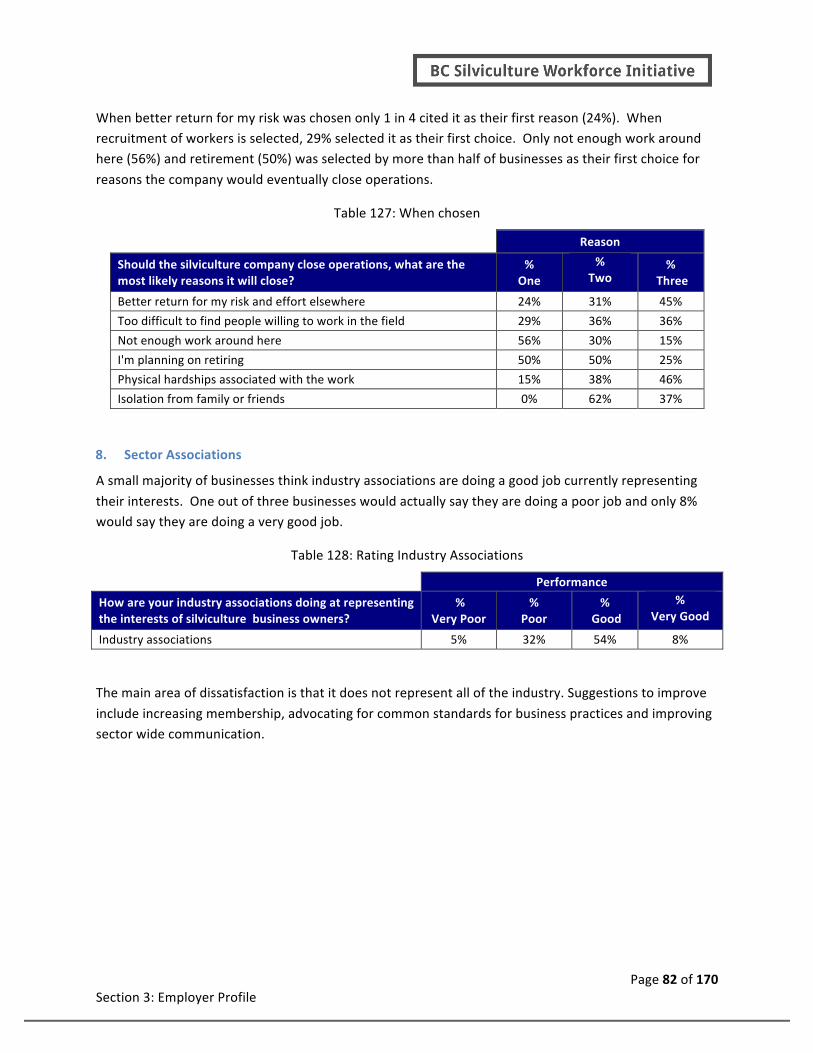
Page 82 of 170 Section 3: Employer Profile
When better return for my risk was chosen only 1 in 4 cited it as their first reason (24%). When recruitment of workers is selected, 29% selected it as their first choice. Only not enough work around here (56%) and retirement (50%) was selected by more than half of businesses as their first choice for
reasons the company would eventually close operations.
Table 127: When chosen
Reason
Should the silviculture company close operations, what are the most likely reasons it will close?
% One
% Two
% Three
Better return for my risk and effort elsewhere 24% 31% 45%
Too difficult to find people willing to work in the field 29% 36% 36%
Not enough work around here 56% 30% 15%
I'm planning on retiring 50% 50% 25%
Physical hardships associated with the work 15% 38% 46%
Isolation from family or friends 0% 62% 37%
8. Sector Associations
A small majority of businesses think industry associations are doing a good job currently representing
their interests. One out of three businesses would actually say they are doing a poor job and only 8% would say they are doing a very good job.
Table 128: Rating Industry Associations
Performance
How are your industry associations doing at representing the interests of silviculture business owners?
% Very Poor
% Poor
% Good
% Very Good
Industry associations 5% 32% 54% 8%
The main area of dissatisfaction is that it does not represent all of the industry. Suggestions to improve
include increasing membership, advocating for common standards for business practices and improving sector wide communication.

Page 83 of 170 Section 4: Recruitment and Retention Findings Section 4: Recruitment and Retention Findings
Section 4 Recruitment & Retention Findings
Information to support finding and keeping employees

Page 84 of 170 Section 4: Recruitment and Retention Findings Section 4: Recruitment and Retention Findings
L. RECRUITMENT PRIORITIES
About 1 in 3 employers reported recruiting workers to fill supervisor and crew boss positions as their
biggest challenge. Only 7% of employers reported that recruiting entry level workers is a big challenge; furthermore, even if they were available only 1 in 10 (11%) would have hired additional rookies.
Table 129: Hiring Challenges
Challenge
How big a challenge was it to find employees in 2013? N=55 %
None
% Somewhat
% Big
Workers for Supervisor/Crew Boss positions 32% 35% 32%
Returning field workers (1+ years industry experience) 39% 37% 23%
New entry level field workers (Rookies, no previous experience) 57% 35% 7%
Table 130: Hiring of Rookies
Would you have hired more rookies if they had been available?
Count % of
Respondents
Yes 5 11% No 31 69% Unsure/Can’t Say 9 20% Total 45 100%
Table 131: Hiring of Field Workers
Would have hired more field workers with previous experience if available?
Count % of
Respondents Yes 29 66% No 11 25% Unsure/Can’t Say 4 9% Total 44 100%
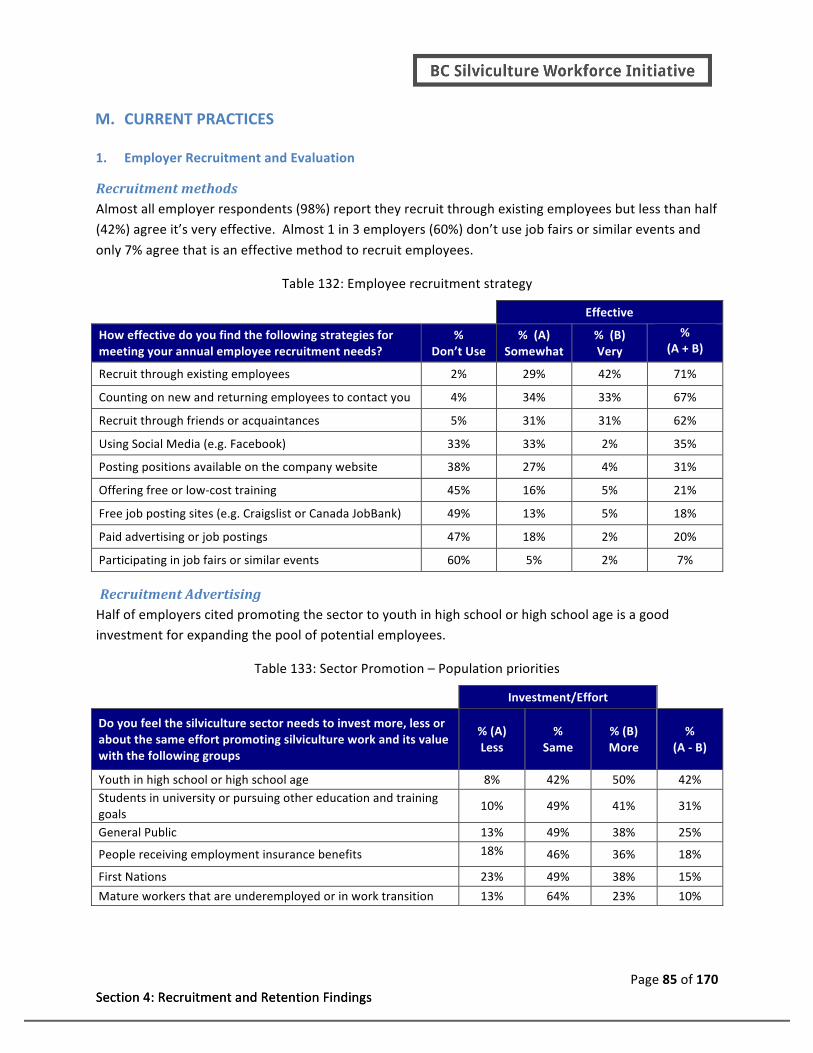
Page 85 of 170 Section 4: Recruitment and Retention Findings Section 4: Recruitment and Retention Findings
M. CURRENT PRACTICES
1. Employer Recruitment and Evaluation
Recruitment methods Almost all employer respondents (98%) report they recruit through existing employees but less than half (42%) agree it’s very effective. Almost 1 in 3 employers (60%) don’t use job fairs or similar events and
only 7% agree that is an effective method to recruit employees.
Table 132: Employee recruitment strategy
Effective
How effective do you find the following strategies for meeting your annual employee recruitment needs?
% Don’t Use
% (A) Somewhat
% (B) Very
% (A + B)
Recruit through existing employees 2% 29% 42% 71%
Counting on new and returning employees to contact you 4% 34% 33% 67%
Recruit through friends or acquaintances 5% 31% 31% 62%
Using Social Media (e.g. Facebook) 33% 33% 2% 35%
Posting positions available on the company website 38% 27% 4% 31%
Offering free or low-‐cost training 45% 16% 5% 21%
Free job posting sites (e.g. Craigslist or Canada JobBank) 49% 13% 5% 18%
Paid advertising or job postings 47% 18% 2% 20%
Participating in job fairs or similar events 60% 5% 2% 7%
Recruitment Advertising Half of employers cited promoting the sector to youth in high school or high school age is a good investment for expanding the pool of potential employees.
Table 133: Sector Promotion – Population priorities
Investment/Effort
Do you feel the silviculture sector needs to invest more, less or about the same effort promoting silviculture work and its value with the following groups
% (A) Less
% Same
% (B) More
% (A -‐ B)
Youth in high school or high school age 8% 42% 50% 42% Students in university or pursuing other education and training goals
10% 49% 41% 31%
General Public 13% 49% 38% 25%
People receiving employment insurance benefits 18% 46% 36% 18%
First Nations 23% 49% 38% 15%
Mature workers that are underemployed or in work transition 13% 64% 23% 10%
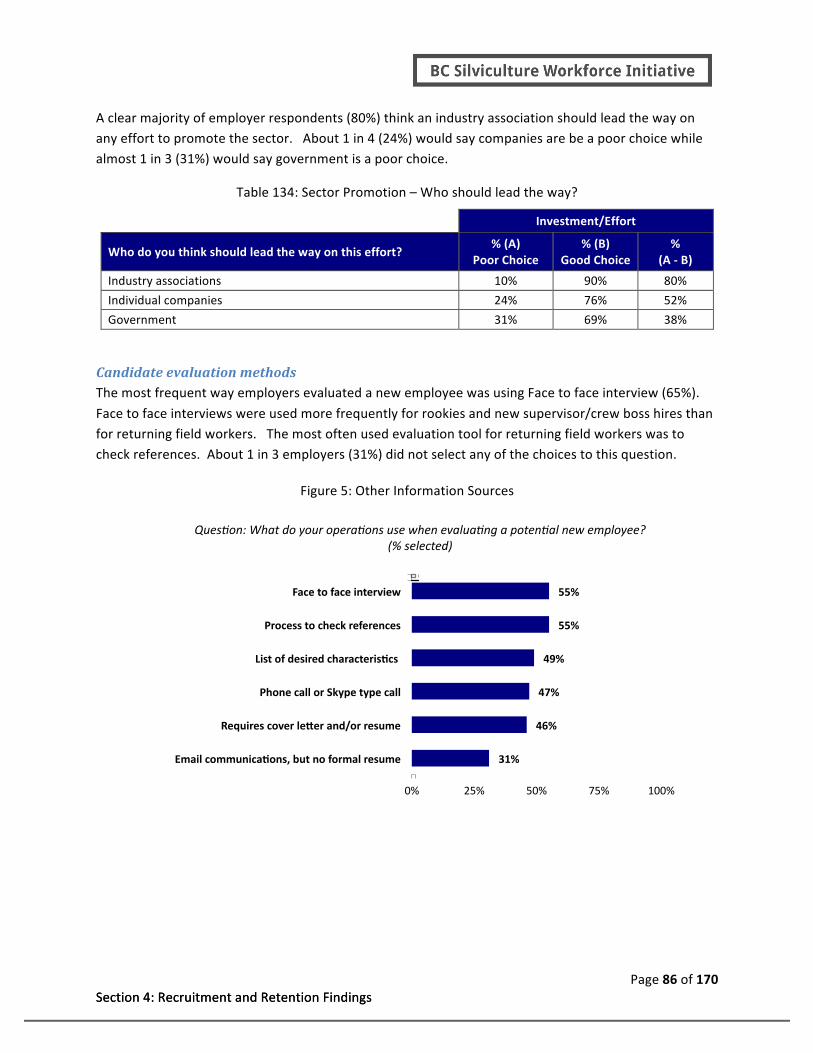
Page 86 of 170 Section 4: Recruitment and Retention Findings Section 4: Recruitment and Retention Findings
A clear majority of employer respondents (80%) think an industry association should lead the way on any effort to promote the sector. About 1 in 4 (24%) would say companies are be a poor choice while almost 1 in 3 (31%) would say government is a poor choice.
Table 134: Sector Promotion – Who should lead the way?
Investment/Effort
Who do you think should lead the way on this effort? % (A)
Poor Choice % (B)
Good Choice %
(A -‐ B)
Industry associations 10% 90% 80%
Individual companies 24% 76% 52%
Government 31% 69% 38%
Candidate evaluation methods The most frequent way employers evaluated a new employee was using Face to face interview (65%).
Face to face interviews were used more frequently for rookies and new supervisor/crew boss hires than for returning field workers. The most often used evaluation tool for returning field workers was to check references. About 1 in 3 employers (31%) did not select any of the choices to this question.
Figure 5: Other Information Sources
31%
46%
47%
49%
55%
55%
0% 25% 50% 75% 100%
Email communicauons, but no formal resume
Requires cover lever and/or resume
Phone call or Skype type call
List of desired characterisucs
Process to check references
Face to face interview
Ques8on: What do your opera8ons use when evalua8ng a poten8al new employee? (% selected)
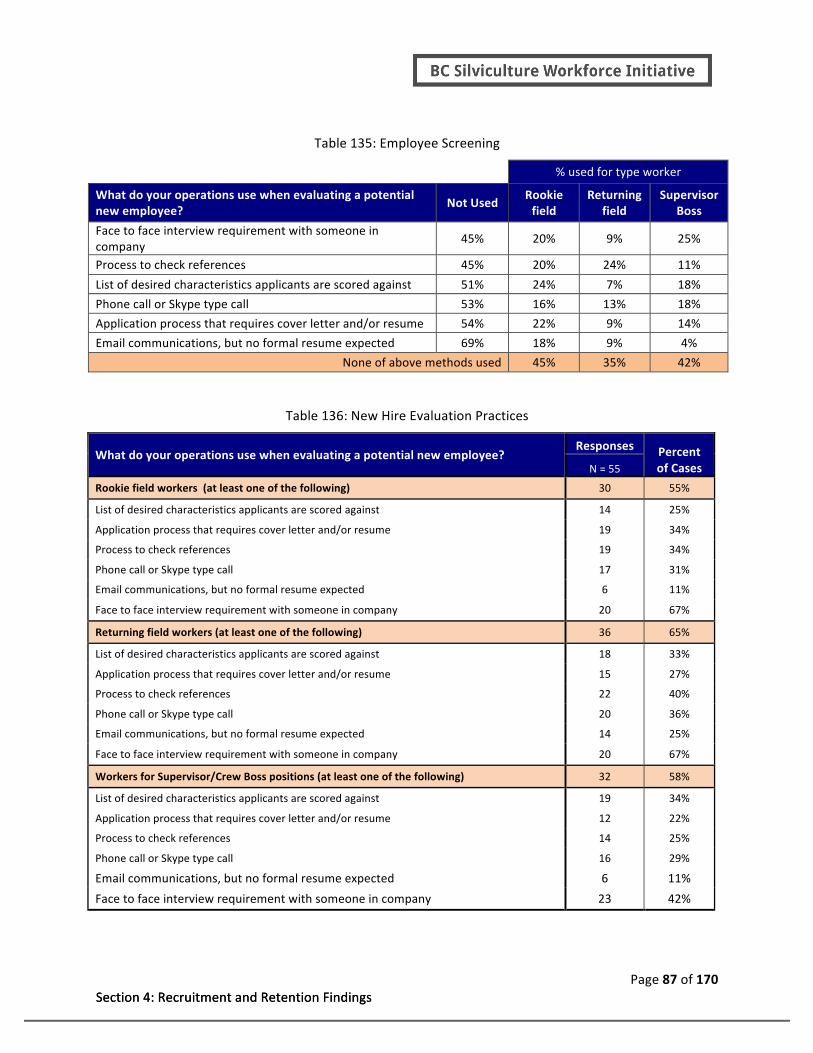
Page 87 of 170 Section 4: Recruitment and Retention Findings Section 4: Recruitment and Retention Findings
Table 135: Employee Screening
% used for type worker
What do your operations use when evaluating a potential new employee?
Not Used Rookie field
Returning field
Supervisor Boss
Face to face interview requirement with someone in company
45% 20% 9% 25%
Process to check references 45% 20% 24% 11%
List of desired characteristics applicants are scored against 51% 24% 7% 18%
Phone call or Skype type call 53% 16% 13% 18%
Application process that requires cover letter and/or resume 54% 22% 9% 14%
Email communications, but no formal resume expected 69% 18% 9% 4%
None of above methods used 45% 35% 42%
Table 136: New Hire Evaluation Practices
What do your operations use when evaluating a potential new employee? Responses Percent
of Cases N = 55
Rookie field workers (at least one of the following) 30 55%
List of desired characteristics applicants are scored against 14 25%
Application process that requires cover letter and/or resume 19 34%
Process to check references 19 34%
Phone call or Skype type call 17 31%
Email communications, but no formal resume expected 6 11%
Face to face interview requirement with someone in company 20 67%
Returning field workers (at least one of the following) 36 65%
List of desired characteristics applicants are scored against 18 33%
Application process that requires cover letter and/or resume 15 27%
Process to check references 22 40%
Phone call or Skype type call 20 36%
Email communications, but no formal resume expected 14 25%
Face to face interview requirement with someone in company 20 67%
Workers for Supervisor/Crew Boss positions (at least one of the following) 32 58%
List of desired characteristics applicants are scored against 19 34%
Application process that requires cover letter and/or resume 12 22%
Process to check references 14 25%
Phone call or Skype type call 16 29%
Email communications, but no formal resume expected 6 11%
Face to face interview requirement with someone in company 23 42%
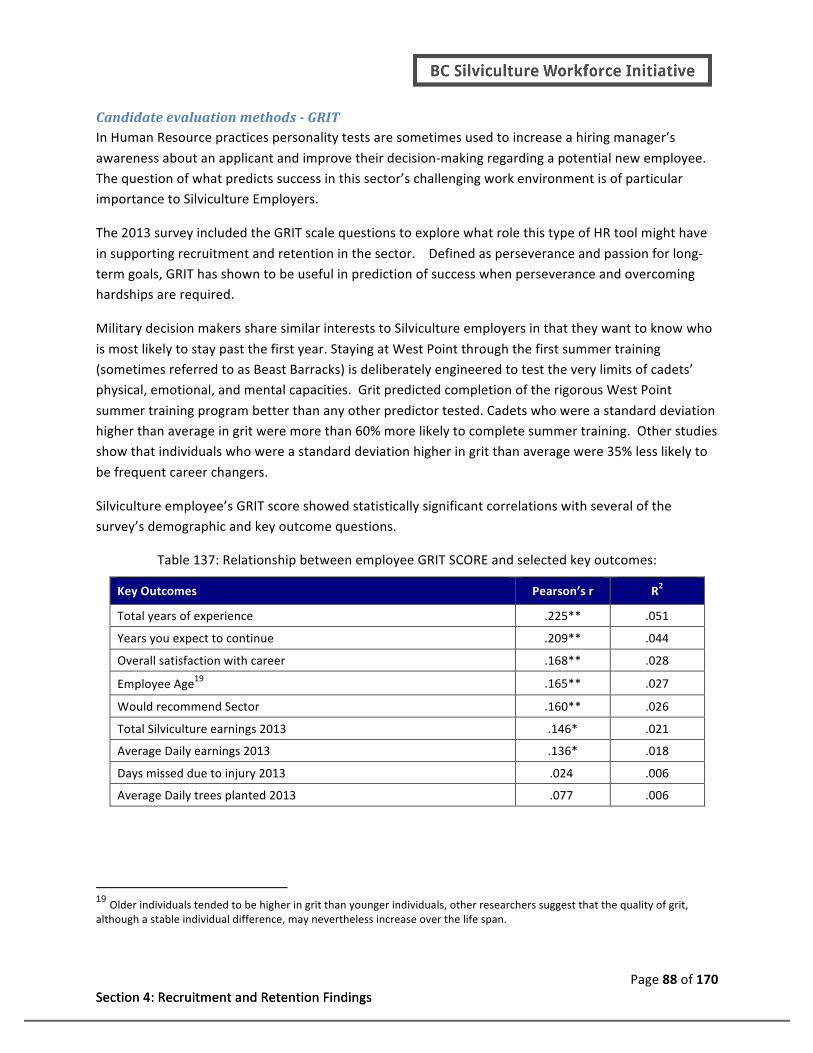
Page 88 of 170 Section 4: Recruitment and Retention Findings Section 4: Recruitment and Retention Findings
Candidate evaluation methods - GRIT In Human Resource practices personality tests are sometimes used to increase a hiring manager’s
awareness about an applicant and improve their decision-‐making regarding a potential new employee. The question of what predicts success in this sector’s challenging work environment is of particular importance to Silviculture Employers.
The 2013 survey included the GRIT scale questions to explore what role this type of HR tool might have
in supporting recruitment and retention in the sector. Defined as perseverance and passion for long-‐term goals, GRIT has shown to be useful in prediction of success when perseverance and overcoming hardships are required.
Military decision makers share similar interests to Silviculture employers in that they want to know who
is most likely to stay past the first year. Staying at West Point through the first summer training (sometimes referred to as Beast Barracks) is deliberately engineered to test the very limits of cadets’ physical, emotional, and mental capacities. Grit predicted completion of the rigorous West Point
summer training program better than any other predictor tested. Cadets who were a standard deviation higher than average in grit were more than 60% more likely to complete summer training. Other studies show that individuals who were a standard deviation higher in grit than average were 35% less likely to
be frequent career changers.
Silviculture employee’s GRIT score showed statistically significant correlations with several of the survey’s demographic and key outcome questions.
Table 137: Relationship between employee GRIT SCORE and selected key outcomes:
Key Outcomes Pearson’s r R2
Total years of experience .225** .051
Years you expect to continue .209** .044
Overall satisfaction with career .168** .028
Employee Age19 .165** .027
Would recommend Sector .160** .026
Total Silviculture earnings 2013 .146* .021
Average Daily earnings 2013 .136* .018
Days missed due to injury 2013 .024 .006
Average Daily trees planted 2013 .077 .006
19 Older individuals tended to be higher in grit than younger individuals, other researchers suggest that the quality of grit, although a stable individual difference, may nevertheless increase over the life span.

Page 89 of 170 Section 4: Recruitment and Retention Findings Section 4: Recruitment and Retention Findings
The results of this test suggest the GRIT scale holds the same potential for silviculture employers as it does for West Point. Used as a recruitment screening tool, then rookie employees who are a standard deviation higher than average in GRIT score may be more than 60% more likely to return in year two.
For retention it means that employees that are a standard deviation higher than average in GRIT score will be 35% less likely to leave silviculture sector career
2. Employee Entrance to Sector
Over half (57%) of employees report being recruited by someone employed in the sector as playing a role in how they found their first silviculture job. Five of the options given to employees were selected
by fewer that 2 of every 5 employees. Of these five options Social Media sites was selected by 17% of employees as playing a role and the other 4 were selected by under 10% of employees.
Table 138: Role of information sources
Listed below are some of the more common ways that people found their first Silviculture job.
% No Role
% Some Role
Recruited by someone employed in sector 17% 57%
Other information source, specify 39% 27%
Job posting you saw on a silviculture company 40% 25%
Social Media sites (e.g. Facebook) 47% 17%
Free job posting sites (e.g. Craigslist or Canada JobBank 54% 8%
Participating in job fair or similar event 56% 5%
Job posting in a newspaper 59% 3%
Watched a news story about the sector 55% 8%
Interestingly, the list provided to employees did not seem to match what information source they used
to find their first silviculture job. Behind “recruitment by someone employed in sector”; the second information source most cited was “Other information source” (27%). The majority of feedback to this question was that another person was instrumental as an information source for how they found their
first job.

Page 90 of 170 Section 4: Recruitment and Retention Findings Section 4: Recruitment and Retention Findings
Figure 6: Other Information Sources
3. Employee Exit from Sector
An insightful comment made in human resource circles is that employers do not leave companies they leave managers. Our research suggests that this insight applies to the silviculture sector. An employee’s
rating of employer professionalism had the most explanatory power when looking at why they might leave their employer; that is, when we look at the questions we used to judge employer professionalism, many seem to relate to supervisor/crew boss management.
The fact of the matter is that many employees don’t choose to have a career in silviculture and
dissatisfaction with their career experience does not seem to be the best explanation for why they leave an employer. They certainly come with the expectation that this is a “temporary” job that will be held until something more appropriate (related to education) or better (income) comes along. We suspect
that the reality for many is the day never arrives or the day arrives later than expected.
Career choice was selected by the fewest number of employees from a list of eight choices given to explain why they were first attracted to the sector. About one in four (26%) select career as a reason
for entering the sector compared to 99% that selected “income” or 96% who selected “attracted by independence and outdoor experience” as important reasons for first choosing to work in silviculture sector. They came for the income and lifestyle.
When asked reasons why that they might eventually leave the sector, most responded it would be
related to moving into a job related to their education (career) followed by physical toll of the work. Less than half workers responded not enough income (41%) followed by isolation from family and friends (37%) then lack of career advancement opportunities (26%).
Employees arrive to the sector thinking this will not be a career choice and anticipate they will
eventually leave for job that is related to their education and/or pays better. But this is only part of the story. We dug a bit deeper and looked at the relationship between how many years an employee
111
14
9
6
4
0 20 40 60 80 100
Friend or Person
Media (Book, Documentry)
Personal Iniuauve
School or Training
Website source
number of men{ons
Ques8on: Listed below are some of the more common ways that people found their first Silviculture job. Other, specify

Page 91 of 170 Section 4: Recruitment and Retention Findings Section 4: Recruitment and Retention Findings
reported they were likely to stay in the sector and how the responded to questions related to key drivers. This analysis suggested that the reasons for leaving an employer is much more immediate and deals with their experience with managers. Yes, they may leave when a job related to their education
opens up. Yes, they many leave when a better paying job becomes available. Until then, the reason they leave an employer is because of treatment by a manager.
Table 139: Why employees quit working in the sector
When the day comes and you quit working in the BC Silviculture Sector, what is the most likely reason you will stop working?
Responses Percent of Cases N = 591
Move on to job related to education (Reason) 415 70%
Physical hardship associated with the work (Reason) 378 64%
Not enough income (Reason) 243 41%
Isolation from family and friends (Reason) 220 37%
No career advancement opportunity (Reason) 224 26%
Accommodation Conditions (Reason) 73 12%
Employer lack of professionalism (Reason) 66 11%
Concerns over safety (Reason) 55 9%
Problems with other employees (Reason) 23 4%
Figure 7: Reasons workers entered the silviculture sector
Employees At Risk to Leave the Sector
Age is statistically correlated with how many years an employee expects to continue doing silviculture work and likelihood of returning to work in 2014. Consequently, this employee characteristic might
99%
96%
84%
70%
57%
29%
26%
0% 25% 50% 75% 100%
Income
Independence & Outdoor
Physical work/Fitness
Knew Someone
Envro Values
No Opuons
Career
Ques8on: Listed below are some of the more common ways that people found thier first Silviculture job. (% selected)

Page 92 of 170 Section 4: Recruitment and Retention Findings Section 4: Recruitment and Retention Findings
serve useful in identification of “at risk to leave the sector” employees. For instance, over the next five years the sector can expect to lose 77% of the current workers that are 24 years or younger. Almost half of all current workers plan to leave within 5 years.
Table 140: Age Groups
What year were you born? r R2
How many years do you expect to continue doing silviculture work? .238** .057
How likely are you to return to silviculture work in 2014? -‐.112* .014
*. Correlation is significant at the 0.05 level (2-‐tailed). **. Correlation is significant at the 0.01 level (2-‐tailed).
• 24 years or younger (47% of all workers)
Almost 8 of every 10 employees (77%) report they will continue for less than 5 years and only 3% report they will stay 10 years or more.
• 25 to 28 years old (28% of all workers)
71% of employees report they will continue for less than 5 years but percent report they will stay 10 years or more triples to 9% compared to younger age group. The reality of the job
market options seems to be settling in!
• 29 to 34 years old (14% of all workers)
About 6 of every 10 employees (64%) report they will continue for less than 5 years and the
percent who see themselves staying 10 years or more increases to 20%. For some, this is now the best job choice.
• 29 to 34 years old (11% of all workers)
About half (53%) report they will continue for less than 5 years and 1 in 4 see themselves staying 10 years or more (25%).
Not surprisingly years of experience is also related to an employee’s age, older employees tend to have
more years of experience. So the pervious type of interpretation is likely as valid.
Table 141: Relationship between years of experience and…:
Please tell us how many years of experience you have in the silviculture sector?
Pearson’s r R2
How many years do you expect to continue doing silviculture work? .260** .068
How likely is it that you would recommend working in the Silviculture Sector? .119** .014
Overall, how satisfied are you with the typical work day you experienced during the 2013 Silviculture season?
.102* .010
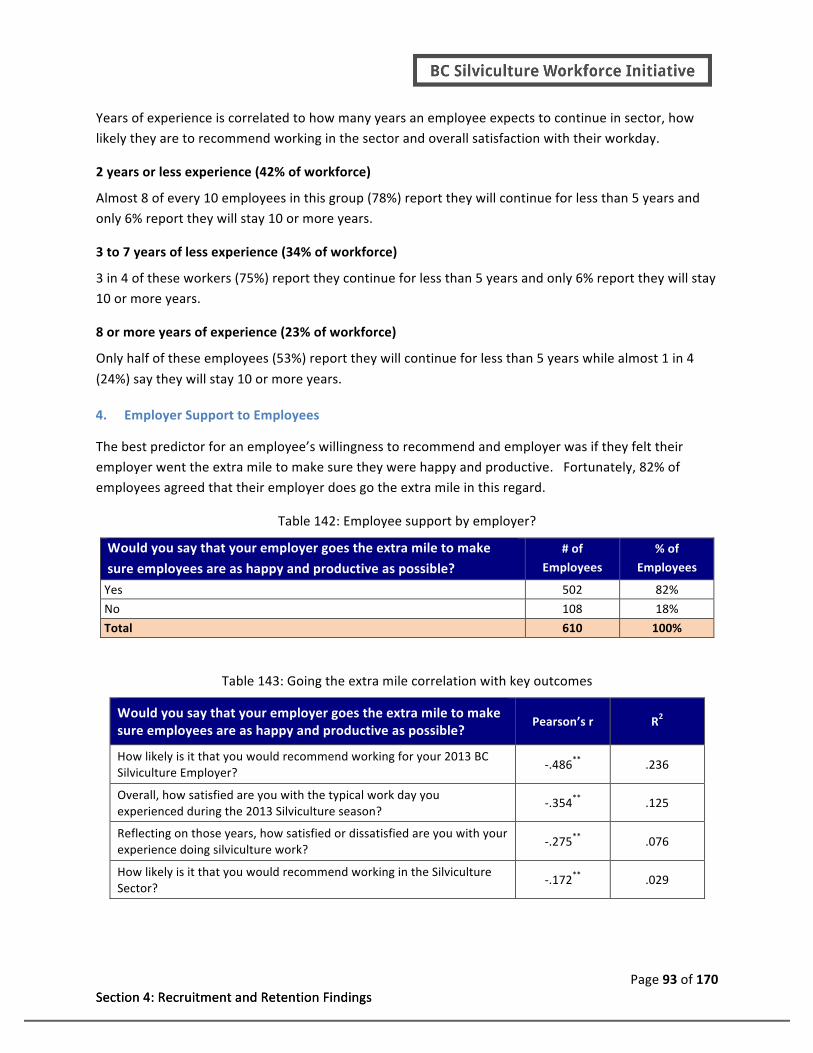
Page 93 of 170 Section 4: Recruitment and Retention Findings Section 4: Recruitment and Retention Findings
Years of experience is correlated to how many years an employee expects to continue in sector, how likely they are to recommend working in the sector and overall satisfaction with their workday.
2 years or less experience (42% of workforce)
Almost 8 of every 10 employees in this group (78%) report they will continue for less than 5 years and only 6% report they will stay 10 or more years.
3 to 7 years of less experience (34% of workforce)
3 in 4 of these workers (75%) report they continue for less than 5 years and only 6% report they will stay 10 or more years.
8 or more years of experience (23% of workforce)
Only half of these employees (53%) report they will continue for less than 5 years while almost 1 in 4
(24%) say they will stay 10 or more years.
4. Employer Support to Employees
The best predictor for an employee’s willingness to recommend and employer was if they felt their employer went the extra mile to make sure they were happy and productive. Fortunately, 82% of employees agreed that their employer does go the extra mile in this regard.
Table 142: Employee support by employer?
Would you say that your employer goes the extra mile to make
sure employees are as happy and productive as possible? # of
Employees
% of
Employees
Yes 502 82%
No 108 18%
Total 610 100%
Table 143: Going the extra mile correlation with key outcomes
Would you say that your employer goes the extra mile to make sure employees are as happy and productive as possible?
Pearson’s r R2
How likely is it that you would recommend working for your 2013 BC Silviculture Employer?
-‐.486** .236
Overall, how satisfied are you with the typical work day you experienced during the 2013 Silviculture season?
-‐.354** .125
Reflecting on those years, how satisfied or dissatisfied are you with your experience doing silviculture work?
-‐.275** .076
How likely is it that you would recommend working in the Silviculture Sector?
-‐.172** .029

Page 94 of 170 Section 4: Recruitment and Retention Findings Section 4: Recruitment and Retention Findings
N. KEY DRIVER ANALYSIS
Identifying and analyzing key drivers can help employers find answers to questions such as: What drives
my employee to quit? What contributes to an employee’s productivity? Which employee group is most satisfied with their career choice? The key drivers (employee opinions) in this survey are measured as employee satisfaction with Income, Workday Experience, Accommodation and Employer
Professionalism. Key driver analysis evaluates the relationship of these opinions to a desired outcome or strategic characteristic.
The key drivers used in our analysis were primarily developed based on qualitative analysis of employee feedback and comments in the 2012 survey as well as guidance from the committee members. The
2013 employee survey is constructed to explore if the above concepts predict desired outcomes.
The desired outcomes used in our analysis include20:
• Retention -‐ satisfaction with the employees work day during the season.
• Recruitment & Retention -‐ willingness to recommend employer as a good employer to work for.
• Recruitment & Retention -‐ willingness to recommend working in the Silviculture Sector?
• Retention -‐ how many years do you expect to continue doing silviculture work?
• Retention -‐ career satisfaction, satisfied with total years of experience doing silviculture work?
The committee is also interested in knowing what actions they need to take to improve recruitment and retention. Consequently as set of questions was also developed that might inform how employer might improve employee opinions for each of the four key drivers. These “action area” questions are also
develop base on 2012 survey results and committee input. The conceptual relationship between key drivers and these action area questions are show in Table 120.
20 Due to time constraints, not all desired outcomes have been looked at, for example, total years of experience.
Desired Outcome
Sausfaciton with Professionalism
Sausfacuon with Income Sausfacuon with
Workday
Sausfacuon with Accomodauon
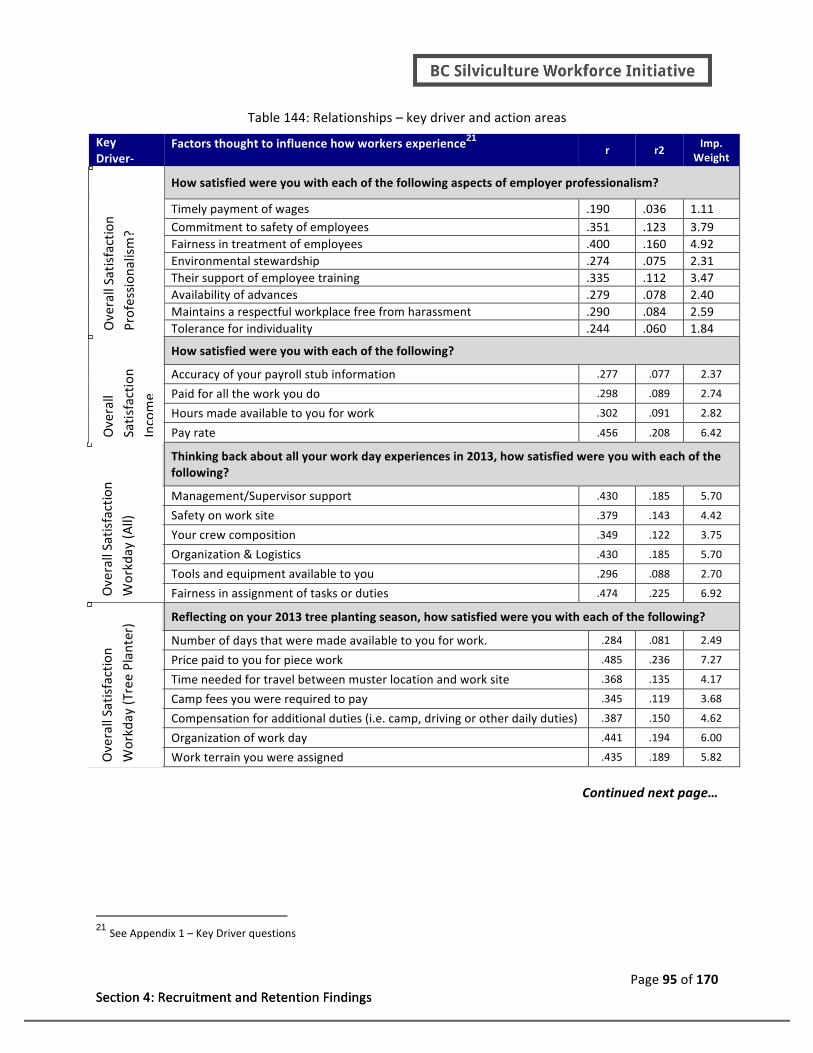
Page 95 of 170 Section 4: Recruitment and Retention Findings Section 4: Recruitment and Retention Findings
Table 144: Relationships – key driver and action areas
Key Driver-‐
Factors thought to influence how workers experience21 r r2 Imp.
Weight
How satisfied were you with each of the following aspects of employer professionalism?
Timely payment of wages .190 .036 1.11 Commitment to safety of employees .351 .123 3.79 Fairness in treatment of employees .400 .160 4.92 Environmental stewardship .274 .075 2.31 Their support of employee training .335 .112 3.47 Availability of advances .279 .078 2.40 Maintains a respectful workplace free from harassment .290 .084 2.59 Tolerance for individuality .244 .060 1.84
How satisfied were you with each of the following?
Accuracy of your payroll stub information .277 .077 2.37
Paid for all the work you do .298 .089 2.74
Hours made available to you for work .302 .091 2.82
Pay rate .456 .208 6.42
Thinking back about all your work day experiences in 2013, how satisfied were you with each of the following?
Management/Supervisor support .430 .185 5.70
Safety on work site .379 .143 4.42
Your crew composition .349 .122 3.75
Organization & Logistics .430 .185 5.70
Tools and equipment available to you .296 .088 2.70
Fairness in assignment of tasks or duties .474 .225 6.92
Reflecting on your 2013 tree planting season, how satisfied were you with each of the following?
Number of days that were made available to you for work. .284 .081 2.49
Price paid to you for piece work .485 .236 7.27
Time needed for travel between muster location and work site .368 .135 4.17
Camp fees you were required to pay .345 .119 3.68
Compensation for additional duties (i.e. camp, driving or other daily duties) .387 .150 4.62
Organization of work day .441 .194 6.00
Work terrain you were assigned .435 .189 5.82
Continued next page…
21 See Appendix 1 – Key Driver questions
Overall Satisfaction
Profession
alism?
Overall Satisfaction
Workday (A
ll)
Overall Satisfaction
Workday (T
ree Plan
ter)
Overall
Satisfaction
Income

Page 96 of 170 Section 4: Recruitment and Retention Findings Section 4: Recruitment and Retention Findings
Key Driver-‐
Factors thought to influence how workers experience22 r r2 Imp.
Weight
How satisfied were you with each of the following aspects of [CAMP LIFE] OR [HOTEL/HOUSE ACCOMODATION]?
Camp Accommodation
Sanitary conditions .461 .212 na
Camp toilets .451 .203 na
Safety and security at camp .410 .168 na
Camp showers .390 .152 na
Sanitary conditions .389 .151 na
Camp location .355 .126 na
Camp social life .354 .125 na
Camp food .353 .124 na
Hotel Accommodation
Cleanliness .479 .229 na
Other facilities (e.g. pool, TV, air conditioning) .459 .210 na
Quality of Beds .439 .192 na
Safety and security at accommodation .439 .192 na
Size of room .418 .174 na
Room mates .312 .097 na
House Rental Accommodation
Cleanliness .646 .417 na
Other facilities (e.g. pool, TV, air conditioning) .623 .388 na
Quality of Beds .587 .344 na
Safety and security at accommodation .564 .318 na
Size of room .519 .269 na
Room mates .321 .103 na
As expected the analysis shows that each set of action item is related to their associated key driver.
Each key driver scale demonstrated high internal consistency. From a low of (α = .77) for Income to a high of (α =.88); for items associated with house rental accommodation. This suggests that action items are related to their associated key driver in that how an employee responds to rating each action item is
related to how they rate the key driver overall.
22 See Appendix 1 – Key Driver questions
Overall, how
satisfie
d are you with the accommod
ations you
experienced
doing silviculture work in 201
3?
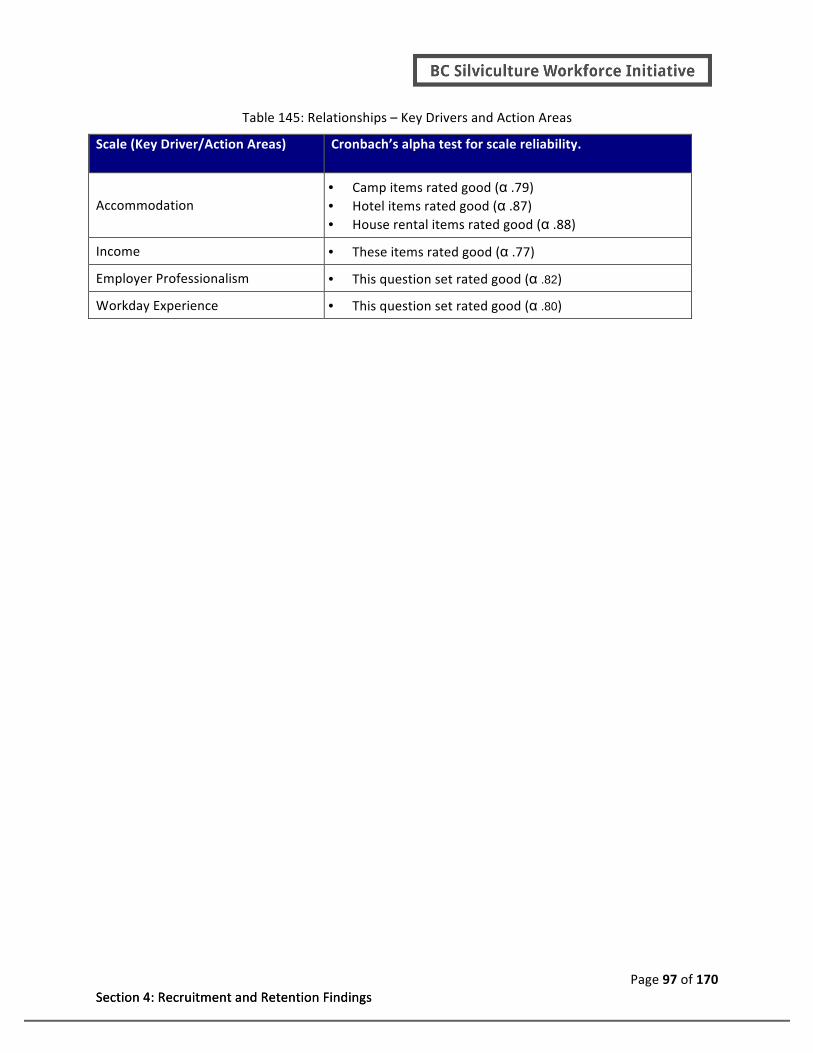
Page 97 of 170 Section 4: Recruitment and Retention Findings Section 4: Recruitment and Retention Findings
Table 145: Relationships – Key Drivers and Action Areas
Scale (Key Driver/Action Areas) Cronbach’s alpha test for scale reliability.
Accommodation • Camp items rated good (α .79) • Hotel items rated good (α .87) • House rental items rated good (α .88)
Income • These items rated good (α .77)
Employer Professionalism • This question set rated good (α .82)
Workday Experience • This question set rated good (α .80)

Page 98 of 170 Section 4: Recruitment and Retention Findings Section 4: Recruitment and Retention Findings
1. Key Driver Analysis – Willingness to Recommend Employer
Each box in the above graphic represents the scale constructed from the “action areas” questions shown in the previous table. Each scale has a statistically significant correlation with an employee’s willingness
to recommend an employer23. Statistically significant does not mean “important”; rather, it means the relationship we found is unlikely to be due to chance. The r2 number tells us how confident we can be in using each scale to predict an employee’s willingness to recommend their employer. For instance, if
we used the satisfaction with professionalism scale as a set of exit questions for all employees at the end of each season, we would expect that 35% of variance in how likely an employee was to recommend their employer could be explained by how they answered the questions used in this scale.
The next best explanatory driver is satisfaction with an employee’s overall accommodation and workday
experience. Overall satisfaction with income was the least powerful predictor of how likely an employee is to recommend working for their employer.
Action Areas – Employer Professionalism As stated, the action areas for each satisfaction scale were combined based on research and conversations with committee members. Overall, the scales are moderately predictive of outcomes of interest.
More open-‐ended exploratory analysis, however, found the following question set (model) acted as the
best predictor of how employees rate employer professionalism (see Table 149). Combined, responses to the following questions explain 75% of variability in overall satisfaction with employer professionalism.
23 The r number is Pearson’s r and ** is two tail test of significance.
Willingness to
Recomend Emloyer
Sausfaciton with Professionalism r =.597** r2 = 356
Sausfacuon with Income
r = .439** r2 = 19% Sausfacuon with Workday
r = .456** r2 = 207%
Sausfacuon with Accomodauon
r = .454** r2 = 206%

Page 99 of 170 Section 4: Recruitment and Retention Findings Section 4: Recruitment and Retention Findings
Table 146: Overall Employer Professionalism Satisfaction
Overall, how satisfied are you with the professionalism your employer demonstrated towards crews and their industry responsibilities?
Pearson’s r
R2
Model .868 .754
Concept Predictors: (Satisfaction with)
Accommodation Camp social life, | Safety and security at camp Hotel Size of room, | Roommates, | Safety and security at accommodation, | Other facilities (e.g. pool, TV, air conditioning), | Quality of Beds, | Cleanliness
Professionalism Management/Supervisor support
Would you say that your employer goes the extra mile to make sure employees are as happy and productive as possible?
Maintains respectful workplace free from harassment, Commitment to safety of employees,
Timely payment of wages
Their support of employee training Environmental stewardship,
When Key Drivers have positive ratings, employers should ensure that strategies are in place to maintain (and improve) those ratings. When Key Drivers have negative ratings, employers should take action to address how to improve them. Improvements to Key Drivers – especially those with low
ratings – will directly impact the dependent variables. Key Drivers, identified in red type above, are the first priority.
This exploratory analysis of the data is a useful reminder that a range of factors, sometimes beyond
what we might commonly understand or expect, can influence outcomes of interest. It also suggests that these types of exploratory analyses many be useful to conduct for other study outcomes of interest.
These findings have implications for actions that employers could pursue to engage and support employees
Finally, it is interesting to keep in mind that while employer professionalism has good potential for predicting an employee’s willingness to recommend an employer it was not a top of mind response
when employees were provided 10 possible reasons why they may eventually quit working in the silviculture sector, very few (n=66) choose employer lack of professionalism.

Page 100 of 170 Section 4: Recruitment and Retention Findings
O. DERIVED VERSUS STATED IMPORTANCE
1. Action Areas to Improve Employee Workday Experience.
Two ways of estimating the importance of action areas to employees.
1) We can ask employees what is important, this is known as stated importance.
2) We can estimate importance by looking at how measurements of action items vary with some overall measurement (for example total satisfaction), this is known as derived importance.
Although often correlated, stated and derived importance differ in several ways. First, things which are
said to be important may not actually predict behavior because they are similar across all employers. Second, stated importance is affected by social desirability. Socially acceptable attributes tend to have higher stated importance, but predict behavior only weakly.
An important reason that stated and derived importance are different is the inherent irrationality of
human decision making. Attitudes and behaviors are often only weakly correlated with behavior, if at all. That is, what people say is important rationally may not be what predicts their irrational decisions.
Action areas that have a high stated and low derived importance are minimum expected attributes workers feel should be part of their work experience. In our analysis we found that action areas of this
type include:
• Paid for all the work you do • Timely payment of wages
• Availability of advances • Accuracy of your payroll stub information
• Number of days that were made
available to you for work.
• Hours made available to you for
work
• Commitment to safety of employees
• Support of employee
training
• Tools and equipment
available to you
• Crew composition
• Maintains a respectful
workplace free from
harassment
• Environmental stewardship
Action areas with low stated and high derived importance are called delight items. Employers should
concentrate on these action items to obtain the greatest change in overall satisfaction. These include:
• Price paid to you for piece work • Organization of work day • Work terrain you were assigned • Compensation for additional duties (i.e. camp, driving or other daily duties) • Time needed for travel between muster location and work site
The most important action areas are when the stated and derived importance is high. If an action area has low importance employers should not go out of their way to change that factor. For instance, in this

Page 101 of 170 Section 4: Recruitment and Retention Findings
analysis we find that being overly concerned with camp fees may not produce commensurate returns in overall satisfaction.
For our analysis we used respondent answers to twenty five survey questions. Each of these questions is plotted in Figure 3 to help employers prioritize improvement initiatives.
Table 147: Derived versus Stated Importance correlations
4 point scale of Not at all; somewhat dissatisfied; somewhat satisfied; and, Very Satisfied was used for each question. N Mini Max Mean Std.
Dev
Tolerance for individuality 607 1 4 3.58 .675
Commitment to safety of employees 609 1 4 3.53 .688
Maintains a respectful workplace free from harassment 611 1 4 3.51 .732
Safety on work site 600 1 4 3.46 .648
Timely payment of wages 605 1 4 3.45 .795
Tools and equipment available to you 597 1 4 3.39 .683
Your crew composition 599 1 4 3.38 .737
Accuracy of your payroll stub information 606 1 4 3.37 .812
Their support of employee training 604 1 4 3.34 .769
Hours made available to you for work 597 1 4 3.33 .762
Availability of advances 572 1 4 3.32 .759
Management/Supervisor support 599 1 4 3.30 .810
Environmental stewardship 592 1 4 3.26 .777
Organization of work day 582 1 4 3.24 .708
Fairness in treatment of employees 614 1 4 3.24 .849
Paid for all the work you do 607 1 4 3.21 .922
Fairness in assignment of tasks or duties 601 1 4 3.18 .779
Number of days that were made available to you for work. 583 1 4 3.10 .846
Organization & Logistics 601 1 4 3.07 .795
Work terrain you were assigned 583 1 4 2.93 .730
Pay rate 604 1 4 2.86 .825
Time needed for travel between muster location and work site 578 1 4 2.78 .756
Compensation for additional duties (i.e. camp, driving or other daily
duties) 575 1 4 2.77 1.009
Price paid to you for piece work 573 1 4 2.68 .812
Camp fees you were required to pay 579 1 4 2.64 .925
Valid N (list wise) 483

Page 102 of 170 Section 4: Recruitment and Retention Findings
Figure 8: Plotted action areas based on derived versus stated importance analysis
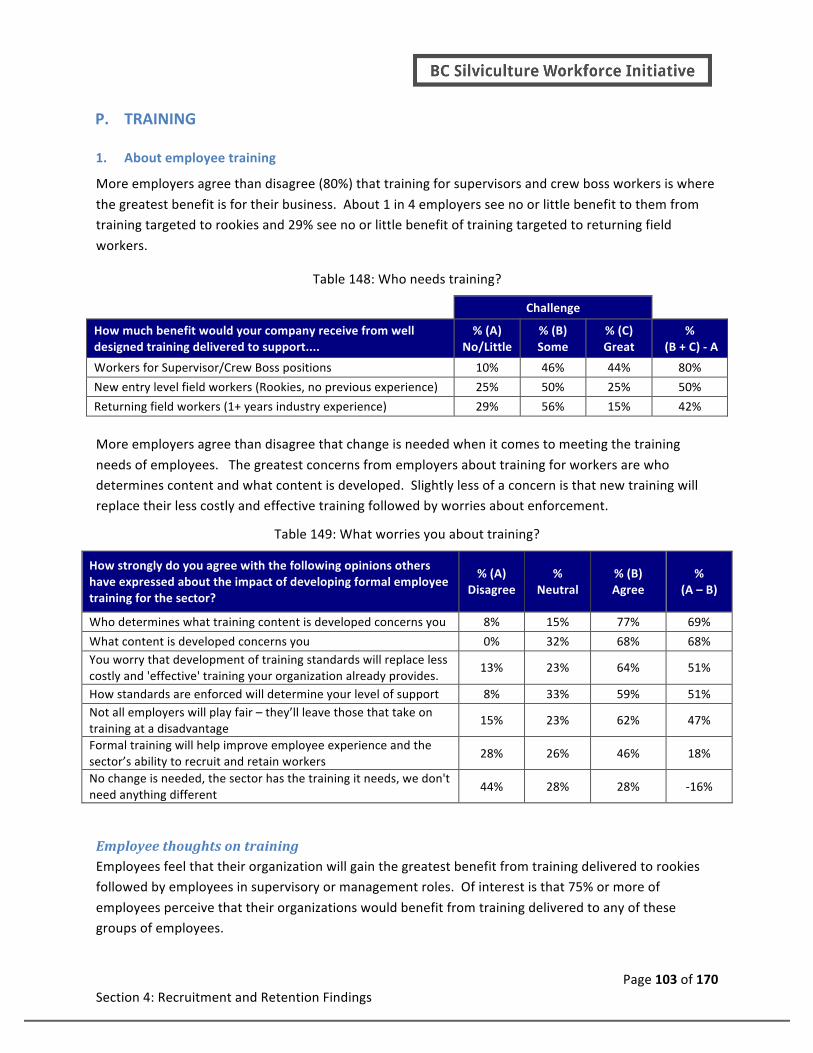
Page 103 of 170 Section 4: Recruitment and Retention Findings
P. TRAINING
1. About employee training
More employers agree than disagree (80%) that training for supervisors and crew boss workers is where
the greatest benefit is for their business. About 1 in 4 employers see no or little benefit to them from training targeted to rookies and 29% see no or little benefit of training targeted to returning field
workers.
Table 148: Who needs training?
Challenge
How much benefit would your company receive from well designed training delivered to support....
% (A) No/Little
% (B) Some
% (C) Great
% (B + C) -‐ A
Workers for Supervisor/Crew Boss positions 10% 46% 44% 80%
New entry level field workers (Rookies, no previous experience) 25% 50% 25% 50%
Returning field workers (1+ years industry experience) 29% 56% 15% 42%
More employers agree than disagree that change is needed when it comes to meeting the training
needs of employees. The greatest concerns from employers about training for workers are who determines content and what content is developed. Slightly less of a concern is that new training will replace their less costly and effective training followed by worries about enforcement.
Table 149: What worries you about training?
How strongly do you agree with the following opinions others have expressed about the impact of developing formal employee training for the sector?
% (A) Disagree
% Neutral
% (B) Agree
% (A – B)
Who determines what training content is developed concerns you 8% 15% 77% 69%
What content is developed concerns you 0% 32% 68% 68% You worry that development of training standards will replace less costly and 'effective' training your organization already provides.
13% 23% 64% 51%
How standards are enforced will determine your level of support 8% 33% 59% 51% Not all employers will play fair – they’ll leave those that take on training at a disadvantage
15% 23% 62% 47%
Formal training will help improve employee experience and the sector’s ability to recruit and retain workers
28% 26% 46% 18%
No change is needed, the sector has the training it needs, we don't need anything different
44% 28% 28% -‐16%
Employee thoughts on training Employees feel that their organization will gain the greatest benefit from training delivered to rookies followed by employees in supervisory or management roles. Of interest is that 75% or more of
employees perceive that their organizations would benefit from training delivered to any of these groups of employees.

Page 104 of 170 Section 4: Recruitment and Retention Findings
Table 150: Employee thoughts about who to train
How much benefit do you feel your organization might receive from
well-‐designed training delivered to support....
% No/Little
Benefit
% Some/Great
Benefit
New to sector (rookies) 10% 90%
Returning field workers not in supervisory or management roles but with 1 or more years of experience
12% 88%
Returning field workers not in supervisory or management roles but with 1 or more years of experience
24% 76%
Q. GENERAL FINDINGS
1. Employer’s Perspective on their Workforce
Employers accurately estimate employee satisfaction.
Table 151: Employee Reported Overall Satisfaction
Overall Satisfaction (0-‐10) %
Not Satisfied
% Neutral
% Satisfied
Satisfaction with work day experience 3% 17% 80%
Satisfaction with accommodation 4% 16% 80%
Career Experience 1% 20% 79%
Satisfaction with income 7% 31% 62%
Table 152: Employee Actual Employee Satisfaction (0 to 10)
Overall, how satisfied would you say your field staff are with their 2013 work experience?
Mean 50th Min Max
Field Staff 7.2 7.0 0 10
Supervisors and/or Crew Boss 7.7 8.0 1 10
Table 153: Employer Perception of Employee Satisfaction (0 to 10)
Overall, how satisfied would you say your field staff are with their 2013 work experience?
Mean 50th Min Max
Field Staff 7.1 8.0 2 10
Supervisors and/or Crew Boss 7.2 8.0 2 10
Least satisfied crew 6 6 0 10
Most satisfied crew 9 9 3 10

Page 105 of 170 Section 4: Recruitment and Retention Findings
2. Workforce Social Network
On average employees stay in contact with about 8 other employees that work in the same company and about 2 that work for another company.
Table 154: Social Connections with other employees
Do you stay in direct contact with other silviculture workers throughout the year?
Mean Std. Dev.
Employees with same silviculture company 7.74 5.1
Employees with another silviculture company 1.83 2.4
Direct contact with other silviculture workers throughout the year is correlated with the likelihood of
returning to work in 2014.
Table 155: Relationship between social connections and likelihood to return to the sector in 2014
Do you stay in direct contact with other silviculture workers throughout the year?
Pearson’s r R2
How likely are you to return to silviculture work in 2014? .163** .027

Page 106 of 170 Appendix
Appendix 1 – Personality Assessments (GRIT)
The Grit Scale contains 12 questions (items) that can be grouped into two factors. The first factor
contained 6 items indicating consistency of interests, and the second factor contained 6 items indicating perseverance of effort. Internal consistency reliability is a measure of reliability used to evaluate the degree to which different items
(questions) that probe the same construct produce similar results. The GRIT scale demonstrated high internal consistency (α = .85) for the overall scale and for each factor (Consistency of
Interests, (α =.84); Perseverance of Effort, (α = .78).
Cronbach’s alpha provides the typical measure of reliability. Compared to other published studies we found the Cronbach’s alpha in this survey was lower and fell into the poor range.
Table 156: GRIT Summary Statistics – Silviculture Employees
α N M SD
Silviculture Employees .54 285 2.45 .417
Table 157: GRIT Questions for Silviculture Employees
GRIT Questions Sample
Mean
SD N
I have overcome setbacks to conquer an important challenge 1.80 .855 285
New ideas and projects sometimes distract me from previous ones 2.76 1.003 285
My interests change from year to year 2.99 1.081 285
Setbacks don't discourage me 2.24 .968 285
I have been obsessed with a certain idea or project for a short time but later lost interest 3.08 1.097 285
I am a hard worker 1.31 .560 285
I often set a goal but later choose to pursue a different one 3.06 1.083 285
I have difficulty maintaining my focus on projects that take more than a few months to complete 3.41 1.092 285
I finish whatever I begin 2.13 .980 285
I have achieved a goal that took years of work 2.09 1.097 285
I become interested in new pursuits every few months 2.78 1.135 285
I am diligent 1.80 .785 285

Page 107 of 170 Appendix
Appendix 2 – Why workers enter/exit sector (summary)
Table 158: Summary of what attracted workers to sector
Listed below are some common reasons that workers say they were attracted to silviculture work.
Responses Percent of Cases N = 618
The income (Important) 613 99%
Don't Recall this as being Important 5 1% Very Little Importance 21 3% Some Importance 181 29% Very Important 411 66%
Attracted by independence and outdoor experience (Important) 604 96%
Don't Recall this as being Important 9 1% Very Little Importance 26 4% Some Importance 203 33% Very Important 375 60%
Wanted the physical work to stay in shape (Important) 522 84%
Don't Recall this as being Important 40 6% Very Little Importance 81 13% Some Importance 270 44% Very Important 211 34%
I knew someone already working in silviculture (Important) 520 70%
Don't Recall this as being Important 84 14% Very Little Importance 72 12% Some Importance 178 29% Very Important 270 44%
Work fit with my desire to help the environment (Important) 353 57%
Don't Recall this as being Important 122 20% Very Little Importance 143 23% Some Importance 242 39% Very Important 90 15%
No other job options at the time (Important) 180 29%
Don't Recall this as being Important 206 33% Very Little Importance 175 28% Some Importance 144 23% Very Important 67 11%
Thought this would be a good career choice (Important) 160 26%
Don't Recall this as being Important 221 36% Very Little Importance 220 35% Some Importance 128 21% Very Important 33 5%
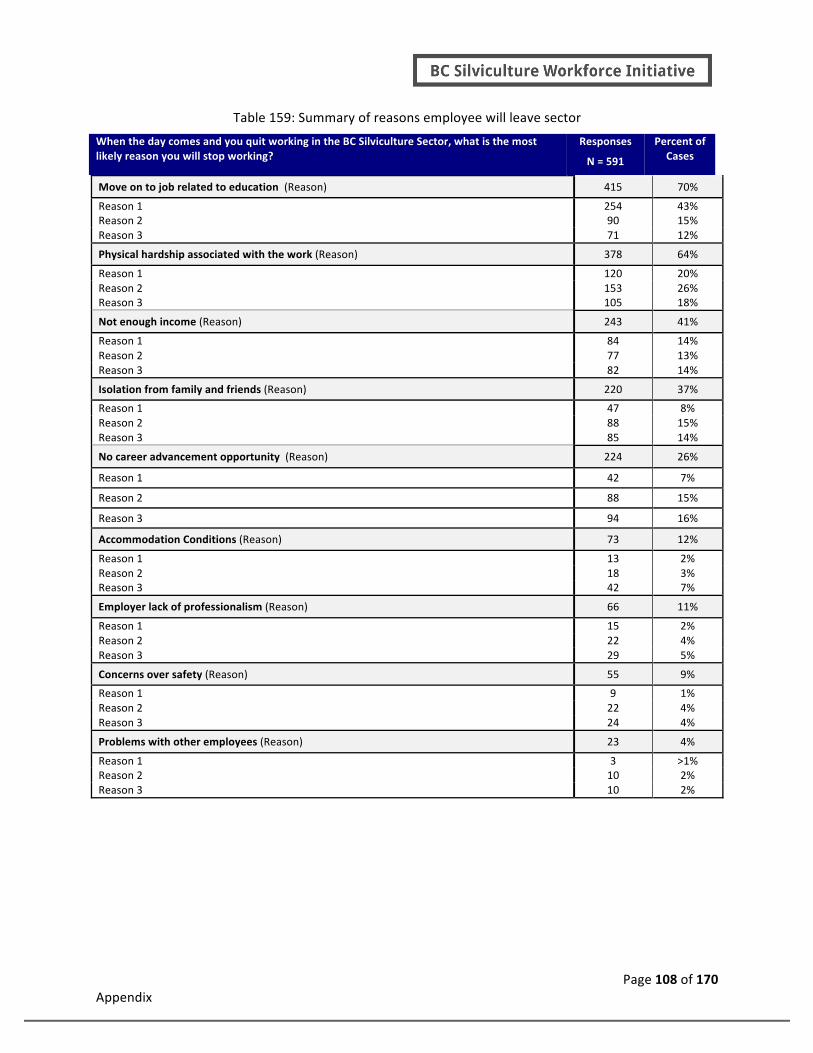
Page 108 of 170 Appendix
Table 159: Summary of reasons employee will leave sector
When the day comes and you quit working in the BC Silviculture Sector, what is the most likely reason you will stop working?
Responses Percent of Cases N = 591
Move on to job related to education (Reason) 415 70%
Reason 1 254 43% Reason 2 90 15% Reason 3 71 12%
Physical hardship associated with the work (Reason) 378 64%
Reason 1 120 20% Reason 2 153 26% Reason 3 105 18%
Not enough income (Reason) 243 41%
Reason 1 84 14% Reason 2 77 13% Reason 3 82 14%
Isolation from family and friends (Reason) 220 37%
Reason 1 47 8% Reason 2 88 15% Reason 3 85 14%
No career advancement opportunity (Reason) 224 26%
Reason 1 42 7%
Reason 2 88 15%
Reason 3 94 16%
Accommodation Conditions (Reason) 73 12%
Reason 1 13 2% Reason 2 18 3% Reason 3 42 7%
Employer lack of professionalism (Reason) 66 11%
Reason 1 15 2% Reason 2 22 4% Reason 3 29 5%
Concerns over safety (Reason) 55 9%
Reason 1 9 1% Reason 2 22 4% Reason 3 24 4%
Problems with other employees (Reason) 23 4%
Reason 1 3 >1% Reason 2 10 2% Reason 3 10 2%

Page 109 of 170 Appendix
Appendix 3 – Employee Survey

Page 110 of 170 Appendix

Page 111 of 170 Appendix

Page 112 of 170 Appendix

Page 113 of 170 Appendix

Page 114 of 170 Appendix

Page 115 of 170 Appendix

Page 116 of 170 Appendix

Page 117 of 170 Appendix

Page 118 of 170 Appendix
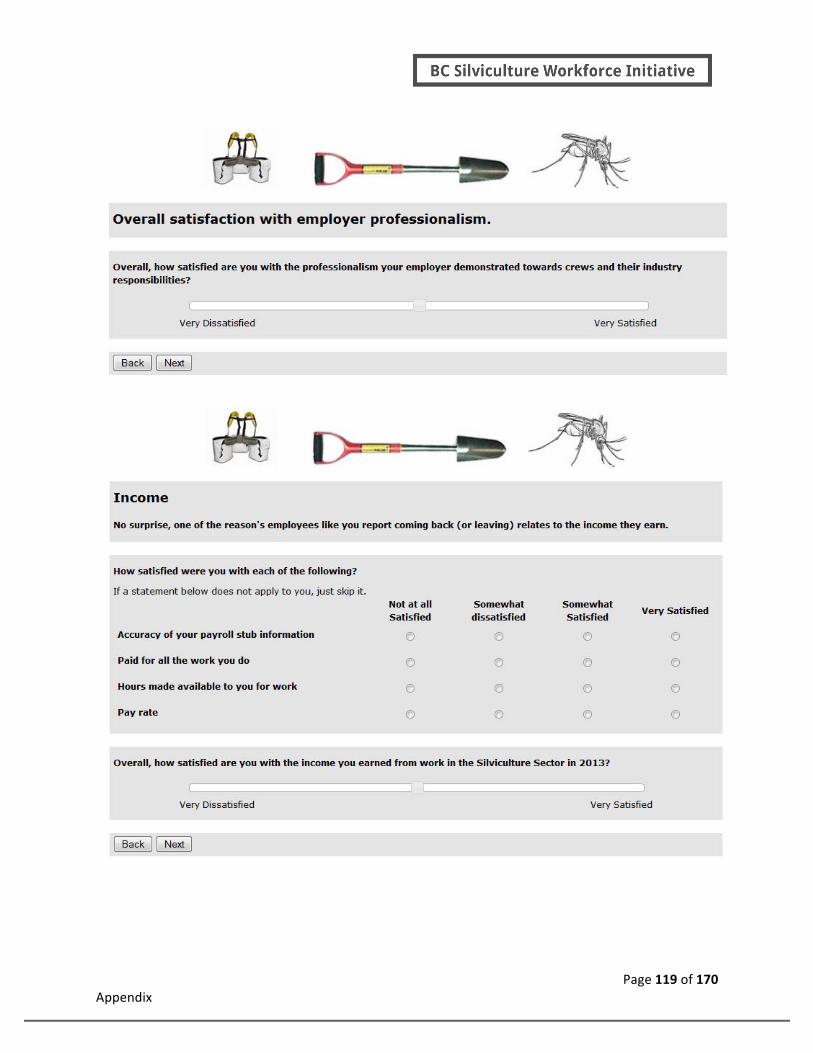
Page 119 of 170 Appendix

Page 120 of 170 Appendix
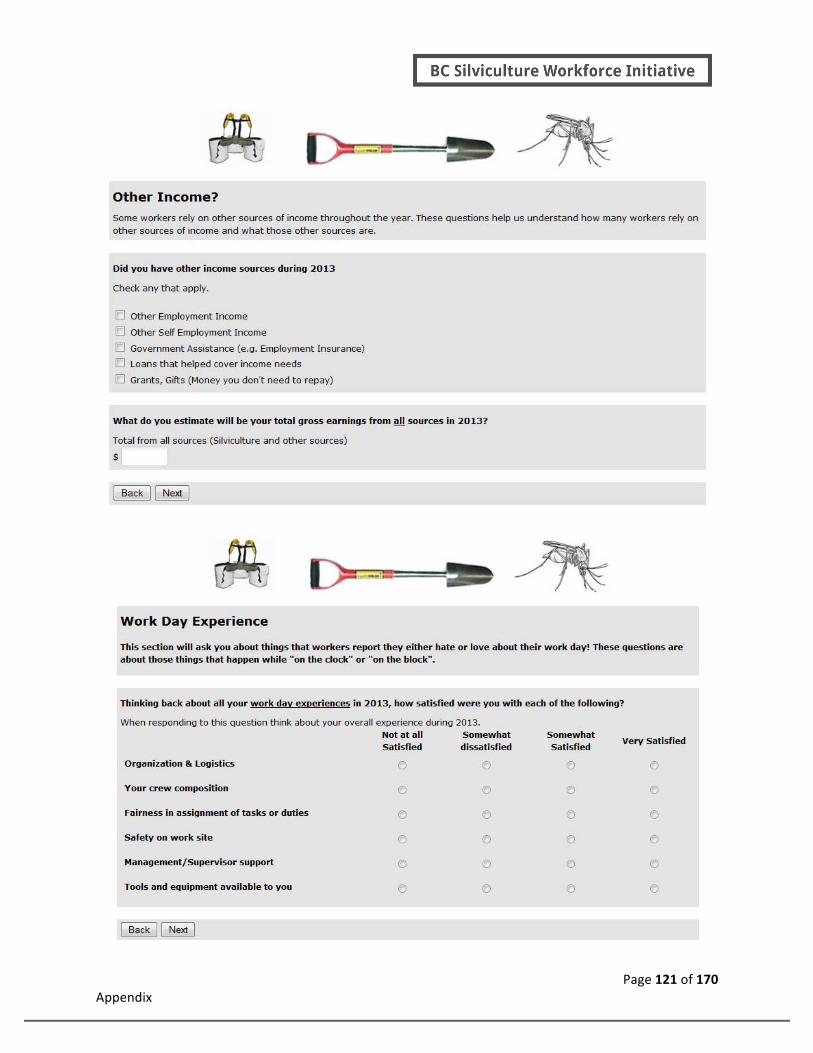
Page 121 of 170 Appendix

Page 122 of 170 Appendix

Page 123 of 170 Appendix

Page 124 of 170 Appendix

Page 125 of 170 Appendix

Page 126 of 170 Appendix

Page 127 of 170 Appendix

Page 128 of 170 Appendix

Page 129 of 170 Appendix

Page 130 of 170 Appendix

Page 131 of 170 Appendix

Page 132 of 170 Appendix

Page 133 of 170 Appendix
Appendix 4 – Employee Quality Assurance Survey

Page 134 of 170 Appendix

Page 135 of 170 Appendix

Page 136 of 170 Appendix

Page 137 of 170 Appendix
Appendix 5 – Employer Initial Survey Invite Dear [Full Name],
In a project funded by the Canada-‐British Columbia Labour Market Development Agreement, the BC silviculture sector is working to improve recruitment and retention of workers. As part of this work, Dialogue Research is conducting an industry wide census survey to get a clearer picture of the challenges facing employers in silviculture today and a forecast for the future.
You have received this letter as one of approximately 180 businesses we believe were earning most of their income from silviculture in BC in 2013. With so few businesses operating your response is critical to ensuring an accurate profile is obtained.
The online survey asks you questions about your operations (e.g. number of employees, hectares covered, revenues, etc.). Where you do not have documentation close at hand you can provide estimates. Some questions are quite specific, and we want to assure you that while we will be sharing the general results of the survey with the sector your business’s specific information will be kept strictly confidential.
This project allows us to offer you customized data reports we think you will find helpful for business operations and planning purposes. You can chose to receive a basic report that compares your operation to similar ones in the sector, or a more in-‐depth option where we send your employees custom invites to the 2013 employee survey and provide you with a report that compares your employees to other firms’ employees on some key criteria. If you go this route you will also have access to additional data and the opportunity to ask your employees some of your own questions. These offers are explained in more detail within the survey.
We know that your participation in this research will take some time. In recognition, every firm that completes a survey will be entered into a draw for one of two $250 prizes.
Simply click on the link below, or cut and paste the entire URL into your browser to access the survey:
[Invite Link]
This link is uniquely tied to this survey and your email address.
We would appreciate your response by December 12, 2013
Sincerely,
Doug Balson
Dialogue Research www.dialogueresearch.com
P.S.
If you believe you received this email in error please contact me to be removed from our list.
If you would like someone else in your company to respond to the survey you have two options. You can simply forward this email to them. They can complete the survey on your behalf but you will be sent reminders and all future survey invites. If you would like us to update our list so future reminders and survey invites go directly to someone else simple reply to this email and let us know the email address and name of the person you would like the invite sent to. If you want to know more about this project you can go to www.bcsilviculture.ca
If you have questions or problems filling out the survey please contact Doug Balson toll free at 1 877
450-‐8304

Page 138 of 170 Appendix
Appendix 6 – Employer Survey
Page 139 of 170 Appendix

Page 140 of 170 Appendix
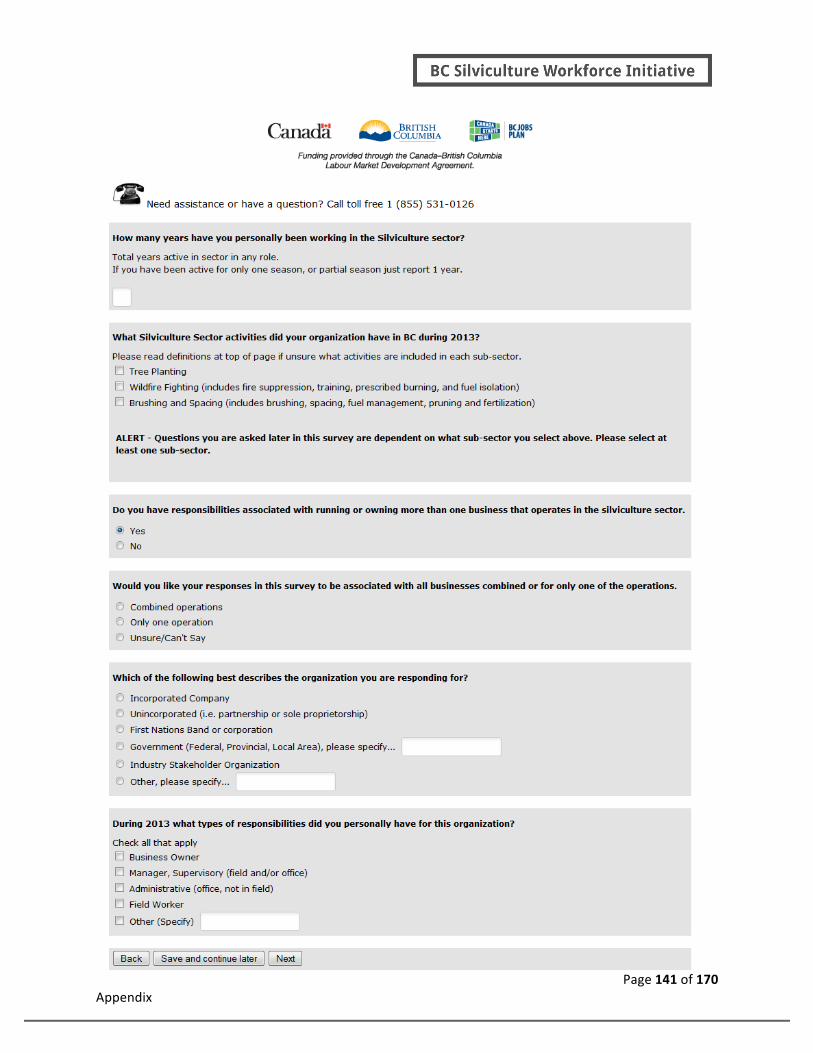
Page 141 of 170 Appendix

Page 142 of 170 Appendix

Page 143 of 170 Appendix

Page 144 of 170 Appendix

Page 145 of 170 Appendix

Page 146 of 170 Appendix
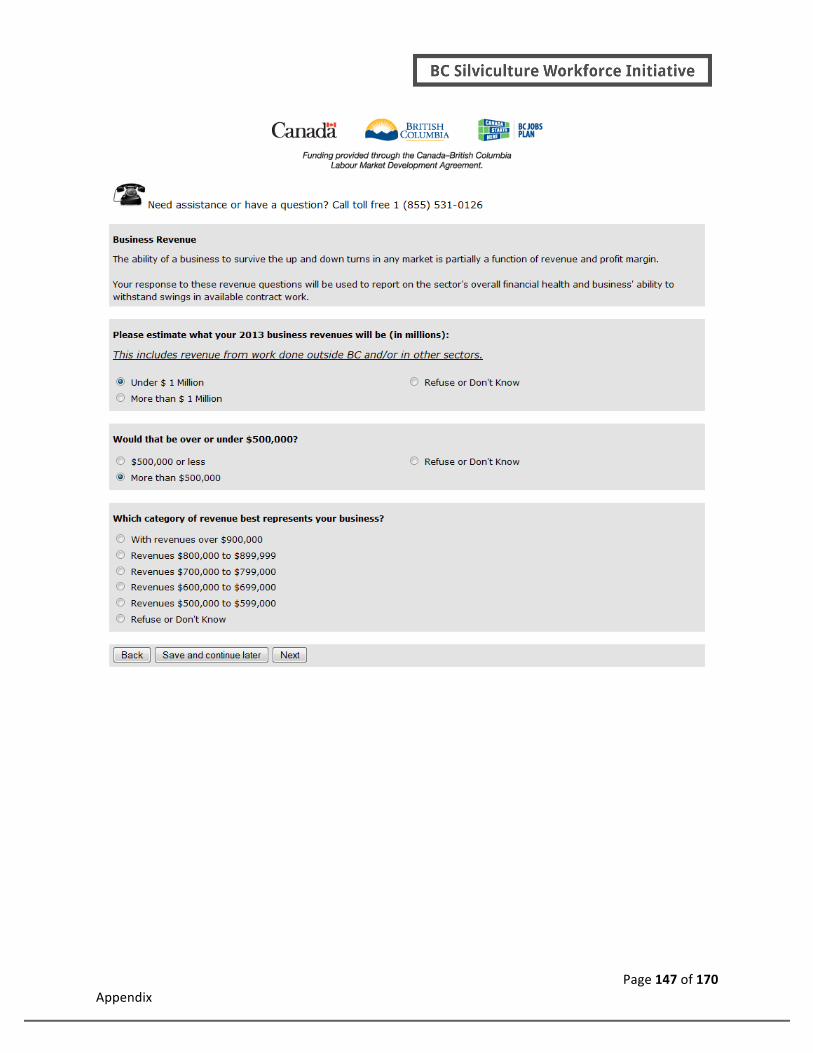
Page 147 of 170 Appendix

Page 148 of 170 Appendix
Or if More than $500,000

Page 149 of 170 Appendix
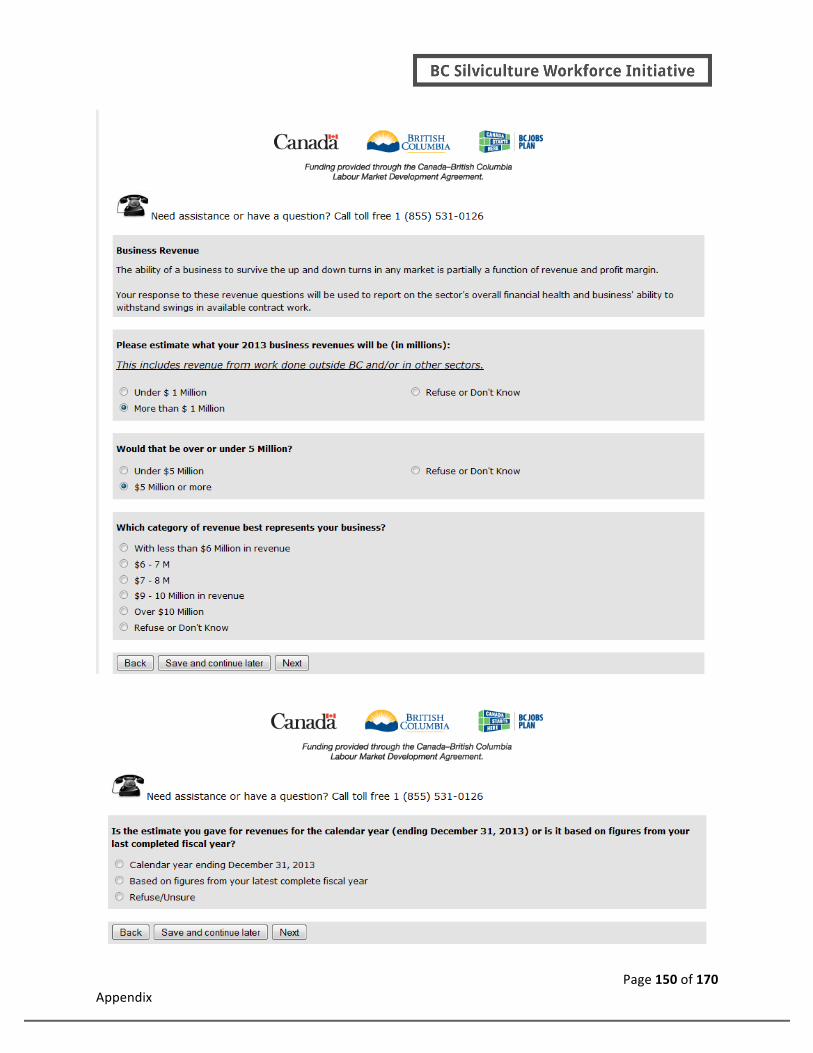
Page 150 of 170 Appendix

Page 151 of 170 Appendix

Page 152 of 170 Appendix
Page 153 of 170 Appendix

Page 154 of 170 Appendix

Page 155 of 170 Appendix

Page 156 of 170 Appendix

Page 157 of 170 Appendix

Page 158 of 170 Appendix

Page 159 of 170 Appendix

Page 160 of 170 Appendix

Page 161 of 170 Appendix

Page 162 of 170 Appendix
Page 163 of 170 Appendix

Page 164 of 170 Appendix

Page 165 of 170 Appendix
Page 166 of 170 Appendix
Page 167 of 170 Appendix

Page 168 of 170 Appendix

Page 169 of 170 Appendix
Page 170 of 170 Appendix
Appendix 7– Accuracy of BCFSC SAFE Companies Classifications
BC Forest Safety Council Classifications (employee counts)
Agreement between administrative employee count data reported through BCFSC’s SAFE certification
types and employee counts self-‐reported through the survey was evaluated by looking at how often classifications differed between what an employer reported counts for employees was and the BCFSC SAFE certification count is.
There is a total of 39 of our 48 respondents that have SAFE certified classification as reported by BCFSC.
These were compared to the employer respondent’s survey response (counts of employees). The review found that in 12 of these comparisons (31%) there was disagreement between certification type reported by administrative and survey response. The trend is to under report employee counts.
In addition, for those employers in our sample with no Classification (n=9) we find:
4=BASE (20+ employees, sample average is 116)
4= SEBASE (6 to 19 employees, sample average is 12)
1=ISEBASE (2 to 5 employees, sample average is 4)
When making estimates of employer counts for businesses with no BCFSC SAFE certification, we recommend using the mean count of 28 compared to the mean count of 70 associated with the average count for all businesses in the sector.