Embed Size (px)
Citation preview

1
Using ISSR genomic fingerprinting to study the genetic
differentiation of Artemia Leach, 1819 (Crustacea: Anostraca)
from Iran and neighbor regions with the focus on the invasive
American Artemia franciscana
Amin Eimanifar1*, Alireza Asem2*, Pei-Zheng Wang3, Weidong Li2 and Michael
Wink1
1 Institute of Pharmacy and Molecular Biotechnology (IPMB), Heidelberg University, Im
Neuenheimer Feld 364, 69120 Heidelberg, Germany.
2 College of Fisheries and Life Science, Hainan Tropical Ocean University, Sanya, China.
3 College of Ecology and Environment, Hainan Tropical Ocean University, Sanya, China.
* equal contribution as the first author and corresponding author (A.E.:
[email protected], A.A.: [email protected])
Preprints (www.preprints.org) | NOT PEER-REVIEWED | Posted: 6 March 2020 doi:10.20944/preprints202003.0098.v1
© 2020 by the author(s). Distributed under a Creative Commons CC BY license.
Peer-reviewed version available at Diversity 2020, 12, 132; doi:10.3390/d12040132

2
Abstract: Due to the rapid developments in aquaculture industry, Artemia franciscana,
originally an American species, has been intentionally introduced to the Eurasia, Africa
and Australia. In the present study, we used a partial sequence of the mitochondrial DNA
Cytochrome Oxidase subunit I (mt-DNA COI) gene and genomic fingerprinting by Inter-
Simple Sequence Repeats (ISSRs) to determine the genetic variability and population
structure of Artemia populations (indigenous and introduced) from 14 different
geographical locations in Western Asia. Based on the haplotype spanning network,
Artemia urmiana has exhibited higher genetic variation than native parthenogenetic
populations. Although A. urmiana represented a completely private haplotype distribution,
no apparent genetic structure was recognized among the native parthenogenetic and
invasive A. franciscana populations. Our ISSR findings have documented that despite
invasive populations have lower variation than source population in Great Salt Lake
(Utah, USA), they have significantly revealed higher genetic variability compare to the
native populations in Western Asia. According to the ISSR results, the native populations
were not fully differentiated by the PCoA analysis, but the exotic A. franciscana
populations were geographically divided in four genetic groups. We believe that during
the colonization, invasive populations have experienced substantial genetic divergences,
under new ecological conditions in the non-indigenous regions.
Keywords: genetic variation; brine shrimp Artemia; invasive species; mt-DNA COI;
Inter-Simple Sequence Repeats (ISSRs) genomic fingerprinting; Western Asia
Preprints (www.preprints.org) | NOT PEER-REVIEWED | Posted: 6 March 2020 doi:10.20944/preprints202003.0098.v1
Peer-reviewed version available at Diversity 2020, 12, 132; doi:10.3390/d12040132

3
1. Introduction
The brine shrimp Artemia is a unique zooplankton has the limited number of species,
distributed globally, except in Antarctica [1]. This tiny crustacean has potentially adapted
to live in the extreme environmental conditions such as hypersaline environments [2,3].
Artemia has been mainly used as a live food in larviculture and fishery industries,
especially in Asia [46]. Artemia has been used to improve the quality of sodium chloride
production in solar salt-fields [4,5]. It was also introduced as a model organism in many
bioscience studies, including cellular and molecular biology [6], phylogeography and
asexual evolution [7], bioencapsulation [8] and toxicity assessment [9].
The genus Artemia consists of seven bisexual species and a large number of
parthenogenetic populations with different ploidy levels [3,10]. It has been assumed that
Asia is the origin of Artemia urmiana Günther, 1899 (Lake Urmia, Iran), Artemia sinica
Cai, 1989 (China), Artemia tibetiana Abatzopoulos, Zhang and Sorgeloos, 1998
(Qinghai–Tibetan Plateau, China), and corresponding parthenogenetic populations [3,11].
Recently, two new species, Artemia frameshifta and Artemia murae have been described
from Mongolia [12]. These species have been described using a single mitochondrial
DNA protein-coding Cytochrome Oxidase subunit I (COI) gene sequence without
confirmation by any morphometric and population genetic analyses [see 11]. A main
problem in the submitted COI sequence of A. frameshifta (LC195588) was detected in the
protein sequence with several stop codon(s). In a protein coding gene, this is an
indication for a nuclear copy of this mtDNA gene. Sometimes, the COI marker provides a
sharp PCR amplified band on the agarose gel but the sequence information presents
heterogeneities [44]. These kinds of results could mis-lead the interpretation of
Preprints (www.preprints.org) | NOT PEER-REVIEWED | Posted: 6 March 2020 doi:10.20944/preprints202003.0098.v1
Peer-reviewed version available at Diversity 2020, 12, 132; doi:10.3390/d12040132

4
downstream phylogenetic analyses. Therefore, population would need more
biosystematic evidences to determine its taxonomical status. In A. murae, neither the
existence of males nor the reproductive mode has been revealed [12]. Based on the
current information, we assume that A. murae is a parthenogenetic population, which
needs more investigations to confirm the biological status of the species.
Generally, the long-distance translocations of the American species Artemia
franciscana to other non-indigenous regions has occurred as a result of commercial
activities which have been fully documented, previously [2,13-16]. Artemia franciscana
is a successful invader in saltwater ecosystems due to its faster filter-feeding rate, a high
potential of reproduction [13,45], and a better physiological immune system which is
associated with nutritional behavior against cestode parasites [13] than the native species.
Asem et al. [15] have suggested that these biological characteristics could afford a high
level of adaptive potential of A. franciscana in the new non-indigenous habitats, which
would eventually result in the replacement with native species.
Lee [17] has documented that genetic structure of introduced populations to the
non-indigenous habitats is one of the most determinative parameters in their successful
establishment. Generally, genetic diversity of the species could determine the potential of
an exotic species to acclimatize in the new environmental conditions [18].
Previous studies on A. franciscana have documented that invasive populations
demonstrated genetic variations relative to the native American source populations
[2,15,16,19-21]. The low genetic diversity in the non-indigenous populations has been
attributed to the founder effect [19] or population bottleneck due to the decreasing of
population size in introduced populations during the process of establishment [15].
Preprints (www.preprints.org) | NOT PEER-REVIEWED | Posted: 6 March 2020 doi:10.20944/preprints202003.0098.v1
Peer-reviewed version available at Diversity 2020, 12, 132; doi:10.3390/d12040132

5
Moreover, high genetic variation could be result of adaptive capacity and physiological
flexibility as a special biological trait observed in invasive populations [2,5,21-23].
Eimanifar et al. [2] have reported the existence of invasive A. franciscana in four sites
from Iran (3 sites) and Iraq (1 site) using the mitochondrial COI sequence marker. The
aim of the present study was to further perform an analysis based on population genetic
approaches to determine the intra- and inter-specific genetic variations of native and
invasive Artemia populations from Iran and neighboring regions (14 sites) using Inter-
Simple Sequence Repeats (ISSRs) genomic fingerprinting. Genomic fingerprinting by
ISSR has been demonstrated to be a useful molecular tool to recognize DNA
polymorphisms among Artemia taxa [24-27]. We hypothesize that the establishment of an
exotic species in the new geographical habitats should be accompanied by intra-species
genetic divergence to better adapt to the new environmental conditions. Here, we utilized
high-resolution ISSR genomic fingerprinting to compare the genetic differentiation in
relationship with native populations and colonized American A. franciscana in the
indigenous environments.
2. Material and Methods
2.1. Sample collection and DNA extraction
Artemia cyst specimens were collected from 14 geographical localities across Iran and
neighbor countries (Figure 1). All studied populations had been confirmed to be bisexual
or parthenogenetic according by Asem et al. [3]. The sample localities with their
geographical coordinates, abbreviations and IPMB voucher are summarized in Table 1.
Total genomic DNA was extracted from part of the antenna of adult males and females
using the Chelex® 100 Resin method (6%, Bio-Rad Laboratories, Hercules, CA, U.S.A.)
Preprints (www.preprints.org) | NOT PEER-REVIEWED | Posted: 6 March 2020 doi:10.20944/preprints202003.0098.v1
Peer-reviewed version available at Diversity 2020, 12, 132; doi:10.3390/d12040132
6
[16]. All extracted DNA was stored at -80 ºC for subsequent genetic characterization.
2.2. Population identification and phylogenetic analyses
A partial sequence of the mitochondrial marker cytochrome c oxidase subunit I (COI)
was utilized to identify the taxonomical status of the studied populations using
phylogenetic analyses as implemented in MEGA X program [2, 15, 16]. To identify the
taxonomical status of the studied populations, the COI reference sequences from the
recognized bisexual species and parthenogenetic populations were downloaded from
GenBank (Table 2). Sequences were aligned using MEGA X with default settings [28].
Phylogenetic trees were reconstructed based on Maximum Likelihood approach included
in the MEGA X program. To reveal the genealogical and geographical relationships, a
median haplotype network was established out following the median-joining algorithm in
the Network program ver. 5.0.1.1 [29].
2.3. Genomic fingerprinting by ISSR-PCR
Genomic variability was examined by inter simple sequence repeat ISSR-PCR using the
same DNA template used for phylogenetic analyses. Initially, 15 ISSR primers were
analyzed to distinguish the intra- and inter-specific genetic variability within and among
83 randomly selected individuals, belonging to 14 geographically different localities of
Artemia. Out of 15 tested ISSR primers, five were selected because of unambiguous
banding patterns of the PCR products (Table 3).
PCR was carried out in a 25 μl volume consisting of 40 ng template DNA, 2.5 μl 10×
PCR buffer [160 mM (NH4)2SO4, 670 mM Tris-HCl pH 8.8, 0.1 % Tween-20, 25 mM
Preprints (www.preprints.org) | NOT PEER-REVIEWED | Posted: 6 March 2020 doi:10.20944/preprints202003.0098.v1
Peer-reviewed version available at Diversity 2020, 12, 132; doi:10.3390/d12040132

7
MgCl2), 10 pmol primer, 2 μg/μl bovine serum albumin (BSA), 0.5 units Taq DNA
polymerase (Bioron), 0.1 mM dGTP, dCTP, and dTTP, 0.045 mM dATP, 1 μCi [α-33P]-
dATP (Perkin Elmer, LAS, Rodgau, Germany). PCR amplifications were executed in a
thermal cycler based on the following conditions: 94 °C denaturation for 1 min., 35
cycles of 46-54 °C annealing for 50 s and 72 °C extension for 2 min. The final cycle was
continued for 7-min at 72 °C. Final PCR products were mixed with 8 μl bromophenol
blue and run on a high-resolution denaturing polyacrylamide gels 6 % (0.2 mm) for 3 h at
65 W (size 45×30 cm) including 1× TBE buffer. The gels were dried and exposed for 2
days to X-ray hyperfilm (Kodak, Taufkirchen, Germany) and subsequently developed.
Finally, the autoradiograms were scanned to identify the polymorphic bands [25].
2.4. ISSR statistics
The quality and quantity of ISSR bands were inspected, visually. Ambiguous and
smeared bands were excluded from the analysis and only unequivocally reproducible
bands were scored for each individual as present (1) or absent (0). The binary data matrix
(presence = 1; absence = 0) was formulated in MS Excel v.2016 and used for subsequent
genetic analyses.
ISSR data were analyzed via Bayesian model-based clustering algorithm as
implemented in STRUCTURE v. 2.3 program [30,31]. We analyzed genetic structure
among populations by assigning individuals into potential numbers of clusters (K = 1-10).
ISSR genotypes were processed with a period of burn-in 50,000 and 100,000 MCMC
repetitions [32]. CLUMPAK online program was employed to identify the pattern of
clustering modes and packaging population structure [33]. The online programs,
STRUCTURE HARVESTER [34] and CLUMPAK [33] were implemented to assess and
Preprints (www.preprints.org) | NOT PEER-REVIEWED | Posted: 6 March 2020 doi:10.20944/preprints202003.0098.v1
Peer-reviewed version available at Diversity 2020, 12, 132; doi:10.3390/d12040132

8
visualize the most appropriate number of K by calculating the likelihood of the posterior
probability [35].
The binary data matrix was employed to calculate the genetic diversity parameters of
each population using GenAlex ver. 6.5 [36]. The population genetic parameters were as
follows: Na (number of different alleles), Ne (number of effective alleles), I (Shannon's
information index), He (expected heterozygosity), uHe (unbiased expected
heterozygosity), PPL (percentage of polymorphic loci), NB (number of bands) and NPB
(number of private bands) and pairwise population matrix of Nei genetic distance [25,26].
Intra- and inter-specific molecular variations and genetic relationships among
populations were implemented by Principal Coordinate Analysis (PCoA) and Analysis of
Molecular Variance (AMOVA) as utilized by GenAlex ver. 6.5, respectively [36].
To better understand the population genetic variations, ISSR analyses were performed
on three platforms separately, as follows: whole populations, native populations and
invasive American A. franciscana.
3. Results
3.1. Phylogenetic analyses and haplotype distribution
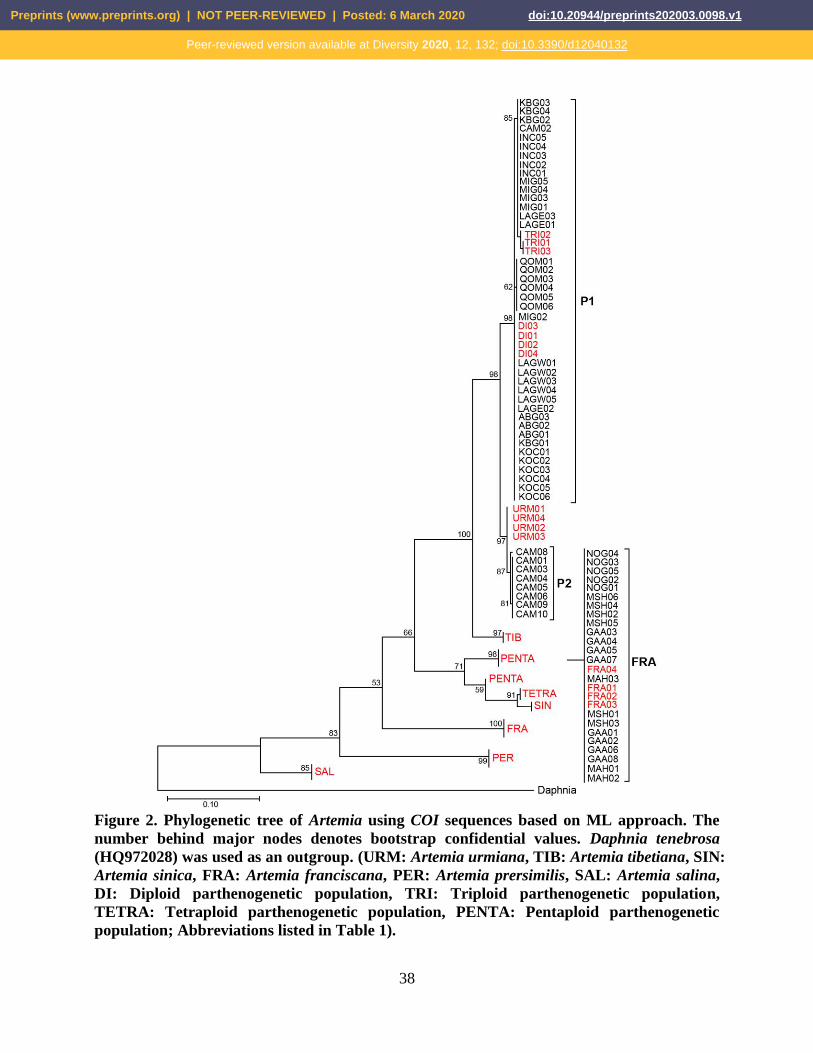
Our phylogenetic analyses provides evidence that the studied bisexual specimens from
three localities of Iran, Nough Catchment (NOG), MSH (Mahshar port) and Maharlu
Lake (MAHR), and a locality from Iraq ,Garmat Ali (GAA), clustered in the clade of A.
franciscana (Figure 2). In addition, all parthenogenetic populations clustered in two
separated clades, which they shared with a common ancestor with A. urmiana. Given that
all parthenogenetic populations were located in a single clade (P1), the majority of CAM
Preprints (www.preprints.org) | NOT PEER-REVIEWED | Posted: 6 March 2020 doi:10.20944/preprints202003.0098.v1
Peer-reviewed version available at Diversity 2020, 12, 132; doi:10.3390/d12040132

9
specimens (eight out of nine) were grouped in a distinct clade (P2) close to A. urmiana.
The clade P1 contained two sub-clades, consisting of diploids and triploid populations.
Figure 3 represents the haplotype spanning network of COI among native A.
urmiana and parthenogenetic populations. Results demonstrated that A. urmiana has
wider genetic variation compared to parthenogenetic ones. Genetic differentiation and a
close relationship of Camalti Lake (CAM) population (Turkey) with A. urmiana was
clearly revealed in the tree. While COI sequences of nine parthenogenetic populations
were distributed in five Haplotypes (H2-6), A. urmiana showed private haplotypes
without a shared haplotype in other populations. The COI sequences of invasive A.
franciscana were grouped in six distinct haplotypes. No population with private
haplotypes was observed (Figure 4). The numbers of individuals and population
composition were calculated for each haplotype (Tables S1 and S2).
3.2. ISSR profiling
We could show previously, that ISSR can detect substantial genetic variation in the genus
Artemia [25,26]. ISSR fingerprints can differ within and among populations. Altogether,
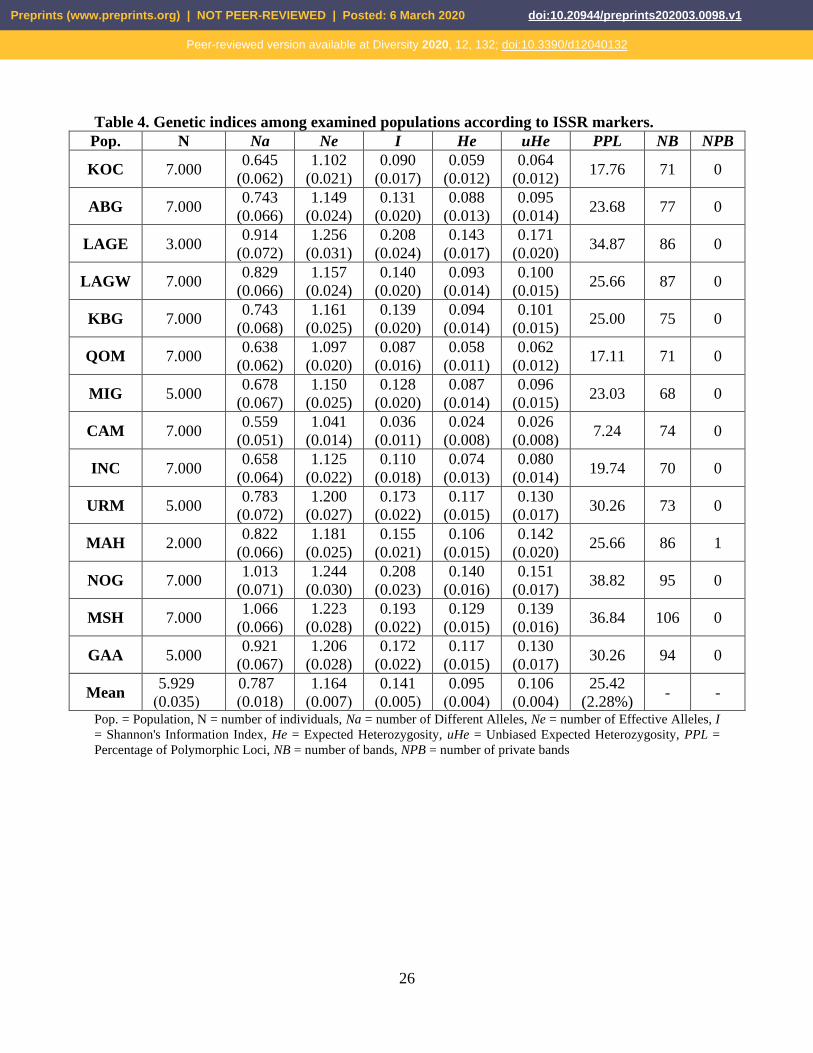
152 observed and unambiguously identified ISSR bands were analyzed. The total number
of polymorphic loci showed a mean value of 25.42% ± 2.28; the lowest number was seen
in Camalti Lake (CAM) (7.24 %) and the highest in Nough Catchment (NOG) (38.82 %).
Generally, the lowest values of genetic indices belonged to the parthenogenetic CAM,
while the highest values were shared between native parthenogenetic population from
Eastern lagoon around Urmia Lake (LAGE) (Ne = 1.256 ± 0.031, I= 0.208 ± 0.024, He =
0.143 ± 0.017, uHe = 0.171 ± 0.020) and invasive A. franciscana from NOG (Na = 1.013
Preprints (www.preprints.org) | NOT PEER-REVIEWED | Posted: 6 March 2020 doi:10.20944/preprints202003.0098.v1
Peer-reviewed version available at Diversity 2020, 12, 132; doi:10.3390/d12040132
10
± 0.071, I = 0.208 ± 0.023) (Table 4). In summary, 134 and 126 distinguished ISSR
bands were examined for ten native and four American A. franciscana populations,
respectively (Tables 5 and 6). According to the results of Nei genetic matrix,
parthenogenetic CAM from Turkey and invasive GAA from Iraq showed the high genetic
distance with parthenogenetic and invasive populations, respectively (Tables 7 and 8).
Based on total results of ISSR, the AMOVA analysis documented that most of the
genetic variations were attributed among native and invasive populations (69 % vs 31 %).
There was no indicative genetic variability observed in the midst of among- and within
variation (55 % vs 45 %) in native populations. In contrast, the high differentiation was
represented within populations (71 % vs 29 %) of non-indigenous A. franciscana in Asia
(Table 9a-c, Figure 5a-c).
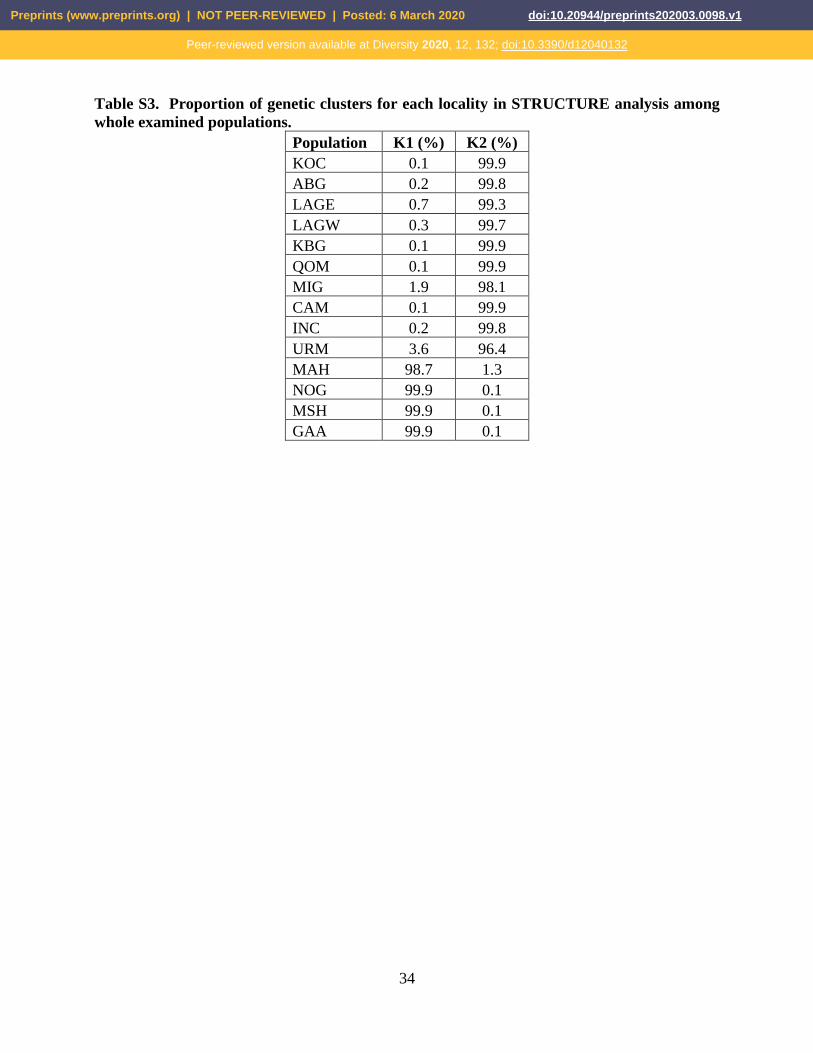
Bayesian clustering analysis using STRUCTURE was performed to investigate the
genetic patterns of the studied populations. The optimum K was obtained at K= 2 for the
whole 14 populations and ten native populations, and K= 9 for four invasive A.
franciscana, respectively. Figure 6 showed the clustering of genetic structures, where the
first highest posterior probability (K) was represented by different colors for each
population. With regard to the genetic patterns of ISSR, native and exotic populations
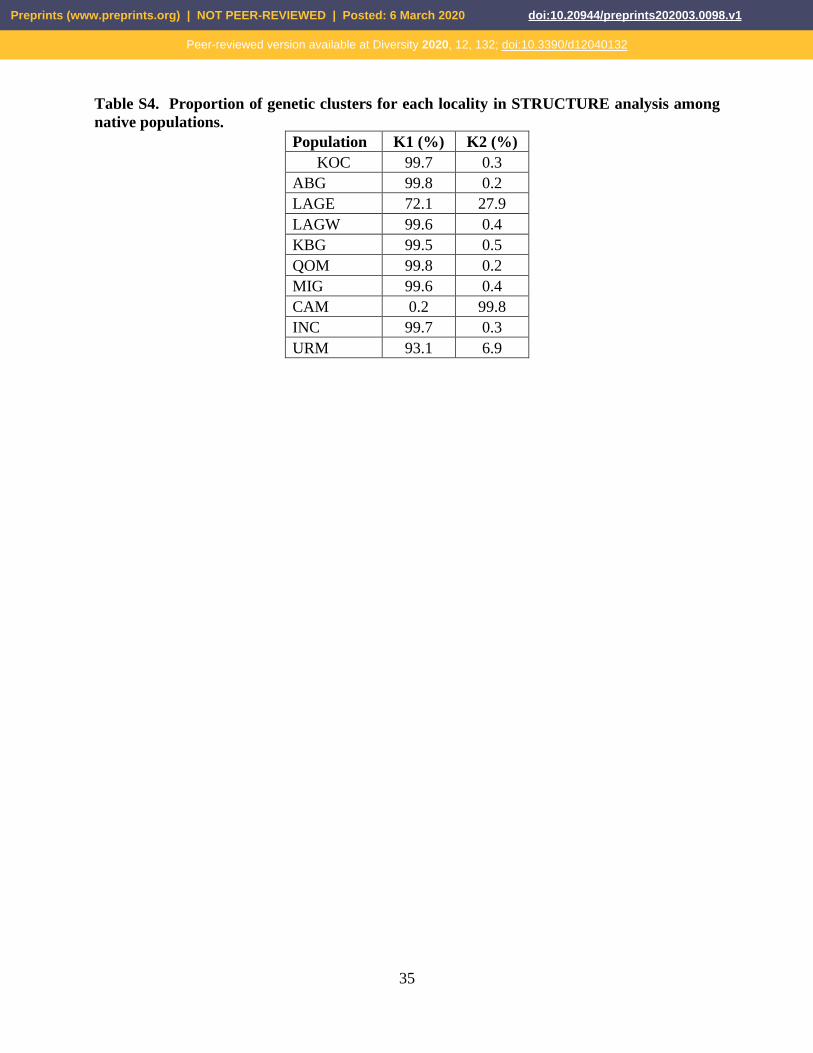
could be completely divided in two groups (Figure 6a). The results of analysis for native
populations documented that parthenogenetic CAM is a distinct population with a
differing clustering pattern. The STRUCTURE analysis could not fully distinguish A.
urmiana and parthenogenetic populations (Figure 6b). The high value of optimum K (K =
9) was prominent in clustering analysis for A. franciscana populations, which generally
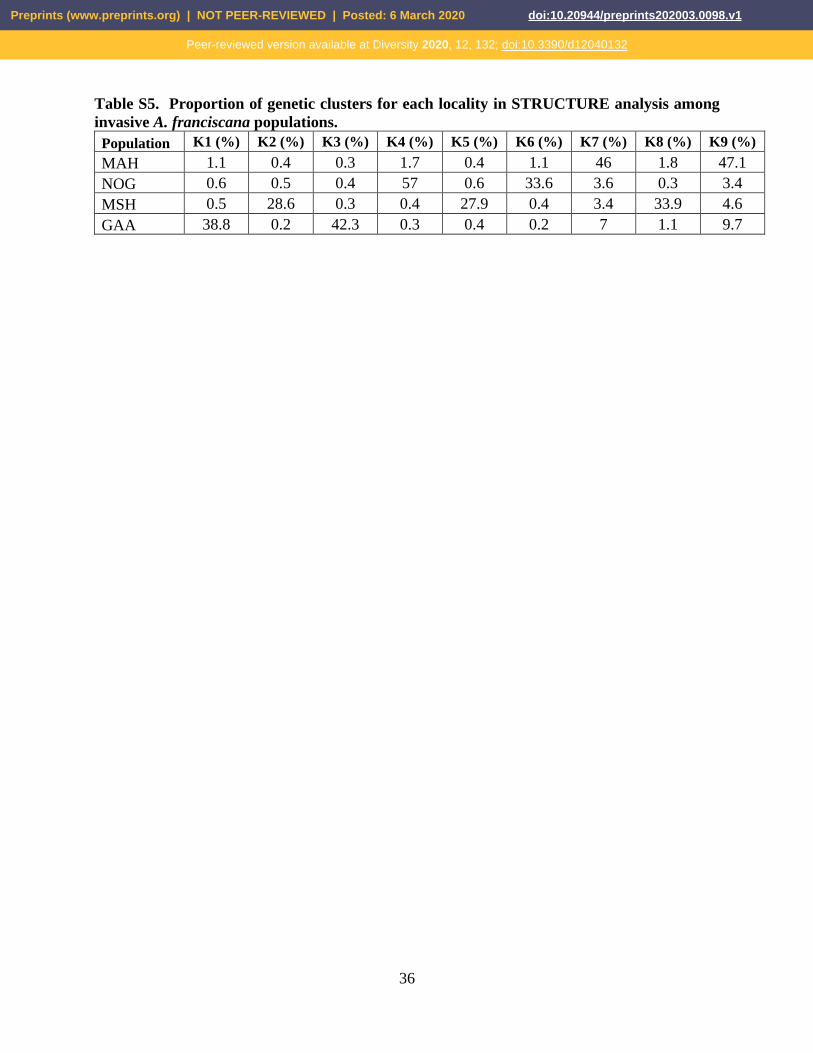
revealed a complex pattern (Figure 6c). Proportions of genetic clusters (percentage) for
Preprints (www.preprints.org) | NOT PEER-REVIEWED | Posted: 6 March 2020 doi:10.20944/preprints202003.0098.v1
Peer-reviewed version available at Diversity 2020, 12, 132; doi:10.3390/d12040132

11
each locality were summarized in Figure 7 (see also Tables S3-5).
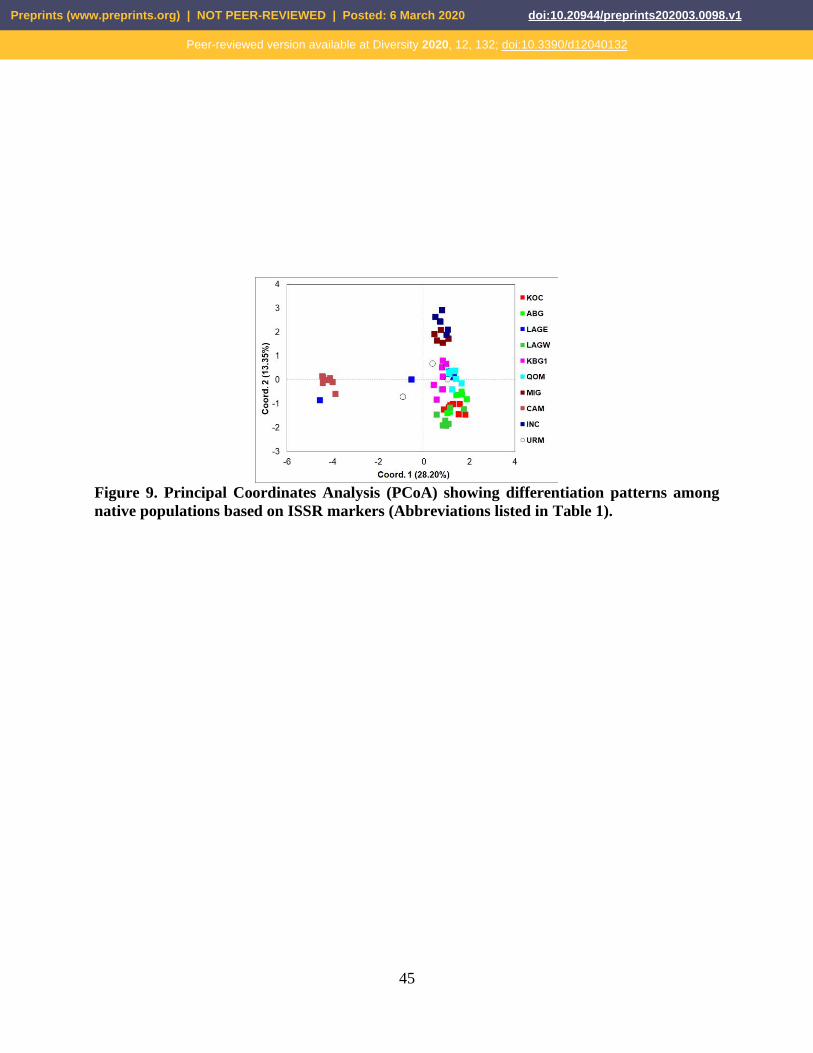
The first and second PCoA coordinates consisted of 64.66 % and 7.00 % of the
variance, respectively (overall 71.66 % of total variation). The results showed all
populations clustered into three groups, where invasive A. franciscana has been
significantly separated from the native populations based on the first coordinate. Ten
native populations (including A. urmiana and parthenogenetics) were divided in two
distinct groups, G2 and G3. G2 included all CAM population and single individual of
Eastern lagoon around Urmia Lake (LAGE). Bisexual A. urmiana and other
parthenogenetics were placed in G3 (Figure 8). The results of the separate analyses of
PCoA for native and invasive populations are shown in Figures 9 and 10, which include
overall 42.55 % and 41.55 % of total variation, respectively. Although native populations
produced almost the same result with the "whole populations" analysis (Figure 9), the
separated analyses of PCoA for invasive A. franciscana could separate all four
populations in isolated groups (Figure 10).
4. Discussion
The present study was performed to compare the population structure and genetic
differentiation of native and invasive Artemia populations. Mitochondrial COI gene has
been established as a useful molecular marker to determine the intra- and inter-specific
evolutionary associations [2,3,15,16]. Asem et al. [2] have documented that di- and
triploid parthenogenetic brine shrimps are maternally related to A. urmiana, while tetra-
and pentaploid lineages shared a common maternal ancestor with A. sinica. Based on the
mitochondrial COI dataset, all examined parthenogenetic individuals have grouped in a
Preprints (www.preprints.org) | NOT PEER-REVIEWED | Posted: 6 March 2020 doi:10.20944/preprints202003.0098.v1
Peer-reviewed version available at Diversity 2020, 12, 132; doi:10.3390/d12040132

12
close evolutionary relationship with A. urmiana (Fig. 2). Our results have demonstrated
that they should include di- and/or triploids, which these have been also confirmed by
phylogenetic tree. Although individuals of eight Artemia populations have been exactly
located in sub-clades of di- and/or triploid, eight out of nine specimens of CAM from
Turkey have been placed in a particular clade (P2), in a close connection with A. urmiana
(Figure 2). This finding has also been confirmed by haplotype distribution (Figure 3).
Previously, Sayg [37] has confirmed that triploid and pentaploid parthenogenetic
populations coexisted in Camalti Lake (CAM). Our observation has confirmed that
Camalti Lake (CAM) populations had a parthenogenetic reproductive mode and those
examined specimens should be considered as a diploid and/or triploid population [see 3].
Despite, A. urmiana shared a common ancestor with di- and triploids, A. urmiana has
represented an unexpectedly high level of haplotype diversity of COI marker. These
results have also documented by Eimanifar and Wink [25]. The high level of haplotype
variation might be attributed to the evolutionary life history of A. urmiana [27] and/or its
large population size [25]. Urmia Lake has undergone considerable changes in
environmental conditions such as salinity and temperature [38,39], which could have
influenced genetic variation and population size during evolution.
Although COI sequences should reveal a phylogeographic structure in the closely
related species [40], our results could not determine a level of geographical
differentiation among native as well among invasive populations. Contrary to the results
of mitochondrial marker, genomic fingerprinting ISSR could not reveal a significant high
level of genetic variation in A. urmiana. This result might be due to differences in the rate
of variation of mitochondrial and nuclear genes and potential hybridization events in the
Preprints (www.preprints.org) | NOT PEER-REVIEWED | Posted: 6 March 2020 doi:10.20944/preprints202003.0098.v1
Peer-reviewed version available at Diversity 2020, 12, 132; doi:10.3390/d12040132
13
past.
Similar to the phylogeny based on COI sequences, clustering analysis of ISSR
sequences by STRUCTURE has revealed a distinguished structure for non-indigenous A.
franciscana populations. In this analysis all native populations (bisexual A. urmiana and
parthenogenetic ones) have displayed almost similar patterns, but a separated analysis for
native populations has revealed a non-identical structure for CAM population.
Additionally, an inconsistent pattern of Eastern lagoon around Urmia Lake (LAGE) was
also observed. A separated analysis for invasive populations could not reveal different
patterns among examined populations by STRUCTURE (Figure 6a-c). On the other hand,
PCoA has divided A. franciscana from native populations. Although PCoAs could not
branch off natives by localities, the separated PCoA has divided invasive populations
based on localities in the four groups. Contrary to COI haplotype distribution, ISSR
marker was unable to reveal a private pattern for bisexual A. urmiana, in comparison to
native parthenogenetic populations.
In general, it was reported that the invasive populations have lower genetic
variation in the new environments as compared with their origin populations [41]. The
colonized population of A. franciscana in Vietnam has a lower genetic diversity than its
native source population from San Francisco Bay (SFB) [19]. In contrast, Eimanifar et al.
[2] have documented that Asian invasive A. franciscana populations had higher genetic
variation than American Great Salt Lake (GSL) population and native Asian species.
Similar results have been reported for some invasive populations from Mediterranean
regions [20,21]. A recent study assumed that invasive populations of A. franciscana show
a wide degree of genetic differentiation in Australia [15].
Preprints (www.preprints.org) | NOT PEER-REVIEWED | Posted: 6 March 2020 doi:10.20944/preprints202003.0098.v1
Peer-reviewed version available at Diversity 2020, 12, 132; doi:10.3390/d12040132

14
The ISSR method had been utilized to study of ten diploid parthenogenetic Artemia
populations from China by Hou et al. [24]. Their genetic variation was significantly
higher than our parthenogenetic populations. For example, percentage of polymorphic
loci ranged from 54.12 %-87.06 % vs 8.21 %-39.55 %. Western Asia is the origin of di-
and triploid parthenogenetic populations [3], so high genetic diversity of Chinese
populations could be the result of their adaptation during colonization through
biologically dispersal to the new environments in East Asia under historical evolutionary
progress.
Overall, our ISSR results have documented that invasive A. franciscana populations
had distinctly higher genetic variation than Western Asian native parthenogenetic
populations. On the other hand, native A. franciscana from Grate Salt Lake (GSL) have
represented higher variation than examined invasive populations in this study, as
percentage of polymorphic loci differed from 67 %-81 % vs. 30.95 %-46.83 % [see 26].
Additionally, all four invasive A. franciscana populations clearly revealed different
genetic structure. Observation of low genetic diversity in native populations might be
attributed to the effect of asexual reproduction in parthenogenetic populations and/or
critical climatic conditions in West Asia, especially Urmia Lake in the last two decades
[see 3,27] We believe that interactions between different ecological conditions in the new
environments and high potential of physiological plasticity and genetic adaptation of A.
franciscana could exert different evolutionary pathways during introduction of exotic
populations, which had ultimately caused intra-specific variations and genetic divergence
in the examined invasive populations.
In conclusion, it is expected that the non-indigenous species should have a lower
Preprints (www.preprints.org) | NOT PEER-REVIEWED | Posted: 6 March 2020 doi:10.20944/preprints202003.0098.v1
Peer-reviewed version available at Diversity 2020, 12, 132; doi:10.3390/d12040132

15
genetic variation than their source populations [22,41,42]. However, non-indigenous A.
franciscana populations gave opposite results in comparison with native populations
from GSL and SFB. Since there is neither a taxonomical identification key nor
morphological identifications to distinguish bisexual species and parthenogenetic
populations [10,43], it would not be possible to identify the exotic population at the
earliest time of invasion. Therefore, there is a lack of information to regularly determine
the colonization progress and evolutionary development of A. franciscana in the new
habitats. We assume that differences in the genetic variation of non-indigenous
populations could be due to the study on different invasion periods consisting of i)
introduced, ii) establishing/colonizing, iii) established/colonized populations.
Author Contributions: Designed the research, Material preparation, data collection were
performed by AA. Data analysis carried out by AA. The first draft of the manuscript was
written by AA and AE. P-Zh.W., W.L. and M.W. reviewed draft. All authors read and
approved the final manuscript.
Funding: This study was carried out at IPMB, Department of Biology, University
Heidelberg and A/10/97179. Amin Eimanifar was supported by a Ph.D. fellowship from
the Deutscher Akademischer Austauschdienst (DAAD, German Academic Exchange
Service).
Conflicts of Interest: The authors declare no conflict of interest. M.W. is Editor-in-Chief
of Diversity.
Preprints (www.preprints.org) | NOT PEER-REVIEWED | Posted: 6 March 2020 doi:10.20944/preprints202003.0098.v1
Peer-reviewed version available at Diversity 2020, 12, 132; doi:10.3390/d12040132

16
References
1) Van Stappen, G. Zoogeography. In Artemia: Basic and Applied Biology,
Abatzopoulos, T.J., Beardmore, J.A., Clegg, J.S., Sorgeloos. P., Eds.; Kluwer Academic
Publishers, Dordrecht, the Netherlands, 2002, pp. 171–224.
2) Eimanifar, A.; Van Stappen, G.; Marden, B.; Wink, M. Artemia biodiversity in Asia
with the focus on the phylogeography of the introduced American species Artemia
franciscana Kellogg, 1906. Molecular Phylogenetics and Evolution 2014, 79, 392–403.
3) Asem, A.; Eimanifar, A.; Sun, S.C. Genetic variation and evolutionary origins of
parthenogenetic Artemia (Crustacea: Anostraca) with different ploidies. Zoologica
Scripta 2016, 45, 421–436.
4) Jones, A.G.; Ewing, C.M.; Melvin, M.V. Biotechnology of solar saltfields.
Hydrobiologia 1981, 81–82, 391–406.
5) Ruebhart, D.R.; Cock, I.E.; Shaw, G.R. Invasive character of the brine shrimp Artemia
franciscana Kellogg 1906 (Branchiopoda: Anostraca) and its potential impact on
Australian inland hypersalinewaters. Marine and Freshwater Research 2008, 59, 587–
595.
6) Li, D.R.; Ye, H.L.; Yang, J.S.; Yang, F.; Wang, M.R.; De Vos, S.; Vuylsteke, M.;
Sorgeloos, P.; Van Stappen, G.; Bossier, P.; Yang, W.J. Identification and
characterization of a Masculinizer (Masc) gene involved in sex differentiation in Artemia.
Gene 2017, 614, 56–64.
7) Kappas, I.; Baxevanis, D.; Abatzopoulos, T.J. Phylogeographic patterns in Artemia: a
model organism for hypersaline crustaceans. In phylogeography and population genetics
in Crustacea. Koenemann, S., Schubart, C., Held, C. Eds.; CRC Press, Boca Raton, USA,
Preprints (www.preprints.org) | NOT PEER-REVIEWED | Posted: 6 March 2020 doi:10.20944/preprints202003.0098.v1
Peer-reviewed version available at Diversity 2020, 12, 132; doi:10.3390/d12040132
17
2011, pp. 233–55.
8) Vazquez-Silva, G.; Aguirre-Garrido, J.F.; Ramirez-Saad, H.C.; Mayorga-Reyes, L.;
Azaola-Espinosa, A.; Morales-Jiménez, J. Effect of bacterial probiotics bioencapsulated
in Artemia franciscana on weight and length of the short fin silverside (Chirostoma
humboldtianum) and the characterization of its intestinal bacterial community by DGGE.
Latin American Journal of Aquatic Research 2018, 45, 1031–1043.
9) Rajabi, S., Ramazani, A., Hamidi, M., and Naji, T. Artemia salina as a model
organism in toxicity assessment of nanoparticles. Journal of Pharmaceutical Sciences
2015, 23, 1-20.
10) Asem, A.; Rastegar-Pouyani, N.; De los Rios, P. The genus Artemia Leach, 1819
(Crustacea: Branchiopoda): true and false taxonomical descriptions, Latin American
Journal of Aquatic Research 2010, 38, 501–506.
11) Asem, A.; Eimanifar, A.; Rastegar-Pouyani, N.; Hontoria, F.; De Vos, S.; Van
Stappen; G. Sun, S.C. An overview on the nomenclatural and phylogenetic problems of
native Asian brine shrimps of the genus Artemia Leach, 1819 (Crustacea: Anostraca).
Zookeys 2020, 902, 1–15. DOI 10.3897/zookeys.902.34593
12) Naganawa, H.; Mura, G. Two new cryptic species of Artemia (Branchiopoda,
Anostraca) from Mongolia and the possibility of invasion and disturbance by the
aquaculture industry in East Asia. Crustaceana 2017, 90, 1679–1698.
13) Sanchez, M.I.; Paredes, I.; Lebouvier, M.; Green, A.J. Functional role of native and
invasive filter-feeders, and the effect of parasites: learning from hypersaline ecosystems.
PLoS ONE 2016, 11, e0161478. doi:10.1371/journal.pone.0161478
14) Horvath, Z.; Lejeusne, C.; Amat, F.; Sanchez-Fontenla, J.; Vad, C.F.; Green, A J.
Preprints (www.preprints.org) | NOT PEER-REVIEWED | Posted: 6 March 2020 doi:10.20944/preprints202003.0098.v1
Peer-reviewed version available at Diversity 2020, 12, 132; doi:10.3390/d12040132

18
Eastern spread of the invasive Artemia franciscana in the Mediterranean Basin, with the
first record from the Balkan Peninsula. Hydrobiologia 2018, 822, 229–235.
15) Asem, A.; Eimanifar, A.; Li W.; Wang, P.; Brooks, S.A.; Wink, M. Phylogeography
and population genetic structure of an exotic invasive brine shrimp Artemia Leach, 1819
(Crustacea: Anostraca) in Australia. Australian Journal of Zoology 2018, 66, 307–316.
16) Saji, A.; Eimanifar, A.; Soorae, P. S.; Al Dhaheri, Sh.; Asem, A. Phylogenetic
Analysis of exotic invasive species of Brine Shrimp Artemia Leach, 1819 (Branchiopoda,
Anostraca) in Al Wathba Wetland Reserve (UAE; Abu Dhabi). Crustacean 2019, 92,
495-503.
17) Lee, C.E. Evolutionary genetics of invasive species. Trends Ecol. Evol. 2002, 17,
386–391.
18) Lavergne, S.; Molofsky, J. Increased genetic variation and evolutionary potential
drive the success of an invasive grass. PNAS 2007, 104, 3883–3888.
19) Kappas, I.; Abatzopoulos, T.J.; Van Hoa, N.; Sorgeloos, P.; Beardmore, J.A. Genetic
and reproductive differentiation of Artemia franciscana in a new environment. Mar. Biol.
2004, 146, 103–117.
20) Hontoria, F.; Redón, S.; Maccari, M.; Varó, I.; Vavarro, C.J.; Ballell, L.; Amat, F. A
revision of Artemia biodiversity in Macaronesia. Aquat Biosystems 2012, 8, 25. DOI
10.1186/2046-9063-8-25
21) Muñoz, J.; Gómez, A.; Figuerola, J.; Amat, F.; Rico, C.; Green, A.J. Colonization and
dispersal patterns of the invasive American brine shrimp Artemia franciscana
(Branchiopoda: Anostraca) in the Mediterranean region. Hydrobiologia 2014, 726, 25–41.
22) Dlugosch, M.K.; Parker, M.I. Founding events in species invasions: genetic variation,
Preprints (www.preprints.org) | NOT PEER-REVIEWED | Posted: 6 March 2020 doi:10.20944/preprints202003.0098.v1
Peer-reviewed version available at Diversity 2020, 12, 132; doi:10.3390/d12040132
19
adaptive evolution, and the role of multiple introductions. Mol Ecol 2008, 17, 431–449.
23) Vikas, P.A.; Sajeshkumar N.K.; Thomas P.C.; Chakraborty K.; Vijayan K.K.
Aquaculture related invasion of the exotic Artemia franciscana and displacement of the
autochthonous Artemia populations from the hypersaline habitats of India. Hydrobiologia
2012, 684:129–142.
24) Hou, L.; Li, H.; Zou, X.; Yao, F.; Bi, X.; He, C. Population genetic structure and
genetic differentiation of Artemia parthenogenetica in China. Journal of Shellfish
Research 2006, 25, 999–1005.
25) Eimanifar, A.; Wink. M. Fine-scale population genetic structure in Artemia urmiana
(Günther, 1890) based on mtDNA sequences and ISSR genomic fingerprinting. Org
Divers Evol 2013, 13, 531–543.
26) Eimanifar, A.; Marden, B.; Braun, M.S.; Wink, M. Analysis of the genetic variability
of Artemia franciscana Kellogg, 1906 from the Great Salt Lake (USA) based on mtDNA
sequences, ISSR genomic fingerprinting and biometry. Marine Biodiversity 2015, 45:
311–319.
27) Asem, A.; Eimanifar, A.; Van Stappen, G.; Sun S.C. The impact of one-decade
ecological disturbance on genetic changes: a study on the brine shrimp Artemia
urmiana from Urmia Lake, Iran. PeerJ 2019, 7:e7190 DOI 10.7717/peerj.7190
28) Kumar, S.; Stecher, G.; Li M.; Knyaz, C.; Tamura, K. MEGA X: Molecular
evolutionary genetics analysis across computing platforms. Mol. Biol. Evol. 2018, 35,
1547–1549.
29) Bandelt, H.J.; Forster, P.; Rohl, A. Median-joining networks for inferring
intraspecific phylogenies. Mol Biol Evol 1999, 16, 37–48. DOI
Preprints (www.preprints.org) | NOT PEER-REVIEWED | Posted: 6 March 2020 doi:10.20944/preprints202003.0098.v1
Peer-reviewed version available at Diversity 2020, 12, 132; doi:10.3390/d12040132

20
10.1093/oxfordjournals.molbev.a026036
30) Pritchard, J.K.; Stephens, M.; Donnelly, P. Inference of population structure using
multilocus genotype data. Genetics, 2000, 155, 945–959.
31) Falush, D.; Stephens, M.; Pritchard, J.K. Inference of population structure using
multilocus genotype data: dominant markers and null alleles. Molecular Ecology Notes,
2007, 7: 574–578.
32) Jonathan, K.P.; Matthew, S.; Peter, D. Inference of population structure using
multilocus genotype data. Genetics, 2000, 155, 945–959.
33) Kopelman, N.M.; Mayzel, J.; Jakobsson, M.; Rosenberg, N.A.; Mayrose, I.
CLUMPAK: a program for identifying clustering modes and packaging population
structure inferences across K. Molecular Ecology Resources 2015, 15, 1179–1191.
34) Earl, D.A.; vonHoldt B.M. STRUCTURE HARVESTER: a website and program for
visualizing STRUCTURE output and implementing the Evanno method. Conservation
Genet. Resour. 2012, 4, 359–361.
35) Evanno, G.; Regnaut, S.; Goudet, J. Detecting the number of clusters of individuals
using the software STRUCTURE: a simulation study. Mol Ecol 2005, 14, 2611–2620.
36) Peakall, R.; Smouse, P.E. GenAlEx 6.5: genetic analysis in Excel. Population genetic
software for teaching and research – an update. Bioinformatics, 2012, 28, 2537-2539.
37) Sayg, Y. Characterization of parthenogenetic Artemia populations from Camalti
(Izmir, Turkey) and Kalloni (Lesbos, Greece): survival, growth, maturation, biometrics,
fatty acid profiles and hatching characteristics. Hydrobiologia 2004, 527, 227–239,
38) Kelts, K.; Shahrabi, M. Holocene sedimentalogy of hypersaline Lake Urmia,
northwestern Iran. Paleogeography, Paleoclimatology and Paleoecology, 1986, 54, 105–
Preprints (www.preprints.org) | NOT PEER-REVIEWED | Posted: 6 March 2020 doi:10.20944/preprints202003.0098.v1
Peer-reviewed version available at Diversity 2020, 12, 132; doi:10.3390/d12040132

21
130.
39) Djamali, M.; Kürschner, H.; Akhani, H.; De Beaulieu, J.L.; Amini, A.; Andrieu-Ponel,
V., Ponel, P.; Stevens, L. Palaeoecological significance of the spores of the liverwort
Riella (Riellaceae) in a late Pleistocene long pollen record from the hypersaline Lake
Urmia, NW Iran. Review of Palaeobotany and Palynology 2008, 152, 66–73.
40) Hebert, P.D.N.; Ratnasingham, S.; Waard, J. R. Barcoding animal life: cytochrome c
oxidase subunit 1 divergences among closely related species. Proceedings of the Royal
Society of London, Series B: Biological Sciences 2003, 270, 96–99.
41) Golani, D.G.; Azzurro, E.; Corsini-Foka M.; Falautana, M.; Andaloro, F.; Bernardi, G.
Genetic bottlenecks and successful biological invasions: the case of a recent Lessepsian
migrant. Biol Lett 2007, 3, 541–545.
42) Rattanawannee, A.; Duangphakdee, O.; Chanchao, C.; Teerapakpinyo, C.; Warrit, N.;
Wongsiri, S.; Oldroyd, B.P. Genetic Characterization of Exotic Commercial Honey Bee
(Hymenoptera: Apidae) Populations in Thailand Reveals High Genetic Diversity and
Low Population Substructure. Journal of Economic Entomology 2020, 113, 34–42.
43) Asem, A.; Sun, S.C. Morphological differentiation of seven
parthenogenetic Artemia (Crustacea: Branchiopoda) populations from China, with special
emphasis on ploidy degrees. Microscopy Research and Technique 2016, 79, 258–266.
44) Wang, W.; Luo, Q.; Guo, H.; Bossier, P.; Van Stappen, G.; Sorgeloos, P.; Xin, N.;
Sun, Q.; Hu, S.; Yu, J. Phylogenetic analysis of brine shrimp (Artemia) in China using
DNA barcoding. Genomics, Proteomics and Bioinformatics 2008, 6, 155–162.
45) Amat, F.; Hontoria, F.; Navarro, J.C.; Vieira, N.; Mura, G. Biodiversity loss in the
genus Artemia in the Western Mediterranean region. Limnetica 2007, 26, 387–404.
Preprints (www.preprints.org) | NOT PEER-REVIEWED | Posted: 6 March 2020 doi:10.20944/preprints202003.0098.v1
Peer-reviewed version available at Diversity 2020, 12, 132; doi:10.3390/d12040132

22
46) Van Stappen, G. Artemia biodiversity in Central and Eastern Asia. Ph.D. Thesis,
Ghent University, Belgium, 2008.
Preprints (www.preprints.org) | NOT PEER-REVIEWED | Posted: 6 March 2020 doi:10.20944/preprints202003.0098.v1
Peer-reviewed version available at Diversity 2020, 12, 132; doi:10.3390/d12040132

23
Table 1. Origin of Artemia samples from Iran and neighbor regions. (IPMB = Institute of Pharmacy and Molecular
Biotechnology, Heidelberg University, Abb. = Abbreviation)
No. Voucher Number
( IPMB) Abb. Species/population Locality Country
Geographic
Coordinates
COI
accession numbers1
1 57211 URM A. urmiana Urmia Lake Iran 37°20′ E–45°40′ N JX512748-808
2 57223 LAGW Parthenogenetic Western Lagoon around Urmia
Lake
Iran 37°15′ E–45°85′ N KF691338-342
3 57224 LAGE Parthenogenetic Eastern Lagoon around
Urmia Lake
Iran 37°50′ E–46°40′ N KF691343-345
4 57225 QOM Parthenogenetic Qom Salt Lake Iran 34°40′ E–51°80′ N KF691367-372
5 57226 MIG Parthenogenetic Mighan Salt Lake Iran 34°20′ E–49°80′ N KF691357-361
6 57230 MSH A. franciscana Mahshar port Iran 49°11′ E–30°33′ N KF691351-356
7 57228 MAHR A. franciscana Maharlu Lake Iran 29°57′ E–52°14′ N KF691347, 349-350
8 57229 NOG A. franciscana Nough Catchment Iran 30°60′ E–56°50′ N KF691362-366
9 57227 INC Parthenogenetic Incheh Lake Iran 37°24′ E–54°36′ N KF691333-337
10 57292 CAM Parthenogenetic Camalti Lake Turkey 27°08′ E–38°25′ N KF691520-525; 527-529
11 57255 ABG Parthenogenetic Abu-Ghraib Iraq 44°30′ E–33°20′ N KF691373-375
12 57256 GAA A. franciscana Garmat Ali Iraq 47°49′ E–30°30′ N KF691376-383
13 57258 KBG Parthenogenetic Kara Bogaz Gol Turkmenistan 53°33′ E–41°17′ N KF691530-532,534
14 57257 KOC Parthenogenetic Korangi Creek (Karachi coast) Pakistan 67°10′ E–24°48′ N KF691442-445; 447-448 1) Eimanifar and Wink (2013); Eimanifar et al (2014)
Preprints (www.preprints.org) | NOT PEER-REVIEWED | Posted: 6 March 2020 doi:10.20944/preprints202003.0098.v1
Peer-reviewed version available at Diversity 2020, 12, 132; doi:10.3390/d12040132
24
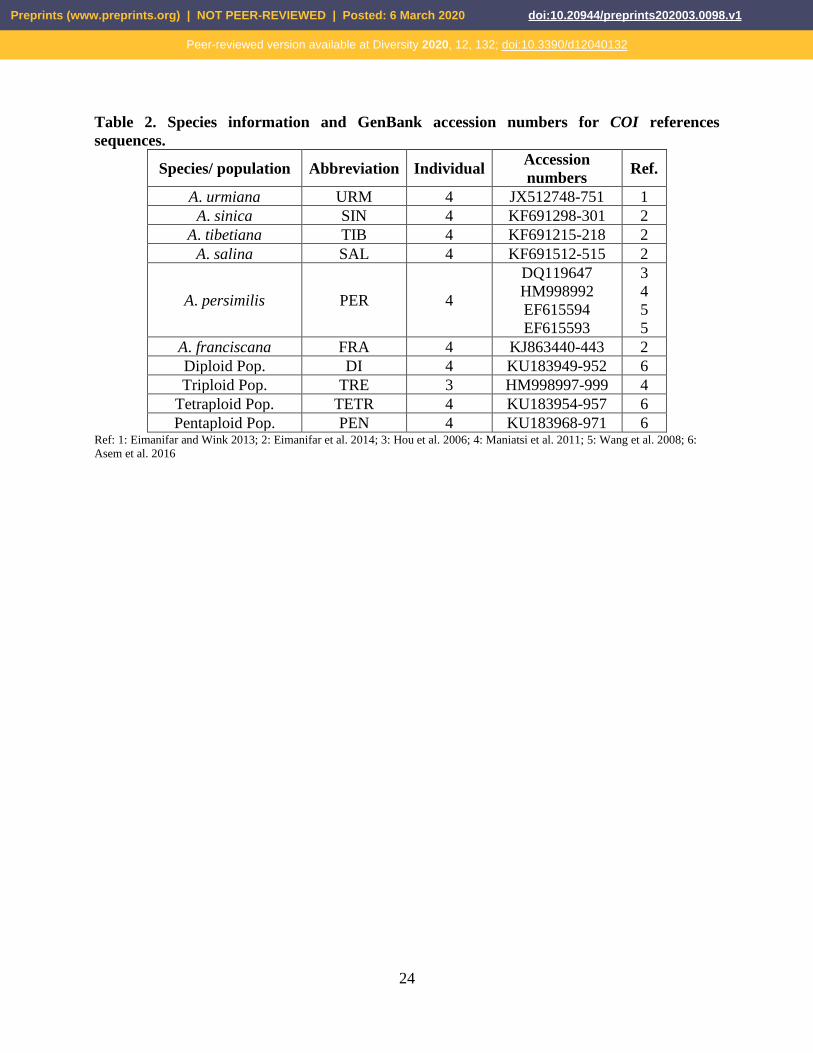
Table 2. Species information and GenBank accession numbers for COI references
sequences.
Species/ population Abbreviation Individual Accession
numbers Ref.
A. urmiana URM 4 JX512748-751 1
A. sinica SIN 4 KF691298-301 2
A. tibetiana TIB 4 KF691215-218 2
A. salina SAL 4 KF691512-515 2
A. persimilis PER 4
DQ119647
HM998992
EF615594
EF615593
3
4
5
5
A. franciscana FRA 4 KJ863440-443 2
Diploid Pop. DI 4 KU183949-952 6
Triploid Pop. TRE 3 HM998997-999 4
Tetraploid Pop. TETR 4 KU183954-957 6
Pentaploid Pop. PEN 4 KU183968-971 6 Ref: 1: Eimanifar and Wink 2013; 2: Eimanifar et al. 2014; 3: Hou et al. 2006; 4: Maniatsi et al. 2011; 5: Wang et al. 2008; 6:
Asem et al. 2016
Preprints (www.preprints.org) | NOT PEER-REVIEWED | Posted: 6 March 2020 doi:10.20944/preprints202003.0098.v1
Peer-reviewed version available at Diversity 2020, 12, 132; doi:10.3390/d12040132

25
Table 3. List of primers screened for ISSR analysis.
Primer Sequence GC (%) Annealing
temperature (°C)
Amplification
pattern
ISSR1 (AC)8T 47.1 48–54 Smear
ISSR2 (CAC)5 66.7 48–54 Smear
ISSR3 (GACA)4 50 48–54 Smear
ISSR4 (AG)12 50 48–54 Poor
ISSR5 (TC)9 50 48–54 Poor
ISSR6 (GT)10 50 48–54 Smear
ISSR7 (CA)10A 47.6 48–54 Poor
ISSR8 (GAA)5 33.3 48–54 No amplification
ISSR9 (CAG)6 66.7 48–54 No amplification
ISSR10 (GCCG)4 100 48–54 No amplification
ISSR11 (AG)8C 52.9 48 Good and sharp
ISSR12 (AG)8YTa 50 48 Good and sharp
ISSR13 (GA)9T 47.4 50 Good and sharp
ISSR14 (TG)8G 52.9 50 Good and sharp
ISSR15 (AC)8C 52.9 49 Good and sharp
Preprints (www.preprints.org) | NOT PEER-REVIEWED | Posted: 6 March 2020 doi:10.20944/preprints202003.0098.v1
Peer-reviewed version available at Diversity 2020, 12, 132; doi:10.3390/d12040132
26
Table 4. Genetic indices among examined populations according to ISSR markers.
Pop. N Na Ne I He uHe PPL NB NPB
KOC 7.000 0.645
(0.062)
1.102
(0.021)
0.090
(0.017)
0.059
(0.012)
0.064
(0.012) 17.76 71 0
ABG 7.000 0.743
(0.066)
1.149
(0.024)
0.131
(0.020)
0.088
(0.013)
0.095
(0.014) 23.68 77 0
LAGE 3.000 0.914
(0.072)
1.256
(0.031)
0.208
(0.024)
0.143
(0.017)
0.171
(0.020) 34.87 86 0
LAGW 7.000 0.829
(0.066)
1.157
(0.024)
0.140
(0.020)
0.093
(0.014)
0.100
(0.015) 25.66 87 0
KBG 7.000 0.743
(0.068)
1.161
(0.025)
0.139
(0.020)
0.094
(0.014)
0.101
(0.015) 25.00 75 0
QOM 7.000 0.638
(0.062)
1.097
(0.020)
0.087
(0.016)
0.058
(0.011)
0.062
(0.012) 17.11 71 0
MIG 5.000 0.678
(0.067)
1.150
(0.025)
0.128
(0.020)
0.087
(0.014)
0.096
(0.015) 23.03 68 0
CAM 7.000 0.559
(0.051)
1.041
(0.014)
0.036
(0.011)
0.024
(0.008)
0.026
(0.008) 7.24 74 0
INC 7.000 0.658
(0.064)
1.125
(0.022)
0.110
(0.018)
0.074
(0.013)
0.080
(0.014) 19.74 70 0
URM 5.000 0.783
(0.072)
1.200
(0.027)
0.173
(0.022)
0.117
(0.015)
0.130
(0.017) 30.26 73 0
MAH 2.000 0.822
(0.066)
1.181
(0.025)
0.155
(0.021)
0.106
(0.015)
0.142
(0.020) 25.66 86 1
NOG 7.000 1.013
(0.071)
1.244
(0.030)
0.208
(0.023)
0.140
(0.016)
0.151
(0.017) 38.82 95 0
MSH 7.000 1.066
(0.066)
1.223
(0.028)
0.193
(0.022)
0.129
(0.015)
0.139
(0.016) 36.84 106 0
GAA 5.000 0.921
(0.067)
1.206
(0.028)
0.172
(0.022)
0.117
(0.015)
0.130
(0.017) 30.26 94 0
Mean 5.929
)0.035(
0.787
)0.018(
1.164
)0.007(
0.141
)0.005(
0.095
)0.004(
0.106
)0.004(
25.42
(2.28%) - -
Pop. = Population, N = number of individuals, Na = number of Different Alleles, Ne = number of Effective Alleles, I
= Shannon's Information Index, He = Expected Heterozygosity, uHe = Unbiased Expected Heterozygosity, PPL =
Percentage of Polymorphic Loci, NB = number of bands, NPB = number of private bands
Preprints (www.preprints.org) | NOT PEER-REVIEWED | Posted: 6 March 2020 doi:10.20944/preprints202003.0098.v1
Peer-reviewed version available at Diversity 2020, 12, 132; doi:10.3390/d12040132

27
Table 5. Genetic indices among native populations according to ISSR markers.
Population N Na Ne I He uHe PPL NB NPB
KOC 7.000 0.731
(0.067)
1.115
(0.023)
0.102
(0.019
0.067
(0.013)
0.073
(0.014) 20.15 71 2
ABG 7.000 0.843
(0.071)
1.169
(0.027)
0.148
(0.022
0.100
(0.015)
0.107
(0.016) 26.87 77 4
LAGE 3.000 1.037
(0.075)
1.291
(0.034)
0.236
(0.026
0.162
(0.018)
0.195
(0.022) 39.55 86 1
LAGW 7.000 0.940
(0.069)
1.178
(0.027)
0.158
(0.022
0.106
(0.015)
0.114
(0.016) 29.10 87 4
KBG 7.000 0.843
(0.073)
1.183
(0.028)
0.158
(0.023
0.107
(0.015)
0.115
(0.017) 28.36 75 0
QOM 7.000 0.724
(0.066)
1.110
(0.023)
0.099
(0.018
0.065
(0.013)
0.070
(0.014) 19.40 71 0
MIG 5.000 0.769
(0.073)
1.170
(0.027)
0.145
(0.022
0.098
(0.015)
0.109
(0.017) 26.12 68 3
CAM 7.000 0.634
(0.055)
1.046
(0.016)
0.041
(0.013
0.027
(0.009)
0.029
(0.009) 8.21 74 0
INC 7.000 0.746
(0.069)
1.142
(0.025)
0.125
(0.021
0.084
(0.014)
0.091
(0.015) 22.39 70 1
URM 5.000 0.888
(0.077)
1.227
(0.029)
0.196
(0.024
0.133
(0.017)
0.148
(0.018) 34.33 73 3
Mean 6.200
(0.036)
0.816
(0.022)
1.163
(0.008)
0.141
(0.007)
0.095
(0.005)
0.105
(0.005)
25.45
(2.74) - -
Pop. = Population, N = number of individuals, Na = number of Different Alleles, Ne = number of Effective Alleles, I
= Shannon's Information Index, He = Expected Heterozygosity, uHe = Unbiased Expected Heterozygosity, PPL =
Percentage of Polymorphic Loci, NB = number of bands, NPB = number of private bands
Preprints (www.preprints.org) | NOT PEER-REVIEWED | Posted: 6 March 2020 doi:10.20944/preprints202003.0098.v1
Peer-reviewed version available at Diversity 2020, 12, 132; doi:10.3390/d12040132

28
Table 6. Genetic indices among invasive A. franciscana populations according to ISSR
markers.
Population N Na Ne I He uHe PPL NB NPB
MAH 2.000 0.992
(0.071)
1.219
(0.029)
0.187
(0.025)
0.128
(0.017)
0.171
(0.023) 30.95 86 3
NOG 7.000 1.222
(0.073)
1.295
(0.034)
0.251
(0.026)
0.169
(0.018)
0.182
(0.019) 46.83 95 6
MSH 7.000 1.286
(0.065)
1.269
(0.033)
0.233
(0.025)
0.156
(0.018)
0.168
(0.019) 44.44 106 8
GAA 5.000 1.111
(0.070)
1.249
(0.033)
0.207
(0.025)
0.141
(0.018)
0.157
(0.020) 36.51 94 5
Mean 5.250
(0.091)
1.153
(0.035)
1.258
(0.016)
0.220
(0.013)
0.149
(0.009)
0.169
(0.010)
39.68
(3.65) - -
Pop. = Population, N = number of individuals, Na = number of Different Alleles, Ne = number of Effective Alleles, I
= Shannon's Information Index, He = Expected Heterozygosity, uHe = Unbiased Expected Heterozygosity, PPL =
Percentage of Polymorphic Loci, NB = number of bands, NPB = number of private bands
Preprints (www.preprints.org) | NOT PEER-REVIEWED | Posted: 6 March 2020 doi:10.20944/preprints202003.0098.v1
Peer-reviewed version available at Diversity 2020, 12, 132; doi:10.3390/d12040132

29
Table 7. Pairwise Population Matrix of Nei Genetic Distance among invasive A. franciscana
populations.
Population KOC ABG LAGE LAGW KBG QOM MIG CAM INC
ABG 0.162
LAGE 0.167 0.175
LAGW 0.193 0.127 0.190
KBG1 0.156 0.117 0.142 0.111
QOM 0.182 0.131 0.171 0.135 0.099
MIG 0.217 0.185 0.171 0.212 0.124 0.148
CAM 0.362 0.346 0.249 0.358 0.279 0.354 0.331
INC 0.233 0.165 0.184 0.223 0.149 0.176 0.091 0.351
URM 0.219 0.194 0.165 0.190 0.141 0.174 0.194 0.351 0.211
Preprints (www.preprints.org) | NOT PEER-REVIEWED | Posted: 6 March 2020 doi:10.20944/preprints202003.0098.v1
Peer-reviewed version available at Diversity 2020, 12, 132; doi:10.3390/d12040132

30
Table 8. Pairwise Population Matrix of Nei Genetic Distance among native populations.
Population MAH NOG MAH
NOG 0.143
MSH 0.145 0.144
GAA 0.198 0.170 0.152
Preprints (www.preprints.org) | NOT PEER-REVIEWED | Posted: 6 March 2020 doi:10.20944/preprints202003.0098.v1
Peer-reviewed version available at Diversity 2020, 12, 132; doi:10.3390/d12040132

31
Table 9. Molecular variation (within and among populations) for examined populations by
AMOVA based on ISSR markers.
Whole populations
Source df SS MS Est. Var. %
Among Pops 13 1673.318 128.717 20.265 69%
Within Pops 69 639.405 9.267 9.267 31%
Total 82 2312.723 - 29.532 100%
Source df SS MS Est. Var. %
Native populations
Among Pops 9 627.912 69.768 10.006 55%
Within Pops 52 418.362 8.045 8.045 45%
Total 61 1046.274 - 18.052 100%
A. franciscana
Source df SS MS Est. Var. %
Among Pops 3 117.338 39.113 5.239 29%
Within Pops 17 221.043 13.003 13.003 71%
Total 20 338.381 - 18.241 100%
Preprints (www.preprints.org) | NOT PEER-REVIEWED | Posted: 6 March 2020 doi:10.20944/preprints202003.0098.v1
Peer-reviewed version available at Diversity 2020, 12, 132; doi:10.3390/d12040132

32
Table S1. Information of network haplotype composition of native populations.
Haplotype Ind. Pop. (Ind.) Haplotype Ind. Pop. (Ind.)
H1 18 URM (18) H24 1 URM (1)
H2 7 CAM (7) H25 1 URM (1)
H3 16 KOC (6), LAGW (5)ABG (3), LAGE (1), KBG (1) H26 1 URM (1)
H4 15 ING (5), MIG (4), KBG (3), LAGE (2) H27 1 URM (1)
H5 7 QOM (6), MIG (1) H28 1 URM (1)
H6 1 CAM (1) H29 1 URM (1)
H7 1 URM (1) H30 1 URM (1)
H8 1 URM (1) H31 2 URM (2)
H9 2 URM (2) H32 1 URM (1)
H10 1 URM (1) H33 1 URM (1)
H11 1 URM (1) H34 1 URM (1)
H12 3 URM (3) H35 1 URM (1)
H13 1 URM (1) H36 1 URM (1)
H14 1 URM (1) H37 1 URM (1)
H15 1 URM (1) H38 1 URM (1)
H16 1 URM (1) H39 1 URM (1)
H17 1 URM (1) H40 1 URM (1)
H18 1 URM (1) H41 1 URM (1)
H19 1 URM (1) H42 1 URM (1)
H20 1 URM (1) H43 1 URM (1)
H21 1 URM (1) H44 1 URM (1)
H22 1 URM (1) H45 1 URM (1)
H23 1 URM (1)
Ind. = individual, Pop. = Population
Preprints (www.preprints.org) | NOT PEER-REVIEWED | Posted: 6 March 2020 doi:10.20944/preprints202003.0098.v1
Peer-reviewed version available at Diversity 2020, 12, 132; doi:10.3390/d12040132

33
Table S2. Information of network haplotype composition of invasive A. franciscana
populations.
Haplotype Ind. Pop. (Ind.)
H1 8 GAA (4), MAH (2), MSH (2)
H2 7 NOG (4), MSH (3)
H3 4 GAA (4)
H4 1 NOG (1)
H5 1 MAH (1)
H6 1 MSH (1) Ind. = individual, Pop. = Population
Preprints (www.preprints.org) | NOT PEER-REVIEWED | Posted: 6 March 2020 doi:10.20944/preprints202003.0098.v1
Peer-reviewed version available at Diversity 2020, 12, 132; doi:10.3390/d12040132
34
Table S3. Proportion of genetic clusters for each locality in STRUCTURE analysis among
whole examined populations.
Population K1 (%) K2 (%)
KOC 0.1 99.9
ABG 0.2 99.8
LAGE 0.7 99.3
LAGW 0.3 99.7
KBG 0.1 99.9
QOM 0.1 99.9
MIG 1.9 98.1
CAM 0.1 99.9
INC 0.2 99.8
URM 3.6 96.4
MAH 98.7 1.3
NOG 99.9 0.1
MSH 99.9 0.1
GAA 99.9 0.1
Preprints (www.preprints.org) | NOT PEER-REVIEWED | Posted: 6 March 2020 doi:10.20944/preprints202003.0098.v1
Peer-reviewed version available at Diversity 2020, 12, 132; doi:10.3390/d12040132
35
Table S4. Proportion of genetic clusters for each locality in STRUCTURE analysis among
native populations.
Population K1 (%) K2 (%)
KOC 99.7 0.3
ABG 99.8 0.2
LAGE 72.1 27.9
LAGW 99.6 0.4
KBG 99.5 0.5
QOM 99.8 0.2
MIG 99.6 0.4
CAM 0.2 99.8
INC 99.7 0.3
URM 93.1 6.9
Preprints (www.preprints.org) | NOT PEER-REVIEWED | Posted: 6 March 2020 doi:10.20944/preprints202003.0098.v1
Peer-reviewed version available at Diversity 2020, 12, 132; doi:10.3390/d12040132
36
Table S5. Proportion of genetic clusters for each locality in STRUCTURE analysis among
invasive A. franciscana populations.
Population K1 (%) K2 (%) K3 (%) K4 (%) K5 (%) K6 (%) K7 (%) K8 (%) K9 (%)
MAH 1.1 0.4 0.3 1.7 0.4 1.1 46 1.8 47.1
NOG 0.6 0.5 0.4 57 0.6 33.6 3.6 0.3 3.4
MSH 0.5 28.6 0.3 0.4 27.9 0.4 3.4 33.9 4.6
GAA 38.8 0.2 42.3 0.3 0.4 0.2 7 1.1 9.7
Preprints (www.preprints.org) | NOT PEER-REVIEWED | Posted: 6 March 2020 doi:10.20944/preprints202003.0098.v1
Peer-reviewed version available at Diversity 2020, 12, 132; doi:10.3390/d12040132

37
Figure 1. Map of Artemia sampling sites (1 = URM, 2 = LAGW, 3 = LAGE, 4 = QOM, 5 =
MIG, 6 = MSH, 7 = MAH, 8 = NOG, 9 = INC, 10 = CAM, 11 = ABG, 12 = GAA, 13 = KBG,
14 = KOC; Abbreviations are list in Table 1).
Preprints (www.preprints.org) | NOT PEER-REVIEWED | Posted: 6 March 2020 doi:10.20944/preprints202003.0098.v1
Peer-reviewed version available at Diversity 2020, 12, 132; doi:10.3390/d12040132
38
Figure 2. Phylogenetic tree of Artemia using COI sequences based on ML approach. The
number behind major nodes denotes bootstrap confidential values. Daphnia tenebrosa
(HQ972028) was used as an outgroup. (URM: Artemia urmiana, TIB: Artemia tibetiana, SIN:
Artemia sinica, FRA: Artemia franciscana, PER: Artemia prersimilis, SAL: Artemia salina,
DI: Diploid parthenogenetic population, TRI: Triploid parthenogenetic population,
TETRA: Tetraploid parthenogenetic population, PENTA: Pentaploid parthenogenetic
population; Abbreviations listed in Table 1).
Preprints (www.preprints.org) | NOT PEER-REVIEWED | Posted: 6 March 2020 doi:10.20944/preprints202003.0098.v1
Peer-reviewed version available at Diversity 2020, 12, 132; doi:10.3390/d12040132

39
Figure 3. The relationship of COI haplotypes distribution among native populations
(Abbreviations listed in Table 1).
Preprints (www.preprints.org) | NOT PEER-REVIEWED | Posted: 6 March 2020 doi:10.20944/preprints202003.0098.v1
Peer-reviewed version available at Diversity 2020, 12, 132; doi:10.3390/d12040132

40
Figure 4. The relationship of COI haplotypes distribution among invasive A. franciscana
populations (Abbreviations listed in Table 1).
Preprints (www.preprints.org) | NOT PEER-REVIEWED | Posted: 6 March 2020 doi:10.20944/preprints202003.0098.v1
Peer-reviewed version available at Diversity 2020, 12, 132; doi:10.3390/d12040132

41
Figure 5. Contribution of genetic variation within and among populations for the examined
populations by AMOVA, based on ISSR markers (A = whole examined populations, B =
native populations, C = invasive A. franciscana).
Preprints (www.preprints.org) | NOT PEER-REVIEWED | Posted: 6 March 2020 doi:10.20944/preprints202003.0098.v1
Peer-reviewed version available at Diversity 2020, 12, 132; doi:10.3390/d12040132

42
Figure 6. Clustering of genetic structures based on ISSR markers (A = whole examined
populations, B = native populations, C = invasive A. franciscana; Abbreviations listed in
Table 1).
Preprints (www.preprints.org) | NOT PEER-REVIEWED | Posted: 6 March 2020 doi:10.20944/preprints202003.0098.v1
Peer-reviewed version available at Diversity 2020, 12, 132; doi:10.3390/d12040132

43
Figure 7. Proportion of genetic clusters for each locality in STRUCTURE analysis (A =
whole examined populations, B = native populations, C = invasive A. franciscana;
Abbreviations listed in Table 1).
Preprints (www.preprints.org) | NOT PEER-REVIEWED | Posted: 6 March 2020 doi:10.20944/preprints202003.0098.v1
Peer-reviewed version available at Diversity 2020, 12, 132; doi:10.3390/d12040132

44
Figure 8. Principal Coordinates Analysis (PCoA) showing differentiation patterns among
whole examined populations based on ISSR markers (Abbreviations listed in Table 1).
Preprints (www.preprints.org) | NOT PEER-REVIEWED | Posted: 6 March 2020 doi:10.20944/preprints202003.0098.v1
Peer-reviewed version available at Diversity 2020, 12, 132; doi:10.3390/d12040132
45
Figure 9. Principal Coordinates Analysis (PCoA) showing differentiation patterns among
native populations based on ISSR markers (Abbreviations listed in Table 1).
Preprints (www.preprints.org) | NOT PEER-REVIEWED | Posted: 6 March 2020 doi:10.20944/preprints202003.0098.v1
Peer-reviewed version available at Diversity 2020, 12, 132; doi:10.3390/d12040132

46
Figure 10. Principal Coordinates Analysis (PCoA) showing differentiation patterns among
invasive A. franciscana populations based on ISSR markers (Abbreviations listed in Table
1).
Preprints (www.preprints.org) | NOT PEER-REVIEWED | Posted: 6 March 2020 doi:10.20944/preprints202003.0098.v1
Peer-reviewed version available at Diversity 2020, 12, 132; doi:10.3390/d12040132