Embed Size (px)
Citation preview

#PharmSci360Slide 1
Using in-silico Models to Integrate in-vitroData to Support Virtual Trials for Cost
Effective Drug Development
November 5th, 2018
Viera Lukacova

#PharmSci360Slide 2
Outline
• What is PBPK model?
• Parameterizing PBPK model using in vitro data• Dissolution & Precipitation
• Passive Absorption
• Pharmacokinetics
• Virtual Trials: Applications of calibrated PBPK model
• Summary

#PharmSci360Slide 3
The Big Picture
PBPK Model
Fa%
Nonlinear kinetics (and DDI)
Formulation - Dose, dosage form, particle
size,release profile
Structure →
ADMET Pred.
In vitro
Experiments
Cp-time profile (and F% with PBPK)
API:
• logP/logD
• pKa(s)
• Solubility
• Permeability
• Fup
• B/P ratio
• CLint or Km & Vmax, renal CL
• DDI interaction constants (Ki & kinact, EC50 & Emax)
• …..
System/Physiology:
• Body height, weight, BMI
• Tissue sizes & blood flows
• Tissue compositions (water, lipid, protein, acidic phospholipids, etc.)
• Intestinal fluid volume and composition (pH, bile salts, etc.)
• Intestinal transit times
• Enzyme & transporter expression levels
• ....
PK in special populations

#PharmSci360Slide 4
Mechanistic Absorption Modeling (MAM)
Physiologically based Pharmacokinetics (PBPK)

#PharmSci360Slide 5
NH
O
OH
OCH3
CH3
CH3
Discovery Preclinical Clinical
Discovery PK
Combine in silico technologies to screen compound
libraries in animals or humans
Incorporate preclinical/in vitro data to extend FIH
simulations to full in vivo outcomes (IVIVE)
Identify toxic dose levels in preclinical species
Pharmaceutical Development
Assess various strategies during formulation development
Assist with Quality by Design (QbD) implementation
Develop mechanistic in vitro-in vivo correlations (IVIVCs)
Understand food effects
Clinical PK/Pharmacology
Simulate population behaviors (e.g.,
pediatrics, disease)
Build PBPK-PD models
Predict DDIs

#PharmSci360Slide 6
What is happening in vivo (oral administration)?
* Modified from van de Waterbeemd, H, and Gifford, E. ADMET In Silico Modelling: Towards Prediction Paradise? Nat. Rev. Drug Disc. 2003, 2:192-204
F% (not Fa%)Fa%
D PV
Metabolism Metabolism
A SCpKa
Solubility vs. pHBiorelevant solubilityPrecipitation kinetics
Transcellular permeabilityParacellular permeabilitylogD vs. pHLysosomal trappingVillus blood flowCarrier-mediated transportGut extraction
Liver metabolismHepatic uptakeBiliary secretion Plasma protein binding
Blood:plasma concentration ratioTissue distributionSystemic clearance
FDp%

#PharmSci360Slide 7
Solubility and Dissolution

#PharmSci360Slide 8
SolubilitypH and bile salt concentrations
human: rat: dog:
fasted:
fed:
Changes in ionization result in changes in solubility in different regions of the intestine
)1(
2
2
,, bile
OH
OH
pHaqpHbile CSRMWt
SolSol +=
Changes in bile salt concentrations in different regions of the intestine may result in changes in solubility (especially for more lipophilic compounds)
Mithani, Pharm Res 1996, 13:163-167
Compartment Data Compartment Data Compartment Data
Compartment Data Compartment Data Compartment Data

#PharmSci360Slide 9
Dissolution
Dissolution rate coefficient (not a constant because it changes at every time step) in intestinal
lumen compartment number i for particle size bin j:
D = diffusion coefficient
CS = solubility at local pH
C(i) = lumen concentration in compartment i
ρ = particle density (density of API crystals)
rj = spherical particle radius for particle size bin j
T = diffusion layer thickness (= particle radius up to a limit)
s = shape factor (Length/diameter*) – for spherical particles = 1
*in the original Johnson equation, s’=Length/radius and the term is
r
Cs
C(i)
T
T = r0j
( )
'
'12
s
s+
( )( ) tuls
t
wDMCC
s
s
Tr
D
dt
dM,
21−
+=

#PharmSci360Slide 10
Predicting in vivo dissolution: Particle Size
Distribution
In vivo dissolution rate and extent
is calculated from particle size
distribution for each formulation
and in vivo drug solubility (in vivo
drug solubility is changing to
account for changes in pH and
bile salt concentration as the drug
is moving through the intestine).
The model is applicable when API
properties (solubility, particle size)
drive the dissolution rate.
( )( ) tuls
t
wDMCC
s
s
Tr
D
dt
dM,
21−
+=
Lu, Pharm Res 1993, 10:1308-1314
Simulation results from GastroPlus v9.0
Prediction of in vivo performance for 3 cilostazol formulations with different
API particle size distributions administered in dog
Observed data from Jinno, J Contr Rel 2006, 111: 56-64

#PharmSci360Slide 11
Predicting in vivo dissolution: z-factor
In vivo dissolution rate and extent is
calculated from z-factor fitted to in
vitro dissolution profile for each
formulation and in vivo drug solubility
(in vivo drug solubility is changing to
account for changes in pH and bile
salt concentration as the drug is
moving through the intestine)
The model is applicable when API
properties or formulation (i.e.
excipients) drive the dissolution rate.
Z represents and is
determined by fitting to in vitro
dissolution data.
rT
Dw
3
Takano, Pharm Res 2006, 23:1144-1156
( ) tulsD MCCZ
dt
dM,−=
Simulation results from GastroPlus v9.0
Prediction of in vivo performance for 3 cilostazol formulations with different
API particle size distributions administered in dog
Observed data from Jinno, J Contr Rel 2006, 111: 56-64

#PharmSci360Slide 12
Predicting in vivo dissolution: Equivalent Particle
SizeTheoretical particle size
distribution was fitted to in vitro
dissolution data and
subsequently used as an in put
in in vivo simulation
The model is applicable when
formulation (i.e. excipients) drive
the dissolution rate.
Pepin et al. Mol Pharmaceutics 2016, 13:3256-3269
The in vitro dissolution profiles showed
multi-phasic behavior for these
formulation and could not be
successfully fitted with single z-factor.
Fitting artificial particle size distribution
allowed for more accurate translation of
in vitro dissolution to in vivo

#PharmSci360Slide 13
Precipitation

#PharmSci360Slide 14
Enabled Formulation Strategies: BCS II
• Supersaturating Drug Delivery Systems
• Salts
• Cocrystals
• Solutions
• Lipidic formulations
• Cyclodextrin complexes
• Self (Micro) Emulsifying Drug Delivery Systems (S(M)EDDS)
• Nanosuspensions (Stabilized)
• Solid Dispersions (amorphous)

#PharmSci360Slide 15
Supersaturating Drug Delivery SystemsSchematic diagram of “Spring and Parachute”
Brouwers J, J. Pharm. Sci. 98(8):2549 (2009)
Weibull Functionfor release profile
Multiple 1st order orMechanistic Nucleation and Growth Model

#PharmSci360Slide 16
Mechanistic Nucleation Theory
Dmono Diffusion coefficient of the monomer (XXE-4 cm2/min)
NA Avogadro’s number (6.02E+23 molecs/mole)
c Conc. of free monomer (moles/cm^3)
S Solubility at the current pH
kb Boltzman’s constant (1.38E-21 cJoules/Deg. K)
(Note: Joule = Newton-meter)
T 310o K
Interfacial tension (Newtons/cm)
m Molecular volume
R* Critical radius (cm)
Effective radius from Lindfors (cm)
ExpCorr Exponential correction factor
Pre-exponential Term:
Exponential Term:
+
R
R
S
cTkcND B
Avmono ln
21
2
2
23
ln3
16
−
S
c
v
TkExpCorr m
B

#PharmSci360Slide 19
Biphasic Dissolution Model
Itraconazole biphasic dissolution
Mullin J. AAPS 2018, Poster W11230-05-037

#PharmSci360Slide 20
Nimodipine• Physicochemical Properties
• S+log P = 4.11 Exper. log P = 4.18 (Biobyte Starlist)
• Aq. Sol (ug/mL) = 3.9 @ pH = 7.0 (Yunzhe, Int. J. Pharmaceut., 2008)
• FaSSIF (ug/mL) = 12 @ pH = 6.5 (Fu, Colloids Surf. B, 2013)
• S+Peff (cm/s x 104) = 1.77 (AP 7.2)
• Caco-2 Papp (cm/s x 105) = 6.04
(Agilent, Pub #5989-7668EN, 2007)
– Converts to human jejunal Peff = 3.12 x 10⁻⁴
cm/s
AP 7.2 = ADMET Predictor 7.2, Simulations Plus, Inc.
S+Predicted Sites of Metab. (CYP3A4)
S+3A4_Km = 19 mM (AP 7.0)
S+3A4_Vmax = 65.4 nmol/min/nmol Enz
Base pKa = 0.83AP 7.2

#PharmSci360Slide 21
Nimodipine Solid Dispersion1st order precipitation
Mechanistic nucleation
ppt Time = 20000s
Lambda (mm) = 0.18Exp. Corr. = 0.18
Lambda (mm) = 0.18Exp. Corr. = 0.18 Lambda (mm) = 0.18
Exp. Corr. = 0.18
ppt Time = 5000s ppt Time = 2500s
Amounts: red solid-dissolved, red dashed-precipitated, cyan-absorbed, blue-enteric portal vein, green-entering systemic circulation; Dark blue line and points – plasma concentration
#PharmSci360Slide 23
Absorption

#PharmSci360Slide 24
Absorption Processes
Blood
Tight Junction
Influx Transporter
Efflux Transporter
ParacellularTransport
Passive Diffusion

#PharmSci360Slide 25
Effective Permeability (Peff): Measurements in Human
• Measure disappearance of drug from donor side
• Factors affecting permeability:
• individual subject variations
• adsorption to the tubes
H. Lennernas, G.L. Amidon, et al.Capsugel Library, 1995
Cross-section
Peff = Q(Cin - Cout) /(2 r L Cin)
r=1.75 cm, L=10 cm
Peff = 0.0091*Q(Cin - Cout) /Cin
#PharmSci360Slide 26
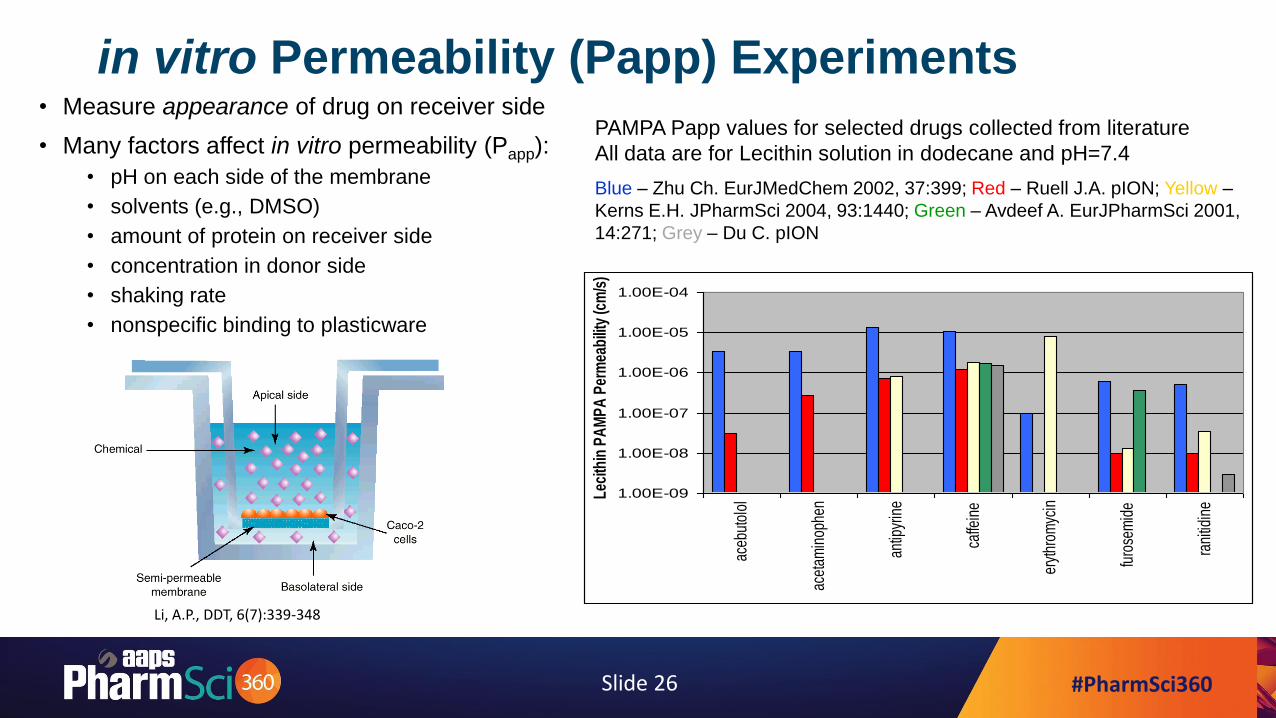
in vitro Permeability (Papp) Experiments• Measure appearance of drug on receiver side
• Many factors affect in vitro permeability (Papp):
• pH on each side of the membrane
• solvents (e.g., DMSO)
• amount of protein on receiver side
• concentration in donor side
• shaking rate
• nonspecific binding to plasticware
Li, A.P., DDT, 6(7):339-348
PAMPA Papp values for selected drugs collected from literature
All data are for Lecithin solution in dodecane and pH=7.4
Blue – Zhu Ch. EurJMedChem 2002, 37:399; Red – Ruell J.A. pION; Yellow –
Kerns E.H. JPharmSci 2004, 93:1440; Green – Avdeef A. EurJPharmSci 2001,
14:271; Grey – Du C. pION
1.00E-09
1.00E-08
1.00E-07
1.00E-06
1.00E-05
1.00E-04
aceb
utol
ol
acet
amin
ophe
n
antip
yrin
e
caffe
ine
eryt
hrom
ycin
furo
sem
ide
rani
tidin
e
Leci
thin
PA
MP
A P
erm
eabi
lity
(cm
/s)

#PharmSci360Slide 27
Mechanistic Simulations of in vitro Permeability (Papp)
Experiments May Help with in vitro/in vivo Translation
• Unlock important information related to absorption
• Number of different processes affecting apparent in vitro permeability can be included in the simulation:
• Passive transcellular diffusion
• Passive paracellular diffusion
• Carrier mediated influx and/or efflux
• Metabolism in the cells
• Binding to albumin
• Accumulation in cell membranes or intracellular compartments
• Experimental conditions (e.g., shaking rate, pH)

#PharmSci360Slide 30
MembranePlus™ Simulation for Methylphenidate
Apical donor
Basolateral receiver
Membrane bilayer
Lysosomal
S+pKa = 8.56 (Base) (AP 7.2)

#PharmSci360Slide 31
Nonlinear Processes

#PharmSci360Slide 32
Metabolic Clearance
Step 1. In vitro incubation of drug with
microsomes/hepatocytes/liver slices to obtain enzyme kinetic
constants Vmax and Km and the in vitro intrinsic clearance
Step 2. Scale in vitro enzyme kinetic constants to in vivo
conditions based on species-specific physiological scale factors.
CLint (whole organ) in vitro
CLh (whole organ) in vivo
Step 3. Based on a tissue blood flow model (e.g. Venous
equilibrium model), determine in vivo hepatic clearance. Rate of
drug elimination = CLh × Concentration
CLint in vitro
Houston and Carlile, Drug Metab. Rev. 29(4):891 (1997)

#PharmSci360Slide 33
Midazolam Clearance IVIVE
GastroPlus simulations of
nonlinear dose dependence
for midazolam using in vitro
Km and Vmax and iv PK.(Agoram et al., 2001)
Experimental GastroPlus Compartmental Simulated
Dose Cmax AUC Cmax AUC Fa% FDP% Fb%
7.5 0.028 69 0.021 65 99 45 24
15 0.056 154 0.052 158 99 55 29
30 0.13 453 0.120 369 99 64 34

#PharmSci360Slide 34
Transporter IVIVE – System Specific Scaling Factors
Jones et al., DMD 2012
Solid lines – predicted from
in vitro data;
Dotted lines – fitted to in
vivo data

#PharmSci360Slide 35
Transporter IVIVE – Compound Specific Scaling Factors
Poirier et al., J Pharmacokinet Pharmacodyn 2009
Rat Human
Use animal data to fit the
empirical scaling factor
Apply the scaling factor from
preclinical data to predict human PK
prediction from in vitro
8
prediction with additional scaling factor

#PharmSci360Slide 36
Transporter IVIVE – Scaling of Passive Diffusion Across Tissues
Lukacova – 17th North American ISSX meeting 2011, Atlanta, GA
(Poirier – J Pharmacokinet Pharmacodyn 2009, 36:585)
19
Instead of empirical scaling factors
Include PStc scaling across tissues
Apply the same approach
for human prediction

#PharmSci360Slide 37
IVIVE for efflux of digoxin – determining intracellular unbound KmThe intracellular unbound P-gp Km for digoxin was found to be 95.3 mM by fitting B->A Papp with MembranePlus across experiments run at
eight different concentrations and validated in a separate experiment using kinetic data at five concentrations

#PharmSci360Slide 38
IVIVE for efflux of digoxin – predicting in vivo absorption
A B CA: Observed (symbols) vs. predicted plasma conc. (blue) and urinary excretion (red) of digoxin (Ochs, 1978).
B: Observed (symbols) vs. predicted plasma conc. (blue) of digoxin for a PO formulation with 6.5 mm radius particle size (Jounela, 1975).
C: Observed (symbols) vs. predicted plasma conc. (blue) of digoxin for a PO formulation with 51 mm radius particle size (Jounela, 1975).
All simulations are using the fitted intracellular unbound P-gp Km value of 95.3 mM

#PharmSci360Slide 39
Virtual Trials

#PharmSci360Slide 40
Use Calibrated PBPK Model to:
Predict Drug Behavior in Different Populations: Disease State
Pharmacokinetics of buspirone and its
metabolite was predicted in patients by
accounting for known physiological changes
between healthy subjects and patients with
liver cirrhosis:
Baseline model described in Macwan J., Poster presentation ACoP 2014
• While the exposure for buspirone increased
significantly (left) in decompensated liver
cirrhosis, only minor changes were
predicted for the 1-pyrimidinylpiperazine
metabolite (right).
• Both sets of simulations are in reasonable
agreement with observed data (blue points).
• Simulations in both groups of subjects are
for 10mg tabletgreen – simulation result in patients with cirrhosis;
pink – simulation result in healthy subjects

#PharmSci360Slide 41
Use Calibrated PBPK Model to:
Predict Drug Behavior in Different Populations: Pediatric
Adult (5mg/kg) Adolescents (15 mg/kg) Infants (12.5 mg/kg)
Neonates (20mg/kg)
Samant et al. – Poster Presentation (Poster # 111) - ASCPT 2015
also Quantitative Systems Pharmacology pre-conference Poster # QP-16

#PharmSci360Slide 42
Use Calibrated PBPK Model to:
Compare Formulations by Accounting for Variability
Incorporate measured variability for
physicochemical, formulation, physiology and
PK parameters into Population Simulator
Capture observed variability from
existing clinical PK studies
Tistaert, C. AAPS Annual Meeting 2015, Orlando, FL

#PharmSci360Slide 43
Use Calibrated PBPK Model to:
Establish Dissolution Specifications for a Formulation
Mechanistic in vitro
simulation may be used to
estimate expected variability
in in vitro dissolutionReference
Test
PBPK model will be used to
evaluate whether the variability in
vitro is likely to translate into
significant differences in in vivo
performance

#PharmSci360Slide 44
Summary• PBPK models allow incorporating different types of in vitro measurements into single
platform to account for all processes affecting drug’s absorption, distribution and
elimination.
• Confidence in predictions of in vivo behavior based on in vitro data still varies between
processes due to gaps in physiology characterizations, adequate in vitro assays, or lack
of validation examples.
• Mechanistic simulations of in vitro assays can be used to ‘deconvolute’ important
parameter values and aid in in vitro – in vivo extrapolation of different processes.
• PBPK models linked with information on population differences and physiological
variability allow for prediction of variability in population of subjects, prediction of drug
behavior between different groups of subjects, comparison of different formulations.