Embed Size (px)
Citation preview
An in Vitro and in Silico Kinetic Study of a Viral RNA Silencing Suppressor
by
Renata Afi Rawlings
A dissertation submitted in partial fulfillment of the requirements for the degree of
Doctor of Philosophy (Biophysics)
in the University of Michigan 2010
Doctoral Committee:
Professor Nils G. Walter, Chair Professor Hashim M. Al-Hashimi Professor Ari Gafni Professor Duncan G. Steel Associate Professor Alice Telesnitsky

© Renata Afi Rawlings 2010

ii
To the Lord Almighty who is my constant support.
iii
ACKNOWLEDGMENTS
There are no words to describe the aid provided to me by my advisor Nils G.
Walter, who has been an excellent mentor and scholar under which to train, allowing me
into his lab, and giving me the tools to grow into a “true biophysicist”. Nils, thank you
for being instrumental in my development as a scientist and for always having an open
door for questions and ideas.
To the members of my committee, Dr. Hashim Al-hashimi, Dr. Ari Gafni, Dr.
Alice Telesnitsky, and Dr. Duncan Steel, I am sincerely grateful for the help and support
of such excellent scientists and truly inspiring people. My experience has been enriched
by your advice and your insights. Additional mentors include Dr. Patrick Nelson, Drs.
Joseph and Lynette Johnson, Dr. Chameree DeSilva, Dr. John Hoertor, Dr. Meridith
Newby, and the many others who have given of their time and talents to provide a space
for me to pursue new challenges.
It is impossible to overstate the support of my family, loved ones, and friends who
have been my foundation in all that I achieve. Specifically, my mother (Illona Sheffey-
Rawlings, JD), brother (Michael Sheffey-Rawlings), father (Dr. Keith Rawlings),
grandmother (Dr. Ruthe T. Sheffey), and grandfather (Marsden Rawlings), have been
instrumental and awe-inspiring with all their help and love.
Without the unfailing support of Stanford C. Goss, Kyla McMullen, The
Nottingham family, The McCoy Family, The Quinn family, The Jacobs family, The

iv
CLFMI family, SMES-G, SCOR, AGEP, Debby Mitchell, Carol-Burell Jackson,
Angelique Johnson, Charissa Clark, Anabel Rawlings, Vernon R. Sheffey, Lilyan
Nottingham and many others, this journey would not have been the successful and
rewarding experience it has been.
I would like to especially thank all past and current members of the Walter lab.
You have made my experience immeasurably gratifying due to the gift of such a bright
and wonderful group of current and future scientists as colleagues and as friends. The
caliber of scholarship and support from all of those who have acted as mentors and
friends have made Michigan truly live up to the motto “the Leaders and Best.” I look
forward to hearing about your auspicious careers and sharing in your lives in the years to
come.
Renata Afi Rawlings
30 March 2010

v
TABLE OF CONTENTS
DEDICATION................................................................................................................... ii
ACKNOWLEDGEMENTS ............................................................................................ iii
LIST OF FIGURES ....................................................................................................... viii
LIST OF APPENDICES ...................................................................................................x
LIST OF ABBREVIATIONS ......................................................................................... xi
ABSTRACT ..................................................................................................................... xii
Chapter 1: THE CO-EVOLUTION OF RNA INTERFERENCE AND VIRAL
SILENCING SUPPRESSION...........................................................................................1
1.1 Introduction ................................................................................................................1
1.2 The RNA World and Non-coding RNAs ...................................................................3
1.3 RNA Interference .......................................................................................................7
1.4 Viral Suppression of RNAi ......................................................................................10
1.5 The Role of the p19 Protein in RNAi Suppression ..................................................12
1.6 Physics in Biology ...................................................................................................13
1.7 The Advantages of Computational Modeling: Speed and Cost ...............................14
1.8 Chapter Overviews ..................................................................................................16
1.9 References ................................................................................................................18
Chapter 2: CATCH AND RELEASE: VIRAL RNA SILENCING SUPPRESSOR
COMPETES WITH HUMAN DICER AND IMPAIRS RISC ASSEMBLY BY
REVERSIBLY BINDING SIRNA .................................................................................27

vi
2.1 Introduction ..............................................................................................................27
2.2 Materials and Methods .............................................................................................29
2.3 Results ......................................................................................................................35
Fluorescence Assays to Observe siRNA:p19 Complex Formation .......................... 35 p19 Binds siRNA Rapidly and Reversibly ............................................................... 37 p19 Efficiently Competes with Recombinant Human Dicer for siRNA Binding ..... 37 Human siRNA-Containing Complexes Formed in Cytosolic Cell Extract are Vulnerable to p19 Challenge .................................................................................... 39 Modeling Supports Formation of a Transient Ternary siRNA:Dicer:p19 Complex 44
2.4 Discussion ................................................................................................................45
2.5 Acknowledgements ..................................................................................................48
2.6 References ................................................................................................................49
Chapter 3: EXPLICIT MODELING: TIME DEPENDENT AND ALTERNATIVE
STEADY STATE IN VIVO INTERACTIONS BETWEEN RNA INTERFERENCE
AND P19 ...........................................................................................................................55
3.1 Introduction ..............................................................................................................55
3.2 Model Description(s): ..............................................................................................58
Explicit Time-Dependence of RNA Interference ..................................................... 58 Ternary Complex Formation ..................................................................................... 61 Dissociative Equilibrium Shift .................................................................................. 62
3.3 Results ......................................................................................................................67
Enhancement of Free siRNA by p19 ........................................................................ 67 P19 Reinitiates Dormant mRNA Replication ........................................................... 70 Timed Introduction of p19 Increases Length of mRNA Replication Phase ............. 70 Modeling Supports Formation of a Transient Ternary siRNA:Dicer:p19 Complex 71
3.4 Discussion ................................................................................................................73
Principles for p19 Interaction with RNAi-Based Applications ................................ 76 Drawbacks and Concerns of p19 .............................................................................. 77
3.5 Acknowledgements ..................................................................................................78
3.6 References ................................................................................................................79
Chapter 4: IN VITRO PROBING OF MICRO-RNA CONTAINING COMPLEXES
IN HUMAN CYTOSOLIC EXTRACT .........................................................................84
4.1 Introduction ..............................................................................................................84
4.2 Materials and Methods .............................................................................................89
4.3 Results ......................................................................................................................93

vii
Complex Formation between Radio-labeled Let-7 and HeLa cell Extract Components .............................................................................................................. 93 p19 Binds miRNAs with the Same Affinity as siRNAs ........................................... 95 Messenger RNA Addition Produces no Effect on miRNA Complexes ................... 96 Cy3 labeled Let-7 Bias Complexes Toward Single-Strand Binding ........................ 98 Western Blots show Dicer Co-migration with Single-stranded Complexes ........... 101
4.4 Discussion ..............................................................................................................101
4.5 Acknowledgements ................................................................................................104
4.6 References ..............................................................................................................105
Chapter 5: SUMMARY AND FUTURE DIRECTIONS ...........................................109
5.1 Summary ................................................................................................................109
5.2 Future Directions ...................................................................................................114
Kinetic Characterization of eukaryotic RSS's and their Applications to Therapeutics................................................................................................................................. 114 Modeling Extension(s) ............................................................................................ 115 Single molecule investigations of HMGA2:Let7 binding ...................................... 116 Fluorescent localization of Let7 targeting in vivo .................................................. 116
5.3 References ..............................................................................................................117
APPENDICES...……………………………….............................................................120
viii
LIST OF FIGURES
Figure 2.1 Fluorescence assays to detect siRNA:p19 complex formation. ...................... 36
Figure 2.2 Kinetics of formation and dissociation of the siRNA:p19 complex.. .............. 38
Figure 2.3 Competition of p19 with human Dicer for siRNA binding as detected by
EMSA. ...................................................................................................................... 40
Figure 2.4 Competition of p19 with human siRNA-containing complexes found in
cytosolic HeLa cell extract. ....................................................................................... 43
Figure 3.1 Model Diagram. ............................................................................................... 68
Figure 3.2 The effect of p19 on RNAi complexes. ........................................................... 69
Figure 3.3 p19 Concentration and Timing effect peak mRNA accumulation and infection
window. ..................................................................................................................... 71
Figure 3.4 Stepwise Introduction of p19 can significantly increase mRNA rising phase..
................................................................................................................................... 72
Figure 3.5 Competition of p19 with human Dicer for siRNA binding as detected by
EMSA. ...................................................................................................................... 74
Figure 4.1 MicroRNA and siRNA Pathways. ................................................................... 86
Figure 4.2 Complex Formation of Radio-labeled Let-7a. ................................................. 94
ix
Figure 4.3 Complex Formation of Cy3-labeled Let-7a. ................................................... 97
Figure 4.4 Western blots against Dicer.. ......................................................................... 100
x
LIST OF APPENDICES
APPENDIX A SUPPLEMENTAL FIGURES ..........................................................120
Figure A1 Concentration dependence of siRNA:p19 dissociation kinetics.. .................. 120
Figure A2 Competition between p19 and human Dicer for siRNA binding as shown by
EMSAs.. .................................................................................................................. 121
Figure A3 Comparison of siRNA complex formation for different HeLa cell extract
concentrations and temperatures.. ........................................................................... 123
Figure A4 Western blot detection of Dicer .................................................................... 124
Figure A5 Gel-based dissociation chase assays.. ............................................................ 125
Figure A6 Size comparison of protein-siRNA binding complexes.. .............................. 126
APPENDIX B MODEL DESCRIPTION: Grouped RNA Interference with p19...127
Model Description...........................................................................................................127 Figure B1 The interaction of p19 with RNAi at Steady State........…………….............132 APPENDIX C MATLAB AND MATHEMATICA CODE….………………….....133

xi
LIST OF ABBREVIATIONS
RNA ribonucleic acid DNA deoxyribonucleic acid RNAi RNA interference RISC RNA induced silencing complex siRNA small interfering RNA miRNA micro RNA dsRNA double-stranded RNA ncRNA non-coding RNA mRNA messenger RNA RSS RNA Silencing Suppression protein UTR untranslated region RdRp RNA dependent RNA polymerase Ago2 Argonaute2 RLC RISC loading complex CIRV Carnation Italian Ringspot Virus SP siRNA:p19 complex SD siRNA:Dicer complex SDP siRNA:Dicer:p19 complex F fluorescein T tetramethylrhodamine FRET fluorescence resonance energy transfer RNase ribonuclease MD molecular dynamics tr-FRET time-resolved FRET EMSA Electrophoretic mobility shift assay HPLC reversed phase high performance liquid chromatography ELISA Enzyme-linked immunosorbent assay PAGE poly-acrylamide gel electrophoresis PCR polymerase chain reaction kDa kilo-Dalton WT wild type PNK polynucleotide kinase ATP adenosine triphosphate NTP nucleotide triphosphate DTT dithiothreitol EDTA ethylenediaminetetraacetic SDS sodium dodecyl sulfate TBE tris-borate-EDTA buffer

xii
ABSTRACT
An in Vitro and in Silico Kinetic Study of a Viral RNA Silencing Suppressor
by
Renata Afi Rawlings
Chair: Nils G. Walter
RNA interference (RNAi) is a conserved gene regulatory mechanism employed
by higher eukaryotes to avert emergent viruses and retrotransposons. During viral
infection, the RNase III-type endonuclease Dicer cleaves viral double-stranded RNA into
small interfering RNAs (siRNAs), 21-24 nucleotides in length, and helps load them into
the RNA-induced silencing complex (RISC) to guide cleavage of complementary viral
RNA. As a countermeasure, many viruses have evolved viral RNA silencing suppressor
(RSS) proteins that tightly, and presumably quantitatively, bind siRNAs to thwart RNAi-
mediated degradation.
Here we report fluorescence quenching and electrophoretic mobility shift assays
that probe siRNA binding by the dimeric RSS p19 from Carnation Italian Ringspot Virus
(CIRV), as well as by Dicer and RISC assembly complexes. We find that the siRNA:p19
interaction is readily reversible, characterized by rapid binding ((1.69 ± 0.07)×108 M-1s-1)
and marked dissociation (koff = 0.062 ± 0.002 s-1). We also observe that p19 efficiently

xiii
competes with recombinant human Dicer and inhibits formation of RISC-related
assembly complexes found in human cell extract.
Computational modeling based on these results provides evidence for the
formation of a ternary complex between siRNA, p19, and human Dicer. The assumption
of an obligatory transient ternary complex intermediate correlates well with the
experimentally observed efficient shuttling of an siRNA toward the p19 bound state. A
simple model based on this mechanism yields a greater than 20-fold bias in dissociation
equilibrium constant for the ternary complex intermediate to dissociate into the
siRNA:p19 complex rather than the siRNA:Dicer complex.
We explicitly model the time dependence of the RNAi complexes in response to
p19 silencing suppression by monitoring the impact of exogenously introduced p19 on
the expression of a messenger RNA targets. We find p19 action to be concentration
dependent and able to significantly increase the peak amount of mRNA produced and
extend the length of the viral replication phase. From our experimentation and
mathematical modeling we can postulate fundamental principles for the optimization of
p19 in conjunction with RNAi-based techniques and therapeutics.

1
Chapter 1:
THE CO-EVOLUTION OF RNA INTERFERENCE AND VIRAL SILENCING
SUPPRESSION
1.1 Introduction
In recent decades, it has been hypothesized that the distinction between humans
and other mammals is due to either an increased amount of genetic information (DNA)
(1), an increased amount of DNA being translated into proteins (2), or the highly complex
processing of DNA editing and remodeling (3, 4). Since the birth of molecular biology
in 1952 with the famed Hershey – Chase heredity experiment (5) and the subsequent
1953 Watson-Crick DNA structure (6), DNA has been the molécule de fascination
promising an explanation for disease susceptibility, genetic variation and the source of
human complexity. In an influential 1957 presentation, James Crick announced his
Central Dogma of Molecular Biology that further solidified DNA as the master molecule,
stating essentially that DNA is copied or transcribed into RNA to be translated into
proteins, which do the heavy lifting in the cell. If the manual of life, however, is
encoded only in our DNA and worked out by our proteins, the initial publications of the
Human Genome Project in 2000 should have functionally unlocked the approximately
20,000-25,000 human genes to give unprecedented understanding of genetic information.
2
Contrary to estimates based on relative size, where the human genome is 30-fold
the size of the worm C. elegans and 600-fold that of the bacterium E. coli, the percentage
of human DNA genes encoding proteins was found to be minuscule in comparison to
other organisms, amounting to only ~2% (7, 8). The surprise in discovering that over
98.5% of the human genome does not code for proteins was only intensified by the
discovery that the majority of this DNA is still being transcribed into RNA, now termed
non-coding RNA (ncRNA) for distinction (8). More perplexing still, the amount of non-
protein coding RNA, not that of protein coding RNA, is scaling with the complexity of
different organisms (2).
The notion that RNA’s role in the cell is passive was to be challenged over the
next decade due to numerous discoveries that RNA is in fact effecting genetic control and
is able to regulate gene expression in a number of ways. This new awareness led to
Science hailing RNA discoveries as the Breakthrough of the Year in 2002, stating that,
“these electrifying discoveries are prompting biologists to overhaul their vision of the cell
and its evolution (9).” Since then the sheer number of identified non-coding RNAs has
boomed, with varied functions in diverse cellular processes such as suppression of
infecting viruses and transposons, cell differentiation, gene regulation, and formation of
heterochromatin used to organize chromosomes (8, 10). Although we are closer than ever
to dispelling the common misconception that “one gene equals one protein, equals one
function”, echoes of this central dogma are still found in studies of evolutionary biology.

3
1.2 The RNA World and Non-coding RNAs
Walter Gilbert, in a 1986 article for Nature, outlined a potential scenario for
evolution he called the RNA World theory (11). In essence he proposed that RNA
molecules, or molecules like them, were the original primordial genetic material and
could act to both catalyze their own replication and undertake a wide range of enzymatic
activities, including the synthesis of proteins (11). Subsequently, through the eventual
processing of RNA into DNA, by reverse transcription, the much more versatile RNA
would be finally superseded by the more stable DNA as the primary storehouse of genetic
information (12).
Soon after Gilbert’s article, Thomas Cech and Sidney Altman were awarded the
1989 Nobel Prize in Chemistry for the two-fold discovery that catalytic RNAs could cut
themselves out of larger RNAs (self-splicing introns) and could cut the leader sequence
off all transfer RNAs across different species through a protein-assisted RNA enzyme
(ribonuclease P) (13, 14). These findings led to a rapid growth in the discovery and
characterization of hundreds of diverse non-coding and catalytic RNAs, including self-
splicing introns, self-cleaving ribozymes, riboswitches, ribosomal RNAs, and new classes
of RNA interference inducers, all with functions outlined below (15).
Splicing occurs when sections of non-coding RNA termed introns are cut out of
pre-messenger RNA transcripts resulting in mature mRNA that is translated into protein
(16). A multimegadalton RNA-protein complex, called the spliceosome, catalyzes this
reaction and is composed of 5 small nuclear ribonucleoprotein complexes that participate
in the two transesterification reactions necessary to fully remove the intron and re-ligate

4
the exons to be translated (17). As a normal phenomenon in eukaryotes, mRNAs can
undergo alternative splicing during which exons can be recombined in multiple ways to
increase protein diversity. Over 80% of human genes are alternatively spliced with
numerous modes of alternative splicing observed (18). Rare introns, classified as group I,
and II, have been observed to perform self-splicing through the formation of an RNA
enzyme or ribozyme that can do the job of the splicosome while requiring no (or only
few) proteins, providing a glimpse into a possible evolutionary cousin to the modern
splicosome (14, 17).
Ribozymes are found not only in self-splicing introns but in the genomes of some
RNA viruses. For example, the human hepatitis delta virus (HDV) encodes a ribozyme
crucial to viral replication (19). The Varkud satellite (VS) ribozyme, found in the bread
mold Neurospora, catalyzes the self-cleavage and ligation reactions necessary for the life
cycle of the VS RNA (20). Other such molecules, including the hairpin and hammerhead
ribozymes, are found in RNA satellites of plant viruses and function to cleave sense and
antisense genomic copies of the virus during rolling circle replication (20, 21). The
glucosamine-6-phosphate activated glmS ribozyme occurs in certain gram-positive
bacteria and regulates cellular production of glucosamine-6-phosohate (GlcN6P) by
controlling the production of the enzyme in charge of GlcN6P production (22). When
concentrations of GlcN6P become elevated, the ribozyme will bind GlcN6P to catalyze
its own cleavage, leading to mRNA degradation and ultimately a reduction in the amount
of enzyme and indirectly GlcN6P (22, 23). In this way, the ribozyme acts as a negative
feedback loop regulating the amount of available enzyme, based on the GlcN6P
concentration. Due to the fact that the glmS ribozyme can control gene expression in
5
response to the concentration of a metabolite (i.e., GlcN6P) it is also considered a
riboswitch.
Riboswitches in general use the binding of small metabolites to directly regulate
the activity of the mRNA they are embedded within (24-26). Mostly contained in
feedback loops of bacteria, riboswitches are generally classified by the small ligands they
bind and regulate. The TPP riboswitch binds directly to thiamin pyrophosphate (TPP) to
regulate genes involved in thiamin biosynthesis and transport, and is the only riboswitch
reported in eukaryotes (27, 28). SAM riboswitches bind S-adenosylmethione (SAM) to
regulate the expression of proteins involved in sulfur metabolism including the
metabolism of methionine, cysteine and SAM (29). PreQ1 riboswitches bind pre-
queuosine1 (PreQ1), to regulate the synthesis or transport of this precursor to queuosine
(30). The Glycine riboswitch binds glycine to regulate protein components of the glycine
cleavage system and metabolism (31). The number and variety of biochemically
identified riboswitches is steadily growing due to high conservation of structure and the
development of computational identification tools to recognize specific RNA motifs (32).
Arguably the most widespread and abundant enzyme on earth, the ribosome is
another powerhouse of RNA. It is composed of two ribonucleoprotein subunits
responsible for universal translation of mRNAs into proteins through transfer RNA
adapters (33). Assembly of both subunits into a mature ribosome initiates translation on
the mRNA template (34). The ribosome then builds the nascent polypeptide chain by
binding an aminoacyl-tRNA (aa-tRNA) and checking for a match between the three-
nucleotide anticodon of the tRNA and the first codon of the mRNA sequence (35).
Transfer of the growing peptide chain from one tRNA onto the next aminoacyl-tRNA

6
(aa-tRNA) requires high-fidelity proofreading and large dynamic conformational changes
with multiple co-factors (34-38).
At the modern forefront, a newly discovered immune and gene regulatory
pathway dominates the RNA landscape. First identified in C. elegans, RNA interference
(RNAi) is a pathway that can use small non-coding RNA fragments as triggers to either
destroy invading RNA (i.e., from viruses or transposons) or regulate endogenous gene
expression (39). The implications of this discovery led to RNAi being used as a new
approach to manipulate gene expression in mammalian cells (40). Researchers have
effectively knocked down genes of interest by introducing into a cell small RNAs
targeted against that gene. For functional genetics this has offered a wide variety of
applications spanning almost all classes of eukaryotes. Also, RNAi is gaining interest as a
potential therapeutic strategy with drug design on the horizon (41).
Today the evolutionary theory of the RNA World still has its supporters and
detractors, however, it has sparked decades of research into these fascinating molecules
and uncovered ever more varied functions. RNA has been risen from relative obscurity,
and from being regarded as a simple facilitator of protein translation to a major player in
gene regulation, not only in ancient times, but in modern organisms. We now know that
RNA molecules can act as enzymes (i.e., ribozymes) (22, 23), regulators of splicing
(group I and II introns) (14, 17), genetic switches (riboswitches) (27, 28), universal
participants in protein translation (ribosome) (34-38), and complex regulators of massive
gene networks as seen in RNAi (39-41). These and other increasingly elaborate
biological functions continue to emerge and stand as proof of the varied capabilities of
RNA and the relevance of RNA biology.

7
1.3 RNA Interference
The newest RNA revolution, RNA interference, has sparked a Nobel Prize of its
own in 2006, a billion dollar business, and is yet another illustration of the meteoric
journey of RNA into the public awareness. The discovery of RNAi began with the
research of Rich Jorgensen, a plant biologist, who observed an irregular phenotype in
petunias. In his attempts to make a more pigmented petunia Jorgensen observed that he
was actually producing non-pigmented white samples. His strategy was to add genes that
encoded for additional pigmentation in the hopes of up-regulating the pigment production
in the plant (42). Initially his white samples were considered an aberration; however, we
now know he was witness to early evidence of the RNA interference pathway.
Since Jorgensen, the role and function of RNAi has been further illuminated.
First, in a 1998 Nature paper Fire and Mello observed that double-stranded RNA triggers
RNAi and stated that, “To our surprise, we found that double-stranded RNA was
substantially more effective at producing interference than was either strand individually”
(39). In 2000, Zamore et al. reported that long double-stranded RNAs (dsRNAs) are
processed into smaller fragments in intervals of 21-24 nucleotides by the RNase III type
enzyme, Dicer (43). Tuschl and co-workers then arrived at a more biochemical
understanding by demonstrating that the functional units of RNAi are small double
stranded RNAs and by first describing RNAi in mammalian cells (44).
Presently the understanding of one RNAi pathway is that long double-stranded
RNA enters the cytoplasm of a cell and is cleaved by the RNase III type enzyme, Dicer,
into small interfering RNA or siRNAs (45-48). These siRNAs are then loaded into an

8
RNA-induced silencing complex (RISC) that selectively uses one strand of the siRNA as
a guide to identify other complementary RNAs in the cell. Once the target RNA is found,
the RISC complex works to degrade all targets complementary to the original siRNA
sequence (49, 50). In this way, the original message is silenced. It turned out that this
silencing was the reason for Jorgensen’s white petunias, as he added to his plant samples
genes that encoded for more pigmentation he inadvertently triggered Dicer cleavage and
the RNAi pathway. RISC used the siRNAs produced by Dicer to suppress or destroy all
RNA encoding for pigment, not only the original additions.
Dicer enzymes are thought to play a crucial dual role in RNAi by not only
generating mature small interfering RNAs, but by participating in handing them off to the
RISC complex. Minimally, RISC is composed of Argonaute proteins, which in both
humans and the fruitfly Drosophila have been reported to bind siRNA duplexes, degrade
one of the two RNA strands (the passenger strand), and initiate sequence-specific
cleavage of the target mRNAs using the other strand, the guide strand (51, 52). There are,
however, many protein partners of Argonaute that are necessary for full in vivo RNA
silencing functions (53). Human Dicer is one among the Argonaute protein partners (54)
and binds directly to the PIWI domain of human Ago2 (55). This direct binding supports
a role for Dicer in siRNA handoff (53) and, consequently, Dicer has been reported to be a
key component in several RISC loading complexes (56-59). The importance of handoff
has been demonstrated by the work of John Rossi (City of Hope) and Greg Hannon (Cold
Spring Harbor), who independently found that longer Dicer substrates (60) or small
hairpin RNAs (61) could induce more potent knockdown, by over 100-fold, when
compared to mature siRNAs introduced to the cell.
9
The fundamental steps in RNAi are outlined above, however, there are expanding
groups of subfamilies that perform different variations on this theme. The two initially
described classes of non-coding RNAs involved in RNAi are the siRNA and micro-RNA
(miRNA) pathways. Micro-RNAs, unlike siRNAs, are endogenous products originating
in the nucleus of the cell and containing selective non-complementary regions. Once
cleaved by Dicer, these molecules are of the same size as siRNAs, but suppress
translation as opposed to promoting targeted cleavage of messenger RNAs. MicroRNAs
have the added benefit to the host organism of requiring only limited base pairing with a
target, enabling them to down-regulate many targets based on short recognition (seed)
sequences.
From a bench-top point of view, functional genomics has taken a giant leap
forward in that researchers can now knockdown genes of interest and examine their
phenotype by introducing siRNAs or a plasmid producing short hairpin RNAs (shRNAs)
that mimic the precursor step in miRNA biogenesis. Forms of the RNAi pathway have
been found in yeast, plants, invertebrates, and mammals, allowing RNAi tools to be
extended to most model systems. Diverse processes from characterizing mouse gene
products, to aging and HIV are being studied using RNAi knockdown or silencing,
therefore RNAi has rapidly become recognized as a gold standard for manipulating gene
expression (62-64).
With RNAi research being applicable to such auspicious targets as HIV and
cancer, the major progression of the field has shifted naturally toward therapeutics.
Several major companies have been recently founded around this endeavor, and big
pharmaceutical companies are eager to get into the market early, as evidenced by the fact
10
that Merck bought the San Francisco based start up Sirna in 2006 for close to a billion
dollars. Clinical trials have begun for an RNAi drug to treat macular degeneration, less
than a decade from the technology’s discovery. By scientific standards this is remarkably
fast, again attesting to the weight given to RNAi’s potential impact on the future of
science and medicine.
1.4 Viral Suppression of RNAi
Due to the progression of RNAi toward therapeutics, the interactions between
RNAi and potentially invading viruses are of central importance to the field. Although
RNAi is thriving as a laboratory technique, a 2007 review article states that “the path
toward RNAi therapeutics is not as straightforward as initially hoped. The drawbacks
with delivery and toxicity that have plagued earlier antisense-based technologies may
prove to be an issue for RNAi therapeutics as well (65).“ There are numerous in vitro
approaches and chemical modifications being actively evaluated that show differences in
relative merit in animal systems as well as in in vivo applications, leaving open questions
as to the viability of RNAi techniques for human subjects.
Additionally, viruses have evolved specific mechanisms for evading RNAi
knockdown. Induced RNAi resistance involves active viral mRNA rearrangement in the
presence of the RNAi pathway, including partial or complete deletion of target
sequences, or insertions and mutations within a target (65). Some point mutations outside
of the target site can induce a conformational change, rendering the target sequence
inaccessible to RISC cleavage (65). Also, there can be intrinsic viral RNAi resistance

11
where viruses enclose their messenger RNA within a sub-cellular compartment to deny
the RNAi machinery access (65). Viral produced proteins can bind mRNA targets and
sterically block target sites (65). Lastly, some viruses encode RNA silencing suppressor
proteins (RSSs). These proteins act to inhibit or compete with Dicer and/or other RNAi
components to decrease the amount of viably loaded RISC complexes (65, 66). Many
potent and hazardous viruses produce an RSS either solely or in conjunction with other
methods of RNAi resistance to increase infection length and systemic effects. Examples
of this counter-defense include the HIV-1 tat protein, Influenza NS1, Ebola VP35, and a
host of other plant-based viruses (67-69).
Considered the most ubiquitous mechanism of RSS suppression is the binding or
sequestering of small RNA products. Viruses that encode an RSS of this type include
HC-Pro of Tobacco etch virus (TEV), p21 of Beet yellows virus (BYV), p122 of Tobacco
mosaic virus (cr-TMV), p15 of clump virus, gB of Barley stripe mosaic virus, as well as
p19 of the tombusvirus Carnation Italian Ringspot Virus (CIRV) (70-73). All members of
the plant virus family tombusviridae produce a small RNA binding, dimeric RSS protein
of ~19 kDa molecular weight per monomer (p19). Sequestration and binding of Dicer
substrates (small RNAs) by p19 has been observed to correlate with reduced viral mRNA
degradation, systemic symptom spread and the sustainability of the viral phenotype after
infection observed from in vivo studies performed in human cells as well as plants (74-
78).

12
1.5 The Role of the p19 Protein in RNAi Suppression
p19 binds small double-stranded RNAs, and this binding is considered to be a
widespread method of viral RNAi suppression (70-73). As one of the earliest examples
of this type of RSS, p19 has been used in efforts to boost production of plant-based
vaccines for human diseases as well as in conjunction with classical gene therapy vectors
to increase protein production levels in lenti- and adenovirus vectors (40, 79).
p19 is a required protein for viral toxicity and spread of symptoms in CIRV and
other tombusviruses. It forms soluble homodimers that bind specifically to siRNAs, 19
base pairs in length with 2-nucleotide 3’ overhangs (80-82). Independently solved crystal
structures (80, 81) and molecular dynamics simulations (82) of p19 dimers in complex
with siRNAs show the protein’s binding to be length dependent, due to caliper-like
stacking on terminal tryptophans, but independent of siRNA sequence, due to nonspecific
binding between residues in the protein groove of the dimer and the sugar-phosphate
backbone of the RNA duplex. In vitro assays, measuring p19 binding, report a tight
apparent dissociation equilibrium constant of 0.17 nM for the siRNA:p19 complex (80).
In conjunction with the experimentally observed correlation between siRNA binding
ability and p19’s silencing suppression efficiency, the prevailing description of p19’s
suppression mechanism is to sequester siRNAs away from the RISC machinery (74-78).
In its natural host, p19 has to compete with an siRNA signal that can be amplified
due to the presence of RNA dependent RNA polymerases (RdRp’s), increasing the
concentration demands on p19 protein production. In vivo assays show that p19, due to
its sequence independent binding, also associates with miRNAs and possibly any small

13
duplex RNA of the required length (78, 83). Without additional parameters, this would
require stoichiometric binding of a large number of intracellular small RNAs by p19 and
would substantially increase the necessary p19 concentration requirements for future
applications. Gel-based assays can, however, only give relative affinities for protein
binding and will not shed light on the solution kinetics of p19 for its various targets, so to
further test the sequestration hypothesis solution-based biophysical techniques are
needed.
1.6 Physics in Biology
For decades, physical techniques such as X-ray cystallography, nuclear magnetic
resonance, Raman spectroscopy, circular dichroism, and fluorescence resonance energy
transfer (FRET) have been staples of molecular research. Some of the founders of
molecular biology were originally trained as physicists, including Francis Crick, who co-
discovered the double helical structure of DNA with James Watson in 1958, and Max
Delbrück, who became a 1969 Nobel laureate in physiology for his discovery that viruses
reproduce in a one-step process as opposed to exponentially as cellular organisms. These
discoveries and others sparked a movement of physically trained scientists into molecular
biology, bolstered by the then recent successes in physics, such as the advent of radar
during World War II.
Molecular biologists, over the approximately half century since Watson and Crick
deciphered the double-helical structure of DNA, have amassed a truly impressive amount
of data regarding the interactions of biological systems, however, with the advent of the

14
genomic era and increasing discoveries regarding RNAi and large-scale gene regulatory
networks, renewed effort has been placed on the search for interesting RNA phenomena.
In fact, the field has become so apt in this search that it is experiencing a deluge of
information, from which some are now trying to take a step back to examine the larger
conclusions. Physicists, accustomed to reducing complex systems to fundamental
principles, are in a unique position to help with this effort. Their background in theory
and experience in model building can be applied to the explanation of these massive
datasets, and the interaction between individual elements.
1.7 The Advantages of Computational Modeling: Speed and Cost
Attempts to bridge the gap between physics and molecular biology have sparked
the creation of a relatively new field within biophysics, coined computational biology,
which now includes several long-standing branches of collaborative approaches.
Computational biology uses advances in physics, computer science, statistics, and applied
mathematics to simulate and model complex biological interactions and datasets.
Historically, computational biology got its start as systems biology, analogous to systems
engineering, due to its overlap in techniques and relation to biological systems. This did
not, however, have the same defined scope in biology as it once had in engineering.
Nature Insights put it best in saying, “When biology ceases to concern itself with the
'systems' of organisms it ceases to be biology (84)).” To avoid this confusion, the term
computational biology was adopted to more accurately describe the role of predictive
mathematics in defining the discipline.

15
Computational biology has expanded under its new definition and now
encompasses a number of subfields, which include bioinformatics, mathematical biology,
molecular dynamics, protein structure prediction, and computational biomodeling.
Bioinformatics uses statistics and algorithms to sift through large sets of data to make
classifications and predict trends, such as aligning sequences for protein homolog
comparisons. Mathematical biology aims to mathematically describe these biological
systems and has produced new equation sets to describe population growth, cancer, and
other intricate processes. Molecular dynamics is the use of extensive structural modeling
for observing molecules at an atomic level in simulated environments. Protein, RNA and
DNA structure prediction software, such as M-fold, allows for 3-D molecular structures
to be generated from only the knowledge of their one-dimensional sequence. Lastly,
computational biomodeling focuses on the building of computer models that synthesize
and visualize the interactions between molecules to provide a comprehensive view of
how distinct changes in individual components affect the outcome of large and/or
complex biological networks.
Biomodeling has the benefit of being extremely applicable to the study of human
systems. One of the first emerging large-scale studies featured mapping and studying the
human brain at a molecular level. The Blue Brain Project founded in 2005 by The Brain
and Mind Institute of Switzerland is attempting to reverse-engineer the mammalian brain
using biologically realistic neuro-networks to gain insight into the nature of
consciousness. Later, a significant amount of work was done in ecology modeling, fueled
by advances in descriptive equations from mathematical biology. Large numbers of
species interactions were able to be determined, and famously, the effect of wolves or any
16
large predator on the concentration of prey was predicted by the Lotka-Volterra model
equations to be periodic (85, 86).
Complementary to experimental work, the appropriate use of computational
modeling to describe and in some ways predict biological outcomes is a powerful tool for
research and therapeutic applications. Without computational tools the pace and the
expense of ongoing laboratory tests and of subsequent clinical trials become prohibitive,
with the average cost of bringing a drug to market exceeding 900 million dollars. Using
mathematical tools to potentially model these systems in advance of such trials reduces
the cost and increases the speed of conventional drug design, which is becoming
restrictive if not impossible.
1.8 Chapter Overviews
Here physical and computational techniques are used to probe the interactions of
the viral suppressor p19 on the RNA interference pathway. In Chapter 2, a ratiometric
fluorescence quenching assay is reported that probes siRNA binding by the dimeric RSS
p19 from Carnation Italian Ringspot Virus (CIRV). The siRNA:p19 interaction is
observed to be reversible, characterized by rapid binding ((1.69 ± 0.07)×108 M-1s-1) and
noticeable dissociation (koff = 0.062 ± 0.002 s-1) (Figure 2.2). In Drosophila extract,
competition between p19 and siRNA-containing complexes is shown to be time
dependent and potent (87). p19 efficiently competes with recombinant human Dicer and
inhibits formation of RISC-related assembly complexes found in human cell extract. We
also find evidence of a ternary complex between p19, siRNA and human Dicer and,

17
based on these results, the possible modes of Dicer/p19 competition are tested using
computational modeling.
In Chapter 3 we develop two independent models, first, to determine the time-
dependent impact of p19 on the RNAi pathway and, second, to assess the mechanism of
p19 competition with human Dicer by an alternative steady-state approach. We explicitly
investigate the time dependence of the RNAi complexes in response to p19 silencing
suppression, and the outcomes of exogenous protein introduction on mRNA
accumulation. We observe that high p19 can increase the yield of a virally introduced
gene of interest by up to 10-fold for the concentrations tested, but has a much more
significant effect on the infection, increasing the effective length of infection by over
100-fold. Additionally, p19 is observed to reinitiate mRNA accumulation even after
suppression has been achieved, suggesting active RNAi is needed to maintain viral
repression. We confirm evidence of a ternary complex between p19, siRNA, and human
Dicer and numerically determine rate constants for this interaction that reproduces
experimental competition data. Using these rates we can achieve viral accumulation
levels consistent with previous experimental literature data from using p19 in support of
gene therapy vectors.
Additionally, Chapter 4 discusses miRNA binding experiments in human
cytosolic extract as well as the potential use of miRNAs for in vivo localization
experiments. We measure equivalent p19 binding affinities for siRNA and miRNA
substrates, highlighting the substrate diversity of p19 in vivo. Chapter 5 summarizes and
discusses all results and provides future directions for both models and experiments.

18
1.9 References
1. Fields C, Adams MD, White O, & Venter JC (1994) How many genes in the
human genome? Nat Genet 7(3):345-346
2. Pennisi E (2007) Genomics. DNA study forces rethink of what it means to be a
gene. Science 316(5831):1556-1557
3. Neely KE & Workman JL (2002) The complexity of chromatin remodeling and
its links to cancer. Biochim Biophys Acta 1603(1):19-29
4. Turelli P & Trono D (2005) Editing at the crossroad of innate and adaptive
immunity. Science 307(5712):1061-1065
5. Hershey AD & Chase M (1952) Independent functions of viral protein and
nucleic acid in growth of bacteriophage. J. Gen Physiol. 36:39-56.
6. Waston JD & Crick FHC (1953) A Structure for Deoxyribose Nucleic Acid.
Nature 171:737-738.
7. Hahn MW & Wray GA (2002) The g-value paradox. Evol Dev 4(2):73-75
8. Szymanski M, Barciszewska MZ, Zywicki M, & Barciszewski J (2003)
Noncoding RNA transcripts. J Appl Genet 44(1):1-19
9. Couzin J (2002) Breakthrough of the year. Small RNAs make big splash. Science
298(5602):2296-2297
10. Kurth HM & Mochizuki K (2009) Non-coding RNA: a bridge between small
RNA and DNA. RNA Biol 6(2):138-140
11. Gilbert W (1986) The RNA World. Nature 319: 618.

19
12. Klyce B (The RNA World.) (web).
13. Altman S, et al. (1989) Catalysis by the RNA subunit of RNase P--a minireview.
Gene 82(1):63-64
14. Cech TR (1990) Self-splicing of group I introns. Annu Rev Biochem 59:543-568
15. Walter NG & Engelke DR (2002) Ribozymes: catalytic RNAs that cut things,
make things, and do odd and useful jobs. Biologist (London) 49(5):199-203
16. Crick F (1979) Split genes and RNA splicing. Science 204(4390):264-271
17. Ritchie DB, Schellenberg MJ, & MacMillan AM (2009) Spliceosome structure:
piece by piece. Biochim Biophys Acta 1789(9-10):624-633
18. Matlin AJ, Clark F, & Smith CW (2005) Understanding alternative splicing:
towards a cellular code. Nat Rev Mol Cell Biol 6(5):386-398
19. Asif-Ullah M, Levesque M, Robichaud G, & Perreault JP (2007) Development of
ribozyme-based gene-inactivations; the example of the hepatitis delta virus
ribozyme. Curr Gene Ther 7(3):205-216
20. Cochrane JC & Strobel SA (2008) Catalytic strategies of self-cleaving ribozymes.
Acc Chem Res 41(8):1027-1035
21. Doherty EA & Doudna JA (2001) Ribozyme structures and mechanisms. Annu
Rev Biophys Biomol Struct 30:457-475
22. Winkler WC, Nahvi A, Roth A, Collins JA, & Breaker RR (2004) Control of gene
expression by a natural metabolite-responsive ribozyme. Nature 428(6980):281-
286
23. Cochrane JC, Lipchock SV, & Strobel SA (2007) Structural investigation of the
GlmS ribozyme bound to Its catalytic cofactor. Chem Biol 14(1):97-105

20
24. Tucker BJ & Breaker RR (2005) Riboswitches as versatile gene control elements.
Curr Opin Struct Biol 15(3):342-348
25. Vitreschak AG, Rodionov DA, Mironov AA, & Gelfand MS (2004)
Riboswitches: the oldest mechanism for the regulation of gene expression? Trends
Genet 20(1):44-50
26. Batey RT (2006) Structures of regulatory elements in mRNAs. Curr Opin Struct
Biol 16(3):299-306
27. Sudarsan N, Barrick JE, & Breaker RR (2003) Metabolite-binding RNA domains
are present in the genes of eukaryotes. RNA 9(6):644-647
28. Kubodera T, et al. (2003) Thiamine-regulated gene expression of Aspergillus
oryzae thiA requires splicing of the intron containing a riboswitch-like domain in
the 5'-UTR. FEBS Lett 555(3):516-520
29. Montange RK & Batey RT (2006) Structure of the S-adenosylmethionine
riboswitch regulatory mRNA element. Nature 441(7097):1172-1175
30. Roth A, et al. (2007) A riboswitch selective for the queuosine precursor preQ1
contains an unusually small aptamer domain. Nature structural & molecular
biology 14(4):308-317
31. Mandal M, et al. (2004) A glycine-dependent riboswitch that uses cooperative
binding to control gene expression. Science 306(5694):275-279
32. Bengert P & Dandekar T (2004) Riboswitch finder--a tool for identification of
riboswitch RNAs. Nucleic Acids Res 32:W154-159
33. Ditzler MA, Aleman EA, Rueda D, & Walter NG (2007) Focus on function:
single molecule RNA enzymology. Biopolymers 87(5-6):302-316

21
34. Rodnina MV, Beringer M, & Wintermeyer W (2006) Mechanism of peptide bond
formation on the ribosome. Q Rev Biophys 39(3):203-225
35. Ogle JM & Ramakrishnan V (2005) Structural insights into translational fidelity.
Annu Rev Biochem 74:129-177
36. Ramakrishnan V (2002) Ribosome structure and the mechanism of translation.
Cell 108(4):557-572
37. Blanchard SC, Kim HD, Gonzalez RL, Jr., Puglisi JD, & Chu S (2004) tRNA
dynamics on the ribosome during translation. Proc Natl Acad Sci U S A
101(35):12893-12898
38. Munro JB, Altman RB, O'Connor N, & Blanchard SC (2007) Identification of two
distinct hybrid state intermediates on the ribosome. Mol Cell 25(4):505-517
39. Fire A, et al. (1998) Potent and specific genetic interference by double-stranded
RNA in Caenorhabditis elegans. Nature 391:806-881.
40. de Vries W, et al. (2008) Increased virus replication in mammalian cells by
blocking intracellular innate defense responses. Gene Ther 15(7):545-552
41. Tiemann K & Rossi JJ (2009) RNAi-based therapeutics-current status, challenges
and prospects. EMBO Mol Med 1(3):142-151
42. Napoli C, Lemieux C, & Jorgensen R (1990) Introduction of a Chimeric Chalcone
Synthase Gene into Petunia Results in Reversible Co-Suppression of Homologous
Genes in trans. Plant Cell 2(4):279-289
43. Zamore PD, Tuschl T, Sharp PA, & Bartel DP (2000) RNAi: Double-stranded
RNA directs the ATP-dependent cleavage of mRNA at 21-23 nucleotide intervals.
. Cell (101):25-33.

22
44. S. M. Elbashir JH, W. Lendeckel, A. Yalcin, Klaus Weber, T. Tuschl, (2001)
Duplexes of 21-nucleotide RNAs mediate RNA interference in cultured
mammalian cells. Nature 411:494-498.
45. Carthew RW & Sontheimer EJ (2009) Origins and Mechanisms of miRNAs and
siRNAs. Cell 136(4):642-655
46. Chellappan P, Vanitharani R, & Fauquet CM (2005) MicroRNA-binding viral
protein interferes with Arabidopsis development. Proc Natl Acad Sci U S A
102(29):10381-10386
47. Baulcombe D (2004) RNA silencing in plants. Nature 431:356-363
48. Ding SW & Voinnet O (2007) Antiviral immunity directed by small RNAs. Cell
130(3):413-426
49. Ji X (2008) The mechanism of RNase III action: how dicer dices. Curr Top
Microbiol Immunol 320:99-116
50. Siomi H & Siomi MC (2009) On the road to reading the RNA-interference code.
Nature 457(7228):396-404
51. Liu J, et al. (2004) Argonaute2 is the catalytic engine of mammalian RNAi.
Science 305(5689):1437-1441
52. Meister G, et al. (2004) Human Argonaute2 mediates RNA cleavage targeted by
miRNAs and siRNAs. Mol Cell 15(2):185-197
53. Yang J & Yuan YA (2009) A structural perspective of the protein-RNA
interactions involved in virus-induced RNA silencing and its suppression.
Biochim Biophys Acta 1789(9-10):642-652
23
54. Hammond SM, Boettcher S, Caudy AA, Kobayashi R, & Hannon GJ (2001)
Argonaute2, a link between genetic and biochemical analyses of RNAi. Science
293(5532):1146-1150
55. Tahbaz N, et al. (2004) Characterization of the interactions between mammalian
PAZ PIWI domain proteins and Dicer. EMBO Rep 5(2):189-194
56. Liu Q, et al. (2003) R2D2, a bridge between the initiation and effector steps of the
Drosophila RNAi pathway. Science 301(5641):1921-1925
57. Liu X, et al. (2007) Dicer-1, but not Loquacious, is critical for assembly of
miRNA-induced silencing complexes. RNA 13(12):2324-2329
58. Gregory RI, Chendrimada TP, Cooch N, & Shiekhattar R (2005) Human RISC
couples microRNA biogenesis and posttranscriptional gene silencing. Cell
123(4):631-640
59. Chendrimada TP, et al. (2005) TRBP recruits the Dicer complex to Ago2 for
microRNA processing and gene silencing. Nature 436(7051):740-744
60. Kim DH, et al. (2005) Synthetic dsRNA Dicer substrates enhance RNAi potency
and efficacy. Nat Biotechnol 23(2):222-226
61. Siolas D, et al. (2005) Synthetic shRNAs as potent RNAi triggers. Nat Biotechnol
23(2):227-231
62. Lee SK & Kumar P (2009) Conditional RNAi: towards a silent gene therapy. Adv
Drug Deliv Rev 61(7-8):650-664
63. Grimm D (2009) Small silencing RNAs: state-of-the-art. Adv Drug Deliv Rev
61(9):672-703
24
64. Umbach JL & Cullen BR (2009) The role of RNAi and microRNAs in animal
virus replication and antiviral immunity. Genes Dev 23(10):1151-1164
65. Haasnoot J, Westerhout EM, & Berkhout B (2007) RNA interference against
viruses: strike and counterstrike. Nat Biotechnol 25(12):1435-1443
66. Li F & Ding SW (2006) Virus counterdefense: diverse strategies for evading the
RNA-silencing immunity. Annu Rev Microbiol 60:503-531
67. Qu F & Morris TJ (2005) Suppressors of RNA silencing encoded by plant viruses
and their role in viral infections. FEBS Lett 579(26):5958-5964
68. Roth BM, Pruss GJ, & Vance VB (2004) Plant viral suppressors of RNA
silencing. Virus Res 102(1):97-108
69. Voinnet O (2001) RNA silencing as a plant immune system against viruses.
Trends Genet 17(8):449-459
70. Csorba T, Bovi A, Dalmay T, & Burgyan J (2007) The p122 subunit of Tobacco
Mosaic Virus replicase is a potent silencing suppressor and compromises both
small interfering RNA- and microRNA-mediated pathways. J Virol
81(21):11768-11780
71. Lakatos L, et al. (2006) Small RNA binding is a common strategy to suppress
RNA silencing by several viral suppressors. EMBO J 25(12):2768-2780.
72. Lozsa R, Csorba T, Lakatos L, & Burgyan J (2008) Inhibition of 3' modification
of small RNAs in virus-infected plants require spatial and temporal co-expression
of small RNAs and viral silencing-suppressor proteins. Nucleic Acids Res
36(12):4099-4107

25
73. Merai Z, et al. (2006) Double-stranded RNA binding may be a general plant RNA
viral strategy to suppress RNA silencing. J Virol 80(12):5747-5756
74. Chu M, Desvoyes B, Turina M, Noad R, & Scholthof HB (2000) Genetic
dissection of tomato bushy stunt virus p19-protein mediated host-dependent
symptom induction and systemic invasion. Virology (266):79-87.
75. Omarov R, Sparks K, Smith L, Zindovic J, & Scholthof HB (2006) Biological
relevance of a stable biochemical interaction between the tombusvirus-encoded
P19 and short interfering RNAs. J Virol 80(6):3000-3008
76. Silhavy D, et al. (2002) A viral protein suppresses RNA silencing and binds
silencing-generated, 21- to 25-nucleotide double-stranded RNAs. EMBO J.
21:3070-3080.
77. Havelda Z, Hornyik C, Valoczi A, & Burgyan J (2005) Defective Interfering
RNA Hinders the Activity of a Tombusvirus-Encoded Posttranscriptional Gene
Silencing Suppressor. J Virol (79):450-457.
78. Dunoyer P, Lecellier CH, Parizotto EA, Himber C, & Voinnet O (2004) Probing
the microRNA and small interfering RNA pathways with virus-encoded
suppressors of RNA silencing. Plant Cell 16(5):1235-1250
79. Zheng N, et al. (2009) Boosted expression of the SARS-CoV nucleocapsid
protein in tobacco and its immunogenicity in mice. Vaccine 27(36):5001-5007
80. Vargason JM, Szittya G, Burgyan J, & Hall TM (2003) Size selective recognition
of siRNA by an RNA silencing suppressor. Cell (115):799-811.
81. Ye K, Malinina L, & Patel DJ (2003) Recognition of siRNA by a viral suppressor
of RNA silencing. Nature (426):874-878.

26
82. Xia Z, Zhu Z, Zhu J, & Zhou R (2009) Recognition mechanism of siRNA by viral
p19 suppressor of RNA silencing: a molecular dynamics study. Biophys J
96(5):1761-1769
83. Chapman EJ, Prokhnevsky AI, Gopinath K, Dolja VV, & Carrington JC (2004)
Viral RNA silencing suppressors inhibit the microRNA pathway at an
intermediate step. Genes Dev 18(10):1179-1186
84. Surridge C (2002) Computational Biology. Nature 420(6912 ).
85. Jost C, Devulder G, Vucetich JA, Peterson R, & Arditi R (2005) The wolves of
Isle Royale display scale-invariant satiation and density dependent predation on
moose. Amimal Ecology 74(5):809-816.
86. Lotka AJ (1910) Contribution to the Theory of Periodic Reaction. J. Phys. Chem
14(3):271-274.
87. Lakatos L, Szittya G, Silhavy D, & Burgyan J (2004) Molecular mechanism of
RNA silencing suppression mediated by p19 protein of tombusviruses. EMBO J
23(4):876-884.

27
Chapter 2:
CATCH AND RELEASE: VIRAL RNA SILENCING SUPPRESSOR COMPETES
WITH HUMAN DICER AND IMPAIRS RISC ASSEMBLY BY REVERSIBLY
BINDING SIRNA
2.1 Introduction
Over the past decade, RNA interference (RNAi) has become recognized as both
an innate eukaryotic immune response against viral pathogens or transposons, and a
benchmark laboratory and potentially clinical tool to control gene expression (1-6).
During viral infection, eukaryotes activate RNAi where viral RNA is specifically
recognized by the cytoplasmic RNase III-type endonuclease Dicer and degraded by an
RNA-induced silencing complex (RISC). Dicer cleaves exposed stretches of double-
stranded RNA into small interfering RNAs (siRNAs) 21-24 nucleotides in length
(depending on species). Dicer then delivers the double-stranded siRNA to the RNA-
induced silencing complex (RISC) (7, 8), where the passenger strand of the duplex is
cleaved and released while the guide strand is retained to guide specific cleavage of
complementary viral RNA genomes or transcripts (9, 10). Dicer is thus thought to play a
critical dual role in RNAi by both generating virus-specific siRNA duplexes and
assembling them with the necessary protein components into active RISC (11).

28
To subvert the host RNAi response many viruses have evolved small proteins that
act as RNA silencing suppressors (RSSs) (12-14). One of the best characterized RSSs is
exemplified in the plant pathogen Carnation Italian Ringspot Virus (CIRV), which
encodes a 19 kDa protein termed p19, an important pathogenicity factor that is highly
conserved among all tombusviruses (15). Crystal structures (16, 17) and recent molecular
dynamics simulations (18) show that homodimers of p19 bind a single siRNA duplex in a
positively charged surface cleft (Figure 2.1A). Pairs of tryptophan residues stack on both
terminal base pairs to establish a sequence-independent, caliper-like size selection for
siRNA duplexes with 19 base pairs and 2-nucleotide long 3´-overhangs. Sequestration
and binding of Dicer-generated siRNAs by p19 has been observed to correlate with
reduced viral RNA degradation, systemic symptom spread, and sustainability of the viral
phenotype after infection (19-24). Previous electrophoretic mobility shift assays
(EMSAs) have suggested that the affinity of dimeric p19 for siRNA is high with an
apparent equilibrium dissociation constant of KD,app = 0.17 ± 0.02 nM (16). These
findings are consistent with a widely accepted sequestration model wherein the p19 dimer
more or less quantitatively binds siRNA duplexes to suppress RNAi (15, 21). Such
double-stranded RNA binding is considered to be the most common RSS mechanism (26-
29), yet measurements of siRNA binding and dissociation kinetics to directly test the
quantitative sequestration model have not been reported for any RSS protein.
Here we develop solution-based fluorescence quenching assays that observe
siRNA:p19 (SP) binding to be readily reversible with not only a rapid binding rate
constant ((1.69 ± 0.07)×108 M-1s-1), but also a dissociation rate constant (koff = 0.062 ±
0.002 s-1) markedly faster than those of slow-release nucleic acid binding proteins (30,

29
31). Our results are consistent, within error, with the high apparent affinity measured in
EMSAs, yet also call into question a simple sequestration model. Where irreversible
binding would require the virus to generate sufficient quantities of p19 dimer to
quantitatively bind (nearly) all small RNAs produced enzymatically by either Dicer
cleavage or the amplification effected in a plant cell through RNA-dependent RNA
polymerase (3), reversibility of SP complex formation opens the possibility that multiple
turnover may potentiate p19’s efficacy as RSS. In particular, if p19 were to disrupt the
siRNA:Dicer (SD) interaction via multiple turnover, it would potently interfere with the
role of Dicer as obligatory RISC assembly factor.
Consistent with such a mechanism of p19 action, we observe efficient competition of
p19 with recombinant human Dicer for siRNA binding, and prominent disruption of
RISC assembly complexes observed in human HeLa cell extract. Mathematical modeling
demonstrates that the Dicer competition data are only accurately reproduced assuming
the formation of a transient ternary complex, siRNA:Dicer:p19 (SDP). Taken together, a
multiple-turnover “catch and release” mechanism emerges where p19 repeatedly
promotes dissociation of SD complexes to efficiently suppress Dicer-mediated RISC
assembly.
2.2 Materials and Methods
Sources of p19, Dicer, and RNA. Purified p19 protein was prepared as
previously described (16), and its dimer concentration was measured by Bradford assay.
Active recombinant human Dicer in a crude extract was obtained from Genlantis at a

30
purity of 5%; it is not known what other RISC related components this extract may
contain. The concentration of total protein was verified by Bradford assay. All RNAs
were synthesized by the HHMI Biopolymer/Keck Foundation Biotechnology Resource
Laboratory at the Yale University School of Medicine, then deprotected and purified as
previously described (34, 35). Sequences were derived from the firefly luciferase gene
(36) and were as follows: Sense strand 5´-P-CGU ACG CGG AAU ACU UCG AAA-3´;
antisense strand 5´-P-UCG AAG (Fluorescein-dT)AU UCC GCG (Amino C6-dT)AC
GUG-3´, where P denotes a 5´-phosphate, and Fluorescein-dT and Amino C6-dT denote
the phosphoramidites of the same name from Glen Research; the antisense strand was
also synthesized with only one or no modification wherein U replaced the modified dT.
Where needed, tetramethylrhodamine was coupled to the Amino C6 linker and the RNA
purified as described (34).
Steady-State Fluorescence Spectroscopy. Standard fluorescence measurements
were performed on an Aminco Bowman spectrofluorometer (Thermo Scientific) at 37 oC.
siRNA duplexes were formed by mixing an excess of 100 nM of unlabeled sense strand
with 50 nM labeled sense strand in near-physiologic standard buffer (50 mM Tris-
Acetate, pH 7.4, 80 mM KCl, 20 mM NaCl, 1 mM MgCl2, 1 mM DTT, 0.02% (v/v)
Tween 20), heat annealing for 2 min at 70 oC, and cooling to room temperature over 5
min. Fluorescein/tetramethylrhodamine doubly-labeled siRNAs were excited at 490 nm
(4 nm slit width) and emission alternately detected at 520 nm (for fluorescein, F) and 585
nm (8 nm slit width, for tetramethylrhodamine, T) to calculate the T/F ratio; F or T
singly-labeled siRNAs were excited/detected at 490/520 nm or 565/585nm, respectively.

31
In a typical experiment, p19 was added to 50 nM labeled siRNA and mixed manually to a
final concentration of 500 nM unless otherwise indicated. For a chase experiment,
unmodified siRNA duplex (formed through annealing the unlabeled composite sense and
antisense RNA strands in a 2:1 ratio in standard buffer) was added to a final
concentration of 3 μM. Saturation by the chase was ensured by triplicate trials using 500
nM, 750 nM, 1.5 μM, and 3 μM (Figure A1).
To observe fast SP complex formation, siRNA samples were prepared as above in
standard buffer to a final concentration of 40 nM. In standard buffer p19 was added to
varying (at least 8-fold) final excess concentrations (0.32 – 1.76 μM) at 37 oC in a
KinTek PMA23B stopped-flow spectrofluorometer while exciting at 520 nm and
detecting emission at 585 nm. All time course were fit with single-exponential increase or
decrease functions in Origin (OriginLab) as described (37).
Time-Resolved FRET. Time-resolved donor (fluorescein, F) fluorescence decays
were collected in the presence and absence of acceptor (tetramethylrhodamine, T) using
time-correlated single-photon counting, as previously described (38, 39). As before, the
donor decay in the presence of acceptor was modeled as a weighted average of the decays
for each donor-acceptor distance in the ensemble of molecules assuming a three-
dimensional Gaussian distance distribution with a Förster distance of 54 Å between F and
T (38, 39).
EMSA. For radioactive EMSAs the non-phosphorylated antisense strand was first
5´-32P labeled with T4 polynucleotide kinase (PNK) and γ-32P-ATP at an RNA

32
concentration of 800 nM. PNK was inactivated by heating to 90 °C for 10 min, then the
5´ phosphorylated complementary strand was added in 2-fold molar excess and the
reaction slowly cooled to room temperature to anneal the two strands. The siRNA duplex
was further purified by nondenaturing, 20% (w/v) polyacrylamide gel electrophoresis.
The duplex siRNA was cut out, eluted overnight into 1 mM EDTA at 4 oC, ethanol
precipitated, and dissolved in RNase-free water. Scintillation counting was done on a
Beckman LS6500 Multipurpose Scintillation Counter. EMSAs were performed as
described previously (16) on 10-cm non-denaturing 12% (w/v) polyacrylamide gels in
0.5x TBE (44.5 mM Tris-Borate, 1 mM EDTA) and run at 500 V and 4 oC for 2 h. Dicer
and p19 at varying final concentrations were added to radiolabeled siRNA duplex
(50,000 cpm, < 400 pM of 5´-32P labeled duplex) in 10 μL standard buffer and incubated
for 0.5 hrs. Next, 10 μL non-denaturing loading buffer (10% glycerol, 0.5x TBE, 0.025%
bromophenol blue, and 0.025% xylene cyanol) was added and each sample loaded into a
well of the EMSA gel. Competition experiments were performed by preincubating < 400
pM siRNA duplex (prepared as above) in standard buffer either with 140 nM Dicer and
increasing concentrations of p19, or with 0.17 nM or 2.5 nM p19 and increasing
concentrations of Dicer. Gels were wrapped in plastic wrap and exposed to phosphor
screens, which were scanned on a Storm 840 PhosphorImager and quantified using Image
Quant software (Molecular Dynamics). The relative fraction f of relevant protein
complexes was fit with the following hyperbolic binding isotherm to extract saturation
point fmax and half-titration point KD,app:
appDKproteinproteinff
,max ][
][+
=

33
RISC Assembly Complex Formation. To observe RISC assembly complexes
15, 50, 75% (v/v) cytosolic HeLa cell extract (Jena Bioscience) was incubated with < 400
pM siRNA duplex (prepared as above) in a final volume of 10 μL HeLa buffer [8% (v/v)
Lysis Buffer (23.7 mM HEPES, pH 7.5, 79 mM potassium acetate, 1.58 mM magnesium
acetate, 5 mM DTT, and 1 mg/ml Perabloc SC (Roche)), supplemented with 20% (v/v)
5x RNAi mix (125 mM creatine phosphate, 5 mM ATP, 25 mM DTT), 2% (w/v) creatine
kinase, and 20% (v/v) RNA guard RNase Inhibitor (GE Bioscience)] for 2 h at 4 oC,
unless otherwise specified. For competition experiments, p19 was added in increasing
concentrations to the HeLa cell extract/siRNA mixture either immediately or after a 2 h
preincubation. Time courses were stopped by direct loading onto a running
nondenaturing 4% (w/v) polyacrylamide gel in 0.5x TBE (44.5 mM Tris-Borate, 1 mM
EDTA), run at ~50 mW/cm2 and 4 oC. For comparison with a previous assay, 50 and
75% (v/v) Hela cell extract was incubated with siRNA as described in (40) for 1 h at 4 oC
to 37 oC and analyzed by EMSA, yielding similar results (Fig S3). 15% (v/v) extract was
preferred for most of our work due to the better pH control afforded by this lower
concentration and to better conserve material. For antibody supershift EMSA, 24 µg of
cytosolic HeLa cell extract was pre-incubated with 0.8 µg or 1.6 µg of anti-Dicer rabbit
polyclonal antibody (Santa Cruz Biotechnology, Inc.) and 0.8 µg or 1.6 µg of an
unrelated control antibodies namely anti- DsRed rabbit polyclonal antibody (Clonetech
Laboratories, Inc.) and anti-β actin mouse monoclonal antibody (Sigma-Aldrich, Inc.) for
2 hr, at 4 oC prior to the RISC assembly assay. Final volume was (60) µL per lane.
Nondenaturing 4% (w/v) polyacrylamide gel electrophoresis was used to resolve these
complexes as described above. Time courses and titration curves were fit as above.
34
Western Blots for Dicer Detection. RISC assembly complexes were formed as
described above, but scaled up 6-fold. Gels were soaked in 0.1% (w/v) SDS for 15 min
and then electroblotted in Tris-Glycine transfer buffer (25 mM Tris, 25 mM Glycine)
onto a PVDF (Polyvinylidene Fluoride) membrane (Immobilon-P Membrane, Millipore)
over 75 min at 300 mA, using a Bio-Rad Trans-Blot SD semi-dry transfer cell per the
manufacturer’s instructions. After transfer, the proteins were fixed to the membrane by
incubating in 5-10% (v/v) acetic acid, rinsing with deionized water, and air drying. The
membrane was probed with a rabbit primary antibody against Dicer (Santa Cruz
Biotechnology), followed by a goat anti-rabbit secondary antibody, conjugated with
horseradish peroxidase (Zymed, Invitrogen). The blot was developed using a
peroxide/enhancer solution (ECL-Plus detection, Amersham), and visualized on a
Typhoon 9410 Variable Mode Imager.
Mathematical Model Description. Details of the model used to describe p19’s
interaction with the RNAi machinery is found in Appendix B.

35
2.3 Results
Fluorescence Assays to Observe siRNA:p19 Complex Formation
We site-specifically labeled the antisense (guide) strand of an established
luciferase-targeting siRNA duplex (35, 36) with either fluorescein or
tetramethylrhodamine as fluorescence quenching probes in positions not expected to
interfere with p19 binding (Figure 2.1A). We found that only the tetramethylrhodamine
label was efficiently quenched upon p19 addition (Figure 2.1B). Addition of buffer or
other proteins such as recombinant Dicer caused no such quenching (Appendix A Figure
A1). To observe a robust quenching signal upon p19 addition, we proceeded to label with
both fluorophores together, allowing us to monitor a normalized
tetramethylrhodamine:fluorescein (T/F) fluorescence ratio that is insensitive to dilution
effects and other perturbations of an otherwise relative fluorescence signal. Next, we
tested by EMSA p19 binding of this doubly-labeled siRNA against that of the unlabeled
siRNA and detected no interference from the fluorophores (KD,app = 0.17 ± 0.03 nM in
both cases, consistent with earlier EMSA studies (16) (Figure 2.1C). Time-resolved
fluorescence resonance energy transfer (trFRET) between the two fluorophores revealed
only a small increase in fluorophore distance distribution upon p19 addition (with the
mean distance increasing from 43.4 to 44.5 Å; (Figure 2.1D), indicating that formation of
the SP complex leads to only a minor deformation of the siRNA duplex, as expected from
X-ray crystallography (16). We conclude that the doubly-labeled siRNA duplex is a
suitable reporter for formation of the siRNA:p19 interaction in solution.

36
Figure 2.1 Fluorescence assays to detect siRNA:p19 complex formation. (A) Crystal
structure of p19 (blue) bound to an siRNA (grey). The nucleotides to which the
fluorophores fluorescein (F) and tetramethylrhodamine (T) are attached are highlighted in
green and red, respectively. (B) The T-only labeled siRNA (red) is quenched upon p19
addition, while the F-only labeled siRNA (green) is unaffected by p19. (C) EMSA
analysis shows that the doubly-labeled ft-siRNA (red) binds to p19 with the same affinity
as the unlabeled siRNA (black). (D) Time-resolved FRET measures the F:distances for
the single-stranded, protein-free double-stranded, and p19-bound double-stranded siRNA
35 Å, 43.4 Å, and 44.5 Å, respectively.

37
p19 Binds siRNA Rapidly and Reversibly
Addition of increasing excess concentrations of p19 to the doubly-labeled siRNA
led to an increase in the pseudo-first order rate constant of tetramethylrhodamine
quenching as monitored by the T/F ratio, yielding a bimolecular binding rate constant of
kon = (1.69 ± 0.07) × 108 M-1s-1 (Figure 2.2A,B). Next, dissociation of the preformed SP
complex was monitored upon addition of a large excess of unlabeled siRNA (chase),
yielding a dissociation rate constant of koff = 0.062 ± 0.002 s-1 (Figs. 2C and S1).
Together with the rapid kon, a solution-based dissociation equilibrium constant of koff/kon
= KD = 0.37 ± 0.08 nM is obtained, within 2-fold of the EMSA predicted value (0.17
nM), attesting to a high-affinity, yet also notably reversible siRNA:p19 binding mode.
p19 Efficiently Competes with Recombinant Human Dicer for siRNA Binding
The critical dual role of Dicer in RNAi as both the enzyme that produces siRNAs
and as a RISC assembly factor (11) suggests the siRNA:Dicer (SD) interaction as a
particularly vulnerable step during RNA silencing. Previous studies in embryo extracts of
the fruitfly Drosophila have shown that p19 suppresses RNA silencing by competing with
the Dcr2-R2D2 complex (21, 27). To determine whether p19 also competes with human
Dicer for siRNA, we employed EMSA using radio-labeled siRNA duplexes and
recombinant human Dicer (available as an active crude extract from Genlantis, see
Methods). We measured the apparent equilibrium dissociation constant of the human SD
complex as KD,app = 3.7 ± 0.4 nM (Figs. 3A and S2A).

38
Figure 2.2 Kinetics of formation and dissociation of the siRNA:p19 complex. (A)
Pseudo-first order kinetics of the binding of doubly-labeled siRNA (50 nM) to excess
p19, measured through the T/F ratio during stopped-flow mixing. Scatter points denote
raw data; lines denote single-exponential fits to extract rate constants. (B) Plot of the
observed pseudo-first rate constants from panel A over the p19 concentration. The linear
fit yields the indicated bimolecular binding rate constant, kon. (C) Fluorescence detection
of the binding of doubly-labeled siRNA (50 nM) to p19 (500 nM) and of complex
dissociation upon addition of an unlabeled siRNA chase (3 μM). A single-exponential fit
(red line) yields the indicated dissociation rate constant, koff.

39
The presence of a low concentration of p19 (0.17 nM), equivalent to the KD,app of
the SP complex, weakened this interaction by >25-fold to ~100 nM (Figs. 3A and S2B).
The presence of a saturating concentration of p19 (2.5 nM) weakened the interaction still
further by >270-fold to an estimated lower limit of ~1.0 μM (Figs. 3A and S2C). These
findings led us to hypothesize that p19 can function to inhibit RNAi in humans by
interrupting the SD complex before Dicer can hand off siRNA to RISC. Reciprocal
competition experiments showed that the presence of even saturating concentrations (140
nM) of Dicer lowered the apparent affinity of p19 for siRNA only marginally (~4-fold
from 0.17 ± 0.03 nM to 0.81 ± 0.06 nM; Figs. 3B and S2D,E), further supporting the
hypothesis that strong competition with the SD complex is an important mode of action
for p19 inhibition of RNAi in human cells.
Human siRNA-Containing Complexes Formed in Cytosolic Cell Extract are
Vulnerable to p19 Challenge
Previous studies with Drosophila extracts have shown that p19 inhibits RISC assembly
while disrupting preassembled RISC to a lesser extent (27). Our result that p19 disrupts
the complex of recombinant human Dicer with siRNA suggests that p19 may also be
effective in suppressing RISC assembly in mammals. To test this hypothesis and probe
p19’s effect on the formation of human RISC-related complexes, we used a modified in
vitro RISC assembly assay (40, 41), wherein we incubated radio-labeled siRNA duplex
with 15% (v/v) cytosolic HeLa cell extract and analyzed the products by EMSA and
autoradiography (Figure 2.4A,B).
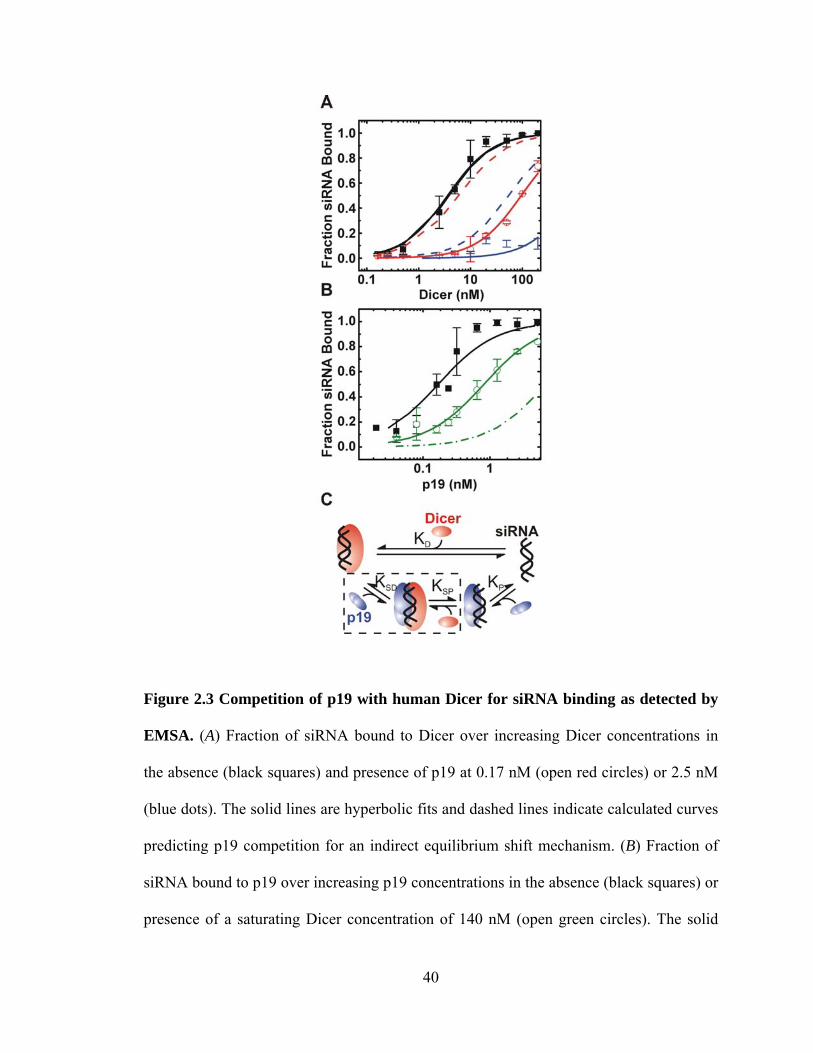
40
Figure 2.3 Competition of p19 with human Dicer for siRNA binding as detected by
EMSA. (A) Fraction of siRNA bound to Dicer over increasing Dicer concentrations in
the absence (black squares) and presence of p19 at 0.17 nM (open red circles) or 2.5 nM
(blue dots). The solid lines are hyperbolic fits and dashed lines indicate calculated curves
predicting p19 competition for an indirect equilibrium shift mechanism. (B) Fraction of
siRNA bound to p19 over increasing p19 concentrations in the absence (black squares) or
presence of a saturating Dicer concentration of 140 nM (open green circles). The solid

41
(Figure 2.3 continued) lines are hyperbolic fits and the dashed-dotted line indicates the
calculated curve assuming p19 and Dicer competition is an indirect equilibrium shift
only. Representative EMSA gel images are shown in (Figure A2). (C) Steady-state two
protein competition model.
Three distinct siRNA-containing complexes were observed that correspond to
those previously observed, including a slowly-migrating complex D that is thought to
contain Dicer, as well as two faster migrating bands termed C1 and C2 (21, 42) (Figure
2.4B). The normalized fraction of complex C2 decreases over a 2-h period, whereas the
complex C1 and D fractions increase (with estimated rate constants of 2 × 10⁻³ s-1, 0.8 ×
10-3 s-1, and 0.4 × 10⁻³ s-1, respectively, (Figure 2.4A).To test for the presence of Dicer
we performed supershift assays with anti-Dicer polyclonal antibody and found that only
complex D specifically supershifts with this antibody (Figure 2.4C). Similarly, Dicer is
detected by Western blot in complex D only (Figure A4). Notably, adding increasing p19
concentrations to the cell extract prior to siRNA addition increasingly impairs the
formation of all three siRNA-containing complexes, concomitant with an accumulation
of the competing SP complex (Figure 2.4D,E). When p19 is added to the RISC assembly
assay after 2 h of pre-incubation with siRNA, the formation of particularly the Dicer-
containing complex D is inhibited to a lesser extent (Figure 2.4F,G). Similar results were
obtained at higher HeLa cell extract concentrations and temperatures (Figure A3).

42

43
Figure 2.4 Competition of p19 with human siRNA-containing complexes found in
cytosolic HeLa cell extract. (A) Normalized fraction of siRNA bound to complexes D
(green), C2 (red), and C1 (black), where the highest point is normalized to unity in each
complex over time, as derived from the gel in panel B. The relative abundances of C1 and
complex D increase over time at estimated rate constants of 8 × 10⁻⁴ s-1 and 4 × 10⁻⁴ s-1,
respectively, whereas C2 decreases in relative abundance at a rate constant of 2 × 10⁻³ s-1.
(B) Formation of complexes D, C2, and C1 after 10, 30, 60 and 120 min incubation of
siRNA in cytosolic HeLa cell extract. Samples were loaded onto a running 4% native
polyacrylamide gel, leading to the indicated differences in migration. (C) Supershift
assay of 5´ end labeled siRNA incubated with cytosolic HeLa cell extract. Dicer
containing complex D, shifts in the presence of an anti-Dicer antibody (lanes 3 and 4),
where 0.8 µg or 1.6 µg of antibody is added respectively. Lanes 1, 5 and 6 indicate the
mobility of the complexes in the absence of any antibody. Lanes 9-12 are the negative
controls with 0.8 µg or 1.6 µg of �- actin (9-10) and DsRed (11-12) antibodies
respectively. (D) Quantification of the normalized fraction of siRNA bound in each
complex, as derived from gels as in panel E. Fractions were normalized to the zero time
point. (E) Formation of complexes after 2.5 h incubation of siRNA in cytosolic HeLa cell
extract, and increasing concentrations of p19. (F) Quantification of the normalized
fraction of siRNA bound in each complex, as derived from gels as in panel E, normalized
as in D. (G) Formation of complexes D, C1, and C2 after 2 h incubation of siRNA in
cytosolic HeLa cell extract, followed by the addition of increasing concentrations of p19
and further incubation for 30 min.

44
Modeling Supports Formation of a Transient Ternary siRNA:Dicer:p19 Complex
The mechanism of competition between p19 and human Dicer can be determined
from mathematically modeling the two possible modes of competition for a two-protein-
single-substrate system. First, competition may occur through a dissociative binding
mode, where the higher affinity protein shifts the relative equilibrium of the system by
binding all available substrate as it dissociates from the competitor, thus establishing a
new equilibrium position (Figure 2.3C). In the case of p19 and Dicer, siRNAs are pre-
associated with Dicer at the onset, due to their cleavage from longer RNAs, making such
dissociative binding by p19 relatively fast only if spontaneous dissociation from Dicer is
rapid. Second, competition may occur through formation of a ternary complex
intermediate involving siRNA, Dicer, and p19 (Figure 2.3C). Using the previously
determined gel-based apparent dissociation equilibrium constants for p19 (KD,app = 0.17 ±
0.02 nM) and Dicer (KD,app = 3.7 ± 0.4 nM), we can discriminate between these two
possible modes of competition by calculating the resulting expected siRNA:Dicer and
siRNA:p19 complex fractions and comparing them to experiments for a given set of
equilibrium conditions (43).
Assumption of the dissociative binding mechanism shows poor correlation with
experiment as the change upon adding Dicer is consistently overestimated (Figure 2.3A),
while the change upon adding p19 is consistently underestimated (Figure 2.3B). This
poor correlation suggests that ternary complex formation is needed to explain the
observed efficient disruption of the siRNA:Dicer complex in the presence of p19. The
addition of ternary complex formation creates a thermodynamic cycle that requires the

45
ratio of dissociation constants KD/KSP to equal that of KP/KSD (44). Rearranging and
using the values of KD and KP we find that KSP/KSD = KD/KP = 21.6 and therefore KSP =
21.6 KSD. This result suggests that the dissociation of the ternary complex into the binary
siRNA:p19 complex is >20-fold more likely than dissociation into the siRNA:Dicer
complex, indicating that siRNAs can indeed be effectively shuttled toward the p19 bound
state by assuming transient formation of a ternary siRNA:Dicer:p19 complex. This result
correlates well with experiment and explains both the weak effect that Dicer addition has
on the siRNA:p19 complex and the large effect that p19 addition has on the siRNA:Dicer
complex (Figure 2.3A,B). A similar result is observed when p19 is placed in the context
of the RNAi pathway (Appendix B: Model Description).
2.4 Discussion
The small, positive-sense, single-stranded RNA genome of tombusviruses
encodes p19, a RSS thought critical for symptom spread and cytotoxicity of this class of
plant pathogens (19, 20, 23, 24) through its ability to bind and thus sequester Dicer-
generated siRNAs (15, 21). To better understand the basis of the cytotoxicity of CIRV’s
p19, we studied its siRNA binding properties through fluorescence quenching assays in
combination with radioactive EMSAs. Noticeable dissociation of an siRNA from p19
(koff = 0.062 ± 0.002 s-1) is counterbalanced by fast association to yield a solution based
dissociation equilibrium constant (KD = 0.37 ± 0.08 nM; Figure 2.2), within 2.2-fold of
the high affinity previously deduced in EMSAs (16). The off rate for p19 binding of
siRNA is considerably faster than some proteins considered to ’irreversibly bind’ their

46
nucleic acid binding partners with dissociation rate constants on the order of 10-4 s-1 (30,
31, 45, 46).
The rate and equilibrium constants for p19 resemble those of HIV-1 protein Rev
for interaction with Rev Response Element (RRE) RNA (kon = 5.3 x10⁸ M-1 s-1, koff =
0.14 s-1, perhaps due to the similar relatively non-sequence specific binding of a small
protein to a (partially) base paired RNA duplex (47).
The presence of low concentrations of p19 dramatically weakens the interaction
of human Dicer with its siRNA product (25 to >270-fold, depending on the p19
concentration, Figure 2.3A). Conversely, the presence of saturating concentrations of
Dicer only slightly lowers (~4-fold) the affinity of p19 for siRNA (Figure 2.3B),
supporting the hypothesis that strong competition with the SD complex is an important
mode of p19 action in mammals in vivo. Assembly assays show that p19 also
significantly disrupts RISC-related human siRNA-protein complexes (Figure 2.4). Our
experimental results inform mathematical modeling of p19-Dicer competition and the
steady-state kinetic interactions involving p19, siRNA, Dicer, RISC, and viral (m)RNA.
We determine that the minimal model necessary to achieve p19 suppression and Dicer
competition includes a ternary complex between Dicer, p19, and siRNA substrates
(Figure 2.3).
Several implications for the struggle between the viral p19 and the cellular RNAi
machinery arise from our work. First, our experimental data suggest that the observed
efficient competition of p19 with the siRNA:Dicer complex (Figure 2.3) and thus
resulting Dicer-containing RISC assembly complexes (Figure 2.4) targets a particularly
critical step on the path to an activated RISC. Recent 3D reconstructions from negatively-

47
stained electron microscopy images of human Dicer complexes depict it as a fist-like
shape with a central flat surface that is thought to bind the siRNA (48, 49). This
architecture along with the known binding mode of p19 leaves open the possibility that
p19 could bind the opposite face of the siRNA in a ternary complex with Dicer. Notably,
we did not observe formation of a super-shifted band as indicative of such a ternary
complex in our EMSAs with siRNA, p19, and human Dicer (Figure 2.4D,G), however,
the complex may be too short-lived or our EMSA too low in resolution for the complex
to be detected.
Second, the previously proposed simple sequestration model would require
stoichiometric p19 concentrations relative to all siRNA duplexes, native to CIRV or not,
that are generated by Dicer, as well as all miRNA duplexes (22, 25), defective interfering
RNAs (23), and the siRNA amplification products generated in plant cells by RNA-
dependent RNA polymerase activity (3). Our finding that formation of the high-affinity
siRNA:p19 complex is readily reversible (Figure 2.2) while still interfering with siRNA
binding by Dicer and RISC-related assembly complexes in vitro (Figures 2.3 and 2.4)
raises the possibility that sub-stoichiometric p19 concentrations may suffice in vivo to
efficiently prevent siRNAs from assembling into RISC, enabling the virus to keep pace
with the amplified host response during systemic RNAi self-defense of the plant host
against CIRV (50).
Third, while our results have an immediate impact on our understanding of the
physicochemical properties and biological function of p19, a more practical consideration
also arises from our work. The future of RNAi based strategies may well be dependent on
the ability to control and predict the relative intracellular expression levels of RISC

48
components and potential therapeutics (51, 52). CIRV p19 and other RSS’s have been
shown to aid in the transfection and difficult over-expression of alpha-, adeno-, and
lentiviruses used in gene therapy and in plant based vaccines, through their ability to
suppress the intracellular RNAi immune response (51). For such immunosuppression to
be effective, dosing of the RSS is important, analogous to immunosuppressants in
modern organ transplant surgery.
2.5 Acknowledgements
I would like to thank Vishalakshi Krishnan for all her hard work and contributions to
(Figure 2.4) and (Figure A4). We thank Jeffrey Vargason and Traci Hall for the generous
provision of purified p19 protein as well as Patrick Nelson for helpful discussions on
mathematical modeling. Also we appreciate Jennifer Doudna’s lab for providing
analytical amounts of purified Dicer and Ago 2 protein.

49
2.6 References
1. Fire A, et al. (1998) Potent and specific genetic interference by double-stranded
RNA in Caenorhabditis elegans. Nature 391:806-881.
2. Castanotto D & Rossi JJ (2009) The promises and pitfalls of RNA-interference-
based therapeutics. Nature 457(7228):426-433
3. Carthew RW & Sontheimer EJ (2009) Origins and Mechanisms of miRNAs and
siRNAs. Cell 136(4):642-655
4. Lee SK & Kumar P (2009) Conditional RNAi: towards a silent gene therapy. Adv
Drug Deliv Rev 61(7-8):650-664
5. Grimm D (2009) Small silencing RNAs: state-of-the-art. Adv Drug Deliv Rev
61(9):672-703
6. Umbach JL & Cullen BR (2009) The role of RNAi and microRNAs in animal
virus replication and antiviral immunity. Genes Dev 23(10):1151-1164
7. Collingwood MA, et al. (2008) Chemical modification patterns compatible with
high potency dicer-substrate small interfering RNAs. Oligonucleotides 18(2):187-
200
8. Kim DH, et al. (2005) Synthetic dsRNA Dicer substrates enhance RNAi potency
and efficacy. Nat Biotechnol 23(2):222-226
9. Ji X (2008) The mechanism of RNase III action: how dicer dices. Curr Top
Microbiol Immunol 320:99-116
10. Siomi H & Siomi MC (2009) On the road to reading the RNA-interference code.
Nature 457(7228):396-404

50
11. Jaskiewicz L & Filipowicz W (2008) Role of Dicer in posttranscriptional RNA
silencing. Curr Top Microbiol Immunol 320:77-97
12. Qu F & Morris TJ (2005) Suppressors of RNA silencing encoded by plant viruses
and their role in viral infections. FEBS Lett 579(26):5958-5964
13. Roth BM, Pruss GJ, & Vance VB (2004) Plant viral suppressors of RNA
silencing. Virus Res 102(1):97-108
14. Voinnet O (2001) RNA silencing as a plant immune system against viruses.
Trends Genet 17(8):449-459
15. Scholthof H (2006) The Tombusvirus-encoded P19: from irrelevance to elegance.
Nat Rev Microbiol (4):405-411.
16. Vargason JM, Szittya G, Burgyan J, & Hall TM (2003) Size selective recognition
of siRNA by an RNA silencing suppressor. Cell (115):799-811.
17. Ye K, Malinina L, & Patel DJ (2003) Recognition of siRNA by a viral suppressor
of RNA silencing. Nature (426):874-878.
18. Xia Z, Zhu Z, Zhu J, & Zhou R (2009) Recognition mechanism of siRNA by viral
p19 suppressor of RNA silencing: a molecular dynamics study. Biophys J
96(5):1761-1769
19. Chu M, Desvoyes B, Turina M, Noad R, & Scholthof HB (2000) Genetic
dissection of tomato bushy stunt virus p19-protein mediated host-dependent
symptom induction and systemic invasion. Virology (266):79-87.
20. Silhavy D, et al. (2002) A viral protein suppresses RNA silencing and binds
silencing-generated, 21- to 25-nucleotide double-stranded RNAs. EMBO J.
21:3070-3080.

51
21. Lakatos L, Szittya G, Silhavy D, & Burgyan J (2004) Molecular mechanism of
RNA silencing suppression mediated by p19 protein of tombusviruses. EMBO J
23(4):876-884.
22. Dunoyer P, Lecellier CH, Parizotto EA, Himber C, & Voinnet O (2004) Probing
the microRNA and small interfering RNA pathways with virus-encoded
suppressors of RNA silencing. Plant Cell 16(5):1235-1250
23. Havelda Z, Hornyik C, Valoczi A, & Burgyan J (2005) Defective Interfering
RNA Hinders the Activity of a Tombusvirus-Encoded Posttranscriptional Gene
Silencing Suppressor. J Virol (79):450-457.
24. Omarov R, Sparks K, Smith L, Zindovic J, & Scholthof HB (2006) Biological
relevance of a stable biochemical interaction between the tombusvirus-encoded
P19 and short interfering RNAs. J Virol 80(6):3000-3008
25. Chapman EJ, Prokhnevsky AI, Gopinath K, Dolja VV, & Carrington JC (2004)
Viral RNA silencing suppressors inhibit the microRNA pathway at an
intermediate step. Genes Dev 18(10):1179-1186
26. Csorba T, Bovi A, Dalmay T, & Burgyan J (2007) The p122 subunit of Tobacco
Mosaic Virus replicase is a potent silencing suppressor and compromises both
small interfering RNA- and microRNA-mediated pathways. J Virol
81(21):11768-11780
27. Lakatos L, et al. (2006) Small RNA binding is a common strategy to suppress
RNA silencing by several viral suppressors. EMBO J 25(12):2768-2780.
28. Lozsa R, Csorba T, Lakatos L, & Burgyan J (2008) Inhibition of 3' modification
of small RNAs in virus-infected plants require spatial and temporal co-expression

52
of small RNAs and viral silencing-suppressor proteins. Nucleic Acids Res
36(12):4099-4107
29. Merai Z, et al. (2006) Double-stranded RNA binding may be a general plant RNA
viral strategy to suppress RNA silencing. J Virol 80(12):5747-5756
30. Mitsis PG & Wensink PC (1989) Identification of yolk protein factor 1, a
sequence-specific DNA-binding protein from Drosophila melanogaster. J Biol
Chem 264(9):5188-5194
31. Ramsden JJ & Dreier J (1996) Kinetics of the interaction between DNA and the
type IC restriction enzyme EcoR124II. Biochemistry 35(12):3746-3753
32. Voinnet O, Rivas S, Mestre P, & Baulcombe D (2003) An enhanced transient
expression system in plants based on suppression of gene silencing by the p19
protein of tomato bushy stunt virus. Plant J 33(5):949-956
33. Zheng N, et al. (2009) Boosted expression of the SARS-CoV nucleocapsid
protein in tobacco and its immunogenicity in mice. Vaccine 27(36):5001-5007
34. Walter NG (2002) Probing RNA structural dynamics and function by
fluorescence resonance energy transfer. Curr. Protocols Nucleic Acid Chem, pp
11.10.11-11.10.23.
35. Hoerter JA & Walter NG (2007) Chemical modification resolves the asymmetry
of siRNA strand degradation in human blood serum. RNA 13(11):1887-1893
36. Martinez J, Patkaniowska A, Urlaub H, Luhrmann R, & Tuschl T (2002) Single-
stranded antisense siRNAs guide target RNA cleavage in RNAi. Cell 110:563-
574.

53
37. Gondert ME, Tinsley RA, Rueda D, & Walter NG (2006) The catalytic core
structure of the trans-acting HDV ribozyme is subtly influenced by sequence
variation outside the core. Biochemistry 45:7563-7573.
38. Rueda D, Wick K, McDowell SE, & Walter NG (2003) Diffusely bound Mg2+
ions slightly reorient stems I and II of the hammerhead ribozyme to increase the
probability of formation of the catalytic core. Biochemistry 42(33):9924-9936
39. Gerczei T, Shah BN, Manzo AJ, Walter NG, & Correll CC (2009) RNA
chaperones stimulate formation and yield of the U3 snoRNA-Pre-rRNA duplexes
needed for eukaryotic ribosome biogenesis. J Mol Biol 390(5):991-1006
40. Pellino JL, Jaskiewicz L, Filipowicz W, & Sontheimer EJ (2005) ATP modulates
siRNA interactions with an endogenous human Dicer complex. RNA 11(11):1719-
1724
41. Pham JW & Sontheimer EJ (2005) Separation of Drosophila RNA silencing
complexes by native gel electrophoresis. Methods Mol Biol 309:11-16
42. Pham JW, Pellino JL, Lee YS, Carthew RW, & Sontheimer EJ (2004) A Dicer-2-
dependent 80s complex cleaves targeted mRNAs during RNAi in Drosophila.
Cell 117(1):83-94
43. Sigurskjold BW (2000) Exact analysis of competition ligand binding by
displacement isothermal titration calorimetry. Anal Biochem 277(2):260-266
44. Wreggett KA & De Lean A (1984) The ternary complex model. Its properties and
application to ligand interactions with the D2-dopamine receptor of the anterior
pituitary gland. Mol Pharmacol 26(2):214-227

54
45. Mougel M, Ehresmann B, & Ehresmann C (1986) Binding of Escherichia coli
ribosomal protein S8 to 16S rRNA: kinetic and thermodynamic characterization.
Biochemistry 25(10):2756-2765
46. Seimiya M & Kurosawa Y (1996) Kinetics of binding of Antp homeodomain to
DNA analyzed by measurements of surface plasmon resonance. FEBS Lett 398(2-
3):279-284
47. Pond SJ, Ridgeway WK, Robertson R, Wang J, & Millar DP (2009) HIV-1 Rev
protein assembles on viral RNA one molecule at a time. Proc Natl Acad Sci U S A
106(5):1404-1408
48. Wang HW, et al. (2009) Structural insights into RNA processing by the human
RISC-loading complex. Nature structural & molecular biology 16(11):1148-1153
49. Lau PW, Potter CS, Carragher B, & MacRae IJ (2009) Structure of the human
Dicer-TRBP complex by electron microscopy. Structure 17(10):1326-1332
50. Baulcombe D (2004) RNA silencing in plants. Nature 431:356-363
51. de Vries W, et al. (2008) Increased virus replication in mammalian cells by
blocking intracellular innate defense responses. Gene Ther 15(7):545-552
52. Grimm D, et al. (2006) Fatality in mice due to oversaturation of cellular
microRNA/short hairpin RNA pathways. Nature 441(7092):537-541
55
Chapter 3:
EXPLICIT MODELING: TIME DEPENDENT AND ALTERNATIVE
STEADY STATE IN VIVO INTERACTIONS BETWEEN RNA
INTERFERENCE AND P19
3.1 Introduction
Computational modeling in infectious disease has been used mostly to elucidate
disease mechanisms, model the progression of infection and to determine the spread of
epidemics. Recently, the immune system has come under considerable scrutiny as a
target for biomodeling. In the post-genomic era, the discovery of siRNAs, miRNAs, and
huge networks of non-coding RNAs that act as genetic regulators against disease has
forced scientists to question their previous understanding of the immune response to
infection. With RNA interference (RNAi) impacting essentially all invading viruses in
most species, from fission yeast to plants and mammals, the possibilities are expanding
for genomic modeling.
The RNAi pathway is activated during viral infection to degrade exposed
stretches of double-stranded viral mRNA. These mRNAs are specifically recognized and
cleaved by the cytoplasmic RNase III-type endonuclease Dicer into small interfering
RNAs (siRNAs) 21-24 nucleotides in length depending on species (1-9). Dicer has a
second role, after cleavage, to deliver the double-stranded siRNA to the RNA Induced

56
Silencing Complex (RISC) (10-12). RISC cleaves and releases the passenger strand of
the duplex while the guide strand is retained to direct specific cleavage of complementary
viral RNA genomes or transcripts (13, 14).
Within the last five years, the modeling community has begun to address this
largely unexplored territory. Bergstrom et. al (2003) used a time dependent
compartmental model of RNAi to examine several key features of the RNAi pathway
including synthesis, cleavage, and degradation of mRNA. They focused on the effect of
siRNA amplification by RNA dependent RNA polymerases and the mechanism behind
the reduced off target self-cleavage of host mRNA (15). Marshall (2005) used a steady-
state compartmental model to study the effect of so-called recursive RNAi, targeting
Dicer and RISC, on viral protein accumulation (16). Bartlett and Davis (2006) employed
a more comprehensive model of RNAi in response to HIV infection and included the
delivery of therapeutic siRNAs in viral production (17). Goutsias and Lee (2007) used
experimental RNAi as a validation tool for gene regulatory models and designed reverse
engineered algorithms for transcriptional regulatory networks by gene perturbations in
colon cancer progression (18). Groenenboom and Hogeweg (2005, 2008) suggested
extensions to the current view of RNAi that would unify the diversity of data presented
on viral growth patterns and observed siRNA ratios in response to RNAi (19, 20).
To combat host RNAi suppression, many viruses have evolved small proteins that
act as RNAi silencing suppressors or RSSs (21-23). Protein 19 (p19) is an RSS encoded
by all members of the tombusviridae viral family that has been observed to correlate with
reduced viral mRNA degradation, systemic symptom spread and the sustainability of the
viral phenotype after infection (24-28). p19 has been shown to bind single siRNA
57
duplexes forming stacking interactions with the terminal base pairs of the siRNA to
prevent reintroduction into the RNAi pathway (29-31). Currently, there are no available
models that explicitly address the interaction of a viral suppressor protein with the RNAi
pathway.
Here we report two sections of computational modeling; in section one we
develop a time-dependent RNAi model that incorporates the effect of exogenously
introduced p19 on viral mRNA levels. We find p19 to be able to increase either the
amount of mRNA production or the length of the viral replication phase. Also, our
model predicts p19 to time invariantly reinitiate viral replication after a steady-state level
of suppression has been reached. In section two, we expand on the steady-state models
presented previously to provide new information on the ternary complex described
between siRNAs, Dicer, and p19. We can calculate through an alternative Jacobian-
based method that indirect binding of siRNA substrates, by p19 or Dicer, is insufficient to
reproduce experimental data reiterating the necessity of a ternary complex (see Model
Description: Indirect Equilibrium Shift). We also numerically estimate rate constants for
each individual reaction in the closed system by dynamic ranging and obtain results
comparable to experiment (see Model Description: Direct Binding and Ternary Complex
Formation).

58
3.2 Model Description(s):
Explicit Time-Dependence of RNA Interference
The RNA interference pathway depicted in (Figure 3.1) is described by a system
of seven ordinary differential equations. The rates of change for viral messenger RNA
(M), two products of mRNA cleavage by Dicer (ds2) and (ds1), free siRNA (S), Dicer
bound siRNA (SD), p19 bound siRNA (SP), and the RISC complex (R) are given below.
• d[M]/dt = h - k7*[R]*[M]
• d[ds2]/dt = Vmax*([M]/(Km+[M]))-Vmax*([ds2]/(Km+[ds2])) + k7*[R]*[M]
• d[ds1]/dt = Vmax*([ds2]/(Km+[ds2]))-Vmax*([ds1]/(Km+[ds1]))
• d[S]/dt = -k3*[S]*[p19] + k4*[SP] - k1*[S]*[Dicer] + k1*Kd*[SD]
• d[SD]/dt = Vmax*([M]/(Km+[M]))+Vmax*([ds1]/(Km+[ds1]))+ Vmax*([d
s2]/(Km+[ds2]))+k1*[S]*[Dicer]-k1*Kd*[SD]-k5*[SD]*[p19]-
k6*[SD]*[Ago]
• d[SP]/dt = k3*[S]*[p19]-k4*[SP]+k5*[SD]*[p19]
• d[R]/dt = k6*[SD]*[Ago]-k8*[R]
We describe these terms as follows:

59
a) Messenger RNA (M): mRNAs are produced at a constant rate (h) and degraded
by their interaction with the mature RISC complex (k7*[R]*[M]).
b) Double-stranded RNA2 (ds2): ds2 is formed from messenger RNA after one
round of cleavage by either Dicer or RISC (Vmax*([M]/(Km+[M])) +
k7*[R]*[M]), respectively. (ds2) remains a substrate for Dicer and is further
processed into ds1 by (Vmax*([ds2]/(Km+[ds2])).
c) Double-stranded RNA1 (ds1): (ds1) is the product of (ds2) cleavage by Dicer
described by the term (Vmax*([ds2]/(Km+[ds2]))) and is again a Dicer substrate
(Vmax*([ds1]/(Km+[ds1]))).
d) Free siRNA (S): siRNAs are accumulated in the cell by dissociation from either
the SD or SP complex (k1*Kd*[SD] + k4*[SP]) and depleted by the binding of
both proteins (k3*[S]*[p19]+ k1*[S]*[Dicer]).
e) Dicer:siRNA (SD): The complex between Dicer and siRNAs is formed through
the direct cleavage of either mRNA, (ds2), or (ds1) by Dicer
(Vmax*([M]/(Km+[M]))+Vmax*([ds1]/(Km+[ds1]))+Vmax*([ds2]/(Km+[ds2])).
The complex is then depleted through the binding of RISC proteins to form the
mature RISC, natural dissociation, or facilitated dissociated by p19
(k6*[SD]*[Ago]+ k1*Kd*[SD]+k5*[SD]*[p19]), respectively.

60
f) p19:siRNA (SP): The complex between p19 and siRNAs is formed by p19
binding of free or Dicer bound siRNAs (k3*[S]*[p19]) + k5*[SD]*[p19]),
respectively, and dissociated at a rate of (k4*[SP]).
g) Mature RISC (R): Mature RISC is formed through Ago proteins binding to the
SD complex (k6*[SD]*[Ago]), and degraded at a rate of (k8*[R]).
We assume Dicer, and Ago proteins are kept constant in the cell and are produced
at sufficient levels to not inhibit the reaction rates. Additionally, p19 is assumed to be
expressed stably in all cases. Parameter values, intended to illustrate the qualitative
features of this model and give insight into its dynamics, are as follows:
• h = 0.6; Rate of mRNA production (nM/hour)
• k7 = 0.001; Rate constant for RISC mRNA cleavage (nM-1hour-1)
• Vmax = 792; Maximum velocity of Dicer cleavage (nM/hour)*
• Km = 2800; Concentration of half maximal Dicer cleavage (nM)*
• k3 = 608.4; Rate constant for p19-siRNA binding (nM-1hour-1)*
• k4 = 363.6; Rate constant for SP dissociation (hour-1)*
• k1 = 0.01476; Rate constant for Dicer-siRNA binding (nM-1hour-1)*
• Kd = 3.67; Dissociation constant for SD (nM)*
• k5 = 0.04446; Rate constant for p19-SD binding (nM-1hour-1)*
• k6 = 0.001; Rate constant for RISC-SD binding (nM-1hour-1)

61
• k8 = 0.1; Rate constant for RISC dissociation (hour-1)
Those parameters that are derived or estimated from experimental results are indicated
with an asterisk.
Steady-State Two Protein Model(s)
Ternary Complex Formation
Addition of a possible ternary complex between Dicer, p19 and siRNA increased
the complexity beyond explicit solving methods. Rate equations were treated as a set of
coupled ordinary differential equations and were numerically solved using Matlab 2007b.
• SD’ [t] = k1*S [t]*D [t] - k2*SD [t] - k5*SD [t]*P [t] + k6*SDP [t]
• S’ [t] = -k4/ KDp*S [t]*P [t] +k4*SP [t] -k1*S [t]*D [t] +k2*SD[t]
• D’ [t] = -k1*S [t]*D [t] + k2*SD [t] - k8*SP [t]*D [t] + k7*SDP[t]
• P’ [t] = -k4/ KDp *S [t]*P [t] + k4*SP [t] - k5*SD [t]*P [t] + k6*SDP [t];
• SP’ [t] = k4/ KDp *S [t]*P [t] - k4*SP [t] - k8*SP [t]*D [t] + k7*SDP [t];
• SDP’ [t] = k5*SD [t]*P [t]-k6*SDP [t]+k8*SP [t]*D [t]-k7*SDP [t] (1)

62
where the concentrations S, D, P, SD, SP and SDP are siRNA, free Dicer, free p19,
Dicer:siRNA complex, p19:siRNA complex and the ternary complex (Dicer:p19:siRNA),
respectively. Unknown constants (k3, k-3, k4, k-4) were simultaneously ranged and
allowed to converge onto a best fit to the experimental data determined by residual least
square analysis.
Dissociative Equilibrium Shift
The set of time dependent rate equations for the model depicted in (Figure 3.3C)
are represented below:
SD'[t] = k1*S[t]* D[t] - k1*KDd SD[t]
SP'[t] = k3*S[t]* P[t] - k3*KDp SP[t] (2)
and
S [t] = So - SP[t] - SD[t]
D [t] = Do - SD[t] (3)
P [t] = Po - SP[t]
where the concentrations S, D, P, SD, and SP are siRNA, free Dicer, free p19,
Dicer:siRNA complex, and p19:siRNA complex respectively. Initial conditions are
represented as So, Do, and Po. After substituting equations (3) into equations (2) the two

63
unique rate equations (SD and SP) are non-dimensionalized or rescaled by substituting
the concentrations SD and SP for scalar multiples multiplied by a unit carrying vectors.
SD [t] = x*Do
SP [t] = y*Po (4)
For a steady state analysis equations (1) are set to zero and x is represented in
terms of y and solved for explicitly. The solutions for y are extensive; we get three values
of y for x1 and three values of y for x2 for a total of six possible steady states for a given
value of Po.
Summarized below :
x1 = A (y), and y11 = a, y12 = b, y13 = c
x2 = B (y), and y21 = d, y22 = e, y23 = g (5)
The steady states are :
[A (a), a], [A (b), b], [A (c), c],
[B (d), d], [B (e), e], [B (g), g] (6)
Next we must evaluate the stability of these steady states and look into their
relevance. Negative values of x or y would mean negative concentrations and are
meaningless. Values of SD or SP that are complex or greater than So (the amount of

64
initial siRNA) are meaningless as well. For stability we find the Jacobian of the system
and evaluate it at the steady states.
Jacobian = ∂SD/∂x ∂SD/∂y
∂SP/∂x ∂SP/∂y (7)
When the Trace of the Jacobian is less than zero and the determinant is greater
than zero the steady state is stable. We find the steady state values to be complex or non-
biologically relevant at all explored values of p19 suggesting the need for additional
complexity. Explicit indirect model was computed use Mathematica 7.0.0 Wolfram
Research copyright 1988-2008. Below is a table of the six non-dimensionalized steady
states for all values of p19 used in this study.
p19 Calculated Steady State for Dicer:siRNA
Calculated Steady State for p19:siRNA
Stability
0.04 0.00692274+0. i 1.00119+0. i TRUE 0.04 -0.0488272+1.98287*10^-18 i 1.00119+0. i TRUE 0.04 0.0066805+0. i 1.00119+0. i TRUE 0.04 1.0264+0. i 1.00119+0. i FALSE 0.04 1.02499+4.72524*10^-20 i 1.00119+0. i FALSE 0.04 1.02639+0. i 1.00119+0. i FALSE
0.08 0.00688667-1.97756*10^-17 i 1.00119-3.90799*10^-14 i TRUE
0.08 -0.0490833+9.91446*10^-19 i 1.00119-3.90799*10^-14 i TRUE
0.08 0.00640185+2.17537*10^-17 i 1.00119-3.90799*10^-14 i TRUE
0.08 1.0264-5.25618*10^-19 i 1.00119-3.90799*10^-14 i FALSE
0.08 1.02499+2.3615*10^-20 i 1.00119-3.90799*10^-14 FALSE

65
i
0.08 1.02638+5.7763*10^-19 i 1.00119-3.90799*10^-14 i FALSE
0.16 0.00681551-5.9327*10^-18 i 1.00119-8.88178*10^-15 i TRUE
0.16 -0.0495966-9.91469*10^-19 i 1.00119-8.88178*10^-15 i TRUE
0.16 0.00584453+9.88834*10^-18 i 1.00119-8.88178*10^-15 i TRUE
0.16 1.02639-1.57663*10^-19 i 1.00119-8.88178*10^-15 i FALSE
0.16 1.02498-2.35924*10^-20 i 1.00119-8.88178*10^-15 i FALSE
0.16 1.02637+2.62272*10^-19 i 1.00119-8.88178*10^-15 i FALSE
0.24 0.00674562+5.93272*10^-18 i 1.00119+0. i FALSE 0.24 -0.0501111-1.48724*10^-18 i 1.00119+0. i TRUE 0.24 0.00528719+0. i 1.00119+0. i TRUE 0.24 1.02639+1.57642*10^-19 i 1.00119+0. i FALSE 0.24 1.02496-3.53547*10^-20 i 1.00119+0. i FALSE 0.24 1.02635+0. i 1.00119+0. i FALSE
0.32 0.00667699-1.97758*10^-18 i 1.00119-3.55271*10^-15 i FALSE
0.32 -0.0506269+0. i 1.00119-3.55271*10^-15 i TRUE
0.32 0.00472984+7.91113*10^-18 i 1.00119-3.55271*10^-15 i TRUE
0.32 1.02639-5.25402*10^-20 i 1.00119-3.55271*10^-15 i FALSE
0.32 1.02495+0. i 1.00119-3.55271*10^-15 i FALSE
0.32 1.02634+2.0936*10^-19 i 1.00119-3.55271*10^-15 i FALSE
0.64 0.00641443-1.97761*10^-18 i 1.00119-1.77636*10^-15 i FALSE
0.64 -0.0527022-3.96642*10^-18 i 1.00119-1.77636*10^-15 i TRUE
0.64 0.00250029+7.91204*10^-18 i 1.00119-1.77636*10^-15 i TRUE
0.64 1.02638-5.25131*10^-20 i 1.00119-1.77636*10^-15 FALSE

66
i
0.64 1.0249-9.38265*10^-20 i 1.00119-1.77636*10^-15 i FALSE
0.64 1.02628+2.0845*10^-19 i 1.00119-1.77636*10^-15 i FALSE
1.28 0.00594131+5.93297*10^-18 i 1.00118+0. i FALSE 1.28 -0.0569055-1.98357*10^-18 i 1.00118+0. i TRUE 1.28 -0.00195954+0. i 1.00118+0. i TRUE 1.28 1.02637+1.57393*10^-19 i 1.00118+0. i FALSE 1.28 1.0248-4.65494*10^-20 i 1.00118+0. i FALSE 1.28 1.02616+0. i 1.00118+0. i FALSE
2.15 0.00539179-1.66097*10^-17 i 1.00118-1.55431*10^-15 i FALSE
2.15 -0.0627148-4.99892*10^-18 i 1.00118-1.55431*10^-15 i TRUE
2.15 -0.00802368+2.32695*10^-17 i 1.00118-1.55431*10^-15 i TRUE
2.15 1.02636-4.40145*10^-19 i 1.00118-1.55431*10^-15 i FALSE
2.15 1.02467-1.16033*10^-19 i 1.00118-1.55431*10^-15 i FALSE
2.15 1.02601+6.0032*10^-19 i 1.00118-1.55431*10^-15 i FALSE
5.12 0.0040705-1.38449*10^-17 i 1.00115-6.66134*10^-16 i FALSE
5.12 -0.0831145-7.943*10^-18 i 1.00115-6.66134*10^-16 i TRUE
5.12 -0.0287384+2.37726*10^-17 i 1.00115-6.66134*10^-16 i TRUE
5.12 1.02632-3.65908*10^-19 i 1.00115-6.66134*10^-16 i FALSE
5.12 1.0242-1.7749*10^-19 i 1.00115-6.66134*10^-16 i FALSE
5.12 1.02548+5.88851*10^-19 i 1.00115-6.66134*10^-16 i FALSE

67
3.3 Results
Enhancement of Free siRNA by p19
In the current model (Figure 3.1), RNAi is initiated by the production of
messenger RNAs (mRNAs) from an infectious agent. mRNAs are cleaved sequentially
by Dicer to produce a Dicer bound siRNA complex (SD) and a shorter double-stranded
RNA product (ds2 or ds1). SD complexes recruit Argonaute and other RISC proteins to
form the mature RISC, which then degrades one strand of the bound siRNA to use as a
guide for selective mRNA degradation (Figure 3.1). The protein p19 can suppress RNAi
by binding siRNAs either freely in the cytoplasm or by facilitating the dissociation of the
SD complex. For simplicity it is assumed that plasmids containing p19 are stably
transfected in the cell to produce the protein in constant amounts (Figure 3.1).
Before the introduction of p19, infected mRNA reaches its peak in ~48 h and is
fully suppressed in ~96 h, after which it remains in constant equilibrium (Figure 3.2A).
The SD complex accumulates to a high level with the peak concentration correlating with
the lowest point of mRNA accumulation and the onset of equilibrium. Once the
equilibrium concentration of mRNA has been reached the levels of SD, RISC, and free
siRNA are also reduced. All three species remain, however, at a relatively high steady-
state level (Figure 3.2A).

68
Figure 3.1 Model Diagram.
When the p19 plasmid is introduced, and assumed to express at a rate sufficient to
produce a constant 5 nM of protein in the cell, the peak levels of SD and RISC are
markedly reduced, with SD reduced by half (Figure 3.2B). Conversely, the level of free
siRNA increases with the addition of p19, and accumulates to a much higher steady state
level (Figure 3.2B). Messenger RNA levels are increased by 40% in the presence of 5 nM
p19 and the time before suppression is increased by 50% (Figure 3.2 C,D).

69
Figure 3.2 The effect of p19 on RNAi complexes. (A) Suppression of mRNA in the
absence of p19. (B) Suppression of mRNA in the presence of 5 nM p19. The
siRNA:Dicer complex (SD) and RISC are reduced in the presence of p19 while free
siRNA concentration is increased. (Insert) Concentration of p19 bound siRNA over time.
(C) Blowup of the mRNA concentration curve from panel A (D) Blowup of the mRNA
concentration curve from panel B, showing a 40% increase in peak mRNA accumulation.

70
P19 Reinitiates Dormant mRNA Replication
Increasing the concentration of p19 from 0 to 250 nM, linearly increases the time
spent in the replication phase and the peak mRNA accumulation. Peak mRNA
accumulation increased by 1.5, 2.2, 5, and 8.7-fold in the presence of 5, 25, 125, and 250
nM of p19, respectively (Figure 3.3A). A larger effect, however, is seen on the duration
of infection. At the highest p19 concentration, the time to fully suppress the infection is
increased by over 100-fold (Figure 3.3A). Such substantial gains in infection duration
may produce varied effects over the course of an infection. We probed effects of timing
by introducing p19 to the cell at 24, 48, 72, 96, and 300 h after infection. Addition of p19
at 24 h increases the peak height only marginally over other time points. Interestingly,
p19 is able to induce mRNA replication at all time-points observed even after equilibrium
has been reached (Figure 3.3B).
Timed Introduction of p19 Increases Length of mRNA Replication Phase
Due to the apparent reactivation of infection with p19, we probed p19’s effect on
rising phase duration by increasing p19 concentration at intervals of 200 h. By increasing
the p19 concentration stepwise, the mRNA replication phase is extended from 48 h to
900 h, compared to wild-type infection (Figure 3.4). Compared with p19 added at the
onset of infection, rising phase duration is increased by ~ 200% (Figure 3.3A).
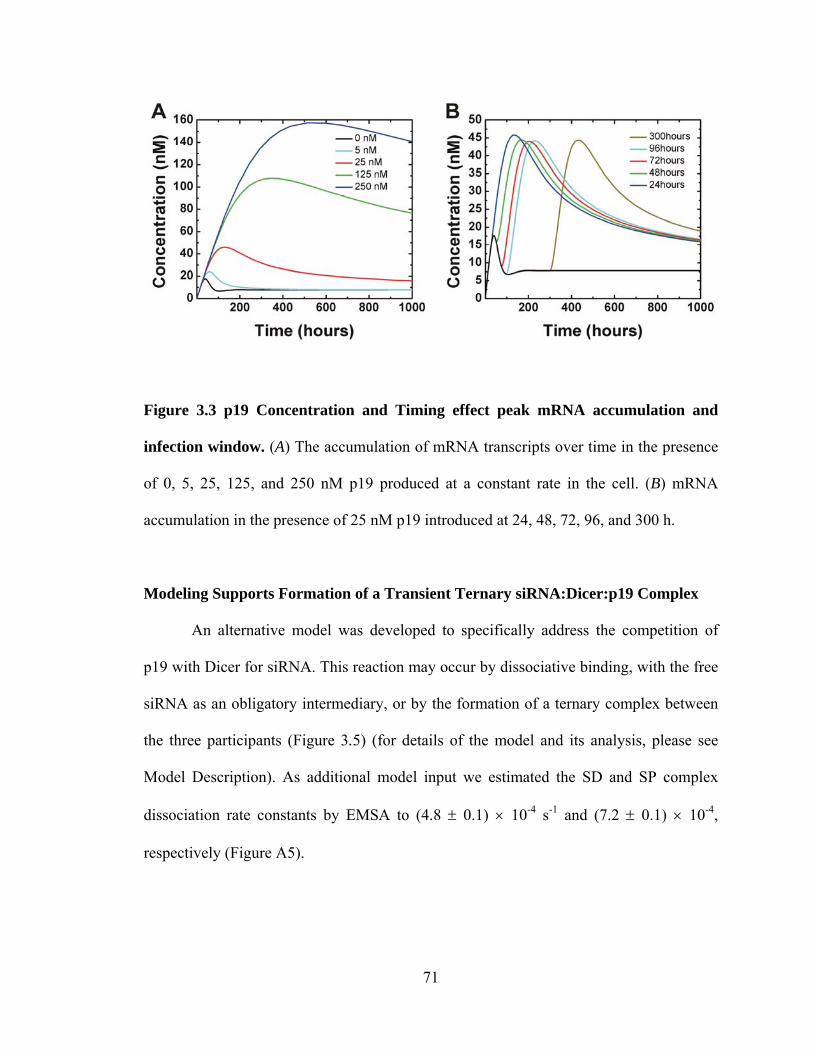
71
Figure 3.3 p19 Concentration and Timing effect peak mRNA accumulation and
infection window. (A) The accumulation of mRNA transcripts over time in the presence
of 0, 5, 25, 125, and 250 nM p19 produced at a constant rate in the cell. (B) mRNA
accumulation in the presence of 25 nM p19 introduced at 24, 48, 72, 96, and 300 h.
Modeling Supports Formation of a Transient Ternary siRNA:Dicer:p19 Complex
An alternative model was developed to specifically address the competition of
p19 with Dicer for siRNA. This reaction may occur by dissociative binding, with the free
siRNA as an obligatory intermediary, or by the formation of a ternary complex between
the three participants (Figure 3.5) (for details of the model and its analysis, please see
Model Description). As additional model input we estimated the SD and SP complex
dissociation rate constants by EMSA to (4.8 ± 0.1) × 10-4 s-1 and (7.2 ± 0.1) × 10-4,
respectively (Figure A5).
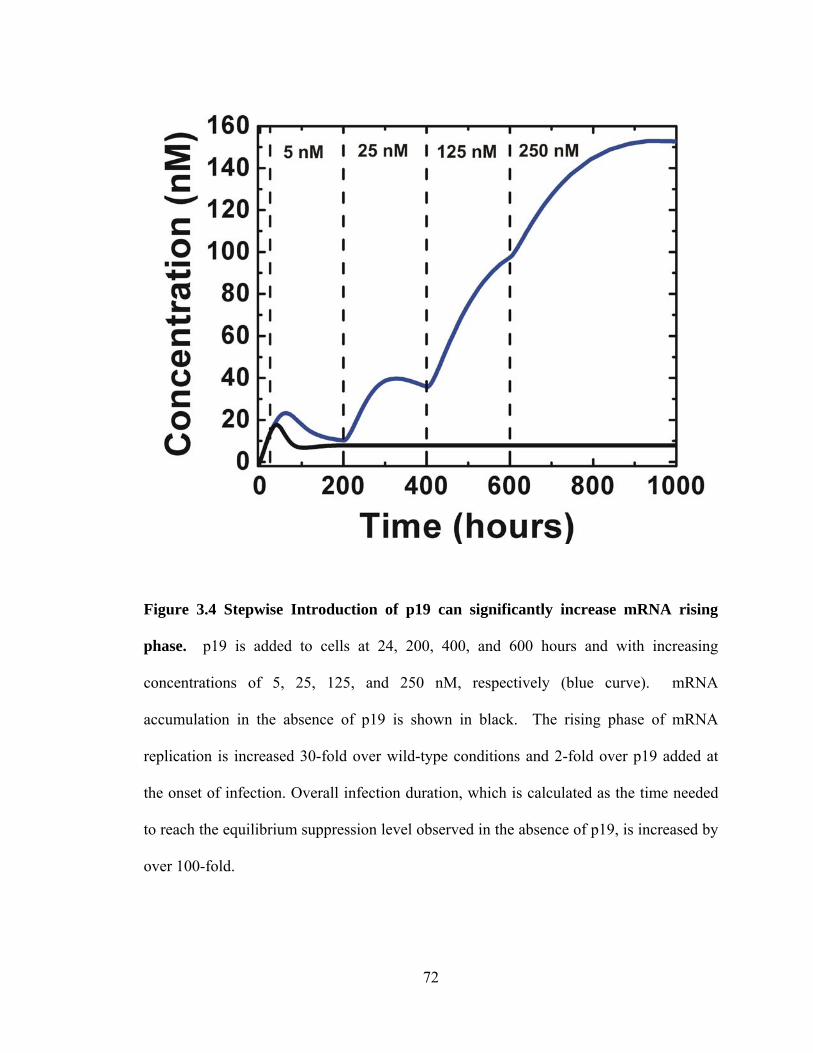
72
Figure 3.4 Stepwise Introduction of p19 can significantly increase mRNA rising
phase. p19 is added to cells at 24, 200, 400, and 600 hours and with increasing
concentrations of 5, 25, 125, and 250 nM, respectively (blue curve). mRNA
accumulation in the absence of p19 is shown in black. The rising phase of mRNA
replication is increased 30-fold over wild-type conditions and 2-fold over p19 added at
the onset of infection. Overall infection duration, which is calculated as the time needed
to reach the equilibrium suppression level observed in the absence of p19, is increased by
over 100-fold.

73
Based on measured dissociation equilibrium constants for p19 (KD,app = 0.17 ±
0.02 nM) and Dicer (KD,app = 3.7 ± 0.4 nM), we found that dissociative binding alone
with free siRNA as an obligatory intermediate cannot reproduce the experimental
competition data. In contrast, a model that includes formation of a ternary SDP complex
reproduces all experimental data well (Figure 3.5A,B); all plots use the following rate
constants: k3 = 3.27 × 10⁶ M-1s-1, k-3 = 0.0011 s-1, k-4 = 0.156 s-1, k4 = 2.56 × 10⁵ M-1s-1.
Notably, the equilibrium dissociation constant for the formation of the ternary complex
from [SP] + [D] is weaker than that of [SD] + [P] (KD = 0.34 nM and Kd = 608.7 nM,
respectively), illustrating the shuttling of siRNA toward the p19 bound state.
3.4 Discussion
Although RNAi is an innate immune response, it has become most extensively
used as a tool for functional genomics (32), gene therapy (33-35), vaccine production
(36) and therapeutics (37). For such applications, viruses offer a natural model system
for regulating RNAi efficiency and identifying points of further development. One
mechanism, used by the tombusviridae family of plant pathogens, is to encode the RNA
silencing suppressor protein p19. Dimers of p19 bind small interfering RNAs,
independent of sequence, to prevent siRNA incorporation into RISC and subsequent
silencing of viral infection. p19’s ability to bind siRNAs is correlated with the symptom
spread and cytotoxicity of this class of viruses, and is found to regulate RNAi effectively
also in non-native hosts.
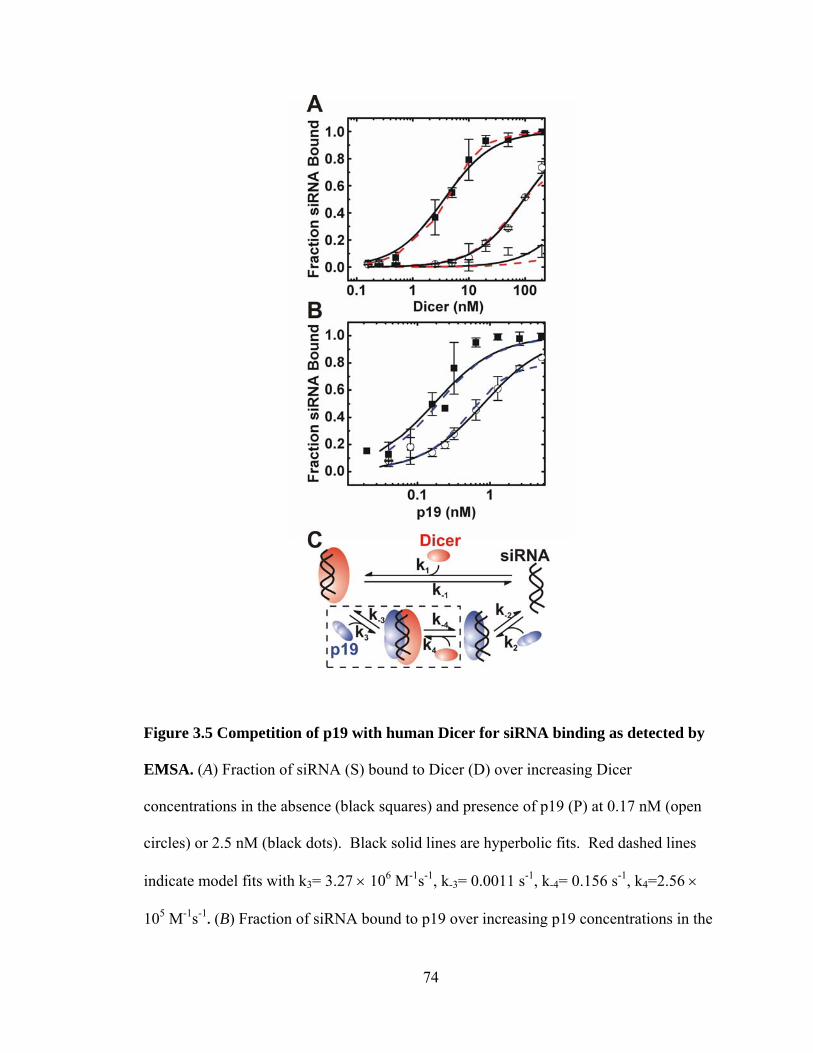
74
Figure 3.5 Competition of p19 with human Dicer for siRNA binding as detected by
EMSA. (A) Fraction of siRNA (S) bound to Dicer (D) over increasing Dicer
concentrations in the absence (black squares) and presence of p19 (P) at 0.17 nM (open
circles) or 2.5 nM (black dots). Black solid lines are hyperbolic fits. Red dashed lines
indicate model fits with k3= 3.27 × 10⁶ M-1s-1, k-3= 0.0011 s-1, k-4= 0.156 s-1, k4=2.56 ×
105 M-1s-1. (B) Fraction of siRNA bound to p19 over increasing p19 concentrations in the

75
(Figure 3.5 continued) absence (black squares) or presence of a saturating Dicer
concentration of 140 nM (open circles). Hyperbolic fits are in black. Blue dashed lines
indicate model fits with rate constants as indicated above. Representative EMSA gel
images are shown in Appendix (Figure A2). (C) Two protein competition model.
Here, we illustrate time dependent interactions between p19 and the entire RNAi
pathway by modeling exogenous p19 introduction into cells expressing a viral mRNA
target. We observe a marked reduction in the maximum accumulation of Dicer bound
siRNAs and of mature RISC complexes in the presence of p19 (Figure 3.2).
Interestingly, the concentration of free siRNA is increased alongside p19, supporting
release of these molecules into the cytoplasm (Figure 3.2). Increasing the concentration
of p19 linearly increases the peak mRNA accumulation and has a large effect on infection
duration, increasing the time in the rising phase by ~10-fold (Figure 3.3A).
Additionally, p19 action was seen to time-invariantly reinitiate mRNA replication
after equilibrium mRNA suppression has been reached (Figure 3.3B). Allowing for the
possibility that p19 could regulate the rising phase of mRNA accumulation, we observed
a 30-fold increase in the rising phase of mRNA replication with stepwise addition of p19
and an overall increase in infection duration of over 100-fold (Figure 3.4).
Next, we modeled the interaction of p19 with human Dicer and saw evidence for
a ternary complex between the siRNA, Dicer, and p19. Rate constants for this reaction
were numerically determined to be k3 = 3.27 × 10⁶ M-1s-1 and k4 = 2.56 × 10⁵ M-1s-1 for
the formation of the ternary complex from either the Dicer bound or p19 bound state, and
k-3 = 0.0011 s-1 and k-4 = 0.156 s-1 for dissociation of the complex back into the
Dicer:siRNA or p19:siRNA complex, respectively (Figure 3.5).

76
Taken together, our models support a catch and release mechanism of p19 action,
in which p19 can bind siRNAs directly or by facilitating Dicer dissociation. Time-
invariance of p19 suggests an active need for Dicer bound siRNAs and RISC complexes
to maintain equilibrium suppression. The idea of long-term active RNAi suppression of
mRNA was suggested also in experiments showing enhancement of HIV replication in
latently infected cells upon knockdown of Dicer or Drosha, another enzyme active in
RNAi (38). From our model we can predict the following principles for optimal use of
p19 in tuning RNAi regulation.
Principles for p19 Interaction with RNAi-Based Applications
(1) Proximity- p19 expressed close to the source of infection maximizes the benefit
of siRNA shuttling through its ternary interaction with Dicer.
(2) Increased concentration- Higher p19 concentrations produce increased viral
mRNA production, longer rising phases and much slower suppression, increasing
the observed duration of infection.
(3) Timing of Incubation- The incubation time before harvesting cells can
significantly affect yield. Optimal incubation times scale linearly with the
effective concentration of p19 in the cell.
(4) Timing of Introduction- Addition of p19 before full suppression of infection
increases the rising phase of mRNA production and the time needed to reach peak
mRNA levels. Late introduction of p19 is observed to reinitiate mRNA
accumulation even after equilibrium has been reached.

77
Although the benefits are apparent, there are potential drawbacks concerning the
use of p19 in some applications. The effect of equilibrium reactivation may not be
specific due to p19’s sequence independent binding of siRNAs and its observed
interactions with other classes of small RNAs (39). This could be a source of off-target
up-regulation of other RNAi suppressed targets including reinitiation of dormant viral
satellites, or activation of endogenously suppressed proteins.
p19, additionally, seems to be a much more effective modulator of infection
duration, than it is an inducer of mRNA accumulation. Modest gains in viral load were
observed in experiments infecting HIV clones into cell lines stably transfected with p19
(40). These results suggest that conventional promoters do not produce p19 in high
enough quantities to induce substantial mRNA accumulation. An added factor is the fact
that the incubation time necessary to achieve maximal mRNA levels is dependent on p19
concentration, increasing the optimal incubation time 8.7-fold at the highest modeled
concentration. A summary of these drawbacks and concerns is given below.
Drawbacks and Concerns of p19
(1) Dormant viruses- The effectiveness of p19 is not specific to the gene of interest
due to its ability to bind siRNAs and other small RNA, independent of sequence.
This can be a source of off-target effects including up-regulation of other RNAi
suppressed targets.
(2) Long Incubation Times- Maximum efficiency comes at the cost of longer
incubation times of greater than 8-fold of the original infection, dependent on p19
concentration.

78
(3) Significance of Sustained Dosing- Sufficiently high sustained dosing of p19 may
be a challenge when using conventional promoters used in stable cell transfection.
Introduction of a low dose of p19 early in the infection window leads to limited, if
any, discernable difference in yield.
We conclude that p19 can significantly increase the yield of a virally introduced
gene of interest. This may be of benefit in numerous functional applications that use
RNAi as a tool for genetic research, protein production and therapeutics, as long as
possible complications are also considered.
3.5 Acknowledgements
I would like to thank Dr. Patrick Nelson and Dr. Trachette Jackson for generously
giving of their time for helpful discussions on computational modeling.
79
3.6 References
1. Carthew RW & Sontheimer EJ (2009) Origins and Mechanisms of miRNAs and
siRNAs. Cell 136(4):642-655
2. Chellappan P, Vanitharani R, & Fauquet CM (2005) MicroRNA-binding viral
protein interferes with Arabidopsis development. Proc Natl Acad Sci U S A
102(29):10381-10386
3. Baulcombe D (2004) RNA silencing in plants. Nature 431:356-363
4. Ding SW & Voinnet O (2007) Antiviral immunity directed by small RNAs. Cell
130(3):413-426
5. Fire A, et al. (1998) Potent and specific genetic interference by double-stranded
RNA in Caenorhabditis elegans. Nature 391:806-881.
6. Johansen LK & Carrington JC (2001) Silencing on the spot. Induction and
suppression of RNA silencing in the Agrobacterium-mediated transient
expression system. Plant Physiol 126(3):930-938
7. Scholthof H (2006) The Tombusvirus-encoded P19: from irrelevance to elegance.
Nat Rev Microbiol (4):405-411.
8. Silhavy D & Burgyan J (2004) Effects and side-effects of viral RNA silencing
suppressors on short RNAs. Trends Plant Sci (9):76–83.
9. Umbach JL & Cullen BR (2009) The role of RNAi and microRNAs in animal
virus replication and antiviral immunity. Genes Dev 23(10):1151-1164
80
10. Collingwood MA, et al. (2008) Chemical modification patterns compatible with
high potency dicer-substrate small interfering RNAs. Oligonucleotides 18(2):187-
200
11. Kim DH, et al. (2005) Synthetic dsRNA Dicer substrates enhance RNAi potency
and efficacy. Nat Biotechnol 23(2):222-226
12. Jaskiewicz L & Filipowicz W (2008) Role of Dicer in posttranscriptional RNA
silencing. Curr Top Microbiol Immunol 320:77-97
13. Ji X (2008) The mechanism of RNase III action: how dicer dices. Curr Top
Microbiol Immunol 320:99-116
14. Siomi H & Siomi MC (2009) On the road to reading the RNA-interference code.
Nature 457(7228):396-404
15. Bergstrom CT, McKittrick E, & Antia R (2003) Mathematical models of RNA
silencing: unidirectional amplification limits accidental self-directed reactions.
Proc Natl Acad Sci U S A 100(20):11511-11516
16. Marshall WF (2008) Modeling recursive RNA interference. PLoS Comput Biol
4(9):e1000183
17. Bartlett DW & Davis ME (2006) Insights into the kinetics of siRNA-mediated
gene silencing from live-cell and live-animal bioluminescent imaging. Nucleic
Acids Res 34(1):322-333
18. Goutsias J & Lee NH (2007) Computational and experimental approaches for
modeling gene regulatory networks. Curr Pharm Des 13(14):1415-1436
19. Groenenboom MA, Maree AF, & Hogeweg P (2005) The RNA silencing
pathway: the bits and pieces that matter. PLoS Comput Biol 1(2):155-165

81
20. Groenenboom MA & Hogeweg P (2008) The dynamics and efficacy of antiviral
RNA silencing: A model study. BMC Syst Biol 2:28
21. Qu F & Morris TJ (2005) Suppressors of RNA silencing encoded by plant viruses
and their role in viral infections. FEBS Lett 579(26):5958-5964
22. Roth BM, Pruss GJ, & Vance VB (2004) Plant viral suppressors of RNA
silencing. Virus Res 102(1):97-108
23. Voinnet O (2001) RNA silencing as a plant immune system against viruses.
Trends Genet 17(8):449-459
24. Chu M, Desvoyes B, Turina M, Noad R, & Scholthof HB (2000) Genetic
dissection of tomato bushy stunt virus p19-protein mediated host-dependent
symptom induction and systemic invasion. Virology (266):79-87.
25. Omarov R, Sparks K, Smith L, Zindovic J, & Scholthof HB (2006) Biological
relevance of a stable biochemical interaction between the tombusvirus-encoded
P19 and short interfering RNAs. J Virol 80(6):3000-3008
26. Silhavy D, et al. (2002) A viral protein suppresses RNA silencing and binds
silencing-generated, 21- to 25-nucleotide double-stranded RNAs. EMBO J.
21:3070-3080.
27. Havelda Z, Hornyik C, Valoczi A, & Burgyan J (2005) Defective Interfering
RNA Hinders the Activity of a Tombusvirus-Encoded Posttranscriptional Gene
Silencing Suppressor. J Virol (79):450-457.
28. Dunoyer P, Lecellier CH, Parizotto EA, Himber C, & Voinnet O (2004) Probing
the microRNA and small interfering RNA pathways with virus-encoded
suppressors of RNA silencing. Plant Cell 16(5):1235-1250

82
29. Vargason JM, Szittya G, Burgyan J, & Hall TM (2003) Size selective recognition
of siRNA by an RNA silencing suppressor. Cell (115):799-811.
30. Ye K, Malinina L, & Patel DJ (2003) Recognition of siRNA by a viral suppressor
of RNA silencing. Nature (426):874-878.
31. Xia Z, Zhu Z, Zhu J, & Zhou R (2009) Recognition mechanism of siRNA by viral
p19 suppressor of RNA silencing: a molecular dynamics study. Biophys J
96(5):1761-1769
32. Belles X (Beyond Drosophila: RNAi in vivo and functional genomics in insects.
Annu Rev Entomol 55:111-128
33. Barichievy S, Saayman S, Arbuthnot P, & Weinberg MS (2009) RNA
interference-based gene expression strategies aimed at sustained therapeutic
inhibition of HIV. Curr Top Med Chem 9(12):1065-1078
34. Berkhout B & ter Brake O (2009) Towards a durable RNAi gene therapy for HIV-
AIDS. Expert Opin Biol Ther 9(2):161-170
35. Schnettler E, et al. (2009) The NS3 protein of rice hoja blanca virus complements
the RNAi suppressor function of HIV-1 Tat. EMBO Rep 10(3):258-263
36. Zheng N, et al. (2009) Boosted expression of the SARS-CoV nucleocapsid
protein in tobacco and its immunogenicity in mice. Vaccine 27(36):5001-5007
37. Tiemann K & Rossi JJ (2009) RNAi-based therapeutics-current status, challenges
and prospects. EMBO Mol Med 1(3):142-151
38. Triboulet R, et al. (2007) Suppression of microRNA-silencing pathway by HIV-1
during virus replication. Science 315(5818):1579-1582

83
39. Lakatos L, Szittya G, Silhavy D, & Burgyan J (2004) Molecular mechanism of
RNA silencing suppression mediated by p19 protein of tombusviruses. EMBO J
23(4):876-884.
40. de Vries W, et al. (2008) Increased virus replication in mammalian cells by
blocking intracellular innate defense responses. Gene Ther 15(7):545-552

84
CHAPTER 4:
IN VITRO PROBING OF MICRO-RNA CONTAINING COMPLEXES IN
HUMAN CYTOSOLIC EXTRACT
4.1 Introduction
MicroRNAs (miRNAs) are a large and growing class of ~ 21-25 nucleotide small
non-coding RNAs that can act as posttranscriptional gene regulators. miRNAs are
usually endogenous transcripts processed first in the nucleus, and then exported into the
cytoplasm where they repress messenger RNA translation (1). The current estimation is
that 40-70% of all miRNAs are transcribed from introns of protein-coding genes and both
introns and exons of non-coding RNAs (2). Initially synthesized as large primary-
miRNA (pri-miRNA) transcripts, microRNAs are cleaved in the nucleus by the nuclear
enzyme Drosha into smaller imperfectly base-paired stem-loops (pre-miRNAs) (3-5).
These pre-miRNAs are then exported to the cytoplasm where they are further processed
into mature miRNAs by the RNase III enzyme Dicer (6, 7). Mature miRNA duplexes are
loaded into the RNA Induced Silencing Complex (RISC), which retains one strand of the
duplex as a guide strand to target specific mRNAs for either destabilization (8) or
translational repression (9, 10) (Figure 4.1A).
Despite distinct overlaps in processing, miRNAs differ from another well-known
class of non-coding RNAs, small interfering RNAs (siRNAs), in both their biogenesis

85
and ultimate cellular functionality (11) (Figure 4.1B). siRNAs are typically ~ 21-22
nucleotide exogenous products cleaved initially in the cytoplasm, by Dicer, from long
double-stranded RNA duplexes derived from viruses or transposons (12-14). After
cleavage, both small RNAs are incorporated into (different forms of) RISC, to carry out
the recognition, cleavage and/or repression of the mRNA targets (15). In contrast to
microRNAs, siRNAs direct targeted degradation of their parent mRNA and require
complete complementarity for binding (11).
Micro-RNAs, uniquely, require incomplete complementarity in their duplex
formation and in binding with a target mRNA to induce repression. Recognition is
achieved by small seed sequences, five to eight nucleotides in length, that are fully
complementary to regions within the 3' UTR of an mRNA with some non-conserved
binding in peripheral flanking sequences (11). Consequently, the stringency for target
recognition is reduced, allowing a single miRNA to regulate numerous genes. For
example, in humans, known miRNAs represent less than 1% of the transcribed genome,
yet they are estimated to regulate >30% of all protein-coding genes (19). Alteration,
therefore, in a single miRNA can lead to distinct higher-order regulation of hundreds of
genes and alter the expression patterns of large subsets of proteins (20).
Lethal-7 (let-7) is an early emerging class of miRNAs that regulate cellular
proliferation and the timing of cell differentiation in various species (21). There are
currently nine referenced examples in this class labeled let-7a through let-7i. Cells that
poorly express let-7 are seen in certain lung cancers (22), and the seed sequences of these
molecules have been mapped to deleted mRNA regions in cancerous cell lines (22, 23).

86
Figure 4.1 MicroRNA and siRNA Pathways. (A) MicroRNAs are initially transcribed
in the nucleus as longer primary RNA transcripts (pri-miRNA) and cleaved by the
nuclear enzyme, Drosha. Drosha cut pre-miRNAs are exported into the cytoplasm for
further processing into mature miRNAs by the RNase III enzyme Dicer. In humans,
Dicer associated miRNAs recruit RISC complex formation (16, 17), which represses
translation of targeted mRNAs. MicroRNAs require selected mismatches in base pairing
for functionality (B) Small interfering RNAs (siRNAs) are cleaved from long cytosolic
87
(Figure 4.1 continued) RNA, derived from viral infection or transposons, by the RNase
III enzyme Dicer. In humans, the Dicer/siRNA complex is a part of the RISC loading
complex (18) and promotes degradation of the mRNA target. siRNAs require full
complementarity to promote degradation.
Findings such as these suggest that this miRNA can act as a tumor suppressor as
well as a regulator of cell fate (24). The mechanism, however, by which let-7 regulates
gene expression still remains poorly understood. Here we specifically 3’-end label let-7a
miRNA using the fluorophore Cy3, with the ultimate goal of imaging its cellular
localization over time within living cells.
A central obstacle in the path of imaging small molecules in vivo is that of
reaching a sufficient signal-to-noise ratio. One fluorophore is often not enough to
effectively image the inside of a living cell. Typically, to overcome this problem, targets
are either immobilized in a single location (i.e., the cell membrane) or they are labeled
with multiple fluorophores sufficient to be seen above the auto-fluorescence of the cell.
In the case of miRNAs, these techniques are problematic, localization cannot be studied
after membrane immobilization, and miRNAs are too small to be labeled sufficiently to
counteract its fast diffusion (which leads to blurring when imaging). In order to achieve
the desired signal–to-noise ratio a suitable target is needed to concentrate the let-7
fluorescence and ensure specificity.
Only five of the over 100 endogenous targets for let-7a have more than four
binding sites in their 3' UTR and, of these, only one target, High Mobility Group protein
or HMGA2, has more than six sites (25). High Mobility Group A (HMGA) proteins

88
generally alter chromatin architecture and thus participate in the transcriptional regulation
of gene expression (26). They were originally isolated from mammalian cells, named
according to their electrophoretic mobility in polyacrylamide gels, and arbitrarily
classified as a specific type of nonhistone proteins, based on the observation that they are
ubiquitous in mammalian cells and are associated with isolated chromatin. HMGA2 has
been implicated in tumorigenesis due to transcriptional up-regulation and chromosomal
translocations in several types of tumors. Additionally, the HMGA2 3' UTR has seven
let-7 binding sites and disruption of these sites enhances oncogenic transformation (27,
28). The function of this up-regulation in tumorigenesis is as yet unclear, however, the
correlation between over-expression of HMGA2 and tumor growth may explain the
higher degree of let-7 regulation. For localization assays, the number of let-7 binding
sites within HMGA2 would allow for up to seven single-labeled let-7 miRNAs to be
associated with one mRNA, thus increasing the image quality and slowing the apparent
tumbling of the miRNAs after association with the larger molecule.
As a precursor to the in vivo work, we determine here the potential effect of let-7a
labeling on binding and complexation using in vitro complex formation assays with
human cell extract. Gel-based analysis shows Cy3-labeling biases protein complexes to
form with a single-stranded miRNA rather than with the double-stranded form. It is
unclear whether this bias will limit in vivo binding as the miRNA duplex is unwound
before mRNA recognition. Moreover, the extent of complexation is altered upon Cy3
labeling, showing limited ATP dependence and co-migration with complexes containing
human Dicer.

89
4.2 Materials and Methods
Preparation of Let 7 and HMGA2. All RNAs were synthesized by the HHMI
Biopolymer/Keck Foundation Biotechnology Resource Laboratory at the Yale University
School of Medicine, then deprotected and purified as previously described (29, 30).
Sequences were derived from the wild-type let 7a target scan sequence (31) and were as
follows: Let-7a Antisense strand 5´-P-UGA GGU AGU AGG UUG UAU AGU U-(
Amino C7)-3´; Let-7 Sense strand 5´-P-CUA UAC AAU CUA CUG UCU UUC C-3´,
Prelet-7 Antisense strand 5´-P-UGG GAU GAG GUA GUA GGU UGU AUA GUU-(
Amino C7)-3´; Prelet-7 Sense strand 5´-P-CUA UAC AAU CUA CUG UCU UUC CUA-
3´, where P denotes a 5´-phosphate and (Amino C7) denotes a phosphoramidite of the
same name from Glen Research. The antisense strands were also synthesized with only
one or no modifications wherein the Amino C7 linker or the unlabeled 5' P was removed.
HMGA2 cDNA (pCMV•SPORT6.1) was provided by the Bartel lab and prepared as
previously described (25). cDNA was amplified by PCR from the pCMV•SPORT6.1
plasmid with the forward primer containing the T7 promoter sequence (Forward T7 UTI
2: TAA TAC GAC TCA CTA TAG GG CAG ATA TCC AGC ACA GTG G and
Reverse 2UTR: TCG AAG GGC CCT CTA GAC TC) or by direct transcription from a
pEF6 plasmid containing HMGA2 subcloned downstream of a T7 promoter. Products
were run on a 0.7% Agraose gel and eluted using 1mM EDTA. Transcriptions were done
with T7 RiboMax Express Kit (Promega), Maxiscript (Applied Biosystem), and
MegaScript (Applied Biosystem) as per manufactures instructions.
90
EMSA. For radioactive EMSAs, the non-phosphorylated antisense strand was
first 5´-32P labeled with T4 polynucleotide kinase (PNK) and γ-32P-ATP at an RNA
concentration of 800 nM. PNK was inactivated by heating to 90 °C for 10 min, then the
5´ phosphorylated complementary strand was added in 2-fold molar excess and the
reaction slowly cooled to room temperature to anneal the two strands. The miRNA
duplex was further purified by polyacrylamide gel electrophoresis on a 20% (v/v)
nondenaturing gel. The duplex miRNA was cut out, eluted overnight into 1 mM EDTA at
4 oC, ethanol precipitated, and dissolved in RNase-free water. Scintillation counting was
done on a Beckman LS6500 Multipurpose Scintillation Counter. EMSAs were performed
as described previously (32) on 10-cm non-denaturing 4, 12, or 20% (v/v)
polyacrylamide gels in 0.5x TBE (44.5 mM Tris-Borate, 1 mM EDTA) and run at 500 V
and 4 oC for 2 h. p19, at varying final concentrations, was added to radio-labeled siRNA
duplex (50,000 cpm, < 400 pM of 5´-32P labeled duplex) in 10 μL standard buffer and
incubated for 0.5 h. Next, 10 μL non-denaturing loading buffer (10% glycerol, 0.5x TBE,
0.025% bromophenol blue, and 0.025% xylene cyanol) was added and each sample
loaded onto a 12% (v/v) polyacrylamide gel.
RISC Assembly Complex Formation. Let7a (synthesized as above) was labeled
with Cy3 monoreactive dye, containing NHS-Ester purchased from GE Healthcare
(PA23001), by combining up to 30 nmoles of RNA dissolved in 11μl water, 75 μL of 0.1
Sodium tetraborate pH 8.5, and 200 mg of Cy3 dye dissolved in 14 μL of DMSO.
Labeling reaction was tumbled overnight at 25 oC, then ethanol precipitated with (3 vol
ETOH, 0.1 vol 3 M NaOAc, and 0.01 vol 100mM NTP) at -20 oC overnight. Samples
91
were purified using reverse phase High Pressure Liquid Chromatography and
concentrations determined by a Beckman 640B UV spectrophotometer. To observe RISC
assembly complexes 15 % (v/v) cytosolic HeLa cell extract (Jena Bioscience) was
incubated with 100 nM Cy3 labeled let-7 or < 400 pM radiolabeled miRNA antisense
strand or duplex (prepared as above) in a final volume of 10 μL HeLa buffer [8% (v/v)
Lysis Buffer (23.7 mM HEPES, pH 7.5, 79 mM potassium acetate, 1.58 mM magnesium
acetate, 5 mM DTT, and 1 mg/ml Perabloc SC (Roche)), supplemented with 20% (v/v)
5x RNAi mix (125 mM creatine phosphate, 5 mM ATP, 25 mM DTT), 2% (w/v) creatine
kinase, and 20% (v/v) RNA guard RNase Inhibitor (GE Bioscience)] for 0.5 h at 4 oC,
unless otherwise specified. ATP depletion experiments were done by addition of 1 μL of
100 mM glucose and omitting ATP generating system. Multiple transcription products of
HMGA2 mRNA were added at 10% (v/v) to Hela cell complexes preformed with radio-
labeled let-7 (as described above).
Western Blots for Dicer Detection. RISC assembly complexes were formed as
described above, but scaled up 6-fold for western detection. Non-denaturing 12%
polyacrylamide gels were soaked in 0.1% (w/v) SDS for 15 min and then electroblotted
in Tris-Glycine transfer buffer (25 mM Tris, 25 mM Glycine) onto a PVDF
(Polyvinylidene Fluoride) membrane (Immobilon-P Membrane, Millipore) over 75 min at
300 mA, using a Bio-Rad Trans-Blot SD semi-dry transfer cell per the manufacturer’s
instructions. After transfer, the proteins were fixed to the membrane by incubating in 5-
10% (v/v) acetic acid, rinsing with deionized water, and air-drying. The membrane was
probed with a rabbit primary antibody against Dicer (Santa Cruz Biotechnology),

92
followed by a goat anti-rabbit secondary antibody, conjugated with horseradish
peroxidase (Zymed, Invitrogen). The blot was developed using a peroxide/enhancer
solution (ECL-Plus detection, Amersham), and visualized on a Typhoon 9410 Variable
Mode Imager.

93
4.3 Results
Complex Formation between Radio-labeled Let-7 and HeLa cell Extract
Components
Let-7a duplexes were 5` end labeled with radioactive γ-32P-ATP (Figure 4.2A).
The labeled duplex was then incubated with S100 cytosolic HeLa cell extract and
complexes were resolved on polyacrylamide gels. We observed that six bands formed in
the presence of extract, which we labeled complex I – complex VI, respectively (Figure
4.2B). These miRNA-containing complexes show variations in relative abundance, with
complexes I, II, and IV consistently the most prominent and limiting amounts of
complexes III and VI (Figure 4.2C). These complexes were compared to those formed
with a luciferase targeting siRNA duplex of similar size, also 5’ end labeled with γ-32P-
ATP and incubated with HeLa extract (Figure 4.2C). Only three complexes of relatively
equal abundance were formed in the presence of the siRNA duplex, consistent with our
previous results (Figure 2.4), and were labeled complex D, C2, and C1, respectively
(Figure 4.2C).
When comparing their evolution over time, miRNA complexes exhibit increased
stability, whereas siRNA complexes increased by ~3-fold over a two-hour period (Figure
4.2C). Additionally, complex I runs comparably to the siRNA complex C1, at 10 and
120 min incubations, while micro-RNA complex III compared with the siRNA complex
C2 at both incubation times (Figure 4.2C). Complex V, however, consistently runs lower
than the siRNA complex D, whereas complex VI runs higher at both 10 and 120 min.
Complex D was shown previously to be the only Dicer-containing siRNA band,

94
suggesting that complexes V and VI are distinct from the Dicer:siRNA complex (Figure
2.4).
Figure 4.2 Complex Formation of Radio-labeled Let-7a. (A) Sequence of let-7a and
prelet-7a duplexes (B) Complex formation between let-7 duplexes and cytosolic HeLa
cell extract. Lanes 3-6 include full-length HMGA2 messenger RNA transcripts. Lanes
7-10 include the 3` UTR only. (C) Time-course of miRNA vs siRNA complex formation.
Let-7 only (lane1). Complexes formed between radio-labeled siRNA and cytosolic HeLa
cell extract after a 10 min incubation (lane 2), plus addition of 100 nM of unlabeled
siRNA (lane 3). Let-7 complexes after a 10, 30, 60 and 120 min incubation (lanes 4, 6, 8

95
(Figure 4.2 continued) and 10), plus addition of 100 nM of unlabeled let-7 duplex (lanes
5, 7 , 9 and 11). siRNA complexes after a 120 min incubation (lane 12), plus addition of
100 nM of unlabeled siRNA (lane 13). SiRNA only (lane 14). (D) EMSA assay between
p19 and let-7. (E) Graph of p19 concentration verses fraction of bound let-7 miRNAs.
Addition of unlabeled let-7 duplexes competed with most complexes as expected,
but also shifted relative abundance. Complexes II, IV, V, and VI were completely
depleted in the presence of 100 nM of unlabeled let-7 duplex (Figure 4.2C). Complex III
was retained at approximately the same abundance in the presence or absence of
unlabeled let-7 duplex, and the abundance of complex I increased by 2-fold at all time-
points upon addition of unlabeled let-7 (Figure 4.2C). Similarly, complexes C1 and C2
were retained in the presence of unlabeled siRNA after 120 min, whereas complex D
showed complete depletion over the same time frame (Figure 4.2C). The similarities
between the miRNA complexes I and III and that of siRNA complexes C1 and C2
suggest they may represent similar non-RISC-related complexes formed in the presence
of modified small RNAs.
p19 Binds miRNAs with the Same Affinity as siRNAs
Due to the observed differences in complex formation between the siRNA and
miRNA duplexes, the effect of sequence as compared to structural changes were probed
by binding of a sequence-independent viral protein, p19. p19 is a highly conserved
pathogenicity factor encoded by the tombusvirus family of viruses to bind siRNAs and
competes with Dicer in vivo. We have shown p19 to have a strong affinity for siRNA

96
duplexes (Figures 2.2 and A2D), and it is known to bind independent of sequence (33).
Sequence-independence is achieved by homodimers of the protein binding siRNA
duplexes in a positively charged surface cleft and stacking on both terminal base pairs to
establish a caliper-like size selection for duplexes with 19 base pairs and 2-nucleotide
long 3´-overhangs (32, 34, 35). miRNAs, with their inherent mismatches, were initially
assumed to be potentially weaker substrates for p19 .
To test for miRNA binding by p19, radioactive electrophoretic mobility shift
assays (EMSAs) were performed wherein the miRNA duplex was incubated with purified
p19 (Figure 4.2D). The apparent equilibrium dissociation constant for the p19:miRNA
complex was measured as KD,app = 0.16 ± 0.02 nM (Figure 4.2D,E), which is identical,
within experimental error, of the dissociation constant measured for the siRNA:p19
complex (KD,app = 0.17 ± 0.03 nM) (Figure A2).
Messenger RNA Addition Produces no Effect on miRNA Complexes
To determine the effect messenger RNA addition has on formation of miRNA
complexes in HeLa cell extract, HMGA2 target mRNA was transcribed using a T7
promoter either from a plasmid containing the entire HMGA2 sequence or a PCR product
of only the 3’UTR of HMGA2. Radio-labeled miRNA duplexes were incubated, as
above, with cytosolic HeLa cell extract to form complexes I-VI, then either full-length
HMGA2 or the 3’UTR only was added and analyzed by EMSA to determine migration
differences (Figure 4.2B). No change in migration was observed due to the addition of
mRNA for either full length or 3’ UTR HMGA2 constructs (Figure 4.2B). We
hypothesize that transcripts may be degraded in extract due to a lack of a 5`-end cap, or

97
that saturating endogenous transcripts are available and contributing to any RISC related
complexes currently observed. Additionally, HMGA2 mRNA may simply not bind a
miRISC or other complex in vitro.
Figure 4.3 Complex Formation of Cy3-labeled Let-7a. (A) Position of Cy3 labeling
and sequence of let-7a and prelet-7a duplexes (B) Complex formation between single or
double-stranded Cy3 let-7a and prelet-7. Addition of 15%, 5%, or 0% (v/v) Hela cell
extract to double-stranded prelet-7 (lanes 1-3), single-stranded prelet-7 (lanes 4-6),
double-stranded let-7 (lanes 7-9), and single-stranded let-7 (lanes 10-12), respectively.
(12% non-denaturing gel, run 4 h at 4o C) (C) ATP dependence of Cy3 let-7 complexes.
Double-stranded let-7 incubated with HeLa cell extract and either (+) an ATP generating
98
(Figure 4.3 continued) system, with and without HMGA2 3`UTR (lanes1 and 2
respectively), or (-) an ATP generating system, with and without HMGA2 3`UTR (lanes
3 and 4 respectively). Lanes 4-8 contain single-stranded let-7 with additions identical to
lanes 1-4, respectively. Duplex (lanes 9-10) or single-stranded let-7 (lanes 11-12) plus or
minus HMGA2 mRNA. (12% non-denaturing gel, run 2 h at 4o C) ATP was depleted in
extract by addition of glucose and hexokinase. Double and single-stranded let-7 ran
similarly for the above gel conditions. (D) Double or single-stranded Cy3 let-7,
respectively, (+ or -) HMGA2 mRNA and Hela cell extract (lanes 1-4), purified Ago2
protein (lanes 5-8) or no proteins (lanes 9-12). (E) Comparison of Cy3 let-7 and
fluorescein labeled siRNA complexes in cytosolic HeLa cell extract . Lanes 1-5 contain
respectively, dyes only (XCB and BPB), single-stranded Cy3 let-7, single-stranded
fluorescein labeled siRNA, double-stranded Cy3 let-7, and double-stranded fluorescein
labeled siRNA.
Cy3 labeled Let-7 Bias Complexes Toward Single-Strand Binding
In preparation for in vivo fluorescence assays, we next 3` end labeled the
antisense strand of the let-7a miRNA with the fluorescent dye Cyanine 3 or (Cy3) (Figure
4.3A). We initially characterize the in vitro binding and efficacy of the fluorescently
tagged miRNA for complex formation. Single-stranded Cy3 labeled let-7 formed eight
complexes, in EMSAs containing 15 or 5% (v/v) cytosolic HeLa cell extract and a
creatine phosphate ATP generating system (Figure 4.3B), complexes were labeled 1-8
respectively. We mimic the natural hairpin precursor to the mature let-7a with an
extended 24-mer (prelet-7a). Similarly, Cy3 labeled single-stranded prelet-7a formed

99
eight complexes, yet bands appeared shifted when compared with let-7 complexes
(Figure 4.3B). For let-7 and prelet-7a, we observed limited binding between the duplex
form of the miRNA and the human cytosolic cell extract (Figure 4.3B). To obtain
information regarding the ATP dependence of these complexes, ATP was depleted in the
HeLa cell extract by addition of glucose and hexokinase and removed by omitting the
ATP generating system. Only complex 8 showed a marked dependence on ATP, and was
reduced in the ATP(-) extract by 50% (Figure 4.3C).
From here we sought to establish the binding ability of a HMGA2 mRNA for Cy3
let-7. No shift was observed in the presence of HMGA2 mRNA and binding was not
facilitated by the addition of ATP (Figure 4.3C), purified Ago2 protein (Figure 4.3D), or
HeLa cell extract alone or in combination (Figure 4.3C,D).
Formation of siRNA complexes was also inhibited by fluorescent labeling.
Double-stranded fluorescein labeled siRNA formed only one complex in extract as
compared to three seen for the radio-labeled species (Figure 4.3E). Single-stranded
fluorescein labeled siRNA formed a much slower running complex comparable to the
microRNA complex 8 (Figure 4.3E).

100
Figure 4.4 Western blots against Dicer. (A) Lanes 1-4 contain recombinant human
Dicer (Genlantis Inc), a no protein control, double-stranded let-7 with HeLa cell extract,
and single-stranded let-7 with HeLa cell extract imaged by western blots against Dicer.
Lane 5 is a duplicate of lane 4, excised before western detection and imaged for Cy3. (B)
Lane 1 contains double-stranded prelet-7 with HeLa cell extract imaged for Cy3. Lanes
2-5 contain double-stranded prelet-7 with HeLa cell extract, single-stranded prelet-7 with
HeLa cell extract, recombinant human Dicer (Genlantis Inc), and a no protein control
imaged by western blot. Western and Cy3 images were aligned using ImageJ software.

101
Western Blots show Dicer Co-migration with Single-stranded Complexes
To determine if specifically complex 8 or any of the Cy3 let-7 single-stranded
complexes contain the enzyme Dicer Western blots were performed. Single-stranded let-
7 complexes were scaled up for Western detection and formed as stated above. Dicer ran
in two bands for both single- and double-stranded let-7, corresponding to complex 3 and
complex 8 in the Cy3 scan (Figure 4.4A). Identical Dicer bands were formed for double-
stranded let-7 as for the single-stranded case despite there being no visible double-
stranded complexes in previous gels. Conversely, double-stranded prelet-7 formed a
single band in a scaled up lane image for Cy3 (Figure 4.4B). This complex corresponded
to the slower migrating of the two Dicer bands visible in the Western. Again two Dicer
bands were seen in the presence of single- or double-stranded prelet-7 without any visible
band running parallel to the faster migrating Dicer band (Figure 4.4B).
4.4 Discussion
The family of let-7 micro-RNAs is important for cell differentiation and the
timing of cell fate in a host of organisms. They down-regulate a potentially tumor-
causing protein, HMGA2, which contains seven let-7 binding sites in the 3`untranslated
region of its mRNA (27). We observe by EMSA six complexes formed when mixing
radio-labeled let-7a duplexes and human cytosolic extract in vitro (Complexes I-VI). All
complexes are relatively stable over time and do not appear to be affected by either the
full-length mRNA or the 3`UTR of HMGA2 mRNA targets (Figure 4.2B,C).

102
When comparing with the three complexes formed in the presence of siRNA
duplexes (complexes D, C2, and C1), microRNA complexes I and III show overlap in
migration with complexes C1 and C2, respectively, suggesting non-specific RNA binding
(Figure 4.2C). Addition of unlabeled miRNAs or siRNAs competes off all complexes
except C2, III, and I; complex I alone increases in relative abundance in the presence of
unlabeled miRNA at all times observed (Figure 4.2C). The siRNA-containing complex
D does not appear to overlap with any of the miRNA complexes and is the only siRNA
complex that contains the enzyme Dicer (Figure 2.4C).
Despite stark differences in complex formation, sequence, and structure of si and
miRNAs, we measure identical binding affinities with the viral RNA silencing suppressor
protein 19 (p19). p19 binds siRNAs independent of sequence, but is thought, based on
crystallographic (32, 34) and MD simulation evidence (35), to recognize the structure and
length of an siRNA by stacking on terminal tryptophans. This binding prevents
incorporation of the siRNA into the RISC machinery and suppresses RNAi. Variation in
siRNA length by as little as 2 nucleotides has been shown to significantly reduce p19’s
binding affinity. miRNAs were assumed to be potentially weaker binding partners for
p19 owing to differences in structure. We observe a binding affinity between p19 and
let-7a miRNA identical to that between p19 and a luciferase targeting siRNA, which is
consistent with structural data observing minimal RNA duplex disruption due to
sequence mismatches (36).
This finding has dual significance in that it shows that differences in base pairing
may not be the only factor contributing to the observed differences in gel electrophoretic
mobility between the complexes formed with siRNA and miRNA in HeLa cytosolic cell

103
extract. Secondly, although miRNA:p19 binding has been observed in vivo (33), the
mechanism of p19’s functionality and its usefulness as an RSS is challenged when
miRNAs compete for p19 binding with p19’s siRNA targets. Also, the ternary complex
between p19, Dicer, and siRNA, defined in Chapter 2, is ever more important for
explaining the specific shuttling of siRNAs to p19 proteins in the presence of a constant
miRNA competitor (Figure 2.3).
With regards to miRNA action, there are still many unanswered questions such
as: Where do miRNA/mRNA complexes localize in vivo? Do they end up in punctate P-
bodies, diffuse in the cytosol, or aggregate as large or small clusters? Do miRNAs
remain associated with mRNAs over long or short times? Once associated with RISC,
how often are miRNAs turned over? Is there any heterogeneity in the mechanism of
action of a specific miRNA between cells (or even within a single cell)? And how does
p19 binding effect miRNA localization?
All these questions can be addressed with appropriate in vivo localization for
which we will choose a fluorescence detection assay that lends itself well to intercellular
miRNA localization for a number of reasons. The first is that single-labeled miRNAs
diffuse too quickly for accurate detection in vivo, but binding to an mRNA would
associate the fluorescence with a larger molecule that would diffuse much more slowly.
Also, HMGA2’s seven let-7 seed sequences would multiply the photon count, lighting
the complexes up like a Christmas tree and thus making them clearly distinguishable
above the cellular autofluorescence and any background from freely diffusing miRNAs.
Cy3 was initially chosen for let-7 labeling and compared in vitro to radio-labeled
constructs. Cy3 labeling reduces duplex binding in extract (Figure 4.3B) but promotes

104
binding of single-stranded let-7, leading to eight identifiable complexes (1-8) (Figure
4.3B,C). Amongst the complexes forming with single-stranded miRNA, only complex 8
shows a dependence on ATP and is depleted in ATP(-) extract. Complex 8 also co-
migrated with Dicer bands in Western blots (Figure 4.4A). Similar results were found for
a Cy3 labeled precurser let-7 (prelet-7) (Figure 4.4B).
HMGA2 messenger RNA binding was not observed for single or double-stranded
Cy3 let-7, and was not enhanced in the presence of ATP, Ago2 protein (a known miRNA
binding component of RISC), or HeLa cell extract (Figure 4.3C,D). Messenger RNA
transcripts without a 5` cap may be degraded in extract or may be competed away by
mRNAs present in the commercial extract used here due to insufficient RNase treatment.
ATP may facilitate RISC incorporation of single stranded miRNAs in the
presence of Cy3, however, as the miRNA duplex is widely considered the biologically
active form, a more conservative interpretation is that Cy3 labeling sterically interferes
with RISC protein binding and biases complex formation toward the single stranded
miRNA. Although Western blot analysis showed complex 8 to co-migrate with Dicer,
raising the intriguing possibility that Dicer may be binding single-stranded miRNA
directly, this does not reflect its in vivo activity. Alternative fluorophore and labeling
strategies will be explored for subsequent assays in vitro and in vivo to rule out the more
trivial explanations for our findings.
4.5 Acknowledgements
I would like to thank Melanie Sabbagh, Charity Haynes, and Aniruda Ratham for
their contributions to the reported characterization of Cy3 labeled let-7.
105
4.6 References
1. Davidson-Moncada J, Papavasiliou FN, & Tam W (MicroRNAs of the immune
system: roles in inflammation and cancer. Ann N Y Acad Sci 1183:183-194
2. Rodriguez A, Griffiths-Jones S, Ashurst JL, & Bradley A (2004) Identification of
mammalian microRNA host genes and transcription units. Genome Res
14(10A):1902-1910
3. Lee Y, et al. (2004) MicroRNA genes are transcribed by RNA polymerase II.
EMBO J 23(20):4051-4060
4. Denli AM, Tops BB, Plasterk RH, Ketting RF, & Hannon GJ (2004) Processing
of primary microRNAs by the Microprocessor complex. Nature 432(7014):231-
235
5. Han J, et al. (2004) The Drosha-DGCR8 complex in primary microRNA
processing. Genes Dev 18(24):3016-3027
6. Ketting RF, et al. (2001) Dicer functions in RNA interference and in synthesis of
small RNA involved in developmental timing in C. elegans. Genes Dev
15(20):2654-2659
7. Grishok A, et al. (2001) Genes and mechanisms related to RNA interference
regulate expression of the small temporal RNAs that control C. elegans
developmental timing. Cell 106(1):23-34
8. Yekta S, Shih IH, & Bartel DP (2004) MicroRNA-directed cleavage of HOXB8
mRNA. Science 304(5670):594-596

106
9. Du T & Zamore PD (2005) microPrimer: the biogenesis and function of
microRNA. Development 132(21):4645-4652
10. Filipowicz W, Bhattacharyya SN, & Sonenberg N (2008) Mechanisms of post-
transcriptional regulation by microRNAs: are the answers in sight? Nat Rev Genet
9(2):102-114
11. Carthew RW & Sontheimer EJ (2009) Origins and Mechanisms of miRNAs and
siRNAs. Cell 136(4):642-655
12. Ding SW & Voinnet O (2007) Antiviral immunity directed by small RNAs. Cell
130(3):413-426
13. Ji X (2008) The mechanism of RNase III action: how dicer dices. Curr Top
Microbiol Immunol 320:99-116
14. Siomi H & Siomi MC (2009) On the road to reading the RNA-interference code.
Nature 457(7228):396-404
15. Liu J, et al. (2004) Argonaute2 is the catalytic engine of mammalian RNAi.
Science 305(5689):1437-1441
16. Chendrimada TP, et al. (2005) TRBP recruits the Dicer complex to Ago2 for
microRNA processing and gene silencing. Nature 436(7051):740-744
17. Gregory RI, Chendrimada TP, Cooch N, & Shiekhattar R (2005) Human RISC
couples microRNA biogenesis and posttranscriptional gene silencing. Cell
123(4):631-640
18. Wang HW, et al. (2009) Structural insights into RNA processing by the human
RISC-loading complex. Nature structural & molecular biology 16(11):1148-1153

107
19. Lewis BP, Burge CB, & Bartel DP (2005) Conserved seed pairing, often flanked
by adenosines, indicates that thousands of human genes are microRNA targets.
Cell 120(1):15-20
20. Chen K & Rajewsky N (2007) The evolution of gene regulation by transcription
factors and microRNAs. Nat Rev Genet 8(2):93-103
21. Reinhart BJ, et al. (2000) The 21-nucleotide let-7 RNA regulates developmental
timing in Caenorhabditis elegans. Nature 403(6772):901-906
22. Calin GA, et al. (2004) Human microRNA genes are frequently located at fragile
sites and genomic regions involved in cancers. Proc Natl Acad Sci U S A
101(9):2999-3004
23. Takamizawa J, et al. (2004) Reduced expression of the let-7 microRNAs in
human lung cancers in association with shortened postoperative survival. Cancer
Res 64(11):3753-3756
24. Pasquinelli AE, et al. (2000) Conservation of the sequence and temporal
expression of let-7 heterochronic regulatory RNA. Nature 408(6808):86-89
25. Mayr C, Hemann MT, & Bartel DP (2007) Disrupting the pairing between let-7
and Hmga2 enhances oncogenic transformation. Science 315(5818):1576-1579
26. Kumar MS, et al. (2008) Suppression of non-small cell lung tumor development
by the let-7 microRNA family. Proc Natl Acad Sci U S A 105(10):3903-3908
27. Young AR & Narita M (2007) Oncogenic HMGA2: short or small? Genes Dev
21(9):1005-1009
28. Meyer B, et al. (2007) HMGA2 overexpression in non-small cell lung cancer.
Mol Carcinog 46(7):503-511

108
29. Walter NG (2002) Probing RNA structural dynamics and function by
fluorescence resonance energy transfer. Curr. Protocols Nucleic Acid Chem), pp
11.10.11-11.10.23.
30. Hoerter JA & Walter NG (2007) Chemical modification resolves the asymmetry
of siRNA strand degradation in human blood serum. RNA 13(11):1887-1893
31. Friedman RC, Farh KK, Burge CB, & Bartel DP (2009) Most mammalian
mRNAs are conserved targets of microRNAs. Genome Res 19(1):92-105
32. Vargason JM, Szittya G, Burgyan J, & Hall TM (2003) Size selective recognition
of siRNA by an RNA silencing suppressor. Cell (115):799-811.
33. Lakatos L, Szittya G, Silhavy D, & Burgyan J (2004) Molecular mechanism of
RNA silencing suppression mediated by p19 protein of tombusviruses. EMBO J
23(4):876-884.
34. Ye K, Malinina L, & Patel DJ (2003) Recognition of siRNA by a viral suppressor
of RNA silencing. Nature (426):874-878.
35. Xia Z, Zhu Z, Zhu J, & Zhou R (2009) Recognition mechanism of siRNA by viral
p19 suppressor of RNA silencing: a molecular dynamics study. Biophys J
96(5):1761-1769
36. Nemecek D, Vaisocherova H, Stepanek J, & Turpin P Y (2005) Structural
features of a central mismatch in oligonucleotide hybrid duplexes visualized via
Raman spectroscopy: model system for evaluation of potential "antisense" drugs.
Biopolymers 79(1):1-8

109
Chapter 5:
SUMMARY AND FUTURE DIRECTIONS
5.1 Summary
RNA, now considered as a primary effector of gene regulation, interferes in the
progression of an invading virus to suppress or silence viral infection (1-6). RNA
interference (RNAi) is initiated by double-stranded RNA, produced during viral
replication and cleaved in the cytoplasm by the RNAse III enzyme Dicer. Dicer
produces small-interfering RNA (siRNA) that act as guides for the cellular RNAi
machine, RISC, to degrade complementary viral messenger RNAs (mRNA) (7-10). The
effect of mRNA degradation reduces viral protein production, cytotoxicity, symptom
spread, and ultimately halts the progression of infection.
As a countermeasure to RNAi, most effective viruses have evolved elaborate
mechanisms of invasion. One of the earliest viral strategies observed was the production
of an RNAi suppressor protein, or RSS, to short-circuit mRNA degradation and recover
infection phenotype (11-13). The tombusviridae class of viruses produce an RSS, termed
p19, as their primary defense against RNAi, which binds Dicer-produced siRNAs
independent of sequence to prevent incorporation into RISC and subsequent degradation
(14). p19 measures the siRNA duplex length through stacking interactions of

110
tryptophans on the terminal bases, and is commonly described as sequestering siRNAs
away from the RNAi machinery (15-17).
Here, we characterize the interaction between p19 and the RNAi pathway to
further elucidate its mechanism. We observe that p19 binds reversibly to siRNAs with a
fast association ((1.69 ± 0.07) × 108 M-1s-1) and dissociation (0.062 ± 0.002 s-1 ) rate
constant, suggesting the possibility of a multi-turnover mechanism for its mode of action
against RNAi (Figure 2.2). Competition between the Dicer enzyme and p19 shows
higher than expected vulerability of siRNA:Dicer complexes to p19, and a lower than
expected effect of Dicer on siRNA:p19 binding than expected from a simple free-siRNA
capture mechanism, (Figure 2.3). This result suggests the presence of a ternary complex
between siRNA, Dicer, and p19. Only the assumption of such a transient ternary
complex intermediate can explain the observed efficient shuttling of an siRNA toward the
p19 bound state. A simple model based on this mechanism yields evidence for an >20-
fold bias in dissociation equilibrium constant for the ternary complex to dissociate into
the siRNA:p19 complex rather than the siRNA:Dicer complex. Additionally, we observe
p19 to compete strongly with human Dicer and to a lesser extent with fully mature RNAi
complexes, suggesting p19’s interaction with Dicer as the primary entry point for
suppression of the RNAi pathway (Figure 2.4).
Computational modeling is employed to describe the impact of exogenously
introduced p19 on the expression of a messenger RNA targets. We find p19 action to be
concentration dependent and able to significantly increase the peak amount of mRNA
produced and extend the length of the viral replication phase (Figure 3.3A). Our model
also predicts p19 to time invariantly reinitiate viral replication after steady-state

111
suppression has been reached (Figure 3.3B). This time invariance allows p19 to be
potentially used as a tool to extend mRNA rising phase duration for a gene of interest
(Figure 3.4).
Exogenous viral infection is only one of many sources of double-stranded RNA
that can activate RNAi. Endogenously produced transcripts are also cleaved by Dicer
into microRNAs (miRNAs) that are bound by RISC and induce translational repression
as opposed to cleavage of mRNA targets. miRNAs differ from siRNAs in that they are
neither fully complementary in their duplex form nor in their binding to mRNA targets.
Underscoring these differences in mechanism, we observe distinctly different complexes
formed in the presence of miRNAs as opposed to siRNAs in human cell extract (Figure
4.2B,C). Interestingly, miRNAs and siRNAs show an identical affinity for binding p19
(Figure 4.2D,E), suggesting that the ternary complex between siRNAs, Dicer, and p19 is
ever more important for specifically shuttling siRNAs to p19 proteins in the presence of a
constant miRNA competitor (Figures 2.3 and 4.2).
Viral counter-suppression by p19 can act as a model system for the use of an RSS
in RNAi-suppression and, analogous to immunosuppressants in modern organ transplant
surgery, p19 can be used as an offset to the RNAi response for applications such as plant-
based vaccines and genetic therapy. From our experimentation and mathematical
modeling we postulate the following principles for optimization of p19 and its impact on
RNAi efficiency.
112
Principles for p19 Interaction with RNAi-Based Applications
(1) Proximity- p19 expressed close to the source of infection maximizes the benefit
of siRNA shuttling through its ternary interaction with Dicer.
(2) Increased concentration- Higher p19 concentrations produce increased viral
mRNA production, longer rising phases, and slower suppression, thus increasing
the observed duration of infection.
(3) Timing of Incubation- Optimal incubation times scale linearly with the effective
concentration of p19 in the cell.
(4) Timing of Introduction- Addition of p19 before full suppression of infection
increases the rising phase of mRNA production and the time needed to reach peak
mRNA levels. Late introduction of p19 is observed to reinitiate mRNA
accumulation even after equilibrium has been reached.
Drawbacks and Concerns
(1) Dormant viruses- The effectiveness of p19 is not specific to the gene of interest
due to its ability to bind siRNAs and other small RNA, independent of sequence.
This feature can be a source of off-target effects including up-regulation of other
normally RNAi suppressed targets such as transposons.
(2) Long Incubation Times- Maximum efficiency comes at the cost of longer
incubation times of greater than 8-fold the original infection.

113
(3) Significance of Sustained Dosing- Sufficient sustained dosing of p19 may be a
challenge for conventional promoters used in stable cellular transfection.
Introduction of a low dose of p19 early in the infection window leads to limited, if
any, discernable difference in yield.
Some of these principles are consistent with prior experimental studies suggesting
the RNAi pathway actively suppresses viral infection by showing viral production can be
reinitiated by knockdown of Dicer or Drosha (18). We observe, in the absence of p19,
relatively high levels of viral siRNAs that remain bound to Dicer and RISC even after the
infection has been suppressed, supporting active repression of viral mRNA by the RNAi
pathway (Figure 3.2). Other predictions remain to be experimentally tested. For
application specific goals, p19 and other RSS's offer an alternative approach for the
regulation of RNAi and provide a platform for controlling dosing. Understanding and
modeling relevant biophysical properties in the presence of RSSs, as advanced here, is
therefore anticipated to become critical for broader and safer use of RNAi therapeutics in
human disease control.

114
5.2 Future Directions
Kinetic Characterization of eukaryotic RSS's and their Applications to
Therapeutics
While RNAi is a powerful host immune response, triggered by emergent viruses
or transposons, virus-encoded RNA silencing suppressor proteins or RSS's represent a
central mechanism for sustained viral infection in the presence of active RNAi. Due to
their high conservation and the reduction of viral phenotype in the absence of RSSs,
suppressor proteins may represent ideal drug targets for stemming symptom spread and
cytotoxcity.
RSS's are found primarily in plant viruses where they must contend with host
amplification of siRNAs by RNA dependent RNA Polymerases (RdRps). Studies show
that the relative strengths of these two factors, along with other plant defense
components, can critically influence the outcome of virus infections (20). Human and
other eukaryotic viral RNAi suppressors that do not combat RdRps seem to be further
specialized for human cells and exhibit increased viability for conventional gene therapy
(19).
To target human cells, the techniques described in Chapter 2 could be employed
for kinetics testing and future biochemical and biophysical characterization of various
RSS proteins. Additionally, the ternary complex between the RSS p19, siRNA, and
human Dicer could be experimentally isolated by HPLC or anti-p19 antibody shift assays
to confirm our computational findings and provide for an avenue to test the stability and
find conditions for disruption of such a complex.

115
Modeling Extension(s)
As RNAi is gaining momentum as a potential therapeutic strategy, with drug
design on the horizon, it is difficult to predict the direct outcome of genetic silencing by
experimental means only, due to the lack of known contributing enzymes and kinetic
constants. Here modeling will become a key tool in interpreting the interplay between
RNAi components and human diseases. Accuracy of results from mathematical and
computer models of RNAi are in this case complicated by the presence of uncertainties in
the experimental data that are used to estimate parameter values.
Ranked Sensitivity Analysis (RSA) is a method for dealing with uncertainty by
sampling the entire parameter space for each variable. This approach overcomes
uncertainty limitations and provides a global sensitivity coefficient to rank the effect of
multiple variations on the system output. RSA has been used successfully on HIV (21),
compartmental ordinary differential equation (22), and agent-based models (23) to
determine sensitivity, but has not as yet been used to study the RNA interference
pathway.
Principle Component Analysis (PCA) is a more sophisticated formal sensitivity
analysis that evaluates the relationship between parameters and solutions, not only the
variation in the output. The use of PCA on HIV models was developed at the University
of Michigan, and offers new insights into nontrivial relationships between model
parameters (24). Again, this analysis has not been applied to RNA interference
modeling.
116
Future work using this two-tiered approach to careful sensitivity analysis would
give confidence weighting to experimentally derived parameters as well as assign priority
to parameters most vital to the predicted outcome, yielding a filtered set of complex
scenarios that can be further tested by experiment.
Single molecule investigations of HMGA2:Let7 binding
Single molecule studies have provided new methods for observing previously
unattainable information on the dynamics, behavior, and the mechanisms of action
between individual molecules, as well as heterogeneity among different molecules within
a population (25). Overcoming the limitations of bulk measurements, single molecule
techniques would allow HMGA2/let-7 binding to be characterized for each of HMGA2’s
seven let-7 binding sites. Previous studies have shown each of the seven binding sites to
be relevant and contributing to HMGA repression (26). Single molecule techniques are
well suited to measure the binding kinetics of all let-7 binding sites of HMGA2 and their
interaction with microRNA loaded RISC. Continuing members of the Walter lab will be
pursuing this question to uncover detailed information regarding the HMGA2/let-7
interaction.
Fluorescent localization of Let7 targeting in vivo
After their incorpoaration into RISC, little is known about what happens to an
siRNA/miRNA and its mRNA target. It is not known whether the mRNA is degraded,
permanently sequestered into p-bodies, or recycled for further use. To probe these
mechanistic features of the RNAi pathway, continuing members of the Walter lab will

117
pursue the in vivo and in vitro characterization studies begun in Chapter 4. Variations on
the labeling of 3'-Cy3-labeled let-7a should be generated and characterized.
5.3 References
1. Fire A, et al. (1998) Potent and specific genetic interference by double-stranded
RNA in Caenorhabditis elegans. Nature 391:806-881.
2. Castanotto D & Rossi JJ (2009) The promises and pitfalls of RNA-interference-
based therapeutics. Nature 457(7228):426-433
3. Carthew RW & Sontheimer EJ (2009) Origins and Mechanisms of miRNAs and
siRNAs. Cell 136(4):642-655
4. Lee SK & Kumar P (2009) Conditional RNAi: towards a silent gene therapy. Adv
Drug Deliv Rev 61(7-8):650-664
5. Grimm D (2009) Small silencing RNAs: state-of-the-art. Adv Drug Deliv Rev
61(9):672-703
6. Umbach JL & Cullen BR (2009) The role of RNAi and microRNAs in animal
virus replication and antiviral immunity. Genes Dev 23(10):1151-1164
7. Collingwood MA, et al. (2008) Chemical modification patterns compatible with
high potency dicer-substrate small interfering RNAs. Oligonucleotides 18(2):187-
200
8. Kim DH, et al. (2005) Synthetic dsRNA Dicer substrates enhance RNAi potency
and efficacy. Nat Biotechnol 23(2):222-226

118
9. Ji X (2008) The mechanism of RNase III action: how dicer dices. Curr Top
Microbiol Immunol 320:99-116
10. Siomi H & Siomi MC (2009) On the road to reading the RNA-interference code.
Nature 457(7228):396-404
11. Qu F & Morris TJ (2005) Suppressors of RNA silencing encoded by plant viruses
and their role in viral infections. FEBS Lett 579(26):5958-5964
12. Roth BM, Pruss GJ, & Vance VB (2004) Plant viral suppressors of RNA
silencing. Virus Res 102(1):97-108
13. Voinnet O (2001) RNA silencing as a plant immune system against viruses.
Trends Genet 17(8):449-459
14. Scholthof H (2006) The Tombusvirus-encoded P19: from irrelevance to elegance.
Nat Rev Microbiol (4):405-411.
15. Vargason JM, Szittya G, Burgyan J, & Hall TM (2003) Size selective recognition
of siRNA by an RNA silencing suppressor. Cell (115):799-811.
16. Ye K, Malinina L, & Patel DJ (2003) Recognition of siRNA by a viral suppressor
of RNA silencing. Nature (426):874-878.
17. Xia Z, Zhu Z, Zhu J, & Zhou R (2009) Recognition mechanism of siRNA by viral
p19 suppressor of RNA silencing: a molecular dynamics study. Biophys J
96(5):1761-1769
18. Triboulet R, et al. (2007) Suppression of microRNA-silencing pathway by HIV-1
during virus replication. Science 315(5818):1579-1582
19. de Vries W, et al. (2008) Increased virus replication in mammalian cells by
blocking intracellular innate defense responses. Gene Ther 15(7):545-552

119
20. Qu F, et al. (2005) RDR6 has a broad-spectrum but temperature-dependent
antiviral defense role in Nicotiana benthamiana. J Virol 79(24):15209-15217
21. M. BS, N. AA, B. GH, & O. KJ (2001) Predicting the unpredictable:
Transmission of drug-resistant HIV. Nature 7(9):1016-1020.
22. Ellwein LM, Tran HT, Zapata C, Novak V, & Olufsen MS (2008) Sensitivity
Analysis and Model Assessment: Mathematical Models for Arterial Blood Flow
and Blood Pressure. Cardiovascular Engineering 8(2):94-108.
23. Marino S, Hogue IB, Ray CJ, & Kirschner DE (2008) A methodology for
performing global uncertainty and sensitivity analysis in systems biology. J Theor
Biol 254(1):178-196
24. Bortz DM & Nelson PW (2004) Sensitivity analysis of a nonlinear lumped
parameter model of HIV infection dynamics. Bull Math Biol 66(5):1009-1026
25. Walter NG, Huang CY, Manzo AJ, & Sobhy MA (2008) Do-it-yourself guide:
how to use the modern single-molecule toolkit. Nat Methods 5(6):475-489
26. Mayr C, Hemann MT, & Bartel DP (2007) Disrupting the pairing between let-7
and Hmga2 enhances oncogenic transformation. Science 315(5818):1576-1579

120
Appendix A
Rawlings et al, Figure A1
Figure A1 Concentration dependence of siRNA:p19 dissociation kinetics. (A, B)
Doubly-labeled siRNA (50 nM) after addition of Dicer (5nM green dotted line) or Buffer
(black dotted line) respectively, followed by addition of p19 (500 nM, blue dotted line).
(C) Doubly-labeled siRNA (50 nM) was bound by p19 (500 nM, blue dotted line) after
which excess unlabeled siRNA was added at concentrations of 500 nM (red), 750 nM
(black), 1.5 μM (green), 3 μM (blue), respectively.

121
Rawlings et al, Figure A2
Figure A2 Competition between p19 and human Dicer for siRNA binding as shown
by EMSAs. siRNA (S) labeled with [γ_32P] ATP are bound to (A). Recombinant human
Dicer (D) (Genlantis Inc.) where Dicer concentrations are 0, 0.16, 0.25, 0.5, 2.5, 5, 10,
16, 50 ,100, 200 nM, respectively. Samples were incubated for 30 min before loading
onto a 12% nondenaturing polyacrylamide gel. (B). siRNA pre-incubated with [p19] =
0.16 nM for 30 min followed by Dicer addition as described above. (C). siRNA pre-
incubated with [p19] = 2.56 nM for 30 min followed by Dicer addition as described
above. (D). p19 only (P) where p19 concentrations are 0, 0.02, 0.04, 0.08, 0.16, 0.32,
0.64, 1.28, 2.56, 5.12 nM, respectively. Samples were incubated for 30 min before
loading onto a 12% nondenaturing polyacrylamide gel. (E). siRNA pre-incubated with
[Dicer] = 140 nM for 30 min followed by p19 addition as described in D.

122
Rawlings et al, Figure A3

123
Figure A3 Comparison of siRNA complex formation for different HeLa cell extract
concentrations and temperatures. (A) (lanes 1-2) 15% or 75% HeLa extract conditions
incubated with siRNA for 1 h at 4 oC, (lanes 3-4) incubated at 25 oC, (lanes 5-8)
incubated at 37 oC, and (lane 9) 93% HeLa cell extract in the absence of an ATP
generating system and in supplied buffer (20 mM HEPES-Na pH 7.9, 42 mM
ammounium sulfate, 0.2 mM EDTA, 0.5 mM DTT and 20% glycerol). The effect of
incubation temperature and HeLa extract concentration on complex formation was
limited. The same migration patterns are seen under all conditions. (B) Formation of
complexes D, C2, and C1 after 10, 30, 60 and 120 min incubation of siRNA in 50%
cytosolic HeLa cell extract. Samples were loaded onto a running 4% native
polyacrylamide gel, leading to the indicated differences in migration. (C) Formation of
complexes after 2.5 h incubation of siRNA in 50% cytosolic HeLa cell extract, and
increasing concentrations of p19. (D) Formation of complexes after 2 h incubation of
siRNA in 50% cytosolic HeLa cell extract, followed by the addition of increasing
concentrations of p19 and further incubation for 30 min.

124
Rawlings et al, Figure A4
Figure A4 Western blot detection of Dicer (A) A scaled-up version of the time course
gel in (Figure 2.4B), imaged for radio-labeled siRNA, yields sufficient complexes for
Western blot detection of Dicer. (B) Western blot of a similar gel to (A) probed with a
rabbit primary antibody against Dicer, followed by a goat anti-rabbit secondary antibody,
conjugated with horseradish peroxidase. Samples were loaded onto a running gel,
leading to the observed differences in migration

125
Rawlings et al, Figure A5
Figure A5 Gel-based dissociation chase assays. Duplicate gel chase experiments were
done in standard buffer with (A) 70 nM recombinant Dicer or (B) 10 nM of p19 added to
5´-32P labeled siRNA before addition of 750 nM unlabeled siRNA chase at 0, 10, 30, 60
and 120 min.

126
Rawlings et al, Figure A6
Figure A6 Size comparison of protein-siRNA binding complexes. [γ_32P] ATP labeled
siRNA bound to: (lane 1) purified rDicer provided for analytical purposes from the J.
Doudna lab. (lane 2): purified recombinant Ago2 protein provided for analytical purposes
from the J. Doudna lab. (lane 3): rDicer (Genlantis Inc), (lane 4) purified p19, (lane 5-6)
15% Hela extract. All lanes were incubated 30 min before loading. Nondenaturing 4%
(w/v) polyacrylamide gel electrophoresis was used to resolve these complexes as
described above.

127
Appendix B
Model Description
Grouped RNA Interference with p19: For the model described schematically in (Figure
B1) (below), changes in viral protein expression levels were monitored in the absence
and presence of the RSS p19. Changes in free p19 protein over time depend on terms
representing the natural rates of production (rx rt / rdm), degradation (rdp [p19]), and the
extent of siRNA binding (v*[siRNA] [P]). Production of p19 is governed by its
transcription rate (rx), its messenger RNA degradation rate (rdm), and its translation rate
(rt), which are assumed to have reached equilibrium on a faster time-scale than that of
repression. The p19 protein is degraded by the first order rate constant (rdp) and bound to
siRNAs by the second order rate constant (v*).
The amount of usable siRNA in the system, i.e. the fraction able to associate with RISC,
is reduced by the amount of siRNA bound to p19. Production of siRNA is dependent on
the catalytic rate of Dicer (kcatD) and is degraded by a first order rate constant (rds).
[1] l
[2] l
[3]

128
The viral protein of interest that serves as a reporter of RNAi suppression and p19
enhancement is described as:
where (kcatR) is the catalytic rate for RISC cleavage of mRNA. The additional term in
the denominator of Equation 3 is a quasi-steady state assumption used in previous work
(1, 2) to describe RISC mediated degradation of viral messenger RNA (mRNA). It
assumes that the active concentration of siRNA-loaded RISC is approaching its steady
state value at the rate (kcatR). This contributes to the rate of degradation of the viral
mRNA as described by the concentration of RISC, siRNA, and the dissociation constant
for RISC binding (KDR). The proteins that are not regulated by the RNAi pathway are
represented as constants at steady state.
Equations (1-3) are rescaled as described in Marshall 2008 (2) at steady state to yield:

129
where v is a scaler multiple of v* equal to (rx rt/rdm rdp) v*. The value of the viral protein
at steady state is dependent on the form of S. As shown in the absence of the RNA
interfering pathway where S = 0, due to no Dicer cleavage, V = 1, or the unsuppressed
protein level. Substituting Equation 6 into Equation 7 we get two solutions for S where
only S2 is biological relevant:
Substituting S2 into Equation 8 yields:
where y equals the efficiency of the RNAi pathway in a specific cell line (2).
Using Equation 10 above and the values of y = 1.2 derived for HEK293 cells (2) and an
experimentally derived catalytic rate for Dicer (kcatD = 11.4 mol/s) (3) the effect of p19
was plotted versus (v) and (rdp). We see a higher than expect dependence on protein
[10] l
[9]
130
degradation (rdp) showing increased degradation correlating with increased viral
production requiring a ratio of rdp = .5 kcatD to reproduce experimental data (4) and rdp
values on the order of 10^2 mol/s to optimize protein production.
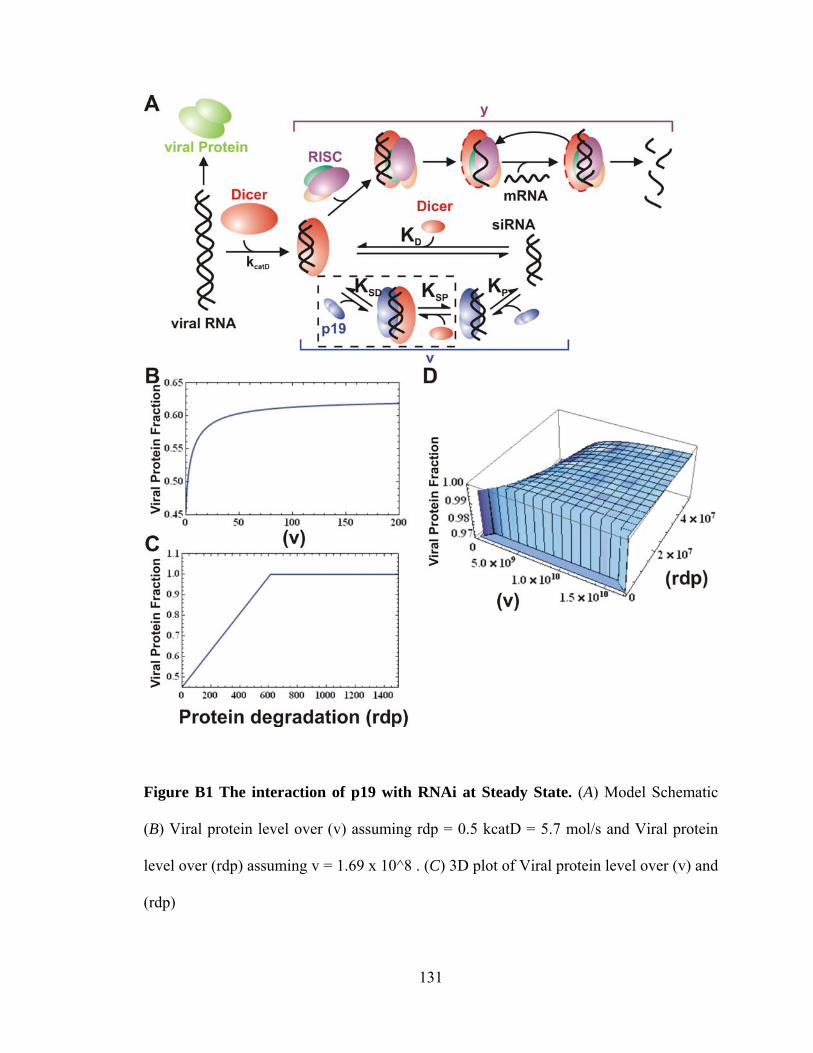
131
Figure B1 The interaction of p19 with RNAi at Steady State. (A) Model Schematic
(B) Viral protein level over (v) assuming rdp = 0.5 kcatD = 5.7 mol/s and Viral protein
level over (rdp) assuming v = 1.69 x 10^8 . (C) 3D plot of Viral protein level over (v) and
(rdp)

132
References
1. Groenenboom MA, Maree AF, & Hogeweg P (2005) The RNA silencing
pathway: the bits and pieces that matter. PLoS Comput Biol 1(2):155-165
2. Marshall WF (2008) Modeling recursive RNA interference. PLoS Comput Biol
4(9):e1000183
3. Ma E, MacRae IJ, Kirsch JF, & Doudna JA (2008) Autoinhibition of human dicer
by its internal helicase domain. J Mol Biol 380(1):237-243
4. de Vries W, et al. (2008) Increased virus replication in mammalian cells by
blocking intracellular innate defense responses. Gene Ther 15(7):545-552

133
Appendix C
Grouped RNA Interference with p19 Clear["Global`*"] Protein Production is described by: Production=(rx rt)/rdm; Degradation= rdp *p19; Binding = v (siRNA)*p19; dp19dt=Production-Degradation-Binding; dsiRNAdt=kcatD (Dicer)-rds (siRNA)-Binding; dvirusdt= (rx rt)/(rdm +kcatR/KDR RISC siRNA)-rdp virus; Dicer=(rx rt)/(rdm rdp); RISC=(rx rt)/(rdm rdp); p19= (rx rt)/(rdm rdp) P; virus=(rx rt)/(rdm rdp) V; siRNA=(rx rt kcatD)/(rdm rdp^2) S; \[CapitalTau]=t/rdp; a =(rx rt)/(rdm rdp); b=(rx rt kcatD)/(rdm rdp^2); 1/a*1/rdp*dp19dt//FullSimplify//Expand 1-P-(kcatD P rt rx S v)/(rdm rdp^3) p1=Solve[dp19dt==0,P] s1=Solve[b*rdp*dsiRNAdt==0,S] v1=Solve[a*rdp*dvirusdt==0,V] (*p2=Expand[1/P/.p1]/.(rt rx)/(rdm rdp^3)->ao/rdp^2 Pss=Simplify[1/p2]*) {{P->(rdm rdp^3)/(rdm rdp^3+kcatD rt rx S v)}} {{S->(rdm rdp^2)/(rdm rdp rds+P rt rx v)}} {{V->(KDR rdm^3 rdp^3)/(KDR rdm^3 rdp^3+kcatD kcatR rt^2 rx^2 S)}} Preduce=1/(1+(kcatD rt rx S v)/(rdm rdp^3))/.(rt rx)/(rdm rdp^3)->ao/rdp^2/.ao v->v Sreduce=1/(rds/rdp+(P rt rx v)/(rdm rdp^2))/.(rt rx)/(rdm rdp^2)->ao/rdp/.rds/rdp->\[Beta]/.ao v->v Vreduce=1/(1+(kcatD kcatR rt^2 rx^2 S)/(KDR rdm^3 rdp^3))/.(kcatD kcatR rt^2 rx^2)/(KDR rdm^3 rdp^3)->\[Alpha] 1/(1+(kcatD S v)/rdp^2) 1/((P v)/rdp+\[Beta]) 1/(1+S \[Alpha]) Sreduce2=Sreduce/.P->Preduce 1/(v/(rdp (1+(kcatD S v)/rdp^2))+\[Beta])

134
Ssolve=Solve[S==Sreduce2, S]//Flatten {S->(kcatD v-rdp v-rdp^2 \[Beta]-Sqrt[4 kcatD rdp^2 v \[Beta]+(-kcatD v+rdp v+rdp^2 \[Beta])^2])/(2 kcatD v \[Beta]),S->(kcatD v-rdp v-rdp^2 \[Beta]+Sqrt[4 kcatD rdp^2 v \[Beta]+(-kcatD v+rdp v+rdp^2 \[Beta])^2])/(2 kcatD v \[Beta])} Vp1=Vreduce/.Ssolve[[1]]/.\[Alpha]->\[Beta] y Vp2=Vreduce/.Ssolve[[2]]/.\[Alpha]->\[Beta] y 1/(1+(y (kcatD v-rdp v-rdp^2 \[Beta]-Sqrt[4 kcatD rdp^2 v \[Beta]+(-kcatD v+rdp v+rdp^2 \[Beta])^2]))/(2 kcatD v)) 1/(1+(y (kcatD v-rdp v-rdp^2 \[Beta]+Sqrt[4 kcatD rdp^2 v \[Beta]+(-kcatD v+rdp v+rdp^2 \[Beta])^2]))/(2 kcatD v)) (*ylabel=Normalized Fraction of Viral Protien; xlabel= v (Binding rate constant 1/M00 *second)*) (*Plot[Evaluate[Vp1/.y->1.22/.\[Beta]->1/.rdp00->.01 kcatD], {v, 0, 200000}] kcaD =.19 fmol/min (Ma Doudna 2008) so 11.4 moles/s*) kcatD=11.4; Vp=1/(1+y); Plot[Evaluate[Vp2/.y->1.2/.\[Beta]->1/.rdp->.5 kcatD], {v, 0, 200},Frame->True,PlotRange->{{0,2 10^2},{.45,.65}},AxesLabel->{v ,P}] Plot[Evaluate[Vp2/.y->1.22/.\[Beta]->1/.v->1.69 10^8], {rdp, 0, 200 10^4},Frame->True,AxesLabel->Automatic,PlotRange->{{0,15 10^2},{.45,1.1}}] Plot3D[Vp2/.y->1.22/.\[Beta]->1,{v, 0, 1.69 10^10},{rdp, 0, 5 10^7},LabelStyle->Directive[Black,Bold,16]]

135
Dissociative Equilibrium Shift Clear["Global`*"] There are five species in this Model S,Di,P, SD, SP And eight potential rate constants k1-k8 The Reaction are as follows S + Di <-> SD [k1 on , k2 off] S + P <->SP [k3 on , k4 off] The Differential Equations are S=So -SP[t] -SD[t]; Di=Dio -SD[t]; P= Po -SP[t]; SD'[t]=Collect[k1*S* Di -k1*KDd SD[t] ,{SD[t],SP[t]}] SP'[t]=Collect[k3*S* P -k3*KDp SP[t] ,{SP[t],SD[t]}] Dio k1 So+k1 SD[t]2-Dio k1 SP[t]+SD[t] (-Dio k1-k1 KDd-k1 So+k1 SP[t]) k3 Po So-k3 Po SD[t]+(-k3 KDp-k3 Po-k3 So+k3 SD[t]) SP[t]+k3 SP[t]2
Non-dimensionalize SD[t]=SD SD∗
, SP[t]=SP SP∗
, t=t τ u=SD'[t]/.{SD[t]->x X , SP[t]->y Y, t->t τ}; v=SP'[t]/.{SD[t]->x X , SP[t]->y Y, t->t τ}; w=u*(τ/X)//Expand z=v*(τ/Y)//Expand -Dio k1 x τ-k1 KDd x τ-k1 So x τ+(Dio k1 So τ)/X+k1 x2 X τ+k1 x y Y τ-(Dio k1 y Y τ)/X -k3 KDp y τ-k3 Po y τ-k3 So y τ+k3 x X y τ+(k3 Po So τ)/Y-(k3 Po x X τ)/Y+k3 y2 Y τ If we could let τ=1 /k1 and X=Dio, Y=Po s=w/.{τ->1 /k1, X->Dio, Y->Po } q=Collect[z/.{τ->1 /k1, X->Dio, Y->Po }/.{k3/k1->ε},ε] So-Dio x-KDd x-So x+Dio x2-Po y+Po x y (So-Dio x-KDp y-Po y-So y+Dio x y+Po y2) ε Now the Nondementionalized equations SD'[t]=s and SP'[t]=q. They depend on known constants Po, Dio, So, and KDd,KDp At Steady state both s = q= 0 so we will solve for x f=Solve[s==0,x] {{x->(Dio+KDd+So-Po y-)/(2 Dio)},{x->(Dio+KDd+So-Po y+)/(2 Dio)}} s1=Solve[s==0,y] {{y->(-So+Dio x+KDd x+So x-Dio x2)/(Po (-1+x))}} {{y->(-So+Dio x+KDd x+So x-Dio x2)/(Po (-1+x))}} s2=y/.s1 Solve[s2*==x*140,x

136
{{y->(-So+Dio x+KDd x+So x-Dio x2)/(Po (-1+x))}} {(-So+Dio x+KDd x+So x-Dio x2)/(Po (-1+x))} Plot[s2/.{Dio->do,So->so,KDd->kd,KDp->kp,Po->po},{x,0,1}] .17/140 2*.17 0.00121429 0.34 Expand[-4 Dio (So-Po y)+(-Dio-KDd-So+Po y)^2] Dio2+2 Dio KDd+KDd2-2 Dio So+2 KDd So+So2+2 Dio Po y-2 KDd Po y-2 Po So y+Po2 y2 We get two values for x or (SD)as a function of y or (SP) so we can plug the two values of x into the equation for y'[t]=q. Then solve for y in terms of only constants. j1=q/.f[[1]]; j2=q/.f[[2]]; r1=Solve[j1==0,y]; r2=Solve[j2==0,y]; The solutions for y are quite long but we get three values of y for x1 and three values of y for x2. So in total we have six steady states. Summarized below: x1=A (y), and so y11=a,y12=b,y13=c, x2=B (y),and so y21=d,y22=e,y23=g The steady states are: [A (a),a],[A (b),b],[A (c),c], [B (d),d],[B (e),e],[B (g),g] If we replace the known constant with numbers we get kd=3.67;kp=.17; do=140;so=.3810;po=.17; h1=r1/.{Dio->do,So->so,KDd->kd,KDp->kp,Po->po}; h2=r2/.{Dio->do,So->so,KDd->kd,KDp->kp,Po->po}; For[i=1 ,i<7,i++, If [i<4, M[i,1]=f[[1]]/.h1[[i]]/.{Dio->do,So->so,KDd->kd,KDp->kp,Po->po}, M[i,1]=f[[2]]/.h2[[i-3]]/.{Dio->do,So->so,KDd->kd,KDp->kp,Po->po}]] For[i=1 ,i<7,i++, If [i<4, M[i,2]=y/.h1[[i]], M[i,2]=y/.h2[[i-3]]]] p=Array[M,{6,2}] {{{x->0.0068067 -1.05058*10-17 I},0.128883 +8.88178*10-15 I},{{x->-0.0496608+1.05344*10-18 I},47.8008 -8.88178*10-16 I},{{x->0.00577486 +1.26077*10-
17 I},1.00119 -1.06581*10-14 I},{{x->1.02639 -2.79191*10-19 I},0.128883 +8.88178*10-
15 I},{{x->1.02497 +2.50639*10-20 I},47.8008 -8.88178*10-16 I},{{x->1.02637 +3.34352*10-19 I},1.00119 -1.06581*10-14 I}} Next we must evaluate the stability of these steady states and look into there relavance. Negative values of x or y would mean negative concentrations and are meaningless.

137
Values of SD or SP complex greater than 1 ( the amount of So ) are meaningless as well. Only the first and third steady state satifies this so we will evaluate their stability. Tangent question is this true for all values of Po? ( Change Po above in h1 and h2 to see how p changes) See below for full matrix. For stability we must find the Jacobian of the system and evaluate it at the steady state. ({ {∂s/∂x, ∂s/∂y}, {∂q/∂x, ∂q/∂y} })xss,yss s q So-Dio x-KDd x-So x+Dio x2-Po y+Po x y (So-Dio x-KDp y-Po y-So y+Dio x y+Po y2) ε J=({ {D[s,x], D[s,y]}, {D[q,x], D[q,y]} }) {{-Dio-KDd-So+2 Dio x+Po y,-Po+Po x},{(-Dio+Dio y) ε,(-KDp-Po-So+Dio x+2 Po y) ε}} Evaluate at the steady state (1) M[1,1] Jss1=J/.M[1,1]/.y->M[1,2]/.{Dio->do,So->so,KDd->kd,KDp->kp,Po->po} {{-142.742-1.43173*10-15 I,-0.168843-1.78599*10-18 I},{(-121.956+1.24345*10-12 I) ε,(-0.343242+1.54899*10-15 I) ε}} If the Trace of Jss ( a-d) is less than zero and the determanent of Jss1 (ad-bc)is greater than zero the steady state is Stable. Tr[Jss1] Det[Jss1] (-142.742-1.43173*10-15 I)-(0.343242 -1.54899*10-15 I) ε (28.4036 -1.0885*10-14 I) ε Steady state (1) is Stable for Po = 0.17nM SD=x X = .0068 Dio = .0068 140 nM =0.952 nM SP=y Y= .13 Po = .13 .17nM =0.0221 nM Evaluate at the steady state (3) M[3,1] M[3,2] {x->0.00577486 +1.26077*10-17 I} 1.00119 -1.06581*10-14 I Jss2=J/.M[3,1]/.y->M[3,2]/.{Dio->do,So->so,KDd->kd,KDp->kp,Po->po} {{-142.883+1.71827*10-15 I,-0.169018+2.14331*10-18 I},{(0.166793 -1.49214*10-12 I) ε,(-0.191114-1.85869*10-15 I) ε}} If the Trace of Jss ( a-d) is less than zero and the determanent of Jss2 (ad-bc)is greater than zero the steady state is Stable. Tr[Jss2] Det[Jss2] (-142.883+1.71827*10-15 I)-(0.191114 +1.85869*10-15 I) ε
138
(27.3351 +1.30477*10-14 I) ε Steady state (3) is Stable for Po = 0.17nM SD=x X = .0057 Dio = .0057 140 nM =0.812 nM SP=y Y= 1.02 Po = 1 .17nM =0.17 nM ***************************************************** Now do we get simular steady states for Po=0, 0.04,0.08,0.16,0.24,0.32,0.64, 1.28, 2.15, 5.12 *Values of y or (SP) Makes a matrix Y1 with three rows corresponding to the three values of y associated with x1 -> y1, y2, y3, with 9 columns corresponding to y at each value of Po . Y1= ({ {y1 (po1), y1 (po2)...}, {y2 (po1) y3 (po1), y2 (po2)... y3 (po2)...} } ) Do the same with Y2 equaling the x2-> y4, y5, y6, Y2= ({ {y4 (po1), y4 (po2)...}, {y5 (po1) y6 (po1), y5 (po2)... y6 (po2)...} } ) For Po=0 the value of y is 1/0 an indeterminant so I leave it off. kd=3.67;kp=.17; do=140;so=1; po1={ 0.04,0.08,0.16,0.24,0.32,0.64, 1.28, 2.15, 5.12}; For[j=1 ,j<10,j++, For[i=1 ,i<4,i++, Y1[i,j]=y/.r1[[i]]/.{Dio->do,So->so,KDd->kd,KDp->kp,Po->po1[[j]]}; Y2[i,j]=y/.r2[[i]]/.{Dio->do,So->so,KDd->kd,KDp->kp,Po->po1[[j]]}]]; Use Y1 and Y2 to get the values of x1 (X1) and x2 (X2)for all values of y six steady states for each value of Po (60 in total) X1= ({ {x1[y1 (po1)], x1[y1 (po2)]...}, {x1[y2 (po1)] x1[y3 (po1)], x1[y2 (po2)]... x1[y3 (po2)]...} } ) where X2 is similar with x2[y4 (po1)]... For[j=1 ,j<10,j++, For[i=1 ,i<4,i++, X1[i,j]=x/.f[[1]]/.y->Y1[i,j]/.{Dio->do,So->so,KDd->kd,KDp->kp,Po->po1[[j]]}; X2[i,j]=x/.f[[2]]/.y->Y2[i,j]/.{Dio->do,So->so,KDd->kd,KDp->kp,Po->po1[[j]]}; ]] Make a combination matrix with 60 rows and 4 columns which are:

139
[Po , x, y, Stability ] The stability column will say ( true or false) Clear[W] Column 1 with only the Po value in use. n=1; For[k=n;j=0,j<10,j++ If[k<55, For[k=n,k<n+6,k++, H[k,1]=po1[[j]]]; n=k]] Column 2 and 3 with steady values [x,y] respectively n=1; For[k=n;j=0,j<10,j++ If[k<55, For[k=n,k<n+3,k++, If[k==n, H[k,2]=X1[1,j]; H[k+3,2]=X2[1,j]; H[k,3]=Y1[1,j]; H[k+3,3]=Y2[1,j]]; If[k==n+1, H[k,2]=X1[2,j]; H[k+3,2]=X2[2,j]; H[k,3]=Y1[2,j]; H[k+3,3]=Y2[2,j]]; If[k==n+2, H[k,2]=X1[3,j]; H[k+3,2]=X2[3,j]]; H[k,3]=Y1[3,j]; H[k+3,3]=Y2[3,j]]; n=k+3]] Column 4 The stability condition for each steady state. For the Jacobian evaluated at each steady state if the Trace is less than zero and the Determinant is greater than zero the condition is stable (True) For[k=1,k<55,k++, W[k]=J/.{x->H[k,2],y->H[k,3]}/.{Dio->do,So->so,KDd->kd,KDp->kp,Po->H[k,1],ε->1}; If[Re[Tr[W[k]]]<0 && Re[Det[W[k]]]>0&&Re[H[k,2]]>0&&Re[H[k,2]]>0, H[k,4]="True";, H[k,4]="False"];] The Full matrix for Stability Sorted by stability (*negative values of x and y are automatically considered False because they are not biologically relavent) c1=Sort[Array[H,{54,4}],StringLength[#1[[4]]]<StringLength[#2[[4]]]&]//MatrixForm

140
Explicit Time-Dependence of RNA Interference
function proof10 tspan = [0; 200 u0 = [0,0,0,0,25,0,0,25,0,0];
[d1,d2,SD,S,D,P,SP,Ago,RISC,mRNA]
[t,u] = ode15s (@f,tspan,u0);
figure; % subplot (2,2,4), plot (t,u (:,1),t,u (:,2),t,u (:,3),t,u (:,4),t,u (:,7),t,u (:,9),t,u (:,10)); legend('dsRNA_ 1','dsRNA_2','SD','siRNA','SP','RISC','mRNA'); xlabel ('Time (hours)'); ylabel ('Concentration (nM)') % title ('k5=3.6E-6 ; k1=3.6E-6 [nM-1hour-1]'); % title ('kt=792; k1=.01476;k3= 608.4 ;k4 =363.6; *k5 = 0 * ;Kd=3.67;Vmax = kt*u (5);Km = 2800;'); title ('proof5 [Po]=25 nM; dds2/t=10 nM/hour') % save newstruct.mat u % save time t
fid = fopen ('Proof10_p19=0.txt', 'w'); % fprintf (fid, 'tspan\tdsRNA_1\tdsRNA_2\tSD\tsiRNA\tSP\tRISC\tmRNA\n'); % allTheData = [t,u (:,1),u (:,2),u (:,3),u (:,4),u (:,7),u (:,9),u (:,10)]; % dlmwrite ('Proof10_p19=0.txt', allTheData, '-append'); % default adds commas % % dlmwrite ('Proof10_p19=0.txt', allTheData, '\t' % fclose (fid);
function dudt = f (t,u) kt=792; % hour-1 (0.22 molecules/second = 792 molecules/hour) k1=.01476; % nM-1 hour-1 (4.1E-6 nM-1 s-1 = .01476 nM-1 hour-1) k3= 608.4; % nM-1 hour-1 (.169 nM-1s-1 = 608.4nM-1 hour-1) k4 =363.6; % hour-1 (.101 s-1= 363.6 hour-1) k5 = 0.04446; % nM-1 hour-1 (1.235 nM-1s-1 = .04446 nM-1 hour-1) Kd=3.67; % nM Vmax = kt;%*u (5);% nM / hour (kt * Do) Km = 2800; % nM k6 = .001; % nM-2 hour-1 k7 = .001; % nM-2 hour-1 k8 = .1; % nM-1 hour-1 h = .6; % nM / hour

141
j = .10; dudt = [Vmax*(u (2)/(Km+u (2)))-Vmax*(u (1)/(Km+u (1)));
Vmax*(u (10)/(Km+u (10)))-Vmax*(u (2)/(Km+u (2)))+ k7*u (9)*u (10); Vmax*(u (10)/(Km+u (10)))+Vmax*(u (1)/(Km+u (1)))+Vmax*(u (2)/(Km+u (2)))+k1*u (4)*u (5)-k1*Kd*u (3)-k5*u (3)*u (6)-k6*u (3)*u (8); -k3*u (4)*u (6)+k4*u (7)-k1*u (4)*u (5)+k1*Kd*u (3);
0; 0; k3*u (4)*u (6)-k4*u (7)+k5*u (3)*u (6); 0; k6*u (3)*u (8)-k8*u (9); h- k7*u (9)*u (10)]; % u (1) = d1 % u (6) = P % u (2) = d2 % u (7) = SP % u (3) = SD % u (8) = Ago % u (4) = S % u (9) = RISC % u (5) = D % u (10) = mRNA
142
Ternary Complex Formation
function datadicer8o global k5 k6 k7 k8 k1; tspan = [0 .25 .5 .75 1 2]; D=[0; 0.16; 0.25; 0.5; 2.5; 5; 10; 20; 50; 100;
200;400;800;1000;10000];
data1= [0.01551 0.02897 0.03184 0.06967 0.36631 0.54888 0.79121 0.93095 0.93917 0.98475 0.99714]; % Experimental data for fraction of SD bound from Dicer gel shift assay (no p19) error1=[0.00759 0.00741 0.00692 0.03871 0.12943 0.03561 0.15126 0.04014 0.05066 0.00882 2.46E-04]; % Error for data1 data2= [0.02166 0.01851 0.02311 0.02302 0.02179 0.03181 0.07124 0.18036 0.28608 0.51479 0.73466]; % Experimental data for fraction of SD bound from Dicer-p19 gel shift assay (p19=0.16 nM) error2=[0.00459 0.00259 7.10E-04 1.52E-04 9.77E-05 0.00209
0.10068 0.01508 0.01057 4.17E-04 0.04317]; % Error for data2
St=.3825; % St=Total concentration of [S] in nM. Pt=0.16; % Pt=Amount of free Dicer p19 SPo=(.4183)*St; % SPo is the determined fraction from 'datafit1.m' the SP fraction 's' at [P]=.16 nM .4183 ;[P]=2.56 nM .9376 So=St-SPo; SDo=0; SDPo=0; if Pt<=SPo Po=0; else Po=Pt-SPo; end k1bar=[.92]; k5bar=[0]; k6bar=[0]; k7bar=[0]; k8bar=[0]; % k1bar=[0:.02:.1]; % k5bar=[11.76]; % k6bar=[4]; % k7bar=[560]; % k8bar=[.92]; tic for a=1:length (k1bar) for i=1:length (k5bar) for j=1:length (k6bar) for l=1:length (k7bar)

143
for n=1:length (k8bar) k1=k1bar (a); k5=k5bar (i); k6=k6bar (j); k7=k7bar (l); k8=k8bar (n); for r=1:1:length (D) % Increment Dicer conc u0 = [0,0,SDo,So,D (r),Po,SPo,SDPo]; %[d1,d2,SD,S,D,P,SP,SDP] [t,u] = ode15s (@f,tspan,u0); for m=1:1:6; % Increment time q (r,m,i,j,l,n,a)=u (m,3)/(u (m,7)+u (m,3)+u (m,4)+u (m,8)); % Create matrix "s" containing the value of SD/(SP+SD+S) where each column is a different time point and each row is a different Dicer initial concentration. if r<=length (data2) R (r,m,i,j,l,n,a)= (data2 (r)-q (r,m,i,j,l,n,a))^2; end for s=3:1:length (u0); U (r,s,m,i,j,l,n,a)=u (m,s); end end end end end end end end save q0 q save U0 U save R0 R toc
%% tic % Loop to determine the best fit for k5-8 by added the residuals of an entire time point over all Dicer % concentrations. min_k5-8 will print out. min_residual_fit=1000; for m=1:1:length (tspan) for a=1:length (k1bar) for i=1:length (k5bar) for j=1:length (k6bar) % Defines the range for k6 for l=1:length (k7bar) % Defines the range for k7 for n=1:length (k8bar) % Defines the range for k8 sum_fit _res=0; for r=1:1:length (data2) sum_fit _res=sum_fit _res+R (r,m,i,j,l,n,a); end if sum_fit _res< min_residual _fit min_residual _fit=sum_fit _res;

144
min_residual=R (:,m,i,j,l,n,a); min_t=tspan (m); min_k1=k1bar (a); min_k5=k5bar (i); min_k6=k6bar (j); min_k7=k7bar (l); min_k8=k8bar (n); v=[i,j,l,n,m,a]; end end end end end end end save sum_fit _res sum_fit _res save v0 v min_residual dicerfit=[min_t, min_k1, min_k5, min_k6, min_k7, min_k8] save dicerfit0 dicerfit toc
%% TO fit for k1 with Dicer only k1bar=[.92]; for a=1:1:length (k1bar) k1=k1bar (a); for r=1:1:length (D) k5=min_k5; k6=min_k6; k7=min_k7; k8=min_k8; % k1=.45; u0 = [0,0,0,St,D (r),0,0,0]; %[d1,d2,SD,S,D,P,SP,SDP] in the pressence of SP [t,u] = ode15s (@f,tspan,u0); for m=1:1:6; qo (r,a,m)= u (m,3)/(u (m,7)+u (m,3)+u (m,4)); % Same as 's' if r<=length (data1) Ro (r,a,m)= (data1 (r)-qo (r,a,m))^2; end for s=3:1:length (u0); Uo (m,s,r,a)=u (m,s); end end end end save qo qo save Ro Ro tic % Loop to determine the best fit for k5-8 by added the residuals of an entire time point over all Dicer % concentrations. min_k5-8 will print out. min_residual_fit=1000; for m=1:1:length (tspan) for a=1:length (k1bar)

145
sum_fit _res=0; for r=1:1:length (data1) sum_fit _res=sum_fit _res+Ro (r,a,m); end if sum_fit _res< min_residual _fit min_residual _fit=sum_fit _res; min_residual=Ro (:,a,m); min_to=tspan (m); min_k1o=k1bar (a); vo=[a,m]; end end end save sum_fit _res sum_fit _res save vo vo min_residual dicerfito=[min_to, min_k1o] save dicerfito dicerfito toc %% figure axes1 = axes ('Parent',figure,'FontSize',20,'FontName','Arial'); % Uncomment the following line to preserve the Y-limits of the axes % ylim ([0 500]); box ('on'); hold ('all'); plot (D,qo (:,vo (1),vo (2)),'k','Parent',axes1,'LineWidth',3); %2:.2:length (k1bar) errorbar (D (1:length (data1))',data1,error1,'MarkerSize',10,'Marker','o','LineStyle','none',... 'LineWidth',1,... 'Color',[0 0 0],... 'Parent',axes1); %% %% plot (D,q (:,v (5),v (1),v (2),v (3),v (4),v (6)),'r','Parent',axes1,'LineWidth',3); errorbar (D (1:length (data2))',data2',error2','MarkerSize',25,'Marker','.','LineStyle','none',... 'LineWidth',1,... 'Color',[1 0 0],... 'Parent',axes1); xlabel ('Dicer Concentration (nM)','FontSize',24,'FontName','Arial');

146
ylabel ('Fraction Dicer bound siRNA','FontSize',24,'FontName','Arial'); title ('open=S+D only (fit black), closed=S+D+P (fit red), S=1nM, k2=2, k4=2, k5=0','FontSize',12,'FontName','Arial') hold; figure plot (D,U (:,3:8,3,v (1),v (2),v (3),v (4),v (6)),'LineWidth',3); legend ('SD','S','D','P','SP','SDP'); xlabel ('Dicer Concentration (nM)','FontSize',24,'FontName','Arial'); ylabel ('Concentration (nM)','FontSize',24,'FontName','Arial'); % title ('open=S+D only (fit black), closed=S+D+P (fit red), S=1nM, k2=2, k4=2, k5=0','FontSize',12,'FontName','Arial') %% % D2 = transpose (D)=D' these are equal (All data must be column vectors to % write to file.) % comment out the next 2 if origin blows up fid = fopen ('Dicer Best Fit.txt', 'w'); fprintf (fid, 'D\tdata1\terror1\tfit1\tdata2\terror2\tfit2\n'); allTheData = [D,data1',error1', qo (:,vo (1),vo (2)),data2',error2', q (:,v (5),v (1),v (2),v (3),v (4),v (6))]; dlmwrite ('Dicer Best Fit.txt', allTheData, '-append'); % default adds commas % dlmwrite ('Dicer Best Fit.txt', allTheData, '/t');% No names with tabs fclose (fid); % -------------------------------------------------------------------------- function dudt = f (t,u) % function du/dt = f (t,u) global k5 k6 k7 k8 k1; % k1=.45; % nM-1 hour-1 (4.1E-6 nM-1 s-1 = .01476 nM-1 hour-1) k2=1.71; % hour-1 Dicerchase k3= 608.4; % nM-1 hour-1 (.169 nM-1s-1 = 608.4 nM-1 hour-1) k4 = 2; % hour-1 (.06 s-1= 216 hour-1 or .03 min-1 = 2 hour-1) % k5 =0; % nM-1 hour-1 (1.235 nM-1s-1 = .04446 nM-1 hour-1) Kd=96; % nM KD=0.17; % nM k4/KD=k3 dudt = [0;0;

147
k1*u (4)*u (5)-k2*u (3)-k5*u (3)*u (6)+k6*u (8); -k4/KD*u (4)*u (6)+k4*u (7)-k1*u (4)*u (5)+k2*u (3); -k1*u (4)*u (5)+k2*u (3)-k8*u (7)*u (5)+k7*u (8); -k4/KD*u (4)*u (6)+k4*u (7)-k5*u (3)*u (6)+k6*u (8); k4/KD*u (4)*u (6)-k4*u (7)-k8*u (7)*u (5)+k7*u (8); k5*u (3)*u (6)-k6*u (8)+k8*u (7)*u (5)-k7*u (8);]; % Can not put 'end' to close the function if you are using global variables*
% u (1) = d1 % u (5) = D % u (2) = d2 % u (6) = P
% u (3) = SD % u (4) = S % u (7) = SP