Embed Size (px)
Citation preview
Using GPS Based Origin-Destination Data to Improve Traffic Studies
Michael R. Wahlstedt, PE, PTOE
OTEC
October 11, 2017
Overview
� Benefits of using O-D data for traffic analysis, particularly for operational modeling
� Example applications
� Using O-D data in VISSIM
2

Benefits of O-D Data
� Traffic count data, particularly turn volumes provide some indications of travel patterns, but don’t provide a clear picture when:
� There are multiple travel routes
� In weave areas
� Over longer corridors

Benefits of O-D Data
� Multiple travel routes
� O-D data with “middle filters” can identify route choice.

Benefits of O-D Data
� Weave areas
� O-D data will provide more realistic assignment of routing through weave areas.
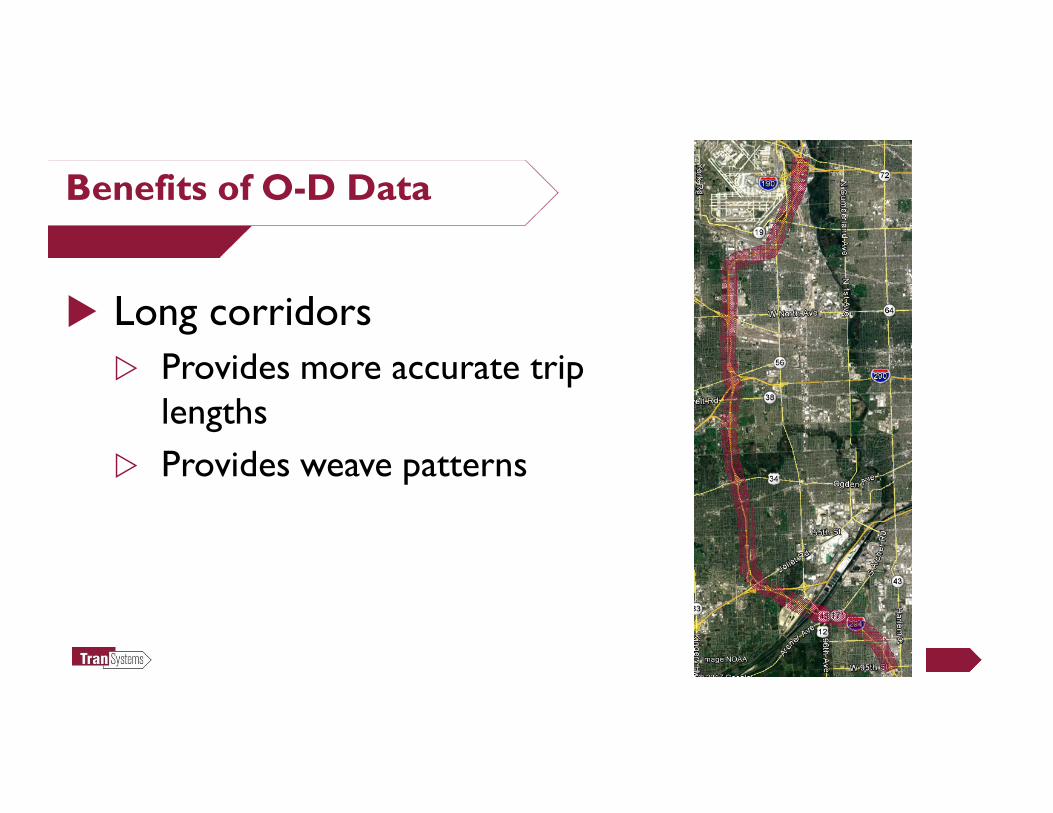
Benefits of O-D Data
� Long corridors
� Provides more accurate trip lengths
� Provides weave patterns

Data Sources
O-D Data Sources
� Visual Observation (weave areas)
� License Plate Surveys
� Cellular Based Data (e.g. Airsage)
� GPS Based Data (e.g. StreetLight, INRIX)

O-D Data Sources
� Visual Observation
� Needs line of sight
� High accuracy
� Low cost

O-D Data Sources
� License Plate Survey
� Can be automated (ALPR)
� High accuracy
� High cost

O-D Data Sources
� ALPR Example: US 54/I-35/K-96
� New access at I-35
� 12 stations/48 cameras
� Captured 70%+ of traffic
7:15-8:15 AM
1-I35 s/o Ex50
3-I35 n/o Ex53
4-K
96 n/o Ex 53
5-U
S54 e/o K96
10-K
TA e/o 127th
11-W
ebb n/o U
S54
12-W
ebb s/o U
S 54
14-U
S54 w
/o Ex50
17-G
wich n/o U
S54
18-G
wich s/o U
S54
1-I35 s/o Ex50 197 163 42 55 60 21 50 17 2
3-I35 n/o Ex53 232 59 2 37 1 10 253
4-K96 n/o Ex 53 31 41 2 163 31 4 64 9 47
5-US54 e/o K96 107 14 768 5 111 8 740 70 17
10-KTA e/o 127th 122 19 86 10 67
11-Webb n/o US54 42 5 23 185 349 42
12-Webb s/o US 54 23 16 26 11 699 284 15 2
14-US54 w/o Ex50 19 161 159 310 7 349 164 184 53
17-Gwich n/o US54 9 3 7 2 197 164
18-Gwich s/o US54 3 39 8 38 1 171 476
7:15-8:15 AM
1-I35 s/o Ex50
3-I35 n/o Ex53
4-K
96 n/o Ex 53
5-U
S54 e/o K96
10-K
TA e/o 127th
11-W
ebb n/o US5
4
12-W
ebb s/o U
S 54
14-U
S54 w
/o Ex50
17-G
wich n/o U
S54
18-G
wich s/o U
S54
1-I35 s/o Ex50 197 163 38 41
3-I35 n/o Ex53 232 1 10 253
4-K96 n/o Ex 53 31 8
5-US54 e/o K96 102 1
10-KTA e/o 127th 113 62
11-Webb n/o US54 5
12-Webb s/o US 54 16
14-US54 w/o Ex50 161 3 3
17-Gwich n/o US54
18-Gwich s/o US54
O-D Data Sources
� Cellular Based Data (e.g. AirSage)
� Uses triangulation of cell phone pings at towers
� More phones, but less spatial accuracy (need larger zones)
� Harder to delineate short duration trip ends
� More suited for zone based analysis (vs. corridor), e.g. sub-area model
� Moderate cost

O-D Data Sources
� Randall Road Corridor
� Created sub-area model to generate specific routing (high effort)
� Sub-area model was then also used for forecasting future traffic
� VISSIM routing generated using sub-area model

O-D Data Sources
� GPS Based Data (e.g. StreetLight, INRIX)
� High-resolution tracking of vehicles (lock to roadways)
� Once per second sampling for certain data sets
� Ideal for corridor based analysis
� Separate commercial and personal vehicle data sets
� Potential for sample bias (participating truck fleets, cars with GPS tracking)
� Moderate cost

O-D Data Sources
� Example: Industrial Facility
� Change in access location to site
� LADOT requires specific truck routes on city streets
� Many possible routes from freeways to site
Site
Proposed
Access
O-D Data Sources
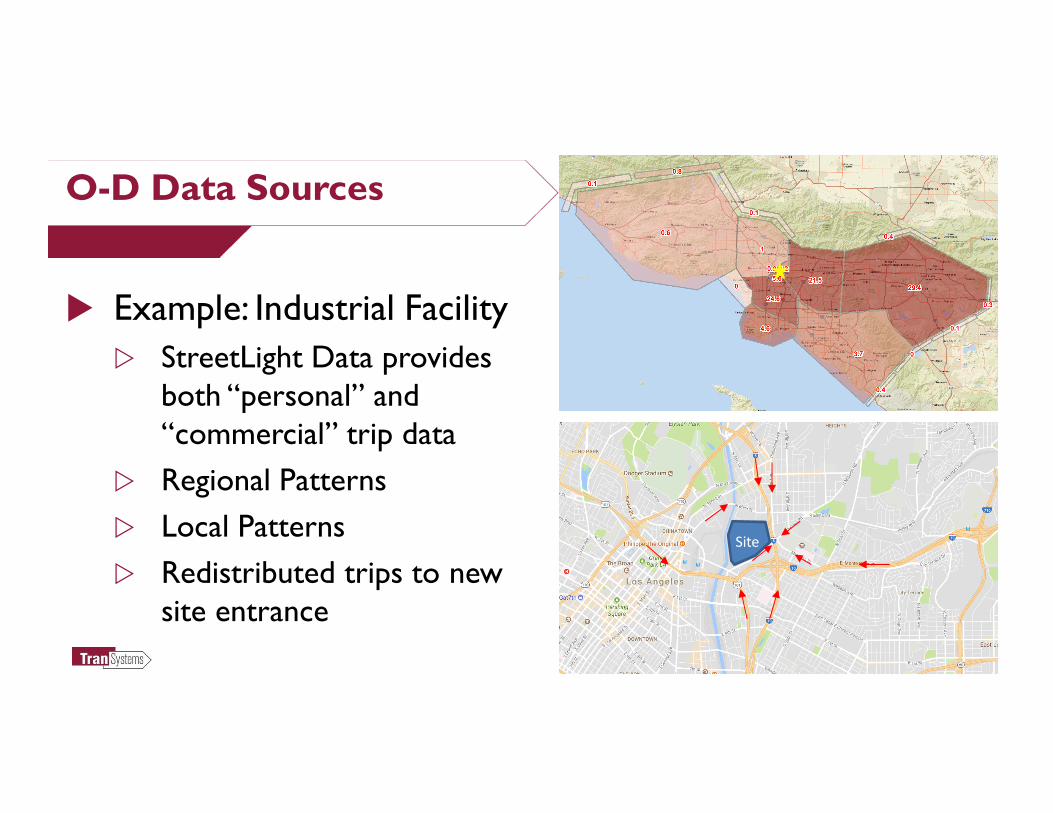
� Example: Industrial Facility
� StreetLight Data provides both “personal” and “commercial” trip data
� Regional Patterns
� Local Patterns
� Redistributed trips to new site entrance
Site
O-D Data Sources
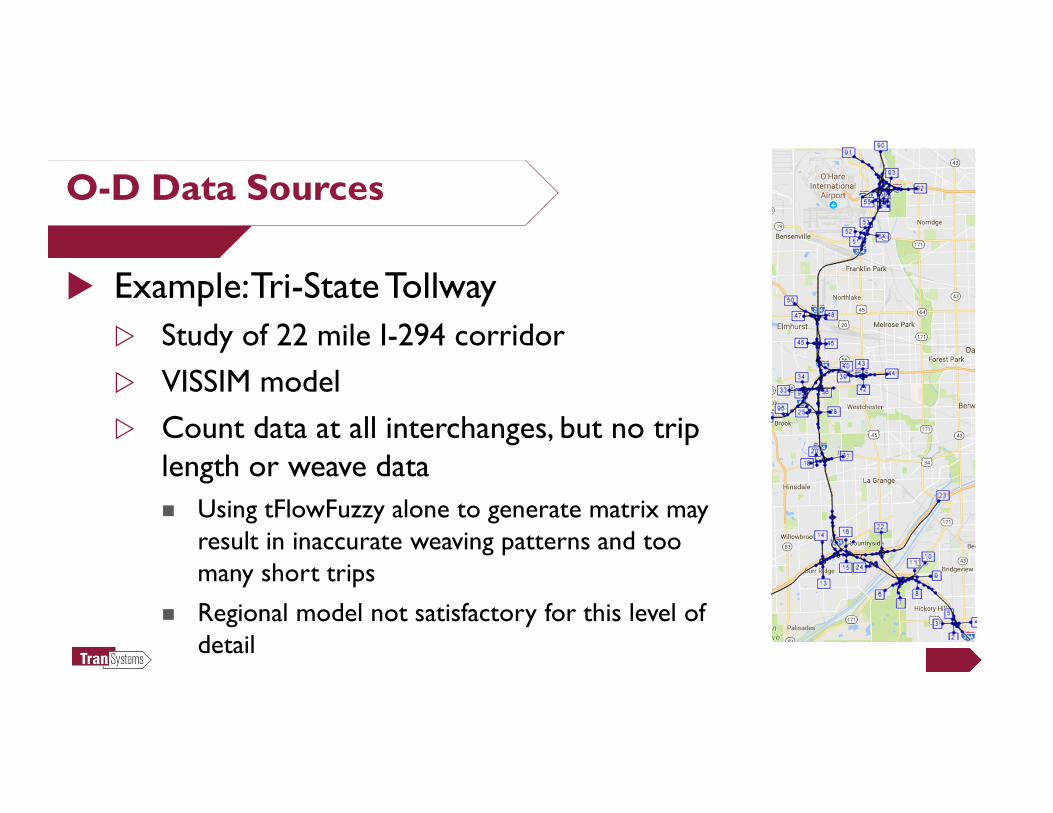
� Example: Tri-State Tollway
� Study of 22 mile I-294 corridor
� VISSIM model
� Count data at all interchanges, but no trip length or weave data
� Using tFlowFuzzy alone to generate matrix may result in inaccurate weaving patterns and too many short trips
� Regional model not satisfactory for this level of detail

O-D Data Sources
� Example: Tri-State Tollway
� StreetLight Data
� 65 “Pass-Thru” zones created at perimeter of study corridor
� Sketch network created in VISUM to generate routing (more on this later!)

O-D Data Sources
� Example: Cambridge Connector
� Traffic projections and VISSIM modeling
� New interstate connection to alleviate arterial congestion
� Will new connection draw sufficient traffic to reduce congested intersection and justify cost?
KU
Medical
Center
Downtown
Kansas City

O-D Data Sources
� Example: Cambridge Connector
� Identify regional patterns
� More traffic from Kansas
� Little traffic from outside metro area
� A lot of traffic from due south (may not use I-35)

O-D Data Sources
� Example: Cambridge Connector
� Study Area O-D Data
� Daily Trip Destinations� This analysis includes internal and
external trips, including pass-thru
� Data set also includes peak periods
KU
Medical
Center
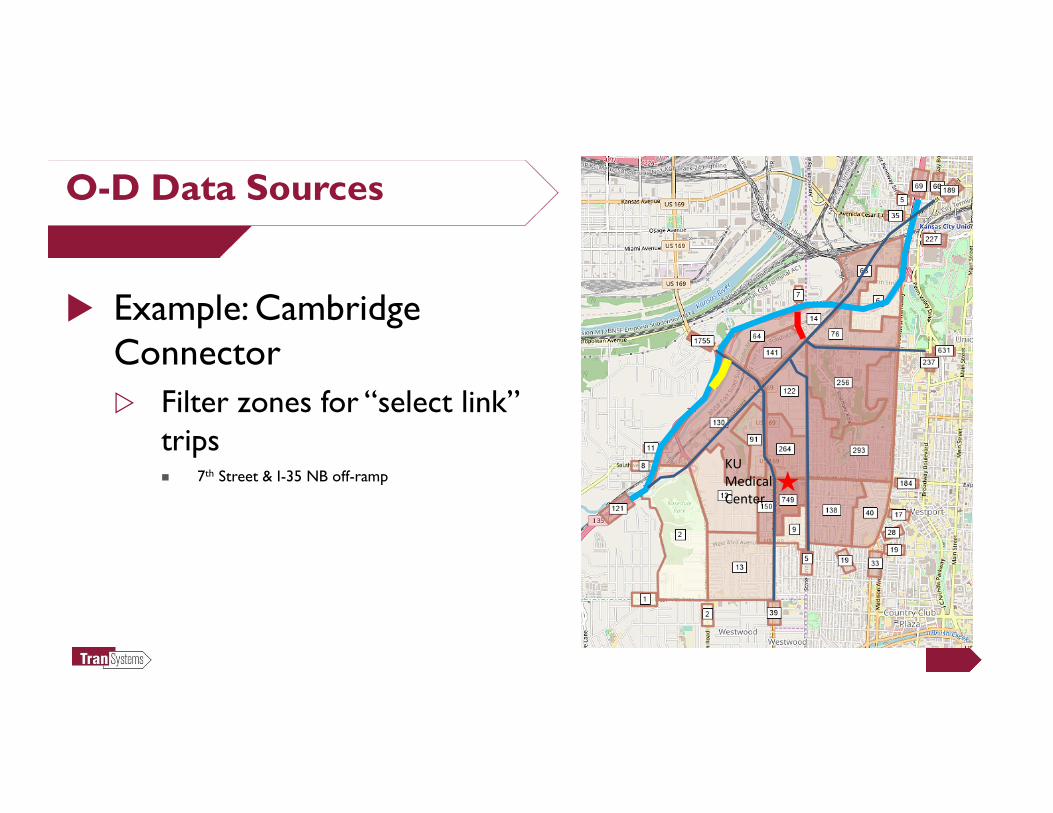
O-D Data Sources
� Example: Cambridge Connector
� Filter zones for “select link” trips� 7th Street & I-35 NB off-ramp
KU
Medical
Center

O-D Data Sources
� Example: Cambridge Connector
� Filter zones for “select link” trips� SW Trafficway & I-35 NB off-ramp
KU
Medical
Center
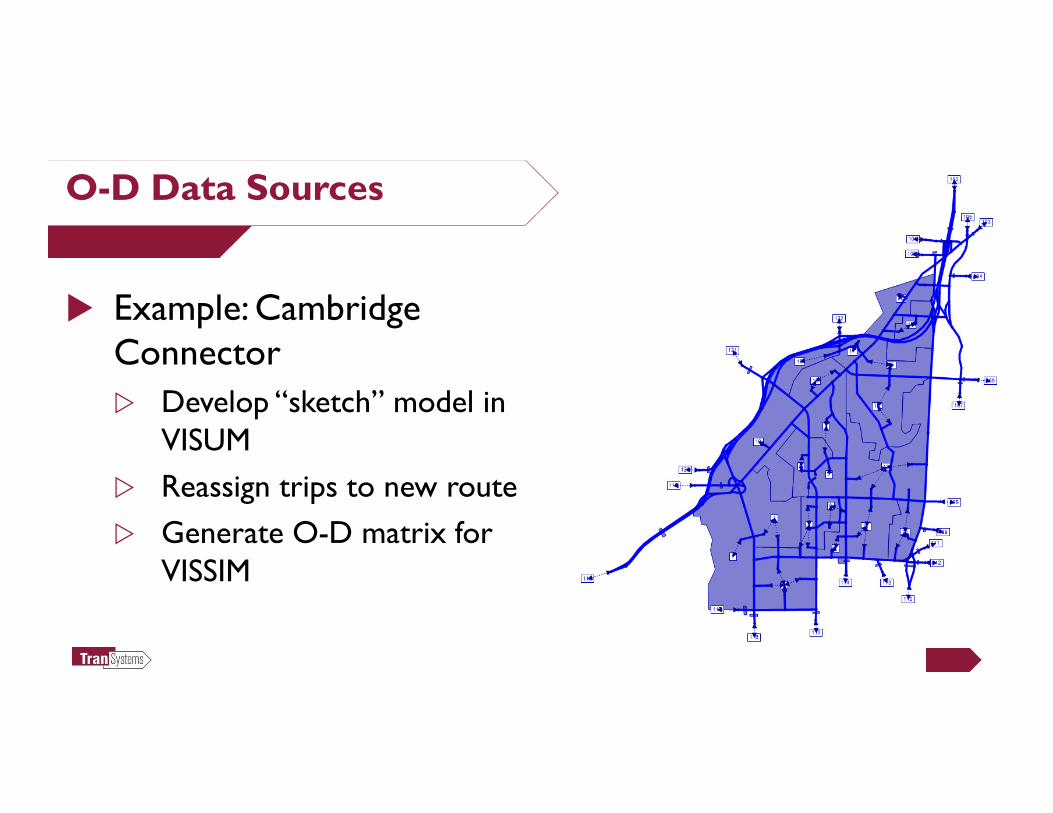
O-D Data Sources
� Example: Cambridge Connector
� Develop “sketch” model in VISUM
� Reassign trips to new route
� Generate O-D matrix for VISSIM

VISSIM Application

VISSIM Application
� Modeling process:
� Merge O-D data and count data in sketch VISUM model
� Generate matrix for use in VISSIM routing
� Import routing into VISSIM
VISSIM Application
� VISUM:
� Create stick network
� Generally for “linear” corridors – only one route option between zone pairs
� VISSIM will assign to shortest route
� Don’t need link and node attributes
� Just create permitted tSys for links and turns
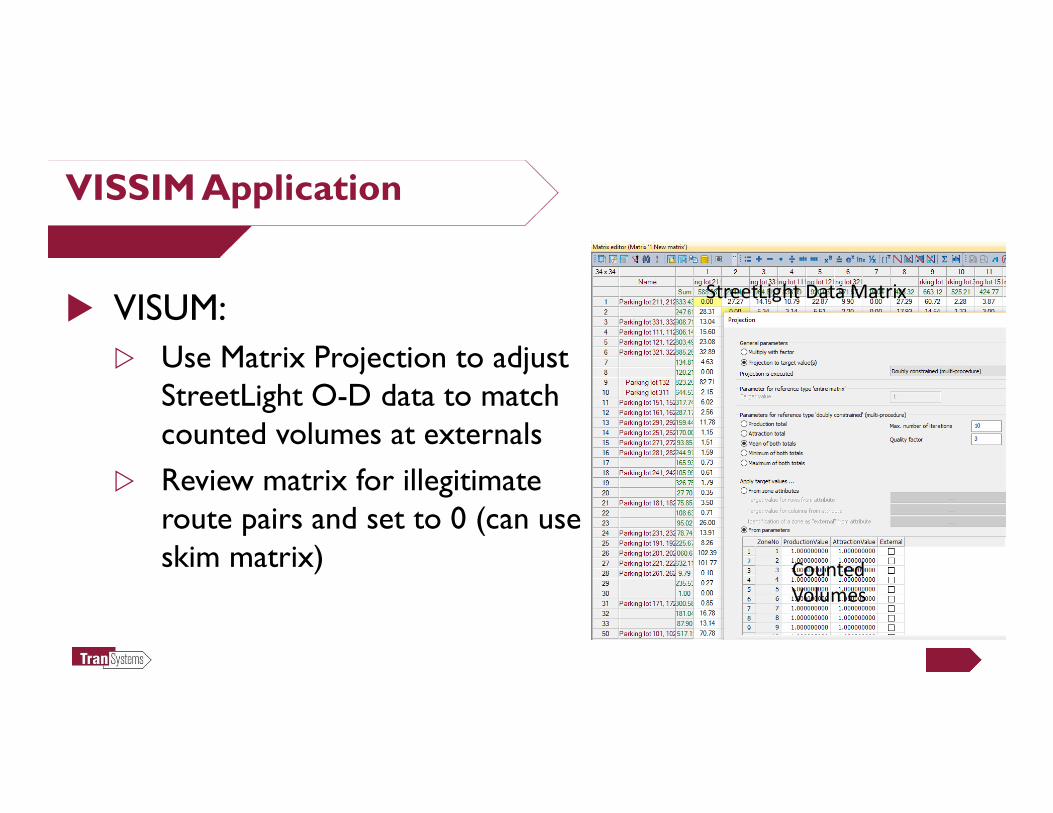
VISSIM Application
� VISUM:
� Use Matrix Projection to adjust StreetLight O-D data to match counted volumes at externals
� Review matrix for illegitimate route pairs and set to 0 (can use skim matrix)
StreetLight Data Matrix
Counted
Volumes
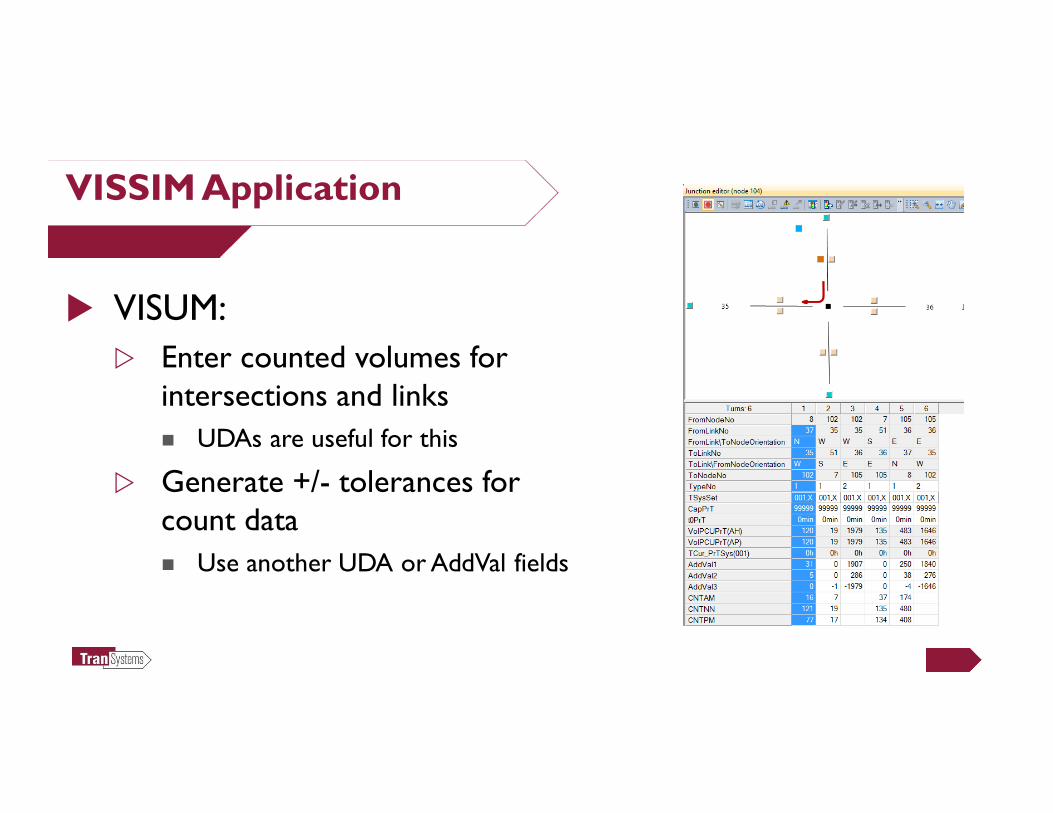
VISSIM Application
� VISUM:
� Enter counted volumes for intersections and links
� UDAs are useful for this
� Generate +/- tolerances for count data
� Use another UDA or AddVal fields
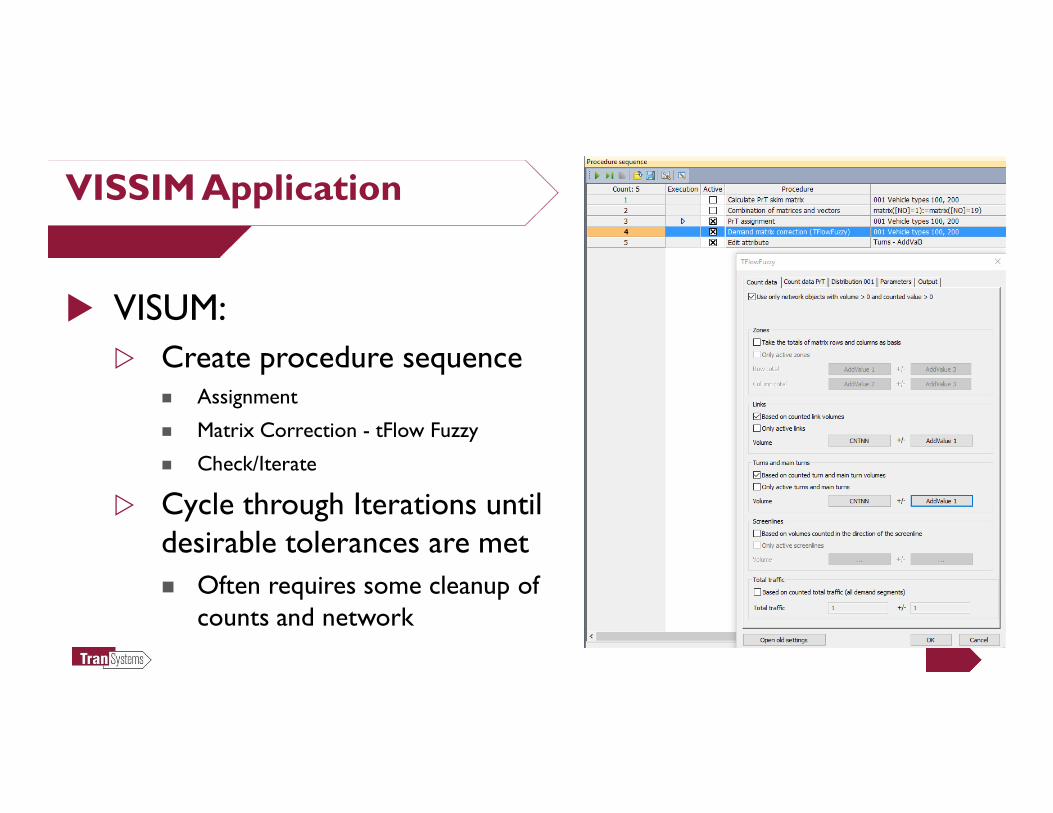
VISSIM Application
� VISUM:
� Create procedure sequence� Assignment
� Matrix Correction - tFlow Fuzzy
� Check/Iterate
� Cycle through Iterations until desirable tolerances are met
� Often requires some cleanup of counts and network

VISSIM Application
� VISSIM:
� Create network that mirrors VISUM structure (or vice versa)
� Pair VISSIM link numbers of external links with VISUM zone numbers
� For smaller networks, you can manually create routes and use volumes from balanced matrix
� For DTA models, stop here and pair with VISSIM matrix

VISSIM Application
� VISSIM:
� For large networks, create a pairing table of VISUM zones and VISSIM external links (in and out).
� Utilize an excel macro to generate route paths to paste into VISSIM inpxfile.� Just need start and end links in VISSIM route,
when you run the VISSIM model, the routing will be auto generated based on the shortest route.
� You can then edit routes as needed.

VISSIM Application
� VISSIM:
� Execute model!