Embed Size (px)
Citation preview

USING FLOWCHART TECHNIQUE TO IMPROVE
STUDENTS’ UNDERSTANDING ON INDEFINITE AND
DEFINITE ARTICLES
THESIS
Submitted by
SHERLA SEPSA ROSIVA
NIM. 140203118
Student of Faculty of Education and Teacher Training
Department of English Language Education
FACULTY OF EDUCATION AND TEACHER TRAINING
AR-RANIRY STATE ISLAMIC UNIVERSITY
DARUSSALAM - BANDA ACEH
2019 M/1440 H


v
ABSTRACT
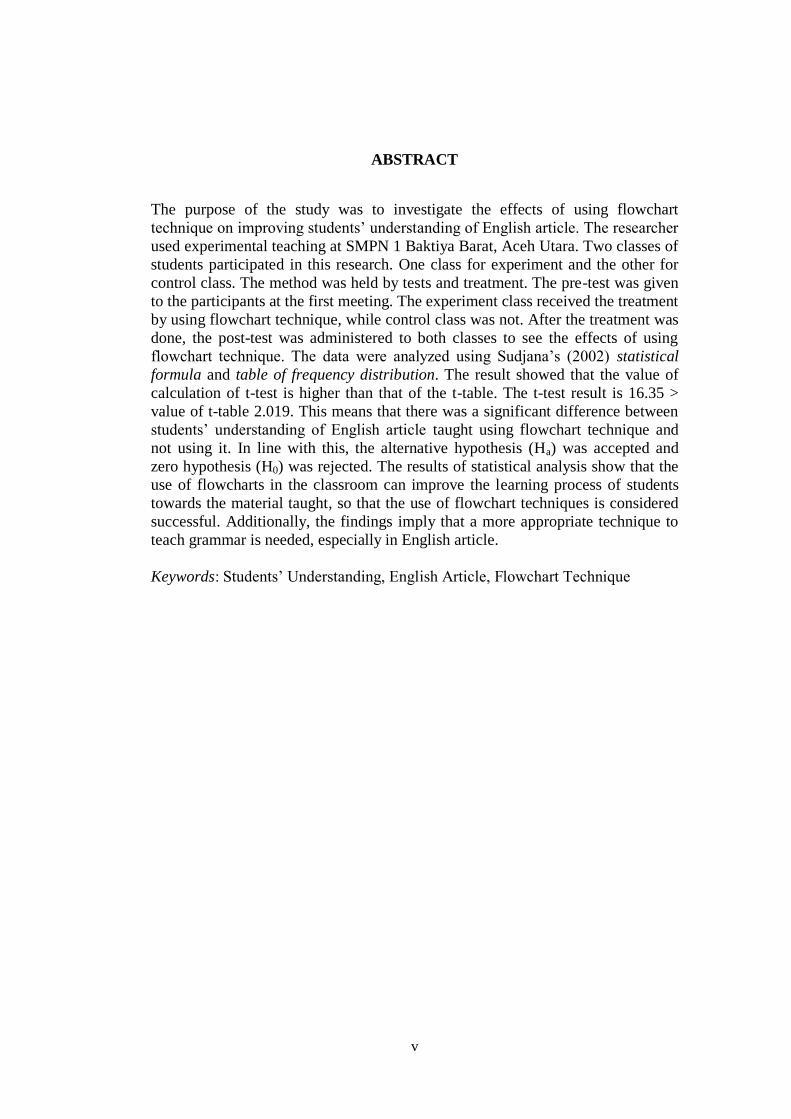
The purpose of the study was to investigate the effects of using flowchart
technique on improving students‟ understanding of English article. The researcher
used experimental teaching at SMPN 1 Baktiya Barat, Aceh Utara. Two classes of
students participated in this research. One class for experiment and the other for
control class. The method was held by tests and treatment. The pre-test was given
to the participants at the first meeting. The experiment class received the treatment
by using flowchart technique, while control class was not. After the treatment was
done, the post-test was administered to both classes to see the effects of using
flowchart technique. The data were analyzed using Sudjana‟s (2002) statistical
formula and table of frequency distribution. The result showed that the value of
calculation of t-test is higher than that of the t-table. The t-test result is 16.35 >
value of t-table 2.019. This means that there was a significant difference between
students‟ understanding of English article taught using flowchart technique and
not using it. In line with this, the alternative hypothesis (Ha) was accepted and
zero hypothesis (H0) was rejected. The results of statistical analysis show that the
use of flowcharts in the classroom can improve the learning process of students
towards the material taught, so that the use of flowchart techniques is considered
successful. Additionally, the findings imply that a more appropriate technique to
teach grammar is needed, especially in English article.
Keywords: Students‟ Understanding, English Article, Flowchart Technique

vi
ACKNOWLEDGEMENT
By saying the name of Allah SWT, the most loving and most merciful.
Through His mercy, a researcher is still given strength and health to complete her
education. Those who always hear the complaints of researcher in the face of
trials and with the power of the researcher are given the convenience to solve
every problem her face. Do not forget, prayer and greetings to the Great Prophet
Muhammad SAW. He has brought us from the realm of ignorance to nature that is
full of science as it is today.
In completing this thesis, researcher has various obstacles. Therefore, the
researcher thanked to Dr. Jarjani, S.Ag, S.Si., M.Sc., MA as the first supervisor
and Nidawati, S.Ag, M.Ag as the second supervisor. Which are helped the
researcher write this thesis as soon as possible. Thanks also to those who
accompanied, encouraged and motivated researcher during the writing of this
thesis. Then, to the head master of SMPN 1 Baktiya Barat; Mansur S.Pd and all
staffs who have allowed researcher to conduct the research at the school.
The researcher also expressed her gratitude to her beloved mother Erlina
and her father IPDA Pujianto, who endlessly supported, reminded, gave love and
prayers for her. Without them, researcher will not be able to complete her
education so far. Then, the researcher also thanked to her two beautiful sisters,
Dewi Novita Sari and Selvi Jannahtun Alhusna. Which always reminds and
encouraging her when down. They always feel comfortable listener to researcher
every day.

vii
The researcher also thanked to all her best friends; Miftahul Jannah,
Rismayanti, Elsa Isnanda, Nurul Shintia, Nurul Arafah, Riska Novela S, Rahmalia
Hasanah, Elma Yunita, Nia Maulina, Al-Muttaqin, Muchtarridha, Haiqal Maulana
T, Rahmad Aulia R, and Rian Purba who always help in joy and sorrow. As well
as to all friends of letting 2014 English Department, especially Unit 4, which has
been accompanied researcher for 4 years.
In addition, her great appreciation goes to the Hapkido and Taekwondo
student activity units of UIN Ar-Raniry, especially the trainers; Sabeum Firman,
Sayed, Halim and Farzal, the seniors, Hapkido's board members and other
members who have supported and entertained her. Lastly, thanked to all my
friends at KPM Gampong Empeh and PPL SMKS Al-Fitri Beureunun.
The researcher was aware of the perfection of the thesis that was still very
far away. Therefore, this thesis needs opinions and suggestions from readers for
future improvement.
Banda Aceh, January 2nd
, 2019
Sherla Sepsa Rosiva

viii
LIST OF CONTENTS
COVER
APPROVAL SHEET
EXAMINERS SHEET
DECLARATION OF ORIGINALITY
ABSTRACT .................................................................................................... v
ACKNOWLEDGMENT................................................................................ vi
LIST OF CONTENTS ................................................................................... viii
LIST OF FIGURES ....................................................................................... xi
LIST OF TABLES ......................................................................................... xii
LIST OF APPENDICES ............................................................................... xiii
CHAPTER I : INTRODUCTION
A. Background of Study ......................................................................... 1
B. Research Question ............................................................................. 3
C. Aims of Study .................................................................................... 3
D. Hypothesis .......................................................................................... 4
E. The Significance of Study .................................................................. 4
F. Operational Definition ........................................................................ 5
CHAPTER II : LITERATURE REVIEW
A. Definition of Article .......................................................................... 6
B. The Types of Article.......................................................................... 8
1. Indefinite Article....................................................................... 8
2. Definite Article......................................................................... 10
C. The Advantages of Using Article ...................................................... 12
D. Flowchart Technique ......................................................................... 13

ix
1. Definition of Flowchart ............................................................. 13
2. The Purpose of flowchart Technique ........................................ 14
E. The Use of Flowchart Technique ...................................................... 14
1. The Function of Flowchart ....................................................... 14
2. Flowchart Basic Procedure ...................................................... 15
3. Flowchart Considerations ........................................................ 17
4. Flowchart Examples ................................................................. 19
5. Commonly Used Symbols in Detailed Flowcharts .................. 20
F. The Advantages and Disadvantages of Flowchart Technique .......... 20
G. Concluding Researcher ..................................................................... 21
CHAPTER III : RESEARCH METHODOLOGY
A. Research Design ............................................................................... 23
B. Population and Sample ...................................................................... 24
1. The Population ......................................................................... 24
2. The Sample .............................................................................. 25
C. Technique of Data Collection............................................................ 26
1. Experimental Teaching ............................................................ 26
2. Test .......................................................................................... 26
3. Questionnaire ........................................................................... 27
D. Technique of Data Analysis ............................................................ 27
1. Test ......................................................................................... 27
2. Questionnaire .......................................................................... 29
3. Research Procedures ............................................................... 29
E. A Brief Illustration during the Research Using Flowchart .............. 33
F. Summary of Data Collection ........................................................... 35

x
CHAPTER IV : FINDING AND DISCUSSION
A. The Research Setting........................................................................ 37
B. Finding of the Research .................................................................... 38
1. The Analysis of Test Result ..................................................... 38
2. The Analysis of Questionnaires ............................................... 46
C. Discussion ........................................................................................ 53
D Examining Hypothesis ..................................................................... 54
CHAPTER V : CONCLUSIONS AND SUGGESTION
A. Conclusions ...................................................................................... 56
B. Suggestions ....................................................................................... 57
REFERENCES ............................................................................................... 58
APPENDICES
AUTOBIOGRAPHY

xi
LIST OF FIGURES
Figure 2.1: Cristopher LyCluyse‟s article Flowchart ....................................... 18
Figure 3.1: Brief Illustration during the Research Using Flowchart ................ 34

xii
LIST OF TABLES
Table 2.1: The sentence to produce a noun phrase means deteminer .............. 8
Table 2.2: Azar and Hagen‟s explains about indefinite article ........................ 10
Table 2.3: Azar and Hagen‟s explains about definite article ........................... 11
Table 2.4: The explanation about Cristopher LyCluyse‟s article Flowchart ... 19
Table 2.5: Symbols of Flowchart ..................................................................... 20
Table 3.1: Summary of Data Collection .......................................................... 36
Table 4.1: The result of Pre-test and Post-test ................................................. 39
Table 4.2: The result of Pre-test and Post-test ................................................. 41
Table 4.3: The Result of T-score (used to analyze t-test formula)................... 43
Table 4.4: The Number of Students in classroom ............................................ 48
Table 4.5: Types of questions related to students‟ attitude about English ....... 48
Table 4.6: Questions to participants related to students attitude about
English.............................................................................................................. 49
Table 4.7: Types of students‟ opinions about flowchart technique in
classroom.......................................................................................................... 50
Table 4.8: Questions of students‟ opinions about flowchart technique
in classroom ..................................................................................................... 51
Table 4.9: Types of students‟ opinions about the advantages of flowchart
technique in classroom ..................................................................................... 52
Table 4.10: Questions of students‟ opinions about flowchart technique
in classroom ..................................................................................................... 53
xiii
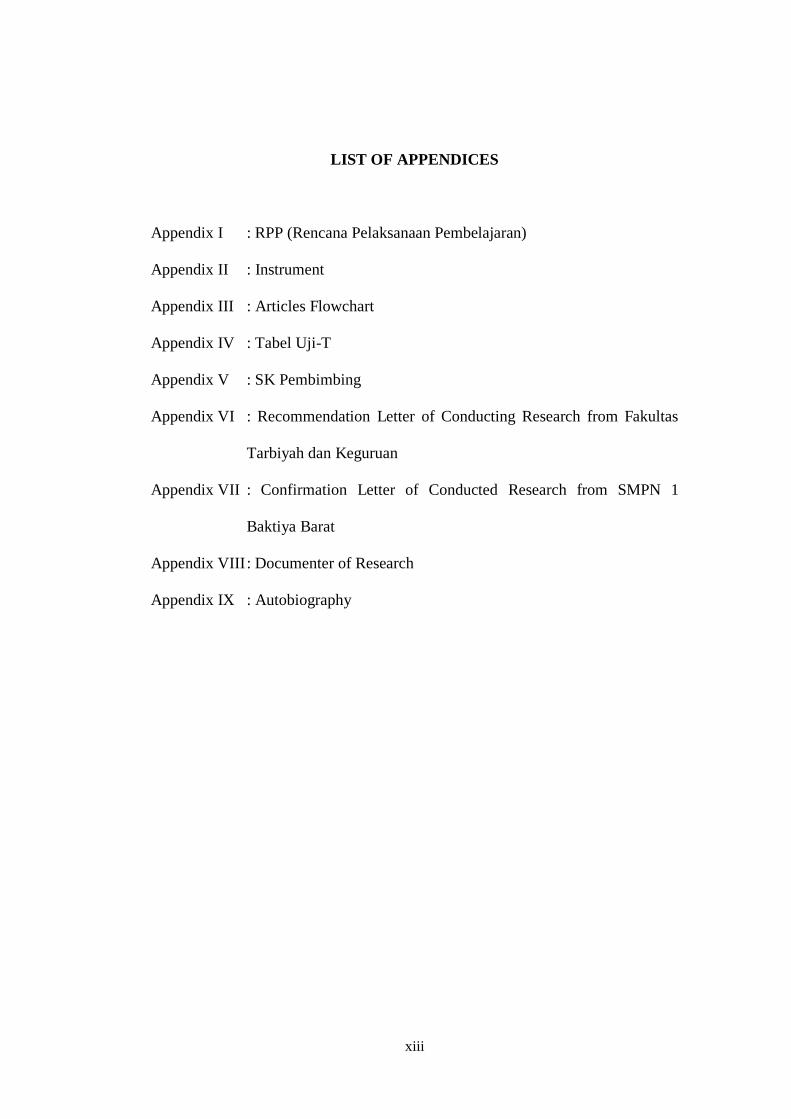
LIST OF APPENDICES
Appendix I : RPP (Rencana Pelaksanaan Pembelajaran)
Appendix II : Instrument
Appendix III : Articles Flowchart
Appendix IV : Tabel Uji-T
Appendix V : SK Pembimbing
Appendix VI : Recommendation Letter of Conducting Research from Fakultas
Tarbiyah dan Keguruan
Appendix VII : Confirmation Letter of Conducted Research from SMPN 1
Baktiya Barat
Appendix VIII : Documenter of Research
Appendix IX : Autobiography

1
CHAPTER I
INTRODUCTION
A. Background of Study
In Indonesia, learning English has been mandatory for secondary school
students. According to Curriculum 2013, English is learned by students since
they are in class seventh. When students learn English, they are focus on
mastering four skills and three components in English. Those skills are reading,
writing, listening and speaking. English components are grammatical
construction, pronunciation, and vocabulary. For mastering all of them, the most
important thing that should be mastered first is grammar. Based on Leech (1982),
grammar serves as a tool to communicate properly. Therefore, without good
grammar. It's impossible for the students can communicate well. As we know,
many materials are discussed in grammar, one of them is article.
The article is a word used to modify a noun (Knowles, n.d). There are two
types of articles, indefinite and definite article. Articles are easy material, but also
include confusing material on grammar. According to Master (1990), the article is
one part of grammar that very difficult to learn by EFL/ESL students. They still
make mistakes when using the article. After that, there are also many other
triggers that can occur. It supported by Sholihatun (2016), in her research, she
found out that students were still affected by their primary language (L1). This is
because the rules of English and Indonesian are very different. It is affected them
in the use of writing English, whether it's about articles. Not only secondary

2
school students, but even students of the university are also still confused. As in
research by Adhella (2007) explains that the use of articles are not easy. In the
results of her research, she found out that there were still many mistakes appeared
due to the use of the articles by second-semester students.
As well as abroad, students still have some problems with the use of articles.
Kim and Laskhmanan (2007) said that adult learners also have difficulties in
learning the correct system using articles. Further, Dulay, Burt, and Krashen
(1982) claimed that L1 learners, who learned their own language (English). They
still lack in using the article itself. In real life, even though they are native
speakers, they are still confused and do not understand how to use the right article.
According to Mrs Erfi as English teacher in SMPN 1 Baktiya Barat, Aceh
Utara, many students experience difficulties in understanding English article.
They are still got errors grammar when put the article in sentences. These
mistakes occur repeatedly without realizing it. Common mistakes that occur are;
first, students use the article "the" even though the sentence does not require
article "the". Consequently, students use the article "a / an" even though the
sentence does not require the article "a / an". It happened because they do not
remember how to use the right article. Besides those problems, students need
suitable learning techniques to reduce their errors.
This research was carried out to the use of flowchart can help the students in
understanding English article. Gluk and Kaarsgaard (2018) stated that flowchart is
a simple diagram that allows us to present the process of discussion. Which the

3
flowchart structure can help researcher to solve problems into smaller segments
and analyzed the problems, until getting the solution. Meanwhile, the flowchart is
a chart with certain symbols that describe the process in detail and the relationship
between one process to another process that we can easy to understand. Also,
flowchart has a role as learning media.
B. Research Questions
This study focused on two research questions:
1. How is the effect of using a flowchart on students‟ understanding of English
article?
2. How do the students perceive the use flowchart technique in teaching English
article?
C. Research Aims
The purposes of this research are as follows:
1. To know the effect of using a flowchart on students‟ understanding of English
article.
2. To find out students perceive the use flowchart technique in teaching English
article.
4
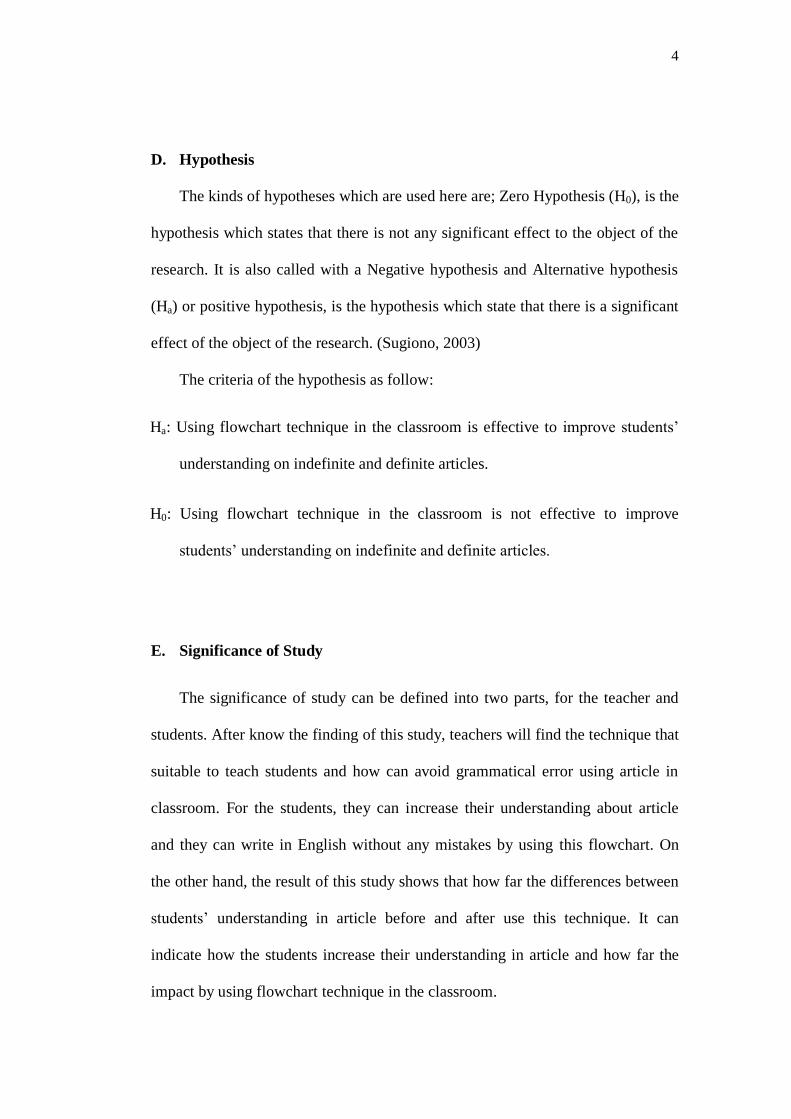
D. Hypothesis
The kinds of hypotheses which are used here are; Zero Hypothesis (H0), is the
hypothesis which states that there is not any significant effect to the object of the
research. It is also called with a Negative hypothesis and Alternative hypothesis
(Ha) or positive hypothesis, is the hypothesis which state that there is a significant
effect of the object of the research. (Sugiono, 2003)
The criteria of the hypothesis as follow:
Ha: Using flowchart technique in the classroom is effective to improve students‟
understanding on indefinite and definite articles.
H0: Using flowchart technique in the classroom is not effective to improve
students‟ understanding on indefinite and definite articles.
E. Significance of Study
The significance of study can be defined into two parts, for the teacher and
students. After know the finding of this study, teachers will find the technique that
suitable to teach students and how can avoid grammatical error using article in
classroom. For the students, they can increase their understanding about article
and they can write in English without any mistakes by using this flowchart. On
the other hand, the result of this study shows that how far the differences between
students‟ understanding in article before and after use this technique. It can
indicate how the students increase their understanding in article and how far the
impact by using flowchart technique in the classroom.

5
F. Operational Definition
1. Flowchart
According to Krismiaji (2010) Flowchart is a technique that describes
information in brief, solid and clear. Flowchart is a chart that uses symbols or
signs to solve a problem. Also, the flowchart program is a chart with certain
symbols that describe the process sequence in detail and the relationship
between one process and another. Each symbol has its own meaning. The
flowchart also makes it easy for students to summarize learning material in
one place.
2. Article
Yildirim (2015) stated that, the article is something refers to a noun. It has
two types of articles; they are indefinite and definite articles. The indefinite
article is used when you are speaking about someone or something unfamiliar
to you in general. Whereas, the definite article is used to describe a specific
person or thing. When you are speaking with someone or something familiar,
you can put the with the noun. (Azar, 2006).
3. Improvement
Improvement leads to better things in increasing a value or quality
(Hornby, 1995). The improvement that the researcher means is the result that
students achieve after the learning process ends.
6
CHAPTER II
LITERATURE REVIEW
To support this research, the literature review is set up in this chapter by
reviewing important theories about article which covers its definition, the types of
articles, and the advantages of using article. The researcher also explains the
definition of flowchart, the purpose of flowchart technique, the use of flowchart
technique, the advantages and disadvantages of flowchart technique and
concluding Researcher.
A. Definition of Article
Article is part of the determiner class. It also include part of speech. In
general, both articles and determinants function to limit the noun.
According to Trask (1999), determiner is a part of speech which includes words
like the and my. Any single word which can fit into the blank in the following
frame to produce a noun phrase is a determiner. __new pen. Example: the, a, this,
that, some, every, no, my, her, which. There are some further determiners which
can only fit into plural phrases , as in __new pens. Example: these, most, both, all,
few, several.
Trask (1999) also mentions that to know the determiner is very simple. Any
word that completes the blank part of the sentence below to produce a noun
phrase means deteminer.

7
Table 2.1 The sentence to produce a noun phrase means deteminer
A Single Noun Phrase Plural Noun Phrase
Example : __ new pen.
To produce a singular noun phrase, it
can complete with words: the, a, this,
that, some, every, no, my, her, which.
Then the word is called determiner.
Example : __ new pens.
Determiner which can only
complement plural noun phrases,
namely: these, most, both, all, few,
several.
Based on Trask (1999), the two most highly grammatical determiners, the
and a(n), are called articles, the ones like my and her are traditionally called
possesive pronouns, but grammatically they are determiners, not pronouns. The
quote explains, that determiner is a part of speech that appears together with a
noun that shows semantic contrast, for example in terms of quantity. When it
appears in a language, the article is a core part of the determiner. Another words
that has a determiner function are: every, this / that, some / any that has a
distribution function in place of the article position, such as: the / this / some book.
Crystal (2001) states that article is a term used in the grammatical
classification of words, referring to a subclass of determiners which displays a
primary role in differentiating the uses of nouns, e.g. the/a in English. Many
languages have no article system (e.g. Russian). Of those which do a distinction is
usually made into definite and indefinite (non-definite) types. Partly of semantic
and partly on grammartical grounds, articles may appear before a noun (as in
English).
In English, there are four types of articles, namely: definite article (the),
indefinite article (a/an), zero article and partial (some and any). In general, the

8
article has semantic and lexical structural functions. Whereas the structural
function is the determiner that precedes the noun. While the semantic function is
to indicate that a noun is definite or indefinite. Articles cannot stand alone and are
followed by a noun thereafter.
The central determiner is divided into two, namely: 1. Indefinite article;
and 2. definite article. Indefinite article uses a / an. Definite article uses the. As
for one other article that shows the type of words that are not preceded by the
article: a, an and the, namely zero articles (Catford, 1965).
In this research, the researcher focused on this two articles; 1. Indefinite
article; and 2. definite article. After this it will be explained in more detail.
B. The types of article
1. Indefinite Article
Based on Thomson and Martinet (1986), The form a is used before a word
beginning with a consonant sound: a man, a hat, a university, a European, a
one way street. The form an is used before words beginning with vowel (a, i,
u, e, o) or words beginning with a mute h: an apple, an island, an hour or
individual letters spoken with a vowel sound: an L-plate, an MP, an SOS, an
„X‟. A/an is the same for all genders: a mam, a woman, an actor, an actress, a
table. Likewise Azar (1985) stated that, A is used in front of nouns that begin
with consonant: a book, a dog, a pencil. An is used in front of nouns that begin
9
with a vowel or a vowel sound: an apple, an elephant, an idea, an opinion, an
uncle, an hour.
From the quote above, we can conclude that the indefinite article is
used for unclear singular count noun. Which is not contextually known both
speaker and listener.
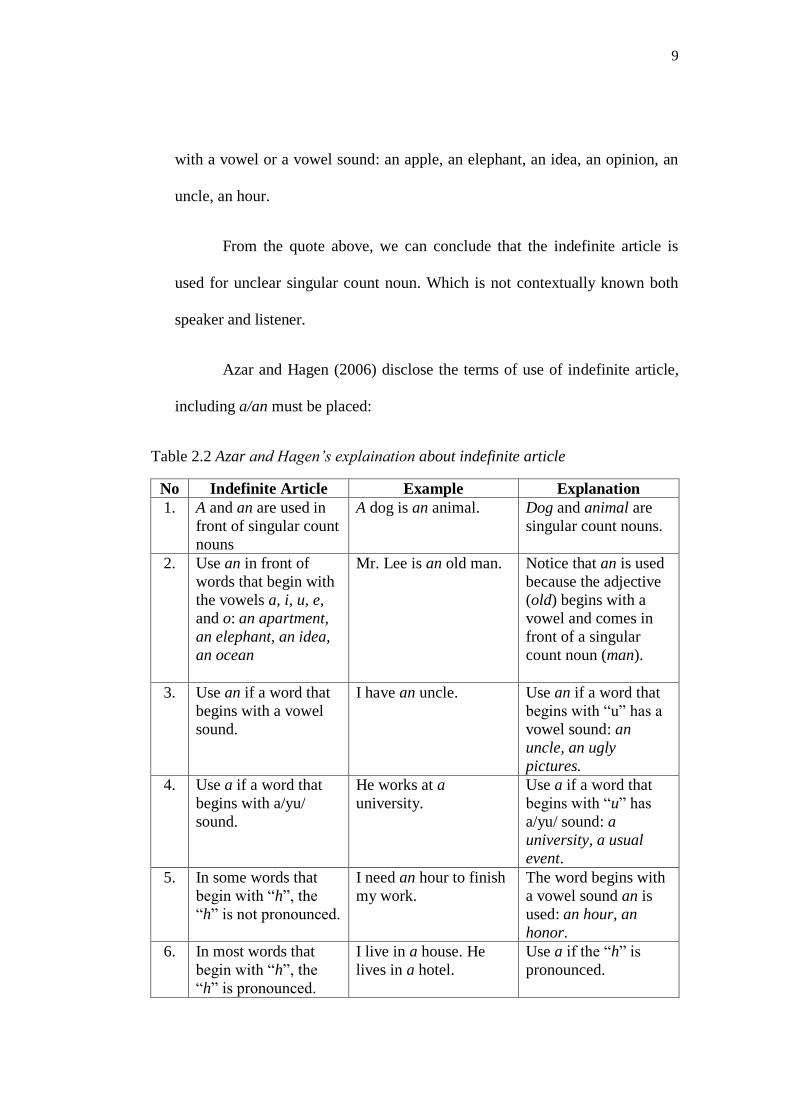
Azar and Hagen (2006) disclose the terms of use of indefinite article,
including a/an must be placed:
Table 2.2 Azar and Hagen’s explaination about indefinite article
No Indefinite Article Example Explanation
1. A and an are used in
front of singular count
nouns
A dog is an animal. Dog and animal are
singular count nouns.
2. Use an in front of
words that begin with
the vowels a, i, u, e,
and o: an apartment,
an elephant, an idea,
an ocean
Mr. Lee is an old man.
Notice that an is used
because the adjective
(old) begins with a
vowel and comes in
front of a singular
count noun (man).
3. Use an if a word that
begins with a vowel
sound.
I have an uncle. Use an if a word that
begins with “u” has a
vowel sound: an
uncle, an ugly
pictures.
4. Use a if a word that
begins with a/yu/
sound.
He works at a
university.
Use a if a word that
begins with “u” has
a/yu/ sound: a
university, a usual
event.
5. In some words that
begin with “h”, the
“h” is not pronounced.
I need an hour to finish
my work.
The word begins with
a vowel sound an is
used: an hour, an
honor.
6. In most words that
begin with “h”, the
“h” is pronounced.
I live in a house. He
lives in a hotel.
Use a if the “h” is
pronounced.

10
2. Definite Article
According to Quirk etl (1986), the is used to mark the phrase it produces
as definite, i.e. as referring to something which can be identified uniquely in
the contextual or general knowledge shared by speaker and hearer. It can be
concluded that the use of definite article the is to mark a unique noun that has
been generally known contextually by the speaker and listener.
The Definite article is also used with common noun and singular noun
such as 'the house' or countable noun like 'the houses', and uncountable noun
'the bread' (Mc Arthur, 1992). In addition, the is also used in the proper noun,
such as: the Vatican, the Hague, the Penniles (Adhella, 2007).
Azar and Hagen (2006) disclose the definite article usage terms, including
the must be placed:
Table 2.3 Azar and Hagen’s explains about definite article
No Definite Article Example Explanation
1. A speaker uses the
when the speaker
and the listener
have the same thing
or person in mind.
The shows that a
noun is spesific.
(a) A: I have two pieces of
fruit for us, an apple and a
banana. Which do you
want?
B: I‟d like the apple, thank
you.
(b) A: Where‟s David?
B: He‟s in the kitchen.
(c) A: It‟s a nice summer day
today. The sky is blue. The
sun is hot.
B: Yes, I really like
summer.
(a) When B says
“the apple”,
both A and B
have the same
apple in mind.
(b) Both A and B
have the same
kitchen in mind.
(c) Both A and B
are thinking of
the same sky
(there is only
one sky for
them to think
of) and the
same sun (there
is only one sun

11
for them to
think of).
2. Singular count
nouns
(a) Mike has a pen and a
pencil.
(b) The pen is blue.
(c) The pencil is yellow.
Notice in
example: the
speaker is using the
for the second
mention of a noun.
When the speaker
mentions a noun
for a second time,
both the speaker
and listener are
now thinking about
the same thing.
First mention: I
have a pen.
Second mention:
The pen is blue.
3. Plural count nouns (a) Mike has some pens and
pencils.
(b) The pens are blue.
(c) The pencils are yellow.
4. Noncount nouns (a) Mike has some rice and
some cheese.
(b) The rice is white.
(c) The cheese is yellow.
5. The used to
indicate a noun that
is definite or has
been previously
specified in the
context
(a) Please close the door.
(b) I like the clothes you gave
me.
6. The used to
indicate a noun that
is unique
(a) Praise the Lord!
(b) The Columbia River is
near here.
It refers to only
one thing in the
world
7. The used to
designate a natural
phenomenon
(a) The nights get shorter in
the summer.
(b) The wind is blowing so
hard.
The listener
understands what
the speaker refers
to.
8. The used to refer to
a time period
(a) I was very naïve in the
past.
(b) This song was very
popular in the 1980s.
9. The used to
indicate all the
members of a
family
(a) I invited the Bakers for
dinner.
(b) This medicine was
invented by the Smiths.

12
C. The Advantages of Using Article
English is a truly remarkable language. This is spoken in almost every
country; even some countries have made this English into their second language
or foreign language.
Although the increasing popularity of English has spread widely. Some non-
native speakers can reach a high level in English. However, there are many non-
native speakers who have low levels. This is based on several reasons, ranging
from their own personal interests that are lacking or even some of them have
direct opportunities to interact with native speakers. So that the experience has
paid off.
However, for many students, researcher suspects that the desire to learn their
English is very low with difficult and confusing English features. This is a feature
that does not seem to make sense to those who are not native speakers. Some of
the most difficult features of English grammar for foreigners are two articles:
"a/an," and "the" (Sholihatun, 2016).
Therefore, features that are considered easy for native speakers. This can
make non-native speakers feel troubled. They do not understand how the feature
works properly. This will make it difficult for them, especially for students.
Although at school they are often taught the use of articles, they still make a
lot of mistakes. Even though, this indefinite article and definite article are very
basic and important in using good and right English. Unfortunately, if you

13
continue to make mistakes without treatment, students cannot make correct
communication in English later.
D. Flowchart Technique
1. Definition of Flowchart
Flowchart is a technique that can be used in learning. It is a systematic
presentation of the process and logic of the activities of handling
information or drawing graphically of the steps and sequences of
procedures of a system. In addition, Gluck and Kaarsgaard (2018) stated
flowcharts also help analysts and programmers to solve problems into
smaller parts and help in analyzing other alternatives in operation.
Flowchart system is a sequence of processes in the system by showing the
input and output media tools as well as the type of storage media in the
data processing process. So, to make this flowchart, there must be
information that can be used for data processing.
Inside the flowchart, besides how it works. The flowchart also has a
program. According to Tonni (2016), flowchart program is a chart with
certain symbols that describe the process in detail and the relationship
between a process (instruction) with other processes in a program. While
Pahlevy (2010) stated that, flowchart is a description in the form of a flow
diagram of the algorithms in a program, which states the direction of the
program flow.

14
2. The Purpose of Flowchart Technique
Flowchart is a chart that shows the flow or flow in a program or
system procedure logically (Jogiyanto, 2005). By using flowchart, it will
be easy to solve a problem using the chart. Which process is clear and
detailed. Based on Kuruvila (2017), in the proposed flow chart plagiarism
detection system, flowcharts are compared by comparing both the shape,
orientation as well as text. This approach creates graph from the
flowchart, hence is capable to detect the plagiarism with same shaped
objects even though the orientation of the graph is changed. Accuracy of
the technique is tested with flowcharts of different shape and orientation.
From the statement above, especially italic writing, the researcher
can conclude, that the flowchart is also useful as an appropriate measuring
tool in solving a problem. Therefore, many researchers use flowcharts as
the right technique in their research.
E. The Use of Flowchart Technique
1. The Function of flowchart
Flowchart is a chart that has a lot of functions. Anharku
(2009) claimed that there are several functions of flowchart; First,
Flowchart is to develop understanding of how a process is done. As
we know, this is the basic function to describe flowchart. With the
flowchart, we can easily understand the process by applied this
chart as one process to another process until the end. Second, put a

15
flowchart as a technique to study a process for improvement
(Gluck & Kaarsgaard, 2018). Example; as in this research,
researcher focuses on flowchart have a function to make learning
techniques in improving student learning. Beside that reason, the
researcher considers the flowchart is one good technique that
improving student learning in a unique way. Then, flowchart is to
communicate to others how a process is done. Also, it has a
function to process a document and planning a project. Thus, this
flowchart can help the people to organize their project plan about
work or study.
2. Flowchart Basic Procedure
Based on Anharku (2009), before we create a flowchart,
many procedures that we should prepared. Firstly, materials
needed: sticky notes or cards, a large piece of flipchart paper or
newsprint, marking pens. Then, define the process to be
diagrammed. Write its title at the top of the work surface. The next
occasion, discuss and decide on the boundaries of your process:
Where or when does the process start? Where or when does it
end? Discuss and decide on the level of detail to be included in the
diagram.
Later on, brainstorm the activities that take place. Write
each on a card or sticky note. Sequence is not important at this

16
point, although thinking in sequence may help people remember
all the steps. Following that, arrange the activities in proper
sequence. After that, when all activities are included and everyone
agrees that the sequence is correct, draw arrows to show the flow
of the process. At the end, review the flowchart with others
involved in the process (workers, supervisors, suppliers,
customers) to see if they agree that the process is drawn
accurately.
3. Flowchart Considerations
May be its hard to drawing a flowchart, but don‟t worry too
much about drawing the flowchart the “right way.” The right way
is the way that helps those involved to understand the process
(Anharku, 2009). So far, identify and involve in the flowcharting
process all key people involved with the process. This includes
those who do the work in the process: suppliers, customers and
supervisors. Involve them in the actual flowcharting sessions by
interviewing them before the sessions and/or by showing them the
developing flowchart between work sessions and obtaining their
feedback. Then, do not assign a “technical expert” to draw the
flowchart. People who actually perform the process should do it.
Also, if a computer software is available for drawing flowcharts.
Meanwhile, software is useful for drawing a neat final diagram,

17
but the method given here works better for the messy initial stages
of creating the flowchart.
4. Flowchart Examples
This is an example of article flowchart by Cristopher
LyCluyse of the Westerner College Writing Center (LyCluyse,
n.d).
Figure 2.1 Cristopher LyCluyse‟s article Flowchart

18
The clear explanation of the articles flowchart above can be
explains in box below:
Table 2.4 The explanation about Cristopher LyCluyse’s article
Flowchart
No Types Explanations or the Examples
1. Count noun
Example:
Window, animal, enclosure,
encounter, tree, boat, bridge,
avalanche.
2. Concrete noun
Example:
Poem, water, figure, crowd,
breath, night, day, sunlight,
sunset.
3. Abstract noun Example:
Poetry, time, theory, knowledge,
space.
4. Indefinite article Referring to something in general.
Example:
Would you hand me a pen? I
want to write a letter.
5. Definite article Referring to something specific.
Example:
Did you notice the moon? We are
on the planet Earth.
6. Plural noun
Example:
Windows, animals, enclosures,
encounters, trees, boats, bridges,
emotions.
7. The rule of of
“Of” is a way of symbolizing
that something belongs to
something else.
Example:
“The time of day is noon.”
“Time” belongs to the concrete
noun “day.”
8. Adjectives
Sometimes an adjective
comes between a noun and its
article. Example:
“We are on the third planet.”
The word “third” acts as an
adjective. It is describing the
noun “planet.”

19
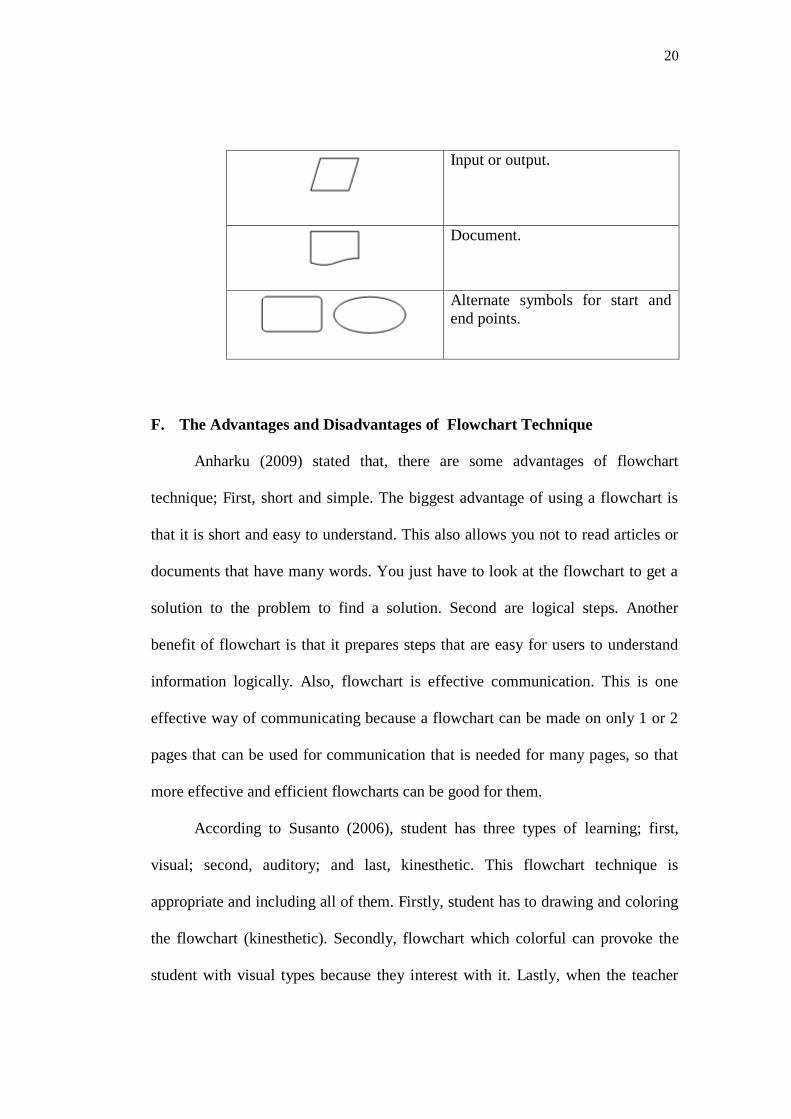
5. Commonly Used Symbols in Detailed Flowcharts
This is a commonly symbols that used in a flowchart by
Anharku (2009) below:
Table 2.5 Symbols of flowchart
Symbol Explanation/function
One step in the process; the step is
written inside the box. Usually,
only one arrow goes out of the
box.
Direction of flow from one step or
decision to another.
Decision based on a question. The
question is written in the
diamond. More than one arrow
goes out of the diamond, each one
showing the direction the process
takes for a given answer to the
question. (Often the answers are “
yes” and “ no.”)
Delay or wait.
Link to another page or another
flowchart. The same symbol on
the other page indicates that the
flow continues there.
20
Input or output.
Document.
Alternate symbols for start and
end points.
F. The Advantages and Disadvantages of Flowchart Technique
Anharku (2009) stated that, there are some advantages of flowchart
technique; First, short and simple. The biggest advantage of using a flowchart is
that it is short and easy to understand. This also allows you not to read articles or
documents that have many words. You just have to look at the flowchart to get a
solution to the problem to find a solution. Second are logical steps. Another
benefit of flowchart is that it prepares steps that are easy for users to understand
information logically. Also, flowchart is effective communication. This is one
effective way of communicating because a flowchart can be made on only 1 or 2
pages that can be used for communication that is needed for many pages, so that
more effective and efficient flowcharts can be good for them.
According to Susanto (2006), student has three types of learning; first,
visual; second, auditory; and last, kinesthetic. This flowchart technique is
appropriate and including all of them. Firstly, student has to drawing and coloring
the flowchart (kinesthetic). Secondly, flowchart which colorful can provoke the
student with visual types because they interest with it. Lastly, when the teacher
21
explains the material with a flowchart as media. Students whose auditory types of
learning will capture the voice of the teachers‟ explanations.
Beside the advantages, flowchart technique also has several disadvantages,
such as: First, time consuming. It is spend a lot of time drawing the diagram box.
Be careful in drawing the box according to the problem process. Also, flowchart is
very difficult to understand the meaning of each box shape. For beginners, it's
very difficult to understand every meaning of the box shape. Because each form
has its own meaning that is adjusted to the process you want to draw. Basically,
users must understand more about the previous flowchart before making this
diagram (Anharku, 2009).
G. Concluding Researcher
Based on the explanation discussed in this chapter, so far students have
experienced many obstacles in understanding English articles, one of them in the
sentence. To overcome these errors occur repeatedly, students need for a solution
that can minimize these errors. One of the solutions provided by researcher is the
use of flowchart techniques to improve student learning systems, based on all the
advantages of flowchart discussed earlier (section 4 in chapter II) and flowcharts
have functions as learning techniques in improving student learning (Gluck &
Kaarsgaard, 2018) (section 3a in chapter II). From students who do not understand
English article can be more understanding than before with the use of the
technique as media. The technique that apply when the teacher do a treatment for
students. Good flowcharts are made in groups / teams. Group members need to

22
discuss and agree on the boundaries of the process or activity that will be included
in the flowchart, like English article. Solve the process into steps that can be
written in the form of short and clear verbs. Each of these steps is written in a box,
then do the mapping by connecting each box with arrows in the order of the steps
in the process based on the teacher instruction (Kusnadi, 2012).
So that later, students' perspective is needed on the use of flowchart
techniques in the class which will be discussed in chapter IV based on the analysis
of the instruments given in the form of questionnaires. Thus researcher knows the
technique can have an effect on their learning or not, so they don't repeat the same
mistakes going forward.

23
CHAPTER III
RESEARCH METHODOLOGY
Research methodology deals with how the research questions proposed in
the first chapter are processed with a particular method. Therefore, in this chapter
the writer discusses about research design, population and samples, technique of
data collection, technique of data analysis, research procedures, a brief illustration
during the research using flowchart and summary of data collection.
A. Research Design
The research method related to how the design is implemented and how the
research is carried out. This method is often used to determine the quality of data
collection. This study uses quantitative methods. According to Fellow and Liu
(2008), the quantitative method is an imitation method that gives immediate
results. Another reason for choosing this approach is that the method is more
efficient, can test hypotheses and always aim to clarify objects, calculate them and
use statistical models to clearly explain what has been observed during the study.
This research is an experimental research which requires the collection,
analysis and interpretation of quantitative data carefully. Adelman (1998)
explained that experimental research is a research situation in which one of the
independent variables is called an experimental variable, deliberately manipulated
or varied by the researcher. While quantitative research is the collection and

24
analysis of numerical data to explain, predict, or control interesting phenomena.
Also, the experimental research is needed to prove the hypothesis.
This study used pre-test and post-test in data collection. Which is the pre-test
used to determine the limits of students' abilities before being given treatment.
After being given treatment, it will be tested through the post-test.
This method combines numerical data through evaluation sheets made by
researcher. Aims to answer questions related to the current status of the research
subject. Questionnaire sheet is used to find out students' responses to using
flowchart technique on indefinite and definite article are effective or not.
Researchers also use research in the field. Field research is a quantitative method
of data collection that aims to understand, survey, and interact with people related
to research naturally.
B. Population and Samples
1. The Population
The population is the subject of research. According to Sugiyono
(2010), the population is an area of generalization which consists of
objects or subjects that have certain qualities and characteristics set by
Researcher to be studied and then drawn conclusions. So the population is
not only people but also objects and other natural objects. The population
is also not just the amount that exists in the object or subject being studied
but includes all the characteristics/characteristics possessed by the subject

25
or object. The population of this study was the first-grade students who
studied at SMPN 1 Baktiya Barat, Aceh Utara. The population of this
study is 67 students consisting of students in class VII/A, VII/B, and
VII/C.
2. The Sample
According to Sugiyono (2010), the sample is part of the number
and characteristics possessed by the population. If researcher conduct
research on a large population, while researcher wants to examine the
population and researcher have limited funds, energy and time, the
researcher used sampling techniques, so that generalization to the
population under study. The meaning of the sample taken can represent or
represent the population. In this case, the sample is grade VII/B and VII/C
students at SMPN 1 Baktiya Barat, Aceh Utara.
The sampling technique was a purposive sampling. The sample
register are in class VII/B and VII/C. The researcher chooses this sample
based on the recommendation from English teacher there. The number of
students is 43 students. This is according to Arikunto (2003) who says that
if the subject is less than 100, it is advisable to take the entire population.

26
C. Technique of Data Collection
To support this research, the research needs to collect data. The researcher
will apply some of the processes needed to collect the data, namely: Experimental
teaching, tests, and questionnaires. The explanation will be discussed below:
1. Experimental Teaching
The Researcher used experimental teaching. It is one technique
used by the researcher to obtain data. It is selected two classes as a sample.
First class as experimental class (VII/C) and other class as control class
(VII/B). Four meetings for per class will be held to teach students how to
improve their understanding of articles using Flowchart as a technique in
experiment class. This technique is very important to provide treatment as
expected to improve students' understanding ability related to the problems
faced. Meanwhile, for control class did not use flowchart technique to
improve their understanding on treatment. This research used a pretest-
posttest group design. At the first meeting and the last meeting was used to
do the test, also the Researcher gave some treatment to students. At the last
meeting of experiment class, the researcher gave them the questionnaire.
2. Test
Tests in this study are given to measure students' skills before and
after treatment. The test is divided into two parts; pre-test and post-test.
The pre-test is a test that aims to find out students' skills before being
given treatment. While the post-test is given after students got the

27
treatment, which served to find out whether there is an increase or not to
students.
3. Questionnaire
To get additional data, the researcher needs a questionnaire. The
questionnaire aims as a 'tool', to collect and record information about the
problem being examined. It will be distributed to students to find out their
response during the research process that occurred. The questionnaire
consists of several questionnaires but must include clear instructions and
space for answers or administrative details (Lisa, 2006). Questionnaires
will be given 15 questions at the last meeting in experiment class and they
will be given 20 minutes to answer all questions. These test results will be
analyzed and discussed.
D. Technique of Data Analysis
1. Test
The Researcher used the statistical formula that to analyzing the
data of two tests; pre-test and post-test. The researcher used 20
questions that answered by the student. Each question is 5 points.
Sudjana (2002) stated that the mean of students‟ score was
calculated by using the formula as follow:

28
X
Note:
X : mean
fi : frequency
xi : the middle score interval class
fixi : the amount of multiplication between the frequencies and
the middle scores of interval class
After calculating the mean of each test. The data is served
in a table named Table of Frequency Distribution. Based on
Sudjana (2009), when the pre-test and post-test mean has been
calculated, the data would be analyzed to the significant
improvement toward the mean score by using the following
formula:
Note:
t0 : t observation
M : Mean of Difference (the difference of pre-test and

29
post-test score)
S : Standard error of Mean Difference
2. Questionnaire
In order to get the data, the researcher created the questionnaire.
The data from questionnaire were analyzed by finding the average in
each statement for each option on questions. In this research was
designed questionnaire consists of 15 questions. The questionnaire
used Likert Scale by the form close-ended question that is by checking
an item from a list of suggested responses. The students were
expected to choose the best answer that suitable for them. The
questionnaire was given for the students in experiment class (VII/C).
In the process of giving the questionnaire, the researcher gave the time
20 minutes to answer all the questions.
E. Research Procedures
There are three stages in doing experiment research; they are pre-test,
treatment and post-test.
1. Pre-test
The pre-test was given before the treatments. Firstly, the teacher
came to the classes. Then, she asked about the difficulties in mastering
indefinite and definite articles and explained about flowchart technique is.

30
Last, the teacher gave them the pre-test and asked them to answer all
questions how to see far they understood about the material before
treatment.
2. Treatment
a. In Experimental Class
1) First Meeting
In the first meeting, the teacher gave an easy
example to provoke their understanding of related
material. After that, the teacher explained in detail about
the answers from the previous example, most importantly
the teacher explained the basic parts before entering the
actual material, namely the count and non-count noun. The
teacher gave a sheet of questions paper, which contains 11
questions about count and non-count nouns. Each student
can fill in the right answer.
2) Second Meeting
The teacher explained about indefinite and definite
articles and the used in sentence. After that, the teacher
gave 10 questions on the whiteboard and order students to
come to the front of the class and fill in the answers they

31
think are right. After the question is fully filled, the
teacher and students discussed together.
The teacher used the flowchart technique as media
to learn indefinite and definite articles easily. The teacher
explained the definition of the flowchart, the function of
the symbols in the flowchart and how to use or read the
correct flowchart. After students understood, the teacher
told students to sit in pairs and gave 22 questions that they
had to do together.
b. In Control Class
1) First Meeting
The teacher gave an easy example to attract
children's attention based on daily life examples. After
that, the teacher explained about the count and non-count
nouns, also how to use them. After that, the teacher gives
11 questions and tells them to answer them individually.
Last, the teacher and students discussed together the
questions that have been answered.
2) Second Meeting
The teacher introduces the students about the use of
indefinite articles in sentence. The teacher wrote some

32
questions on the whiteboard and tells some students to
answer. After that, the teacher and students discussed
together.
The teacher introduces the students about the use of
indefinite article in the sentence. The teacher wrote some
questions on the whiteboard and told some students to
match the sentence with the answer they think is right.
After that, the teacher and students discussed together.
3. Post-test
Post-test was held after all treatments were conducted. This test
was used to measure students‟ understanding of the material after given
treatments. The result of the test was analyzed statistically.

33
F. A Brief Illustration during the Research Using Flowchart
This is a brief illustration by the researcher during conducted the research
through flowchart.
Yes
Title
Research Questions
Research Design;
Quantitative
Hypothesis
Population and
Sample
Technique of Data Collections; Experimental
teaching, tests, and questionnaire
Research Procedure; pre-
test, treatment, post-test
Experiment class
using flowchart
technique

34
Yes
Yes
Figure 3.1 A Brief Illustration during the Research Using Flowchart
Data Analysis; Test
and Questionnaire
Control class not
using flowchart
technique
Is it t-test > t-
table?
Analysis of Data
Result
Ha > H0
35
G. Summary of Data Collection
This is a summary of data collection used by researcher in her research based
on what has been described above in this chapter.
Table 3.1 Summary of Data Collection
No Research
Questions
Methods Participants Reasons
1. How is the effect
of using a
flowchart on
students‟
understanding of
English article?
- Tests (Pre-test
and Post-test)
- Treatment
Students To measure
the data and
students‟
knowledge.
2. How do the
students perceive
the use flowchart
technique in
teaching English
article?
- Questionnaire Students To know
students
perceive
about
flowchart
technique in
classroom
based on
their learning
experiences.
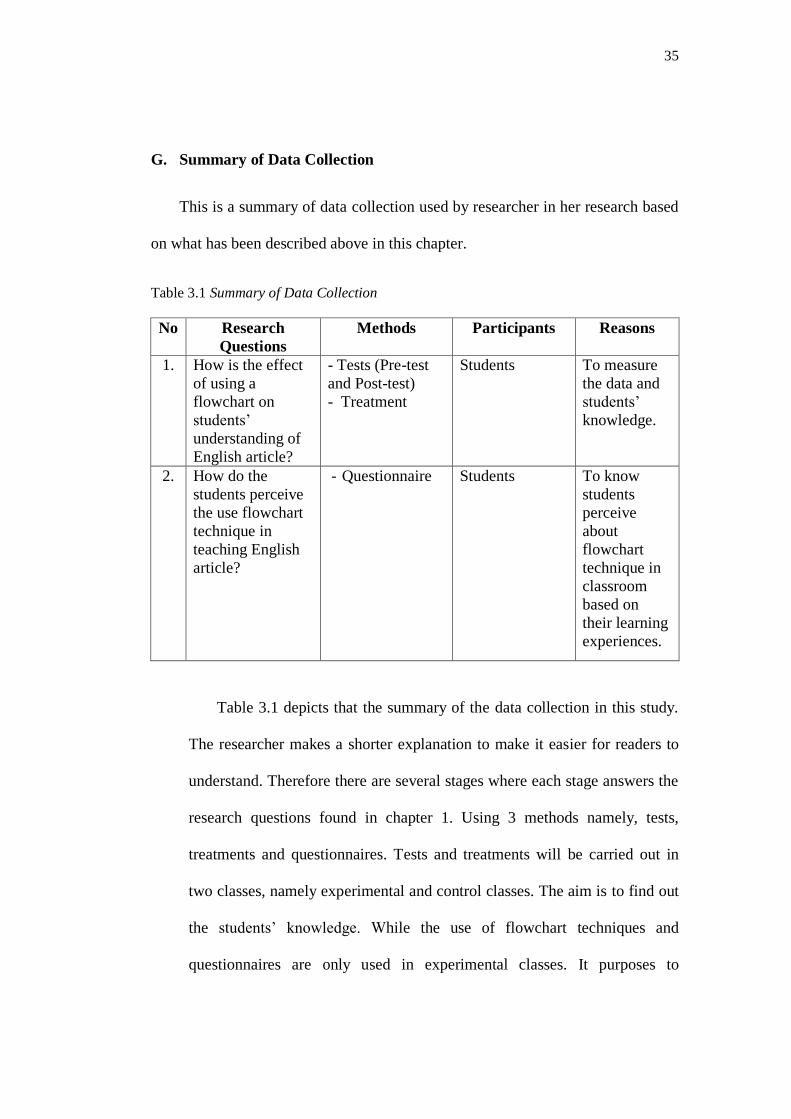
Table 3.1 depicts that the summary of the data collection in this study.
The researcher makes a shorter explanation to make it easier for readers to
understand. Therefore there are several stages where each stage answers the
research questions found in chapter 1. Using 3 methods namely, tests,
treatments and questionnaires. Tests and treatments will be carried out in
two classes, namely experimental and control classes. The aim is to find out
the students‟ knowledge. While the use of flowchart techniques and
questionnaires are only used in experimental classes. It purposes to
36
determine students' responses to flowchart techniques and how far this
technique is effective in learning English articles.

37
CHAPTER IV
FINDING AND DISCUSSION
This chapter discussed the finding of the research related to using flowchart
technique to improving students‟ understanding on indefinite and definite articles
to the students that were done at SMP Negeri 1 Baktiya Barat. The following is
the explanation related to the finding and discussion of the research as well as the
research setting, finding of the result, discussion and examining hypothesis.
A. The Research Setting
Researcher took SMPN 1 Baktiya Barat as a place of research. This school is
under the auspices of the local government. It is located in Matang Kumbang,
Baktiya, Kabupaten Aceh Utara, Aceh. This school was founded in November
1984. The head master is Mansur S.Pd. This school is accredited A with the 2013
Curriculum learning.
The school has a land area of 9000. Also, it has a 4500 electricity source. This
school has 9 study rooms, consists of 3 classes per grade. There has 1 library, 2
canteens and 1 teacher room. Then, the school has a large ceremony field and
volleyball court. The school is also equipped with a school bell that rings
automatically according to its use, usually used during class changes. This school
is not yet equipped with a special computer room, and internet access that is still
intended for teachers only. However, this school has been equipped with a
projector.

38
SMPN 1 Baktiya Barat has 251 students consisting of 67 students of grade
one, 90 students of grade two and 94 students of grade three. The school has 32
teachers, 28 of who are permanent (PNS) and 16 are an attachment (Honor). 3 of
32 teachers are English teachers, 3 of them are permanent.
B. Finding of the Research
1. The Analysis of Test Result
The first step of calculating the data is tabulating the result of both
pre-test and post-test in the two classes (experimental class and control
class) as described in the table below.
a) Experimental Class (VII.C)
Table 4.1 The result of Pre-test and Post-test
No Students' Initial Pre-Test Score Post-Test Score
1 AM 35 90
2 AR 35 90
3 EY 45 90
4 HA 35 95
5 HAZ 40 95
6 KN 40 95
7 LK 40 95
8 MD 35 90
9 MF 35 90
10 MFD 50 85
11 MI 55 100
12 MJ 50 100
13 MK 40 85
14 MR 40 100
15 MRD 35 100
16 MRN 40 90
17 MRY 50 90

39
18 MRZ 40 90
19 MU 45 100
20 MZ 40 95
21 ZB 40 90
22 ZF 40 70
Total 695 2025
The highest score
The lowest score
According to the table presented above, it can be seen that the highest
score for the pre-test was 55 and the lowest one was 35. Meanwhile, the
highest score for post-test was 100 and the lowest one was 70.
Following is the further statistical analysis of each test result, pre-test and
post-test:
1) Pre-test
In order to calculate the mean of pre-test, the following formula is used.
X= 31.59

40
2) Post-test
In order to calculate the mean of post-test, the following formula is used.
X=
X= 92.04
a) Control Class (VII.B)
Table 4.2 The result of Pre-test and Post-test
No Students' Initial Pre-Test Score Post-Test Score
1 AF 5 60
2 AW 15 80
3 CAZ 20 85
4 FH 45 95
5 FJ 10 65
6 HS 20 90
7 IM 45 75
8 JH 20 55
9 MR 45 70
10 MRA 50 95
11 MRF 45 90
12 NF 10 80
13 NL 20 80
14 RA 55 95
15 RH 25 100
16 RM 15 70
17 RS 35 85
18 SP 40 80
19 SUH 20 50
20 SY 10 50
21 ZK 10 50
Total 555.5 1600
41
The highest score
The lowest score
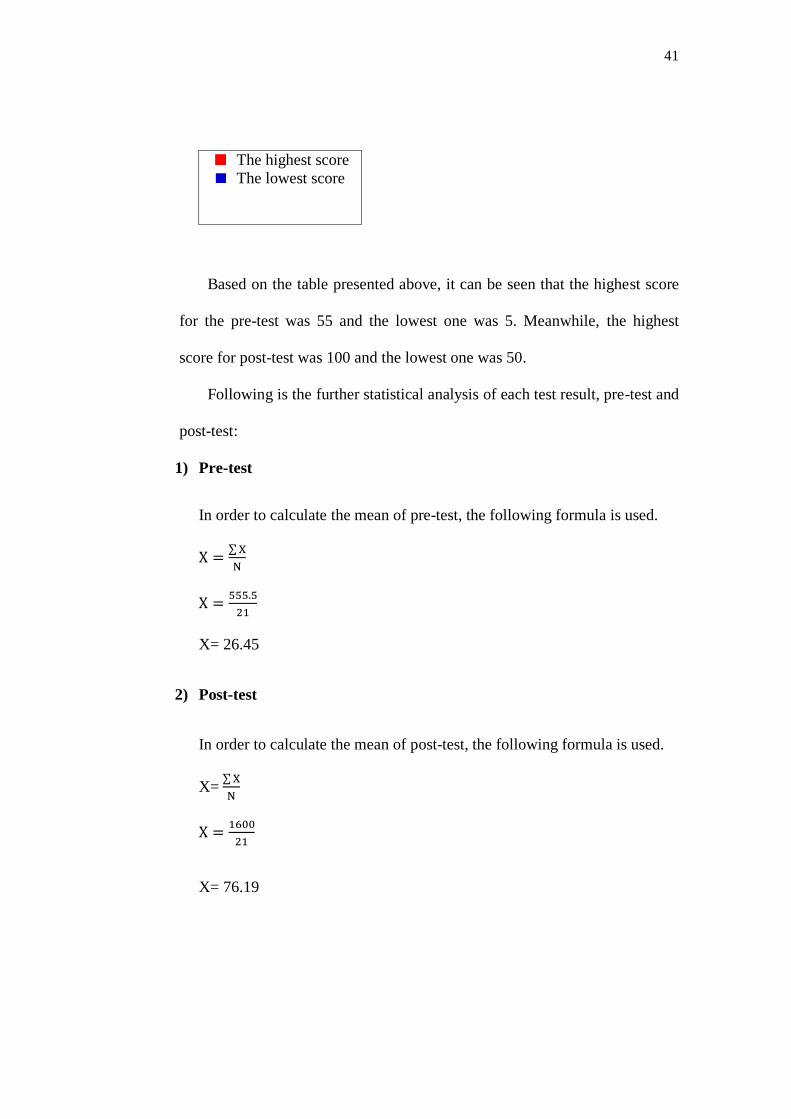
Based on the table presented above, it can be seen that the highest score
for the pre-test was 55 and the lowest one was 5. Meanwhile, the highest
score for post-test was 100 and the lowest one was 50.
Following is the further statistical analysis of each test result, pre-test and
post-test:
1) Pre-test
In order to calculate the mean of pre-test, the following formula is used.
X= 26.45
2) Post-test
In order to calculate the mean of post-test, the following formula is used.
X=
X= 76.19
42
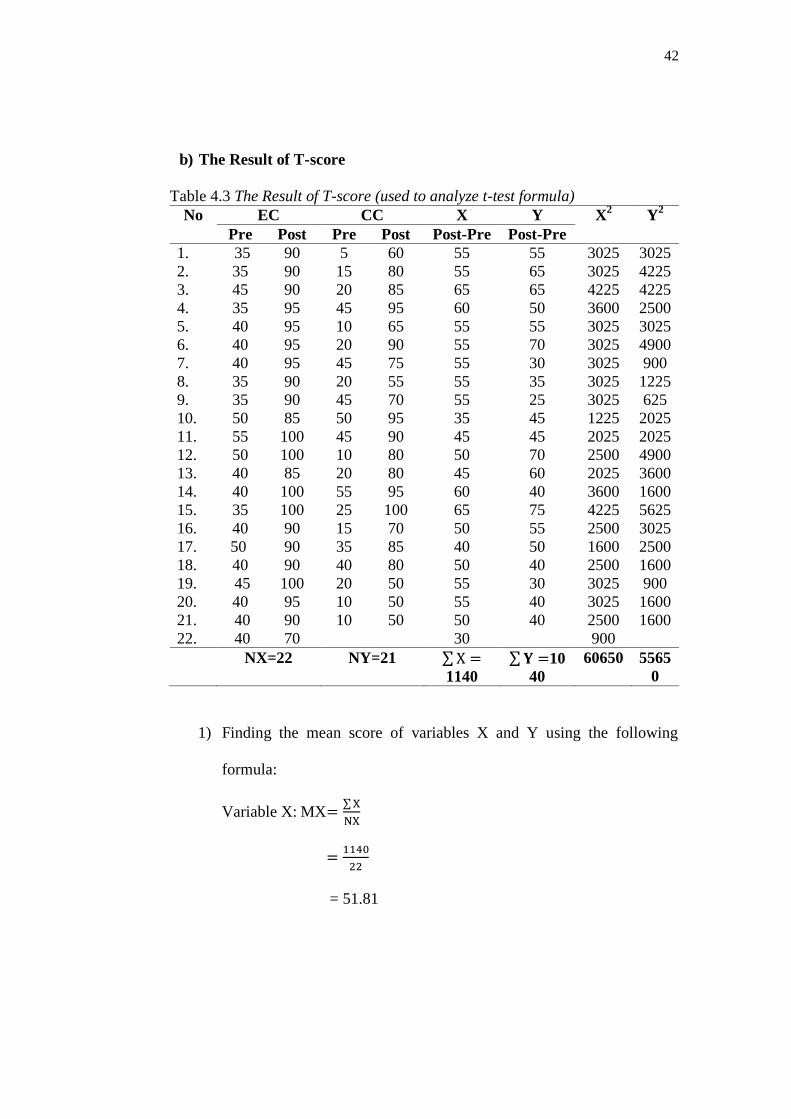
b) The Result of T-score
Table 4.3 The Result of T-score (used to analyze t-test formula)
No EC CC X Y X2
Y2
Pre Post Pre Post Post-Pre Post-Pre
1. 35 90 5 60 55 55 3025 3025
2. 35 90 15 80 55 65 3025 4225
3. 45 90 20 85 65 65 4225 4225
4. 35 95 45 95 60 50 3600 2500
5. 40 95 10 65 55 55 3025 3025
6. 40 95 20 90 55 70 3025 4900
7. 40 95 45 75 55 30 3025 900
8. 35 90 20 55 55 35 3025 1225
9. 35 90 45 70 55 25 3025 625
10. 50 85 50 95 35 45 1225 2025
11. 55 100 45 90 45 45 2025 2025
12. 50 100 10 80 50 70 2500 4900
13. 40 85 20 80 45 60 2025 3600
14. 40 100 55 95 60 40 3600 1600
15. 35 100 25 100 65 75 4225 5625
16. 40 90 15 70 50 55 2500 3025
17. 50 90 35 85 40 50 1600 2500
18. 40 90 40 80 50 40 2500 1600
19. 45 100 20 50 55 30 3025 900
20. 40 95 10 50 55 40 3025 1600
21. 40 90 10 50 50 40 2500 1600
22. 40 70 30 900
NX=22 NY=21
1140
10
40
60650 5565
0
1) Finding the mean score of variables X and Y using the following
formula:
Variable X: MX
= 51.81

43
Variable Y: MY
= 49.52
2) Finding the score of standard deviation difference between the
difference score of two variables, X and Y by using the following
formula:
a) Standard Deviation
Sx = √
= √
= √
= √
= √
= 237.46
SY = √
= √
= √

44
= √
= √
= 221.47
b) Z-Score
Variable X: SDX =
=
=
= 4.58
Variable Y: SDY =
=
=
= 4.47
3) Calculating the standard error of mean difference (SX-Y) between the
variable X and Y.
SX-Y =√
(
)

45
√
(
)
= √
=√
=√
= 0.14
4) Calculating t0 score
The writer used t0 score to find out whether there is a significant difference
between pre-test and post-test. The calculation is as follow:
t0
=
=
= 16.35
5) Calculating degree of freedom
Interpreting the t0 by determining degree of freedom by using following
formula;
Df = (NX + NY) – 2
= (21 + 22) – 2
= 43 – 2
= 41

46
Based on the results of the calculation value of the score t0 and refers to
the ttable value of a significant level of 0.5% (0.05). Tables showes that the
critical score for differentiation score 41 in a level of 5% was 2.019 (see in
appendix IV). After comparing the results of the t-score (t0 = 16.35) and t-
table (t5% = 2.019), we can found if t0 > ttable or 16.35 > 2.019. Because
the results of t0 are higher than ttable, that of conclusion can be made that
Ha (Hypothesis) is accepted and H0 (Hypothesis) is rejected. It can be
concluded, there are differences in the improvement between using
flowchart techniques on indefinite and definite articles and without using
flowchart techniques. Brevity, because there is a significant difference
between the two, it can be said that "using flowchart technique can
improve students' understanding on indefinite and definite articles at first
grade".
2. The Analysis of Questionnaire
The researcher created the questionnaire consists of 15 questions.
The questionnaire was used likert Scale by the form close-ended question
that is by checking an item from a list of suggested responses. The
questionnaire was given by the researcher in the last meeting after using an
experimental teaching at experimental class (VII/C). It was designed by
researcher to know students‟ responses about using flowchart technique
can improve their understanding on indefinite and definite articles.

47
Table 4.4 The Number of Students in classroom
Gender of Students Number of Students Percentage
Male 12 54.54 %
Female 10 45.45 %
Results 22 100 %
Here are the results of questionnaire analysis:
1. Students’ attitude about English.
The means of each agreement that are described in table 4.5 below.
Table 4.5 Types of questions related to students’ attitude about English
Question
No
Students’ Attitude about English Anxiety
Means
1 Students‟ agreement about their interest on
learning English.
3.54
2 Students' opinions about their preferences for
indefinite and definite articles.
3.18
4 Students' opinions about their previous
understanding of definite articles.
2.86
5 Students' opinions about errors in using indefinite
and definite articles that they often do.
2.81
3 Students' opinions about their previous
understanding of indefinite articles.
2.77
Table 4.5 above shows that the mean of students attitude about English
from the student participants in different value. Most of the means are
between 2 and 3. There are 2 types of students‟ attitude about English which
higher more than other are above 3, including students‟ interest on learning
English and the materials. This means that the students really interest on
learning English (Question 1) and most of them also like the material inside,
including about indefinite and definite articles (Question 2) are easy for the
researcher to do the research because they have passion in learning English.
On the other side, their still lacking to understand the material indefinite
(Question 3) and definite (Question 4) also they have do an error when put

48
the indefinite and definite articles in sentences without realize repeatedly
(Question 5). It shows that the students do not master about the material and
their need the solution about it.
Here is the detail of the respondents‟ answer:
Table 4.6 shows the reader of respondents‟ answer in detail below
Table 4.6 Questions to participants related to students attitude about
English
Respondents Q1 Q2 Q3 Q4 Q5
1 4 3 2 2 1
2 3 3 3 4 4
3 4 4 2 2 2
4 4 2 2 3 1
5 4 3 2 2 2
6 4 3 4 3 2
7 4 3 4 3 2
8 4 3 4 3 2
9 4 3 2 4 3
10 3 4 2 2 1
11 4 3 2 2 2
12 4 3 4 3 2
13 3 4 2 3 4
14 3 3 3 3 3
15 4 4 3 4 4
16 3 3 3 3 4
17 3 3 3 3 4
18 3 3 3 3 4
19 4 4 3 4 4
20 3 3 2 2 4
21 3 3 3 3 4
22 3 3 3 2 3
Means 3.54 3.18 2.77 2.86 2.81
Note:
1 = Strongly Disagree; 2 = Disagree; 3 = Agree; 4 = Strongly Agree.
49
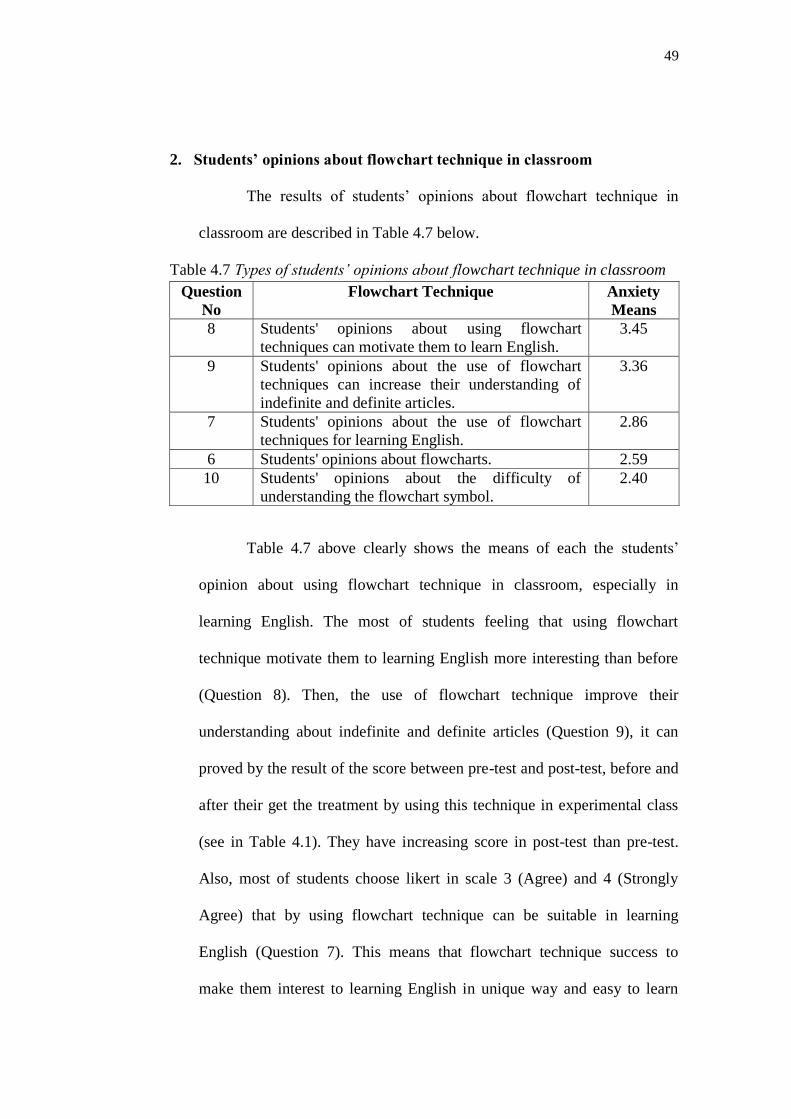
2. Students’ opinions about flowchart technique in classroom
The results of students‟ opinions about flowchart technique in
classroom are described in Table 4.7 below.
Table 4.7 Types of students’ opinions about flowchart technique in classroom
Question
No
Flowchart Technique Anxiety
Means
8 Students' opinions about using flowchart
techniques can motivate them to learn English.
3.45
9 Students' opinions about the use of flowchart
techniques can increase their understanding of
indefinite and definite articles.
3.36
7 Students' opinions about the use of flowchart
techniques for learning English.
2.86
6 Students' opinions about flowcharts. 2.59
10 Students' opinions about the difficulty of
understanding the flowchart symbol.
2.40
Table 4.7 above clearly shows the means of each the students‟
opinion about using flowchart technique in classroom, especially in
learning English. The most of students feeling that using flowchart
technique motivate them to learning English more interesting than before
(Question 8). Then, the use of flowchart technique improve their
understanding about indefinite and definite articles (Question 9), it can
proved by the result of the score between pre-test and post-test, before and
after their get the treatment by using this technique in experimental class
(see in Table 4.1). They have increasing score in post-test than pre-test.
Also, most of students choose likert in scale 3 (Agree) and 4 (Strongly
Agree) that by using flowchart technique can be suitable in learning
English (Question 7). This means that flowchart technique success to
make them interest to learning English in unique way and easy to learn

50
with it. Thus, Flowchart technique is effective for students to improve
their understanding of English articles in the classroom related to students‟
learning experiences.
Here is the detail of the respondents‟ answer:
Table 4.8 shows the reader of respondents‟ answer in detail below
Table 4.8 Questions of students’ opinions about flowchart technique in classroom
Respondents Q6 Q7 Q8 Q9 Q10
1 1 1 3 2 2
2 2 4 4 4 2
3 4 4 4 4 4
4 4 4 4 4 2
5 4 4 4 4 4
6 2 2 3 4 1
7 2 2 3 4 1
8 2 2 3 4 1
9 2 4 3 3 3
10 2 3 4 3 4
11 1 1 3 3 3
12 2 2 3 4 1
13 4 3 4 3 4
14 3 3 4 3 3
15 3 3 3 4 1
16 3 3 3 3 2
17 3 3 4 3 3
18 3 3 3 3 2
19 3 3 4 3 3
20 2 3 3 3 3
21 3 3 4 3 3
22 2 3 3 3 1
Means 2.59 2.86 3.45 3.36 2.4
Note:
1 = Strongly Disagree; 2 = Disagree; 3 = Agree; 4 = Strongly Agree.

51
3. The Advantages of Flowchart Technique in Classroom
Table 4.9 shows the result of students‟ opinions about the advantages of
Flowchart Technique in Classroom below.
Table 4.9 Types of students’ opinions about the advantages of flowchart
technique in classroom
Question
No
The Advantages of Flowchart Technique in
Classroom
Anxiety
Means
14 Students' opinions about the use of flowchart
techniques can be applied continuously in the
learning process, especially on indefinite and
definite articles.
3.59
11 Students' opinions about using flowchart
techniques can help them deduce the contents of
the learning material.
3.22
13 Students' opinions about their ability to master
flowchart techniques are easy to use.
3.22
15 Student opinions about flowchart techniques that
can be used in other subjects.
3.22
12 Students' opinions about learning to use flowchart
techniques are more difficult than not using
techniques.
2.5
Based on table 4.9 above, almost the means (average) in 3, there
are questions 14, 11, 13, and 15, only means 2 in question 12. The table is
clearly explains about the use of flowchart technique can be applied
continuously in classroom, especially on indefinite and definite articles
(Question 14). It supported by the students‟ responses about using
flowchart techniques can help them deduce the contents of the learning
material (Question 11). At the same time, the students want to use this
technique into other subjects too (Question 15) because the technique easy
to use and they are master of it (Questions 13). Also, they think that the
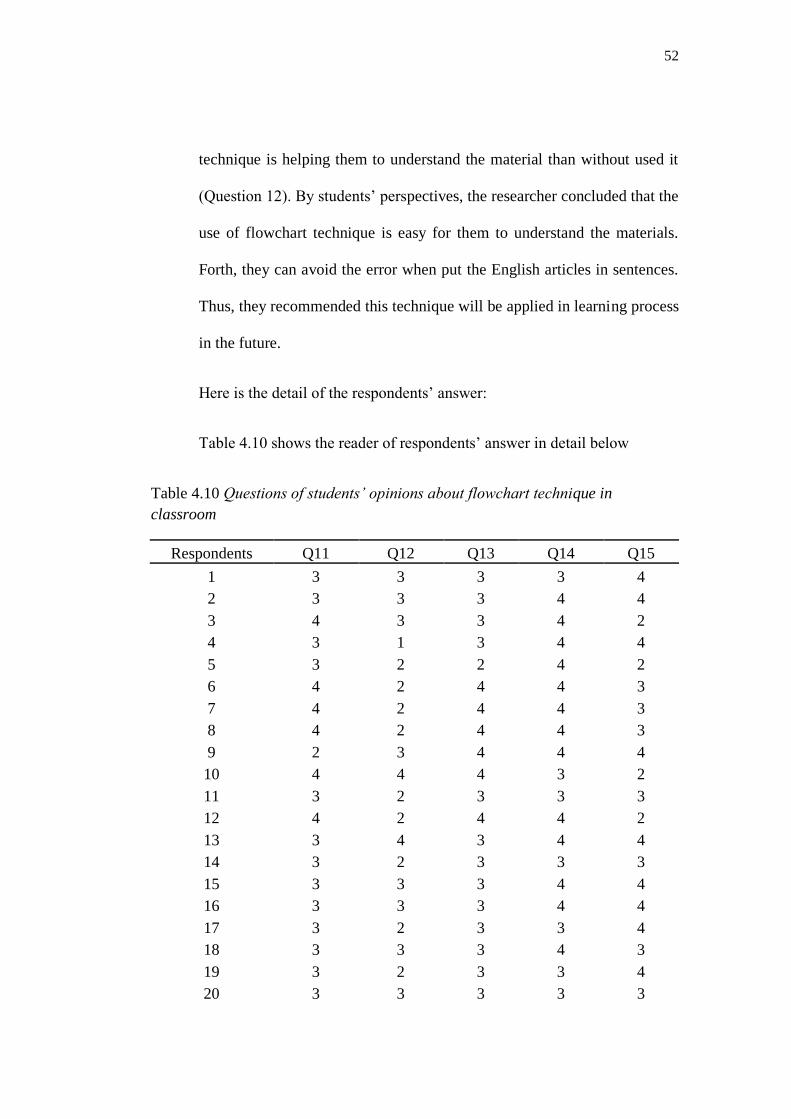
52
technique is helping them to understand the material than without used it
(Question 12). By students‟ perspectives, the researcher concluded that the
use of flowchart technique is easy for them to understand the materials.
Forth, they can avoid the error when put the English articles in sentences.
Thus, they recommended this technique will be applied in learning process
in the future.
Here is the detail of the respondents‟ answer:
Table 4.10 shows the reader of respondents‟ answer in detail below
Table 4.10 Questions of students’ opinions about flowchart technique in
classroom
Respondents Q11 Q12 Q13 Q14 Q15
1 3 3 3 3 4
2 3 3 3 4 4
3 4 3 3 4 2
4 3 1 3 4 4
5 3 2 2 4 2
6 4 2 4 4 3
7 4 2 4 4 3
8 4 2 4 4 3
9 2 3 4 4 4
10 4 4 4 3 2
11 3 2 3 3 3
12 4 2 4 4 2
13 3 4 3 4 4
14 3 2 3 3 3
15 3 3 3 4 4
16 3 3 3 4 4
17 3 2 3 3 4
18 3 3 3 4 3
19 3 2 3 3 4
20 3 3 3 3 3

53
21 3 2 3 3 4
22 3 2 3 3 2
Means 3.22 2.5 3.22 3.59 3.22
Note:
1 = Strongly Disagree; 2 = Disagree; 3 = Agree; 4 = Strongly Agree.
C. Discussion
In this section, the research presented the analysis of the data obtained from
SMPN 1 Baktiya Barat. After analyzing the data provided in the previous section,
the researcher explained and discussed the research findings here.
According to the data during the research, the researcher answered the
research questions. The first research question is How is the effect of using a
flowchart on students’ understanding of English article?. The result in test
showed that the experimental class got means score 31.59 in pre-test and 92.04 in
post-test. Whereas, the control class got means score 26.45 in pre-test and 76.19 in
post-test. As the result, the mean score of post-test in the experimental class is
higher than the control class. So, flowchart technique has the effect to improving
students‟ understanding of English article.
The second research question is How do the students perceive the use
flowchart technique in teaching English article?. From the result of
questionnaires given to the experimental class, students‟ responses are really
excited and recommended that flowchart technique applied in classroom. The
tables 4.9 and 4.10 shows that flowchart technique is the technique which is easy
54
to learn by the students. It helped them to deduce the material and most necessary
to improve their understanding about English articles by using the technique than
without using it.
Based on the results of the findings above. There are similarities and
differences in this study with previous studies from Sholihatun (2016). We have
the same problem as the research title, namely the problem of students in
understanding the correct use of English articles. But the difference is, she is not
looking for solutions to avoid the same mistakes. While in this study, researcher
offers a solution to deal with problems so that they do not occur repeatedly in the
future, namely using flowchart techniques in learning. Thus the results found that
with the flowchart technique can help students better understand the material
being taught and not make the same mistakes as before. So this technique is
highly recommended for use in the learning system in the future.
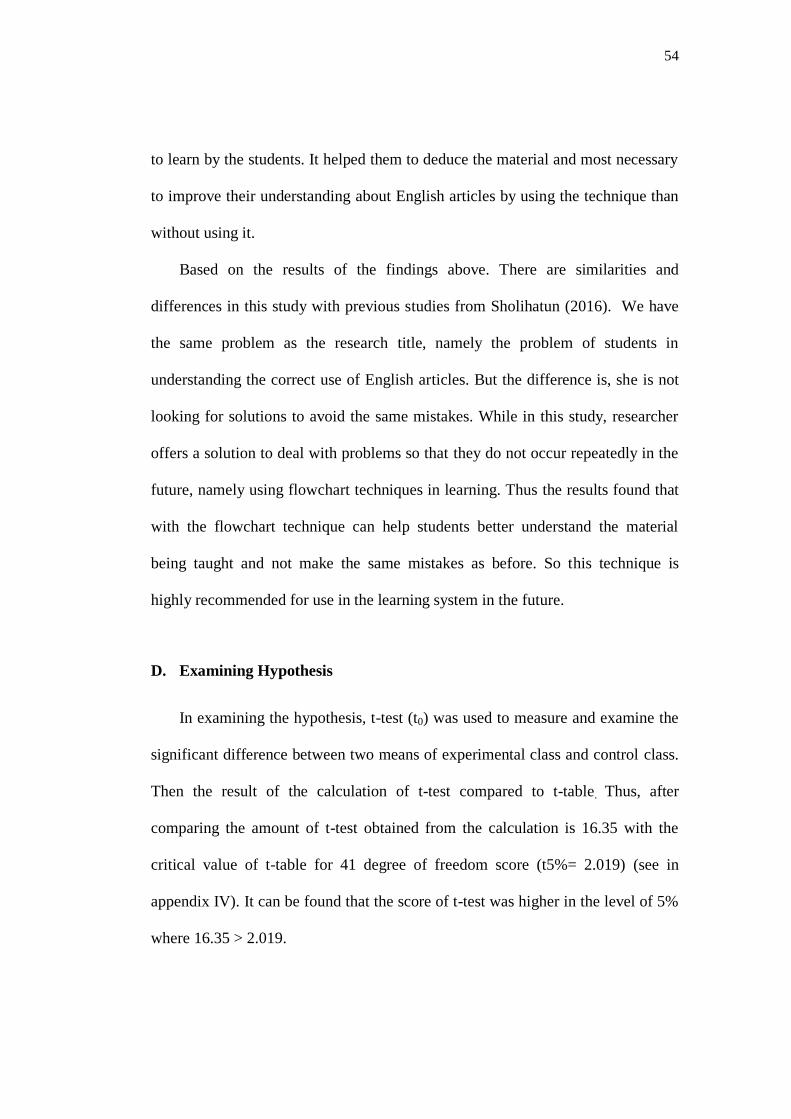
D. Examining Hypothesis
In examining the hypothesis, t-test (t0) was used to measure and examine the
significant difference between two means of experimental class and control class.
Then the result of the calculation of t-test compared to t-table. Thus, after
comparing the amount of t-test obtained from the calculation is 16.35 with the
critical value of t-table for 41 degree of freedom score (t5%= 2.019) (see in
appendix IV). It can be found that the score of t-test was higher in the level of 5%
where 16.35 > 2.019.

55
Related to the value obtained of t-test was higher than t-table, it showed that
there was a significant difference mastery of English article of students taught by
using flowchart technique and not using flowchart technique in the classroom. In
the line, it found that the alternative hypothesis (Ha) was accepted and the zero
hypothesis (H0) was rejected. In conclusion, using flowchart technique has the
effect to improve students‟ understanding of English article.

56
CHAPTER V
CONCLUSION AND SUGGESTION
In this chapter, the researcher would to presented the conclusions and
suggestions that have been found in using flowchart technique to improve
students‟ understanding on indefinite and definite articles.
A. Conclusions
Having conducted the research about using flowchart technique to improve
students‟ understanding on indefinite and definite articles, the researcher would
like to draw some conclusions. Using flowchart technique to improve students‟
understanding on indefinite and definite articles produced meaningful progress to
the students to improve their understanding about the English article. It was
proved by the result of the test is 16.35 > 2.019. Because of the value of t-test is
higher than t-table. It showed that there was a significant difference of mastery the
English article of students taught by using flowchart technique and not using
flowchart technique in the classroom. There is found that the alternative
hypothesis (Ha) was accepted and the zero hypothesis (H0) was rejected.
Teaching English article by using flowchart technique as media in the
classroom is more effective. Based on the result of the questionnaire given to the
students; all of them more interested in studying English through flowchart
technique than not using the technique. It proved from the result of questionnaires

57
given to the experimental class, on tables 4.9 and 4.10 shows that flowchart
technique is the technique which easy to be learned by the students. It helped them
to deduce the material and most important to improve their understanding about
English articles. Most of students agree if the use of flowchart techniques can be
applied continuously in the learning process.
B. Suggestions
After drawing the conclusions, the researcher gave some suggestions.
Although the flowchart technique has never been used in learning English in
general. Based on research that researcher has done. This technique can be applied
in the future learning, which can make students interested in learning English,
help students more easy to deduce the learning material in a short time, make easy
for students to remember the material in a unique way and can improve students‟
competence to be better. Flowchart techniques have the function to a process
study for improvement, where the technique suitable for the teacher to teach
English to students in interesting ways, especially English article.

58
REFERENCES
Adelman, H.S. & Taylor, L. (1998). Involving teachers in collaborative efforts to
better address the barriers to student learning. Preventing School Failure,
42(2), 55-60.
Adhella, T. R. (2007). Kesalahan Penggunaan Artikel A, An, dan The Pada Tugas
dan Hasil Ujian Tengah Semester Mata Kuliah Composition II. Bandung.
Anharku. (2009). Flowchart. Retrieved July 3, 2018, from Komunitas eLearning
IlmuKomputer.Org: http://www.ilmukomputer.com/
Arikunto, S. (2003). Prosedur Penelitian, Suatu Praktek. Jakarta: Bina.
ASQ. (2018). Learn About Quality. Retrieved July 1, 2018, from What is a
Process of Flowchart?:http://asq.org/learn-about-quality/process-analysis-
tools/overview/flowchart.html
Azar, B. S. (1985). Fundamental of English Grammar. Englewood Cliffs, New
Jersey: Prentice Hall Inc.
Azar, B. S., & Hagen, S. (2006). Basic English Grammar Third Edition. 10 Bank
Street, White Plains, NY 10606: Pearson Education.
Catford, J. C. (1965). A Linguistic Theory of Translation: An essay in applied
linguistics.. London: Oxford University Press.
Crystal, D. (2001). Language and the internet. Cambridge: Cambridge University
Press.
Dulay, H., Burt, M., & Krashen, S. (1982). Language two. New York, NY:
Oxford University Press.
Fellows, R. &. (2008). Research Methods for Construction (3rd ed.). Oxford:
Wiley-Blackwell.
Gl¨uck, R., & Kaarsgaard, R. (2018). A Categorical Foundation for Structured
Reversible Flowchart Languages. Electronic Notes in Theoretical
Computer Science 336, 155-171.
Jogiyanto. (2005). Analisis dan Desain Sistem Informasi. Yogyakarta: Penerbit
Andi.

59
Kim, K., & Lakshmanan, U. (2007). Proceedings from the 9th
generativeapproaches to second language acquisition conference
(GALANA 2007): L2 article semantics and second language proceeding.
Somerville, MA: Cascadilla Proceedings Project.
Krismiaji. (2010). Sistem Informasi Akutansi. Yogyakarta: UPP AMP YKPN.
Kuruvila, J. S., etl. (2017). Flowchart Plagiarism Detection System: An Image
Processing. Procedia Computer Science 115, 533-540.
Kusnadi, E. (September 22, 2012). Standar simbol-simbol flowchart dan
penggunaannya. Retrieved January 20, 2019, from Blog Eris:
https://eriskusnadi.com/2012/09/22/standar-simbol-simbol-flowchart-dan-
penggunaannya/
Leech, G. (1982). English Grammar for Today. London: The Macmillan Press.
Lisa, K. (2006). Research for Educator. Melbourne: Thomson Social Sience
Press.
LyCluyse, C. (n.d). Article Flowchart. Westerner College Writing Center.
Master, P. (1990). Teaching the English articles as a binary system. TESOL
Quarterly 24(3), p. 46-478.
McArthur, T. (1992). The Oxford Companion to the English Language. New York
Oxford University Press.
Muchtar, H. (2016). The Implementation of Student Team Achievement Division
(STAD) Technique in Improving Students' Reading Comprehension. Banda
Aceh.
Pahlevy. (2010). Pengertian Flowchart dan Definisi Data.
Quirk, R., & etl. (1986). A Comprehensive Grammar of the English Language.
New York: Longman.
Sholihatun. (2016). An error analysis on the use of English article in descriptive
texts written by the eighth grade students of SMP Nurul Iman Palembang.
Undergraduate thesis. UIN Raden Fatah Palembang.
Sudjana. (2002). Metode Statistika. Bandung: Tarsito.
Sugiyono. (2010). Penelitian Pendidikan Pendekatan Kuantitatif, kualitatif, dan
R&D. Bandung: Alfabeta.

60
Susanto, H. (2006). Meningkatkan kosentrasi peserta didik konsentrasi peserta
didik melalui optimalisasi modalitas belajar peserta didik. Jurnal
Pendidikan Penabur, 5 (2), 46-51.
Talkenglish.com. (2005). Retrieved May 14, 2018, from Indefinite and Definite
Articles: https://www.talkenglish.com/grammar/articles.aspx
techievp. (2018, May 20). AdvantagesNDisadvantages. Retrieved July 2, 2018,
from Advantages and Disadvantages of Flowchart:
http://www.advantagesndisadvantages.com/advantages-and-
disadvantages-of-flowchart.html
Thomson, A. J., & Martinet, A.V. (1986). A Practical English Grammar (4th
Edition). New York: Oxford University Press.
Tonni, G. (2016). Skeletal dysplasia with bowing long bones: Proposed flowchart
for pretal diagnosis with case demonstration . Taiwanese Journal of
Obstetrics & Gynecology, 771-776.
Trask, R. L. (1999). Key Concepts in Language and Linguistics. Routledge:
London.
Yildirim, F. B. (2015). Turkish ELT students‟ acquisition of the definite article:
An analysis of four non-generic uses. Procedia - Social and Behavioral
Sciences 199, 748-755.

RENCANA PELAKSANAAN PEMBELAJARAN
(RPP)
Nama Sekolah : SMPN 1 Baktiya Barat
Mata Pelajaran : Bahasa Inggris
Kelas/Semester : VII/1
Materi : Definite & Indefinite Article
Alokasi Waktu : 8 X 40 JP (4 Pertemuan)
A. Kompetensi Inti (KI)
KI3
Memahami pengetahuan (faktual, konseptual, dan prosedural) berdasarkan
rasa ingin tahunya tentang ilmu pengetahuan, teknologi, seni, budaya
terkait fenomena dan kejadian tampak mata.
KI4
Mencoba, mengolah, dan menyaji dalam ranah konkret (menggunakan,
mengurai, merangkai, memodifikasi, dan membuat) dan ranah abstrak
(menulis, membaca, menghitung, menggambar, dan mengarang) sesuai
dengan yang dipelajari di sekolah dan sumber lain yang sama dalam sudut
pandang/teori.
B. Kompetensi Dasar dan Indikator Pencapaian Kompetensi
Kompetensi Dasar Indikator Pencapaian Kompetensi
3.4 Mengidentifikasi fungsi sosial,
struktur teks, dan unsur
kebahasaan teks interaksi
transaksional lisan dan tulis yang
melibatkan tindakan memberi dan
3.4.1 Menganalisis fungsi sosial yang
terdapat dalam teks
3.4.2 Membedakan struktur teks yang
terdapat dalam teks
3.4.3 Mengindentifikasi unsur

meminta informasi terkait nama
dan jumlah binatang, benda, dan
bangunan publik yang dekat
dengan kehidupan siswa sehari-
hari, sesuai dengan konteks
penggunaannya. (Perhatikan unsur
kebahasaan dan kosa kata terkait
article a dan the, plural dan
singular).
kebahasaan yang terdapat dalam teks
4.4 Menyusun teks interaksi
transaksional lisan dan tulis sangat
pendek dan sederhana yang
melibatkan tindakan memberi dan
meminta informasi terkait nama
dan jumlah binatang, benda, dan
bangunan publik yang dekat
dengan kehidupan siswa sehari-
hari, dengan memperhatikan
fungsi sosial, struktur teks, dan
unsur kebahasaan yang benar dan
sesuai konteks.
4.4.1 Menciptakan teks interaksi
transitional, baik dalam lisan
maupun tulis pendek dan
sederhana.
C. Materi Pembelajaran
Fungsi Sosial
Mengenalkan, serta menjalin hubungan interpersonal dengan teman dan
guru.
Struktur Teks
Dapat mencakup
- Memulai,
- Menanggapi (baik yang direncanakan/tidak) sesuai dengan konteks.

Unsur Kebahasaan
- Nouns : count nouns dan non-count nouns.
- Noun singular dan plural dengan atau tanpa a/n, the, some, dsb.
- Ucapan, tekanan kata, intonasi, ejaan, tanda baca, dan tulisan tangan.
Topik
Memberi dan meminta informasi terkait nama dan jumlah binatang, benda,
dan bangunan publik yang dekat dengan kehidupan siswa sehari-hari,
sesuai dengan konteks penggunaannya.
D. Kegiatan Pembelajaran
a. Pertemuan Pertama (2JPx40m)
Pendahuluan (15 menit)
a) Salam dan tegur sapa, berdoa
b) Apersepsi
1) Guru menyapa peserta didik dengan sapaan “Good
Morning”.
2) Guru melakukan apersepsi terhadap siswa.
3) Guru menyampaikan materi dan tujuan pembelajaran yang
akan berlangsung pada hari ini.
Inti (60 menit)
Kegiatan Belajar
Guru Siswa
1. Membagikan kepada siswa soal pre-test
2. Meminta setiap siswa untuk menjawab pertanyaan-pertanyaan
pre-test yang telah dibagikan
3. Guru meminta siswa untuk mengumpulkan lembar jawaban
1. Siswa menjawab soal pre-test yang
dibagikan secara individu.

siswa yang telah dikerjakan.
Penutup (5 menit)
1) Guru menyampaikan rencana pembelajaran pada pertemuan
berikutnya.
b. Pertemuan Kedua (2JPx40m)
Indikator Pencapaian Kompetensi (IPK):
3.4.1 Menganalisis fungsi sosial yang terdapat dalam teks.
3.4.2 Membedakan struktur teks yang terdapat dalam teks.
Pendahuluan (10 menit)
a) Salam dan tegur sapa, berdoa
b) Apersepsi
1) Guru menyapa peserta didik dengan sapaan “Good
Morning”.
2) Guru melakukan apersepsi terhadap siswa.
3) Guru menyampaikan materi dan tujuan pembelajaran yang
akan berlangsung pada hari ini.
Inti (60 menit)
Kegiatan Belajar
Guru Siswa
1. Guru melemparkan pertanyaan
kepada siswa terkait materi yang akan
1. Siswa menanggapi pertanyaan yang
dilontarkan oleh Guru.
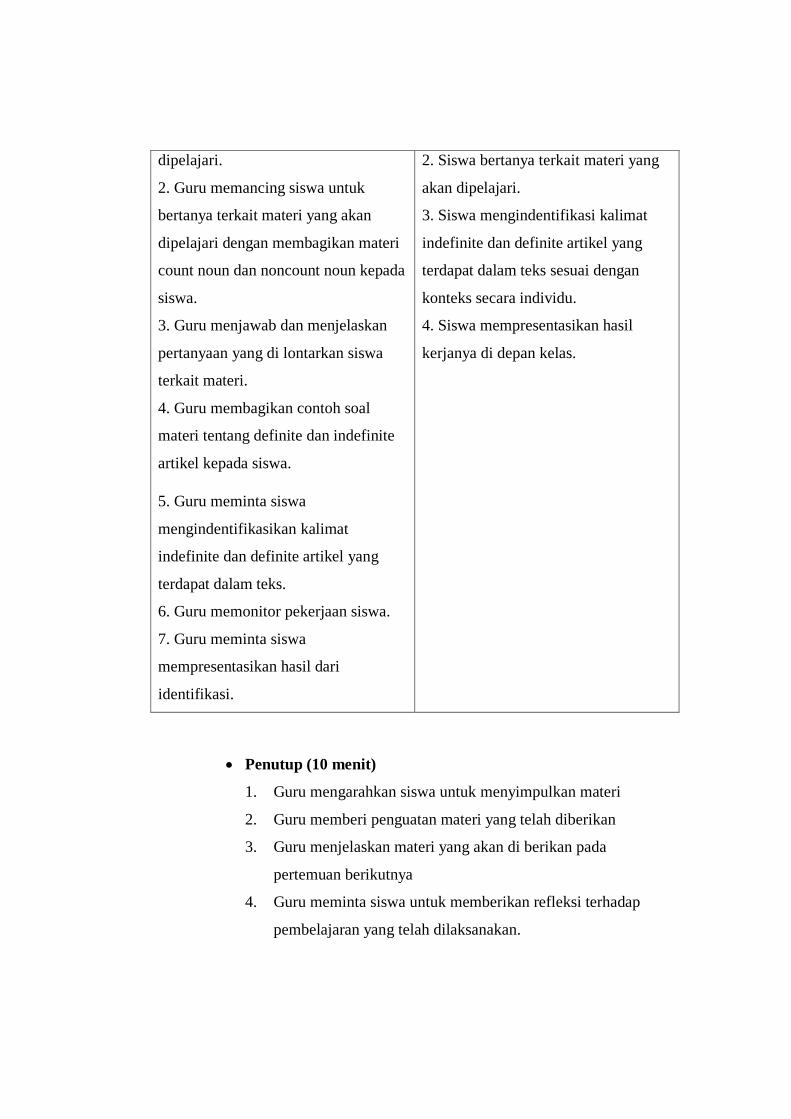
dipelajari.
2. Guru memancing siswa untuk
bertanya terkait materi yang akan
dipelajari dengan membagikan materi
count noun dan noncount noun kepada
siswa.
3. Guru menjawab dan menjelaskan
pertanyaan yang di lontarkan siswa
terkait materi.
4. Guru membagikan contoh soal
materi tentang definite dan indefinite
artikel kepada siswa.
5. Guru meminta siswa
mengindentifikasikan kalimat
indefinite dan definite artikel yang
terdapat dalam teks.
6. Guru memonitor pekerjaan siswa.
7. Guru meminta siswa
mempresentasikan hasil dari
identifikasi.
2. Siswa bertanya terkait materi yang
akan dipelajari.
3. Siswa mengindentifikasi kalimat
indefinite dan definite artikel yang
terdapat dalam teks sesuai dengan
konteks secara individu.
4. Siswa mempresentasikan hasil
kerjanya di depan kelas.
Penutup (10 menit)
1. Guru mengarahkan siswa untuk menyimpulkan materi
2. Guru memberi penguatan materi yang telah diberikan
3. Guru menjelaskan materi yang akan di berikan pada
pertemuan berikutnya
4. Guru meminta siswa untuk memberikan refleksi terhadap
pembelajaran yang telah dilaksanakan.
c. Pertemuan Ketiga (2JPx40m)
Indikator Pencapaian Kompetensi (IPK):
3.4.3 Mengindentifikasi unsur kebahasaan yang terdapat dalam teks
4.4.1 Menciptakan teks interaksi transitional, baik dalam lisan maupun
tulis pendek dan sederhana.
Pendahuluan (10 menit)
a. Salam dan tegur sapa, berdoa
b. Apersepsi
1) Guru menyapa peserta didik dengan sapaan “Good
Morning”.
2) Guru melakukan apersepsi dengan mengajukan pertanyaan
kepada peserta didik tentang materi yang telah diajarkan
sebelumnya dikaitkan dengan materi yang akan dipelajari.
3) Guru menyampaikan tujuan pembelajaran yang akan
berlangsung pada hari ini.
Inti (60 menit)
Kegiatan Belajar
Guru Siswa

1. Guru memberikan media article
flowchart kepada masing-masing
siswa
2. Guru menjelaskan cara penggunaan
media article flowchart kepada siswa
Setelah siswa memahami cara
penggunaan article flowchart, guru
meminta siswa duduk berpasangan
(pair work).
3. Guru membagikan kertas soal
tentang materi yang terkait.
4. Guru meminta siswa untuk
menjawab soal tersebut dengan baik
dan benar seperti yang telah di pelajari
sebelumnya.
5. Guru memonitori pekerjaan siswa.
6. Guru meminta setiap pasangan
mempresentasikan hasil kerja mereka
ke depan.
1. Siswa memperhatiakan penjelasan
dari guru mengenai penggunaan article
flowchart
2. Siswa duduk berpasangan.
3. Siswa dan pasangannya berdiskusi
untuk menjawab kertas soal dengan
benar.
4. Siswa dan pasangannya
mempresentasikan hasil kerjasama
mereka di depan kelas.
Penutup (10 menit)
1) Guru mengarahkan siswa untuk menyimpulkan materi
2) Guru memberi penguatan materi yang telah diberikan
3) Guru menjelaskan materi yang akan di berikan pada
pertemuan berikutnya
4) Guru meminta siswa untuk memberikan refleksi terhadap
pembelajaran yang telah dilaksanakan.
d. Pertemuan Keempat (2JPx40m)
Pendahuluan (15 menit)
c) Salam dan tegur sapa, berdoa
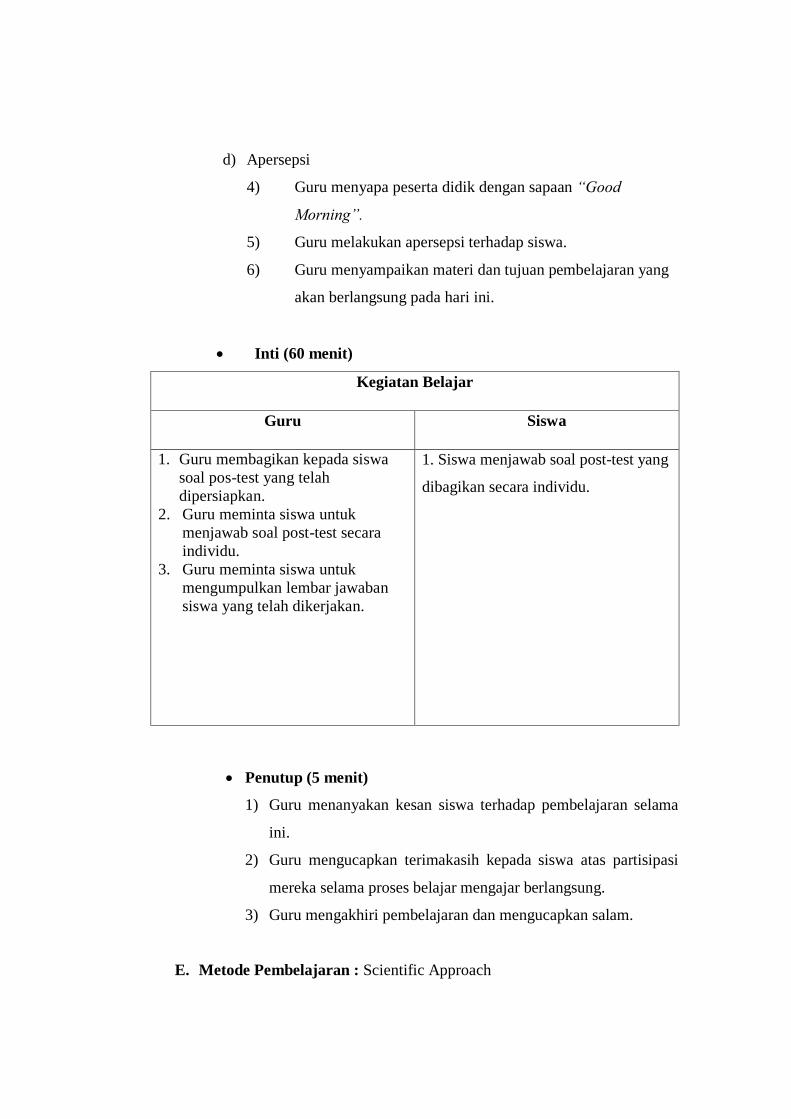
d) Apersepsi
4) Guru menyapa peserta didik dengan sapaan “Good
Morning”.
5) Guru melakukan apersepsi terhadap siswa.
6) Guru menyampaikan materi dan tujuan pembelajaran yang
akan berlangsung pada hari ini.
Inti (60 menit)
Kegiatan Belajar
Guru Siswa
1. Guru membagikan kepada siswa
soal pos-test yang telah
dipersiapkan.
2. Guru meminta siswa untuk
menjawab soal post-test secara
individu.
3. Guru meminta siswa untuk
mengumpulkan lembar jawaban
siswa yang telah dikerjakan.
1. Siswa menjawab soal post-test yang
dibagikan secara individu.
Penutup (5 menit)
1) Guru menanyakan kesan siswa terhadap pembelajaran selama
ini.
2) Guru mengucapkan terimakasih kepada siswa atas partisipasi
mereka selama proses belajar mengajar berlangsung.
3) Guru mengakhiri pembelajaran dan mengucapkan salam.
E. Metode Pembelajaran : Scientific Approach
F. Media/Alat, Bahan dan Sumber Belajar
1. Media/Alat : Article Flowchart, Lembar Kerja Siswa
2. Bahan : Alat tulis
3. Sumber belajar :
- Buku Bahasa Inggris Kelas VII
- Buku Basic English Grammar Third Edition
- Internet
- Sumber lainnya.
G. Materi Pembelajaran : Terlampir
H. Penilaian
1. Teknik penilaian : Tes tulisan
2. Scoring:
a. Pedoman Penilaian
Nilai =
Mengetahui
Lhoksukon, 26 November 2018
Kepala Sekolah Guru Mata Pelajaran
(Mansur, S.Pd) (Sherla Sepsa Rosiva)
NIP 19591231 198403 1 036 NIM 140203118
𝑆𝑘𝑜𝑟 𝑦𝑎𝑛𝑔 𝑑𝑖𝑝𝑒𝑟𝑜𝑙𝑒ℎ
x 100%
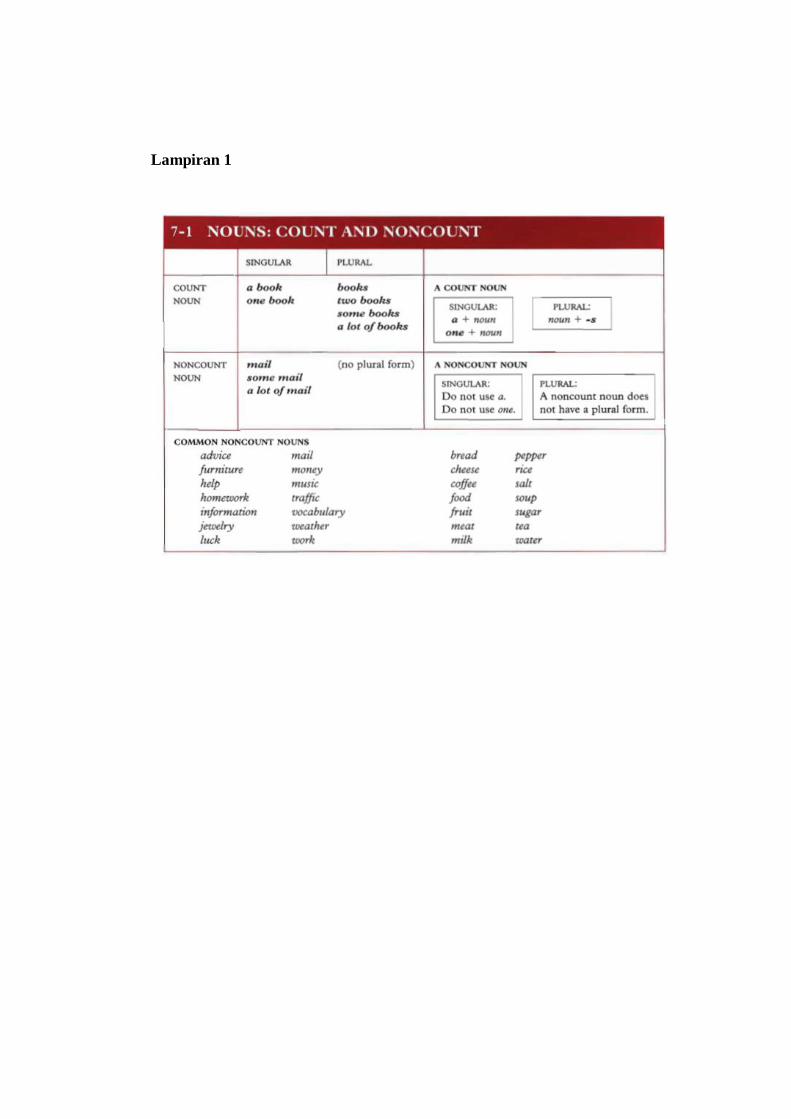
Lampiran 1
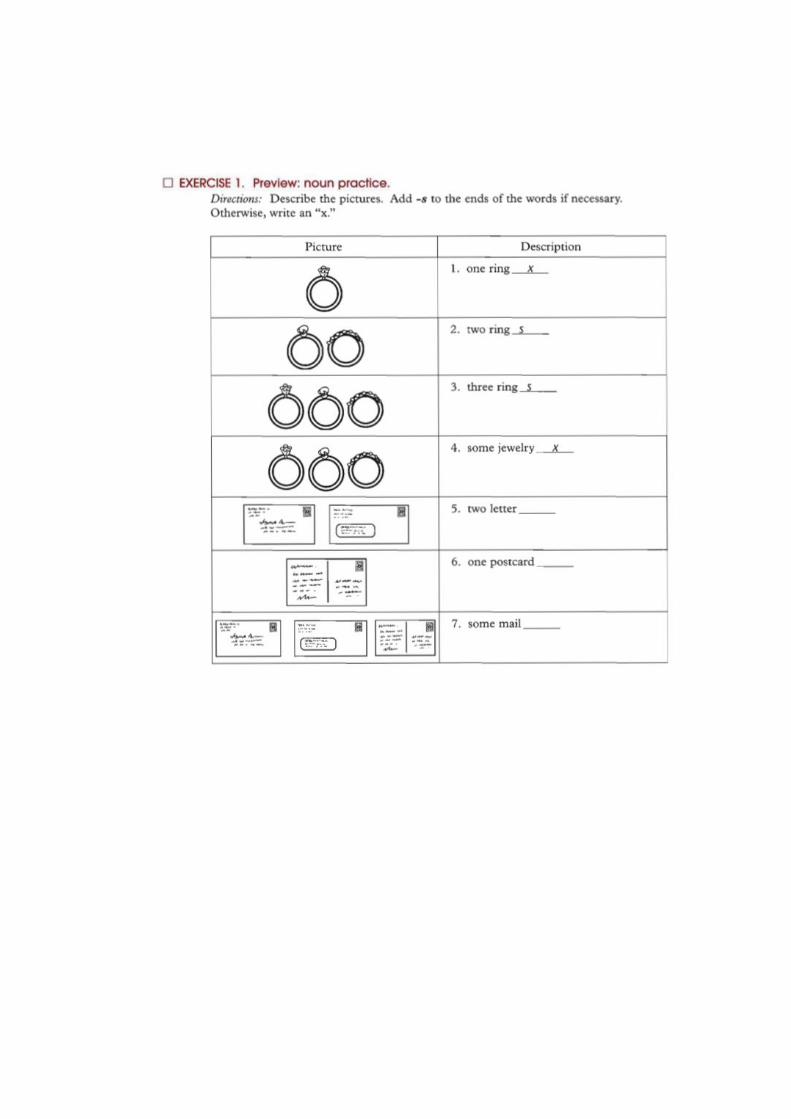

Source: Basic English Grammar Third Ed – Betty S.Azar
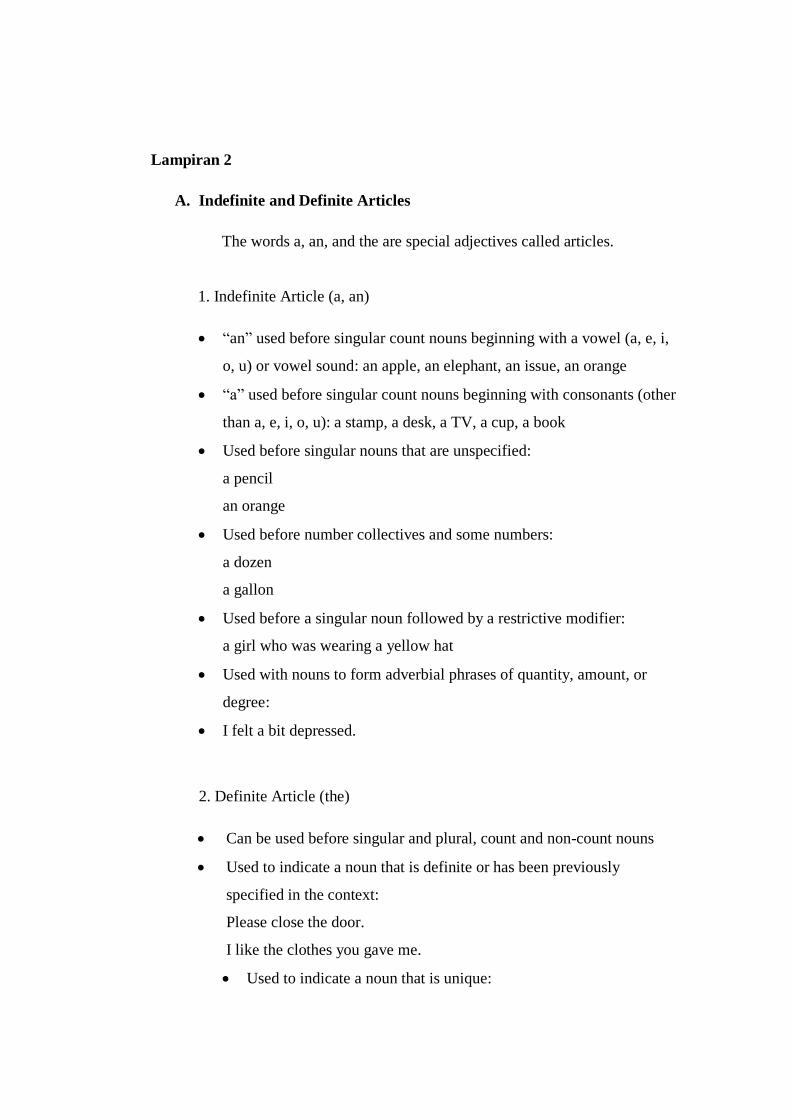
Lampiran 2
A. Indefinite and Definite Articles
The words a, an, and the are special adjectives called articles.
1. Indefinite Article (a, an)
“an” used before singular count nouns beginning with a vowel (a, e, i,
o, u) or vowel sound: an apple, an elephant, an issue, an orange
“a” used before singular count nouns beginning with consonants (other
than a, e, i, o, u): a stamp, a desk, a TV, a cup, a book
Used before singular nouns that are unspecified:
a pencil
an orange
Used before number collectives and some numbers:
a dozen
a gallon
Used before a singular noun followed by a restrictive modifier:
a girl who was wearing a yellow hat
Used with nouns to form adverbial phrases of quantity, amount, or
degree:
I felt a bit depressed.
2. Definite Article (the)
Can be used before singular and plural, count and non-count nouns
Used to indicate a noun that is definite or has been previously
specified in the context:
Please close the door.
I like the clothes you gave me.
Used to indicate a noun that is unique:
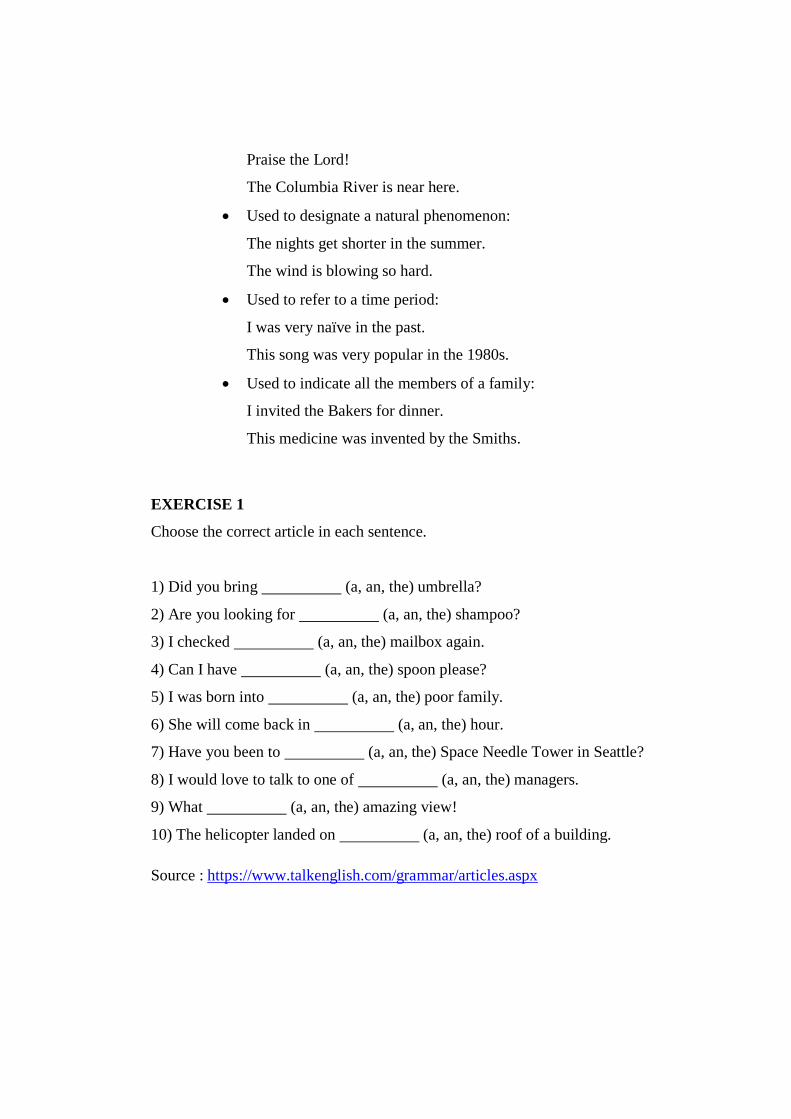
Praise the Lord!
The Columbia River is near here.
Used to designate a natural phenomenon:
The nights get shorter in the summer.
The wind is blowing so hard.
Used to refer to a time period:
I was very naïve in the past.
This song was very popular in the 1980s.
Used to indicate all the members of a family:
I invited the Bakers for dinner.
This medicine was invented by the Smiths.
EXERCISE 1
Choose the correct article in each sentence.
1) Did you bring (a, an, the) umbrella?
2) Are you looking for (a, an, the) shampoo?
3) I checked (a, an, the) mailbox again.
4) Can I have (a, an, the) spoon please?
5) I was born into (a, an, the) poor family.
6) She will come back in (a, an, the) hour.
7) Have you been to (a, an, the) Space Needle Tower in Seattle?
8) I would love to talk to one of (a, an, the) managers.
9) What (a, an, the) amazing view!
10) The helicopter landed on (a, an, the) roof of a building.
Source : https://www.talkenglish.com/grammar/articles.aspx

Lampiran 3
Source: Basic English Grammar Third Ed – Betty S.Azar

Name :
Class :
PRE-TEST
EXERCISE 1. Noun Practice.
Directions: Look at the italicized words. Underline the noun. Is it count or
noncount?
1. He sits on a chair. Count
Noncount
2. He sits on furniture. Count
Noncount
3. She has a coin. Count
Noncount
4. She has some money. Count
Noncount
5. The street is full of traffic. Count
Noncount
6. There are a lot of cars in the street. Count
Noncount
7. I know a fact about bees. Count
Noncount
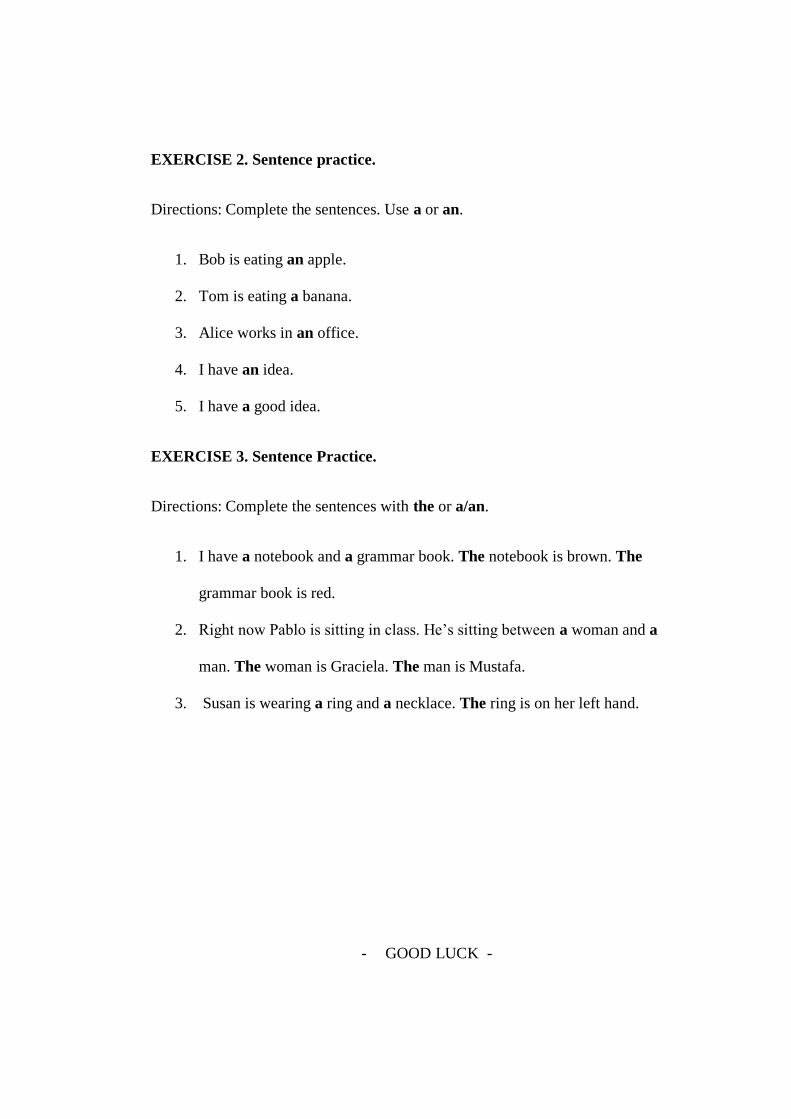
EXERCISE 2. Sentence practice.
Directions: Complete the sentences. Use a or an.
1. Bob is eating an apple.
2. Tom is eating a banana.
3. Alice works in an office.
4. I have an idea.
5. I have a good idea.
EXERCISE 3. Sentence Practice.
Directions: Complete the sentences with the or a/an.
1. I have a notebook and a grammar book. The notebook is brown. The
grammar book is red.
2. Right now Pablo is sitting in class. He‟s sitting between a woman and a
man. The woman is Graciela. The man is Mustafa.
3. Susan is wearing a ring and a necklace. The ring is on her left hand.
- GOOD LUCK -

Name :
Class :
POST-TEST
EXERCISE 1. Sentence practice.
Directions: Complete the sentences. Use the, a/an or some.
1. Sue is taking a class.
2. Sue is taking an easy class.
3. Cuba is an island near the United States.
4. An hour has sixty minutes.
5. A healthy person gets regular exercise.
6. I need some money.
7. I need a dollar.
8. Alice has some mail in her mailbox.
9. Alice has a letter in her mailbox.
10. I‟m hungry. I would like some fruit.
11. Tony and Sara are waiting for their plane to depart. Tony is reading a
magazine. Sara is reading a newspaper. When Sara finishes the newspaper
and Tony finishes the magazine, they will trade.
12. Linda and Anne live in an apartment in an old building. They like the
apartment because it is big. The building is very old. It was built more
than one hundred years ago.
13. We stayed at a hotel in New York. The hotel was expensive.
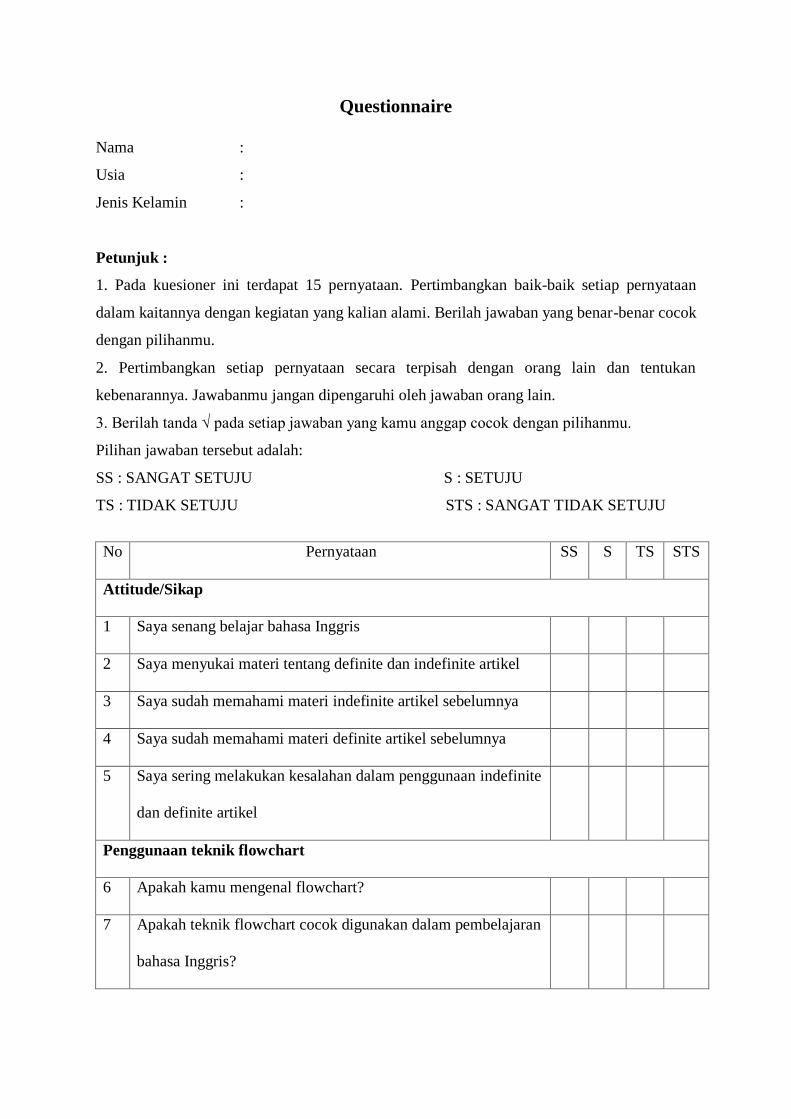
Questionnaire
Nama :
Usia :
Jenis Kelamin :
Petunjuk :
1. Pada kuesioner ini terdapat 15 pernyataan. Pertimbangkan baik-baik setiap pernyataan
dalam kaitannya dengan kegiatan yang kalian alami. Berilah jawaban yang benar-benar cocok
dengan pilihanmu.
2. Pertimbangkan setiap pernyataan secara terpisah dengan orang lain dan tentukan
kebenarannya. Jawabanmu jangan dipengaruhi oleh jawaban orang lain.
3. Berilah tanda √ pada setiap jawaban yang kamu anggap cocok dengan pilihanmu.
Pilihan jawaban tersebut adalah:
SS : SANGAT SETUJU S : SETUJU
TS : TIDAK SETUJU STS : SANGAT TIDAK SETUJU
No Pernyataan SS S TS STS
Attitude/Sikap
1 Saya senang belajar bahasa Inggris
2 Saya menyukai materi tentang definite dan indefinite artikel
3 Saya sudah memahami materi indefinite artikel sebelumnya
4 Saya sudah memahami materi definite artikel sebelumnya
5 Saya sering melakukan kesalahan dalam penggunaan indefinite
dan definite artikel
Penggunaan teknik flowchart
6 Apakah kamu mengenal flowchart?
7 Apakah teknik flowchart cocok digunakan dalam pembelajaran
bahasa Inggris?
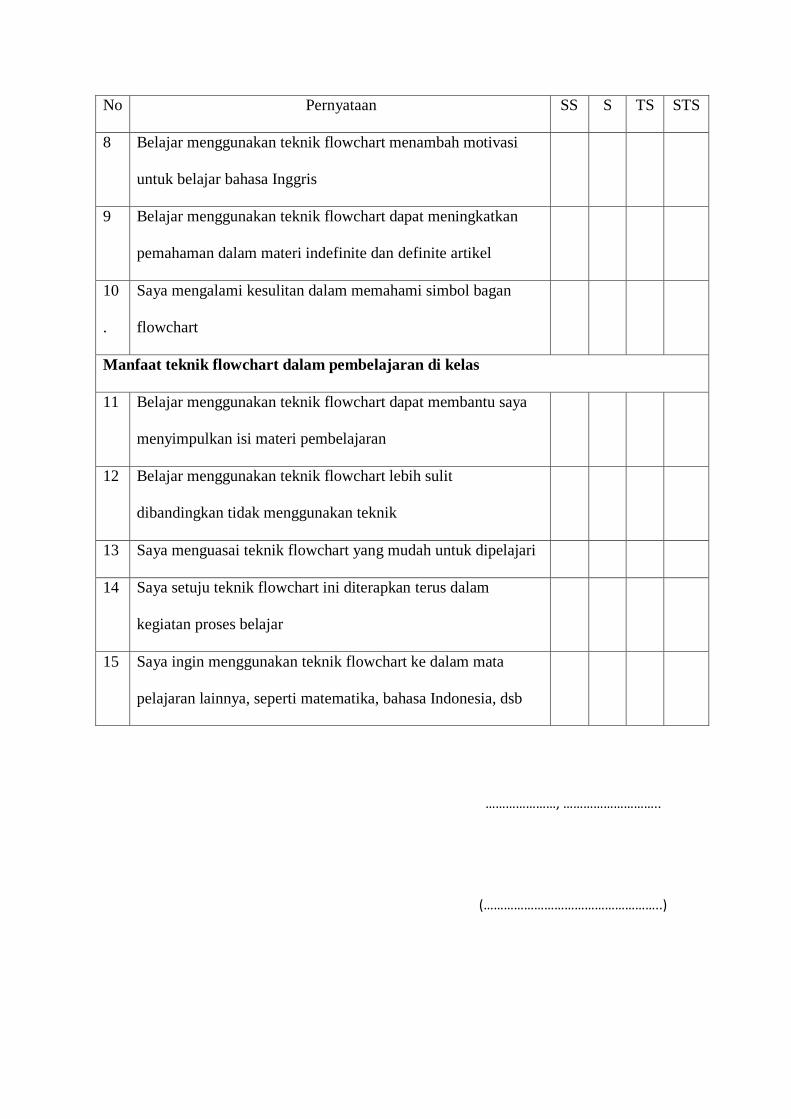
No Pernyataan SS S TS STS
8 Belajar menggunakan teknik flowchart menambah motivasi
untuk belajar bahasa Inggris
9 Belajar menggunakan teknik flowchart dapat meningkatkan
pemahaman dalam materi indefinite dan definite artikel
10
.
Saya mengalami kesulitan dalam memahami simbol bagan
flowchart
Manfaat teknik flowchart dalam pembelajaran di kelas
11 Belajar menggunakan teknik flowchart dapat membantu saya
menyimpulkan isi materi pembelajaran
12 Belajar menggunakan teknik flowchart lebih sulit
dibandingkan tidak menggunakan teknik
13 Saya menguasai teknik flowchart yang mudah untuk dipelajari
14 Saya setuju teknik flowchart ini diterapkan terus dalam
kegiatan proses belajar
15 Saya ingin menggunakan teknik flowchart ke dalam mata
pelajaran lainnya, seperti matematika, bahasa Indonesia, dsb
…………………, ………………………..
(……………………………………………..)

Article Flowchart (Definite & Indefinite Articles)
by Sherla Sepsa Rosiva
YES YES
YES YES
YES
YES YES
NOUNS
COUNT
NOUNS
NON-COUNT
NOUNS
SINGULAR PLURAL
NOUN IS SPESIFIC. USE
“THE”
USE “SOME” USE
“A/AN”
USE “SOME” NOUN IS SPESIFIC. USE
“THE”

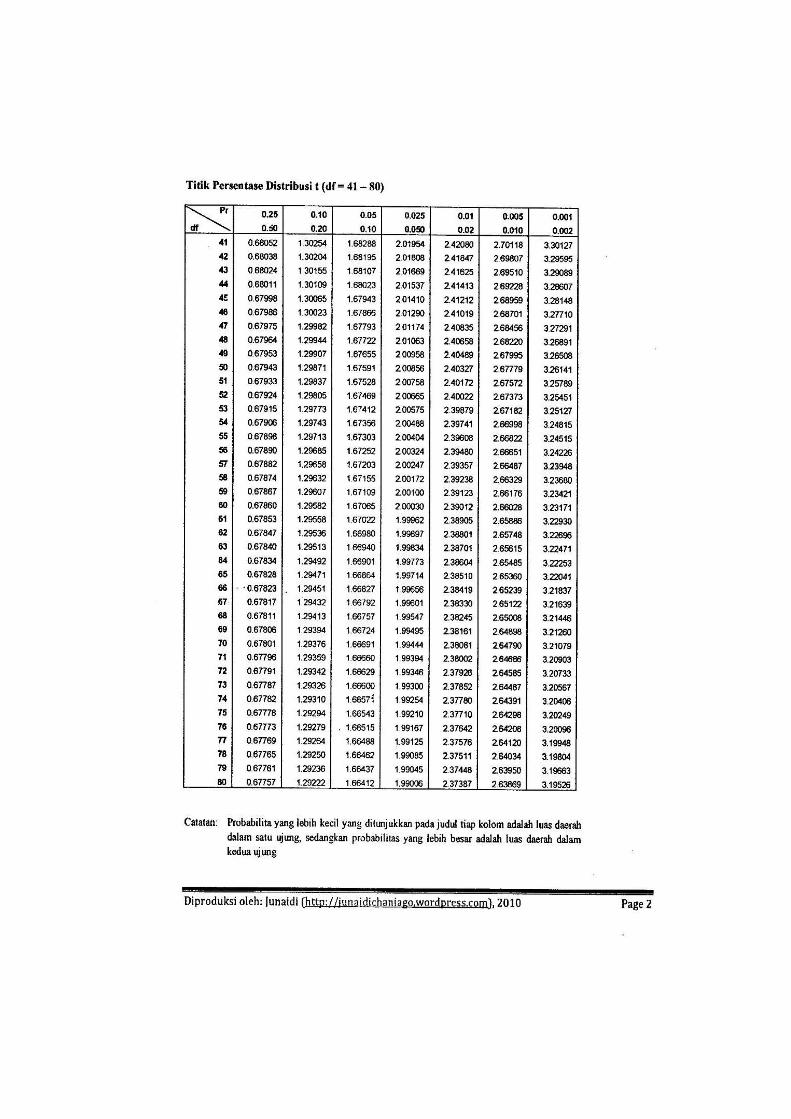


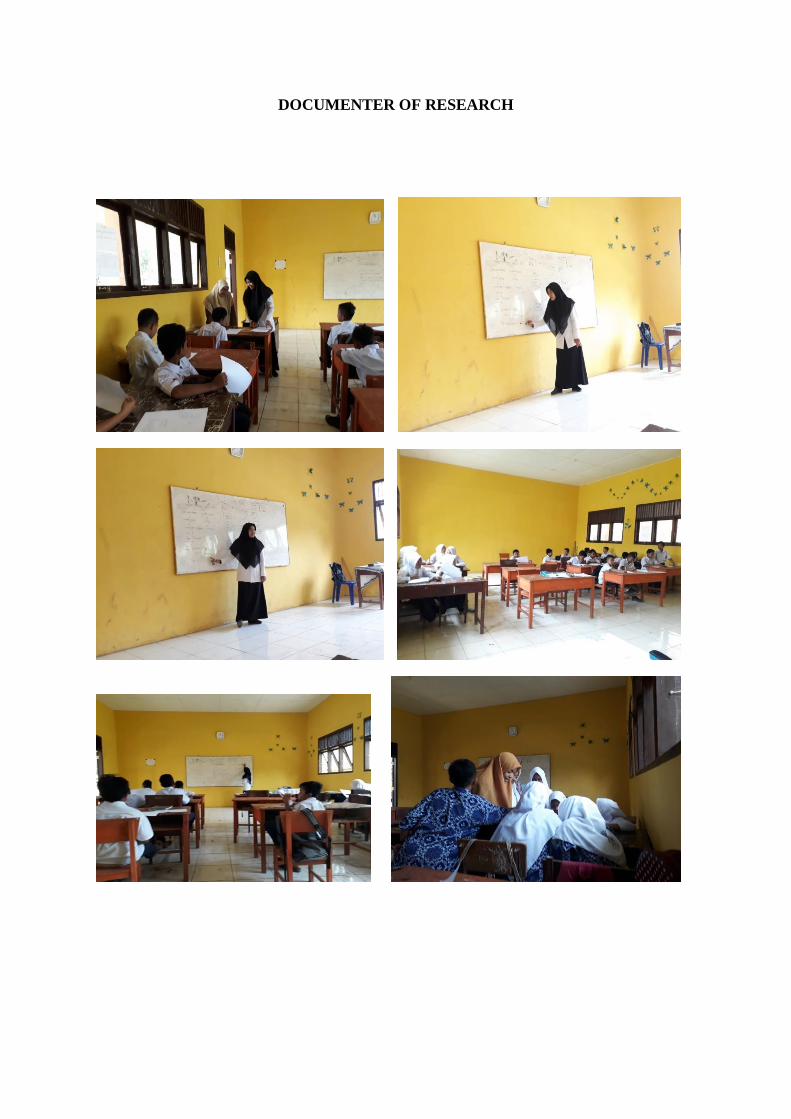
DOCUMENTER OF RESEARCH

AUTOBIOGRAPHY
1. Name : Sherla Sepsa Rosiva
2. Place / Date of Birth : Lhokseumawe / September 7, 1996
3. Religion : Islam
4. Sex : Female
5. Nationality / Ethnic : Indonesia / Javanese
6. Marital Status : Single
7. Occupation : Student
8. Address : Jl. Mesjid, Jeulingke, Banda Aceh
9. E-mail : [email protected]
10. Parents
a. Father : Pujianto
b. Mother : Erlina
c. Occupation : POLRI
d. Address : Desa Ceubrek, Lhoksukon, Aceh Utara
11. Education Background
a. Elementary School : SDN 2 Lhoksukon (2002-2008)
b. Junior High School : SMPN 1 Lhoksukon (2008-2011)
c. Senior High School : SMAN 3 Putra Bangsa Lhoksukon (2011-
2014)
d. University : UIN Ar-Raniry (2014-2019)
Banda Aceh, January 2nd
, 2019
Sherla Sepsa Rosiva