Embed Size (px)
DESCRIPTION
ad-Repository-for-Database-Tuning-Tips-for-Expert-DBAs.ppt
Citation preview


Using Automatic Workload Repository for Database Tuning: Tips for Expert DBAs
Kurt EngeleiterProduct Manager

The following is intended to outline our general product direction. It is intended for information purposes only, and may not be incorporated into any contract. It is not a commitment to deliver any material, code, or functionality, and should not be relied upon in making purchasing decisions.The development, release, and timing of any features or functionality described for Oracle’s products remains at the sole discretion of Oracle.
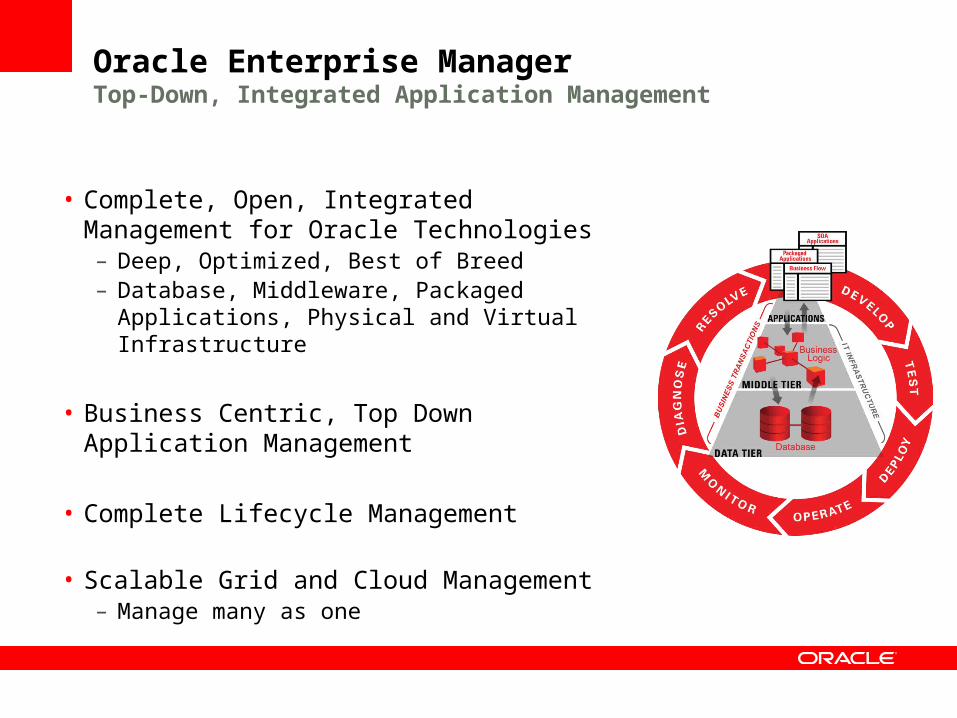
Oracle Enterprise Manager Top-Down, Integrated Application Management
• Complete, Open, Integrated Management for Oracle Technologies– Deep, Optimized, Best of Breed – Database, Middleware, Packaged Applications,
Physical and Virtual Infrastructure
• Business Centric, Top Down Application Management
• Complete Lifecycle Management
• Scalable Grid and Cloud Management– Manage many as one

<Insert Picture Here>
Agenda
• Automatic Workload Repository Infrastructure
• Out of the box AWR reports
• Active Reports
Automatic Workload Repository (AWR )
SGA
In-memorystatistics
AWRStatistics
ASH
SYSAUXMMON
7:00 a.m.8:00 a.m.
9:00 a.m.
AWR Data
Snapshot 1
Snapshot 2
Snapshot 3
Snapshot 4
10:00 a.m.
ADDM finds top problems
BG
BG
…
FG
FG
…
DBA
Eightdays
V$DBA_HIST%
Built-in, automatic
performance statistics data
warehouse

• DB Time– Total time in database calls by foreground sessions– Includes CPU time, IO time and non-idle wait time– DB Time <> response time– Total DB time = sum of DB time for all active sessions
Goal: To Reduce Total DB time
• Active Session– Session currently spending time in a database call, i.e., accruing DB
time
• Average Active Sessions
• Average Active Sessions is a key metric for measuring DB load
Fundamental Concepts
=Wall-Clock (Elapsed) Time
DB Time
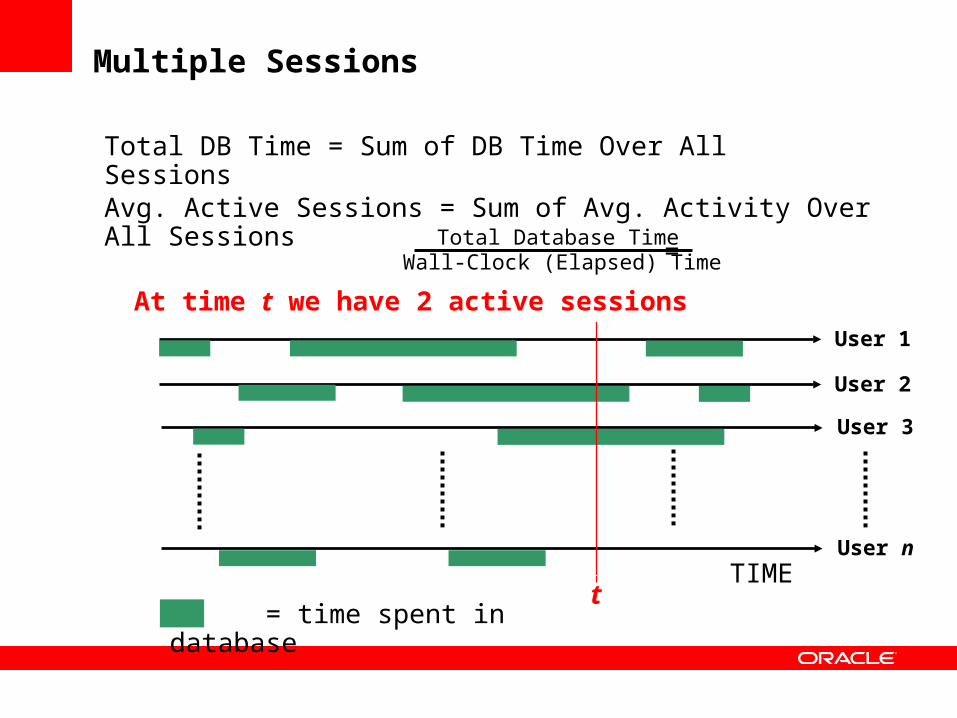
= time spent in database
Multiple Sessions
TIME
User 1
User 2
User 3
User n
Total DB Time = Sum of DB Time Over All Sessions
Avg. Active Sessions = Sum of Avg. Activity Over All Sessions
Wall-Clock (Elapsed) TimeTotal Database Time
=
t
At time t we have 2 active sessions

AWR Data
• Time Model – v$sys_time_model => dba_hist_sys_time_model– DB Time– Automatic Tracking of Operation Times
• Overall parse time (hard, soft, failed,..)• SQL, PLSQL and Java overall execution times
• Wait Model – v$system_event => dba_hist_system_event– Wait Events Categorized Based On Solution Area– More than 900 different wait events. 12 wait classes (Application,
Concurrency..)
• SQL statement statistics – v$sqlstats => dba_hist_sqlstat– Resource Usage: Executions, Physical Reads, Physical Writes– Efficient Top SQL identification using deltas in the kernel
• OS Stats – v$osstat => dba_hist_osstat– CPU + Memory
User I/O
CPU Commit
Application
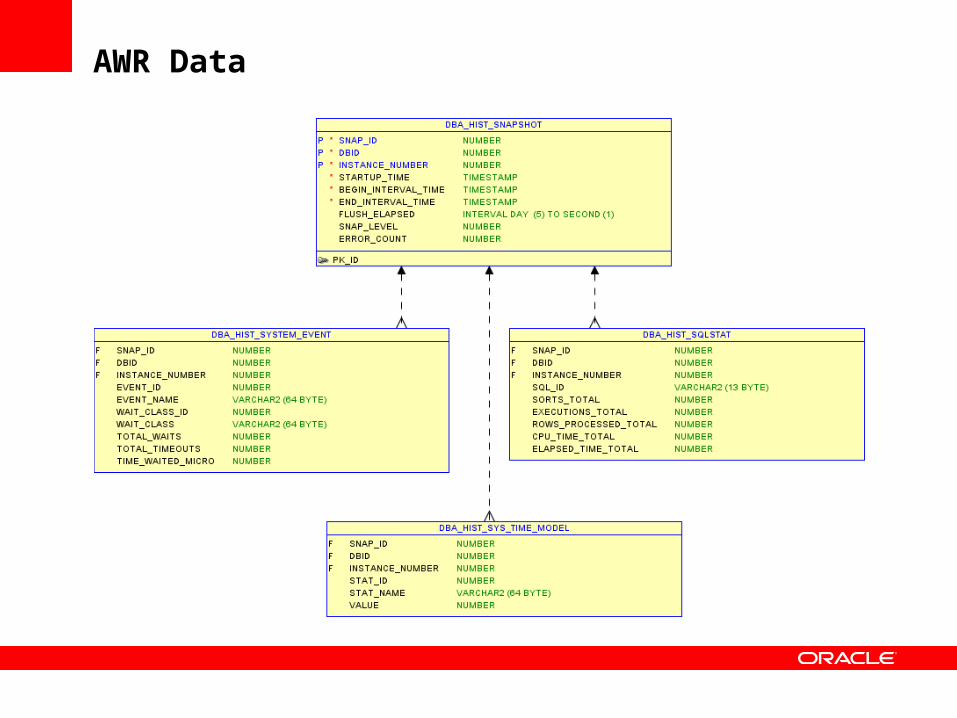
AWR Data
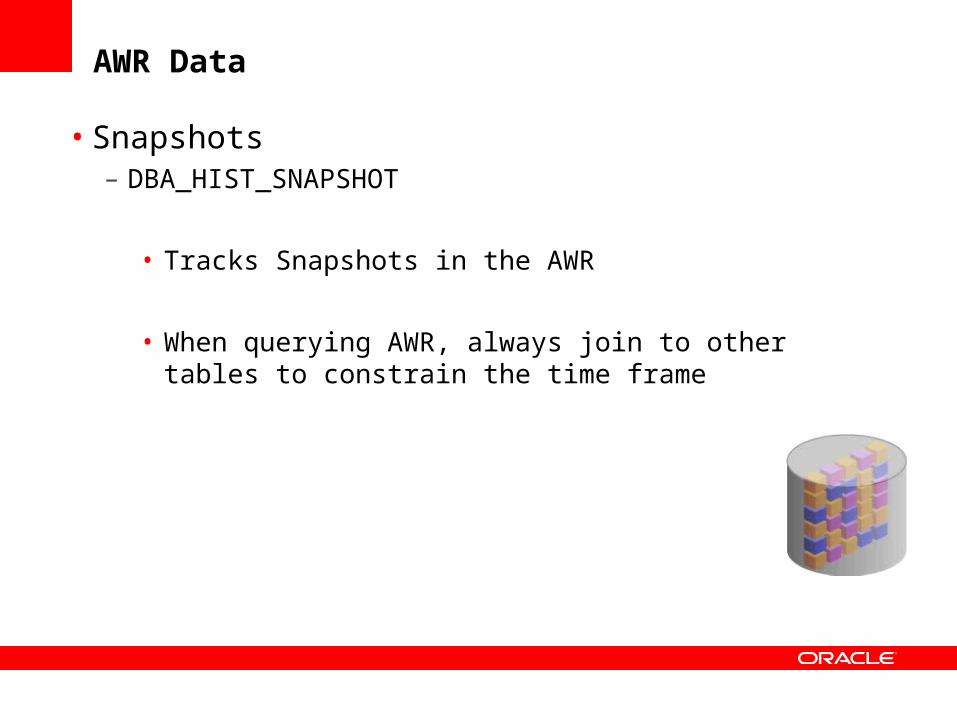
• Snapshots– DBA_HIST_SNAPSHOT
• Tracks Snapshots in the AWR
• When querying AWR, always join to other tables to constrain the time frame
AWR Data
Active Session History (ASH)
• ASH is session level data
• Active sessions are sampled and persisted in-memory– Sampling interval = 1 second– V$ACTIVE_SESSION_HISTORY– Foreground and background sessions are sampled
• On-disk persistence– DBA_HIST_ACTIVE_SESS_HISTORY
• ASH is a system-wide trace of what happened
• ASH is a many-dimensional FACT table– Dimensions are V$SESSION columns– Fact is that DB time was accumulating over these dimensions

DB Time
Query for Tom Kyte
Books
Browse andRead
Reviews
Add item to
cart
Checkout using
‘one-click’
Active Session History (ASH)
WAITING
State
db file sequential readqa324jffritcf2137:38:26
EventSQL IDModuleSIDTime
CPUaferv5desfzs5Get review id2137:42:35
WAITING log file syncabngldf95f4deOne click2137:52:33
WAITING buffer busy waithk32pekfcbdfrAdd to cart2137:50:59
Book by author

ASH
Circular buffer in SGA
V$SESSION
V$SESSION_WAIT
V$ACTIVE_SESSION_HISTORY DBA_HIST_ACTIVE_SESS_HISTORY
Session
State
Objects
AWR
Every snapshot
or out of space
MMON Lite (MMNL)

AWR and ASH in Enterprise Manager

Top Activity
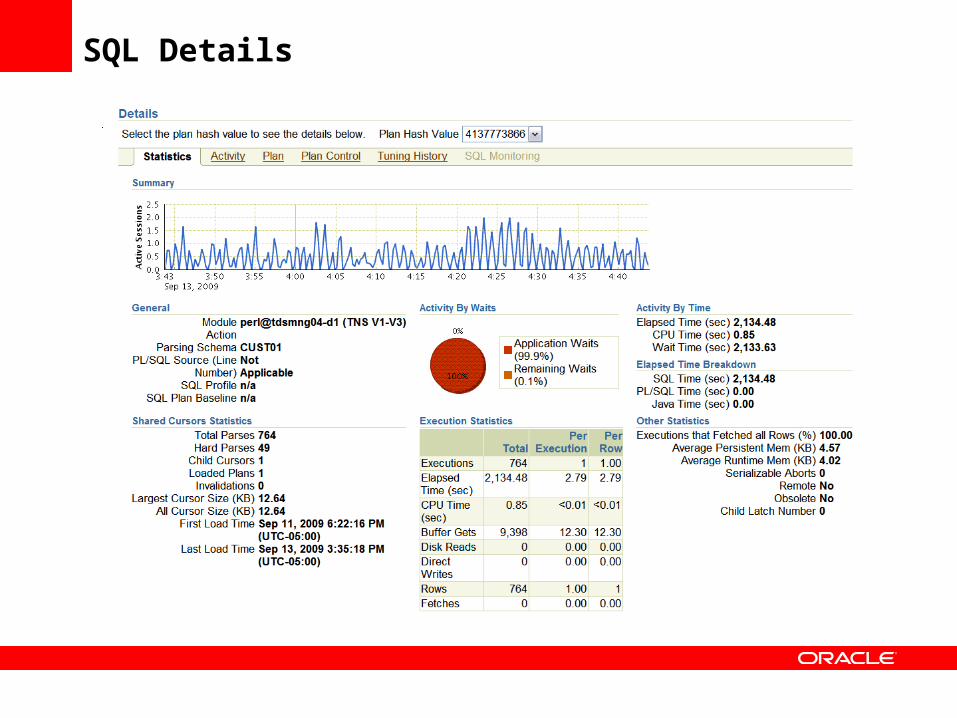
SQL Details

Active Session Widget
Demo

<Insert Picture Here>
Agenda
• Automatic Workload Repository Infrastructure
• Out of the box AWR reports
• Active Reports
AWR Reporting Resources
• Enterprise Manager is the preferred way to view and analyze AWR and ASH data
• In addition, predefined AWR html reports are provided in each Oracle database release
• Each report has a specific function and use case
• The following slides show the major reports and their use cases
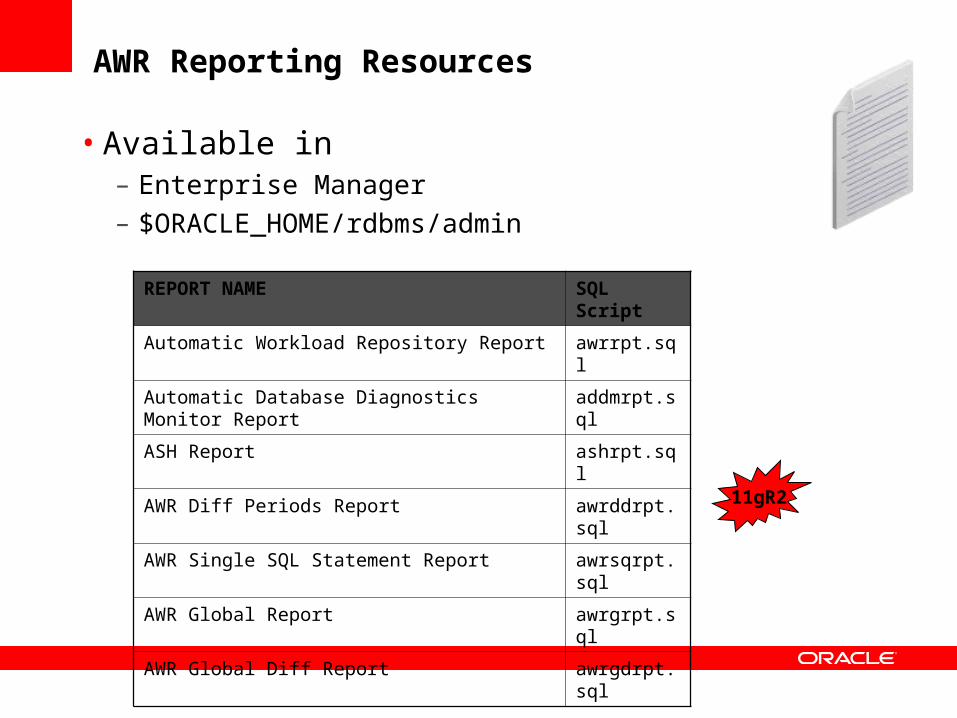
AWR Reporting Resources
• Available in – Enterprise Manager – $ORACLE_HOME/rdbms/admin
REPORT NAME SQL Script
Automatic Workload Repository Report awrrpt.sql
Automatic Database Diagnostics Monitor Report addmrpt.sql
ASH Report ashrpt.sql
AWR Diff Periods Report awrddrpt.sql
AWR Single SQL Statement Report awrsqrpt.sql
AWR Global Report awrgrpt.sql
AWR Global Diff Report awrgdrpt.sql 11gR2

How do I read an AWR report?

AWR Report
• The AWR report is the most well known performance report.
• Oracle tuning professionals frequently start their analysis with this report.
• AWR report contains much data – but contains no concrete recommendations for action.

Tip: Check ADDM Report When Viewing AWR Report
• When viewing AWR report, always check corresponding ADDM report for actionable recommendations• ADDM is a self diagnostic engine designed from
the experience of Oracle’s best tuning experts• Analyzes AWR data automatically after an AWR
snapshot• Makes specific performance recommendations• Consistent – never has a ‘bad’ day• ADDM also tells you what is NOT a problem
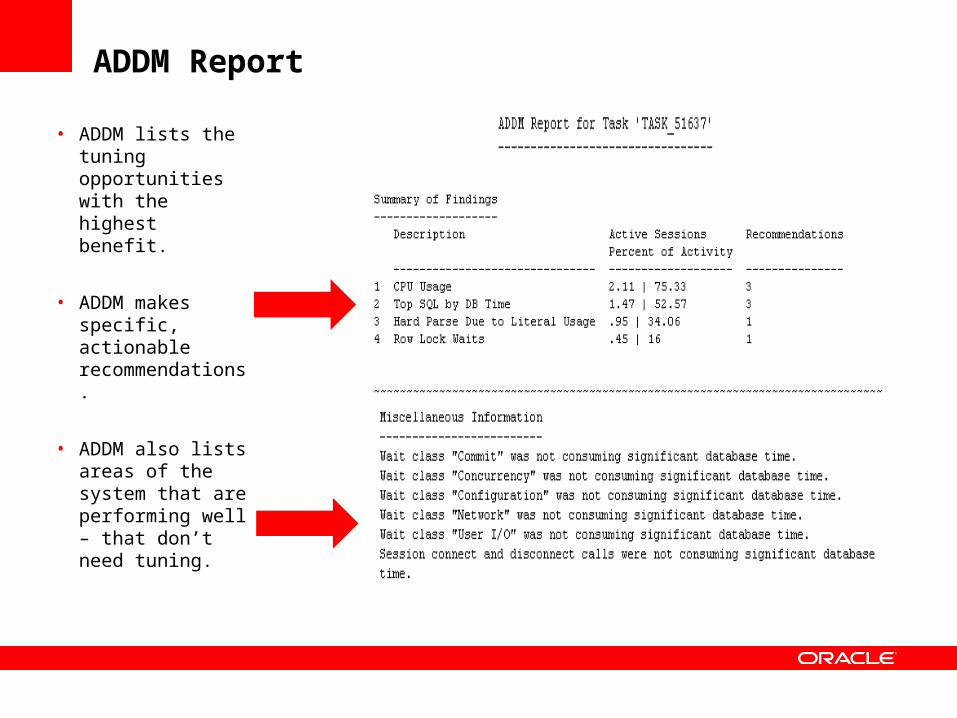
ADDM Report
• ADDM lists the tuning opportunities with the highest benefit.
• ADDM makes specific, actionable recommendations.
• ADDM also lists areas of the system that are performing well – that don’t need tuning.
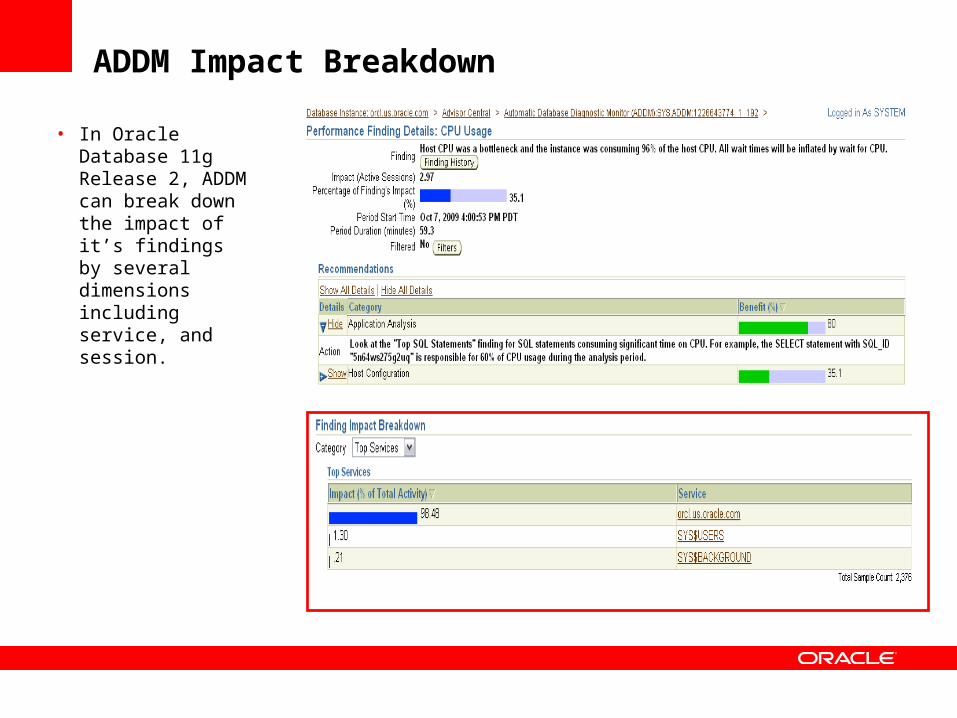
ADDM Impact Breakdown
• In Oracle Database 11g Release 2, ADDM can break down the impact of it’s findings by several dimensions including service, and session.

ADDM
Demo
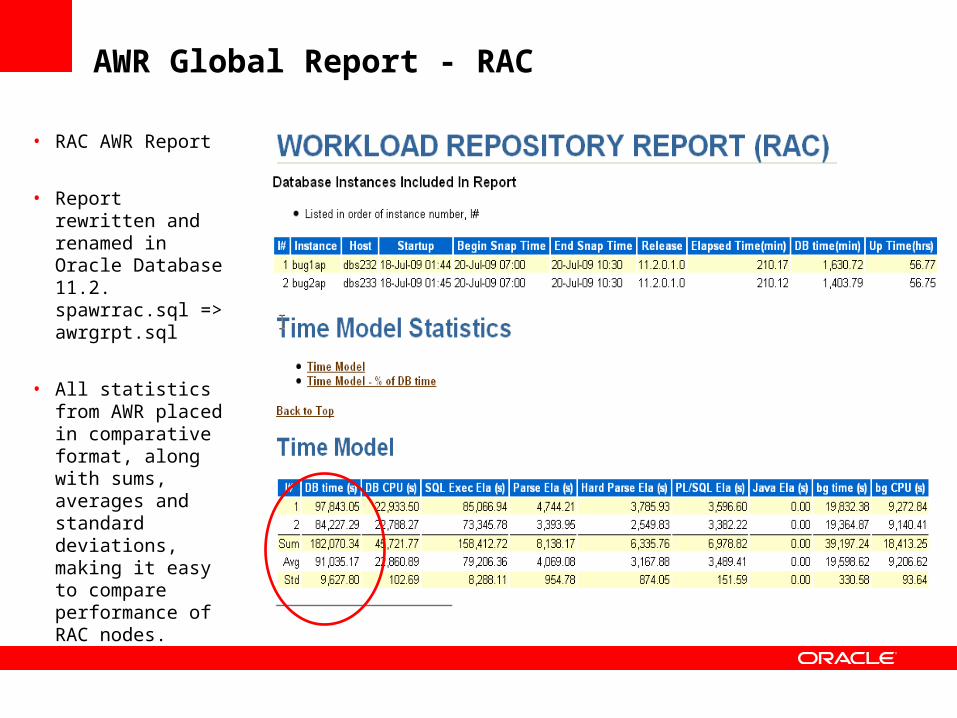
AWR Global Report - RAC
• RAC AWR Report
• Report rewritten and renamed in Oracle Database 11.2. spawrrac.sql => awrgrpt.sql
• All statistics from AWR placed in comparative format, along with sums, averages and standard deviations, making it easy to compare performance of RAC nodes.
AWR Global Report – RAC (cont.)
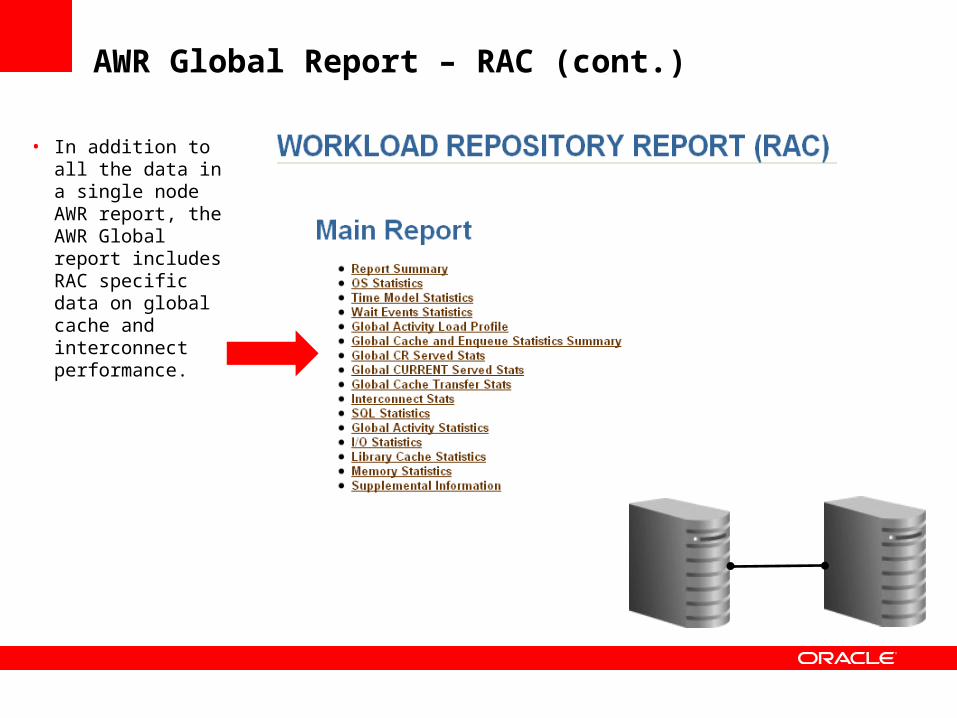
• In addition to all the data in a single node AWR report, the AWR Global report includes RAC specific data on global cache and interconnect performance.

My database was running fine yesterday but it is really slow today?
What has changed?
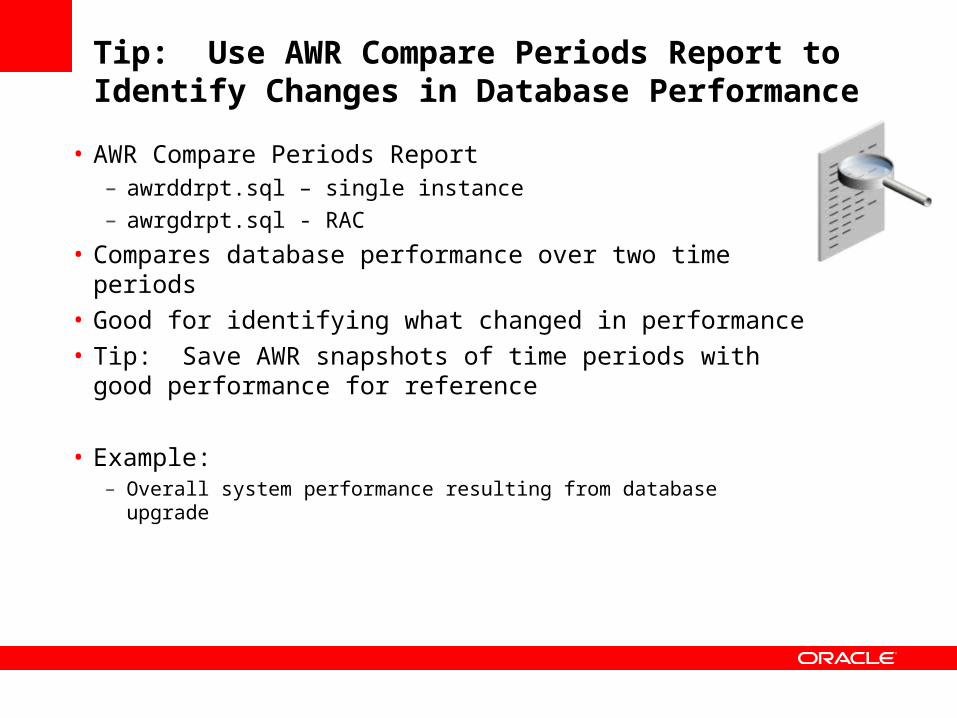
Tip: Use AWR Compare Periods Report to Identify Changes in Database Performance
• AWR Compare Periods Report– awrddrpt.sql – single instance– awrgdrpt.sql - RAC
• Compares database performance over two time periods• Good for identifying what changed in performance • Tip: Save AWR snapshots of time periods with good
performance for reference
• Example: – Overall system performance resulting from database upgrade
AWR Global Compare Periods Report
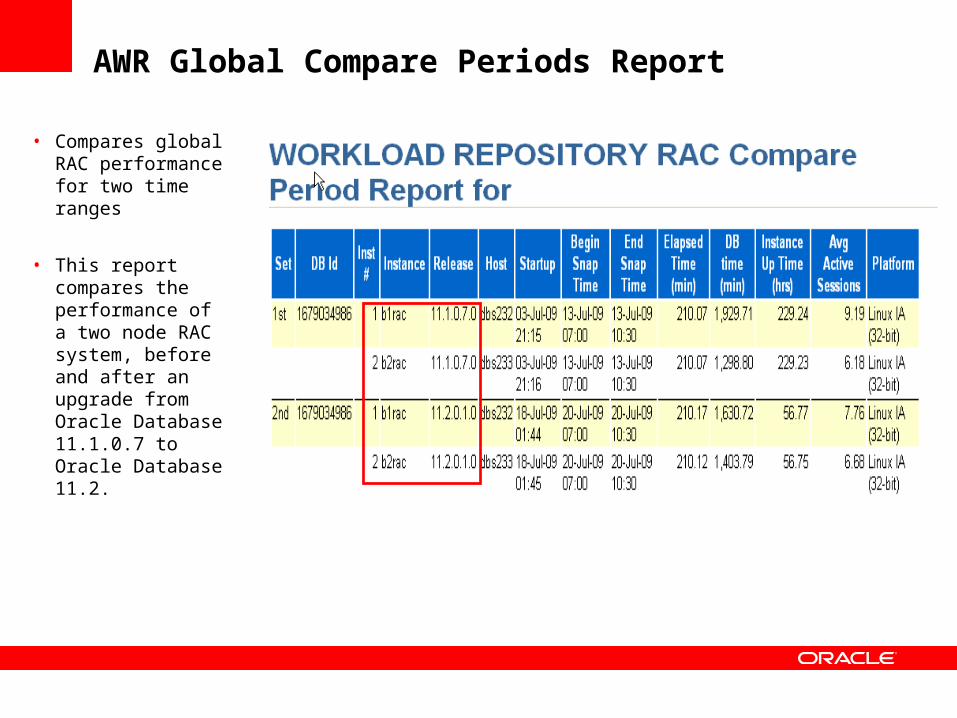
• Compares global RAC performance for two time ranges
• This report compares the performance of a two node RAC system, before and after an upgrade from Oracle Database 11.1.0.7 to Oracle Database 11.2.
AWR Global Compare Periods Report (cont.)
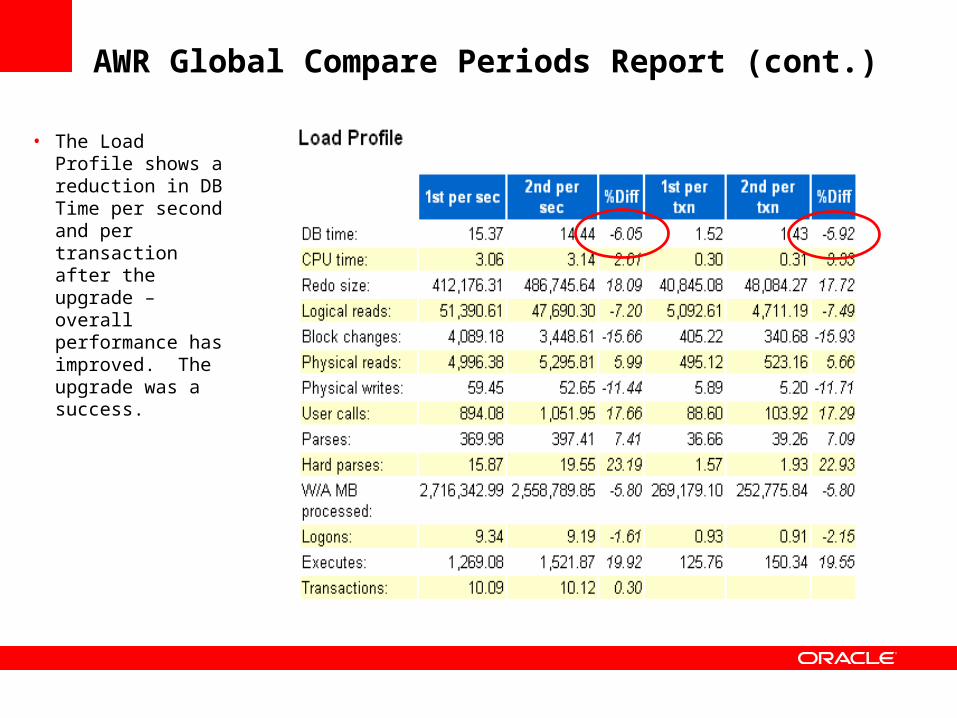
• The Load Profile shows a reduction in DB Time per second and per transaction after the upgrade – overall performance has improved. The upgrade was a success.
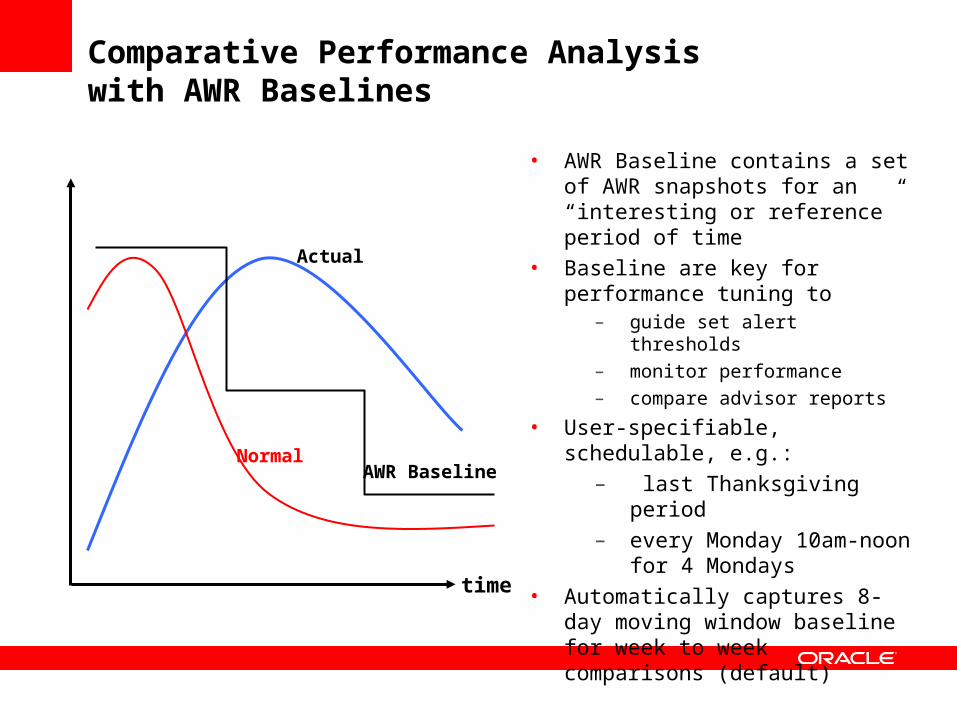
Comparative Performance Analysiswith AWR Baselines
• AWR Baseline contains a set of AWR snapshots for an “interesting or reference” period of time
• Baseline are key for performance tuning to
– guide set alert thresholds– monitor performance– compare advisor reports
• User-specifiable, schedulable, e.g.:– last Thanksgiving period– every Monday 10am-noon for
4 Mondays• Automatically captures 8-day moving
window baseline for week to week comparisons (default)
time
Actual
AWR Baseline Normal

A user complains that his session seemed to hang for a few minutes.
What happened?

Tip: Use ASH for Targeted Performance Diagnostics
• AWR snapshots and reports cover entire system
• Transient events can be averaged over a snapshot and be non-obvious from an AWR report
• ASH can be used for examining:– Targeted time range– A specific
• session• service• wait_class• client_id• SQL_ID
– A targeted time range in combination with the above
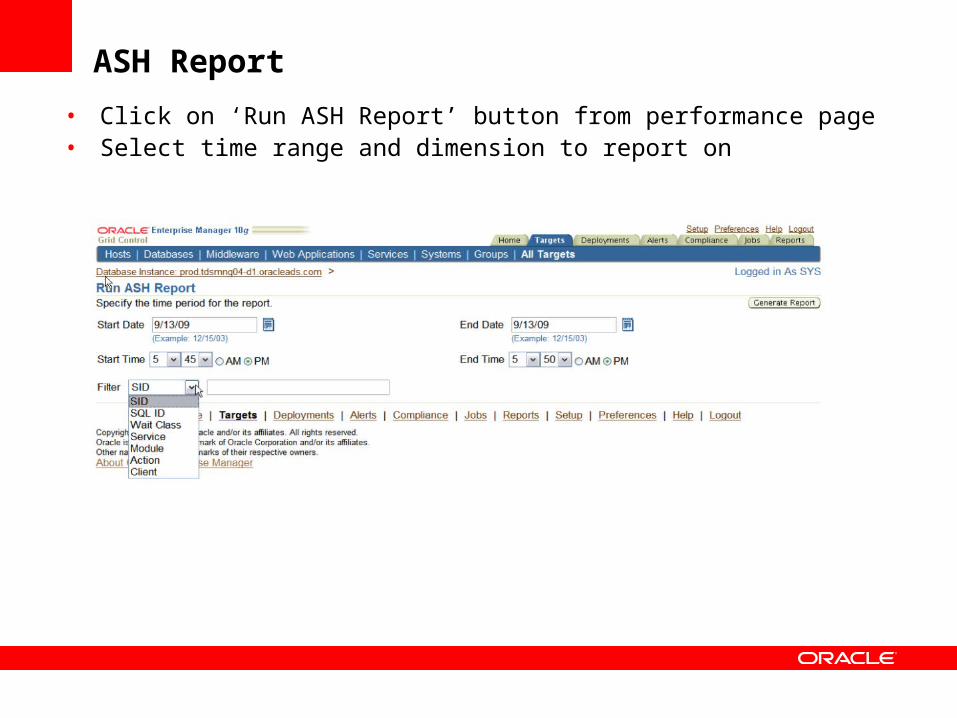
ASH Report
• Click on ‘Run ASH Report’ button from performance page• Select time range and dimension to report on

ASH Report:
• ASH Report of a single session for a 5 minute period
• The session accounted for 52% of database activity for the time period
• The session spent 64% of the time in a concurrency wait event, 36% on CPU. There is clearly some opportunity for tuning.

Has my SQL statement’s performance changed over time?

AWR Individual SQL Report
• AWR Report for a particular SQL Statement -awrsqrpt.sql
• Useful for researching individual SQL statement performance over time
• Example: Single SQL statement, before and after tuning
• CPU Time per execution substantially decreased – tuning was successful.
Plan Statistics
Before tuning
After tuning
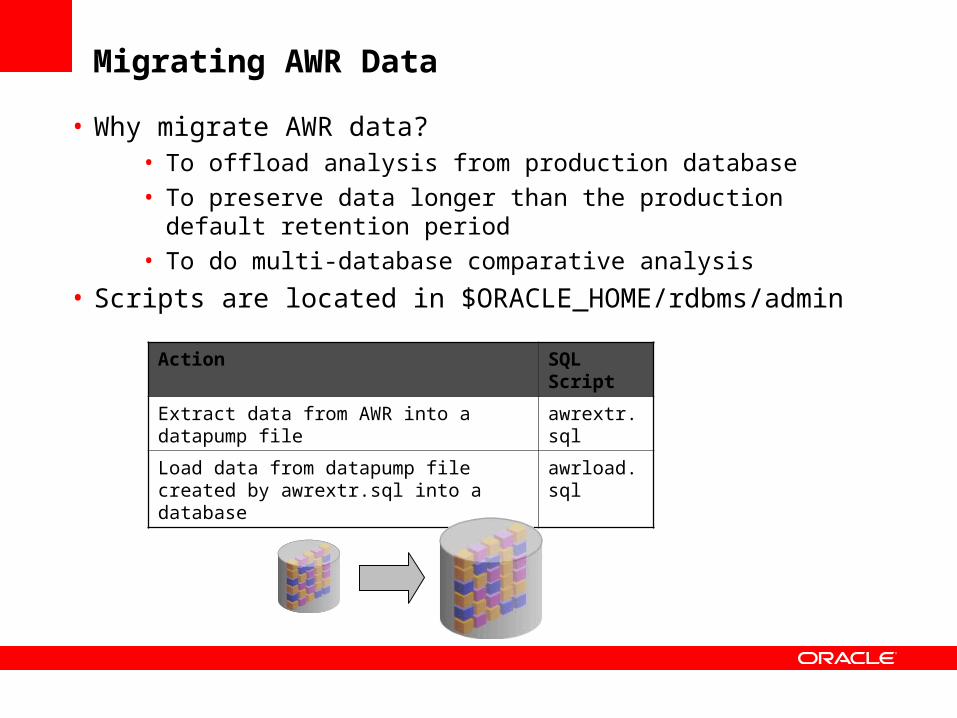
Migrating AWR Data
• Why migrate AWR data?• To offload analysis from production database• To preserve data longer than the production default retention
period• To do multi-database comparative analysis
• Scripts are located in $ORACLE_HOME/rdbms/admin
Action SQL Script
Extract data from AWR into a datapump file awrextr.sql
Load data from datapump file created by awrextr.sql into a database
awrload.sql
<Insert Picture Here>
Agenda
• Automatic Workload Repository Infrastructure
• Out of the box AWR reports
• Active Reports
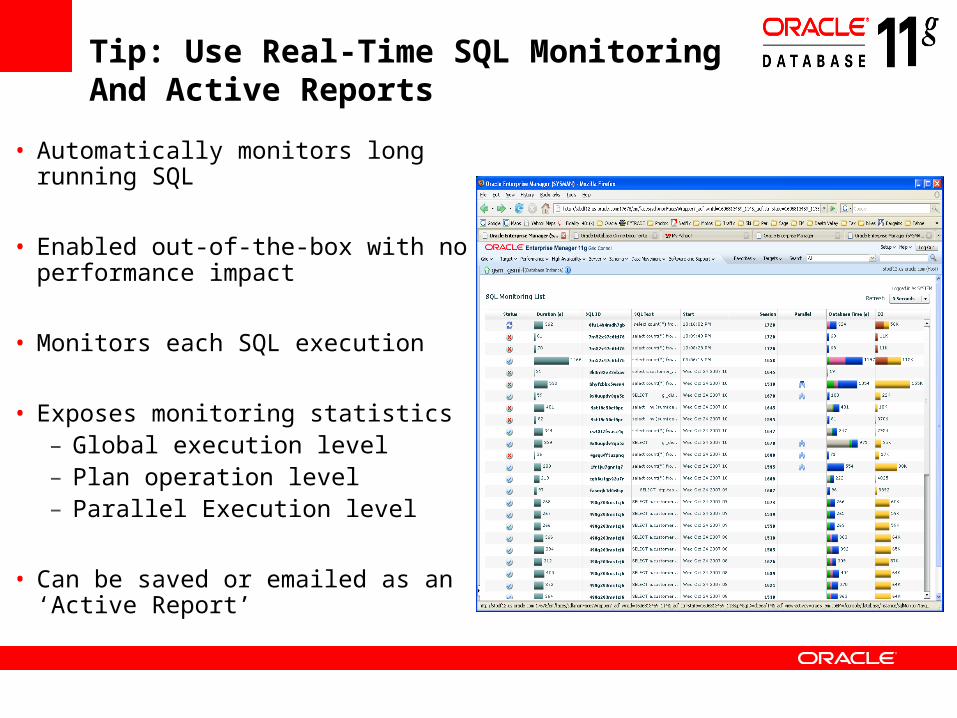
• Automatically monitors long running SQL
• Enabled out-of-the-box with no performance impact
• Monitors each SQL execution
• Exposes monitoring statistics– Global execution level– Plan operation level– Parallel Execution level
• Can be saved or emailed as an ‘Active Report’
Tip: Use Real-Time SQL MonitoringAnd Active Reports
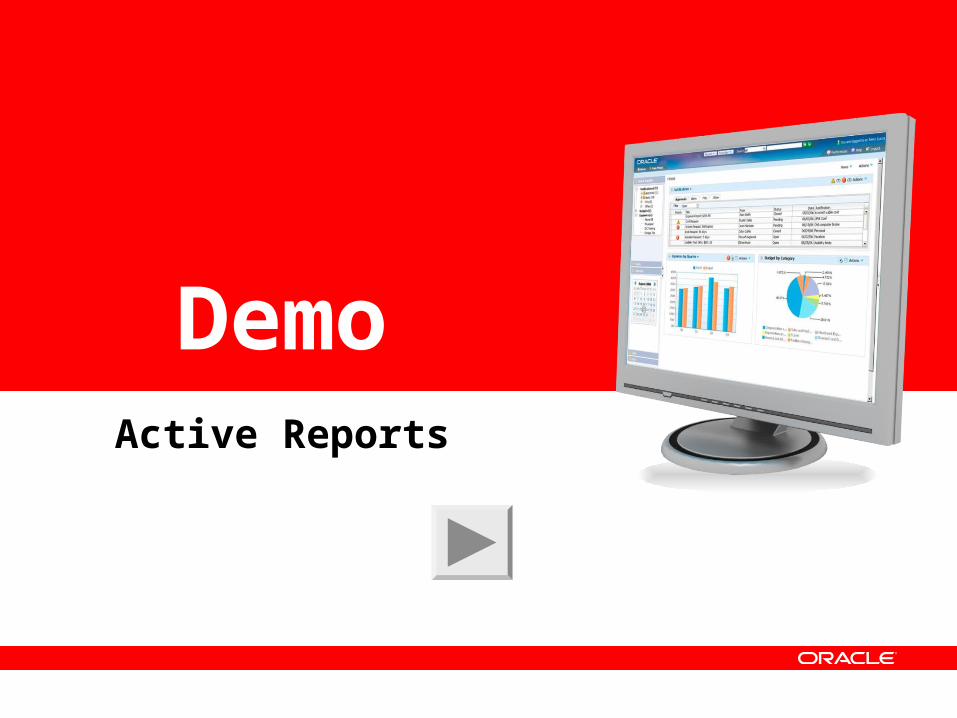
Active Reports
Demo

Conclusion
• AWR contains vast amounts of database performance data• Enterprise Manager displays a comprehensive view
and analysis of that data• Standard reports can provide additional insights– Use the right report for the right problem
• Active reports are a useful new tool for the Oracle database professional
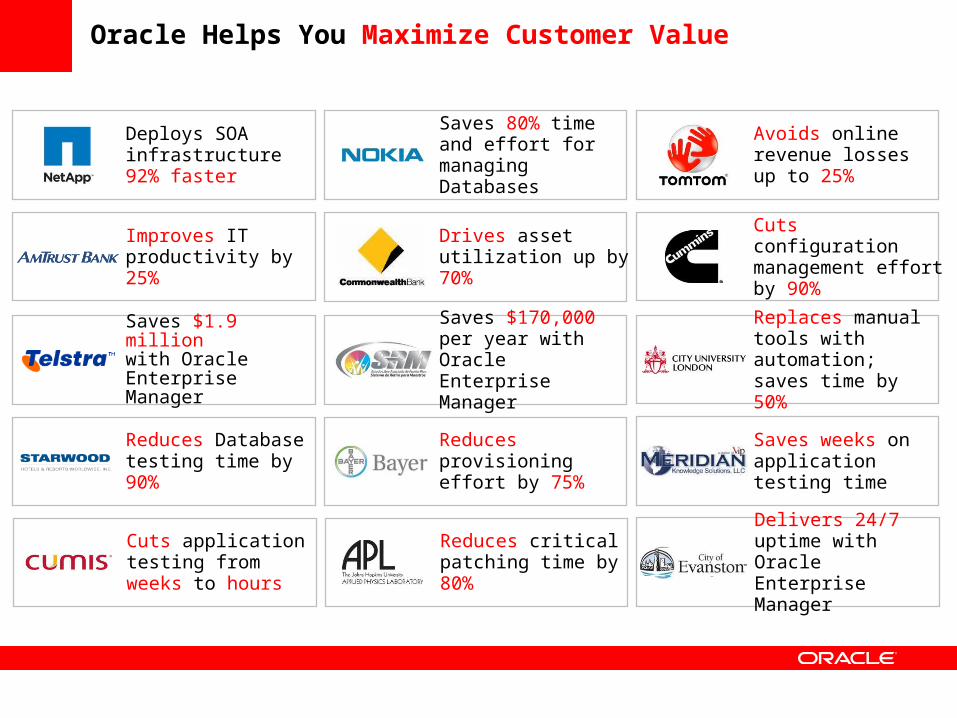
Oracle Helps You Maximize Customer Value
Avoids online revenue losses up to 25%
Cuts configuration management effort by 90%
Saves weeks on application testing time
Replaces manual tools with automation; saves time by 50%
Deploys SOA infrastructure 92% faster
Saves 80% time and effort for managing Databases
Improves IT productivity by 25%
Drives asset utilization up by 70%
Reduces Database testing time by 90%
Reduces provisioning effort by 75%
Saves $1.9 million with Oracle Enterprise Manager
Saves $170,000 per year with Oracle Enterprise Manager
Delivers 24/7 uptime with Oracle Enterprise Manager
Cuts application testing from weeks to hours
Reduces critical patching time by 80%

Additional Oracle Enterprise Manager sessions
Wednesday, Oct. 14 Location
• 11:45 a.m.- Performance-Testing Oracle E-Business Suite: Tips and Tricks from Oracle Experts
• 11:45 a.m.- Oracle Enterprise Manager: Monitoring and Security Best Practices
• 11:45 a.m.- Upgrade Case Study: Database Replay, Snapshot Standby, and Plan Baselines
• Moscone S. Room 305
• Moscone S. Room 303
• Moscone S. Room 301
• 1:45 p.m.- Quick Tips for Database Performance Tuning
• 5:00 p.m.- SQL Gone Wild: Taming Bad SQL the Easy Way (or the Hard Way)
• 5:00pm Oracle Enterprise Manager: Beyond the Basics: Getting More from Oracle Enterprise Manager
• Moscone S. Room 104
• Moscone S. Room 102
• Moscone S. Room 305
Additional Oracle Enterprise Manager sessions
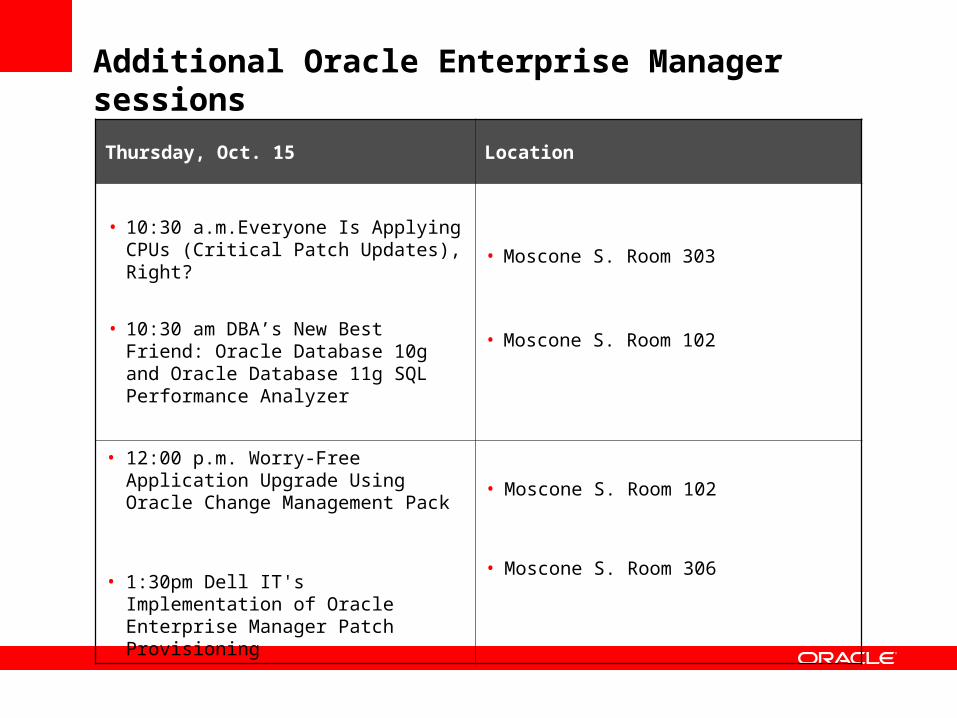
Thursday, Oct. 15 Location
• 10:30 a.m.Everyone Is Applying CPUs (Critical Patch Updates), Right?
• 10:30 am DBA’s New Best Friend: Oracle Database 10g and Oracle Database 11g SQL Performance Analyzer
• Moscone S. Room 303
• Moscone S. Room 102
• 12:00 p.m. Worry-Free Application Upgrade Using Oracle Change Management Pack
• 1:30pm Dell IT's Implementation of Oracle Enterprise Manager Patch Provisioning
• Moscone S. Room 102
• Moscone S. Room 306