Embed Size (px)
Citation preview

Using ArcIMS to Prioritize EQIP Applications for USDA NRCS Wyoming
Authors Jeri Sue Ponder, Randy Wiggins, Cheryl Grapes, Michele Basham May
Abstract A customized ESRI ArcIMS tool was designed to assist with evaluating and prioritizing applications for funding for the Environmental Quality Incentives Program (EQIP) for the United States Department of Agriculture (USDA) Natural Resources Conservation Service (NRCS) in Wyoming. The ESRI ArcIMS HTML viewer was simplified to include only the necessary tools. The user is given the choice of entering a new EQIP application or working with existing applications. To enter an application, the user zooms to an area of interest, using DRGs or DOQs as a reference layer, to place a point representing the location of a producer’s livestock waste facility. In the background, overlays are done on aquifer sensitivity, distance to water, and impaired watersheds. The user then submits non-spatial data about the facility via a JSP page. Each application is then scored and ranked against existing applications. The information gathered is stored in an Oracle database. Significant time is saved and more objective and reliable results are achieved.
Introduction Early in 2004, the USDA NRCS National Cartography and Geospatial Center (NCGC) and the Wyoming NRCS began work on an ESRI ArcIMS pilot project intended to assist with prioritizing EQIP applications for livestock waste facilities. EQIP is a voluntary Farm Bill conservation program for farmers and ranchers that promotes agricultural production and environmental quality as compatible national goals. EQIP offers financial and technical assistance to eligible participants to install or implement structural and management practices on eligible agricultural land. Producers can apply for cost sharing for many types of conservation practices. Demand for EQIP contracts often exceeds funding availability, and applications are evaluated and selected for funding based on a locally developed procedure to optimize environmental benefits. Complying with confined animal feeding operations (AFO/CAFO) regulations is one of the top natural resource concerns facing Wyoming producers. In prior years, evaluating and ranking an EQIP application for funding was done mostly on paper and could take between 2 and 4 hours. Not only was the process time-consuming, it could also be somewhat subjective as the process occurred in 29 field offices across the state. Because the ranking process included geospatial decision-
1

2
making, a customized ArcIMS tool was piloted to help prioritize EQIP funding applications for the priority concern of livestock waste management. The project was designed to speed the EQIP application evaluation process, to automatically rank the applications, and to provide greater objectivity.
Evaluating and Ranking EQIP Applications – Automating a Manual Process
Overview The old ranking process was done on paper. One of the most potentially inaccurate and time-consuming tasks associated with evaluating a request for EQIP cost-share funding for livestock waste management assistance was locating the AFO/CAFO on paper maps or on a geographic information system (GIS) and determining its proximity to water features, whether the operation occurred within an impacted watershed, and whether the operation overlay an impaired aquifer. Each field office required hard copies of the EQIP Application Ranking Criteria worksheet (see appendix A), along with an aerial photo of each operation. The evaluator would then open ESRI ArcView and add the GIS layers for impaired water bodies and aquifer sensitivity. (Sometimes it took offices a while to find the GIS layer or hard copy map.) Multiple geospatial processing steps were required to calculate a score for each funding request. After determining the location and identifying the attribute for that area, the evaluator would select the ranking score for that criterion and write it on the worksheet. Each criterion would be scored and added manually for the total ranking score. This process also included calculating the cost per animal unit and using a graph (see appendix A) to determine those points. Each step provided the opportunity for a variety of errors. The entire process took about 2 hours per application. After the ranking worksheet was completed, it was photocopied and mailed to the state office to be compiled with all the applications across the state. The county name, application number, total ranking points, and estimated cost share dollars were manually transferred from each application into an Excel spreadsheet to determine priority ranking and cumulative cost share dollars requested. This process also provided the opportunity for errors and even the potential to lose applications. This step generally required an entire day to compile and involved a lot of paper handling. The function of the customized ArcIMS site was to allow NRCS staff in offices around the state to quickly and easily locate and submit a point on a map representing an existing livestock waste facility; automate the derivation of necessary spatial information; collect user input about a client’s requirements via a forms page; store the data in a centralized database; and score and iteratively rank all submitted funding applications against one another. Completed applications were then reviewed by the NRCS state office. A user must first login to the site from within the USDA network. The user can then decide weather to add, view, or delete an EQIP application for livestock waste management funding. If the user chooses to add a new application, the user is forwarded
USDA NRCS ESRI Federal User Conference 2005
3
to the ArcIMS site where they can navigate and zoom to the location of the AFO/CAFO, then click on the map to place a point representing the operation via a custom “Add Point” tool. If the location is not correct, the user simply adds a point again. Only one facility is allowed per funding application. If the scale is at 1:12,000 or better, the point is accepted, and a pushpin icon appears on the map. A message is displayed if the point is placed at a scale above 1:12,000, and a custom “Zoom to Scale” tool is provided to assist the user and ensure that all points are submitted at a consistent scale. Once the point is placed at the desired location and the “Submit” button is clicked, ArcIMS begins calculating spatial overlays in the background. When the overlays are complete, a table displays the point coordinates and the results of the overlay operations. The user is given the option of continuing on or starting over. Next, a set of questions are presented via HTML forms. When the data are submitted, a cost effectiveness score is calculated, including the total project cost, the cost-share amount, and the total points to be used to rank the application. The user is given the option of altering the questionnaire responses or of submitting the application as is. The user input is collected and stored, along with the point coordinates and overlay results, in an Oracle table, and used to calculate a score for the funding application. With proper permissions, a user may also select from a list of existing applications for review or deletion and view a table that ranks application scores and calculates cumulative cost share funding requests from within their own county or across the state.
Information Architecture and System Configuration The application is deployed using ArcIMS 9.0 and runs on a Windows 2003 server with four processor and 2.0 GB of RAM. The web server is Apache 2.0.48, and the servlet connector is Tomcat 4.129. Several web programming languages were used in this application, the combination of which provides a secure and robust application. The client is a modified HTML viewer with tools and forms written in JavaScript and HTML. Java Server Pages (JPS) were used to wrap around the viewer for database connections, security, and session and variable management. Oracle 9.2 running under Solaris 9 on a Sun 480 workstation serves as the database.
Customizing the HTML Viewer The standard ArcIMS HTML viewer was selected as the starting point because the team had the greatest knowledge of this viewer and experience with the JavaScript language. The viewer was modified to remove unneeded functions and to add several new functions not included in the standard viewer. The zoom, pan, and identify functions were retained, and a new Zoom to Scale function was added, as well as a function to generate a point feature. The Zoom to Scale function allows the user to zoom to the preset scale of 1:12,000, which is the desired scale for adding points. The Add Point function checks the map scale to make sure it is at the desired scale. If not, it prompts the user to zoom to 1:12,000 or not (see figure 1). If the user elects to automatically zoom to 1:12,000, the tool zooms in, centers on the clicked location, and prompts the user to re-enter the point in order to verify the location. If the user declines to zoom to the correct scale, a point is
USDA NRCS ESRI Federal User Conference 2005

4
not generated, allowing the user to manually zoom to the correct place and scale. If the user accepts the point, the coordinate is submitted to the database.
Figure 1. The Add Point tool is used to generate a point to locate a new or existing AFO/CAFO on a
DOQ or DRG at a predefined scale. Also incorporated into the viewer is the preliminary USDA web template. This USDA web template was used to give the ArcIMS site a unified Department “look and feel” and to conform to the Department’s new style guide so fewer style changes would be needed at a later date.
USDA NRCS ESRI Federal User Conference 2005

5
Data Presentation Layers The initial map view presents a painted relief image of the State of Wyoming, along with county boundaries and major roads. As a user zooms in, additional vector layers are rendered, including public land survey system, hydrography, and more detailed roads. Aquifer sensitivity data, classified from high to low, are also available for display. In addition, a watershed boundary layer showing impaired status is presented. Three scales of DRGs – 1:250,000 scale, 1:100,000 scale, and 1:24,000 scale – are also rendered in turn as the user continues to zoom in to the area of interest. Finally, National Agriculture Imagery Progam (NAIP) 1-meter digital orthophoto quadrangle (DOQ) imagery, primarily in color-infrared, in MrSID compressed format is presented. Data sources include shapefiles and SDE views for vector data, image catalogs of MrSID files on disk for DOQ, and SDE raster catalogs of digital raster graphics (DRG). Because the State of Wyoming includes two UTM zones, displaying the image data presented a challenge. The image data were stored and maintained in their native projections, and it was necessary to reproject the DRG and DOQ images from UTM Zone 12 into UTM Zone 13 on-the-fly. In addition, the DOQ rendering greatly impacted performance due to a combination of factors. Therefore, display thresholds were carefully adjusted to minimize response time while still presenting the layer at a practical scale.
Multiple Image Services Based on the volume of image data being served from two servers and the use of two UTM zones, multiple image services were setup. This made using data on separate servers easier to manage and simplified troubleshooting. The DRG data are served via an SDE raster catalog connection to the USDA Geospatial Data Warehouse (GDW). The DOQ images are MrSID files in a raster catalog on a Unix machine with a Samba connection to the ArcIMS server. The main image service incorporates shapefile layers that are stored on the ArcIMS server with SDE vector layers served through the GDW. The implementation of multiple services came from an ESRI example included in the install of ArcIMS 9.0.
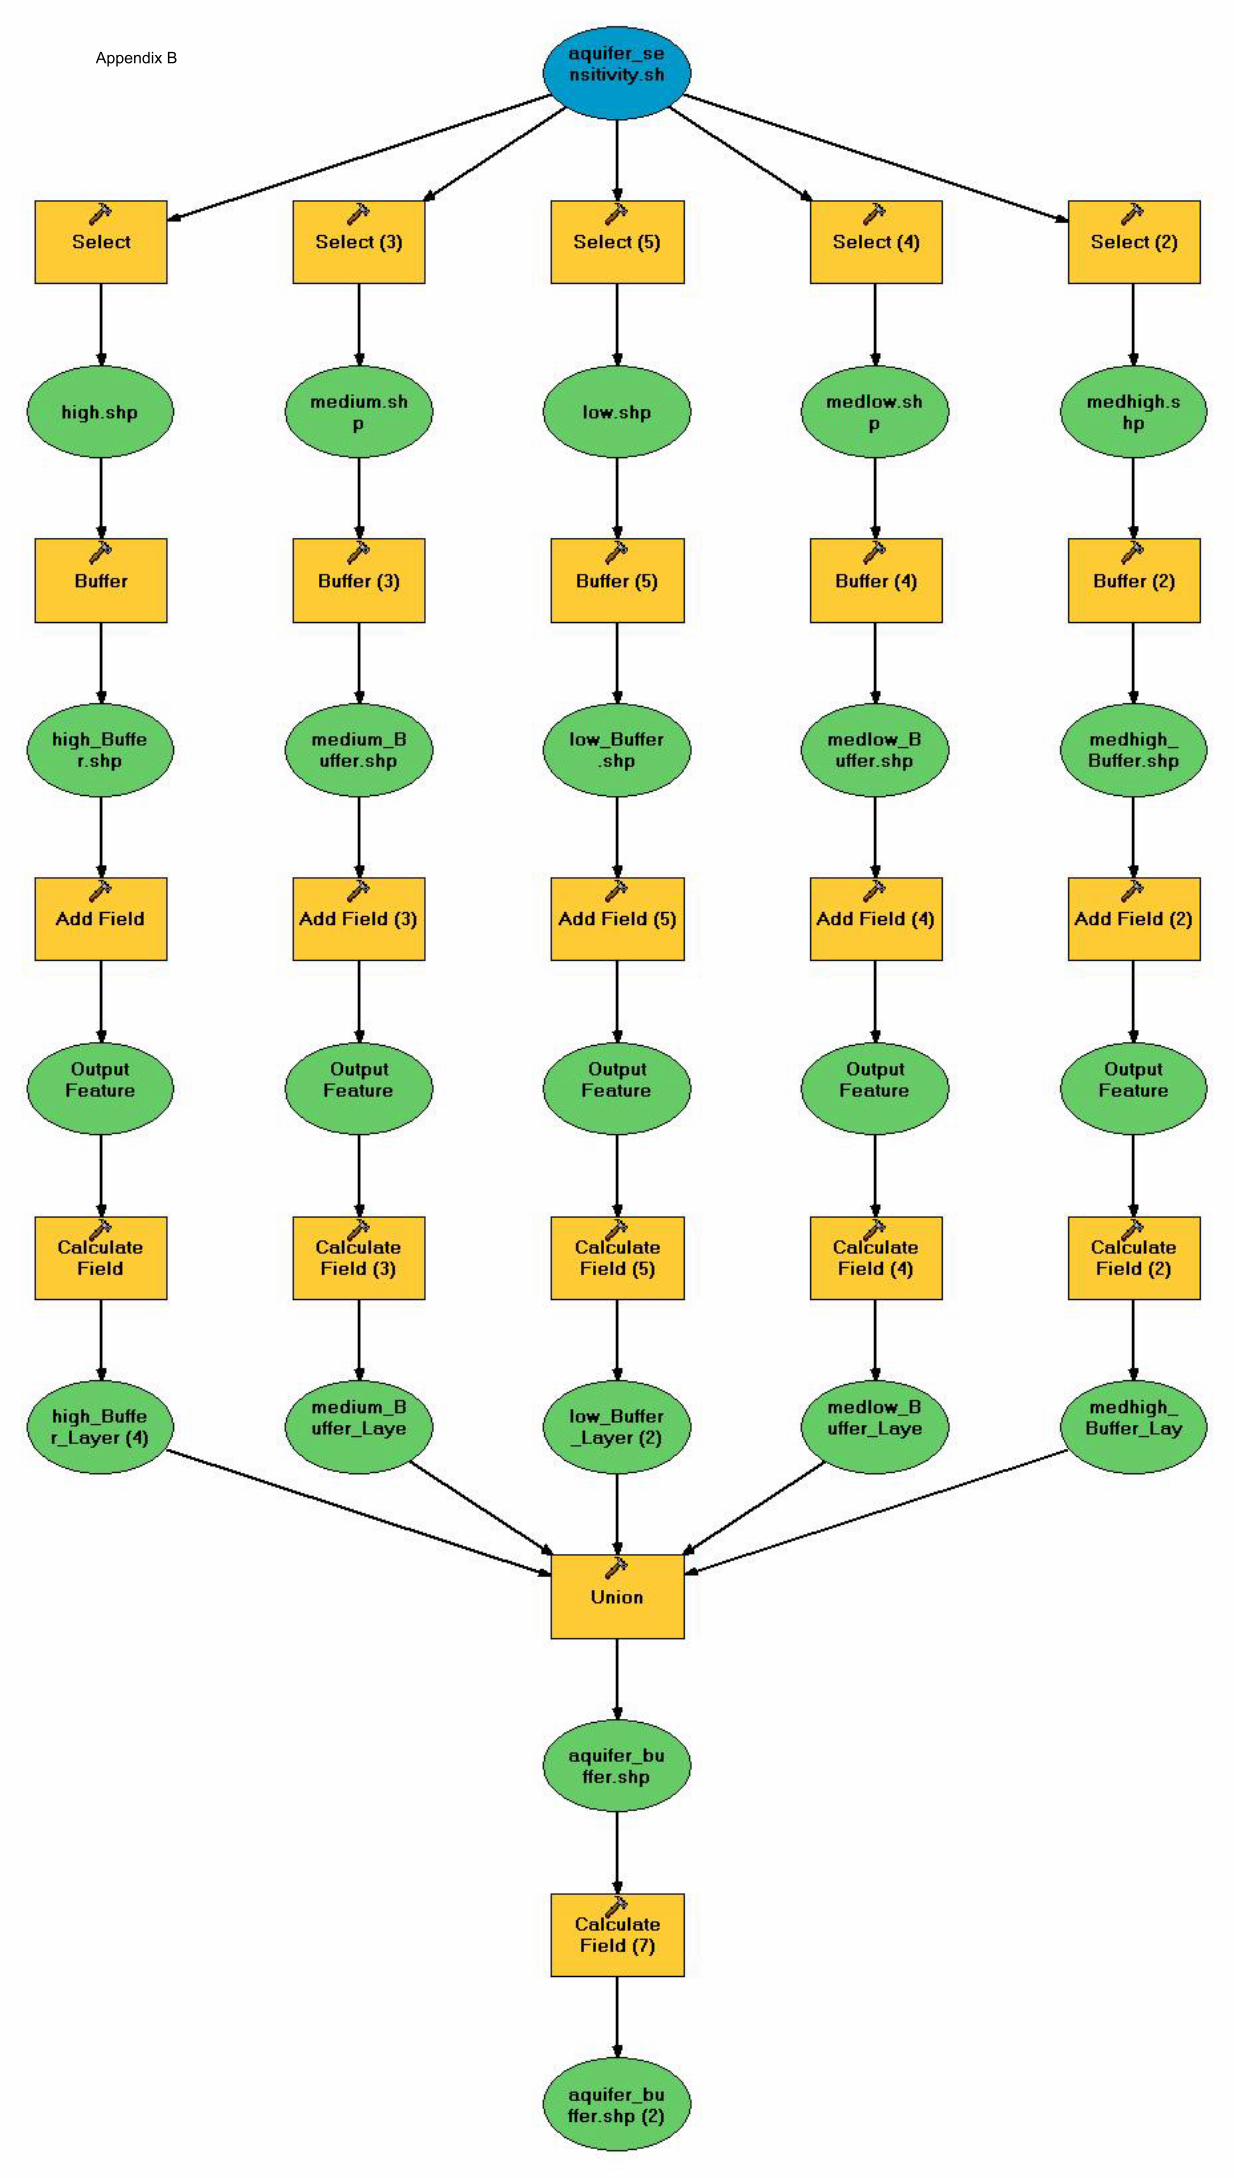
Preprocessed Data After some initial testing, it was decided that two datasets needed to be preprocessed in order to speed up the geospatial processing time. Preprocessing significantly improved response times. The aquifer sensitivity layer was to be queried, and if the point was within 100 feet of a higher sensitivity class, then the higher value should be returned. This took a long time to process as ArcXML commands, so a new layer was developed to minimize repetitive, on-demand geoprocessing. Each class in the aquifer sensitivity layer was separated into its own layer. Each class layer was then buffered an additional 100 feet. A new unique item was added to each buffered class layer where the class was stored based on the “inside” item equaling 100. Then a series of unions were done to put the buffered class layers back together as single layer. Next, a series of selects and updates were done to determine the highest class for each polygon. This became the layer that overlays would be done against. Upon testing, this new layer greatly reduced the processing time for this overlay. (See appendix B for a simplified process diagram.)
USDA NRCS ESRI Federal User Conference 2005

6
The streams and ponds layers were also preprocessed. Initially, the distances from the livestock waste facility to both the streams and ponds layers were calculated. However, the processing time required was unacceptable. Since only three proximity classes were actually needed, it was decide to buffer both layers at 100 feet, join them into one layer, buffer that layer an additional 300 feet, and then joined it back to the 100 foot buffer layer to create a proximity-to-water layer. This helped the processing time, but it was still very slow because the layer was statewide; many polygons stretched across the entire state. The counties were unioned to the proximity-to-water layer, making the spatial extent of any one polygon much smaller, thus resulting in very fast processing time. (See appendix B for simplified process diagrams.)
Overlays ArcIMS performs three separate overlays once the point locating the livestock operation is submitted. The first overlay determines whether the point falls within an impaired watershed. The second overlay determines which of three proximity-to-water classes the point falls within. The last overlay uses the preprocessed aquifer sensitivity layer to determine the aquifer sensitivity class in which the point falls. The resulting information is shown to the user on a new page, but the data can not be changed. The user does have the option of returning to the map and changing the point location or of accepting the information and proceeding (see figure 2). The information acquired from the overlays is used in computing the final rank of the EQIP application. (See appendix A for point assignments.)
USDA NRCS ESRI Federal User Conference 2005

7
Figure 2. When a point to locate the AFO/CAFO is submitted, overlays are used to determine whether it falls within an impaired watershed or near a sensitive aquifer, and its proximity to a water feature. The user has the option of relocating the point or of submitting the point and continuing on
with the data entry process.
Collecting EQIP Applicant Information After locating the livestock operation and submitting a point, additional information about the operation must be collected (see figure 3). The priority screening of the application, the number of animals involved, and the total cost of the improvement are all needed to calculate the final ranking (See appendix A). The priority is determined by the current condition of the AFO/CAFO (high, medium, or low based on environmental impact) and whether the operation will be removed if the proposed project is complete. The user must also indicate whether the applicant has completed a Self Assessment Worksheet to determine his or her eligibility. Finally, the total cost of the project and the number of animals are needed to calculate the Cost Effectiveness. The answers to each of
USDA NRCS ESRI Federal User Conference 2005

8
these questions are then shown to the user for review. The user can then submit his responses for calculating a score or return to the data input page to make changes (see figure 4).
Figure 3. Information about the AFO/CAFO operation and the EQIP application for funding is collected via HTML forms and used to score and rank the application.
USDA NRCS ESRI Federal User Conference 2005
9
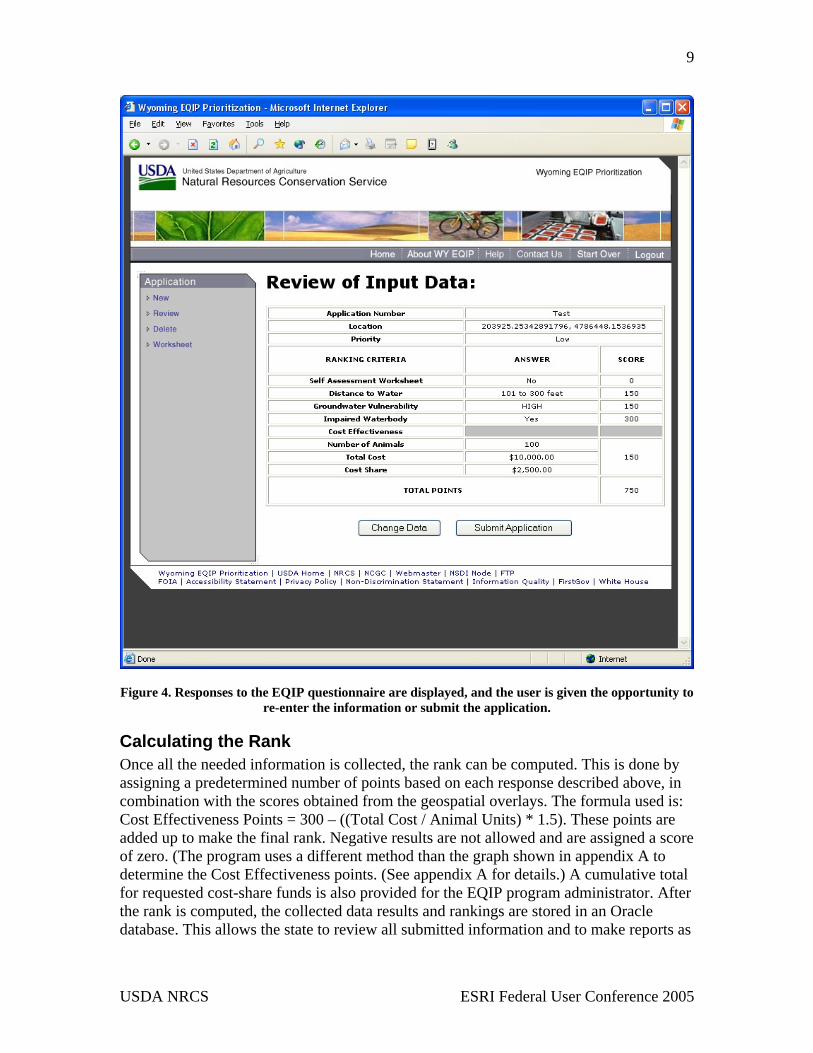
Figure 4. Responses to the EQIP questionnaire are displayed, and the user is given the opportunity to re-enter the information or submit the application.
Calculating the Rank Once all the needed information is collected, the rank can be computed. This is done by assigning a predetermined number of points based on each response described above, in combination with the scores obtained from the geospatial overlays. The formula used is: Cost Effectiveness Points = 300 – ((Total Cost / Animal Units) * 1.5). These points are added up to make the final rank. Negative results are not allowed and are assigned a score of zero. (The program uses a different method than the graph shown in appendix A to determine the Cost Effectiveness points. (See appendix A for details.) A cumulative total for requested cost-share funds is also provided for the EQIP program administrator. After the rank is computed, the collected data results and rankings are stored in an Oracle database. This allows the state to review all submitted information and to make reports as
USDA NRCS ESRI Federal User Conference 2005

10
desired. A combination of rank and priority is used by the NRCS state office to determine which projects get funded for that year.
Security and Administration The application is housed inside the USDA firewall and is accessible only from within the USDA network. Users as assigned an id and password, and user authentication will be handled via the USDA eAuthentication process in the immediate future. Currently, two levels of user permissions have been established. Field office users can add, delete, and review applications only for their county or service center area. An administrator in the state office can add, delete, and review applications from across the state. A third category of user permissions for regional managers may be added in the future. Database and ArcIMS administration is handled by NCGC staff, while the state office is responsible for EQIP related questions and general end-user support.
Future Enhancements Several enhancements are planned. A tool to allow the state administrator to export the point coordinates, user responses, and all scores to an Excel spreadsheet or shapefile is under development. The application will also be modified to allow users with appropriate permissions to edit existing records without having to re-enter the AFO/CAFO location and all other data. Where available, links to metadata will be added for each layer, and the legend and layer list will be integrated. The ability to zoom to a location based on township/section/range values may also be implemented. Finally, brief Help documentation will be added.
Conclusions In prior years, ranking worksheets could take between two and four hours per application to complete. The new process takes just a few minutes to complete in the ArcIMS tool. The field office staff need not open other references, find maps, or handle or make photocopies. In addition, all of the applications are already compiled, prioritized, and ranked for the state office, along with the cumulative dollars requested. Once submitted, the user can see how the completed application ranks against other applications submitted in their county or service center area. Selection of applications by the state office can be done almost immediately based on the aggregated information. This is a major time saver for state and field office personnel. The improvement includes not only a large savings of time, but also improvement in the accuracy and consistency of the ranking process. Looking into the future, the tool could be made publicly available on the web so that cost-share applicants could complete the ranking themselves from their home computer or from a kiosk at their local office. The project was conducted as a proof-of-concept pilot. ArcIMS is highly customizable program that provides the flexibility to incorporate geospatial questions along with questions that we want the applicant to answer. Total development time required approximately 2 months, plus time to coordinate between NCGC and Wyoming NRCS personnel. The development process and programming code are applicable and transferable to other web-enabled GIS, prioritization tools, suggesting that less time would be required to build new, similar tools.
USDA NRCS ESRI Federal User Conference 2005

11
Implications for this type of ArcIMS tool extend to many other NRCS conservation programs and across the states. However, the aquifer sensitivity layer and the impacted watersheds layer are available in only about 20 states. Furthermore, ranking criteria for EQIP funding vary among the states. Therefore, the acquisition of national, seamless dataset, such as high-resolution vegetation and land cover, and current imagery, along with the layers mentioned above would facilitate implementation of a similar tool in other states or nationwide. A wizard-based tool, one that would allow the user to select ranking criteria based on State requirements and relevant datasets, would be highly beneficial.
Acknowledgments The authors would like to thank Tony Kimmet, NCGC Cartographer, for his help obtaining and preparing DOQ data; Michele Simmons, NCGC Webmaster, for assistance with the web template; and Steve Farwell, NCGC IT Specialist, for support with ArcIMS issues and data processing. We would also like to thank Steve Nechero for his advice along the way and for his editorial comments, along with M. Lynn Owens for her editorial review.
USDA NRCS ESRI Federal User Conference 2005

Appendix A
2005 EQIP Application Ranking Criteria Application Number: County: Date:
WATER QUALITY THROUGH LIVESTOCK WASTE
MANAGEMENT Priority Screening: ___ High Priority The application is an AFO/CAFO with an unacceptable
condition that will be removed if the proposed project is completed.
___ Medium Priority The application is an AFO/CAFO without an unacceptable
condition, but completion of the project will result in an improvement in water quality.
___ Low Priority The application is for a new or expanding operation.
Max Actual Ranking Criteria: Points Points 1. Has the applicant completed the Self Assessment Worksheet? 50 _____ Yes = 50 points 2. Location: a. Distance to surface water or to ditch, canal, draw, 300 _____ or other conveyance system.
Less than 100 feet 300 points 101 feet to 300 feet 150 points More than 300 feet 50 points
b. Depth to groundwater (Refer to "Wyoming Ground 150 _____ Water Vulnerability Assessment Map & Handbook") Aquifer Sensitivity:
High (red) 150 pts Med.Hi (yellow) 100 pts Med. (green) 50 pts Med.Lo (blue) 25 pts Low (purple) 0 pts c. Facility is located within a watershed with an impaired 300 _____ water body? (303d list for fecal coliform) Yes = 300 pts 12

13 Max Actual Points Points 3. Points from cost effectiveness chart. 300 _____
Cost Effectiveness Points Water Quality
0
50
100
150
200
250
300
0 50 100 150 200 250
Estimated Total Cost ($) per Animal Unit
Poin
ts
TOTAL POINTS: 1100 _____
USDA NRCS ESRI Federal User Conference 2005
Appendix B


14
Author Information Jeri Sue Ponder GIS Programmer USDA NRCS NCGC / CSC 501 Felix St. Building 23 Fort Worth, TX 76115 Office: 817-509-3556 Fax: 817-509-3469 [email protected] Randy Wiggins State GIS Coordinator USDA NRCS Wyoming 100 East "B" Street, Room 3124 Casper, WY 82601 Office: 307-233-6778 Fax: 307-233- 6753 [email protected] Cheryl Grapes Resource Conservationist/Farm Bill USDA NRCS Wyoming 100 East "B" Street, Room 3124 Casper, WY 82601 Office: 307-233-6762 Fax: 307-233- 6753 [email protected] Michele Basham May Physical Scientist USDA NRCS NCGC 501 Felix St. Building 23 Fort Worth, TX 76115 Office: 817-509-3459 Fax: 817-509-3459 [email protected]
USDA NRCS ESRI Federal User Conference 2005