Embed Size (px)
Citation preview

VCES Data: The Virtual Reality at CMHA Halton Region Branch
E-QIP QI Innovations ConferenceApril 13, 2021
Ed Castro, CLSSBB, Director, Planning and ServicesMegan McNeil, RSSW, Manager of Case Management ServicesAngela Gaetano, MSW, RSW, Clinical Planner and Case Manager
VCES Response data accurate as of: Wednesday, December 09, 2020Client response rate estimated based on historical EMHWare “Program History” data from October 2020, based on reports pulled on: 13 January 2021
Objective:To share some learnings from the process of designing and implementing our recent quality improvement pilot project.
Agenda:
1. Overview of the VCES Pilot Project2. Learnings:
A. Introductions & The Voice of Lived Experience: Language Matters!B. Basic Survey Information
I. Always plan for “n”II. Importance of Strategic Communication
C. Demographics: Plan Output Before InputD. Technology:
I. Expanding Helpful Input/OutputsII. Notice Who & What You’re Missing
E. Client Experiences: What if your results are all positive?F. Preliminary Statistical Analysis: Planning for Statistical Analysis
3. Next Steps

Overview of VCES Pilot ProjectProblem Statement:Lack of data measuring client services satisfaction with the pivot to virtual supports during the COVID-19 pandemic
Why a pilot?:• To test design of data collection system & identify quality improvement activities in
it prior to rolling it out agency wide.
• Began with 3 non-crisis Case Management programs providing video supports.
Why CAMH’s Virtual Client Experience Survey (VCES)?• Brief literature review showed few easily accessed tools specifically targeted to our
community programs & client populations.
• CAMH trusted & widely known; potential broader use of VCES in system may allow for knowledge sharing with multiple system partners.

Virtual Client Experience Survey (VCES)• CAMH; Drs. Allison Crawford, MD, PhD, FRCPC & Eva Serhal, MBA PhD• Self Report; Full and Brief Versions• Includes items from the Ontario Perception of Care (OPOC)• Is free to download and use from CAMH: https://edc.camhx.ca/redcap/surveys/?s=7CRKNYT7FY
Full version includes items on: Client satisfaction with virtual mental health and addictions supports.
Some demographics
Presence of some common health and accessibility factors, including:• Chronic Illness• Mental health and/or substance use challenges• Ability differences (cognitive, physical, & sensory)
Technology, including:• What tech is used to access appointments• Overall comfort level with technology

Prep (PLAN)
Administer(DO)
Data Collection(STUDY)
Analysis (STUDY)
Report Back &Identification of QI
Activities(ACT)
Tool Identification via Literature Review
Input from Lived Experience
(Peer Mentor Meeting23 September 2020)
Administration Process Planning
Staff Training Development
Training Staff in programsidentified for Pilot.
Creation of online surveyinput sustem anonymous
(SurveyMonkey)
Staff to send link to allactive clients receivingvideo supports duringthe month of October:
Staff to communicatevalue & deadline to client
(script available)
Survey monkey collectsresults as surveys are
completed
Client informs staff they have completed by end
of October(honor system)
Staff emails client namesto Clinical Planner for
draw by draw deadline:06 November 2020
Participants who wish tobe are entered in draw.
Manager draws numbersfor 5 $25 Walmart GiftCards in a November
team meeting
Data Analyst aggregatessurvey results (outcomedata) by Nov 16, 2020
Meet with staff to reportoutcome data & identified
QI goalsTimeline Target: end of
November
Project Team to meet on24 Nov 2020 to analyseoutcome data and start
Identifying QI goals & nextsteps including action
items and ideas re: potential project teams
Manager to remind staffat team meetings in October regularly re:
providing link to surveyto clients
VCESImplementation Pilot PDSA Cycle
Fall 2020
CMHA Halton Region Branch
Pilot now complete; Project team begins
planning for completion of identified QI changes to
survey to a second (fuller) implementation of survey.
Proceed with Next Project: Fuller implementation of
survey.
Report back to Board re:outcome data & identified
QI goals
We are here: Pilot Project Now Complete!
Proceed with NextProject:
Fuller implementation of
survey with QI changes made.

“I appreciated the opportunity to contribute to the conversation through the lens of ‘What is important to the peer/client’.
Framing the questions and using Language which reflected ‘we are listening’ and peers/clients input and experience is very important to the organization.”
-CMHA Halton Peer Mentor
• Peer Mentors & voice of lived experience
• Person-centered language to communicate: • Importance of your voice• Value of your input• Respect & Person-centered values• How information will be used• Impact of information received &
value for service users
• Mitigating the impact of jargon & clinical language by adding an introduction
• Collaboratively wrote an intro for the survey monkey & optional introduction script forCase Managers.
• Honorarium
Learning: Language Matters!Introductions & The Voice of Lived Experiences

Basic Survey InformationTotal Responses Estimated Response
Rate*Completion Rate Typical Time Spent
Completing
33 18.76* 100% 9 min 34 sec
Challenge: • Project team was focused on so many moving
parts, we did not work in a process for consistently tracking how many invitations to the survey were sent out (the “n” in research terms)
• This made it difficult to determine an accurate response rate.
Solution: • To address this gap in information, a “proxy”
estimate was calculated based on known caseload data from the electronic records database (reported above*).
Important Learning for QI: Always get the “n”Moving forward, this will be a required data input for future launches of the survey & a process for Case Managers to record and report the number of surveys handed out is
being developed for our wider roll out.
“Missing the Forest for the Trees”

Response Timeline - Communication with Case Management (CM) Team
DATES
# O
F R
ESPO
NSE
S
CM Team Meeting
CM Team Meeting & Clinical Planner spoke re: VCES
Email reminder sent to CM Team
Intended stop of pilot project.
LEGEND:
Learning: Importance of Strategic Communication

Demographics• Full VCES collected basic demographic information on:
• Gender• Age• Geography (via postal code)• Racial/Ethnic Group• Number of years living in Canada• Presence of:
• Chronic Physical Health Conditions• Mental Health Challenges• Substance Use Challenges• Ability Differences (cognitive, physical, and sensory)
• Notably does not include income or sexual orientation
• QI Activity: May add additional demographic questions in upcoming second implementation

0123456789
10R1A 2B3V1C 9K7N8K 0M7N2G 1L8V7D 8L9Q2C 9H6N3K 0L8R1A 0M7N2G 1L8L8L 6G7R1A 2B3
V1C 9K7N8K 0M7N2G 1L8V7D 8L9Q2C 9H6N3K 0L8R1A 0M7N2G 1L8L8L 6G1R1A 2B3V1C 9K7
N8K 0M7N2G 1L8V7D 8L9Q2C 9H6N3K 0L8R1A 0M7N2G 1L8L8L 6G1*Not actual screen shots of inputs or postal code responses; created for illustrative purposes only
OUTPUT*: OUTPUT:
Learning: Plan Output Before InputPostal Code vs City Name: Free text vs Discrete Choice Input
ORIGINAL DATA INPUT*: REVISED DATA INPUT*:

Years in Canada: Open ended comment box vs forced choice
ORIGINAL DATA INPUT*: REVISED DATA INPUT*:
“1978”“At 10 years old”“01 January 2003”“In childhood”“1996”“2007”“2013”“I can’t recall”“Last year.”“5 years ago”
OUTPUT*:
25
2015
25
10
Years in Canada
0 to 5 5 to 10 10 to 15 15 to 20 20 +
*Not actual screenshots of inputs or actual responses; created for illustrative purposes only
OUTPUT*:
Learning: Plan Output Before Input

Technology Data• Full VCES collects information on:
• Where you accessed the appointment from.
• What online platform/software you used to access your appointment.
• What type of device you used to access your appointment.
• How comfortable you are with technologyin your daily life.

Question 11: Where did you access the virtual mental health and/or addiction appointment from?
75.76%
21.2%
3.03%
Home Healthcare Organization Other
Question 13: What type of device did you use to access the virtual mental health and/or addiction appointment?
9.09%
48.48%
42.42%
Tablet Computer Phone
Potential QI Activity: Expanding “Other” to identify community partners for program development
Learning: Expanding Helpful Input/Outputs

Question 14: How comfortable do you feel with technology in your daily life?
QI Learning:
• This population of participants is already accessing virtual supports because of pandemic; this may skew this data.
• It is important to get information on digital inclusion & who is not accessing virtual supports.
• How do you get information on who is accessing virtual services during the pandemic when that’s most of what you can offer?
• Beginning development of processes to collect this information.
• Began communicating with regional data partners.
Learning: Notice What & Who You’re Missing
Client Experiences: • Overall, participants were highly satisfied.
• Hopeful the fuller roll out to a larger population (more agency programs) will allow for more nuanced data & reveal more areas for improvement.

Question 15: For each of the following statements, please indicate if you Strongly Disagree, Disagree, Agree or Strongly Agree.*Select items from the “Ontario Perception of Care Tool for Mental Health and Addictions (OPOC-MHA).”Copyright © 2015 by CAMH.
1. It was easy to access virtual mental health and/or addiction care at this organization.
3. It was easy to book my virtual mental health and/or addiction appointment.
4. During my virtual mental health and/or addiction appointment, I was able to see the healthcare provider clearly.
5. During my virtual mental health and/or addiction appointment, I was able to hear the healthcare provider clearly.
6. I am confident that the healthcare provider at this organization and my other service providers are working as a team.
7. I feel that there was an adequate amount of time allotted for the virtual mental health and/or addiction appointment.
2. *The wait time for services was reasonable for me.
8. I felt comfortable during my virtual mental health and/or addiction appointment.
9. I believe virtual mental health and/or addiction care is just as effective as in-person healthcare.
Learning: What if your results are all positive?

Q15: Continued.
10. I was able to get a virtual mental health and/or addiction appointment sooner than an in-person healthcare appointment.
11. *I was assured my personal information was kept confidential.
12. *Staff understood and responded to my needs and concerns.
13. *I was treated with respect by program staff.
14. I received compassionate virtual mental health and/or addiction care.
15. I felt safe (emotionally and physically) during my virtual mental health and/or addiction appointment.
16. The healthcare provider spoke with me about my mental health and/or addiction in a way that I could understand.
17. *I was involved as much as I wanted to be in decisions about my treatment services and supports.
18. The healthcare provider explained to me the benefits and risks of any treatments or interventions that were recommended during my virtual mental health and/or addiction appointment.

This may sound strange, but….It may sound counter-intuitive, but we’d actually like to see LESS positiveresponses so that we can find ways to improve!
We anticipate that a more diverse range of experiences exists within our client population, and that by increasing our pool of participants, we willget a more representative sample of their satisfaction level.
19. I am confident that I will be able to follow the healthcare provider's recommendations.
20. I understand what to do if I have a mental health and/or addiction emergency following this appointment.
21. The physical location of my virtual mental health and/or addiction appointmen was convenient for me to get to.
22. Overall, I am satisfied with my virtual mental health and/or addiction appointment.
Q15: Continued.
… if your results are all positive, keep digging!
Preliminary Statistical Analysis• Lean Six Sigma Black Belt tools
• Experimented with running statistical analysis tools designed to output correlation calculations and illustrative scatterplots
• Learned we were able to investigate correlations between responses to different VCES items
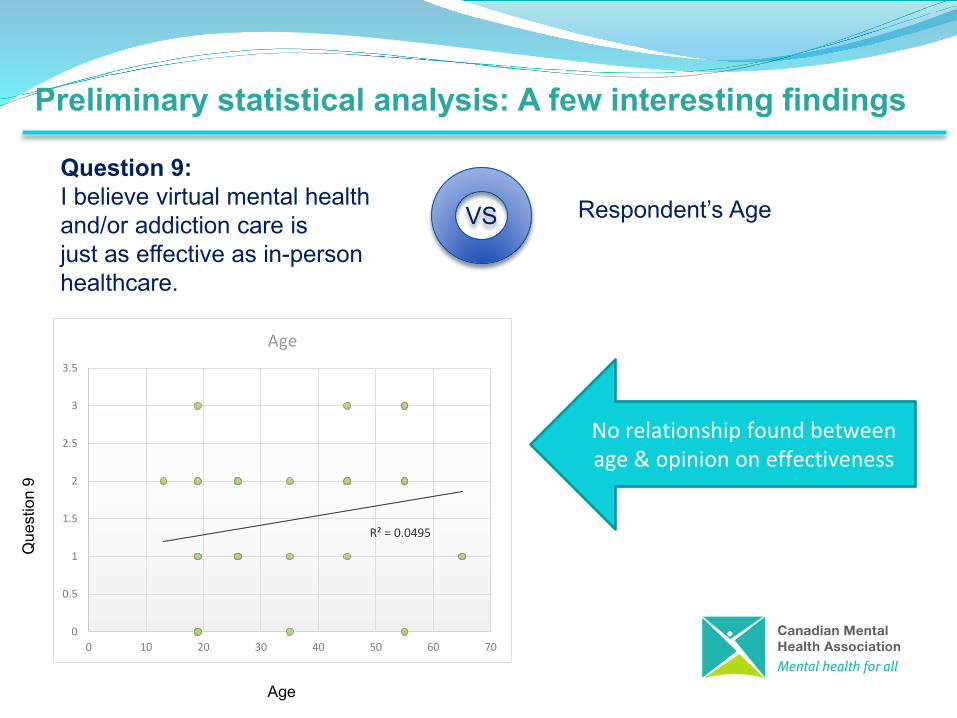
Preliminary statistical analysis: A few interesting findings
R² = 0.0495
0
0.5
1
1.5
2
2.5
3
3.5
0 10 20 30 40 50 60 70
Age
No relationship found between age & opinion on effectiveness
Age
Que
stio
n 9
VS
Question 9: I believe virtual mental health and/or addiction care is just as effective as in-person healthcare.
Respondent’s Age

Significant correlation between feeling
understood and responded to & perceived ability to follow through on staff’s
recommendations. R² = 0.425
0
0.5
1
1.5
2
2.5
3
3.5
0 0.5 1 1.5 2 2.5 3 3.5
12. *Staff understood and responded to my needs and concerns.
Que
stio
n 19
Question 12
VS
Question 19: I am confident that I will be able to follow the healthcare provider’s recommendations
Question 12: Staff understood and responded to my needs and concerns.

Weak correlation between feeling safe and perceived ability to follow through on staff’s recommendations.
R² = 0.3609
0
0.5
1
1.5
2
2.5
3
3.5
0 0.5 1 1.5 2 2.5 3 3.5
15. I felt safe (emotionally and physically) during my virtual mental health and/or
addiction appointment.
Que
stio
n 19
Question 15
VS
Question 19: I am confident that I will be able to follow the healthcare provider’s recommendations
Question 12: I felt safe (emotionally and physically) during my virtual health and/or addiction appointment
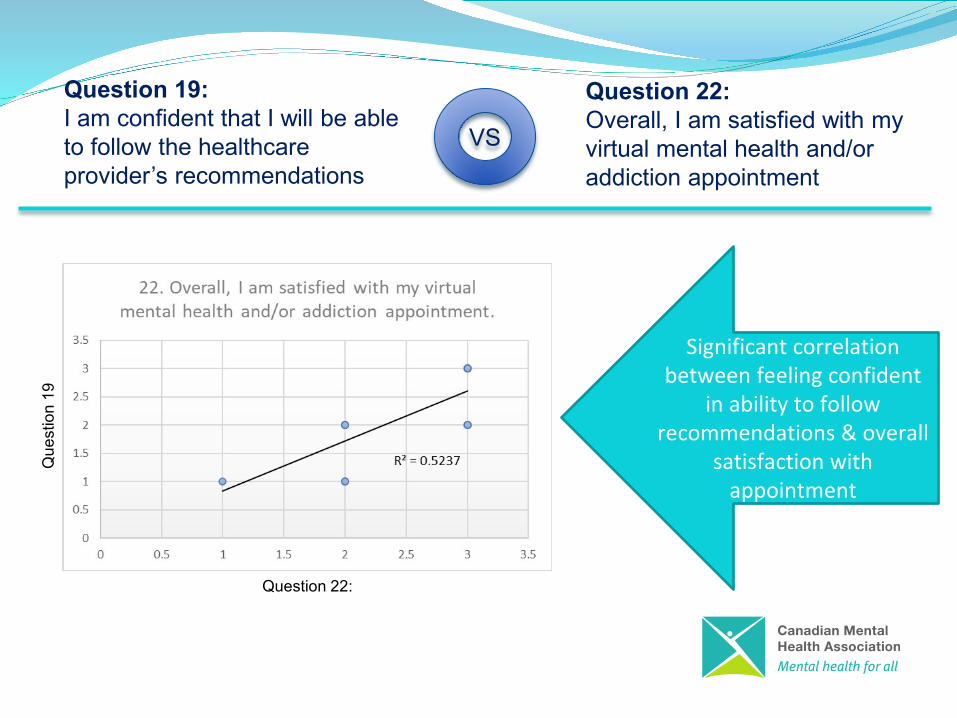
Significant correlation between feeling confident
in ability to follow recommendations & overall
satisfaction with appointment
Que
stio
n 19
Question 22:
VS
Question 19: I am confident that I will be able to follow the healthcare provider’s recommendations
Question 22: Overall, I am satisfied with my virtual mental health and/or addiction appointment

• Again, data input matters: For statistical analysis, text questions must be converted to/coded as numbers
• It’s easier to have this be an automated input, rather than manually code afterward
Learning: Planning for Statistical Analysis
StronglyDisagree
Disagree Agree Strongly Agree
1 2 3 4

• You can run literally thousands of correlations: choose potential research questions wisely.
• Challenging Stereotypes: Further data on age and comfort with technology to see if lack of correlation is accurate.
• Supporting Newcomers: Is there a correlation between how long you’ve been in Canada and your satisfaction with virtual supports?
• Health Equity: Do diverse communities have different experiences of virtual supports?
Learning: Planning for Statistical Analysis
• Be open to surprises: the data may suggest unexpected research questions.

Next Steps:
QI Activities broadly summarized into themes:
• Changing data inputs to allow for more effective and efficient data collection and analysis.• Creating a process to consistently and accurately collect “n”• Strategically planning communications with staff to maximize the number of responses.• S.M.A.R.T. Research Questions:
• Mindfully crafting targeted research questions, especially around demographics and health equity, to be able to hone in on which correlations to run.
• Removing and/or adding questions to tailor our data set to our research questions.• Reviewing the revised processes with Lived Experience to
ensure continued attention to person-centered values. • Creating complimentary data collection projects to gather information
on digital inclusion & staff experiences delivering virtual supports.
Anticipated Outcome: Collect more diverse client experience data which will help define QI targets for changes virtual program delivery to increase client satisfaction.
QI Comes First: Prior to second implementation, we will be implementing over 20 quality improvement ideas to survey items and collection process;
May 2021: Roll out the survey to a wider number of programs to increase our data pool.

Thank you!Thank you for your time and your support of Quality Improvement!