Embed Size (px)
Citation preview
USING A TRACER GAS TO QUANTIFY SEALING EFFECTIVENESS FOR ENGINE REALISTIC RIM SEALS
Kenneth Clark, Michael Barringer, and Karen Thole Department of Mechanical and Nuclear Engineering
The Pennsylvania State University University Park, PA, USA
Carey Clum, Paul Hiester, Curtis Memory, and Christopher Robak Pratt and Whitney
East Hartford, CT, USA
ABSTRACT As overall pressure ratios increase in gas turbine engines,
both the main gas path and cooling temperatures increase
leading to component durability concerns. At the same time
effective use of the secondary air for both cooling and sealing
becomes increasingly important in terms of engine efficiency.
To fully optimize these competing requirements, experiments at
engine-relevant conditions are required to validate new designs
and computational tools. A test turbine has been commissioned
in the Steady Thermal Aero Research Turbine (START) lab.
The test turbine was designed to be a 1.5 stage turbine
operating under continuous flow simulating engine-relevant
conditions including Reynolds and Mach numbers with
hardware true to engine scale. The first phase of research
conducted using the test turbine, which was configured for a
half-stage (vane only), was to study hot gas ingestion through
turbine rim seals.
This paper presents a series of facility benchmarks as well
as validation experiments conducted to study ingestion using a
tracer gas to quantify the performance of rim seals and purge
flows. Sensitivity studies included concentration levels and
sampling flow rates in flow regimes that ranged from stagnant
to compressible depending upon the area of interest. The
sensitivity studies included a range of purge and leakage flow
conditions for several locations in the rim seal and cavity areas.
Results indicate reasonable sampling methods were used to
achieve isokinetic sampling conditions.
INTRODUCTION
Secondary air bled from the compressor is required to cool
components in the hot section of a gas turbine engine. These
components are exposed to temperatures that can degrade the
components and lead to durability concerns. Frequent
maintenance is costly and undesirable, so cooling air must be
provided to the hot section of the engine. Additionally, the
cavities between the rotating and stationary components
typically do not feature the advanced cooling technologies seen
in main gas path hardware; however, hot gas can be ingested
into these cavities leading to high temperatures. Some of the
secondary air is provided to the cavities to seal or purge the
ingested hot gas. Although some secondary air is required for
cooling and sealing in a gas turbine, the excessive use of
secondary air negatively impacts the efficiency of the engine.
As the bypass ratios of aircraft engines increase the fans
get larger accelerating more air and the core mass flow rate
decreases. To drive the fan the overall pressure ratio increases,
leading to higher turbine inlet and cooling air temperatures.
Sealing the turbine rim cavities is increasingly important as
engine core diameter decreases. Absolute clearances remain
consistent, but relative rim seal clearances increase resulting in
significant ingestion. To purge the rotor-stator cavities more
secondary flow is required. It is thus critical to quantify the
sealing effectiveness of rim seal geometries used in decreasing
engine core sizes.
Quantifying the sealing effectiveness in actual engines is
challenging given the high temperatures and the complexity of
the flow. The high temperatures in engines can cause sensors to
fail so detailed and reliable measurements in the engine are
difficult. Conductive heat transfer in the metal turbine
components also confounds effectiveness measurements.
Frictional heating in the cavities can increase the air and disk
temperatures further complicating effectiveness measurements.
Sealing effectiveness is the quantification of how well a
rim seal prevents main gas path air from being ingested into the
Proceedings of ASME Turbo Expo 2016: Turbomachinery Technical Conference and Exposition GT2016
June 13 – 17, 2016, Seoul, South Korea
GT2016-58095
1 Copyright © 2016 by ASME

cavities. For the stated reasons most sealing effectiveness
studies use a tracer gas to quantify sealing effectiveness. The
use of a tracer gas allows for the direct measurement of the
equivalent of the adiabatic wall temperature in the rim seals and
cavities thereby negating conductive effects. This paper
presents a method for using CO2 as a tracer gas to quantify the
sealing effectiveness and for tracing the secondary flows in a
realistic rim seal and rim cavity. Although using CO2 as a tracer
gas is a common method for quantifying sealing effectiveness,
this paper is unique in that it explicitly describes both the
method as well as provides several validation experiments in
the rim cavity and rim seal of an engine realistic vane at engine
relevant Reynolds and Mach numbers.
NOMENCLATURE b hub radius
c gas concentration
Cx axial chord length
ε c concentration effectiveness ((𝑐 − 𝑐∞)/(𝑐𝑠 − 𝑐∞)) ε c,s vane plenum supply concentration effectiveness
((𝑐1𝑉𝑃 − 𝑐∞)/(𝑐𝑠 − 𝑐∞)) h height
mmfg mfg leakage flow based on full span turbine flow rate
mpurge purge flow based on full span turbine flow rate
msec,air secondary air supply mass flow rate
μ dynamic viscosity
p, pt static and total pressure r radius
ρ fluid density Rex vane exit axial Reynolds number s spacing sc seal clearance S/Smax percent wetted surface distance Tt total temperature V velocity
Subscripts and Abbreviations 1V, 1VP first vane, first vane plenum avg indicates an average quantity
ex indicates a turbine exit parameter
in indicates a turbine inlet parameter ∞ indicates a main gas path parameter mfg mate face gap rc rim cavity rs rim seal
REVIEW OF LITERATURE A variety of methods exist in the literature for studying
turbine rim seals, particularly in quantifying hot gas ingestion.
Qualitative measurements of ingestion, such as pressure and
flow visualization, have been used to provide evidence of
ingestion behaviors. Pressure measurements, for example, were
used by Phadke and Owen [1] to determine if ingress or egress
occurred across a turbine rim seal, which agreed well with
companion flow visualization that was used to determine the
flow rate at which no ingestion occurred.
Quantitative measurements of sealing effectiveness have
been made, similar to this study, by seeding the secondary flow
with a tracer gas such as CO2. When the CO2 fraction in the
secondary flow is low, the assumptions of the heat and mass
transfer analogy hold, namely that the turbulent Schmidt
number is approximately equal to the turbulent Prandtl number,
as described by Graber, et al. [2]. Gentilhomme [3] highlighted
the use of CO2 over other gases due to its high light absorption
coefficient, leading to accurate concentration measurements by
gas analyzers.
Many studies have since used CO2 to quantify the rim seal
performance, but the fraction of CO2 in the secondary supply
has varied between researchers. The molecular weight of CO2 is
higher than that of air, but as stated by Graber, et al. [2] “the
overwhelming dominance of turbulent mixing over molecular
diffusion in the rim seal” justifies the use a tracer gas with a
slightly higher molecular weight. The authors have found that
the fraction of CO2 used for rim seal studies has varied from
1% [4–6] to as high as 30% [7], with various fractions in
between [8–10]. Although some of the studies cited provided a
schematic of the sampling system, no mention was made with
regards to the sampling flow rates used.
A few investigations explicitly mentioned the importance
of sampling method, at isokinetic conditions. In addition to the
qualitative measurements described previously, Phadke and
Owen provided quantitative measurements of ingestion through
the use of a tracer gas [1]. The mainstream flow was seeded
with 100 ppm of nitrous oxide and gas samples were extracted
from within the cavity to determine the flow rate required to
seal the cavity. The sampling flow rate was adjusted to achieve
isokinetic sampling conditions as validated through
experiments outside of the rim seal test rig. Their experiments
showed that increasing the sampling flow rate up to four times
the isokinetic value kept concentration measurement errors
within ±3% [1].
Using a tracer gas is a powerful technique to quantify
sealing effectiveness and the literature contains several other
studies that use this method. These studies provide many
insights into the performance of rim seals and the physics
governing ingestion. Most of the tracer gas studies, however, do
not explicitly describe the sampling methods and the validation
of those methods. This paper presents a description and
validation of using CO2 as a tracer gas to quantify sealing
effectiveness in an engine realistic turbine rim seal. The
sampling method is explicitly described with an emphasis on
achieving isokinetic sampling conditions, where isokinetic
sampling is defined as drawing gas samples at the same kinetic
conditions, or velocity, as the flow from which it is drawn. This
paper also presents a discussion of the overall facility, test
turbine, and instrumentation used for these studies.
TEST FACILITY AND TEST TURBINE The experiments described in this paper were performed in
a facility described in full by Barringer, et al. [12] with a brief
description provided in this paper. Both the test facility and test
turbine are described in this section.
2 Copyright © 2016 by ASME

Facility Description
The facility used for these experiments was a high
pressure, steady state, open loop flow path capable of
simulating engine relevant conditions using engine hardware
for the test turbine. An overview of the facility is shown in
Figure 1. The air was directed through the flow path with a 1.1
MW (1500 hp) industrial compressor capable of providing the
conditions given in Table 1. The research presented in this
paper was for a test turbine with half span airfoils, which
required only one of the two available compressors. A second
identical compressor will be used in future tests with full-span
airfoils. Because the focus of this paper was on the platform,
rim seal, and rim cavity, half-span airfoils were justified. The
success of test turbines with short span airfoils for studying rim
seal performance has been demonstrated in several previous
studies [4–6, 9, 10, 13].
The compressor discharge air was sent to a large settling
chamber located upstream of the turbine test section as shown
in Figure 1. The settling chamber contained a series of baffles
and screens, which were followed by a 20:1 contraction to
ensure uniform flow and thermal profiles enter the test turbine.
Upon exiting the turbine, deswirler vanes straightened the flow
and minimized losses before entering the downstream settling
chamber. The turbine exit flow was eventually sent to an
exhaust silencer on the roof of the laboratory. The flow control
valves and by-pass loop were designed to allow steady control
of the turbine inlet pressure, turbine exit pressure, and the main
gas path flow rate. In the event of an emergency shut-down,
fast-acting valves divert the air through the bypass loop.
The facility instrumentation included flow meters, several
resistance temperature devices and pressure transducers to
monitor facility operating conditions from the control room, as
indicated in Figure 1. The main gas path flow rate was
redundantly measured by large venturi flow meters both
upstream and downstream of the test section. A programmable
logic control (PLC) system was used to set the operating
conditions for the test facility from the control room.
A portion of the compressor discharge air was directed to
the secondary air system to supply the purge and leakage flows
in the turbine test section. The secondary air passed through a
heat exchanger that cools the compressor discharge air from
395 K (250°F) to 283 K (50°F). Downstream of the heat
exchanger, a moisture separator and filter removed condensate
from the flow.
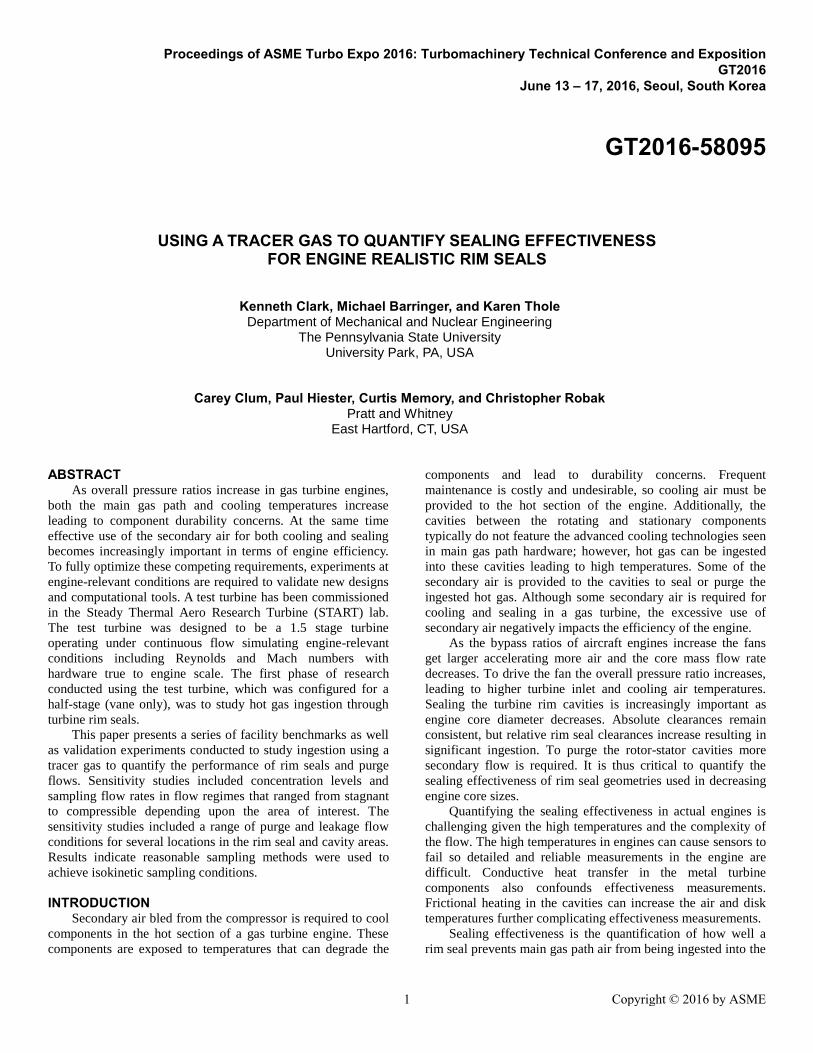
Test Turbine Description
The test turbine design was a 1.5 stage (vane-blade-vane)
at true engine scale with half-span airfoils, as was previously
mentioned. For the validation experiments presented in this
paper, only the first vane was present. The rotor was replaced
with a static rim seal and rim cavity aft of the vanes, and the
second vanes were replaced with inner and outer casings.
Figure 2 shows a cross-section of the half stage turbine. The
first vane doublets were additively manufactured by a metal
laser sintering process of an Inconel alloy. Quantified
inspections of the first vane doublets showed good agreement
between the vane throat gaps with less than ±0.3% deviation
from the design gap width.
Geometric parameters of the rim seal and cavity are
defined in Figure 3. The colored areas clearly define the areas
that we refer to as the trench, rim seal, and rim cavity. The two
leakage flow paths, including the purge flow from discrete
holes and the mate face gap flow from gaps between the vane
doublets, are also clearly indicated in Figure 3. Note that there
was no downstream blade in these studies. Future studies will
include the full 1.5 turbine stages.
The vane purge and leakage flows were designed such that
each could be independently flowed and measured. The
secondary air supply entered the test turbine at the inner
diameter through five flexible hoses. Each hose connected to an
internal manifold that contained three successive baffle plates
to ensure the secondary air uniformly entered the first vane
plenum. The first vane plenum supplied the secondary air purge
and leakage flows associated with the vane. As designed in the
engine, the mate face gap leakage flow for each vane doublet
was simulated by flow passing from the vane plenum to the rim
seal through the mate face gap. The purge flow provided air to
the rim cavity through discrete holes that acted to seal the
cavity. For the studies reported in this paper, 150 purge holes
uniformly distributed around the circumference were used.
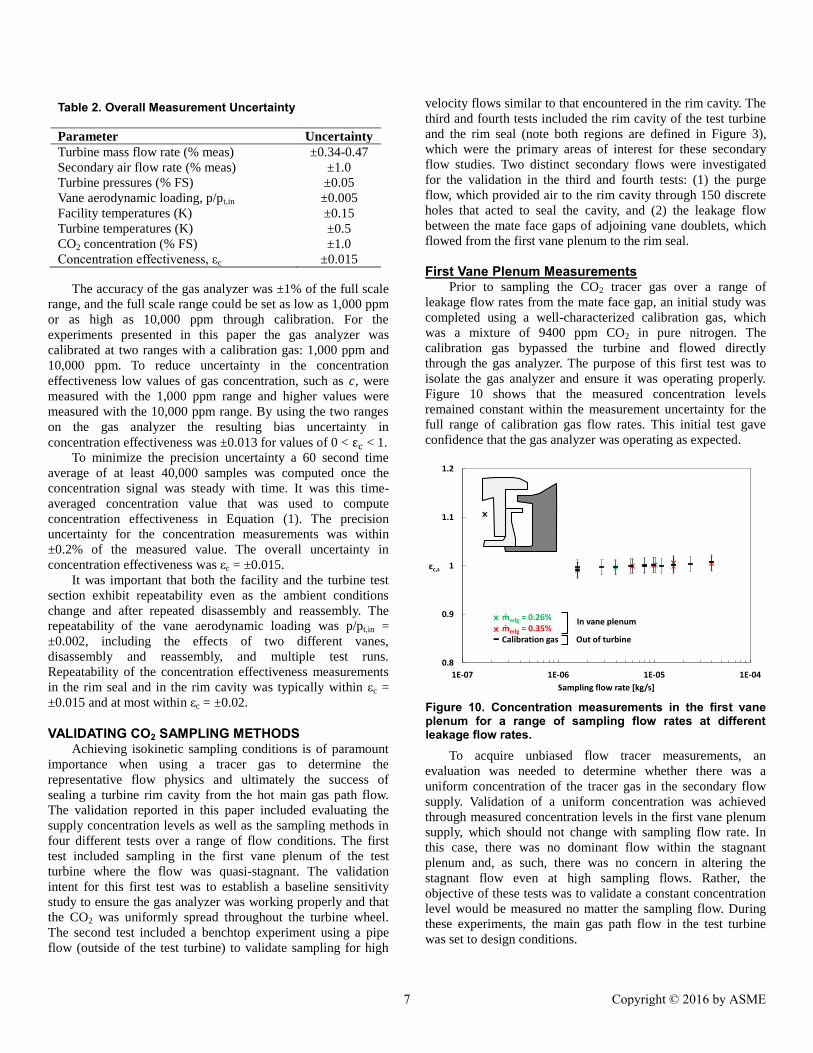
Figure 4 shows the instrumentation in the turbine test
section with an inset image showing the circumferential
arrangement. The instrumentation is distinguished by different
Figure 1. START facility layout.
Table 1. START Facility Operating Conditions
Parameter Value
Compressor discharge pressure 480 kPa
Compressor discharge temperature 395 K
Compressor mass flow rate (single) 5.7 kg/s
Vane exit Mach number 0.7
Vane exit Reynolds number* 6X10
5
* based on vane exit velocity magnitude
3 Copyright © 2016 by ASME
symbols, and groups of similar instrumentation are
distinguished by colors. The two large circles on the inset
image indicate the main gas path annulus, and the colored
symbols are located at the approximate radial and
circumferential locations corresponding to that instrumentation
group. The open symbols are not shown on the inset image as
they are spread circumferentially throughout the test section.
Kiel pressure probes were used to measure the turbine inlet
total pressure, the first vane plenum pressure, and the total
pressure in the rim cavity and trench regions as indicated in
Figure 4. To reduce aerodynamic blockage the kiel pressure
probes were small, with a 1.6 mm diameter kiel head and a 0.5
mm diameter sensing tube. Kiel temperature probes were
integrated into the first vane leading edge on six vanes around
the annulus. Three vanes had temperature probes at 10%, 50%
and 90% spans, and three vanes had temperature probes at 30%
and 70% span for a total of 15 total temperature measurements
at the turbine inlet.
Since additive manufacturing was used for the vanes,
instrumentation was directly integrated into the vanes. Pressure
taps were used for two purposes: static pressure and
concentration measurements. Six vanes spaced around the
annulus were designed with static pressure taps on the airfoil
surfaces as indicated in Figure 4. The pressure taps on the
airfoil surface had a diameter of 0.5 mm, and were located
around the airfoil on both the pressure and suction surfaces for
airfoil loading measurements. Two vanes had taps at 10% span,
two vanes had taps at 50% span, and two vanes had taps at 90%
span for a total of nearly 80 integrated static pressure taps on
six different vanes spaced around the annulus. Flow and
leakage tests ensured that no leakages or cross-talk between
pressure taps or internal tubes existed in the hardware. Two
vane doublets each had pressure taps concentrated in the vane
hub trailing edge, the platform trailing edge, and on the stator
side of the rim seal with a diameter of 0.5 mm, which were
again made possible through additive manufacturing.
There were additional pressure taps with a diameter of 0.5
mm on the stator side of the rim cavity, as indicated in Figure 4,
which were circumferentially located near the rim seal taps.
The pressure taps on the rotor side of the rim seal and cavity
were spread circumferentially throughout the test section and
had a diameter of 0.9 mm. On the rotor side of the rim cavity
there were taps at the same circumferential locations as the
stator side taps. Additionally there were pressure taps and
sampling probes spread throughout the rim seal at various axial
locations. The sampling probes, indicated by the triangles in
Figure 4, were rigid tubes of 1 mm diameter that extended from
the rotor side into the flow in both the rim seal and rim cavity.
Purge and Leakage Flow Rates
In this paper several of the figures contain data
corresponding to various purge or leakage flow rates. It is
important to note that the flow rates presented in these figures
were normalized as a percent of the full span turbine inlet mass
flow rate rather than the half span turbine inlet mass flow rate.
Although half span airfoils were used in this study, the results
were more directly comparable to operating turbines by using
the full span mass flow percentages. As such, the full span mass
flows were used as the reference.
Figure 2. First vane only test turbine cross-section.
Main gas path(MGP)
First Vane
Secondary air supply
hoses Baffle plates
First vane plenum
(1VP)
Figure 3. Test turbine nomenclature and geometric parameter definitions.
h/b=0.03
sc/b=0.01
s/b=0.03
s/b=0.04
First Vane
Plenum(1VP)
Rim cavity(RC)
Trench
Rim seal (RS)
Mate face gap leakage
Purge
b
r/b=0.88
Rotor side
Stator side
Figure 4. Test turbine instrumentation.
Kiel pressure probeStatic pressure tapSampling probeTotal temperature
MFG
Purge
Airfoil surface tapsKiel temperature probesKiel pressure probesRim seal tapsRim cavity tapsVane plenum TC’sVane plenum probes
Instrumentation type
Circumferential arrangement
Rotor sideStator
side
4 Copyright © 2016 by ASME

FACILITY AND FIRST VANE BENCHMARKING Extensive benchmarking experiments were performed for
the facility and the test turbine. The facility was designed to
operate in a steady state mode and has been shown to hold
pressure and temperature for over 10 hours. Thermal steady
state was reached in the turbine within two hours.
The facility valves were designed to allow independent
control of the vane inlet pressure, vane exit pressure, and the
main gas path flow rate thereby providing a range of Reynolds
and Mach number operating conditions. The operating range of
the facility for this test turbine in terms of the vane exit Mach
number and the Reynolds number based on the vane exit
conditions is shown in Figure 5. Note that the vane exit
Reynolds number in Figure 5 was based on the vane exit
velocity magnitude.
Circumferential uniformity was achieved in the test section
as indicated by a variety of measurements. Figure 6 shows the
turbine inlet total temperature profile for a typical test. As
shown in the inset image in Figure 4 the measurements were
obtained at five spanwise locations across six vanes spaced
around the annulus. The circumferential uniformity of the inlet
total temperature profile were all within the uncertainty at each
spanwise location. Although not shown, the turbine inlet total
pressure also exhibited circumferential uniformity. Regarding
the inlet total pressure, the standard deviation between the four
measurements was typically less than ±0.02% of the measured
value, which was less than half the measurement uncertainty of
±0.05%.
The aerodynamic loading on the first vane was measured
on two vanes at 50% span as shown in Figure 4. The agreement
of the data between the different vanes exhibited excellent
circumferential uniformity. The data agreed well with each
other, indicating a circumferentially uniform flow through the
first vanes. Similar circumferential uniformity was also
observed at 10% and 90% spans. Additionally the CFD pre-test
predictions, which were generated before running the
experiments, and the data agreed well, instilling confidence in
both the CFD and the data.
CO2 INSTRUMENTATION AND DATA ACQUISITION The objective of this paper is to validate the use of CO2 as
a tracer gas while ensuring that the flow field is not altered as a
result of the sampling. This section describes the concentration
effectiveness definition used in this paper, the tracer gas
injection system, the sampling system, and the CO2 gas
analyzer.
Gas concentration effectiveness, defined in Equation (1), is
used in this paper to characterize rim seal performance.
εc =𝑐 − 𝑐∞𝑐𝑠 − 𝑐∞
(1)
where c is the CO2 molar concentration, and the subscripts ∞
and s correspond respectively to the main gas path and the
secondary air supply. It is important to note that the main gas
path CO2 is subtracted such that a value of εc = 1 denotes no
ingestion (fully sealed), and a value of εc = 0 denotes full
ingestion (negligible sealing flow).
Figure 5. Range of operation for these measurements.
0.0
0.2
0.4
0.6
0.8
1.0
0 1 2 3 4 5 6 7 8
Vane exit
Mach number
Rex=ρ∞CxV
μ∞ vane exit
Vane exit Reynolds number (X105)
Figure 6. Turbine inlet total temperature.
Figure 7. Circumferential uniformity of the first vane aerodynamic loading at 50% span.
0.5
0.6
0.7
0.8
0.9
1.0
0.0 0.2 0.4 0.6 0.8 1.0
p/pt,in
Percent wetted distance, S/Smax
CFDVane AVane B
5 Copyright © 2016 by ASME

The molecular weight of CO2 is higher than that of air, but
when used in small quantities the resulting gas mixture is very
similar to air allowing for the heat and mass transfer analogy to
hold. Highly accurate measurements of low CO2 concentrations
are made possible by gas analyzers, which require only small
concentrations in the secondary air supply. CO2 is also used
because it is noncorrosive and nontoxic in small concentrations.
The CO2 injection and test turbine sampling system are
shown in Figure 8. To ensure a uniform supply concentration,
𝑐𝑠, the CO2 was injected into the secondary air far upstream of
the turbine test section. The mass flow rate of the secondary air
supply was measured with a turbine flow meter, and the CO2
flow rate was set using a mass flow controller such that the
supply gas concentration, 𝑐𝑠, is 10,000 parts per million (ppm),
or 1%. The mass flow controller held the CO2 mass flow rate to
within ±1% of the set point ensuring the secondary air supply
concentration remained constant over the duration of the test.
Measurements of CO2 concentration at four circumferential
locations in the first vane plenum are shown in Figure 9 for two
different mate face gap leakage flows. The measurement
locations are shown in Figure 4 as the vane plenum probes. The
concentration was also measured in the secondary air supply
plenum shown in Figure 8. Figure 9 shows the raw
concentration signal from the gas analyzer with time. The
sampling system was used to cycle through the upstream
secondary air supply plenum, and then each of the vane plenum
probes spaced around the annulus. The vertical height of the
boxes in Figure 9 indicates the bias uncertainty. The
measurements in the vane plenum all agreed with each other
within 0.2% and with the secondary air supply plenum within
0.2%. The data shown in Figure 9 indicate steady
measurements were achieved as well as uniform mixing of the
CO2 with the secondary air before entering the turbine and the
rim cavity.
Continuous gas samples were extracted through the static
taps and then routed to a gas analyzer where the CO2
concentration was measured. The main gas path concentration,
𝑐∞, was measured through a kiel pressure probe at the turbine
inlet, and the secondary air supply concentration, 𝑐𝑠, was
measured through the first vane plenum probes shown in Figure
4. Gas samples were extracted through pressure taps and
probes, shown at various locations in the rim seal and rim
cavity in Figure 4, to characterize concentration effectiveness
throughout the turbine. A sampling system allowed a single gas
sample to flow through the gas analyzer, and a mass flow
controller held the gas sampling flow rate to within ±1% of the
set point. The sampling flow rate was varied using the mass
flow controller to determine the conditions at which isokinetic
sampling was achieved, which will be further discussed later in
the paper.
The gas analyzer used infrared molecular absorption band
sensors to measure the CO2 concentration. The infrared
absorption bands of CO2 overlap with those of other molecules,
but the gas analyzer achieved highly accurate CO2
concentration measurements by using an infrared beam divider
and a double-layer detector, which minimized the effects of
absorption wavelengths overlapping with other species.
Continuous flow was sent to the gas analyzer, which output an
analog voltage corresponding to the CO2 gas concentration.
UNCERTAINTY AND REPEATABILITY
The overall uncertainty of the facility and test turbine
measurements is given in Table 2, as calculated from the
instrument bias error and the precision error according to the
method of [14]. Precision uncertainty was typically low for the
measurements due to the steady state capability of the facility.
The facility venturi flow meters and the adjoining pipes
were calibrated by a commercial laboratory to within ±0.34-
0.47% of the measurement across the full range. The rated
accuracy of the electronic pressure scanner transducers was
±0.05% of full scale (FS), with ranges of 35, 100, 200 and 350
kPa. A pressure calibration system was used daily to perform
calibration checks and, if necessary, calibrations of the pressure
scanner system.
Figure 8. CO2 injection and test turbine sampling system.
CO2
RegulatorMass Flow Controller
Secondary Air Supply
Sampling System
Mass Flow Controller
C8 ~0
Cs=1%
Gas Analyzer, C
Turbine Flow Meter
Plenum
Figure 9. Uniformity of seed concentration in first vane plenum for (a) mate face gap leakage ṁmfg = 0.35% and (b) mate face gap leakage ṁmfg = 0.15%.
8000
8500
9000
9500
10000
0 2 4 6 8 10
Secondary air supply plenum
Vane B
Vane plenum probes
Vane A
Vane C
Vane D
8000
8500
9000
9500
10000
0 2 4 6 8 10Time [min]
Secondary air supply plenum
Vane B
Vane plenum probes
Vane A
Vane C
Vane D
(a)
(b)
CO2
[ppm]
CO2
[ppm]
6 Copyright © 2016 by ASME
The accuracy of the gas analyzer was ±1% of the full scale
range, and the full scale range could be set as low as 1,000 ppm
or as high as 10,000 ppm through calibration. For the
experiments presented in this paper the gas analyzer was
calibrated at two ranges with a calibration gas: 1,000 ppm and
10,000 ppm. To reduce uncertainty in the concentration
effectiveness low values of gas concentration, such as 𝑐, were
measured with the 1,000 ppm range and higher values were
measured with the 10,000 ppm range. By using the two ranges
on the gas analyzer the resulting bias uncertainty in
concentration effectiveness was ±0.013 for values of 0 < εc < 1.
To minimize the precision uncertainty a 60 second time
average of at least 40,000 samples was computed once the
concentration signal was steady with time. It was this time-
averaged concentration value that was used to compute
concentration effectiveness in Equation (1). The precision
uncertainty for the concentration measurements was within
±0.2% of the measured value. The overall uncertainty in
concentration effectiveness was εc = ±0.015.
It was important that both the facility and the turbine test
section exhibit repeatability even as the ambient conditions
change and after repeated disassembly and reassembly. The
repeatability of the vane aerodynamic loading was p/pt,in =
±0.002, including the effects of two different vanes,
disassembly and reassembly, and multiple test runs.
Repeatability of the concentration effectiveness measurements
in the rim seal and in the rim cavity was typically within εc =
±0.015 and at most within εc = ±0.02.
VALIDATING CO2 SAMPLING METHODS Achieving isokinetic sampling conditions is of paramount
importance when using a tracer gas to determine the
representative flow physics and ultimately the success of
sealing a turbine rim cavity from the hot main gas path flow.
The validation reported in this paper included evaluating the
supply concentration levels as well as the sampling methods in
four different tests over a range of flow conditions. The first
test included sampling in the first vane plenum of the test
turbine where the flow was quasi-stagnant. The validation
intent for this first test was to establish a baseline sensitivity
study to ensure the gas analyzer was working properly and that
the CO2 was uniformly spread throughout the turbine wheel.
The second test included a benchtop experiment using a pipe
flow (outside of the test turbine) to validate sampling for high
velocity flows similar to that encountered in the rim cavity. The
third and fourth tests included the rim cavity of the test turbine
and the rim seal (note both regions are defined in Figure 3),
which were the primary areas of interest for these secondary
flow studies. Two distinct secondary flows were investigated
for the validation in the third and fourth tests: (1) the purge
flow, which provided air to the rim cavity through 150 discrete
holes that acted to seal the cavity, and (2) the leakage flow
between the mate face gaps of adjoining vane doublets, which
flowed from the first vane plenum to the rim seal.
First Vane Plenum Measurements Prior to sampling the CO2 tracer gas over a range of
leakage flow rates from the mate face gap, an initial study was
completed using a well-characterized calibration gas, which
was a mixture of 9400 ppm CO2 in pure nitrogen. The
calibration gas bypassed the turbine and flowed directly
through the gas analyzer. The purpose of this first test was to
isolate the gas analyzer and ensure it was operating properly.
Figure 10 shows that the measured concentration levels
remained constant within the measurement uncertainty for the
full range of calibration gas flow rates. This initial test gave
confidence that the gas analyzer was operating as expected.
To acquire unbiased flow tracer measurements, an
evaluation was needed to determine whether there was a
uniform concentration of the tracer gas in the secondary flow
supply. Validation of a uniform concentration was achieved
through measured concentration levels in the first vane plenum
supply, which should not change with sampling flow rate. In
this case, there was no dominant flow within the stagnant
plenum and, as such, there was no concern in altering the
stagnant flow even at high sampling flows. Rather, the
objective of these tests was to validate a constant concentration
level would be measured no matter the sampling flow. During
these experiments, the main gas path flow in the test turbine
was set to design conditions.
Table 2. Overall Measurement Uncertainty
Parameter Uncertainty
Turbine mass flow rate (% meas) ±0.34-0.47
Secondary air flow rate (% meas) ±1.0
Turbine pressures (% FS) ±0.05
Vane aerodynamic loading, p/pt,in ±0.005
Facility temperatures (K) ±0.15
Turbine temperatures (K) ±0.5
CO2 concentration (% FS) ±1.0
Concentration effectiveness, εc ±0.015
Figure 10. Concentration measurements in the first vane plenum for a range of sampling flow rates at different leakage flow rates.
0.8
0.9
1
1.1
1.2
1E-07 1E-06 1E-05 1E-04
εc,s
Sampling flow rate [kg/s]
ṁmfg = 0.26%ṁmfg = 0.35%Calibration gas Out of turbine
In vane plenum
7 Copyright © 2016 by ASME

Figure 11. Benchtop experiment to validate gas sampling method with measurements in a pipe with a similar velocity to the rim cavity swirl velocity.
Shop Air Supply
CO2 Supply
Turbine Flow Meter
Mass Flow Controller Gas Analyzer
L/D=80L/D=100
Mass Flow Controller
0.8
0.9
1.0
1.1
1.2
1E-07 1E-06 1E-05 1E-04
εc
Sampling flow rate [kg/s]
D=1.6 mmD=1.0 mm
Pressure tap diameter
As previously described, Figure 9 shows the first vane
plenum concentration was uniformly mixed throughout all the
locations. As is also shown in Figure 10, a number of CO2
sampling flow rates were conducted in the first vane plenum for
two leakage flow rates through the mate face gap. The
measurement location inside the plenum is indicated by the “x”
in the Figure 10 inset image. Note that the concentration level
used for these experiments was approximately 9,000 ppm. The
results in Figure 10 were normalized and presented in terms of
the supply concentration effectiveness, c,s, as defined in the
nomenclature. Again, it was expected that these tests would
show a constant effectiveness of unity, which was indicative of
uniformly distributed CO2 tracer gas. Figure 10 shows that for
each of the leakage flows and all sampling flow rates, the
measured concentration was invariant indicating that the CO2
was uniformly distributed for the conditions of interest.
Pipe Flow Measurements The half stage turbine used in these experiments included a
static rim seal and rim cavity with no rotor as shown in Figure
3. Because of the high turning of the vane there were
significant swirl velocities that occurred in the rim cavity,
which were in the compressible flow regime [15]. As such
achieving isokinetic CO2 sampling in the rim seal area
presented yet another challenge. To ensure that the sampling
methodology held for representative compressible flow
conditions as those in the rim seal and cavity, a benchtop
experiment was used to perform sampling flow rate sensitivity
studies with compressible flow, as would occur in the rim seal
and rim cavity. Figure 11 shows a diagram of the benchtop pipe
experiment, outside of the test turbine, that was used for this
test. Similar to the turbine secondary air supply shown in
Figure 8, CO2 was injected into a pipe with flow supplied by a
compressor. The pipe had a diameter designed for the available
compressor flow to provide a mean velocity equal to the rim
cavity swirl velocity in the test turbine. In the pipe experiment,
the CO2 was completely mixed with the air supply due to the
long length of both pipes. Samples were measured using two
different diameter static pressure taps in the walls of the pipe to
also determine the sensitivity to the tap diameter. Figure 11
shows there was no change in the measured concentration for
varying the sampling flow rate or the pressure tap diameter to
within the measurement uncertainty. These results showed that
even in a compressible flow, as long as concentration was
uniform, the measured concentration was constant with
sampling flow rate.
Rim Cavity Measurements The purpose of the first validation study performed in the
cavity was to determine the sensitivity of the concentration
effectiveness measurements to the secondary air supply CO2
concentration. Figure 12 shows the concentration effectiveness
measurements for three levels of supply concentration for a low
and a high purge flow rate at four locations as indicated in the
inset image. The concentration effectiveness measurements at
all conditions in the figure were insensitive to the supply
concentration. The uncertainty of the measurements increased
as supply concentration decreased. A secondary air supply CO2
concentration of 10,000 ppm was used for all experiments to
reduce the uncertainty.
Because the flow field in the rim cavity was quite complex,
it was also important to verify isokinetic sampling could be
achieved using the CO2 tracer gas for both the mate face gap
leakage flow and the purge flow. The mate face gap leakage
flow results are shown first and the purge flow results follow.
Figure 3 shows the injection location and the area defined as
the rim cavity. For all of the rim cavity experiments, the main
gas path was present at the test turbine design conditions.
The inset image in Figure 13 shows the sampling location
was on the stator side of the cavity for the rim cavity studies of
the mate face gap leakage flow. Recall the mate face gap
Figure 12. Comparison of concentration effectiveness in the rim cavity with varying secondary air supply CO2 concentrations for two purge flow rates.
0.0
0.1
0.2
0.3
0.4
0.5
0.6
0.7
0.8
0.9
1.0
0 2000 4000 6000 8000 10000
εc
Secondary Air Supply CO2 Concentration [ppm]
ṁp = 2.7%
ṁp = 0.9%
8 Copyright © 2016 by ASME

leakage flowed through a slot between adjoining vane doublets.
Figure 13 shows the same sampling flow rates and leakage flow
rates as were used for the first vane plenum. The concentration
levels were much below unity indicating that there was
significant main gas path flow entering the turbine rim cavity.
Even though significant ingestion occurred in the rim seal, the
flow ingested from the rim seal into the rim cavity was at a
uniform concentration for a given mate face gap leakage flow
rate as indicated by the constant concentration effectiveness
levels at all sampling flow rates. As would be expected, the
concentration effectiveness levels increased with increased
mate face gap flows because better sealing occurred with
increased leakage flows. The data in Figure 13 showed that
there was no appreciable gradient in the rim cavity for the mate
face gap leakage flow. As will be presented later in the paper,
there was a gradient in the rim seal where the ingested air and
the mate face gap leakage flow were both introduced.
Figure 14 shows a sampling flow rate sensitivity performed
at several locations in the rim cavity for the purge flow to
determine the effects of sampling flow rates for the CO2 tracer
gas. The purge flow entered the rim cavity uniformly through
150 discrete purge holes as shown in Figure 3. A purge flow
rate of 0.9% of the main gas path was used for these studies.
Note that the test turbine was operated at design conditions and
there was no mate face gap flow. The inset image of the turbine
in Figure 14 contains a legend showing where each
measurement was located in the rim cavity.
The main finding in Figure 14 was that at low sampling
flows, the concentration measurements were invariant. As the
sampling flow rate increased, however, the measured
concentration effectiveness increased with sampling flow rate.
The data shown in Figure 14 suggested that at higher sampling
flow rates the sampling method influenced the flow field
thereby resulting in non-isokinetic sampling conditions. For
this test, a concentration gradient existed in the rim cavity, due
to the shear layers between the purge flow with the ingested
main gas path flow which carried only background CO2 levels.
The purge flow entered the rim cavity with a concentration
effectiveness of unity, but significant ingestion occurred that
acted to dilute the purge flow and reduce the mean
concentration in the rim cavity.
At high sampling flow rates as shown in Figure 14, the
data suggested the gas sample was not withdrawn from the flow
right at the sampling probe or tap. It is interesting to note that
the concentration levels on both the vane side of the rim cavity
and on the downstream rotor side of the cavity were both
relatively low values at isokinetic sampling conditions because
the high concentration measured at high sampling flow rates
suggested that the sampling method affected the flow field by
redirecting the purge flow toward the sampling taps.
Below a sampling flow rate of 2E-6 kg/s the measured
concentration effectiveness was constant with sampling flow
rate, indicating that the flow field was not affected by the
sampling method. For sampling taps at the walls where the no
slip condition dictates zero velocity, a sampling flow rate of
zero would correspond to perfect isokinetic sampling
conditions. In practice, there was a range over which sampling
flow rates yielded the same measured concentration as is shown
in Figure 14 up to 2E-6 kg/s, which were considered for these
studies to be isokinetic sampling conditions.
Rim Seal Measurements Similar to the rim cavity the flow field in the rim seal was
complex with regions of ingestion and flow egress. Significant
ingestion occurred in the rim seal, so a strong concentration
gradient existed, requiring a sampling sensitivity study to verify
isokinetic sampling could be achieved in the rim seal. This
section describes the effects of sampling flow rate on
concentration measurements in the rim seal for both the mate
face gap leakage flow and the purge flow. The mate face gap
leakage flow is shown first, and the purge flow follows. The
injection of both the mate face gap leakage and the purge flow
from the 150 uniformly distributed holes remained the same as
Figure 13. Concentration effectiveness measurements in the rim cavity for a range of sampling flow rates and mate face gap leakage flow rates.
0.0
0.1
0.2
0.3
0.4
0.5
1E-07 1E-06 1E-05 1E-04
εc
Sampling flow rate [kg/s]
ṁmfg = 0.35%
ṁmfg = 0.26%
ṁmfg = 0.15%
Figure 14. Comparison of measured concentration effectiveness for varying sampling flow rates in the rim cavity for purge ṁp = 0.9%.
0.0
0.1
0.2
0.3
0.4
0.5
1E-07 1E-06 1E-05 1E-04
εc
Sampling flow rate [kg/s]
9 Copyright © 2016 by ASME

was discussed in the previous two sections. The test turbine was
also operated at design conditions for these studies.
It was expected that a concentration gradient would be
present in the rim seal for the mate face gap leakage flow
resulting from the high degree of ingestion. The sampling flow
rate sensitivity of concentration effectiveness at two locations
in the rim seal for three mate face gap leakage flow rates is
shown in Figure 15. The symbol colors represent different mate
face gap leakage flow rates, and the symbols represent different
pitchwise locations in the rim seal at the same radius relative to
the mate face gap leakage slots as indicated in the inset image
in Figure 15. The triangles are located at 15% pitch, and the
diamonds are located at 40% pitch. Note that the mate face gap
leakage slot was located at 35% vane pitch in the rim seal.
Similar to the rim cavity, as shown in Figure 14, the
concentration effectiveness increased with sampling flow rate
and was constant for a sampling flow rate less than 2E-6 kg/s.
Figure 15 also shows that there was a concentration gradient
that existed in the rim seal for the mate face gap leakage flow.
Concentration gradients existed in locations where flow
was not directly injected as evidenced in Figure 16. Figure 16a
presents the sensitivity of the concentration effectiveness across
the axial gap of the rim seal in the rim cavity for a purge flow
of ṁp = 1.6%. Figure 16a shows the sampling flow rate
sensitivity for three axial locations, as indicated in the inset
image. The concentration effectiveness was again shown to be
invariant for sampling flow rates less than 2E-6 kg/s, indicating
isokinetic sampling conditions were achieved in the rim seal.
The concentration effectiveness was measured at isokinetic
sampling conditions at five axial locations at the same radius in
the rim seal and the variation is shown in Figure 16b as a
function of the axial location across the rim seal at the same
purge flow of ṁp = 1.6%. The concentration effectiveness
increased with distance from the stator side of the rim seal
suggesting three major conclusions: (1) the purge flow exited
the rim cavity and mainly stayed on the rotor side of the rim
seal, (2) the ingested main gas path flow primarily stayed on
the stator side of the rim seal, and (3) a concentration gradient
existed between the stator and rotor sides of the rim seal where
the purge and ingested flows mixed. As stated, at high sampling
flow rates the sampled flow entered the probe from all
directions, which pulled purge air from the rim cavity. The
concentration effectiveness levels in the rim cavity were also
noted in the inset image in Figure 16b. The increase in
effectiveness observed at higher sampling flow rates was likely
due to the superposed radially outward flow of the purge air as
it entered the rim seal. Higher effectiveness levels were
observed in the rim cavity than in the rim seal, indicating that
there were significant shear layers between the ingested flow
and the purge flow in the rim seal inner clearance, further
emphasizing the need for careful sampling methods.
The trend of higher effectiveness on the rotor side of the
rim seal compared to the stator side existed at a range of purge
flow rates as shown in Figure 17. Even at higher purge flows of
ṁp = 2.3% and 2.7% the concentration effectiveness on the
rotor side was higher than on the stator side indicating the
purge flow mainly stayed on the rotor side of the rim seal
across a wide range of purge flows. Repeatability of the
effectiveness measurements was also shown in the figure, and
the measurements all agreed within the uncertainty of ±0.015.
MATE FACE GAP LEAKAGE EFFECTS IN RIM SEAL Using a tracer gas, such as CO2, for flow tracing is a
powerful diagnostic tool in assessing the performance of rim
seals and identifying the representative local flow phenomena.
Given the validation studies previously described, a sampling
flow rate of 2E-6 kg/s was used to investigate the flow physics
in the rim seal region in order to achieve isokinetic sampling
conditions. CO2 tracing was used to spatially track the leakage
flow in the rim seal region for the case with a range of mate
face gap leakage flows. Concentration effectiveness levels are
given in Figure 18 at a constant radius in the middle of the rim
Figure 15. Comparison of measured concentration effectiveness for varying sampling flow rates in the rim seal for three mate face gap leakage flows.
0.0
0.1
0.2
0.3
0.4
0.5
1E-07 1E-06 1E-05 1E-04
εc
Sampling flow rate [kg/s]
ṁmfg= 0.15% 0.26% 0.35%
15% pitch
40% pitch
Vane
0% pitch100% pitch
Vane
MFG leakage slot
Figure 16. (a) Sampling flow rate sensitivity at three axial positions in the rim seal, and (b) concentration effectiveness across rim seal axial gap; both at ṁp = 1.6%.
0.0
0.1
0.2
0.3
0.4
0.5
0.6
0.7
0.8
0.9
1.0
1E-07 1E-06 1E-05 1E-04
εc
Sampling flow rate [kg/s]
0.0
0.1
0.2
0.3
0.4
0.5
0.6
0.7
0.8
0.9
1.0
0 25 50 75 100
εc
% axial gap in rim seal
(a) (b)
εc=0.66
0.87
0.850.72
10 Copyright © 2016 by ASME

seal on the stator side. The inset image in Figure 18 shows an
isometric view of the vane doublet and the rim seal. The mate
face gap leakage slots are also shown, located at 0% and 100%
pitch in the circumferential direction. Note that the swirl
direction was clockwise. Six sampling taps were spread
circumferentially through the stator side of the rim seal as
shown in the inset image by the different colors.
The data in Figure 18 indicated that there was a significant
variation in the concentration effectiveness with mate face gap
leakage flow rates and circumferential location. The
concentration effectiveness increased with the mate face gap
leakage flow rate throughout the rim seal. At higher leakage
flows the concentration effectiveness approached a constant
value with increasing mate face gap leakage flow rates
indicating that the leakage may have been choking. The mate
face gap leakage flow alone could not provide enough flow to
fully seal the rim seal from ingestion, but contributed some
effectiveness in the rim seal as indicated in Figure 18. Local
effectiveness values as high as 0.5 on the stator side of the rim
seal were shown to exist just downstream of the leakage slot.
Regarding the circumferential variation, the measured data
was consistent with the mate face gap leakage flow being
similar to a planar jet in a strong crossflow that resulted from
the swirl velocity. Similar to a jet-in-crossflow, high
concentration effectiveness levels (representing the leakage
flow) occurred just downstream of the leakage slot followed by
a decay as the distance from the leakage slot increased. At
higher mate face gap leakage flow rates the effectiveness
continued to show a variation in the circumferential direction,
but the effectiveness began to level off with increasing leakage
flow rate. The data suggested strong concentration gradients
existed in the rim seal. Curiously the effectiveness was zero for
ṁmfg = 0.1%, suggesting that the ingested hot main gas path
flow overpowered the leakage flow at low flows. The physical
mechanism for why the effectiveness was so low is not well
understood at this time, but further experiments are expected to
reveal the flow physics.
CONCLUSIONS This paper presented benchmarking and validation of the
use of a tracer gas for quantifying sealing effectiveness in an
engine realistic turbine rim seal. The commissioning and
benchmarking of the facility, test turbine, and instrumentation
were described. The focus of this paper was on the
measurement technique used to characterize rim seal
performance, which was the use of CO2 as a tracer gas in the
secondary air supply.
A high pressure, steady state, open loop turbine research
facility has been successfully commissioned, and was shown to
be capable of simulating engine relevant conditions using
engine realistic hardware. Benchmarking experiments showed
that the facility exhibited long duration steady state capability,
turbine inlet uniformity, and repeatability. The facility was also
shown to reliably simulate a range of Reynolds numbers and
Mach numbers in the turbine. The measurements described in
this paper were for a heavily instrumented half-stage (vane
only) turbine design with a realistic rim seal and rim cavity. The
successful commissioning of the test turbine was also shown,
with an emphasis on the test section uniformity, repeatability,
and agreement with CFD pre-test predictions.
The use of CO2 as a tracer gas was validated in this paper
for quantifying rim seal and purge flow performance for engine
realistic hardware at engine relevant Mach and Reynold
numbers. Careful sampling was required to ensure that accurate
concentration effectiveness measurements were obtained. In
regions where purge and leakage flows mixed with ingested
flow, the measured concentration was sensitive to the sampling
flow rate. At high sampling flow rates the concentration
measurements suggested that the sampling method could affect
the flow field. At low sampling flow rates the concentration
measurements were constant with sampling flow rate,
indicating that the flow field was not affected by the sampling
method and, as such, isokinetic sampling conditions were
achieved. For the results presented in this paper a sampling
Figure 17. Concentration effectiveness measurements on the stator and rotor sides of the rim seal for multiple purge flow rates.
0.0
0.1
0.2
0.3
0.4
0.5
0.6
0.7
0.8
0.9
1.0
0.9% 1.6% 2.3% 2.7%
εc
ṁp [%]
Rotor side, test 1Rotor side, repeat testStator side, test 1Stator side, repeat test
Figure 18. Concentration effectiveness on the stator side of the rim seal for multiple circumferential locations.
0.0
0.1
0.2
0.3
0.4
0.5
0.6
0.7
0.8
0.9
1.0
0.0 0.1 0.2 0.3 0.4
εc
ṁmfg [%]
Rim seal, 15% pitchRim seal, 29% pitchRim seal, 40% pitchRim seal, 53% pitchRim seal, 65% pitchRim seal, 78% pitch
Vane
0% pitch
100% pitch
Vane
MFG leakage slot
11 Copyright © 2016 by ASME
flow rate of 2E-6 kg/s was found to correspond to isokinetic
sampling conditions in the rim seal and the rim cavity.
CO2 tracing was proven to be a powerful method not only
for quantifying rim seal and purge flow performance, but also
for deducing flow patterns in the rim seal and rim cavity region.
Deducing flow patterns is especially important for engine
realistic hardware as the various leakage flows contribute to the
complexity of the flows in the rim seal and rim cavity. Many
rim seal performance studies consider the effects of a uniform
purge flow originating from deep with the cavity, but the
leakage flows in the rim seal and rim cavity contribute
significantly to the local concentration effectiveness where
most of the hot gas ingestion occurs. Although it is not a
designed purge flow the mate face gap leakage flow contributes
to the concentration effectiveness in a turbine rim seal.
Although the mate face gap leakage flow alone was not
sufficient to fully seal the rim seal from ingestion, the
contribution of the mate face gap leakage flow to the
concentration effectiveness in the rim seal is significant.
The data presented is also of value for benchmarking
numerical simulations since a tracer gas can also be modelled
in such simulations. The verification of numerical models for a
designer is important because purge and leakage flows need to
be accurately predicted. If insufficient flow is provided to seal
the cavity, it means there will be hardware durability issues.
Alternatively, an excess of secondary air would result in
unnecessary penalties in engine efficiency. Results from these
initial studies show the complexity of the flow pattern in the
rim seal and cavity and the importance of understanding these
flows for determining better sealing methods.
ACKNOWLEDGMENTS The authors would like to thank Pratt & Whitney and the
Department of Energy National Energy Technologies
Laboratory for sponsoring the research presented in this paper.
REFERENCES
[1] Phadke, U. P., and Owen, J. M., 1988, “Aerodynamic
aspects of the sealing of gas-turbine rotor-stator systems
Part 2: The performance of simple seals in a quasi-
axisymmetric external flow,” Int. J. Heat Fluid Flow, 9(2),
pp. 106–112.
[2] Graber, D. J., Daniels, W. A., and Johnson, B. V., 1987,
Disk Pumping Test., Aero Propulsion Laboratory, Wright-
Patterson Air Force Base, Ohio 45433.
[3] Gentilhomme, O. J. P., 2004, “Turbine Rim Seal
Ingestion,” University of Sussex.
[4] Sangan, C. M., Pountney, O. J., Zhou, K., Wilson, M.,
Michael Owen, J., and Lock, G. D., 2012, “Experimental
Measurements of Ingestion Through Turbine Rim Seals—
Part I: Externally Induced Ingress,” J. Turbomach., 135(2),
pp. 021012–021012.
[5] Sangan, C. M., Pountney, O. J., Zhou, K., Owen, J. M.,
Wilson, M., and Lock, G. D., 2012, “Experimental
Measurements of Ingestion Through Turbine Rim Seals—
Part II: Rotationally Induced Ingress,” J. Turbomach.,
135(2), pp. 021013–021013.
[6] Sangan, C. M., Pountney, O. J., Scobie, J. A., Wilson, M.,
Owen, J. M., and Lock, G. D., 2013, “Experimental
Measurements of Ingestion Through Turbine Rim Seals—
Part III: Single and Double Seals,” J. Turbomach., 135(5),
pp. 051011–051011.
[7] Palafox, P., Ding, Z., Bailey, J., Vanduser, T., Kirtley, K.,
Moore, K., and Chupp, R., 2013, “A New 1.5-Stage
Turbine Wheelspace Hot Gas Ingestion Rig (HGIR): Part I
- Experimental Test Vehicle, Measurement Capability and
Baseline Results,” ASME Turbo Expo 2013, Paper No.
GT2013-96020.
[8] Bohn, D. E., Decker, A., Ma, H., and Wolff, M., 2003,
“Influence of Sealing Air Mass Flow on the Velocity
Distribution In and Inside the Rim Seal of the Upstream
Cavity of a 1.5-Stage Turbine,” ASME Paper No. GT2003-
38459.
[9] Roy, R. P., Xu, G., Feng, J., and Kang, S., 2001, “Pressure
Field and Main-Stream Gas Ingestion in a Rotor-Stator
Disk Cavity,” ASME Paper No. 2001-GT-0564.
[10] R. P. Roy, J. F., 2005, “Experiment on Gas Ingestion
Through Axial-Flow Turbine Rim Seals,” J. Eng. Gas
Turbines Power, 127(3).
[11] Eastwood, D., Coren, D. D., Long, C. A., Atkins, N. R.,
Childs, P. R. N., Scanlon, T. J., and Guijarro-Valencia, A.,
2011, “Experimental Investigation of Turbine Stator Well
Rim Seal, Re-Ingestion and Interstage Seal Flows Using
Gas Concentration Techniques and Displacement
Measurements,” ASME Paper no. GT2011-45874.
[12] Barringer, M., Coward, A., Clark, K., Thole, K., Schmitz,
J., Wagner, J., Alvin, M. A., Burke, P., and Dennis, R.,
2014, “Development of a Steady Aero Thermal Research
Turbine (START) for Studying Secondary Flow Leakages
and Airfoil Heat Transfer,” ASME Turbo Expo 2014,
Paper No. GT2014-25570, Dusseldorf, Germany.
[13] Feiereisen, J. M., Paolillo, R. E., and Wagner, J., 2000,
“UTRC Turbine Rim Seal Ingestion and Platform Cooling
Experiments,” 36th AIAA/ASME/SAE/ASEE Joint
Propulsion Conference.
[14] Figliola, R. S., and Beaseley, D. E., 2006, Theory and
Design for Mechanical Measurements, John Wiley &
Sons, Inc.
[15] Clark, K., Barringer, M., Coward, A., Thole, K., Clum, C.,
Hiester, P., Memory, C., and Robak, C., 2016, “Effects of
Purge Distribution and Flowrates on Vane Rim Sealing,”
ASME Turbo Expo 2016, Paper No. GT2016-58098,
Seoul, South Korea.
12 Copyright © 2016 by ASME