Embed Size (px)
Citation preview

Using a PSW Approach to Identify Students with
Specific Learning DisabilitiesMilton J. Dehn, Ed.D., NCSP
Schoolhouse Educational ServicesKASP 2014
Notice of Copyright 2014
This PowerPoint presentation and accompanying materials are copyrighted by Schoolhouse Educational Services, LLC. They are not to be reprinted, copied, or electronically disseminated without written permission. To obtain permission, email [email protected].

Workshop Information Sources
• Essentials of Processing Assessment, 2nd Ed.• Children’s Psychological Processes Scale (CPPS)• Psychological Processing Analyzer (PPA)• www.psychprocesses.com• Intervention references• Presenter Contact: [email protected]

Topics
1. Processes to assess 2. Processes and academic skills3. PSW Models4. Conducting a processing assessment5. Completing the processing analysis worksheet6. Identifying processing deficits with the PPA7. CPPS overview8. Processing interventions overview

The Need for Processing Assessment
1. Part of a neuropsychological approach2. Not just for SLD but Autism, ADHD, TBI, etc.3. Neuroscience has increased our
understanding of brain-learning relationships4. A deficit in a “psychological process” is part
of federal and states’ SLD definitions5. Identification of processing deficits leads to
more appropriate & effective interventions

Working Memory Example
1. 10% of children have a WM deficit2. Of those in the bottom 10% percentiles, 80%
will have significant learning problems3. A working memory deficit predicts LD with
more than 80% accuracy4. WM predicts LD better than IQ, consistency
predicts better than discrepancy5. WM evidence-based interventions

It’s About the “Why”
1. The “why” matters2. Learning disabilities have a neurological basis3. Understanding the brain basis as to why a
student has a learning disability is important4. Identifying processing deficits is a big part of
answer the why question5. Assessment that answer some why questions
benefits the learner even without placement or interventions

Processing Assessment and RTI
1. Both value early identification2. When RTI fails, a processing deficit is
probably the cause3. Addressing processing deficits makes
academic interventions successful; example4. Much has changed/improved in regards to
processing assessment and intervention

What are Neuropsychological Processes?
1. Brain processes, operations, functions2. Whenever information is perceived, transformed,
manipulated, stored, retrieved, expressed3. Include “cognitive” processes4. Whenever we think, reason, problem-solve5. There are basic and higher level processes6. Doesn’t include knowledge or achievement7. Learning and performance depend on these processes;
they underlie academic skill acquisition8. There are social-emotional, sensory, and other processes
that are not included for SLD assessment
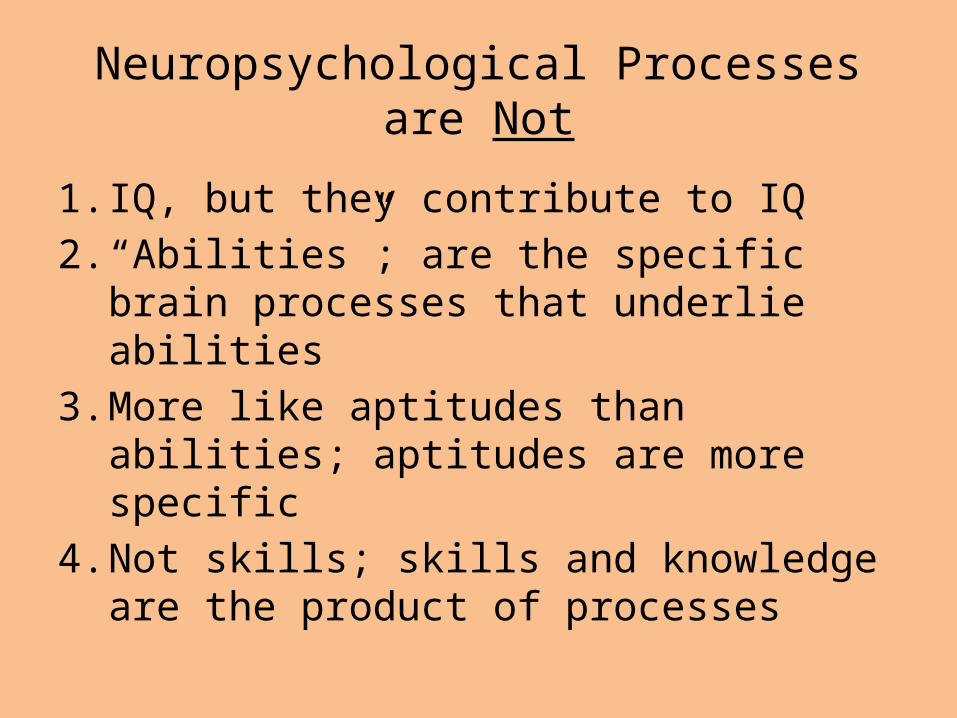
Neuropsychological Processes are Not
1. IQ, but they contribute to IQ2. “Abilities”; are the specific brain processes
that underlie abilities3. More like aptitudes than abilities; aptitudes
are more specific4. Not skills; skills and knowledge are the
product of processes

Processes to Include in Assessment
1. Broad processes composed of numerous subprocesses– Consider subprocesses when a broad process is
low
2. Related to academic learning & performance3. Observable in the classroom4. They have evidence-based interventions

Processes for SLD Assessment
1. Attention2. Auditory Processing3. Executive Functions4. Fine Motor5. Fluid Reasoning6. Long-Term Recall7. Oral Language8. Phonological Processing9. Processing Speed10.Visual-Spatial Processing11.Working Memory (WM)
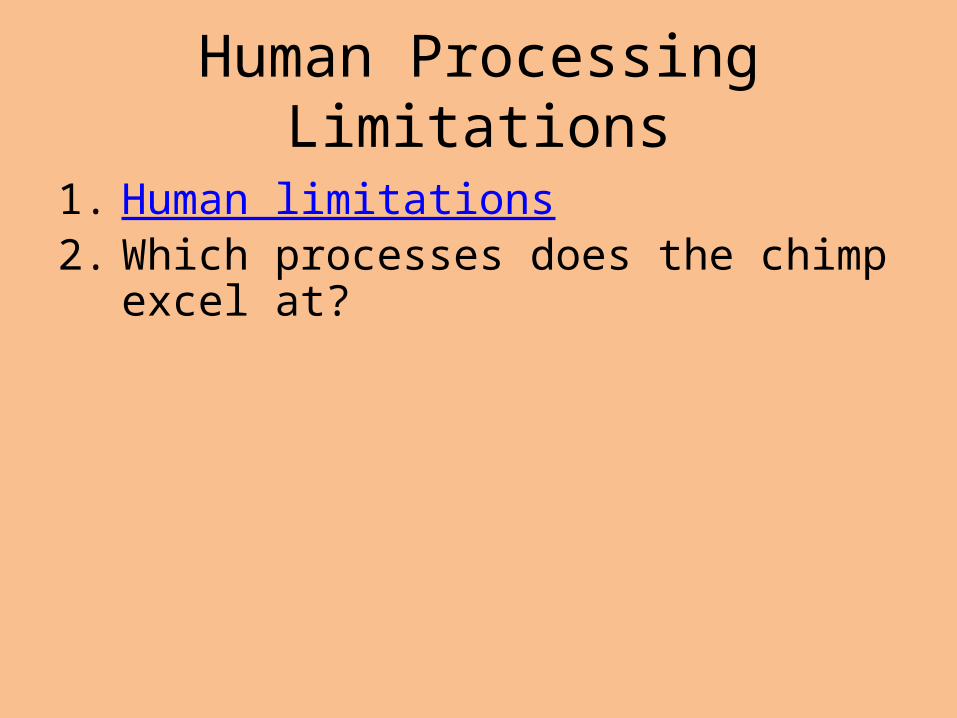
Human Processing Limitations
1. Human limitations2. Which processes does the chimp excel at?

Attention
1. Types: Selective, focused, divided, sustained2. Necessary for learning and memory3. Attention deficits part of LD; ADHD/LD comorbidity4. Not necessarily ADHD (not enough symptoms)
1. ADHD is more hyperactive/impulsive2. Inattentive type is more cognitive/learning
problems5. Can use rating scales to assess attention6. Related to Executive Functions and Working
Memory

Executive Functions
1. Self-regulation of cognitive functions and psychological processes
2. There are more than 30 exec processes3. Self-monitoring, self-regulation, and
metacognition are part of EF4. Have a longer course of development5. Also have to do with classroom
performance 6. Can assess with rating scales

Long-Term Recall
1. The focus is on the processes, not the amount of acquired knowledge
2. Close connection with other processes and with academic learning in general
3. Includes encoding, consolidation, storage, and retrieval
4. Don’t need memory battery; can use scores from WJ and other scales

Working Memory
1. Processing while retaining information2. Includes short-term memory3. Verbal, visual-spatial, & executive WM4. WM is a cognitive and executive process5. Scores from WJ, IQ, and other cognitive
scales can be used6. An example of where CHC theory does not
match up with neuropsychology; WJ IV has made an adjustment

Neuroanatomy of Processes

Neuroanatomy of Processes
1. Most in more than one brain lobe2. Illustrates the interconnectivity of processes3. Most have specific structures within a lobe4. Processing speed is a function of
interconnectivity; does not have a specific structure

Occipital Lobe
1. Dedicated to vision and visual-spatial processing
2. Receives sensory data from the thalamus3. Visual and spatial processing are separate4. Dorsal stream (upper) sends spatial
information to parietal lobe5. Ventral stream (lower) sends visual
information to temporal lobe

Temporal Lobe
1. Auditory processing2. Long-term memory processing in the
hippocampus3. Some visual processing4. Semantic memory storage

The Hippocampus

Parietal Lobe
1. Integrates sensory information2. Language processing3. Phonological processing

Frontal Lobe
1. The “output” lobe; others are input2. Executive functions---prefrontal cortex3. Working memory---prefrontal cortex4. Attentional control---prefrontal cortex5. Fluid reasoning6. Fine motor7. Oral expression8. No storage of long-term memories

Brain Lobes and STM & WM
1. Frontal (Prefrontal Cortex): Executive WM2. Temporal: Episodic WM (especially during
LTM encoding and retrieval)3. Parietal Lobes: Phonological STM and Verbal
WM in language processing areas4. Occipital Lobes: Visuospatial STM and WM

The Evidence for the SLD-Processing Deficit Connection
Meta-Analysis of 32 studies by Johnson et al. (2010) found “moderately large to large effect sizes (many close to one standard deviation of difference) in cognitive processing differences between groups of students with SLD and typically achieving students.” The processes included were: Working memory, short-term memory, phonological processing, processing speed, executive function, and language.”

The SLD-Processing Connection from Study with the CPPS
1. LD subjects had significantly higher means on all 11 processes; about 1.5 SD difference Link

Processes and Academic Learning
1. Psychological processes are like “aptitudes”2. Relations established through research
– Flanagan et al., & McGrew– Swanson, Geary, and others
3. For SLD look for academic area and related psychological processes to both be low
4. See Table; useful for planning, interpretation, and diagnosis
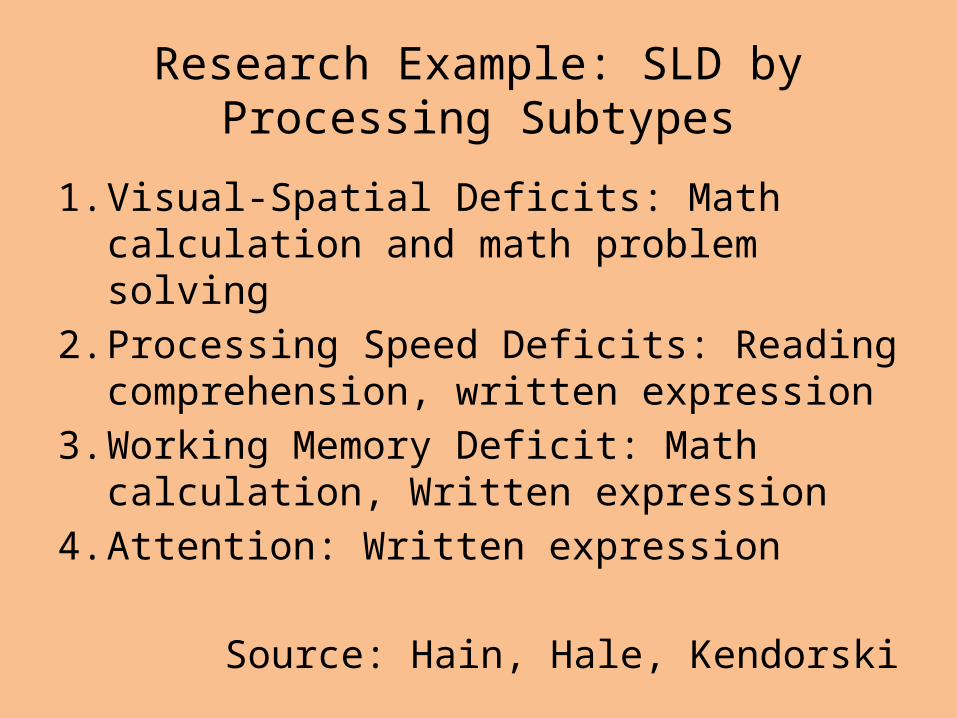
Research Example: SLD byProcessing Subtypes
1. Visual-Spatial Deficits: Math calculation and math problem solving
2. Processing Speed Deficits: Reading comprehension, written expression
3. Working Memory Deficit: Math calculation, Written expression
4. Attention: Written expression
Source: Hain, Hale, Kendorski

The Origin of PSW
1. IDEIA 2004 Federal Regulations define SLD as “a disorder in one or more of the basis psychological processes”
2. First method: IQ-Achievement Discrepancy3. Second method: RTI4. The third method allowed for SLD
identification using “alternative research-based procedures”

The Third Method
Flanagan interpreted this as allowing the use of a “pattern of strengths and weaknesses” in achievement, cognitive abilities, or psychological processes, with an emphasis on psychological processes

SLD and PSW
1. Assumption: a neurologically-based processing weakness underlies or “causes” learning disabilities (Hale & Fiorello, 2004)
2. The occurrence of significant intra-individual processing weaknesses indicates SLD
3. The “why” matters

Jack Naglieri’s Model
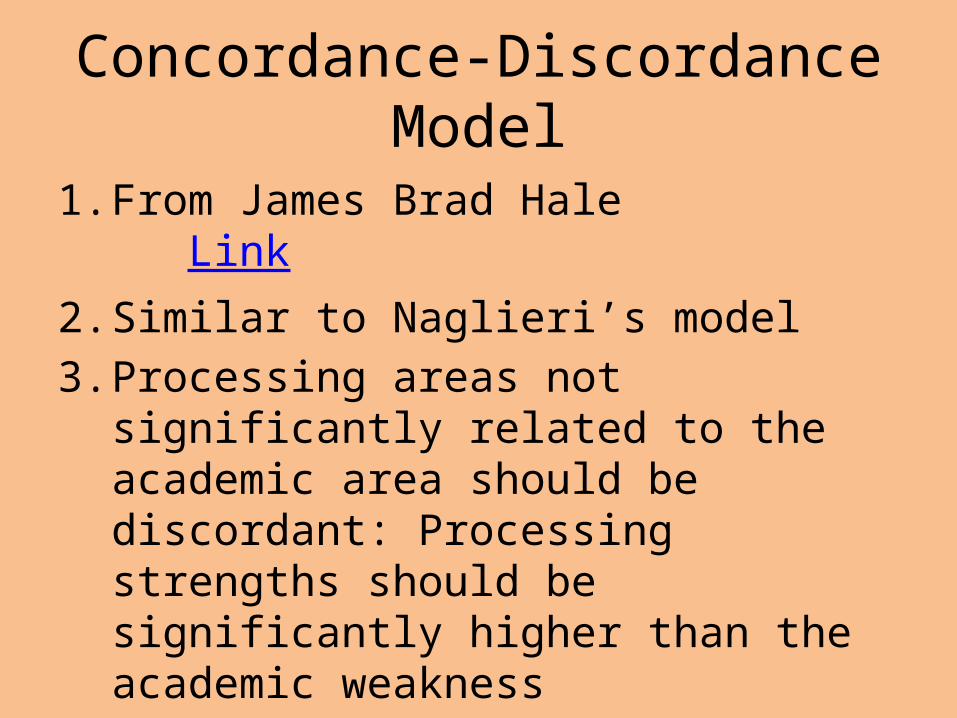
Concordance-Discordance Model
1. From James Brad Hale Link2. Similar to Naglieri’s model3. Processing areas not significantly related to
the academic area should be discordant: Processing strengths should be significantly higher than the academic weakness

CHC Model
1. A process related to the academic deficiency is weak or deficient
2. Unexpected underachievement: Process and academic deficit exist with otherwise normal ability
3. Regarding strengths, at least some processes should be in the average range

PSW & SLD: The “Minds” Consensus
1. Neurologically-based deficits underlie SLD2. There’s no SLD if there’s no processing deficit3. Some processes highly related with academic skills4. Processing deficits related to academic deficits5. SLD have average or near average cognitive ability6. Weakness should be normative & intra-individual7. Weakness: statistically significant and unusual8. PSW doesn’t mean there is a learning disability.

Dehn’s PSW Model
1. Intra-individual processing weaknesses are statistically significant
2. At least one process is a deficit (see definition)3. The processing deficit is related to the deficient
academic skill4. Consistency between low process score(s) and the
related low academic skill score 5. Subtest scores must be unitary for a deficit6. There is at least one strength (or a processes that is
in average range)
Dehn’s Definition of Deficit
1. Normative weakness + intra-individual weakness = deficit
2. Three reasons for deficit emphasis– Both weaknesses together is statistically rare– A deficit indicates an underlying neurological
impairment– Students with both kinds of weaknesses
really need special ed.

Process Scores Allowed in Dehn’s Model
1. The list of 11 processes2. Rating scales are included3. Composite scores preferred over subtests4. Achievement-like scores, e.g., verbal,
crystallized intelligence, vocabulary excluded5. Some subtests are re-classified

CHC vs Dehn’s Model
1. Dehn’s uses processes that have the highest relations with academic learning even if they are narrow processes
2. Dehn has more specific criteria for using processing deficits to identify SLD
3. Both use cross-battery analysis but Dehn offers IQ as a optional predictor
1. IQ score more reliable than cross-battery mean

Single Battery Testing
1. One battery is sufficient if it is comprehensive2. Examples: NEPSY-II, Woodcock-Johnson Cog.3. With NEPSY-II, use Dehn’s analysis worksheet4. With WJ, use the intra-cognitive discrepancy
analysis table Link
Cross-Battery, Selective Testing
1. Start with batteries you have2. Try to limit number of supplemental batteries3. Avoid redundancies4. Only selected subtests administered5. Two subtests or composites are ideal6. May include rating scales7. Use cross-battery analysis procedures

Cross-Battery, Selective Testing
1. Test all processes important for academics with most attention to an in-depth assessment of hypothesized weaknesses
2. Pick composites first3. See selective testing table Link4. See comprehensive list link from Essentials
of Processing Assessment, 2nd Edition

Some Subtests are Classified Differently Through Task Analysis
1. Consider definition of the process2. Consider factor analytic information3. What is the primary process being measured
by the subtest? (not just input or output)4. Which primary process allows the examinee
to successfully complete the task5. What the task is typically used to measure6. No such thing as “pure” subtest measure

Hypothesis Testing Approach
1. Given academic deficiency, what are the most likely process deficits
2. It’s “why” the child has a learning problem3. Include non-processes 4. Must collect assessment data to “test”
hypotheses5. Try to avoid “confirmatory bias”6. We all have weaknesses

Planning Processing Assessment
1. Assess most major processes, especially those hypothesized to be deficits
2. Don’t test areas that are clearly strengths3. Use the CPPS to reduce need to test4. Identify academic deficiencies5. Generate processing deficit hypotheses based
on relations with academics6. Decide on assessment method7. Select tests and subtests, not entire batteries

Planning a Processing Assessment
1. Complete the processing assessment planner on case study
2. Consider concern; look at academic relations table; hypothesize which processes involved
3. Consider non-processing hypotheses4. Fill in all processes tested by primary scale5. Find other scales to cover remaining
processes See Partially Completed Example
Case Study Risk Factors
1. Blood clot in umbilical cord2. Abusive father; stressful home environment3. ADHD4. Executive dysfunctions but very self-aware5. Speech/language delay and disorder6. Seizure disorder7. Severe word retrieval difficulties
Six-Year Old Case Study Concerns
1. Learning colors, letters, and numbers2. Inconsistent performance 3. Recognizing and generating rhyming words4. Reading difficulties5. Doesn’t remember directions6. Difficulty getting started on a task7. Word retrieval problems 8. Math learning difficulties

Processing Analysis with Hand Computations
1. Use composite scores from test manual whenever possible
2. Convert all scores to standard scores3. Compute clinical scores by averaging4. Compute processing or memory mean or use IQ5. Calculate discrepancies6. Determine weaknesses and deficits7. Both kinds of weaknesses = a deficit8. Do pairwise comparisons
– Opposites and those closely related9. Example
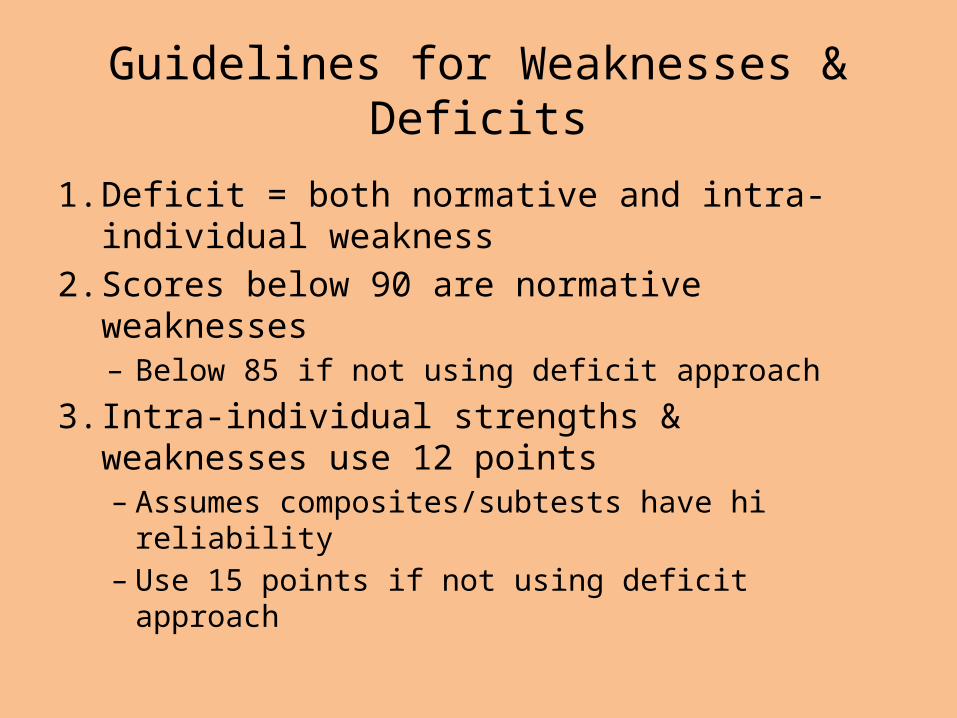
Guidelines for Weaknesses & Deficits
1. Deficit = both normative and intra-individual weakness
2. Scores below 90 are normative weaknesses– Below 85 if not using deficit approach
3. Intra-individual strengths & weaknesses use 12 points – Assumes composites/subtests have hi reliability– Use 15 points if not using deficit approach

Non-Unitary Scores
1. When standard score difference is greater than 22 points
2. Something different is being measured or something is different about the task
3. Investigate further with more testing if cannot be explained
4. Don’t use a non-unitary process score for diagnostic purposes

Pairwise Comparisons
1. For intervention planning, not diagnosis2. Pay most attention to:
– Opposites– Those that are closely related
3. A greater discrepancy is required for significance
4. Significant when confidence intervals do not overlap

PSW SLD Criteria for Case Study
1. Is there at least one deficit2. Is there at least one strength3. Is the intra-individual weakness statistically
significant4. Are the scores unitary5. Does the deficit relate to the deficient skill6. Is there consistency between the process and
achievement score (bands overlap)

When to Use IQ Instead of Cross-Battery Mean
1. Okay to use IQ as predictor because it has high correlations with most processes
2. Is technically more appropriate because it has known reliability and SEM
3. Use when only weak processes tested4. Use when only a few processes tested5. Use when a legal challenge is anticipated

Using Dehn’s Automated Analysis Worksheet to Determine PSW
1. Automated worksheet from Essentials of Processing, 2nd Edition

Psychological Processing Analyzer2.1 and 3.0
1. Available at www.psychprocesses.com2. Identifies statistically significant strengths,
weaknesses, deficits, and assets 3. Can enter composite and/or subtest scores4. 11 psychological processes5. Takes scores (about 400 to choose from)
from 50+ different scales: cognitive, achievement, rating, and processing

Psychological Processing Analyzer
1. Composite and subtests are limited to those that are fairly direct measures
2. Some are re-classified based on the primary demands of the task
3. Use the mean of the process scores or IQ as predicted score
4. Differences greater than critical values are intra-individual weaknesses

PPA Equations
1. Converts all scores (except raw scores) to standard scores
2. .01 or .05 level of significance3. Difference formulas based on reliability
coefficients of composites/subtests4. Regression toward the mean 5. Predicted score based on mean of other 106. Non-unitary scores are flagged7. Checks processes and achievement for consistency

PPA Report
1. Pairwise comparisons also provided 2. Results tables, graph and narrative3. Identifies academic areas associated with the
identified deficits4. See demo and sample report

New Features with PPA 3.0
1. New tests such as WISC-V and WJ IV2. Will do cross-battery intra-achievement
analysis3. Will select deficit processes and deficit
academic skills that pair up (related)4. Check them for statistical consistency5. Longer narrative with definitions, etc.
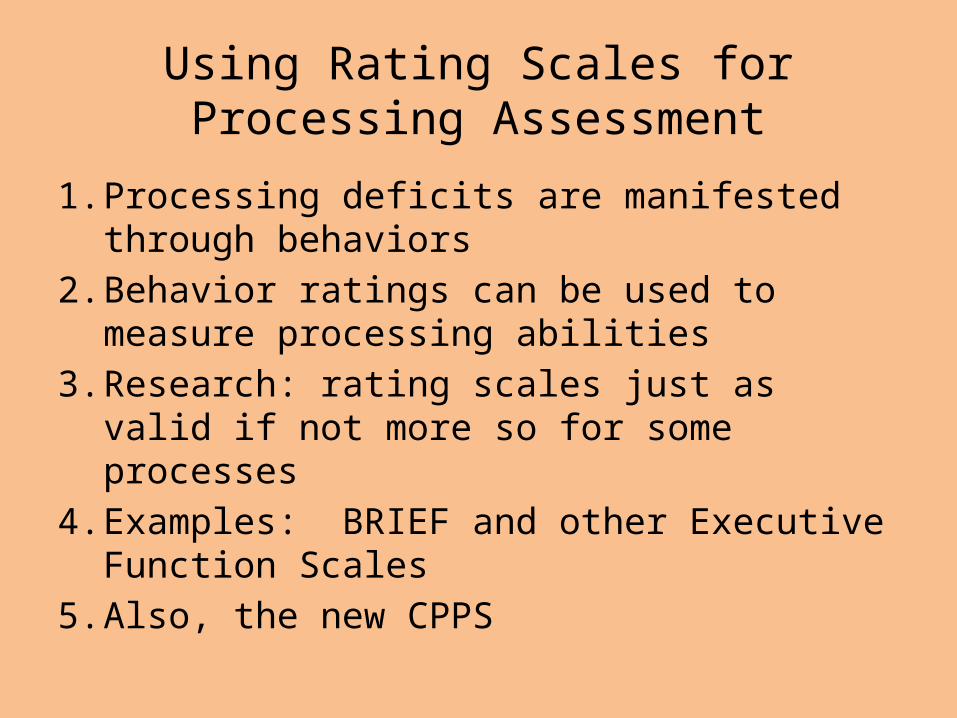
Using Rating Scales forProcessing Assessment
1. Processing deficits are manifested through behaviors
2. Behavior ratings can be used to measure processing abilities
3. Research: rating scales just as valid if not more so for some processes
4. Examples: BRIEF and other Executive Function Scales
5. Also, the new CPPS

Children’s Psychological Processes Scale (CPPS) Overview
1. Standardized teacher rating scale2. Ages 5-0-0 to 12-11-303. 121 items across 11 subscales4. Entirely online, internet-web based5. Online administration time of 15 minutes6. Online scoring and report7. Author: Milton Dehn; published by Schoolhouse
Educational Services, 20128. Measurement Consultant: Kevin McGrew

Main Uses of the CPPS
1. To identify psychological (cognitive) processing weaknesses in children referred for a learning disability evaluation
1. An additional source of data for diagnostic purposes
2. Can be used as a Pattern of Strengths and Weaknesses (PSW) analysis
3. Covers processes not directly tested 4. Progress monitoring5. Screening

CPPS Standardization
1. 1,121 students rated by 278 teachers2. 128 communities in 30 states3. All data collected online4. Demographics match U.S. Census well5. Norms: 4 age groups (5-6; 7-8; 9-10; 11-12)6. Included children with disabilities

The CPPS Identifies Children with SLD
1. LD subjects had significantly higher means on all subscales; about 1.5 SD difference
2. The CPPS has high classification accuracy in regards to LD1. 37 LD subjects compared with matched controls2. Using CPPS GPA cutoff of 60 had 92%
classification accuracy across 74 subjects

CPPS Processes
1. Attention2. Auditory Processing3. Executive Functions4. Fine Motor5. Fluid Reasoning6. Long-Term Recall7. Oral Language8. Phonological Processing9. Processing Speed10.Visual-Spatial Processing11.Working Memory (WM)

CPPS Report
1. Brief narrative, graph, and a table of scores2. Change-sensitive W-scores3. T-scores; percentiles; confidence intervals4. Intra-individual strengths and weakness
discrepancy table5. T-score to standard score converter6. Example

CPPS Discrepancy Analysis
1. Use discrepancy table to determine pattern of strengths and weaknesses
2. Predicted score based on mean of other 103. Regression toward the mean included 4. +/- 1.00 to 2.00 SD of SEE discrepancy options5. Strengths and Weakness labeling is opposite
of discrepancy, e.g. “-” value = a strength6. Link

Diagnosing LD with the CPPS
1. Look for pattern of strengths and weaknesses (discrepancy table)
2. If intra-individual weaknesses are also normative weaknesses (T-scores of 60 and above), then they are deficits
3. Same criteria as PSW model
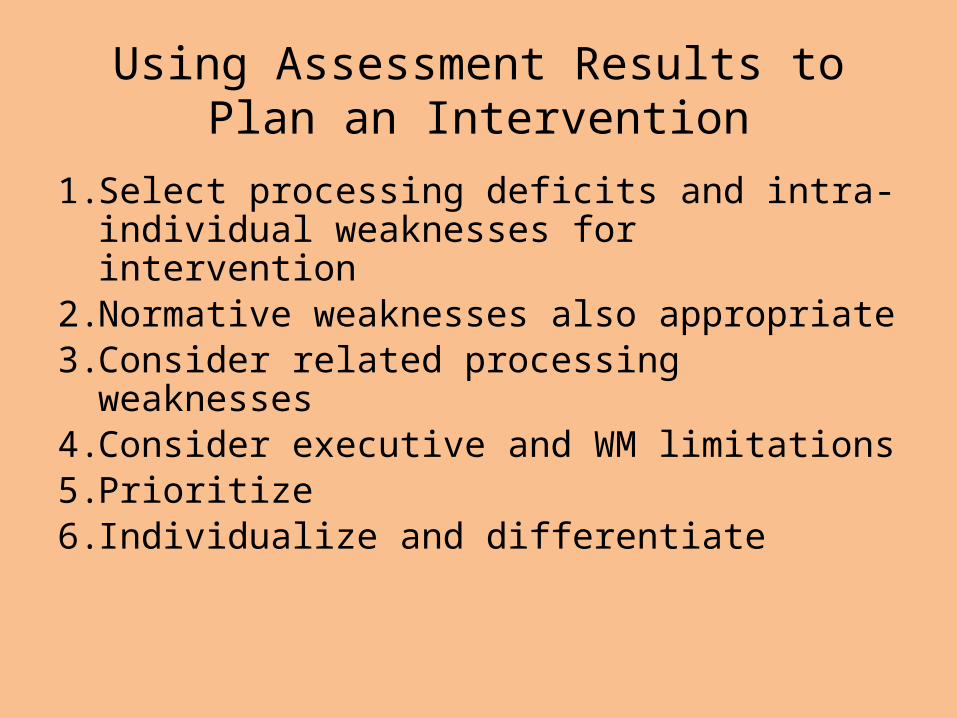
Using Assessment Results toPlan an Intervention
1. Select processing deficits and intra-individual weaknesses for intervention
2. Normative weaknesses also appropriate3. Consider related processing weaknesses4. Consider executive and WM limitations5. Prioritize6. Individualize and differentiate
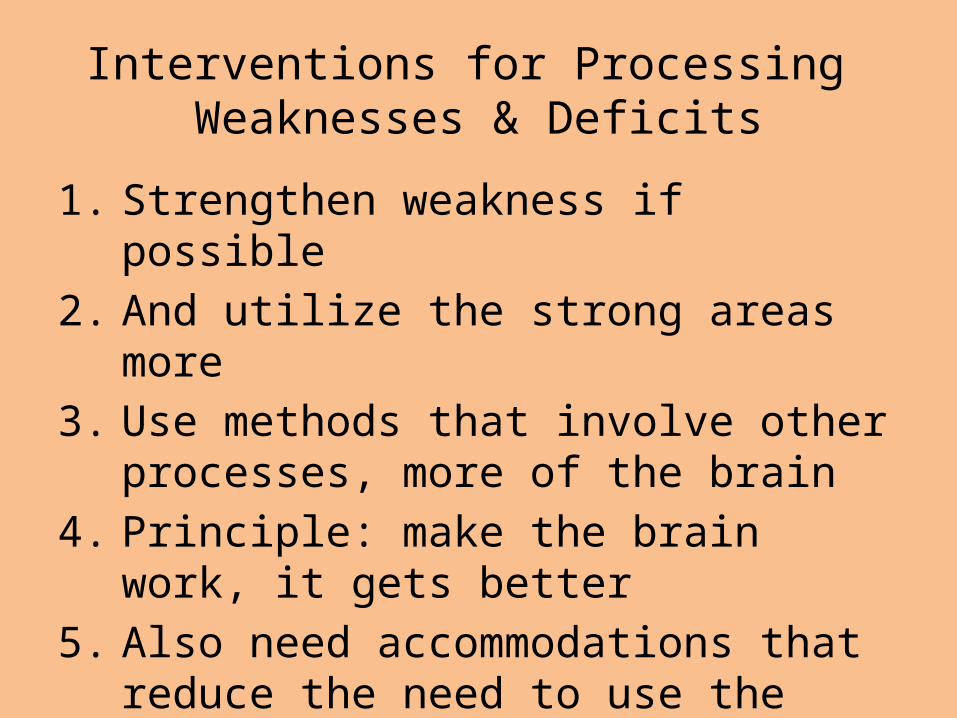
Interventions for Processing Weaknesses & Deficits
1. Strengthen weakness if possible2. And utilize the strong areas more3. Use methods that involve other processes,
more of the brain4. Principle: make the brain work, it gets better5. Also need accommodations that reduce the
need to use the weak processes, especially when deficits are severe

See Summary Sheet with References
• More methods and references for WM and long-term memory Link

Metacognitive Component
1. Applies to all processing interventions2. Teach child how process works3. Inform child of strengths and weaknesses4. Teach how to control the process5. Emphasize personal efficacy of intervention6. Teach conditional strategy knowledge: how,
when, where, why

Attention: Self-Monitoring
1. Teacher, or device carried by student, cues student at variable intervals, such as 5 minutes
2. When cued, student marks monitoring sheet regarding behavior when cue occurred: 2-Completely on task; 1-Partially on task; 0-Completely off task
3. When teacher is cueing, she also provides her rating alongside student’s; student receives bonus point when ratings match
4. Set a points goal that student is working for, easy at first, then keep adjusting upward Link

Auditory Processing
1. Same as interventions for CAPD2. Recoding auditory into visual information3. Visual representations should accompany
verbal presentations4. Quiet environment5. Improve acoustics6. Fast ForWord7. Auditory trainers (individual sound systems)

Executive Functions: Planning
1. Developing planning improves math performance
2. Discuss benefits of plans3. Develop plans4. Verbalize them5. Implement them and evaluate
Fluid Reasoning
1. Problem solving2. Categorizing3. Similarities and differences4. Games that require reasoning and
recognizing relationships

Phonological Processing
1. Phonemic awareness interventions very effective .86 effect size (the earlier the better)
2. Oral at first, then with written material3. Rhyming; isolating phonemes; identifying
phonemes; deleting phonemes; categorizing common phonemes; segmenting phonemes that comprise words; and blending phonemes into words

Processing Speed
• Video Games
Visual-Spatial Processing• None recommended

Long-Term Recall
1. Dual encoding2. Elaboration3. Visual mnemonics
Dual Encoding
1. Instructors should make it both verbal and visual or give students time to recode
2. Instruct students to visualize verbal info.3. Instruct students to name/describe visual-
spatial info.4. Increases the number of pathways available
for retrieval

Verbal Memory Strategy: Elaboration
1. Relate new info. with previous2. Facilitates encoding and LTM organization,
consolidation, retrieval3. Teachers should provide for young child4. In-depth versus superficial processing5. Ties info. with appropriate schema6. Example: Asking and answering the “Why
does this make sense” question

Visual Mnemonics
1. For students with low verbal WM2. Link info to something already known that will not
be forgotten; Act as a scaffold or bridge 3. Creates associations and meaning4. Best when student creates images5. Interactive images best6. Ideal for those with verbal WM deficit7. Basic visualization without a mnemonic is also
beneficial Link

Approaches to Improving WM
1. Reduce the “cognitive load” imposed on the student (Tier I)
2. Directly increase WM capacity through the use of training exercises (Tiers II and III)
3. The student can make more effective use of existing WM capabilities by learning to use strategies (Tiers 1 – 3)
4. Accommodations