Embed Size (px)
Citation preview

User‐Friendly Traffic Incident Management (TIM) Program Benefit‐Cost Estimation Tool,
Version 1.2

FOREWORD
Traffic incidents contribute significantly to the deterioration of the level of service of both freeways and arterials. Traffic Incident Management (TIM) programs have been introduced worldwide with the aim of mitigating the impact of traffic incidents on safety and roadway performance. These programs support quick incident response, thereby shortening incident duration, and control traffic demand around the incident scene. Some TIM programs can be costly to taxpayers; thus, it is important to evaluate their benefits and determine the associated return on investment. Although benefit-cost (BC) estimation studies have been conducted for numerous TIM programs, these studies employ a wide range of estimation methodologies and monetary equivalent conversion factors. Consequently, resulting BC ratio estimates vary widely and have been shown to be sensitive to these choices. Moreover, these studies can be quite costly. Therefore, this report develops a TIM-BC tool with standardized methodology that can be universally and equitably employed in BC ratio estimation for different TIM programs, which is essential to creating consistency and, therefore, greater confidence in the validity of the results. With access to the methodology in the form of a simple-to-use, less data-intensive tool, TIM programs and taxpayers alike can benefit from cost-effective evaluations.
Notice
This document is disseminated under the sponsorship of the U.S. Department of Transportation in the interest of information exchange. The U.S. Government assumes no liability for the use of the information contained in this document. This report does not constitute a standard, specification, or regulation.
The U.S. Government does not endorse products or manufacturers. Trademarks or manufacturers’ names appear in this report only because they are considered essential to the objective of the document.
Quality Assurance Statement
The Federal Highway Administration (FHWA) provides high-quality information to serve Government, industry, and the public in a manner that promotes public understanding. Standards and policies are used to ensure and maximize the quality, objectivity, utility, and integrity of its information. FHWA periodically reviews quality issues and adjusts its programs and processes to ensure continuous quality improvement.

i
TECHNICAL REPORT DOCUMENTATION PAGE
1. Report No.
FHWA-HRT-16-055
2. Government Accession No.
3. Recipient’s Catalog No.
4. Title and Subtitle
User-Friendly Traffic Incident Management (TIM) Program Benefit-Cost Estimation Tool
5. Report Date
January 2016 6. Performing Organization Code
7. Author(s)
Jiaqi Ma, Elise Miller-Hooks, Mersedeh Tariverdi, Taylor Lochrane, Fang Zhou, David Prentiss, Kathleen Hudgins, Paul Jodoin, Zhitong Huang, Margaret Hailemariam
8. Performing Organization Report No.
9. Performing Organization Name and Address
Leidos, Inc. 11251 Roger Bacon Drive Reston, VA 20190
10. Work Unit No. (TRAIS) 11. Contract or Grant No.
DTFH61-12-D-00020
12. Sponsoring Agency Name and Address
Office of Operations Research and Development Federal Highway Administration 6300 Georgetown Pike McLean, VA 22101-2296
13. Type of Report and Period Covered
Project Final Report
14. Sponsoring Agency Code
HRDO-20
15. Supplementary Notes
The Contracting Officer’s Technical Representative (COTR): Taylor Lochrane 16. Abstract
Traffic incidents contribute significantly to the deterioration of the level of service of both freeways and arterials. Traffic Incident Management (TIM) programs have been introduced worldwide with the aim of mitigating the impact of traffic incidents on safety and roadway performance. These programs support quick incident response, thereby shortening incident duration, and control traffic demand around the incident scene. Some TIM programs can be costly to taxpayers, thus, it is important to evaluate their benefits and determine the associated return on investment. Although benefit-cost (BC) estimation studies have been conducted for numerous TIM programs, these studies employ a wide range of estimation methodologies and monetary equivalent conversion factors. Consequently, resulting BC ratio estimates vary widely and have been shown to be sensitive to these choices. Moreover, these studies can be quite costly. This report develops a TIM-BC tool with standardized methodology that can be universally and equitably employed in BC ratio estimation for different TIM programs, which is essential to creating consistency and, therefore, greater confidence in the validity of the results. With access to the methodology in the form of a simple-to-use, less data-intensive tool, TIM programs and taxpayers alike can benefit from cost-effective evaluations. A New York case study compares the effectiveness of implementing three selected TIM strategies, namely: safety service patrol, driver removal laws, and dispatch colocation. The case study also helps in understanding the need for a standardized BC ratio estimation tool and the effectiveness of the developed TIM-BC tool.
17. Key Words
research, safety, traffic incident management, safety service patrol, benefit cost analysis
18. Distribution Statement
No restrictions.
19. Security Classif. (of this report)
Unclassified
20. Security Classif. (of this page)
Unclassified
21. No. of Pages
59
22. Price
Form DOT F 1700.7 (8-72) Reproduction of completed page authorized

ii
SI* (MODERN METRIC) CONVERSION FACTORS APPROXIMATE CONVERSIONS TO SI UNITS
Symbol When You Know Multiply By To Find Symbol LENGTH
in inches 25.4 millimeters mm ft feet 0.305 meters m yd yards 0.914 meters m mi miles 1.61 kilometers km
AREA in2 square inches 645.2 square millimeters mm2
ft2 square feet 0.093 square meters m2
yd2 square yard 0.836 square meters m2
ac acres 0.405 hectares ha mi2 square miles 2.59 square kilometers km2
VOLUME fl oz fluid ounces 29.57 milliliters mL gal gallons 3.785 liters L ft3 cubic feet 0.028 cubic meters m3
yd3 cubic yards 0.765 cubic meters m3
NOTE: volumes greater than 1000 L shall be shown in m3
MASS oz ounces 28.35 grams glb pounds 0.454 kilograms kgT short tons (2000 lb) 0.907 megagrams (or "metric ton") Mg (or "t")
TEMPERATURE (exact degrees) oF Fahrenheit 5 (F-32)/9 Celsius oC
or (F-32)/1.8
ILLUMINATION fc foot-candles 10.76 lux lx fl foot-Lamberts 3.426 candela/m2 cd/m2
FORCE and PRESSURE or STRESS lbf poundforce 4.45 newtons N lbf/in2 poundforce per square inch 6.89 kilopascals kPa
APPROXIMATE CONVERSIONS FROM SI UNITS Symbol When You Know Multiply By To Find Symbol
LENGTHmm millimeters 0.039 inches in m meters 3.28 feet ft m meters 1.09 yards yd km kilometers 0.621 miles mi
AREA mm2 square millimeters 0.0016 square inches in2
m2 square meters 10.764 square feet ft2
m2 square meters 1.195 square yards yd2
ha hectares 2.47 acres ac km2 square kilometers 0.386 square miles mi2
VOLUME mL milliliters 0.034 fluid ounces fl oz L liters 0.264 gallons gal m3 cubic meters 35.314 cubic feet ft3
m3 cubic meters 1.307 cubic yards yd3
MASS g grams 0.035 ounces ozkg kilograms 2.202 pounds lbMg (or "t") megagrams (or "metric ton") 1.103 short tons (2000 lb) T
TEMPERATURE (exact degrees) oC Celsius 1.8C+32 Fahrenheit oF
ILLUMINATION lx lux 0.0929 foot-candles fc cd/m2 candela/m2 0.2919 foot-Lamberts fl
FORCE and PRESSURE or STRESS N newtons 0.225 poundforce lbf kPa kilopascals 0.145 poundforce per square inch lbf/in2
*SI is the symbol for th International System of Units. Appropriate rounding should be made to comply with Section 4 of ASTM E380. e(Revised March 2003)

iii
TABLE OF CONTENTS
EXECUTIVE SUMMARY ...........................................................................................................1
Introduction ....................................................................................................................................3
TRAFFIC INCIDENT MANAGEMENT OVERVIEW ............................................................5
Traffic Incident Management Strategies ....................................................................................5
Traffic Incident Management Stakeholders ...............................................................................6
Benefits of Traffic Incident Management Strategies .................................................................7
Costs of Traffic Incident Management Strategies .....................................................................8
Existing Benefit-Cost Estimation Tools .......................................................................................... 8
Methodology .................................................................................................................................11
Selected Traffic Incident Management Strategies ...................................................................11
Critical Traffic Incident Management Strategies Selection ........................................................... 11 Requirements of New Traffic Incident Management Benefit-Cost Tool ....................................... 12
Duration/Proportion-based Estimation ....................................................................................13
Estimation Method ......................................................................................................................... 13 Examples ........................................................................................................................................ 15
Data Collection Based on Microscopic Simulation .................................................................15
Selected Simulator ......................................................................................................................... 15 Contributing Factors and their Relationships ................................................................................. 17 Incident Modeling .......................................................................................................................... 18 Scenario Design ............................................................................................................................. 21
Benefit Estimation Modeling ...................................................................................................22
Regression Models ......................................................................................................................... 22 Hybrid Statistical-Simulation Estimation ...................................................................................... 24 Total Benefit Calculation ............................................................................................................... 26
Cost Calculation .......................................................................................................................29
The Benefit-Cost Ratio ............................................................................................................30
Additional Benefits ..................................................................................................................31
The Web-based Traffic Incident Management Benefit-Cost Tool ..........................................33
Introduction ..............................................................................................................................33
Required Input Data .................................................................................................................34
Output ......................................................................................................................................36
CASE STUDY: THE NEW YORK EXPERIENCE .................................................................37
CONCLUSIONS ..........................................................................................................................41
APPENDIX A: AN EXAMPLE OF REGRESSION DEVELOPMENT PROCESS ............43

iv
APPENDIX B: INCIDENT DURATION ESTIMATION FOR IMPLEMENTING DIFFERENT TIM STRTEGIES ................................................................................................49
REFERENCES .............................................................................................................................57

v
LIST OF FIGURES Figure 1. Equation. Total travel delay calculation. ....................................................................... 17 Figure 2. Diagram. Incident layout on typical three-lane unidirectional freeway segment. (30) (11)
....................................................................................................................................... 19 Figure 3. Equation. Final Model of Travel Delay of Light-Duty Vehicles (Cars) ....................... 23 Figure 4. Equation. Final Model of Travel Delay of Heavy-Duty Vehicles (Trucks) .................. 23 Figure 5. Diagram. Statistical-simulation hybrid approach for estimating fuel consumption of
light-duty vehicles. ........................................................................................................ 24 Figure 4. Equation. Emission Estimation for Co2, HC, CO, NOx. .............................................. 25 Figure 5. Equation. Estimation of SOX emissions. ...................................................................... 25 Figure 8. Equation. Secondary Incident Estimation. .................................................................... 26 Figure 9. Equation. Total Savings Estimate. ................................................................................. 28 Figure 10. Equation. Estimation of total benefits of implementing a TIM strategy. .................... 29 Figure 11. Equation. Method for calculating the total cost of a TIM strategy. ............................ 29 Figure 12. Equation. Method for calculating costs of operating TIM strategies along a corridor.30 Figure 13. Equation. Model for calculating benefit cost ratios. .................................................... 30 Figure 14. Diagram. System flow process and architecture for the Traffic Incident Management
Benefit-Cost tool. .......................................................................................................... 33 Figure 15. Screenshot. Traffic Incident Management Benefit-Cost Tool navigation page with
panels linking to all eight subtools. ............................................................................... 34 Figure 16. Screenshot. User interface of Safety Service Patrol Benefit-Cost subtool for data input
on roadway geometry, safety service patrol program information, traffic information, and incident information. .............................................................................................. 35
Figure 17. Screenshot. Project output/calculate ratio screen. ....................................................... 36 Figure 18. Chart. Sensitivity analysis results with varying values for incident duration savings. 39 Figure 19. Chart. Fit diagnostics for total travel delay of light-duty vehicles. ............................. 44 Figure 20. Chart. Plot of residuals for total travel delay of light-duty vehicles. .......................... 45 Figure 21. Chart. Plot of R-student residuals for total travel delay of light-duty vehicles. .......... 45 Figure 22. Chart. Quantile-Quantile plot for total travel delay of light-duty vehicles. ................ 46 Figure 23. Chart. Outlier and leverage diagnostics for total travel delay of light-duty vehicles. . 46 Figure 24. Chart. Scatterplots of residuals against explanatory variables. ................................... 47 Figure 25. Chart. Normality of residuals for total delay of cars. .................................................. 48 Figure 26. Chart. Standard residuals for total delay of cars.......................................................... 48
LIST OF TABLES Table 1. TIM strategies and categories. (4) ...................................................................................... 5 Table 2. Existing sketch planning tools and postprocessing tools. (18) ............................................ 8 Table 3. Comparison of operational analysis approaches. (18) ......................................................... 9

vi
Table 4. Eight Traffic Incident Management strategies selected based on interviews with project advisory committee. ...................................................................................................... 11
Table 5. Evaluation methods and default parameters for selected TIM programs. ...................... 14 Table 6. Summary of variables and the range used in numerical experiments. (30) ...................... 18 Table 7. Driver behavior parameters. (35) ...................................................................................... 21 Table 8. Contributing measure of effectiveness factors directly employed in simulation
designs. .......................................................................................................................... 22 Table 9. Emission factors. ............................................................................................................. 25 Table 10. Fuel properties. ............................................................................................................. 26 Table 11. Summary of monetary equivalents. .............................................................................. 27 Table 12. Evaluation results of three traffic incident management strategies. ............................. 37 Table 13. Linear regression model for travel delay of light-duty vehicles (cars). ........................ 43

vii
LIST OF ACRONYMS AIC Akaike information criterion ARL Authority removal laws BC Benefit-Cost BIC Bayesian information criterion CAD Computer aided dispatch CHART Coordinatated Highways Action Response
Team COM Component object module DC Dispatch colocation DMS Dynamic message signs DOT Department of Transportation D/P-E Duration/proportion-based estimation DRL Driver removal laws EMS Emergency medical services FHWA Federal Highway Administration FFS Free-flow speed HAR Highway advisory radio HDV Heavy-duty vehicles HOT High occupancy toll HOV High occupancy vehicle ITS Intelligent transportation systems LBD Look back distance LDV Light-duty vehicles MOE Measures of effectivenss NIMS/ICS National Incident Management
System/National Incident Command System NUG National unified goal PTSA Preestablished Towing Service Agreements SDRF Safety Distance Reduced Factor SHRP2 Second Strategic Highway Research Program SQCG Shared quick-clearance goals SSP Safety Service Patrols SSP-BC Safety Service Patrols Benefit-Cost ST SHRP2 Training TAC Total annual cost TDc Total travel delay of cars TDt Total travel delay of trucks TIM Traffic incident management TIM-BC Traffic incident management benefit-cost TMC Transportatioan management centers TOC Traffic operations centers TTF TIM Task Forces Vplph Vehicles per lane per hour VMT Vehicle miles traveled


1
EXECUTIVE SUMMARY
Traffic incident management (TIM) strategies are major approaches to dealing with safety and mobility issues resulting from traffic incidents. As such, they are critical for traffic operation and management. These strategies support quick incident response, thereby shortening incident duration, and controlling traffic demand around the incident scene. Since some TIM strategies could be costly to taxpayers, and because resources and funding are limited among State departments of transportation (DOTs) and local transportation agencies, it is essential to investigate benefits and costs for different potential and existing TIM strategies. Some transportation engineers and researchers have offered different methods and software packages for estimating the benefits and costs of the various TIM strategies. However, the majority of these methods and software packages are related to safety service patrols (SSPs). Further, these methods and software packages employ a wide range of estimation methodologies and monetary equivalent conversion factors. As a result, benefit and cost (BC) ratio estimates vary widely for TIM strategies. This has created a need to develop a more consistent and standardized methodology for TIM-BC assessment. Different State DOTs and local transportation agencies use different TIM strategies, and to meet requirements for most of these agencies, the research team identified the eight most commonly used TIM strategies according to surveys and interviews from a project advisory committee. Building on previous efforts from a prototype SSP-BC tool developed by the University of Maryland, this study fashioned a standardized methodology that can be universally and equitably employed in BC ratio estimation for different TIM strategies, which is essential to creating consistency and, therefore, greater confidence in the validity of the results. The methodology was incorporated into a user-friendly and less data-intensive Web-based TIM-BC tool to facilitate cost-effective TIM evaluations by State and local transportation agencies. The new TIM-BC tool covers eight different strategies: safety service patrols, driver removal laws, authority removal laws, shared quick clearance goals, preestablished towing service agreements, dispatch colocation, TIM Task Forces, and the second Strategic Highway Research Program (SHRP2) training. As part of this project, the team conducted a case study of the New York experience, which compared the effectiveness of implementing three selected TIM strategies: safety service patrols, driver removal laws, and dispatch colocation. The case study example may also help practitioners to understand the need for a standardized BC ratio estimation tool and the effectiveness of a developed TIM-BC tool. In the final section, conclusions from this project and recommendations for future research are presented.


3
INTRODUCTION
Traffic Incident Management (TIM) is a “systematic, planned, and coordinated effort to detect, respond to, and remove traffic incidents and restore traffic capacity as safely and quickly as possible.” (1) The National TIM Coalition (NTIMC) has published a set of objectives for TIM programs around the Nation. This National Unified Goal (NUG) includes three main objectives: (1) responder safety; (2) safe and quick clearance; and (3) prompt, reliable, interoperable communications. (2) Practitioners may design or select the TIM strategies that make up their TIM program overall with these objectives in mind. In addition to supporting the NUG, TIM programs aim to reduce overall incident delays, minimize vehicle fuel costs and emissions, decrease the probability of secondary incidents, and maintain safety for the driving public. TIM is a relatively inexpensive way to reduce congestion. Various TIM programs have been shown to have a high return on investment. Using a traffic simulation program, analysts determined that Maryland State Highway Administration’s Coordinated Highways Action Response Team (CHART) program reduced travel delays on major Maryland corridors by 32.43 million vehicle-hours in 2009, equating to a savings in delay, fuel, and emissions valued at more than $1 billion. (3) The Traffic Incident Management Handbook confirms TIM effectiveness in reducing average incident duration to 22 minutes, which resulted in almost 300 fewer secondary crashes in Maryland in 2005. (4) FHWA (1) also found that TIM programs reduce average incident duration by up to 65 percent, decrease the possibility of secondary crashes by 30–50 percent, and contribute to savings of 2,600 to 7,700 gallons of fuel per incident. In addition to economic benefits, TIM programs have also helped improve collaboration among stakeholder agencies, increase safety for the driving public and responders, and reduce productivity impacts from traffic incidents. There is a need within the TIM discipline for accurate, reliable, and easy-to-use methodologies or tools to estimate the benefits and costs of TIM strategies. Many reasons for needing BC estimation tools are provided by Cambridge Systematics (5) and the Whitehouse Group. (6) The most notable reason is that the limited budgets and resources of local highway agencies require program leaders to be able to prove program benefits to offset (or exceed) the corresponding costs. Software tools not only help practitioners estimate the BC ratios for their programs, but also enable stakeholders to think critically about options to trim program operation costs or increase program efficiency. These BC estimation tools provide objective methods to address the safety, reliability, and security goals of an agency or program. Currently, there are various software tools available to practitioners, each with a unique way of defining benefits and costs. Many of the tools available presently focus on operations or intelligent transportation systems (ITS) strategies and have limited applicability for TIM programs; in other words, they are broader and produce relatively rough estimates of BC ratios.(7) (8) (9) Each of these programs requires a different amount and type of input data from the user, and the complexity and accuracy of program output often correlate to the scope of the required input.

4
A few studies, as documented by Chou, Miller-Hooks, and Promisel, (10) developed their own unique approach with special assumptions to analyze one of the most popular TIM strategies—the safety service patrol (SSP)—for which BC ratios range from 2:1 to 36:1. While BC ratios of SSP are high, they are also extremely variable among different programs and among different evaluation tools. This wide range emphasizes a need for a single, consistent, and accurate BC estimation tool for assessing and comparing TIM strategies. Previous studies by the University of Maryland produced a prototype tool for estimating benefits and costs of SSP programs. (11) (12) This tool and its estimation methodology were developed through extensive research, literature review, data collection, simulation, statistical analysis, and model development. The tool only addressed SSP. In this current Federal Highway Administration (FHWA) study, the Leidos team along with the University of Maryland, enhanced the current SSP-BC tool and modified this tool to create a standardized simple-to-use TIM Benefit-Cost estimation tool for a wider class of TIM programs andstrategies. This effort has culminated in a robust software platform for a TIM-BC estimation tool, including open source code and necessary documentation. This report documents the development of the user-friendly Web-based Traffic Incident Management Benefit-Cost (TIM-BC) tool to conduct BC estimations related to a wide range of TIM strategies. It supports the analysis of return on investments. The methodologies, referred to as Duration-based and Proportion-based approaches, are standardized so that the B/C ratio estimates are consistent and ensure confidence in the validity of the results. In addition, the TIM-BC tool applies to eight TIM strategies, identified by a project advisory committee, involving leading experts in the TIM community. These eight strategies include safety service patrols, driver removal laws, authority removal laws, shared quick clearance goals, preestablished towing service agreements, dispatch colocation, TIM Task Forces, and second Strategic Highway Research Program (SHRP2) training. The report also applies the methodologytool to a case study completed on the I–95 Corridor Coalition in New York that helps elucidate the need for standardized B/C ratio estimation and demonstrate the effectiveness of the developed TIM-BC tool. The outline of this report is as follows. The next section describes findings from a TIM-related literature review. The third section illustrates methodologies of BC estimation for TIM strategies. A Web-based TIM-BC tool is introduced in the fourth section, which is followed by a discussion of a case study that examines the application of the TIM-BC tool for a segment of roadway in the greater New York City metropolitan area. Conclusions and recommendations from this project are presented in the final section.
5
TRAFFIC INCIDENT MANAGEMENT OVERVIEW
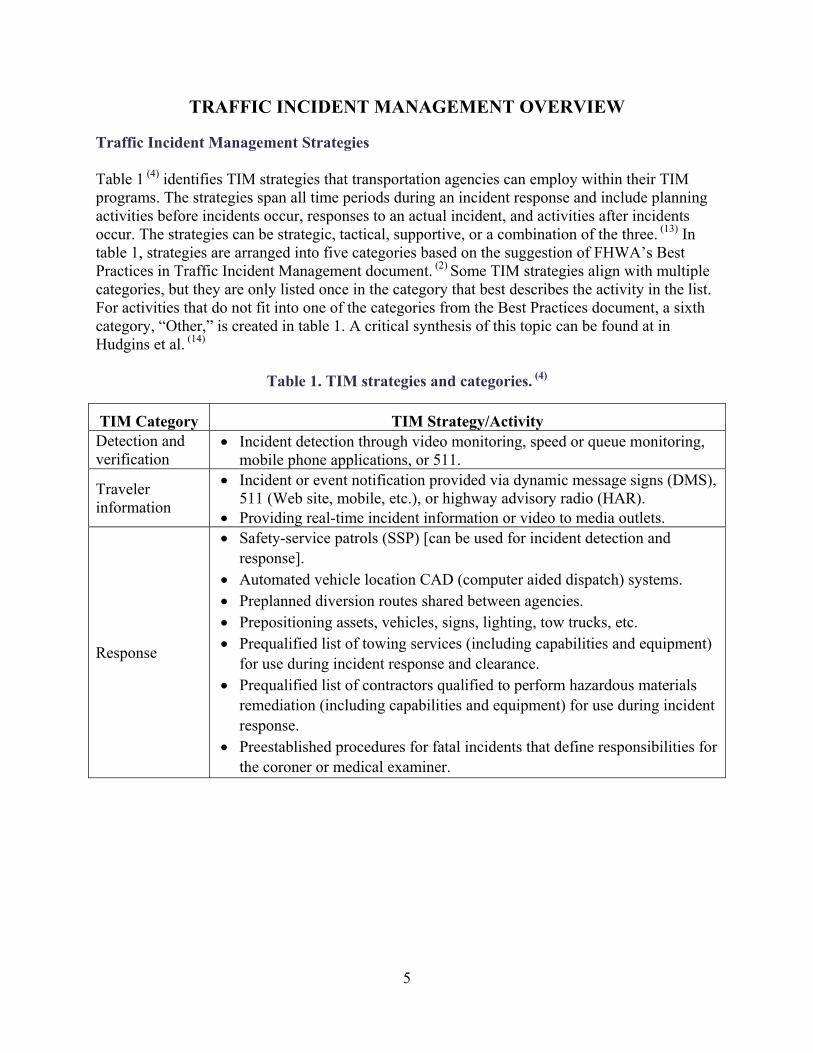
Traffic Incident Management Strategies Table 1 (4) identifies TIM strategies that transportation agencies can employ within their TIM programs. The strategies span all time periods during an incident response and include planning activities before incidents occur, responses to an actual incident, and activities after incidents occur. The strategies can be strategic, tactical, supportive, or a combination of the three. (13) In table 1, strategies are arranged into five categories based on the suggestion of FHWA’s Best Practices in Traffic Incident Management document. (2) Some TIM strategies align with multiple categories, but they are only listed once in the category that best describes the activity in the list. For activities that do not fit into one of the categories from the Best Practices document, a sixth category, “Other,” is created in table 1. A critical synthesis of this topic can be found at in Hudgins et al. (14)
Table 1. TIM strategies and categories. (4)
TIM Category TIM Strategy/Activity Detection and verification
Incident detection through video monitoring, speed or queue monitoring, mobile phone applications, or 511.
Traveler information
Incident or event notification provided via dynamic message signs (DMS), 511 (Web site, mobile, etc.), or highway advisory radio (HAR).
Providing real-time incident information or video to media outlets.
Response
Safety-service patrols (SSP) [can be used for incident detection and response].
Automated vehicle location CAD (computer aided dispatch) systems. Preplanned diversion routes shared between agencies. Prepositioning assets, vehicles, signs, lighting, tow trucks, etc. Prequalified list of towing services (including capabilities and equipment)
for use during incident response and clearance. Prequalified list of contractors qualified to perform hazardous materials
remediation (including capabilities and equipment) for use during incident response.
Preestablished procedures for fatal incidents that define responsibilities for the coroner or medical examiner.

6
TIM Category TIM Strategy/Activity
Scene management and traffic control
Traffic diversion or detour (and preplanning of detours). o Modifying traffic signal timing on detour routes and arterials. o Opening or closing high-occupancy vehicle (HOV) and high-
occupancy toll (HOT) lanes during incident. Temporary traffic control devices (portable DMS and lane control signs)
and procedures around incident or at the end of the incident queue. Move Over laws (require drivers to reduce speed and move to adjacent
lane when approaching incident scene). Application of certain design treatments with TIM impacts.
Incident command system used onscene (consistent with National Incident Management System/National Incident Command System (NIMS/NICS) standards).
Quick clearance and recovery
Safe, quick clearance laws. o Authority removal laws (allowing predesignated responders to
remove disabled or wrecked vehicles and spilled cargo). o Driver removal laws (require drivers involved in minor crashes (not
involving injuries) to move vehicles out of the travel lanes). Policy for removal of abandoned vehicles.
Other (mostly crossagency coordination, communication, and training)
Agency coordination and communication. o Agreements for information and data collection, integration, and
sharing across agencies. o Interoperable, interagency communications onsite between incident
responders. o Use of transportation management centers (TMC) and traffic
operations centers (TOC) to coordinate detection, notification, and response.
o Agreements for shared use of equipment, signing, and shared quick clearance goals and detour setup times.
Training incident responders on NIMS/NICS. Agency support for postincident debriefings, special event planning, and
TIM planning for maintenance/construction projects. Traffic Incident Management Stakeholders With the variety of TIM strategies available to local agencies, there is an extensive set of potential stakeholders or operators that can be involved in running TIM programs. It is important to note the variety of potential stakeholders in a TIM program because, in most cases, they come from many different agencies.

7
A truly effective TIM program requires active coordination and cooperation among the various agencies to time responses, maximize the flow of information, and avoid duplication of efforts during an incident. The list below identifies some of the major players in TIM strategy implementation, in addition to the actual roadway users and drivers involved in incidents. (15)
Law enforcement.
Fire, rescue, and emergency medical services (EMS).
Towing and recovery teams.
Hazardous materials response teams/contractors (in some areas, these teams can be found in the towing and recovery community).
Medical examiners/coroners.
Emergency dispatchers.
DOT/TMC staff. Benefits of Traffic Incident Management Strategies Application of TIM strategies could bring significant benefits. For the purpose of estimating benefits and costs, some of these benefits are translated into slightly different measures of effectiveness (MOE) that could be directly quantifiable. The MOEs can be defined as “indirect benefits” of the TIM strategies:
Reduces congestion. (15) o Decreases fuel consumption. o Minimizes emissions. o Diminishes travel time delays. o Improves travel time reliability. o Lowers vehicle operating costs.
Boosts efficiency and productivity for local agencies (law enforcement, responders, highway agencies, etc.). (5)
o Improves customer satisfaction for these agencies.
Increases the safety of people involved in incidents and other road users. o Reduces mortality/morbidity rates. o Decreases the opportunity for secondary incidents. (15)
Cuts the number of required law enforcement officers at the scene. (16) Widens responders’ understanding of how their actions affect the greater community. (15)
Heightens drivers’ confidence. (17) Ultimately, society sees benefits from TIM programs in the forms of improved health, productivity, and safety. A survey conducted in 1997 (1) indicated that improved traveler information dissemination resulted in increased driver confidence.

8
The benefits listed above apply most directly to system users (i.e., drivers and passengers on the roadway) and responding agencies, but they also apply to all travelers and many local businesses or industries because of reduced medical costs to society, diminished burden on the environment, and decreased burdens to productivity. Costs of Traffic Incident Management Strategies The following cost elements can result from applying TIM strategies:
Staffing costs.
Planning and operations costs, including training.
Implementation costs, especially for strategies involving infrastructure modifications.
Equipment procurement, maintenance, and depreciation (vehicles, signs, temporary traffic control devices, lighting, video monitoring, etc.).
o A major element of equipment upkeep is fuel costs for patrol or response vehicles.
Information technology systems and support (for communication with other agencies or public).
For the most part, TIM program costs are supported by roadway users through taxes. (5)
Existing Benefit-Cost Estimation Tools The existing BC estimation tools have two major categories: sketch planning and postprocessing tools. The most popular existing tools for estimating benefits and costs of TIM programs or strategies are listed in table 2. (18)
Table 2. Existing sketch planning tools and postprocessing tools. (18)
Category Name of
Tool/Method Developer (Year) MOEs Evaluated
Sketch Planning Tools
BCA.net Federal Highway Administration (1998)
Mobility, safety, environment, energy, vehicle operating cost
CAL-BC California Department of Transportation (Caltrans) (1999)
Mobility, safety, environment, vehicle operating cost
IMPACTS Federal Highway Administration (1999)
Mobility, environment, energy, vehicle operating cost
Screening Tool for ITS (SCRITS)
Federal Highway Administration (1999)
Mobility, safety, environment, energy, vehicle operating cost
Tool for Operations Benefit/Cost (TOPS-BC)
Federal Highway Administration (2012)
Mobility, safety, environment, energy, vehicle operating cost, reliability, agency cost

9
Category Name of
Tool/Method Developer (Year) MOEs Evaluated
Trip Reduction Impacts of Mobility Management Strategies (TRIMMS)
Center for Urban Transportation Research (CUTR) at the University of South Florida (2009)
Mobility, environment, energy
Postprocessing Tools
Surface Transportation Efficiency Analysis Model (STEAM)
Federal Highway Administration (2000)
Mobility, safety, environment, energy, vehicle operating cost, reliability, agency cost
ITS Deployment Analysis System (IDAS)
Federal Highway Administration (2003)
Mobility, safety, environment, energy, vehicle operating cost, reliability, agency cost
The Florida ITS Evaluation (FITSEval) Tool
Florida Department of Transportation (2008)
Mobility, safety, environment, energy, vehicle operating cost, reliability, agency cost
Source: This table is created by the Transportation Benefit-Cost Analysis Web site with the Transportation Economics Committee of the Transportation Research Board (TRB), (19) Booz-Allen & Hamilton Inc., (7) Cambridge Systematics, (8) (20) (21) Concas and Winters, (22) DeCorla-Souza, (23) FHWA, (24) FDOT, (25) Florida Intelligent Transportation, (9) Hadi et al., (26) and SAIC. (27)
Table 3 (18) describes the differences between sketch planning and postprocessing methods in the fields of geographic scope, budget, turnaround period, staff expertise, and data requirement. It can be seen that the sketch planning approach requires less resources than that of the postprocessing method.
Table 3. Comparison of operational analysis approaches. (18)
Category Sketch Planning Postprocessing Geographic Scope Any geographic level Any geographic level Budget Low ($1,000–$25,000) Medium/high ($5,000–$50,000) Turnaround Period Short (1–8 weeks) Medium (2–12 months) Staff Expertise General (ability in understanding
travel demand model outputs and spreadsheet based tools)
Medium/high (ability in travel demand modeling and postprocessing tools)
Data Requirement Less Medium


11
METHODOLOGY
This section describes in detail the methodology embedded in the TIM-BC tool. First, the section presents the selected TIM strategies according to surveys from the project advisory committee. It then addresses the development of a duration/proportion-based estimation (D/P-E) method to enable the comparison of traffic performance before and after the implementation of TIM strategies. A simulation-based evaluation approach is presented to calibrate regression models and populate lookup tables to predict travel delays, fuel consumption, emissions, and secondary incidents. Finally, methods to evaluate benefits and costs of selected TIM strategies are proposed. Selected Traffic Incident Management Strategies Critical Traffic Incident Management Strategies Selection Various types of TIM strategies have been implemented worldwide. Due to the constraints of time and budget, a project advisory committee was interviewed regarding which TIM strategies they use at their agencies. The strategies were then ranked from highest to lowest based on the percentage of respondents’ agencies that use that strategy. Eight TIM strategies that are most widely adopted and considered most effective were selected for the new TIM-BC tool, as shown in table 4.
Table 4. Eight Traffic Incident Management strategies selected based on interviews with project advisory committee.
TIM Strategy Description
Safety Service Patrols (SSP)
SSPs provides short-term traffic control and scene management along interstate highways and controlled-access primary routes, reducing incident duration and promoting the safe movement of people and commerce.
Driver Removal Laws (DRL) Driver removal laws require or encourage drivers whose vehicles are involved in a traffic incident to move their vehicles from the road when they are able to do so.
Authority Removal Laws (ARL)
Authority removal laws give TIM responders some measure of authority to have vehicles, debris, and spilled cargo removed from the road when the owners are unwilling or otherwise unable to do so in a timely manner.
Shared Quick-Clearance Goals (SQCG)
Some TIM management areas with coordinated, interdisciplinary TIM response structures adopt shared quick-clearance goals to improve clearance time across all incident types.

12
TIM Strategy Description
Preestablished Towing Service Agreements (PTSA)
Preestablished towing service agreements between TIM management agencies and local towing services promote, via contractual obligation, the level of service that those companies must provide. These obligations are usually set in terms of availability and response times of towing vehicles.
Dispatch Collocation (DC) Collocation of dispatch personnel and equipment can improve communication between responders, thus decreasing dispatch and initial response times.
TIM Task Forces (TTF) TTFs are groups of TIM-related planners, managers, and other personnel that meet periodically to coordinate activities and policies.
Second Strategic Highway Research Program (SHRP2) Training (ST)
SHRP2 National Traffic Incident Management Responder Training. SHRP2 training focuses on motorist and responder safety while minimizing impact to traffic flows.
Requirements of New Traffic Incident Management Benefit-Cost Tool The interviews with the project advisory committee also concluded that the new TIM-BC tool should mitigate many of the gaps identified in the other tools, leading to the following requirements (R1, R2, R3):
R1. The tool should be able to account for multiple TIM strategies with consistent methods. R2. The tool should account for both direct and indirect benefits. R3. The tool should be presented with a postprocessing, user-friendly interface and require
relatively simple data inputs from the user. In response to these requirements, this study proposes the following three solutions (S1, S2, S3), which will be detailed in the remainder of this report.
S1. The proposed BC estimation method, referred to as D/P-E, is suitable for the evaluation of all selected programs and applied consistently across eight subtools.
S2. The developed evaluation methodology adopts simulation and statistical analysis techniques introduced by TariVerdi (11) and Miller-Hooks et al.(12) to be able to estimate the savings caused by any TIM program in terms of travel delay (cars and trucks), fuel consumption, emissions, and secondary incidents.
S3. The developed tool is a user-friendly and easy-to-access Web-based tool that consists of multiple convenient functions, such as segment cloning, to avoid repetitive data entries by users. Input data requirements are low and only the most basic data that can be conveniently obtained are required, including general roadway geometry, incidents, traffic volume, composition, and general weather condition. Updatable monetary conversion factors are obtained from the latest identified, publically available database and embedded in the tool itself.

13
Duration/Proportion-based Estimation Estimation Method At the core of the developed TIM-BC methodology is an approach referred to as Duration/Proportion-based Estimation (D/P-E). This approach is based on the assumption that the benefits of TIM strategies, including travel delay, fuel consumption, emissions, and safety originate from the duration reduction of all or a proportion of incidents because of the TIM program. The three key parameters of this approach include:
Proportion of incidents that are susceptible to change by the strategy (applicable cases). Success rate of the strategy among applicable cases. Magnitude of improvement (incident duration savings).
These parameters need to be supplied by the users based on local conditions and engineering judgment. The tool provided default values to facilitate quick TIM evaluation, particularly for areas where targeted TIM programs have not been implemented and no relevant data are available. The most important parameters of the methodology are incident-duration savings. For SSP programs, there are data available from different agencies. A study of the evaluation of the SSP program in Los Angeles assumed that the SSPs would reduce incident duration by 10, 12.5, or 15 minutes, resulting in a B/C ratio that ranged from 3.75:1 to 5.5:1. (28) Moreover, the average duration of crashes and in-lane incidents handled with the Hoosier Helper SSP program were assumed to be lowered by 10 minutes while all other incident durations were reduced by 15 minutes. (29) Chou et al. (10) lengthened the duration of incidents without FSP assist incidents by between 5 and 25 minutes in 5-minute increments for studies on the SSP program of New York State, H.E.L.P. (Highway Emergency Local Patrol).They obtained results from statistical analysis of system data that are consistent with recommended values by the project committee during the interviews. Therefore, an average of 20 minutes for duration savings of the SSP programs was suggested in the TIM-BC tool as a default value. These values vary by program and roadway; local values should be used if available. However, no studies have been found to evaluate the duration savings for other strategies based on real-world data. Therefore, these values were obtained from the second round of interviews with the project advisory committee, as shown in table 5. Information on other key parameters, such as the proportion of incidents that can be affected and the types of lane blockage that are applicable to different TIM strategies, were also obtained from the interviews, as shown in table 2. These values should be cautiously used, and when data are available, local values should be used to replace these default values.

14
Table 5. Evaluation methods and default parameters for selected TIM programs.
TIM Strategy Methodology Default Parameter Values
Safety Service Patrol (SSP) Duration-based Average duration savings: 20 min Apply to all types of lane blockage
Shared Quick-Clearance Goals (SQCG)
Preestablished Towing Service Agreements (PTSA)
Dispatch Collocation (DC)
TIM Task Forces (TTF)
SHRP2 Training (ST)
Duration-based and proportion-based
Proportion: 100% Implementation: 100% Average incident duration savings:
10 min SQCG, TTF, ST – All types of
blockage PTSA – All types of blockage
other than shoulder DC – Two-lane blockage or
greater
Driver Removal Laws (DRL)
Authority Removal Laws (ARL)
Duration-based and proportion-based, with hypothetical incidents
Proportion: 50% Compliance rate: 30% Average incident duration after
DRL implementation on mainline:a 5 min
Average incident duration after ARL implementation on mainline:a 10 min
DRL applies only to one-lane blockage; ARL applies to all types of lane blockage except shoulder
a After implementing DRL and ARL, the duration of incidents in the general lanes are reduced to 5 minutes. After vehicles moved to the shoulder, these incidents are processed and are referred to as shoulder incidents. The methodologies for the selected eight TIM programs are categorized into three types, as shown in table 5. Based on the interview findings, it is recommended that a pure duration-based approach may be applied to SSP program analyses because it has the potential to reduce incident duration of almost all incidents. Users enter average duration savings or duration savings by lane blockage if available. Programs such as SQCG, PTSA, DC, TTF, and ST can also reduce incident duration but only apply to a proportion of incidents, and therefore a combined Duration and Proportion estimation method is applied. Users should enter average duration savings, percentage of applicable cases, and actual successful implementation rate. DRL and ARL move a proportion of incidents from general lanes to the shoulder lane, and these incidents then become shoulder incidents after the removal. The impact of the new/hypothetical shoulder incidents on traffic should also be considered. Therefore, in addition to the combined Duration and Proportion estimation, hypothetical shoulder incidents are considered, and the amount of hypothetical shoulder incidents are set identically to the removed incidents from general lanes.

15
Users should enter the average shortened incident duration percentage of applicable cases and actual successful implementation rate. Note that the duration of hypothetical shoulder incidents is assumed to be the value obtained by subtracting shortened incident duration from the original general lane incident duration. Examples The following examples illustrate the concepts. Additional examples of selected TIM strategies are provided in appendix B. Assumption During the AM peak time period, there are 25 shoulder incidents with an average duration of 30 minutes, 20 one-lane incidents with an average duration of 35 minutes, and 10 two-lane incidents with an average duration of 45 minutes for the study period. Three scenarios for each of the three method categories in table 2 are provided next. Scenario 1: SSP Since the SSP applies to all entered incidents (since the tool requests inputs of the number of incidents to which only SSP vehicles have responded), with suggested average incident duration of 20 minutes, after the implementation, there are 25 shoulder incidents with a duration of 10 minutes (30 – 20 = 10), 20 one-lane incidents with a duration of 15 minutes (35 – 20 = 15) and 10 two-lane incidents with a duration of 25 minutes (45 – 20 = 25). Scenario 2: DC Since the DC applies to two-lane blockage incidents, after the implementation, there are 25 shoulder incidents with a duration of 30 minutes (no change), 20 one-lane incidents with a duration of 35 minutes (no change), and 10 two-lane incidents with a duration of 40 minutes (45 – 5 = 40). Scenario 3: DRL Since DRL applies to one-lane blockage incidents with assumed applicable proportion of 50 percent and a compliance rate of 30 percent, the duration of half (10) of the one-lane blockage incidents could be reduced (i.e. driver removal is possible) to 5 minutes as a result of driver removal. Of these incidents, 30 percent are assumed to be cleared by compliant drivers. After the implementation, there are 17 (20 – 3 = 17) one-lane blockage incidents with a duration of 35 minutes, 3 (0 + 3 = 3) one-lane incidents with a duration of 5 minutes, that are then moved to the shoulder, 25 shoulder incidents with a duration of 30 minutes (unchanged), and 3 (0 + 3 = 3) hypothetical shoulder incidents with duration of 30 minutes (35 – 5 = 30). Data Collection Based on Microscopic Simulation Selected Simulator The simulation experiments were conducted using VISSIM (from "Verkehr In Städten – SIMulationsmodell" – German for "Traffic in cities – simulation model") microscopic traffic flow simulation (henceforth microsimulation) modeling platform.

16
As with other microsimulation models, VISSIM replicates individual movements of vehicles that make up the traffic composition, including personal cars, light- and heavy-duty trucks, motorcycles and transit vehicles, and related driver decisions. The properties of the different vehicle classes in terms of weight, power, and acceleration/deceleration rates were incorporated. In addition, driver behavior, including lane-changing behavior and other aspects of aggressiveness, was captured through the use of car-following models. Thus, simulation runs replicated the individual vehicle movements based on desired speeds, traffic volumes, vehicle and driver characteristics, interactions between the various entities, and interactions between these entities and the physical environment (i.e. roadway geometry). In this study, traffic conditions surrounding incidents were replicated as well. Incident duration, number of lanes blocked, and other features were modeled. Their impacts on traffic in terms of driver response (e.g., rubbernecking) and induced delays due to, for example, the created shock wave and reduced roadway capacity were simulated. To support the development of the models, various input data elements were required. This input includes:
Geometry of each roadway segment. Traffic composition. Traffic characteristics under varying weather conditions (specifically, desired speed). Demand (specifically, traffic volume). Incident attributes. Choice of parameter settings affecting driver behavior (this input is also needed for car-
following modeling). To conduct the large number of needed simulation runs, the component object module (COM) interface of VISSIM was employed. The COM interface allows a modeler to access VISSIM objects (e.g., an individual vehicle) and control factors used in the underlying computational methods through a scripting language. Visual Basic was employed using this COM interface to develop codes that support batch runs in which input data—i.e., traffic conditions surrounding incidents—were varied. Thus, different incident scenarios were replicated in an automated manner. Each VISSIM simulation under a given incident scenario produced outputs for specific BC estimates. In this effort, estimates of total travel delay (i.e., the difference between total travel time at free-flow speeds and realized total travel time as shown in equation 1) and fuel consumption were needed. VISSIM provides an estimate of total travel delay by vehicle class (specifically, passenger vehicles or heavy-duty trucks in this study) as an output. This estimate is based on the equation in figure 1. Thus, from each scenario, a single value of total travel delay per vehicle class was reported.

17
Figure 1. Equation. Total travel delay calculation.
where
D = total travel delay. = vehicle index. = time index. = desired speed by vehicle at time = actual simulated speed of vehicle at time .
∆ = 1/number of time steps per simulation second (0.2). Pollutant emissions were also estimated based on fuel consumption estimates, which were computed through previously developed fuel consumption estimation techniques, since it was found in earlier work that VISSIM does not reliably estimate fuel consumption. Details of this technique can be found in Miller-Hooks, et al. (30) The developed technique accounts for vehicle characteristics, such as weight and power, and the effects of roadway grade. This estimation technique requires second-by-second vehicle speed and acceleration profiles as input. From each simulation run, two files were created: one file includes the total travel delay estimation and the other, significantly larger file contains the second-by-second speed and acceleration profiles, which are used for fuel consumption estimation. The output from the analysis of an individual output file containing the speeds and accelerations is a single value of total fuel consumption for the given incident scenario. The estimated total travel times and total fuel consumption were collected in a single Microsoft® Excel file to develop fuel consumption estimation regression models for use in the overall benefit computations. Contributing Factors and their Relationships Miller-Hooks et al. (30) identified the factors that have the greatest effect on travel delay, fuel consumption, and emissions. For example, roadway geometry (such as number of lanes, gradient and curvature, density of ramps in the roadway segment, traffic volume and composition, and weather) influence the available capacity of a roadway segment and fuel consumption rates. Initial runs were completed in the earlier work to study trends in travel delay and fuel consumption estimates resulting from univariate changes in the identified factors as well as correlations between factors. Table 6 summarizes the factors that were considered and the ranges of the factors used within these initial experiments. One of the findings was that the percentage of trucks and segment grade are independent with other explanatory variables. This insight was exploited in the creation of the regression models presented herein. An additional goal of the initial runs made in the earlier research was to assess VISSIM’s capacity to capture the effects of changes in the various identified factors. It was found that capturing the effects of weather, density of ramps, and horizontal curvatures on roadway performance required changes to the free-flow speeds of vehicles travel on the main lanes.

18
Table 6. Summary of variables and the range used in numerical experiments. (30)
General Attributes Factors Range Used
Geometry of the roadway segment
Segment length *20 miles Number of lanes and average lane width
2–8 lanes, 12 feet
Lateral clearance (shoulder) 6 feet Ramps 0 to 20 ramps/mile Horizontal curves Straight, Mild, Sharp Segment gradient 0, 2.5, 7.5 percent
Traffic characteristics
Free-flow speeds (FFS) 55–75 mph Ramp FFS 25–35 mph
Traffic flow rate 200–2,200 (vehicles per lane per hour, vplph)
Percentages of trucks in traffic flow
0–18 percent
Incident attributes
Incident severity Shoulder-only through up to 1 open lane in the segment
Average incident duration 0–240 minutes (5-minute increments up to 2 hours, 30-minute increments from 2–4 hours)
Rubbernecking effect 500 feet upstream of incident location Weather conditions Clear, Light Rain, Heavy Rain, Snow, Fog, Icy condition, Low Visibility, Wind *Modified for this study to capture longer backup queues.
Incident Modeling
Replicating Incidents within the VISSIM Platform. Numerous simulation-based traffic studies have used a variety of methods to model traffic incidents (i.e. events involving vehicles that block one or more lanes or the shoulder) within the VISSIM platform. VISSIM does not offer a specific technique for replicating incidents. This study employed the tools offered within the COM interface to model an incident by placing two passenger vehicles, each with a speed of zero, in each blocked lane in the incident location for the incident period. Specifically, the vehicles were placed within the simulation at the incident location (in the blocked lanes) from the start time of the incident to the end of the incident’s clearance time, as shown in figure 2. Incidents were assumed to arise adjacent to the shoulder. Thus, in an incident involving one blocked lane, that lane was the lane closest to the shoulder. In an incident with two lanes blocked, the two lanes closest to the shoulder were assumed to be involved. Combinations where other lanes, such as the middle lane or the far left lane, were the only lanes blocked were not considered. At the end of this incident period, vehicles involved in the incident were simultaneously removed from the blocked lanes and vehicles traveling in the affected lanes accelerated until they reached their original desired speed.

19
Additionally, the incident impact area was assumed to span at most 20 miles and incident duration for incidents involving TIM implementations would not exceed four hours. To capture the impact of the rubbernecking effect associated with the incident, temporary reduced speed areas in the adjacent lanes were set in the simulation. The inclusion of this effect in the adjacent lanes allows the replication of reduction in speed in unblocked lanes during the incident period and reflects the lower capacity of the highway segment. Hadi et al. (31) found that, within the VISSIM platform for freeways with 3 lanes (in a single direction), a speed of 20 mph in adjacent lanes results in the suggested available capacity for the incident period according to the Highway Capacity Manual 2000. (32) The speed reduction value by lane required to capture the capacity reduction due to rubbernecking in freeway segments with more than four lanes (in a single direction) was determined experimentally in a previous study. (30) Setting the rubbernecking effect in this manner imposed an additional modeling step. To set up the reduced speed area, the desired speed along that stretch of roadway was reduced to 20 mph. Thus, VISSIM computed the travel delay in this area assuming a desired speed of 20 mph. However, the desired speed needed for travel delay computation (equation 1) is the preincident desired speed. The delay incurred due to the speed reduction associated with the incident should be counted in the travel delay estimates. Consequently, VISSIM 6.0 will underestimate the travel delay due to the incident. To address this, travel delay was recomputed using the preincident desired speed of each vehicle recorded in the vehicle record output file. (12)
© University of Maryland, College Park. Used with permission.
Figure 2. Diagram. Incident layout on typical three-lane unidirectional freeway segment. (30) (11)
Replicating an Incident in a Simulation Run. Details associated with the replication of a single incident within the simulation environment are described below.

20
Simulation Time. For incident scenarios with an incident duration of less than 120 minutes, one replication involved 11,100 simulation seconds, which included a 30 minute warmup period, 300 seconds from the end of the warmup period until the incident occurrence, and 2.5 hours of data collection. The simulation time was increased to 18,300 simulation seconds for incidents with an incident duration of 120 to 240 minutes (to include 4.5 hours of data collection). The choice of the 1,800 second warmup period was made based on a suggestion given in the VISSIM software user manual. (33) The warmup period is required to load the segment and achieve a steady traffic flow along the segment by the start of the analysis period. As noted, incidents were set to occur 300 seconds after the end of the warmup period or 2,100 seconds into the simulation. A detailed analysis to determine the length of the warmup period can be found at Miller-Hooks et al. (34) The actual time required for each replication was approximately 480 seconds for incident durations under 120 minutes or 900 seconds for incident durations between 120 and 240 minutes on a Dell Precision T7500 personal computer with a 3.20 gigahertz quad core processor and 12 gigabytes of random access memory running a 64-bit Windows 7® operating system. Random Seeds. The VISSIM user manual (REF) (PTV AG 2014) suggests conducting a minimum of three runs with different random seeds for each simulation experiment and reporting the average performance values over these runs in the final results. Additional experiments revealed that only small improvements in computational accuracy could be achieved using a higher number of random seeds. (34) (12) Simulation Resolution. VISSIM is a time-based (as opposed to event-based) simulation technique. Thus, a time step for updating the vehicle locations must be set. The software user manual (REF) (PTV AG 2014) suggests a simulation resolution of one time step per simulation second. In initial experiments, it was found that using one time step per second led to high values of lost vehicles (vehicles that cannot enter the network). Thus, five time steps per simulation second (or 0.2 time steps per simulation second) were used instead. (12) (30) Traffic Flow Calibration. Calibration of the simulation software to actual traffic conditions is essential to ensure that the simulation model will adequately replicate reality. Miller-Hooks et al. (12) identified five car-following and lane-changing parameters in VISSIM that had significant effects on travel delay estimation. After completing an extensive effort to calibrate a model of a 41-mile Maryland freeway (82 miles in both directions) against actual travel time measurements, the research findings suggested changes to four of the five values. The parameter settings suggested to be calibrated are: “Following” Variation (CC2), “Following” Thresholds (CC4&5), Safety Distance Reduced Factor (SDRF), and Look Back Distance (LBD). Their definitions, default values, possible range in VISSIM, and the final set that are used in this study are listed in table 7. SDRF and LBD are lane-changing parameters associated with driver behavior. These settings are discussed in more detail by in Miller-Hooks et al. (12)

21
The recommended parameter settings were based on a comparison between actual measured travel times and estimates of travel times obtained using VISSIM 5.4 for a studied roadway. Additional experiments were conducted herein to assess the use of these parameters within VISSIM 6.0. Runs were made with both VISSIM 5.4 and 6.0, and no significant changes in estimated travel delay were observed in results from runs involving the study segment. Thus, these recommended parameters were used in this study.
Table 7. Driver behavior parameters. (35)
Parameter Definition Default Value Adjusted for SSP-BC Tool
“Following” Variation (CC2)
Following variation: desired safety following distance
4 meters 39.37 feet
“Following” Thresholds (CC4&5)
Lower and upper following threshold
0.35 mph 0.1 mph
Safety Distance Reduced Factor (SDRF)
Safety distance reduced factor: effects safety distance during lane changing
0.6 0.1
Look Back Distance (LBD)
Look back distance: defines the distance at which vehicles will begin to attempt to change lanes
200 meters 3,280.83 feet
SSP-BC = Safety Service Patrol Benefit-Cost Scenario Design Ideally, all possible combinations of number of lanes in the roadway segment, roadway grade, FFS, traffic volume and composition, number of lanes blocked, and incident duration with ranges presented in table 8 would be replicated. This would require the replication of 246,960 combinations, each repeated three times to accommodate three seeds. Thus, 740,880 runs would be needed. At 700 seconds per run on average, using the computer described previously, it would take approximately 16 years to run these simulation combinations. This estimate does not account for the time required to process the output. Through the development of regression models and the use of the hybrid statistical-simulation methodology, the number of simulation runs can be reduced significantly with little reduction in accuracy. To achieve this, two sets of runs were completed. The first involved a random sample of 1,319 incidents. To attain a representative sample, statistical distributions of incidents were studied in the literature and all the factors were selected in accordance with identified distributions. Incident frequency distributions were used to calculate the probability of each incident category by severity. For example, vehicle breakdowns were assigned higher occurrence probabilities than were rarer events such as a four-lane blockage incident on a six-lane highway. It was assumed that the explanatory variables are independent and uncorrelated with one another. Where this assumption was invalid, appropriate modeling techniques were used to minimize any effect on the development of the regression models. (30) Results from this first set of simulation runs were used to develop and calibrate the regression models. These models are discussed in more detail below.

22
Table 8. Contributing measure of effectiveness factors directly employed in simulation designs.
Factor Range used Number of lanes and average lane width 2–6 lanes, using increment of one lane Segment gradient (percent) 0, 2.5, 7.5 percent FFS (miles per hour, mph) 40–75, using 10-mph increment Traffic flow rate (vehicles per lane per hour, vplph)
500, 1,000–2,200, using 200 vplph increment
Percentage of trucks in traffic flow (percent)
0–18 percent, using 2-percent increments
Incident severity Shoulder, up to only 1 open lane in the segment
Average incident duration 0–240 minutes (5-minute increment up to 120 minutes, 30-minute increments from 120–240 minutes)
The second set of runs involved replication of 162,599 incidents, including the 1,319 incident scenarios from the first set of runs. These runs were required as input to the hybrid statistical-simulation methodology introduced by Miller-Hooks et al. (11) and used herein. This approach was developed to improve the estimation accuracy of these regression models.
Benefit Estimation Modeling
Regression Models
Regression equations were developed for estimating travel delay for light-duty vehicles (passenger cars), travel delay of heavy-duty vehicles (including trucks), and fuel consumption for passenger cars. Fuel consumption savings for heavy-duty vehicles are incorporated through the monetization of related travel delay savings and thus need not be treated separately. These regression equations, the methods undertaken for their calibration, and the results from statistical analyses to test their goodness-of-fit are presented in this section. The linear regression models of travel delay and fuel consumption were obtained based on the explanatory variables included in table 8. Additional variables based on the same factors were developed through composition of variables techniques in which the variables were taken to different powers or were multiplied. Different linear and nonlinear regression models were tested and assessed using various goodness-of-fit tests. For each model, a stepwise technique was employed to find the best subset of explanatory variables to include in these models. The SAS statistical software package was employed for the statistical analysis conducted herein. To choose the best estimation model for travel delay and fuel consumption from the set of candidate models, the coefficient of determination (R-square), adjusted R-square, graph of residuals, maximum log likelihood (assuming normality of the model error term), and analysis of variance and nonlinearity were studied. The maximum log likelihood estimate was used to compute the Akaike information criterion (AIC) and the Bayesian information criterion (BIC). All of these factors were considered in choosing the best-fitting model for each performance metric (travel delay and fuel consumption), resulting in the final three equations. An example of the regression model development process is shown in appendix A.

23
Selected Regression Models. The final regression models for travel delay for light-duty vehicles (LDV) and heavy-duty vehicles (HDV) and fuel consumption of light-duty vehicles are presented. The nomenclature used in these models is given subsequently.
Figure 3. Equation. Final Model of Travel Delay of Light-Duty Vehicles (Cars)
All variables are statistically significant with 0.01 confidence level, DurationP2 with 0.05
confidence level.
Figure 4. Equation. Final Model of Travel Delay of Heavy-Duty Vehicles (Trucks)
All variables are statistically significant with 0.001 confidence level.
where
TDc = Total travel delay of cars (hours) TDt = Total travel delay of trucks (hours) LogTDc = Ln(TDc) LnTDt = Ln(TDt) NofLaneIndex1 = (Number of open lanes / Number of lanes in each direction)*100 Duration = Incident duration (hours) DurationP2 = Incident duration2 (hour2) FFS = Free-flow speed (km/h) Comp(*10k) = Traffic composition – percentage of trucks SqrComp = Percentage of trucks power 0.5 Volume = Traffic volume (vplph, 1,000) VolumeP2: Traffic volume power 2 (vplph2, 1,0002) VolumeP3 Traffic volume power 3 (vplph3, 1,0003) Gradient Roadway gradient GradientP2: Roadway gradient power 2 (percent2)

24
Hybrid Statistical-Simulation Estimation While the final regression model for fuel consumption of cars has an acceptable R-square value at 0.812, the model does not fully meet assumptions made for the residuals–constant variance. The regression-simulation hybrid approach introduced by Miller-Hooks et al. (12) was employed to further improve this model as described in the following. Fuel Consumption Estimation. Miller-Hooks et al. (12) introduced and tested a hybrid statistical-simulation modeling approach in which the performance measures obtained from simulated incidents were integrated with estimates obtained from developed regression models. The aim of the technique is to reduce the error of the estimation models and more accurately capture the relationship between the performance measure and explanatory variable values. To employ this hybrid statistical-simulation approach, the total fuel consumption of cars was computed by summing two independent components: (a) and (b). Component (a) is the fuel consumption under an identical incident but with zero percentage of trucks (Truck %) and zero roadway gradient (Gradient). This baseline incident scenario is simulated in VISSIM to obtain fuel consumption as described above. Component (b) is the additional fuel consumption due to a higher percentage of trucks or different roadway gradient of the actual incident, compared with the baseline incident scenario. This excess consumed fuel is estimated by taking advantage of the independence of regression variables. Independence of variables allows estimation of the relevant proportion of fuel consumption associated to Truck % and Gradient using the lookup data generated based on microscopic simulation data. This is illustrated in figure 5.
© University of Maryland, College Park. Used with permission. Figure 5. Diagram. Statistical-simulation hybrid approach for estimating fuel consumption
of light-duty vehicles.
Component (a) is estimated for baseline incident scenario (Truck % = 0 and Gradient = 0) based on the lookup table from the VISSIM simulation run.
Fuel consumption of an incident for the scenario with nonzero percentage of trucks and gradient is: fuel consumption computed for remodeled incident from VISSIM vehicle record output file + . . . .
Component (b) employs coefficients from this part of the regression model to obtain additional fuel consumed above the baseline.

25
Emission Calculation. Similarly to approaches used in Miller-Hooks et al., (12) fuel consumption and emission computations are adopted from Melanta et al. (36) Fuel-based emission factors (i.e., mass of pollutant produced per unit of vehicle activity) The emission factor for pollutant (EFPol) for the LDV and light-duty trucks (LDT) vehicle categories for major fuel types (i.e., gasoline and diesel) were obtained from the U.S. Environmental Protection Agency (refer to table 9). These emission factors in combination with other variables specific to the vehicle categories (e.g. fuel economy, time spent on roads, etc.) and fuel (i.e., density, EFPol) were then used to calculate the emissions output for each pollutant (EMPol) using the equation in figure 4.
Figure 6. Equation. Emission Estimation for Co2, HC, CO, NOx.
The sulfur content in a fuel affects the amount of SOx emissions produced when fuel is consumed. Therefore, the sulfur contents (SCFuel as obtained from table 10) for gasoline and diesel were used to estimate the SOx emissions for a vehicle category using the following relationship:
Figure 7. Equation. Estimation of SOX emissions.
where
EMPol = Emission for pollutant (g) EMSOX = SOx Emission (g) EFPol = Emission factor for pollutant (g/mile) ρFuel = Density of fuel (g/gal) Fuel Economy LDV/LDT = Fuel Economy for vehicle category (gal/mile) T = Total time travelled by vehicle category (sec) SCFuel = Sulfur Content of Fuel (ppm) FR = Fuel consumption rate (g of fuel/sec)
While the equations in figures 4 and 5 use the term FR* T to calculate fuel consumption, in our tool, the fuel consumption values are calculated from the previous step and those values are used to replace FR* T in each of the equations.
Table 9. Emission factors.
Vehicle Fuel
Economy (mile/gal)1
Emission Factors for Gasoline (g/mi)
HC CO NOx CO2
LDV 22.1 2.8 20.9 1.39 451 LDT 17.6 3.51 27.7 1.81 637
CO = carbon monoxide, CO2 = carbon dioxide, HC = hydrocarbon, NOx = nitrogen oxide.

26
Table 10. Fuel properties.
Fuel Base Fuel ρ(g/gal) SCFuel (ppm) Gasoline Base fuel 2834.95 80 Diesel Base fuel 3210.98 500
Secondary Incidents Calculation. A robust approach for calculating secondary incidents is explained in Chou and Miller-Hooks. (10) However, data requirements and analysis required for the method is beyond the capability of many TIM programs. Therefore, the secondary estimation method developed by Miller-Hooks et al. (11) is adopted. The number of secondary incidents without TIM is assumed to be linearly correlated to the travel delay ratio of without and with implementation of TIM, as shown in the equation in figure 8.
Figure 8. Equation. Secondary Incident Estimation.
where
= Number of secondary incidents for extended incident duration case (without case). = Number of secondary incidents in base case (with case).
= Travel delay for the extended case. = Travel delay for the base case.
The number of secondary incidents as a fraction of primary incidents is given as user input. For this analysis, the number of secondary incidents ( ) as a fraction of primary incidents must be known regardless of the chosen secondary incident classification method. and are parameters. Total Benefit Calculation Monetary Values. To isolate a single unit for evaluation of a TIP strategy, congestion-related travel delay (vehicle-hours), fuel consumption (gallons), and number of secondary incidents prevented are converted into their monetary equivalents. Sources of the monetary equivalents in the TIM-BC tool proposed herein are provided in table 11. Four individual tables containing this information support the BC ratio computation within the tool. They are also designed to be updatable.

27
Table 11. Summary of monetary equivalents.
Variable Corresponding
Output Description Source
Average gasoline prices
Gallons of fuel saved
Used to monetize the wasted fuel that would result from increased congestion if SSP did not exist. NOTE: fuel is already factored into the Hourly Truck Cost, and the monetization of wasted fuel should only be performed on the passenger vehicle share. (37)
U.S. Energy Information Administration, Gasoline and Diesel Fuel Update; updated 5:00 p.m. every Monday; http://www.eia.doe.gov/oog/info/gdu/gasdiesel.asp
Average labor costs
Hours of delay prevented
Used to monetize lost productivity of passenger vehicles resulting from increased congestion if SSP did not exist. (38)
U.S. Department of Labor, Bureau of Labor Statistics; State Occupational Employment and Wage Estimates; http://www.bls.gov/oes/current/oessrcst.htm
Commercial vehicle costs per hour
Hours of delay prevented; Gallons of fuel saved
Used to monetize lost productivity of commercial vehicles resulting from increased congestion if SSP did not exist. (39)
ATRI, An Analysis of the Operational Costs of Trucking: A 2014 Update, http://www.atri-online.org/wp-content/uploads/2014/09/ATRI-Operational-Costs-of-Trucking-2014-FINAL.pdf Based on actual operational cost data collected from motor carriers across the country, representing a cross-section of industry sectors.
Secondary incident cost
Number of secondary incidents averted
Represents only the cost of property damage. Used to monetize the cost of additional secondary incidents that would result from increased congestion if SSP did not exist. (40)
National Highway Transportation Safety Administration, The Economic Impact of Motor Vehicle Crashes: 2000 (Revised).

28
While some previously developed BC ratio estimates made for TIM strategies have included monetized emissions equivalents in the savings computation, a review of the literature indicates that the available monetary equivalents are based largely on soft, intangible costs as opposed to more quantifiable costs, such as the price of a gallon of fuel. Thus, the value for tons of emissions saved is reported separately and is not included in the BC ratio computed in the TIM-BC tool. (11) Average hourly wages are used to convert savings in travel delay to a monetary equivalent. Wage values are available both at metropolitan levels and as a State average. Additionally, data containing the share of commercial vehicle miles traveled (VMT) compared to total VMT by State were used for the truck composition estimates for each State. These data are necessary to distinguish between the benefits derived from savings in travel delay for passenger vehicles and those for commercial vehicles. The average operational cost of trucking for 2014 is $67 per hour
based on table 11. The BC ratio is highly sensitive to the cost of secondary incidents. In this study, cost represents “property only damage” incidents and for 2014 that value is assumed to be $4,736 based on table 11. Other costs associated with higher severity incidents and congestion due to secondary incidents were not considered.
Computing Total Benefit. To compute the total savings in travel delay, fuel consumption, emissions, and secondary incidents resulting from a TIM strategy in a segment over a period of time, information pertaining to the incidents arising along the studied roadway segment during the study period is needed. Specifically, the distribution of incidents with respect to lane blockage must be known (or approximated). Assuming any two incidents are independent, TS , the total savings of type , where = {total travel delay, fuel consumption, emission, secondary incidents} for every incident arising during a period of time over a road segment as described in the equation in figure 7 can be computed. When using this method, it is necessary to assume that an individual incident has no influence on other incidents on the road. Furthermore, savings in travel delay and fuel consumption is related to geometry characteristics of the study segment and weather conditions at the time of the incident by adjusting FFS. The geometry characteristics are similar for all incidents in a study segment. However, the weather condition might vary incident by incident in a period of time. One incident under weather conditions would have a different actual speed. Therefore, having the probability of each weather type, P , the savings from one incident can be estimated as exhibited in the equation in figure 9. (11)
Figure 9. Equation. Total Savings Estimate.
where = Total saving of type .
= Type of saving {Total travel delay, fuel consumption, emission pollutants}. = Individual incidents. = Weather conditions {Clear, light rain, heavy rain, low visibility, snow, fog, icy}.

29
= The probability of weather condition.
, = Saving type in incident of weather condition . Given monetary conversion rates for travel delay, fuel consumption, and secondary incidents, total program benefit can be computed. Assuming that benefits are uniformly distributed over length, the total benefit of the TIM strategy over the study period and roadway segment can be computed as shown in the equation in figure 10.
Figure 10. Equation. Estimation of total benefits of implementing a TIM strategy.
where
= Total benefit of implementing a TIM strategy. = Travel delay (1), Fuel consumption (2), Emissions (3), and Secondary incidents (4).
= Monetary equivalent of saving . = Length of study segment.
The approaches to estimating benefits of various TIM programs are made consistent by using the D/P-E method. However, the estimation of the number of incidents and incident durations are different for different TIM strategies. More details about this estimation are provided in appendix B. Cost Calculation The total cost of a TIM strategy, , has two major components: operating cost and other related costs. For SSP, the operating cost is a function of the number of roving SSP trucks along the study segment, hourly operating cost per truck, number of working hours, number of workdays in a year, fuel costs for each vehicle, cost of giveaway fuel to drivers whose vehicles ran out of gas, and other costs, such as vehicle maintenance. The equation in figure 11 shows the method to calculate the total cost of a TIM strategy.
Figure 11. Equation. Method for calculating the total cost of a TIM strategy.
where
= Total annual cost for operating a TIM strategy in dollars. = Cost per truck-hour {hourly wage of driver, fuel cost of the vehicle}. = Number of roving trucks. = Number of working hours in each day.
= Number of workdays in a year. = Annual giveaway fuel consumption.
= Other related cost. = The operation cost for a TIM strategy in dollars.

30
The cost of many TIM strategies can oftentimes be easily calculated, as many TIM programs are outsourced and the charges are provided contractually. The cost of a TIM strategy for a specific roadway segment may be less clear. Two general methodologies were considered herein for the computation of segment-based costs. First, given total program costs, costs associated with a given segment can be computed based on the proportion: number of the total incidents to which the TIM strategy implemented for the study segment to total incidents that implemented the TIM strategy. This computation is captured in the equation in figure 12.
Figure 12. Equation. Method for calculating costs of operating TIM strategies along a
corridor.
where
= Cost of operating a TIM strategy along the study segment = Total annual cost of the TIM strategy
= Number of incidents implemented during the TIM strategy along the study segment
= Total number of incidents implemented during the TIM strategy The second portion of the methodology is to compute the costs associated with a given segment by the proportion of its length to the total length of covered roads that apply a TIM strategy. Using this method, we assume that cost is uniformly distributed over the length of the roads of the TIM strategy service area. The first method is used in developing the TIM-BC tool in this study. The Benefit-Cost Ratio The obtained benefit from equation 8 and cost from equation 10 are used to assess the segment-based BC ratio for a given TIM strategy over the study period. The TIM-BC tool provides multisegment analysis. The BC ratio of n segments is computed from the ratio of the sum of benefits to the sum of costs for all segments, as shown in the equation in figure 13.
Figure 13. Equation. Model for calculating benefit cost ratios.
where
⁄ = B/C ratio of multiple segments. = Obtained benefits of implementing a TIM strategy for the segment . = Costs of implementing a TIM strategy for the segment .
Note that within the TIM-BC tool, savings in pollutant emissions are not translated to dollars. Thus, it is not included in the BC ratio. Emissions reductions are given separately in the form of metric tons.

31
Additional Benefits Additional savings that have not been quantified in this study include improved safety not only in preventing secondary incidents, but also in improving the users’ feeling of security on transportation systems, reduced congestion costs associated with the secondary incidents, more efficient freight transit system, greater environmental benefits, and the accrual of advantages to other agencies, such as additional time available for troopers for more urgent tasks that TIM strategies cannot address. The following is a list of some additional costs associated with incidents: Administrative costs: The cost (monetary and temporal) associated with investigating and
documenting primary and secondary incidents. In the case of fatal incidents, costs increase exponentially. In general, there are additional administrative costs associated with insurance claims.
Legal costs: The attorney fees and court costs associated with litigation resulting from primary and secondary incidents.
Rehabilitation costs: The cost of career retraining required as a result of disability caused by a roadway incident. An additional cost in this category is replacement employee costs. That is, employers often hire temporary help or compensate other staff by paying overtime to cover the position of an injured employee.
Disability/retirement income: If an employee suffers a career-ending injury, the employer will make payments to fund the employee’s disability pension.
Productivity reduction: This is the cost associated with lost wages and benefits over the victim’s remaining lifespan.
Numerous additional sources of benefits in cost reduction have not been included in the computation of program benefits within the proposed TIM-BC tool. The exclusion of the many additional benefits within the TIM-BC tool results in conservative BC estimates.


33
THE WEB-BASED TRAFFIC INCIDENT MANAGEMENT BENEFIT-COST TOOL
Introduction Based on the proposed methodology in the last section, a Web-based Traffic Incident Management Benefit-Cost (TIM-BC) tool was developed to help State and local transportation engineers, decision makers, and other users evaluate and compare the monetary value of different TIM strategies. The TIM-BC tool allows for quick global updates to backend calculations and default values and can allow for a more user-friendly interface. Users would only need an updated Web browser to use the tool. In addition, a compressed zip file can be downloaded from the dedicated Federal Highway Administration (FHWA) Web page (http://www.fhwa.dot.gov/software/research/operations/timbc) hosting the tool with a detailed user guide (41) so that the tool can be used without Internet access. The system flow process and architecture of the Web-based TIM-BC tool are illustrated in figure 14.
Figure 14. Diagram. System flow process and architecture for the Traffic Incident
Management Benefit-Cost tool.
Figure 15 shows a screenshot of the navigation page of the TIM-BC tool. By clicking the name of each TIM strategy, the user will be taken to a corresponding subtool.

34
© Federal Highway Administration, TIM-BC Tool.
Figure 15. Screenshot. Traffic Incident Management Benefit-Cost Tool navigation page with panels linking to all eight subtools.
Required Input Data When using any subtool, the users are required to prepare and enter some necessary data to conduct benefits and costs analyses for each of eight selected TIM strategies. The required input data are listed below:
TIM program information (e.g., TIM strategy, incident duration savings, location, time-of-day for implementation, and duration of period).
Segment information (e.g., segment length, curvature, terrain, and number of ramps). Incident records (e.g., number of incidents, incident durations, and secondary incident
rate). Program cost estimation. For example, the SSP subtool also offers the function for cost
estimation, with breakdown items, such as number of vehicles and average drivers’ wage. Using parameters and monetary equivalents stored in the backend database, the TIM-BC tool adopts the proposed methodology in this report to calculate travel delays before and after the implementation of the selected strategies, upon which the fuel consumption, emissions, and secondary incidents are also calculated. After entering basic information of a desired TIM strategy, the user will be presented with a project detail input page to prepare BC estimates. These estimates require information on roadway geometry, the selected strategy information, traffic, weather, and incidents. Figure 16 shows a sample of an SSP program. The tool also provides many user-friendly functions, such as segment cloning.

35
With this function, users can batch copy all segment information (making data entry much more convenient), assuming information, such as roadway geometry and weather conditions for adjacent analysis segments, is similar. Layout of the SSP-BC subtool enhances the usability of the prior prototype tool. (12)
© Federal Highway Administration, Safety Service Patrol Benefit-Cost Subtool.
Figure 16. Screenshot. User interface of Safety Service Patrol Benefit-Cost subtool for data input on roadway geometry, safety service patrol program information, traffic
information, and incident information.

36
Output After users enter all required data, final results will be generated. Figure 17 shows the Project Output/Calculate Ratio screen. Users can view the results on the right panel directly. Users can also access a printable PDF report with more detailed results by clicking the “Produce Report” button. The final results, including segment information and benefit results, are automatically produced and incorporated in a professionally designed PDF report.
© Federal Highway Administration, Safety Service Patrol Benefit-Cost Subtool.
Figure 17. Screenshot. Project output/calculate ratio screen.
The developed Web-based TIM-BC tool provides a user-friendly graphic user interface. Transportation decision makers, transportation engineers, and other users can easily assess the benefits and costs of applying each of eight selected TIM strategies by entering the required data. Where possible, user inputs were designed around data that are often collected during daily freeway operations. As a result, it is expected that the tool will have broad application in BC analysis for TIM strategies developed across the Nation.

37
CASE STUDY: THE NEW YORK EXPERIENCE
A case study performed on the I–95 Corridor Coalition in NY (10) is used to demonstrate the TIM-BC tool application. This study was performed on a 10-mile segment of I–287, beginning at the junction with I–95 and continuing west to the Tappan Zee Bridge in New York. (10) During the 6-month evaluation period, there were 659 incidents on the segment to which only SSP program vehicles responded. This stretch of roadway has 14 ramps and is four-lanes in each direction. The case assumes all level terrain and straight horizontal curvature. The speed limit was assumed to be 65 mph and the traffic volumes are categorized as 1,800 and 1,200 vehicles per hour for AM and PM peak periods with truck percentage of 7.8 percent. In addition to the SSP program evaluation (12) two other potential TIM programs, DRL and DC, are evaluated and compared with the SSP program. The annual program cost of the SSP program is calculated by the tool based on user input information on the number of patrol vehicles, driver’s hourly wage, working hours, fuel price, and other costs. Users are required to give an overall estimate of annual costs of the other two programs. Herein, a value of $4,000 for this segment is assumed for both programs.
Table 12. Evaluation results of three traffic incident management strategies.
Strategy Performance Measure
Safety Service Patrol
Driver Removal Law
Dispatch Collocation
Total Program Savings
Travel Delay of Passenger Vehicles
52,343 Vehicle Hours
503 Vehicle Hours 256 Vehicle Hours
Travel Delay of Trucks
1,326 Vehicle Hours
9.8 Vehicle Hours 7 Vehicle Hours
Fuel Consumption of Passenger Vehicles
–36 Gallons 104 Gallons 143 Gallons
Secondary Incidents
5.09 0.05 0.03
Annual Costs $161,280 $4,000 $4,000
Emissions Reductions
Hydrocarbon (HC) –0.0023 Metric Tons
0.0064 Metric Tons 0.0089 Metric Tons
Carbon Monoxide (CO)
–0.0171 Metric Tons
0.0481 Metric Tons 0.0663 Metric Tons
Nitrogen Oxide (NOx)
–0.0011 Metric Tons
0.0032 Metric Tons 0.0044 Metric Tons
Carbon Dioxide (CO2)
–0.3683 Metric Tons
1.0374 Metric Tons 1.4299 Metric Tons
Sulfur Oxide (SOx) –0.0059 Grams 0.0167 Grams 0.023 Grams
Benefit‐Cost Ratio
18.43 7.25 3.93

38
As shown in table 12, the SSP program is the most cost-effective strategy with a B/C ratio of 18.43, while the other two strategies have relatively low, but still high ratios at more than 3.0. The results indicate that all three investments are cost effective and should be considered for the segment. Further, with adequate funding for TIM programs, it is recommended that an SSP should be considered first. If their costs, particularly the institutional components, were to be reduced by five times, these two strategies will be comparable with the SSP, and should be considered for implementation. Sensitivity analyses were conducted with varying values of incident duration savings (0.5–2 times of default values). As shown in figure 18, the B/C ratio increases almost linearly with incident duration savings with similar shallow slopes. Also, the ranking of the three strategies does not change, further illustrating the robustness and reasonableness of the methodology employed in the tool.
0
5
10
15
20
25
30
35
40
45
0 10 20 30 40 50
B/C Ratio
Average Incident Duration Savings (min)
(a) Safety Service Patrol
0
1
2
3
4
5
6
7
8
9
0 2 4 6 8 10 12
B/C Ratio
Average Shortened Incident Duration (min)
(b) Driver Removal Laws

39
Figure 18. Chart. Sensitivity analysis results with varying values for incident duration
savings.
0
1
2
3
4
5
6
7
8
9
10
0 5 10 15 20 25
B/C Ratio
Average Incident Duration Savings (min)
(c) Dispatch Colocation


41
CONCLUSIONS
Traffic Incident Management (TIM) programs have been proven effective in mitigating the impact of traffic incidents on roadway safety and mobility performance by supporting quick incident response and clearance. Since some TIM programs can be costly to taxpayers, it is critical to estimate the return on investments of different TIM strategies. Benefit-Cost estimation studies have been conducted for numerous programs, the majority of which are related to SSPs. A wide range of estimation methodologies, however, have been used in these studies, and consequently these B/C ratio estimation results vary widely and are not comparable. Building on previous efforts of the preliminary SSP-BC tool developed by the University of Maryland, (12) this study expands the standardized methodology that can be universally and equitably employed in such B/C ratio estimation for different TIM programs. Such a standardized approach is essential to creating consistency and, therefore, greater confidence in the validity of the evaluation results. The methodology was then incorporated into a user-friendly Web-based TIM tool to facilitate cost-effective TIM evaluation by State DOTs. A New York synthetic case study compares the effectiveness of implementing three selected TIM strategies: Safety Service Patrol, Driver Removal Laws, and Dispatch Colocation. The case study example illustrates the B/C ratio estimation methodology and the effectiveness of the developed TIM-BC tool. While the new TIM-BC tool offers the possibility of evaluating a wider range of TIM programs, there are areas for future studies. For example, evaluation results of different TIM strategies are not additive because benefits and costs of different TIM strategies may not be independent. Future studies should consider potential interactions between different TIM strategies. Moreover, evaluation of other TIM strategies could be added to the TIM-BC tool. Further, finer details of various TIM programs, such as different SSP capacities (e.g., size of vehicles SSPs can move) can be potentially considered to improve the accuracy of the evaluation results. Last, since some key parameters used in the methodology were assumed based on interviews with the project advisory committee, it is necessary to collect more data (traditional and nontraditional) to determine values of these parameters. For example, it is critical to produce better linkages between the various TIM strategies and actual reductions in incident durations.


43
APPENDIX A: AN EXAMPLE OF REGRESSION DEVELOPMENT PROCESS
In this section, the regression model development process is illustrated by considering the travel delay of cars. Results of statistical analysis for the model are shown in table 13. Fit diagnostics for developed models, including residual graphs for each explanatory variable, were computed and analyzed. Additional steps to fit a nonlinear regression model to the data are presented. Similar steps were taken for development of the travel delay of trucks and fuel consumption models for cars, details of which are omitted for brevity.
Table 13. Linear regression model for travel delay of light-duty vehicles (cars).
Number of Observations Read 1320
Number of Observations Used 1320
Source DF
Sum of
Squares
Mean
Square F Value Pr > F
Model 6 16431362977 2738560496 348.29 0.0000
Error 1313 10324098945 7862984.726
Corrected Total 1319 26755461923
Root MSE 2804.10141 R‐Square 0.6141
Dependent Mean 3385.04141 Adj R‐Sq 0.6124
Coeff Var 82.83802
Variable DF
Parameter
Estimate
Standard
Error t Value Pr > |t|
Intercept 1 ‐4397.909706 520.739103 ‐8.45 0.0000
NofLaneIndex1 1 ‐36.5690578 3.88923507 ‐9.40 0.0000
Duration(hours) 1 1960.455234 84.50397765 23.20 0.0000
FFS(km/h) 1 19.40740278 3.930616261 4.94 0.0000
COMPTP(*10k) 1 13.49217169 14.82628496 0.91 0.3630
Volume(k) 1 4636.452108 123.6968344 37.48 0.0000
Gradient(*10k) 1 182.4028943 27.00029045 6.76 0.0000
Variable Intercept NofLaneIndex1 Duration(hours) FFS(km/h) COMPTP(*10k) Volume(k) Gradient(*10k)
Intercept 271169.2134 ‐1146.180224 ‐9689.455221 ‐1341.431227 ‐1923.665266 ‐18407.66357 ‐3972.210894
NofLaneIndex1 ‐1146.180224 15.12614943 15.51532574 0.730591989 ‐0.624425891 20.24586907 0.983763344
Duration(hours) ‐9689.455221 15.51532574 7140.922238 ‐10.98496648 ‐24.13639598 578.5220012 19.08887543
FFS(km/h) ‐1341.431227 0.730591989 ‐10.98496648 15.4497442 ‐1.276124235 ‐19.22720807 ‐0.119290199
COMPTP(*10k) ‐1923.665266 ‐0.624425891 ‐24.13639598 ‐1.276124235 219.8187258 91.17392218 7.180905576
Volume(k) ‐18407.66357 20.24586907 578.5220012 ‐19.22720807 91.17392218 15300.90684 73.58130849
Gradient(*10k) ‐3972.210894 0.983763344 19.08887543 ‐0.119290199 7.180905576 73.58130849 729.0156843
Variable Intercept NofLaneIndex1 Duration(hours) FFS(km/h) COMPTP(*10k) Volume(k) Gradient(*10k)
Intercept 1.0000 ‐0.5659 ‐0.2202 ‐0.6554 ‐0.2492 ‐0.2858 ‐0.2825
NofLaneIndex1 ‐0.5659 1.0000 0.0472 0.0478 ‐0.0108 0.0421 0.0094
Duration(hours) ‐0.2202 0.0472 1.0000 ‐0.0331 ‐0.0193 0.0553 0.0084
FFS(km/h) ‐0.6554 0.0478 ‐0.0331 1.0000 ‐0.0219 ‐0.0395 ‐0.0011
COMPTP(*10k) ‐0.2492 ‐0.0108 ‐0.0193 ‐0.0219 1.0000 0.0497 0.0179
Volume(k) ‐0.2858 0.0421 0.0553 ‐0.0395 0.0497 1.0000 0.0220
Gradient(*10k) ‐0.2825 0.0094 0.0084 ‐0.0011 0.0179 0.0220 1.0000
Model: Linear_Regression_Model
Dependent Variable: TotalDelayOfCar(hours)
Analysis of Variance
Parameter Estimates
Covariance of Estimates
Correlation of Estimates

44
The developed regression models are based on four assumptions related to the dependent variables: independence, normality, homoscedasticity (constant variance of response variable), and linearity. The regression assumptions can be reexpressed in terms of modeling errors to validate the assumptions on which the model is built. Where random errors are independent, normally distributed, have constant variance and zero mean, they can be considered as a random sample from 0, . In addition, the best representation of errors is through standard residuals. SAS calculates residuals with a variance of 1. A summary of goodness-of-fit test results for travel delay of light-duty vehicles is presented in figure 19. Analysis of each test is further discussed separately. Behavior of other regression models and the analysis were very similar for this case.
Figure 19. Chart. Fit diagnostics for total travel delay of light-duty vehicles.
In general, any systematic pattern in residuals indicates a violation in assumptions and systematic error (figure 19). In this model, it appears that the linearity assumption is violated because the residuals are not scattered randomly around zero and do not form a clear pattern. Also, the variance of residuals seems to have two values and that value is not constant.

45
It shows that accuracy of the model decreases as TDc increases. This problem is known as heteroscedasticity.
Figure 20. Chart. Plot of residuals for total travel delay of light-duty vehicles.
Figure 21. Chart. Plot of R-student residuals for total travel delay of light-duty vehicles.
Looking at the Quantile-Quantile plot (figure 21) the slope of the curve of the plotted points increases from left to right, which indicates that a theoretical distribution skewed to the right, such as a log-normal distribution, might better fit the data. In addition, the mild curve indicates a small shape parameter for the chosen distribution (i.e. σ for log-normal). Cook’s Distance (figure 23) shows outlier points, as all data points are not within a distance of two units of residual of the zero line. However, since the data result from designed experiments, we cannot eliminate the outliers with this method.

46
Figure 22. Chart. Quantile-Quantile plot for total travel delay of light-duty vehicles.
Figure 23. Chart. Outlier and leverage diagnostics for total travel delay of light-duty
vehicles.
As part of additional analysis, the residuals are plotted separately for each explanatory variable (figure 22). Since the variables are uncorrelated by design, each graph shows the direct relationship of the dependent variable and the explanatory variable. Travel delays of light-duty vehicles seem to have a nonlinear relationship with a number of available lanes. The residuals suggest data-fitting functions, such as log-normal distributions. Incident duration has a random scatter plot suggesting a quadratic relationship between incident duration and travel delay of cars. Also, variance is not constant and there is fanning. Residuals of volume show cosine or bimodal distribution. Form Residuals associated with the FFS, truck composition, and gradient are also randomly scattered around zero; therefore, the linear assumption seems reasonable.

47
Figure 24. Chart. Scatterplots of residuals against explanatory variables.
Given these observations, to improve the model, new variables based on the above analysis were introduced to the model and the process was continued. These variables were developed from a variety of transformations involving the explanatory variables. For travel delay of light-duty vehicles, residual graphs for the final fitted model were found, as seen in figure 25 and figure 26. Residuals are distributed normally around zero (figure 25) and systematic patterns of these models are eliminated (figure 26).

48
Figure 25. Chart. Normality of residuals for total delay of cars.
Figure 26. Chart. Standard residuals for total delay of cars.

49
APPENDIX B: INCIDENT DURATION ESTIMATION FOR IMPLEMENTING DIFFERENT TIM STRTEGIES
General Methodology for Quick-Clearance Traffic Incident Management Strategies A given incident scenario, supplied among the currently required user inputs of the TIM-BC tool, represents the status quo of the highway segments before one of the considered TIM strategies is implemented. Given a set of assumptions and estimates for the mechanisms and effectiveness of a particular TIM strategy, the proportion of incidents in the incident scenario is modified to reflect the state of affairs after the implementation of that strategy. That is, each new TIM strategy will reduce the duration of some portion of incidents in the sample commensurate with the assumptions made about that strategy’s effectiveness. This adjusted incident duration is then used to estimate the total travel delay and fuel consumption after implementation and BC calculations in the methodology section. It is the task for the TIM-BC tool developers to supply or request of the user the appropriate assumptions and estimates for each considered quick clearance TIM strategy. These assumptions and user inputs shall address the following issues for each proposed TIM strategy:
The criteria for selecting the incidents susceptible to change by the strategy (applicable cases).
The success rate of the strategy among applicable cases. The magnitude of improvement for incidents that successfully implemented a TIM
strategy. It should be noted that the results for different TIM strategies are not additive. This is because the benefits of different TIM strategies may not be independent of each other. As such, BC ratios calculated with the sum of benefits from various strategies represent a best case scenario where the benefits are assumed to be independent. While such a result may be useful, the actual combined benefit of those strategies is likely less than the total sum benefits of each applied strategy. Driver Removal Laws Driver removal laws require or encourage drivers whose vehicles are involved in a traffic incident to move their vehicles from the mainline of a highway to the shoulder when they are able to do so. The TIM-BC tool developer supplied assumptions and user inputs address the general TIM strategy issues as follows:
The proportion and severity of incidents that could be cleared by the relevant driver(s). o Supplied by user. o Assumes (based on the panel interviews) that incidents in which there were no
injuries and claims less than $500 could be cleared by drivers. The driver compliance rate among applicable cases before and after the proposed DRL
program.

50
o Supplied by user. o Before rate equals zero if no DRL exists.
The average time for drivers to move a vehicle from the mainline to the shoulder: o Supplied by default. o Assumes incidents are cleared by drivers in five minutes, after which incidents are
considered shoulder incidents. A Calculation Example Assume, for example, that the local effectiveness of DRLs is as follows:
The user estimates that one-half of all one-lane incidents are made shorter by driver removal.
There is currently no existing DRL and the proposed program has a compliance rate of 30 percent.
It is assumed that, during the AM peak time period, there are 20 one-lane incidents with an average duration of 35 minutes; and there are 25 shoulder incidents with an average duration of 30 minutes for the study period. The duration of half (10) of the one-lane incidents could be reduced (i.e., driver removal is possible) to 5 minutes as a result of applying driver removal laws. Of these incidents, 30 percent are cleared by compliant drivers; i.e., three incidents. Travel delays for the improved case are calculated with the following adjusted values. After implementation of DRLs, there are:
Seventeen (20 – 3 = 17) one-lane incidents with a duration of 35 minutes. Three (0 + 3 = 3) one-lane incidents with a duration of 5 minutes that are then moved to
the shoulder. Twenty-five shoulder incidents with a duration of 30 minutes (unchanged). Three hypothetical shoulder incidents with a duration of 30 minutes.
The benefit from the DRL is limited to the three one-lane incidents that were moved. As such, the 17 unchanged incidents are not part of the benefit calculation for travel delay and fuel consumption. So, the total benefits of applying the driver removal law is the difference between benefits from reduced duration of the mainline incident and the cost (lost benefits) from an extra shoulder incident due to driver removal laws. In the example above, the benefit of moving three one-lane incidents to the shoulder is calculated as the number of incidents successfully implementing the DRL (3 = 20 * 0.5 * 0.3) and the calculated average incident duration savings (30 = 35 – 5). The costs or lost benefits due to moving those incidents to the shoulder are calculated as the cost of three hypothetical shoulder incidents of 30-minute duration. This represents the remaining time to clear the incident from the shoulder. For the example above, if the travel delay savings for the one-lane reductions were 4,000 vehicle hours and the increased travel delay for the hypothetical shoulder incidents were 2,200, the actual benefit in travel delay of the driver removal program would be 1,800 vehicle hours (4,000 – 2,200). The calculated travel delay savings are used to directly compute corresponding fuel savings.

51
The calculation of secondary incident savings proceeds as with the TIM-BC tool, with the exception that the lost benefits due to moving to the shoulder must be deducted from the total travel delay and fuel consumption values. Put another way, there is no calculation of secondary savings from the hypothetical shoulder incidents. Rather, the impact of the driver removal strategy on secondary incidents is that of the one-lane savings alone, after accounting for benefits lost. Authority Removal Laws Authority removal laws give TIM responders some measure of authority to have vehicles, debris, and/or spilled cargo removed from the road when the owners are unwilling or unable to do so in a timely fashion. The TIM-BC tool’s developer-supplied assumptions and user inputs address the authority removal laws as follows:
The proportion and severity of incidents that could be reduced by exercising removal authority. o Supplied by user. o Supplied by default to be 30 percent of all incidents.
The proportion of applicable cases for which ARL could be exercised. o Supplied by user. o Supplied by default to be 100 percent of incidents.
The average time for vehicles to be moved to shoulder. o Supplied by user. o Supplied by default to be 10 minutes. o For the default value, incidents are cleared in 10 minutes. After 10 minutes, these
incidents are considered shoulder incidents. A Calculation Example Assume, for example, that the local effectiveness of ARLs is as follows:
The user accepts the default value that 30 percent of incidents in all severity classes are mitigated by authority removal.
There is currently no existing law and the proposed program is effective in 100 percent of the applicable cases.
It is assumed that, during the AM peak time period, there are 20 one-lane incidents with an average duration of 35 minutes, 10 two-lane incidents with an average duration of 45 minutes, and 25 shoulder incidents with an average duration of 30 minutes for the study period. The duration of 30 percent of the one-lane incidents (six) and two-lane incidents (three) could be reduced to 10 minutes as a result of authority removal. All of these incidents are moved to the shoulder via authority remova laws. Travel delays for the improved case are calculated with the following adjusted values:
Fourteen (20 – 6 = 14) one-lane incidents with a duration of 35 minutes. Seven (10 – 3 = 7) two-lane incidents with a duration of 45 minutes.

52
Six one-lane incidents with a duration of 10 minutes. Three two-lane incidents with a duration of 10 minutes. Twenty-five shoulder incidents with a duration of 30 minutes (unchanged). Six shoulder incidents with a duration of 25 minutes. Three shoulder incidents with a duration of 35 minutes.
The benefits from the ARL strategy are from the six one-lane and three two-lane incidents that were the implemented strategy. As such, the other unchanged incidents are not part of the benefit calculation for travel delay and fuel consumption. In general, the total travel delay and fuel savings are calculated as the total benefit of shortening the one- and two-lane incidents minus the benefits loss of extra shoulder incidents due to moving those mainline incidents to the shoulder. The benefits loss due to moving a mainline incident to the shoulder are calculated as the negative of the hypothetical benefits of completely reducing the duration of the same number of shoulder incidents to zero for one- and two-lane incidents, respectively. In the example above, the benefit of moving the one-lane and two-lane incidents to the shoulder is calculated as number of incidents implemented ARL (20 * 0.3 * 1.0 = 6; 10 * 0.3 * 1.0 = 3) for one- and two-lanes, respectively, and the calculated average incident duration savings, (35 – 10 = 25 (one lane); 45 – 10 = 35 (two lanes)). The lost benefits due to moving those incidents to the shoulder is calculated as the extra travel delays due to six (from one-lane incident) hypothetical shoulder incidents with a duration of 25 minutes and three (from two-lanes incident) shoulder incidents with a 35-minute duration. The total savings in travel delay and fuel consumption of applying the authority removal law are the difference between travel delays and fuel consumption that resulted in mainline and shoulder incidents. For the example above, if the total travel delay savings for the one- and two-lane reductions were 4,000 vehicle hours and the extra delays of hypothetical amount of shoulder incidents were 800 (from one lane incidents) and 600 (from two lane incidents), the actual benefit in travel delay of the authority removal program would be 2,600 vehicle hours (4,000 – 800 – 600 = 2,600). The calculation of secondary incident savings proceeds as with the TIM-BC tool, with the exception that the lost benefits due to moving to the shoulder must be deducted from the total travel delay and fuel consumption values. Put another way, there is no calculation of secondary savings from the hypothetical shoulder incidents. Rather, the impact of the authority removal strategy on secondary incidents is that of the one-lane and two-lane savings alone, after accounting for benefits lost. Shared Quick-Clearance Goals Some TIM management areas with coordinated, interdisciplinary TIM response structures adopt shared quick-clearance goals to improve clearance time across all incident types. The TIM-BC tool developer-supplied assumptions and user inputs shall address the following issues for this TIM strategy:
The proportion and severity of incidents that could be improved by adopting shared quick-clearance goals. o Supplied by user.
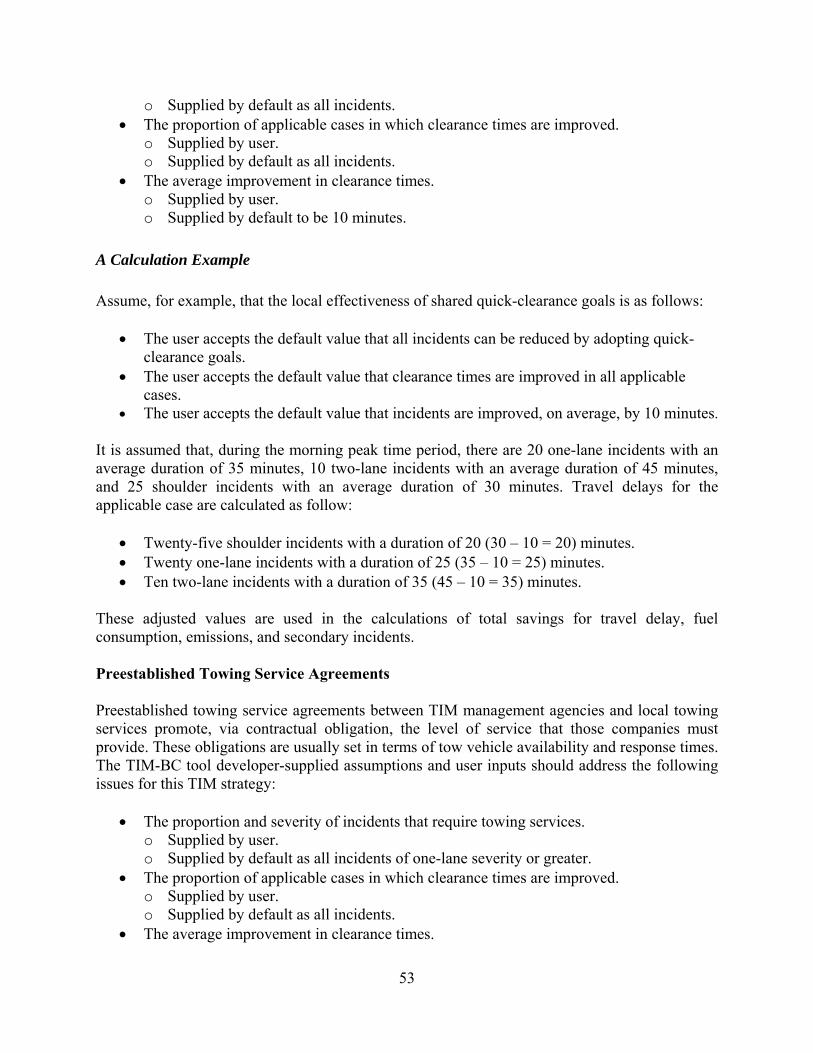
53
o Supplied by default as all incidents. The proportion of applicable cases in which clearance times are improved.
o Supplied by user. o Supplied by default as all incidents.
The average improvement in clearance times. o Supplied by user. o Supplied by default to be 10 minutes.
A Calculation Example Assume, for example, that the local effectiveness of shared quick-clearance goals is as follows:
The user accepts the default value that all incidents can be reduced by adopting quick- clearance goals.
The user accepts the default value that clearance times are improved in all applicable cases.
The user accepts the default value that incidents are improved, on average, by 10 minutes. It is assumed that, during the morning peak time period, there are 20 one-lane incidents with an average duration of 35 minutes, 10 two-lane incidents with an average duration of 45 minutes, and 25 shoulder incidents with an average duration of 30 minutes. Travel delays for the applicable case are calculated as follow:
Twenty-five shoulder incidents with a duration of 20 (30 – 10 = 20) minutes. Twenty one-lane incidents with a duration of 25 (35 – 10 = 25) minutes. Ten two-lane incidents with a duration of 35 (45 – 10 = 35) minutes.
These adjusted values are used in the calculations of total savings for travel delay, fuel consumption, emissions, and secondary incidents. Preestablished Towing Service Agreements Preestablished towing service agreements between TIM management agencies and local towing services promote, via contractual obligation, the level of service that those companies must provide. These obligations are usually set in terms of tow vehicle availability and response times. The TIM-BC tool developer-supplied assumptions and user inputs should address the following issues for this TIM strategy:
The proportion and severity of incidents that require towing services. o Supplied by user. o Supplied by default as all incidents of one-lane severity or greater.
The proportion of applicable cases in which clearance times are improved. o Supplied by user. o Supplied by default as all incidents.
The average improvement in clearance times.

54
o Supplied by user. o Supplied by default as 10 minutes.
A Calculation Example Assume, for example, that the local effectiveness of towing agreements is as follows:
The user accepts the default value that all incidents of one-lane severity or greater are improved by preestablished towing agreements.
The user accepts the default value that incident durations are reduced, on average, by 10 minutes.
It is assumed that, during the morning peak time period, there are 20 one-lane incidents with an average duration of 35 minutes, 10 two-lane incidents with an average duration of 45 minutes, and 25 shoulder incidents with an average duration of 30 minutes. Travel delays for the implemented towing service cases are calculated as follow:
Twenty-five shoulder incidents with a duration of 30 minutes (no change). Twenty one-lane incidents with a duration of 25 (35 – 10 = 25) minutes. Ten two-lane incidents with a duration of 35 (45 – 10 = 35) minutes.
These adjusted values are used in the calculations of total savings for travel delay, fuel consumption, emissions, and secondary incidents. Dispatch Colocation Colocation of dispatch personnel and equipment can improve communication between responders, thus decreasing dispatch and initial response times. The following are TIM-BC tool developer-supplied assumptions and user inputs address this TIM strategy issues:
The proportion and severity of incidents that are potentially improved by colocation. o Supplied by user. o Supplied by default as all incidents of two-lane severity or greater.
The proportion of applicable cases that are actually improved by colocation. o Supplied by user. o Supplied by default as all incidents.
The average improvement in clearance time for applicable cases. o Supplied by user. o Supplied by default to be 10 minutes.
A Calculation Example Assume, for example, that the local effectiveness of dispatch colocation is as follows:

55
The user accepts the default value that durations of all incidents of two-lane severity or greater are reduced by dispatch colocation.
The user accepts the default value that incident durations are reduced, on average, by 10 minutes.
It is assumed that, during the morning peak time period, there are 20 one-lane incidents with an average duration of 35 minutes, 10 two-lane incidents with an average duration of 45 minutes, and 25 shoulder incidents with an average duration of 30 minutes. Travel delays for the improved case are calculated as follows:
Twenty-five shoulder incidents with a duration of 30 minutes (no change). Twenty one-lane incidents with a duration of 35 minutes (no change). Ten two-lane incidents with a duration of 35 (45 – 10 = 35) minutes.
These adjusted values are used in the calculations of total savings for travel delay, fuel consumption, emissions, and secondary incidents. TIM Task Forces TIM task forces are groups of TIM-related planners, managers, and other personnel that meet periodically to coordinate activities and policies. The TIM-BC tool developer-supplied assumptions and user inputs address the general TIM strategy issues as follows:
The proportion and severity of incidents that are potentially improved by the activities of task forces. o Supplied by default (by user or tool) as all incidents.
The proportion of applicable cases that are actually improved by task forces. o Supplied by default (by user or tool) as all incidents.
The average improvement in clearance time for applicable cases. o Supplied by default (by user or tool) to be 10 minutes.
A Calculation Example Assume, for example, that the local effectiveness of TIM task forces is as follows:
The user accepts the default value that all incidents are improved by TIM task force activities.
The user accepts the default value that incident durations are reduced, on average, by 10 minutes.
It is assumed that, during the AM peak time period, there are 20 one-lane incidents with an average duration of 35 minutes, 10 two-lane incidents with an average duration of 45 minutes, and 25 shoulder incidents with an average duration of 30 minutes. Travel delays for the TIM task forces case are calculated as follows:

56
Twenty-five shoulder incidents with a duration of 20 (30 – 10 = 20) minutes. Twenty one-lane incidents with a duration of 25 (35 – 10 = 25) minutes. Ten two-lane incidents with a duration of 35 (45 – 10 = 35) minutes.
These adjusted values are used in the calculations of total savings for travel delay, fuel consumption, emissions, and secondary incidents. SHRP2 Training The second Strategic Highway Research Program (SHRP2) National Traffic Incident Management Responder Training focuses on motorist and responder safety while minimizing an incident’s impact on traffic flows. The TIM-BC tool developer-supplied assumptions and user inputs address the following issues for this TIM strategy:
The proportion and severity of incidents that are potentially improved by training. o Supplied by default (user or tool) as all incidents.
The proportion of applicable cases that are actually improved by training. o Supplied by default (user or tool) as all incidents.
The average improvement in clearance time for applicable cases. o Supplied by default (user or tool) to be 10 minutes.
A Calculation Example Assume, for example, that the local effectiveness of SHRP2 training is as follows:
The user accepts the default value that all incidents are improved by SHRP2 training. The user accepts the default value that incident durations are reduced, on average, by 10
minutes. It is assumed that, during the AM peak time period, there are 20 one-lane incidents with an average duration of 35 minutes, 10 two-lane incidents with an average duration of 45 minutes, and 25 shoulder incidents with an average duration of 30 minutes. Travel delays and fuel consumption for the cases applied to SHRP2 training are calculated as follows:
Twenty-five shoulder incidents with a duration of 20 (30 – 10 = 20) minutes. Twenty one-lane incidents with a duration of 25 (35 – 10 = 25) minutes. Ten two-lane incidents with a duration of 35 (45 – 10 = 35) minutes.
These adjusted values are used in the calculations of total savings for travel delay, fuel consumption, emissions, and secondary incidents.

57
REFERENCES
1. Federal Highway Administration. Intelligent Transportation Systems for Traffic Incident Management. U.S. Department of Transportation - ITS. [Online] January 2007. [Cited: February 5, 2016.] http://ntl.bts.gov/lib/jpodocs/brochure/14288.htm. FHWA-JPO-07-001.
2. Federal Highway Administration. Best Practices in Traffic Incident Management. 21st Century Operations for 21st Century Technologies. [Online] 2010. [Cited: February 5, 2016.] http://ops.fhwa.dot.gov/publications/fhwahop10050/fhwahop10050.pdf.
3. Chang, G., and S. Rochon. CHART Input and Analysis: Performance Evaluation and Benefit Analysis for CHART in Year 2009. Making the Connection: Advancing Traffic Incident Management in Transportation Planning. 2009.
4. Owens, Nicholas, et al. Traffic Incident Management (TIM) Handbook. Office of Operations. [Online] January 2010. [Cited: February 5, 2016.] http://ops.fhwa.dot.gov/eto_tim_pse/publications/timhandbook/tim_handbook.pdf. FHWA-HOP-10-013.
5. Cambridge Systematics. FHWA Operations Benefit/Cost Analysis Desk Reference Project: FDOT D2 TSM&O Workshop Presentation. Washington, DC : Department of Transportation, May 22, 2012.
6. Whitehouse Group. Florida ITS Evaluation Tool (FITSEval): A Regional ITS Evaluation Tool. Tallahassee, FL : Whitehouse Group, 2009.
7. Booz-Allen & Hamilton Inc. California life-cycle benefit/cost analysis model (Cal-B/C): User's Guide. Sacramento: California Department of Transportation, 1990.
8. Federal Highway Administration. ITS deployment analysis system (IDAS) user’s manual. Washington, DC: U.S Department of Transportation, 2001.
9. Florida Intelligent Transportation. Systems evaluation (FITSEVAL) tools. 2012.
10. Chou, C., E. Miller-Hooks, I. Promisel. Benefit-Cost Analysis of Freeway Service Patrol Programs: Methodology and Case Study. Advances in Transportation Studies Section B. 2010, Vol. 20, pp. 81-86.
11. Miller-Hooks, E., TariVerdi, M. Prentiss, D., and Ma, J. Standardizing and Simplifying Safety Service Patrol Benefit-Cost Ratio Estimation, Report to the I-95 Corridor Coalition. University of Maryland, College Park. College Park, MD: University of Maryland, 2012.
12. Miller-Hooks, E., Chou, C., Feng, L. and Faturechi, R. Concurrent Flow Lanes: Phase III. Baltimore, MD: Maryland State Highway Administration, 2011. MD-11-SP009B4P.
13. Federal Highway Administration. Traffic Incident Management Cost Management and Cost Recovery Primer. McLean, VA: Federal Highway Administration, 2012.
14. Hudgins, K. L., Miller-Hooks, E., TariVerdi, M., Prentiss, D., and Ma, J. A Critical Synthesis of Traffic Incident. 2015.

58
15. Federal Highway Administration. Making the Connection: Advancing Traffic Incident Management in Transportation Planning. Washington, DC: U.S. Department of Transportation, 2013. FHWA-HOP-13-044.
16. Battelle Memorial Institute for the Maricopa County Department of Transportation. Regional Emergency Action Coordination Team (REACT) Evaluation, Phoenix, Arizona. Phoenix, AZ: Battelle Memorial Institute, 2002. p. 9.
17. National Traffic Incident Management Coalition (NTIMC). Benefits of Traffic Incident Management. AASHTO National Traffic Incident Management Coalition. [Online] 2006. [Cited: February 8, 2016.] http://ntimc.transportation.org/Documents/Benefits11-07-06.pdf.
18. Ma, J., Lochrane, T. User’s Manual for The TIM Benefit-Cost (TIM-BC) Tool (Version: 1.0.0). Federal Highway. McLean, VA: Federal Highway Administration, 2015. FHWA-HRT-15-059.
19. Transportation Research Board. Transportation Benefit-Cost Analysis. Transportation Economics Committee of the Transportation Research Board. [Online] undated. [Cited: February 8, 2016.] http://bca.transportationeconomics.org/models/bca-net.
20. Cambridge Systematics. Surface transportation efficiency analysis model (STEAM 2.0) user manual. McLean, VA : Federal Highway Administration, 2000.
21. Cambridge Systematics. ITS deployment analysis system (IDAS) user’s manual. McLean, VA : Federal Highway Administration, 2001.
22. Concas, S., and Winters, P. L. Quantifying the net social benefits of vehicle trip reductions: guidance for customizing . s.l.: Center for Urban Transportation Research (CUTR), University of South Florida, 2009.
23. DeCorla-Souza, P. IMPACTS spreadsheet software documentation. McLean, VA: Federal Highway Administration, 1999.
24. Federal Highway Administration. Operations benefit/cost analysis desk reference. Washington, DC: U.S. Department of Transportation, May 2012. FHWA-HOP-12-028.
25. Florida Department of Transportation. Evaluation tools to support ITS planning process: Development of a sketch planning tool in FSUTMS/Cube Environment. Tallahassee, FL: Florida International University Lehman Center for Transportation Research, October 2008.
26. Hadi, M. A., Quigley, D., Sinha, P., Krishnamurthy, A., Hsia, L. Intelligent transportation systems deployment. Tallahassee: Florida Department of Transportation by PBS&J ITS Division, 2005.
27. Science Applications International Corporation. User’s manual for SCRITS, screening analysis for ITS. McLean, VA: Federal Highway Administration Office of Traffic Management and ITS Applications, 1999.
28. Skabardonis, A. and Mauch, M. FSP Beat Evaluation and Predictor Models: Users Manual. Berkley, CA: Institute of Transportation Studies, University of California-Berkley, California. UCB-ITS-RR-2005-XX.

59
29. Latoski, S. P., Pal, R. and K.C., Sinha. Cost-Effectiveness Evaluation of Hoosier Helper Freeway Service Patrol. Reston, VA: American Society of Civil Engineers, September 1999.
30. Miller-Hooks, E., TariVerdi, M. and Zhang, X. Standardizing and Simplifying Safety Service Patrol Benefit-Cost Ratio Estimation, Report to the I-95 Corridor Coalition. University of Maryland, College Park. College Park, MD: University of Maryland, 2012.
31. Hadi, M., Sinha, P., Wang, A. Modeling Reductions in Freeway Capacity due to Incidents in Microscopic Simulation Models. Washington, DC: Transportation Research Board, 2007.
32. Transportation Research Board. Highway Capacity Manual (version 2000). Washington, DC : Transportation Research Board, 2000.
33. PTV AG. PTV VISSIM 6 User Manual. Karlsruhe, Germany: PTV Group, 2014.
34. Miller-Hooks, E., TariVerdi, M. Prentiss, D., and Ma, J. Benefit Estimation Models for Safety Service Patrol Programs. 2015.
35. Miller-Hooks, E., Melanta, S., Qi, B., and Avetisyan, H. GHG Emissions to Support Estimation in On-Road Transport Along Freeway and Arterials. College Park, MD : University of Maryland, 2012.
36. Melanta, S., Miller-Hooks, E., Avetisyan, H. A Carbon Footprint Estimation Tool for Transportation Construction Projects. Reston, VA: American Society of Civil Engineers, 2012.
37. U.S. Energy Information Administration. Gasoline and Diesel Fuel Update. U.S. Energy Information Administration. [Online] [Cited: February 18, 2016.] http://www.eia.gov/petroleum/gasdiesel/.
38. United States Department of Labor. May 2014 State Occupational Employment and Wage Estimates. United States Department of Labor. [Online] Bureau of Labor Statistics. [Cited: February 18, 2016.] http://www.bls.gov/oes/current/oessrcst.htm.
39. American Transportation Research Institute. ATRI, An Analysis of the Operational Costs of Trucking: A 2014 Update. Arlington, Virginia: American Transportation Research Institute, September 2014.
40. Blincoe, L., et al. The Economic Impact of Motor Vehicle Crashes: 2000 (Revised). Washington, DC: U.S. Department of Transportation, 2002. DOT-HS-809-446.
41. Ma, J., Lochrane, L. User’s Manual for The TIM Benefit-Cost (TIM-BC) Tool (Version: 1.0.0). McLean, VA: Federal Highway Administration, July 2015. FHWA-HRT-15-059.