Embed Size (px)
Citation preview

Products Solutions Services
06/12/2013
Use your instrumentation – the right way
Your instruments are already looking out! When are you ready to open the window?
Slide 1 Kasper Adsersen

Products Solutions Services
06/12/2013
Secondary values from your instrumentation
Next Level Instrumentation
Slide 2 Kasper Adsersen

06/12/2013
Micropilot/Levelflex product family
Use your instrumentation - the right way
• Dynamic algorithms• Multi-Echo Tracking• Accuracy ±2mm
• Intuitive operating concept• HistoROM – data management• Seamless system integration • Exact instrument and process
diagnosis
Safe Precise Efficient• Hardware and software
developed according to IEC 61508, SIL2 for single device and SIL3 in homogenous redundancy
• High temperature and high pressure versions
• Gastight feedthrough as second line of defense
Slide 3 Kasper Adsersen

06/12/2013
Development according to IEC 61508
Use your instrumentation - the right way
• The new ToF Series FMR/FMP5x are the world’s first ToF devices which has been developed according to IEC 61508:2010 (Edition 2.0)
• All FMR/FMP5x are suitable for the use in safety-loops (MIN, MAX and RANGE) with all 4…20mA HART® options, up to
• SIL3 (in homogenous redundancy)• SIL2 (as a single device)
• For test sequence C (simulation) it is not necessary to interrupted or manipulated the production process and can be done easily from control room (Communication between device and DTM is secured)
• Development supported by certified TÜV Functional Safety Engineers and TÜV Functional Safety Expert
• Independent Functional Safety Assessment and certification by accredited body (TÜV Rheinland)
Slide 4 Kasper Adsersen

06/12/2013
Developed according IEC61508
Use your instrumentation - the right way
Continuous automatic internal check in the device
• Logic program run control
• Reference pulse HF
• Quartz synchronization
• Measuring cycle time
• Supply voltage
• Temperature
• Check sum RAM
• Cable breakage
Check
• Continuous self-monitoring to check the correct functionality of the device• More than 80 diagnostic measures and techniques permanently running in the
background
Slide 5 Kasper Adsersen

06/12/2013
Proof test from control room
Use your instrumentation - the right way
Proof procedure via manual started self check (proof test)
Proof test is done without interruption of the process!
Send
Check
Save time and costs with worlds easiest proof test for SIL/WHG1. Start the “Self check” (device checks internal communication
path)2. Check the signal output by simply starting the simulation
Developed acc. to IEC61508, also the data communication between Device-DTM and device is secured (send – check). The proof test can easily done out of the control room
Slide 6 Kasper Adsersen

06/12/2013
Setup FieldCare DTM
Use your instrumentation - the right way
Same user oriented menu structure like on-site displayUser role is per default: Maintenance FieldCare Device Setup delivered with device
Slide 7 Kasper Adsersen

06/12/2013
What is Advanced Diagnostics ?
Use your instrumentation - the right way
• Advanced Diagnostics in Micropilot/Levelflex, offers additional possibilities to monitor the process
• The Micropilot/Levelflex offers two advanced diagnostics, which can be used stand alone or can be linked together
• Choose different inputs like:• Level linearized, Unfiltered distance, Rel. Echo Amplitude,
• Area of In-coupling of HF-Cable, Electronic Temp., Terminal voltage
• The Advanced Diagnostics can use different statistic functions with the chosen input value like:
• Maximum, Minimum, Mean, Standard deviation
• Difference Max. – Min., Slope
• These calculated values can be monitored in the DCS/PLC´s or used as a switch output, second mA output or to link this information to the second advanced diagnostics in the Micropilot/Levelflex
Slide 8 Kasper Adsersen

Products Solutions Services
06/12/2013
Wastewater treatment / biogas production
Digester optimizationIncrease the gas production – save money – less cleaning
Slide 9 Kasper Adsersen

06/12/2013
How does it work ? Foam detection 1/4
Use your instrumentation - the right way
• Problem:
• The digester can “produce” foam from time to time.Depend on the season and chemical/protein leftover in the wastewater received.
• While the digestion process runs, foam can occur. This foam can create big problems, because foam in the piping/venting system needs maintenance work to clean the process equipment
• The foam can be avoided by sprinkling water from the top or by adding a chemical foam inhibitor to the mixture.This solution however is costly and could also reduce the efficiency of the digester and result in lower gas production
• Pre Conditions:
• The process can be monitored with and without foam during commissioning
Slide 10 Kasper Adsersen

06/12/2013
How does it work ? Foam detection 2/4
Use your instrumentation - the right way
• What happens with the Micropilot signal if foam occurs ?
• The rel. echo amplitude will decrease and this can be used to run a “foam” detection with the Advanced Diagnostic function
• The raw value of the rel. echo amplitude can be appointed to one of the secondary HART® values and used in the control system.
• Or: a function block in the Micropilot is set up to output the value on the second mA output
• Or: the digital status output is used as a simple foam yes or no signal
• If the foam level is very high, the signal will be lost - like all other radars on the market. This is simply a physical limit of the measuring principle.BUT when using the function, the foam formation can be stopped beforereaching a level critical for the measurement
Slide 11 Kasper Adsersen

06/12/2013
How does it work ? Foam detection 3/4
Use your instrumentation - the right way
Defined echo amplitude limit
Slide 12 Kasper Adsersen

06/12/2013
How does it work ? Foam detection 4/4
Use your instrumentation - the right way
What has to be done ?• The signal has to be observed for a while. The echo amplitude in the process at
e.g. 80% level (via output or the drag indicators of the advanced diagnostics of FMR5x). After this, you define the lower limit of the amplitude.
• Program the advanced diagnostics blocks 1 and 2 to detect foam
Advanced Diagnostic 1
(4) – (7)
(11) / (12)
Alarm handling
Calculation
Advanced Diagnostic 1(AD1)
Upper limit: 85%Lower limit: 75%
Check mode: In range
Assign diagnostic
signal:Level (%)
AD1 digitaloutput
Level (%)
Advanced Diagnostic 2 (AD2)
Linking logic AD2:And
Link AD2 to:Digital out AD1
Assigndiagnostic
signal:Echo amplitude
AD digitaloutput
AD analogoutput
Sample time: 60 sec
Calculation type: Mean
Check mode: Lower limitLower limit: 10dB
Status output and programmableWarning/Alarm event
Echo amplitude (dB)
Slide 13 Kasper Adsersen

Products Solutions Services
06/12/2013
Proline Prosonic Flow B 200
Online Methane measurement as a secondary valueThe primary value is the volume flow
Slide 14 Kasper Adsersen

06/12/2013
100% CH4 @ 40 °C
Use your instrumentation - the right way
Temperature Methane Carbon dioxide
Speed of sound
°C CH4 CO2 m/s
40 0.0% 100.0% 274.7
40 10.0% 90.0% 284.1
40 20.0% 80.0% 294.5
40 30.0% 70.0% 306.0
40 40.0% 60.0% 319.0
40 50.0% 50.0% 333.8
40 60.0% 40.0% 350.8
40 70.0% 30.0% 370.7
40 80.0% 20.0% 394.2
40 90.0% 10.0% 422.8
40 100.0% 0.0% 458.5
The speed of sound in 100% Methane at 40 °C is 458.5 m/s
Slide 15 Kasper Adsersen
06/12/2013
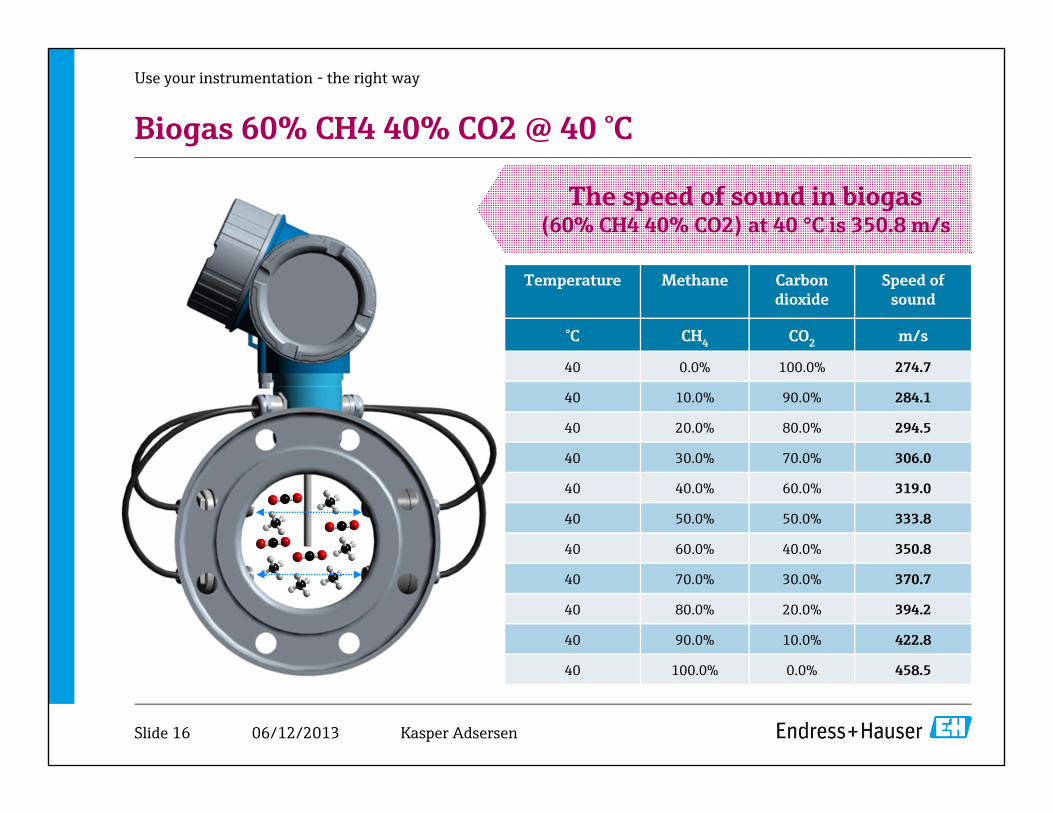
Biogas 60% CH4 40% CO2 @ 40 °C
Use your instrumentation - the right way
Temperature Methane Carbon dioxide
Speed of sound
°C CH4 CO2 m/s
40 0.0% 100.0% 274.7
40 10.0% 90.0% 284.1
40 20.0% 80.0% 294.5
40 30.0% 70.0% 306.0
40 40.0% 60.0% 319.0
40 50.0% 50.0% 333.8
40 60.0% 40.0% 350.8
40 70.0% 30.0% 370.7
40 80.0% 20.0% 394.2
40 90.0% 10.0% 422.8
40 100.0% 0.0% 458.5
The speed of sound in biogas (60% CH4 40% CO2) at 40 °C is 350.8 m/s
Slide 16 Kasper Adsersen

Products Solutions Services
06/12/2013
A global view
HART® and other communication protocols used in instrumentation
Slide 17 Kasper Adsersen

06/12/2013
Use your instrumentation - the right way
European Fieldbus Market Market Information
Competition
Key Success Factors
Well established communication protocol
Approx. 37 mill. installed devices with HART® communication
Market still shows a good growth but mainly based on MRO business
All established competitors in the process automation have devices with HART® communication
Display of all four HART® values (PV, SV, TV, QV) of one sensor
Request for HART 7 devices is increasing
Cost-effective price
Market distribution of fieldbuses
Source: Frost & Sullivan, European Fieldbus Market, 2009
Also in the U.S. and Asia HART® is a well established communication standard and makes up more than 50%
of the market
Market Information – HART® Communication
Slide 18 Kasper Adsersen

06/12/2013
Use your instrumentation - the right way
Industry segmentation of HART® devices in Europe
Source: Frost & Sullivan, European Fieldbus Market, 2009
Market Information – HART® Communication
Slide 19 Kasper Adsersen

06/12/2013
•Endress+Hauser had a turnover of approx. 750 mill. € with HART® devices in 2012
•This complies with a number of approx. 550,000 sold units
•The HART® devices were sold in all Industry segment but with the biggest share in the Chemical and Oil & Gas industries
• An indicator that supports HART® communication can be used with a huge number of already installed units
• Process indicator RIA15 with HART® supports the global trend of using HART® values for getting more process information and not only using the protocol for the parameterization/commissioning
Facts and Figures
Use your instrumentation - the right way
History – HART® Products of Endress+Hauser
Slide 20 Kasper Adsersen

Products Solutions Services
06/12/2013
No HART® transparency to your control system ?No problem!Loop Powered Indicator RIA15 with HART® Communication
Slide 21 Kasper Adsersen

06/12/2013
Use your instrumentation - the right way
Flexibility: With RIA15 4…20 mA or HART® communication is possibleLittle requirements: Very low voltage drop of ≤ 1.9 V with HART® makes an additional power supply unnecessaryUp to four values: RIA15 can indicate all four values (PV, SV, TV, QV) of one sensor in the analog HART® mode as well as in a multi-drop networkMaster functionality:RIA15 can be primary or secondary master and actively inquire values from the sensorAll information at a glance: RIA15 can indicate the values in alternation incl. bar graph and engineering unitExcellent readability: Very large characters with a height of 17 mm (0.67 in) and an optional backlight guarantee a good readability in all lighting conditions
Summary of main features and advantages
Slide 22 Kasper Adsersen

06/12/2013
• RIA15 fulfills the requirements of HCF Specification, revision 7.x
• RIA15 is downwards compatible to all sensors/actuators with HART® versions 5.x, 6.x as well as 7.x
RIA15 can be used with HART® instrumentation/sensors/actuators of the newest generation
Due to downwards compatibility thereis a large installed base of devices with which RIA15 can be applied
Use your instrumentation - the right way
Key feature: Compatibility
NEW Feature HART® Communication
Slide 23 Kasper Adsersen

06/12/2013
More process information
Use your instrumentation - the right way
More process informationmass, volume, corrected
volume, density, ref. density, temperature.
Slide 24 Kasper Adsersen

06/12/2013
Wireless HART® features
Use your instrumentation - the right way
Local Wireless Network:• Full mesh (or star)• Self-organizing• Self-healing• Redundant routing• Time synchronized, i.e.
power efficient• Coexist w/ WLAN, etc.• 128-bit encryption
An additional accessories is the WirelessHART® adapter SWA70. It opens the world to the wireless communication and to various customer benefits.
Slide 25 Kasper Adsersen

06/12/2013
• More than 40 variables are available to be displayed
• When using the Advanced Diagnostics and FieldCare, the condition of the flowmeter can be monitored in details.
• Endress+Hauser can even output the viscosity of the media. Viscosity is often use to control heating of a media in blending and combustion processes
• Typically installation: mA output is used for Mass flow pulse/freq. output is used for the totalizer
• What about: density of the media, temperature in the pipe, air in the pipe, corrosion inside the meter… no value for you???
Use your instrumentation - the right way
A Coriolis flow meter measures a lot of relevant data
Slide 26 Kasper Adsersen

06/12/2013
How to get the relevant value out of your Promass
Use your instrumentation - the right way
Slide 27 Kasper Adsersen
Description available in the standard manual
Just select the relevant value To be displayed as:PV, SV, TV or QV – that´s it!!!
No options need to be orderedEverything is standard
No extra price
Similar possibilities with Profibus and Foundation Fieldbus

06/12/2013
Just 5 additional ideas – we have a lot more for you!
Use your instrumentation - the right way
1. Compare your internal temperature in your flowmeter with the process temperature
Rising difference = someone need to check the two devices
2. Compare the electronic temperature with the room temperature – verify that it is still working.
Rising difference = someone need to check the two devices
Temperature > 60-70 deg. C = activate ventilation/cooling or send someone to observe
3. Monitor the supply voltage to keep track of your power supply and cabling/installation
Humidity in connection boxes will be detected – before you loose the measurement
4. Monitor the near-field signal to detect build-up and condensation in the top of the tank.
Build-up could reduce the quality/safety of the level measurement – reduce the agitator speed
5. Monitor the abs. echo amplitude to detect build-up on the tank wall
When should the tank cleaning be performed – no need to open a clean tank
Slide 28 Kasper Adsersen
06/12/2013
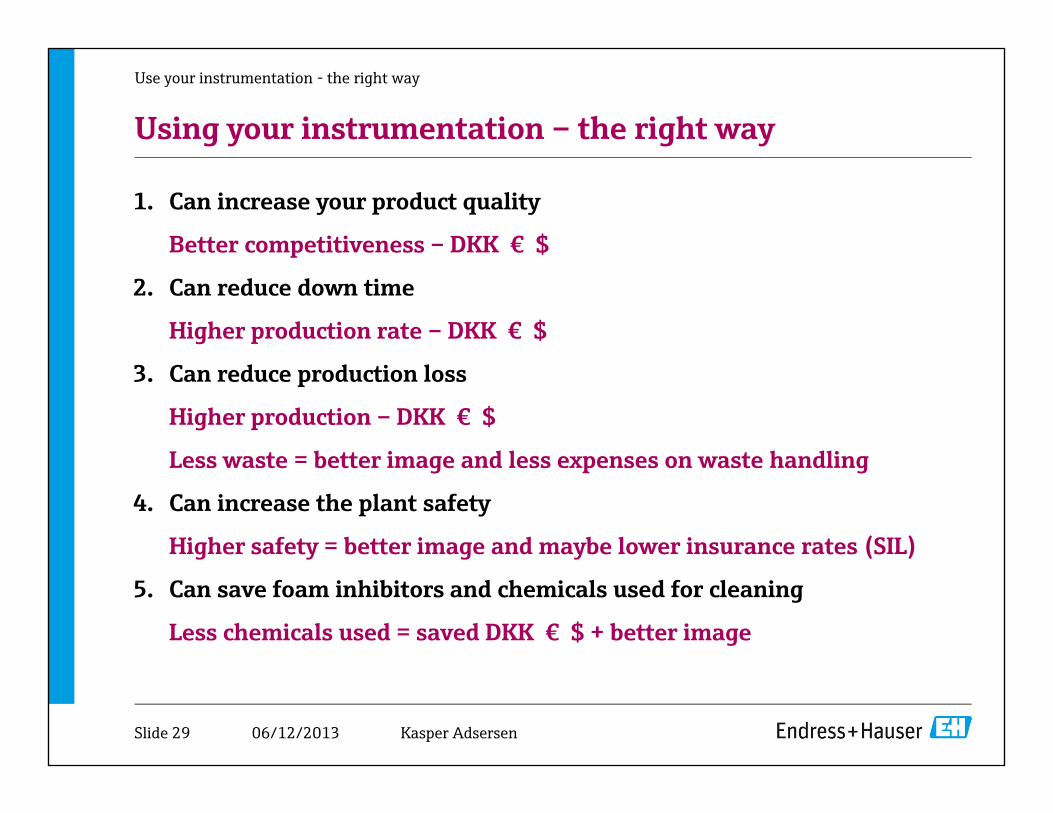
Using your instrumentation – the right way
Use your instrumentation - the right way
Kasper AdsersenSlide 29
1. Can increase your product quality
Better competitiveness – DKK € $
2. Can reduce down time
Higher production rate – DKK € $
3. Can reduce production loss
Higher production – DKK € $
Less waste = better image and less expenses on waste handling
4. Can increase the plant safety
Higher safety = better image and maybe lower insurance rates (SIL)
5. Can save foam inhibitors and chemicals used for cleaning
Less chemicals used = saved DKK € $ + better image

Products Solutions Services
06/12/2013
Thank you very much for your attention
Using your instrumentation – the right way
Is a true contribution to the improvement of our competitiveness in Denmark
But: We are NOT ahead of other countries here – we are behind at the moment
Slide 30 Kasper Adsersen