Embed Size (px)
Citation preview

Ecofys UK
78 Cannon Street
London EC4N 6NQ
tel +44 (0)20 7618 6646
fax +44 (0)20 7618 8001
e-mail [email protected]
- FINAL REPORT -
Gemma Reece
Dian Phylipsen
Max Rathmann
Max Horstink
Tana Angelini
26 October 2006
PECSGB062506
Supported by WWF UK
USE OF JI/CDM CREDITS BY
PARTICIPANTS IN PHASE II OF
THE EU ETS

FINAL REPORT 2
Table of Contents
1 In t roduct ion 3
2 Globa l supp ly o f J I /CDM c red i t s in 2008-2012 5
3 Count ry l eve l demand fo r c red i t s i n 2008-2012 11
4 EU Emiss ions Trad ing Scheme Phase I I 14
5 Emiss ion reduc t i on poten t i a l s w i th in the EU ETS 25
6 Conc lus ions 27
ANNEX 1: Cap – BAU Background ca l cu l a t ions 28
ANNEX 2: Compar i son to o the r s tud ie s 29

FINAL REPORT 3
1 Introduct ion
This report describes the findings of an analysis of the use of project credits in Phase II of the
European Emissions Trading Scheme (EU ETS).
The EU ETS is a cornerstone of climate change policy in the European Union (EU). The scheme is
a cap and trade system which sets a limit on carbon dioxide (CO2) emissions from installations in
the energy sector and selected industry sectors across the EU25. The scheme aims to incentivise
emissions reductions in those sectors at the lowest possible cost by allowing trading of emissions
rights between companies. If participants have emitted more in one year than the number of
emissions rights (allowances) they were allocated, ie. they are short of allowances, they can
therefore choose whether to comply with the scheme by making emissions reductions within their
installations or by purchasing additional allowances on the market from those who are long (have
an excess of allowances).
Phase I of the EU ETS started operating on 1 January 2005 and will run for a three year period to
31 December 2007. It covers over 11 thousand installations responsible for approximately 50% of
the EU’s total CO2 emissions. Phase II of the scheme will start on 1 January 2008 and run for a
five year period to the end of 2012.
Each EU Member State must develop a National Allocation Plan (NAP) for their country which
includes detail on the allocation of “European Union Allowances” (EUAs) to be allocated to
installations in the scheme and also how this fits with Member States’ international obligations
under the Kyoto Protocol. Phase II NAPs were due to be submitted to the European Commission
for approval by 30 June 2006. To date however not all NAPs have been formally notified to the
Commission1 and many NAPs are still available only in their original language.
From Phase II Member States can choose to allow installations in their country to also use project
based credits towards meeting their EU ETS target. Here the term “project based credits” is used to
describe emissions reduction credits, measured in tonnes carbon dioxide equivalent (tCO2e),
generated through either Joint Implementation (JI) or Clean Development Mechanism (CDM)
projects, the Flexible Mechanisms under the Kyoto Protocol. Installations in the EU ETS may
convert either “Emission Reduction Units” (ERUs) from JI projects or “Certified Emission
Reductions” (CERs) from CDM projects into EUAs and use these towards their EU ETS target.
To try to ensure that some emissions abatement takes place nationally however, Member States
can choose to set restrictions on the amount of JI/CDM credits that installations will be allowed to
use to meet their target. (Member States can also set restrictions on the type of JI/CDM credits that
1 For latest status of Phase II NAP availability see European Commission website:
http://ec.europa.eu/environment/climat/2nd_phase_ep.htm
FINAL REPORT 4
installations may use, for example restricting the use of credits from projects that mitigate non-
CO2 greenhouse gases.)
Under the EU ETS guidance Member States must specify to the European Commission in their
Phase II NAP any such quantitative or qualitative restrictions to the use of JI/CDM credits they
apply. The Commission however gives no quantitative guidance on an appropriate level of a
JI/CDM credit limit.
Aim
The aim of this project is to support WWF UK in the assessment of the likely use of project-based
credits by installations in Phase II of the EU ETS, and hence the level of emissions abatement that
will take place in the EU versus the level of emissions abatement that will occur outside the EU in
the period 2008 to 2012.
Scope o f th is report
This report will first focus on the global picture in terms of JI/CDM credits. An assessment is
made of the amount and type of project based-credits that are likely to be available globally during
the first Kyoto Commitment Period (2008-1012), based on available literature. An assessment is
then made of the amount of project-based credits that are likely to be purchased by Governments
globally in the first Kyoto Commitment Period to meet their Kyoto targets. This takes into account
publicly announced Government intentions to purchase allowances, and also whether sufficient
budgets and procedures are in place to actually obtain these credits.
The focus of the report then turns to the European market and current proposed Phase II NAPs.
Proposed caps are compared to Business as Usual (BAU) emissions (formal as well as own
estimates) to enable an estimate of the shortage of allowances within Phase II of the EU ETS to be
made. The assessment is made for the following NAPs: Germany, UK, Poland, Ireland (notified to
the Commission) and France, Spain, Italy, Portugal and the Netherlands (draft NAP available at
time of assessment). The NAPs have been selected on the basis of large volumes of emissions,
status of notification to the Commission and publication language.
Restrictions on the use of JI/CDM credits by participants in the EU ETS is then considered before
an assessment of likely JI/CDM use within the scheme versus the likely amount of internal
emissions abatement by participants is made.
FINAL REPORT 5
2 Globa l supp ly of JI/CDM credi ts in 2008-2012
Volume o f JI/CDM credi ts ava i lab le in 2008-2012
This section aims to assess the amount of project based credits (JI/CDM credits) that is likely to be
available globally during the first Kyoto Commitment Period (2008-2012). This is partly based on
an unpublished study Ecofys/Ecosecurities carried out in 2005 into the global supply of JI/CDM in
Phase I and Phase II 2. This study looks at both the current project pipeline as well as the potential
and cost of GHG emission reductions in JI/CDM host countries, taking into account the time lag
between project development and implementation, and the delivery risk for the credits based on
project type and host country. This data has been complemented and updated to reflect the rapid
changes in this area, using the most recent information from the UNFCCC and other recent studies
and market analyses.
The UNFCCC provides an overview of all currently registered CDM projects and the expected
project pipeline. For the currently registered projects (305 projects) the expected CER delivery
until 2012 is 570 MtCO2-eq. The total CDM pipeline for the period up to 2012, including projects
that are not yet registered at the moment, is estimated to lead to a cumulative supply of 1,200
MtCO2-eq until the end of the first commitment period or 240 MtCO2-eq annually (>1,000
projects). Note that this only includes CDM projects, no estimates for JI projects are available yet.
Table 1 on page 8 depicts the potential delivery of JI/CDM credits until 2012 on the basis of
various studies. The UNFCCC figures are included for comparison as well. The
Ecofys/Ecosecurities report estimates between 1,100-1,550 MtCO2-eq to be available between
2008 and 2012 or 220-310 MtCO2-eq annually, depending on the assumed price of the credits. The
Deutsche Bank3 recently made an assessment pointing to a similar level of supply, however with a
somewhat wider range of 750-1,500 MtCO2-eq for the first commitment period or 150-300
MtCO2-eq/yr.
The IEA4 conducted several studies on non-CO2 GHG emission reduction potential, with the latest
update in 2005 estimating the emission reduction potential up to 2020 at 1,240 MtCO2-eq/yr at
cost below 0$/t. An additional 1,700MtCO2-eq/yr would be available at prices up to 10$/t. This
study focused on industrial sectors only – disregarding for instance the agricultural sector –
nevertheless pointing to a very large potential compared to the other studies. It must be noted
though that the IEA figures refer to emission reduction potentials, rather than the supply of (JI
and) CDM credits.
2 Ecofys/Ecosecurities (2005), Market assessment for Kyoto project credits and policy for using credits by EU
ET participants in Phase I and beyond – Implementation of the Linking Directive in the UK. Confidential. 3 M.C. Lewis, R. Smith, European Utilities Equity Research, Deutsche Bank, EU Emissions Trading: Phase 2
NAPs under scrutiny (25 July 2006). 4 John Gale, Diana Pape & Alexei Sankowski (2005), Comparing the costs of abatement for the non-CO2
greenhouse, gases in the industrial sector - IEA Greenhouse Gas R&D Programme (IEA GHG).
FINAL REPORT 6
Important differences in this respect are:
• The emission reduction potentials includes measures that would not qualify as JI/CDM
projects because of additionality requirements. A previous IEA report (2003)5 states the
potential may be halved in case of strict additionality checks – this is, however, not addressed
in the 2005 study. The Ecofys/Ecosecurities results only include measures with marginal
abatement cost between 0-15 £/t (~0-28 US$/t), assuming that measures below US$0 will not
comply with additionality requirements.
• The emission reduction potentials are not corrected for the likelihood of delivery. As many
energy conservation and emission reduction analyses have shown, substantial parts of cost-
effective potentials are not implemented because of a variety of reasons, including lack of
information, low priority, lack of access to capital, high (perception of) risk, etc. In addition, in
the context of JI/CDM additional risks of non-delivery of credits can result from the required
project approval from the host country and the required approval by UNFCCC and validator,
which is, amongst others, limited by the monitorabilty of emission reductions.
Uncertainties such as country risk and project risk are not taken into account in the IEA study.
Other studies show that these delivery risks could reduce the potential by a factor of 4.
• Taking the above described risks into account (reducing the potential by a factor of 4) would
place the results of the IEA report in a similar ballpark as the Ecofys/Ecosecurities and
Deutsche Bank results.
• The regions in the IEA analysis include North America as the most significant region for
emission reductions as well as OECD Europe. Most countries in these regions are either not
eligible as host countries (USA) or are likely to have a Kyoto gap, i.e. are not likely to sell JI
credits during the first commitment period.
On the other hand, the Ecofys/Ecosecurities study is likely to underestimate the supply of credits
from F-gas and N2O emission reduction projects, as most of the models used in the analysis to
estimate emission reductions may not adequately reflect these types of projects. Based on the
figures estimated for these type of projects by HIIE/PointCarbon6 of about 100 Mt/yr, this would
lead to an upward adjustment of our estimate to 320-410Mt/yr. This is in the same order of
magnitude as provided by various other assessments by the Climate Strategies Network7 (160-440
Mt/yr) and PointCarbon (200-600 Mt/yr). The breakdown into JI and CDM credits provided by the
Climate Strategies Network assessment shows their high estimate for CDM to be the same as the
UNFCCC estimated supply for CDM.
5 As quoted in: Axel Michaelowa, Hamburg Institute of International Economics, Jorund Buen, Arne Eik &
Elisabeth Lokshall, Point Carbon, (2005), The market potential of large-scale non-CO2 CDM projects. 6 Axel Michaelowa, Hamburg Institute of International Economics, Jorund Buen, Arne Eik & Elisabeth
Lokshall, Point Carbon, (2005), The market potential of large-scale non-CO2 CDM projects. 7 Neuhoff K, F Ferrario, M Grubb, E Gabel & K Keats (2006), Emission projections 2008-2012 versus NAPs II, convened by Climate Strategies. Available from: www.climate-strategies.org

FINAL REPORT 7
Given the above assessment, a CER/ERU supply of about 400 Mt/yr seems a reasonable estimate,
with a possible range from 200-600 Mt/yr.

FINAL REPORT 8
Table 1 Expected project based credits supply unt i l 2012
Phase I Phase II Up to 2020 Carbon price Credit type Source
Total
(MtCO2-eq)
Annual
(MtCO2-
eq/yr)
Total
(MtCO2-eq)
Annual
(MtCO2-eq/yr)
Annual
(MtCO2-eq/yr)
(per tCO2-eq)
Ecofys/Ecosecurities
(2005)
90 30 1,100-1,550 220-310 0-20$/t CERs/ERUs
Deutsche Bank
(Aug 2006)
750-1,500 150-300 ? CERs/ERUs
IEA (2005) 1,240
1,700
-10 – 0 $/t
0-10 $/t
Non-CO2 emission
reduction potential
IEA (2003) 583
1,191
< 0 $/t
10 $/t
Non-CO2 emission
reduction potential
HIIE/PointCarbon
(2004)
320 175
(495 cumulative
upto 2012)
99
(Ph I + Ph II)
CERs large non-CO2
CDM projects only
WorldBank (2005) 1,300 CERs
Climate Strategies
Network (Sep 2006)
680-1200
120-980
136-240
24-196
CERs
ERUs
PointCarbon (2006) 1,000-3,000 200-600 CERs/ERUs
UNFCCC 1,200 240 Actual prices CERs only
FINAL REPORT 9
Type of JI/CDM credi ts ava i lab le in 2008-2012
The following section presents a qualitative assessment of the type of projects that are likely to be
used to supply the JI/CDM credits in 2008-2012. This is based on a literature review and current
UNFCCC data.
In the CDM, basically all project types are eligible, except for nuclear plants and certain types of
land use projects (other than forestation). A major determining factor in terms of sectoral scope or
project type is the requirement for baseline and monitoring posed by the UNFCCC. This has
clearly been shown in the pipeline of baseline and monitoring methodologies submitted and
approved over time as well as the number of projects registered so far.
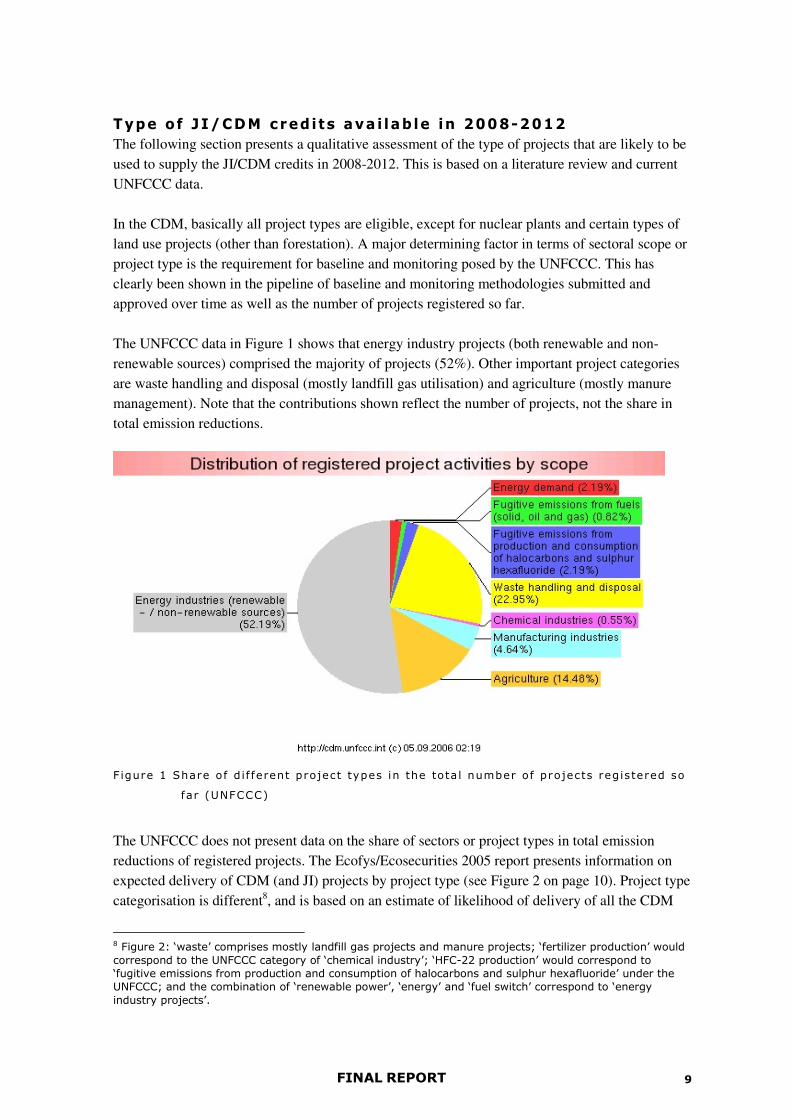
The UNFCCC data in Figure 1 shows that energy industry projects (both renewable and non-
renewable sources) comprised the majority of projects (52%). Other important project categories
are waste handling and disposal (mostly landfill gas utilisation) and agriculture (mostly manure
management). Note that the contributions shown reflect the number of projects, not the share in
total emission reductions.
Figure 1 Share of d i f ferent project types in the tota l number of projects registered so
far (UNFCCC)
The UNFCCC does not present data on the share of sectors or project types in total emission
reductions of registered projects. The Ecofys/Ecosecurities 2005 report presents information on
expected delivery of CDM (and JI) projects by project type (see Figure 2 on page 10). Project type
categorisation is different8, and is based on an estimate of likelihood of delivery of all the CDM
8 Figure 2: ‘waste’ comprises mostly landfill gas projects and manure projects; ‘fertilizer production’ would
correspond to the UNFCCC category of ‘chemical industry’; ‘HFC-22 production’ would correspond to
‘fugitive emissions from production and consumption of halocarbons and sulphur hexafluoride’ under the
UNFCCC; and the combination of ‘renewable power’, ‘energy’ and ‘fuel switch’ correspond to ‘energy
industry projects’.

FINAL REPORT 10
projects for which Project Design Documents (PDDs) have been developed (i.e. more projects are
covered than in the UNFCCC data). Therefore, results cannot be compared one-on-one.
Again, no data are available for JI projects. However, there are limited reasons to assume that the
project scope within the JI would be different than in CDM, especially since Russia and Ukraine
are likely to be the major host countries for JI projects. Main determining factors for project type
are assumed to be related to baseline methodologies and monitoring feasibility.
Comparison of the two sets of data shows that a relatively small number of projects will be
responsible for a large share of the expected emission reductions, especially for the landfill gas
projects, the HFC projects and the fertilizer production projects (reduction of N2O emissions).
These are the type of projects for which baseline and monitoring methodologies are most easily
developed.
When looking at submitted baseline and monitoring methodologies there is a trend towards more
energy efficiency and transport projects. However, only a limited number of those methodologies
have so far been approved. For the transport sector, for example, about 6 transport methodologies
have been submitted (three related to biofuels, two to modal shift and one related to transport
infrastructure) and only one methodology has been approved (modal shift).
Supply per sector as share of total CDM-JI
emission reductions
30%
23%19%
10%
7%
3%
3%
2% 2%
1%renew able pow er
Waste
Fertilizer production
HFC-22 production
industry
mining
Electricity
Energy
Fuel sw itch to NG
other
Figure 2 Supply of project-based emiss ion reduct ions ( tCO 2) by sector based on the
PDD database af ter adjustment for the l ike l ihood of del ivery
(Ecofys/Ecosecur it ies , 2005).

FINAL REPORT 11
3 Country leve l demand for c redi ts in 2008-2012
This section of the report assesses the likely purchase of project-based credits by Governments
globally to meet their Kyoto targets during the first Kyoto Commitment Period. This takes into
account publicly announced Government intentions to purchase allowances, and also whether
sufficient budgets and procedures have been put in place to actually obtain these credits.
The main countries that have ratified the Kyoto Protocol and are likely to have a gap to meet their
Kyoto target are the EU Member States, Canada and Japan. These are therefore the countries that
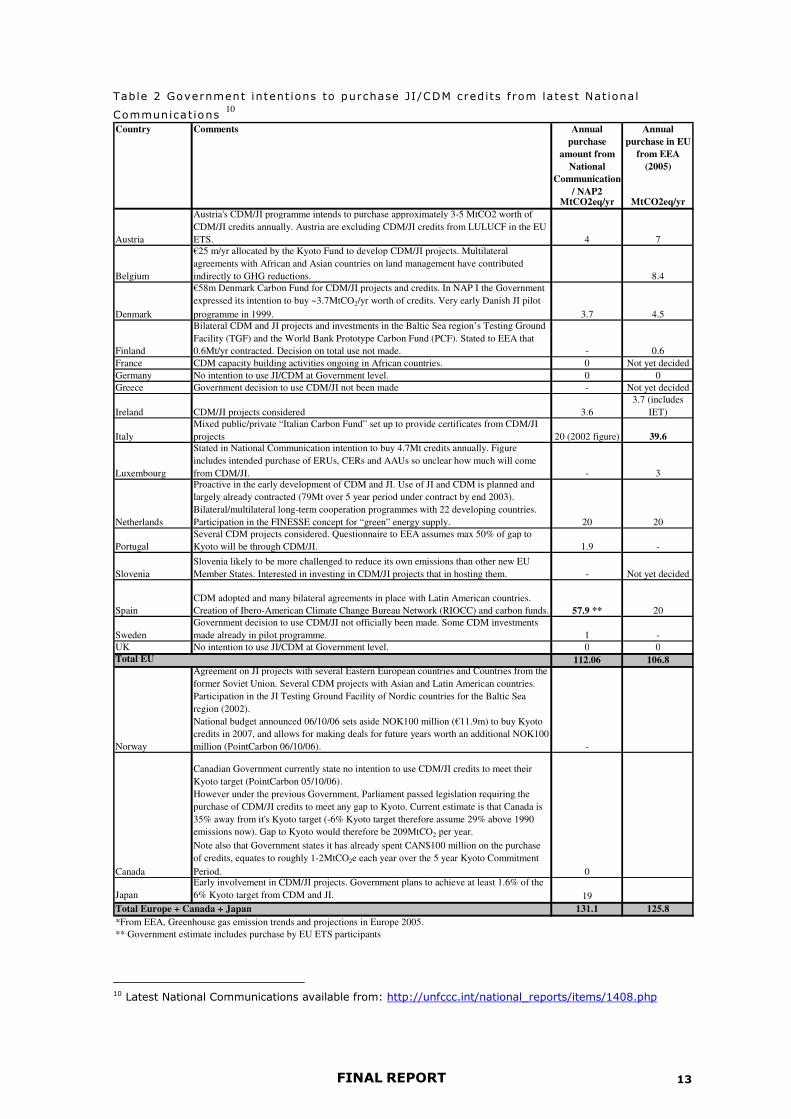
have been considered in this assessment. Table 2 on page 13 shows indications of Government
intentions to purchase JI/CDM credits to comply with their Kyoto target in the period 2008-2012,
taken from latest National Communications, Phase II NAPs and the 2005 European Environment
Agency (EAA) report 9.
According to the EEA 17 EU Member States have provided information on their intended use of
the Kyoto mechanisms and 12 have already decided to make use of the Kyoto mechanisms at a
government level. The only new Member States to have provided information on likely
Government JI/CDM purchase are Estonia and Slovenia. Estonia has more interest in being a host
country for JI than for purchasing credits. Slovenia is the only new Member State to have stated
interest in purchasing JI/CDM credits. This is in line with the progress towards Kyoto, where
Slovenia is the only new Member State to have difficulties reaching its Kyoto target. The volume
has however not been decided.
The figures stated in the table may differ due to: changing political decisions about what
proportion of the gap to Kyoto should be met through purchase of JI/CDM credits, particularly
versus the purchase of “Assigned Amount Units” (AAUs); different assumptions about emissions
projections and the likely gap to the Kyoto target; and also due to the state of preparations towards
the purchase of JI/CDM credits ie. whether sufficient funds have been put in place etc.
Estimated government demand in the EU25 is around 112 MtCO2eq/yr, according to latest
National Communications and Phase II NAPs. This compares to an estimate from the EEA report
in 2005 of 107 MtCO2eq/yr. Table 2 shows substantial differences in the estimates for Italy and
Spain between the two sources. In both cases the latest figure (indicated in bold) is higher than the
older figure and represents predictions of high emissions growth under a business as usual scenario
and hence an increased estimate of the gap to the Kyoto target.
The major governments outside the Europe that plan to purchase JI/CDM credits are Japan and
Canada. When Government demand from Japan is added to the European demand, the total figure
rises to 131.1 MtCO2eq/yr. The current Canadian Government states no intention to use JI/CDM
9 EEA (2005), Greenhouse gas emission trends and projections in Europe 2005.

FINAL REPORT 12
credits to meet their Kyoto target. However legislation was passed by the previous Government
requiring the purchase of JI/CDM credits to meet any gap to Kyoto, and Canada is projected to
have a gap to Kyoto of 209 MtCO2 per year. How this gap will be filled is not currently clear given
the discussions in Canada about whether or not to comply with the Kyoto Protocol. A change in
political decision to purchase JI/CDM credits could therefore change the Government demand
from Canada, and consequently the picture of global Government demand dramatically.
The overall estimate of 131 MtCO2eq/yr is likely to be conservative in that there are a number of
Governments who have stated an intention to use the Kyoto Flexible Mechanisms, but the actual
volume of JI/CDM credits they will purchase is not always stated or indeed known, and is not
therefore included in this estimate. On the other hand questions can be raised in many cases about
the status of Government preparations to purchase JI/CDM credits. If indeed a budget has so far
been set aside for JI/CDM credit purchase, it is often only a partial budget, and would not cover all
the stated intention to purchase JI/CDM credits at today’s prices. Government purchases of
JI/CDM credits that will actually occur in practice are also subject to uncertainty over the extent to
which countries will buy AAUs rather than JI/CDM units when under pressure to meet their Kyoto
target.
FINAL REPORT 13
Table 2 Government intent ions to purchase JI/CDM credits f rom latest Nat iona l
Communicat ions 10
Country Comments Annual
purchase
amount from
National
Communication
/ NAP2
Annual
purchase in EU
from EEA
(2005)
MtCO2eq/yr MtCO2eq/yr
Austria
Austria's CDM/JI programme intends to purchase approximately 3-5 MtCO2 worth of
CDM/JI credits annually. Austria are excluding CDM/JI credits from LULUCF in the EU
ETS. 4 7
Belgium
€25 m/yr allocated by the Kyoto Fund to develop CDM/JI projects. Multilateral
agreements with African and Asian countries on land management have contributed
indirectly to GHG reductions. 8.4
Denmark
€58m Denmark Carbon Fund for CDM/JI projects and credits. In NAP I the Government
expressed its intention to buy ~3.7MtCO2/yr worth of credits. Very early Danish JI pilot
programme in 1999. 3.7 4.5
Finland
Bilateral CDM and JI projects and investments in the Baltic Sea region’s Testing Ground
Facility (TGF) and the World Bank Prototype Carbon Fund (PCF). Stated to EEA that
0.6Mt/yr contracted. Decision on total use not made. - 0.6
France CDM capacity building activities ongoing in African countries. 0 Not yet decided
Germany No intention to use JI/CDM at Government level. 0 0
Greece Government decision to use CDM/JI not been made - Not yet decided
Ireland CDM/JI projects considered 3.6
3.7 (includes
IET)
Italy
Mixed public/private “Italian Carbon Fund” set up to provide certificates from CDM/JI
projects 20 (2002 figure) 39.6
Luxembourg
Stated in National Communication intention to buy 4.7Mt credits annually. Figure
includes intended purchase of ERUs, CERs and AAUs so unclear how much will come
from CDM/JI. - 3
Netherlands
Proactive in the early development of CDM and JI. Use of JI and CDM is planned and
largely already contracted (79Mt over 5 year period under contract by end 2003).
Bilateral/multilateral long-term cooperation programmes with 22 developing countries.
Participation in the FINESSE concept for “green” energy supply. 20 20
Portugal
Several CDM projects considered. Questionnaire to EEA assumes max 50% of gap to
Kyoto will be through CDM/JI. 1.9 -
Slovenia
Slovenia likely to be more challenged to reduce its own emissions than other new EU
Member States. Interested in investing in CDM/JI projects that in hosting them. - Not yet decided
Spain
CDM adopted and many bilateral agreements in place with Latin American countries.
Creation of Ibero-American Climate Change Bureau Network (RIOCC) and carbon funds. 57.9 ** 20
Sweden
Government decision to use CDM/JI not officially been made. Some CDM investments
made already in pilot programme. 1 -
UK No intention to use JI/CDM at Government level. 0 0
Total EU 112.06 106.8
Norway
Agreement on JI projects with several Eastern European countries and Countries from the
former Soviet Union. Several CDM projects with Asian and Latin American countries.
Participation in the JI Testing Ground Facility of Nordic countries for the Baltic Sea
region (2002).
National budget announced 06/10/06 sets aside NOK100 million (€11.9m) to buy Kyoto
credits in 2007, and allows for making deals for future years worth an additional NOK100
million (PointCarbon 06/10/06). -
Canada
Canadian Government currently state no intention to use CDM/JI credits to meet their
Kyoto target (PointCarbon 05/10/06).
However under the previous Government, Parliament passed legislation requiring the
purchase of CDM/JI credits to meet any gap to Kyoto. Current estimate is that Canada is
35% away from it's Kyoto target (-6% Kyoto target therefore assume 29% above 1990
emissions now). Gap to Kyoto would therefore be 209MtCO2 per year.
Note also that Government states it has already spent CAN$100 million on the purchase
of credits, equates to roughly 1-2MtCO2e each year over the 5 year Kyoto Commitment
Period. 0
Japan
Early involvement in CDM/JI projects. Government plans to achieve at least 1.6% of the
6% Kyoto target from CDM and JI. 19
Total Europe + Canada + Japan 131.1 125.8
*From EEA, Greenhouse gas emission trends and projections in Europe 2005.
** Government estimate includes purchase by EU ETS participants
10 Latest National Communications available from: http://unfccc.int/national_reports/items/1408.php
FINAL REPORT 14
4 EU Emiss ions Trading Scheme Phase II
To provide an assessment of the likely use of JI/CDM credits by participants in Phase II of the EU
ETS it is necessary to assess first the likely shortage of credits within Phase II of the scheme. This
section therefore considers one of the main indicators of likely shortage – a comparison of the
level of the proposed EU ETS cap to an estimate of what EU ETS sector emissions would be in
Phase II without the scheme: the projected Business as Usual (BAU) emissions.
CAP vs BAU
EU ETS Phase II caps proposed by Member States are compared here to alternative indicators of
the level of the cap. The proposed caps are then compared to two alternative Business as Usual
(BAU) emissions projections for the EU ETS sector in Phase II: the official ETS BAU stated by
the Member State in their Phase II NAP; and an independent calculated ETS BAU figure based on
PRIMES emissions projections from 2005 11.
This analysis here has been carried out for the following NAPs 12:
- Germany, UK, Poland, Ireland (notified to the European Commission); and
- France, Spain, Italy, Portugal and the Netherlands (draft NAPs available at time of
assessment).
These 9 Member States account for roughly 80% of emissions in the EU ETS, so although not
exhaustive, the analysis covers a major part of the emissions covered by the scheme. The countries
were selected on the basis of their large volumes of emissions, but also the status of notification of
the NAP to the European Commission and the NAP publication language.
The table in the Annex to this document shows an overview of the main cap and BAU data from
the calculations in this analysis.
Member States’ proposed Phase II caps are compared here to:
- Phase I cap minus 6%
The Phase I cap minus 6% scenario is relevant as a comparison as the Commission stated
in their December 2005 guidance document that:
11 PRIMES is a "market equilibrium" model for energy supply and demand in the EU(30) often used in policy
development and evaluation by the European Commission. It is based on energy data for all Member States
and Member States have an opportunity to comment on data and assumptions. Note that PRIMES has the
advantage of using one common framework with a consistent set of assumptions on eg. economic growth.
The disadvantage may be that the model is less tailored to individual Member States’ circumstances. 12 Latest available Phase II NAPs available from European Commission website:
http://ec.europa.eu/environment/climat/2nd_phase_ep.htm

FINAL REPORT 15
“If the emissions trading sector were to contribute a proportionate share of the reduction in
Member States with a gap to close, the second period total allocation in the EU25 would
be some 6% below the first period allocation, resulting in an annual average allocation
of 2.063 billion allowances. To meet the Kyoto targets a reduction of less than 6 % would
imply stronger efforts by the non-trading sector.”
The allocation to any additional installations proposed for inclusion in Phase II was added
to the Phase I cap -6% for each country to provide a figure that is directly comparable to
the proposed Phase II cap and the indicative maximum cap13.
- Indicative maximum cap for Phase II
The Commission proposed an indicative maximum cap for Member States in the second
EU ETS guidance document issued by the European Commission in December 2005 14.
The guidance document suggests that an indicative maximum cap should be calculated by
multiplying 2003 EU ETS sector emissions by projected national GDP growth and CO2
intensity improvement, thus giving a theoretical maximum that Member States should be
able to commit to achieving.
Due to data availability and a match with the time period of the growth projections
available we used 2005 verified emissions data15 in the calculation of the indicative
maximum cap here instead of 2003 emissions data. These data are then multiplied by
national GDP growth rates and CO2 intensity improvement rates from PRIMES (2005).
Again, the allocation to any additional installations proposed for inclusion in Phase II is
then added to this figure for each country to give an indicative Phase II maximum cap that
is directly comparable to the scope of the scheme in Phase II 13.
It is also relevant to use 2005 verified emissions data in calculations in this context as the
Commission has stated 16:
“The new 2005 emissions data gives independently assessed installation-level figures for the first
time and so provides Member States with an excellent factual basis for deciding upon the caps in
their forthcoming national allocation plans for the second trading period, when the Kyoto targets
have to be met. The plans are subject to approval by the Commission, which will also be making
extensive use of the 2005 emissions data.”
It is worth emphasising at this point that the caps analysed here are those proposed by Member
States for Phase II before the Commission decision on the NAP. A Euractiv report on 27 October
13 Note that adding the proposed Phase II allocation for additional installations means that no assessment
can be made of the level of proposed allocation to these additional installations. However the change in
scope is relatively small for all countries, so the error is estimated to be small. 14 Communication from the Commission on “Further guidance on allocation plans for the 2008 to 2012
trading period of the EU Emission Trading Scheme” COM (2005) 703, 22.12.2005. 15 Verified 2005 emissions taken from European Commission (DG ENV) press release 15/05/06, scaled up
to account for installations with missing data, plus estimated 2005 emissions for installations that opted out
of Phase I (relevant for Poland, Netherlands and UK). 16 Quote from European Commission (DG ENV) press release 15/05/06
http://ec.europa.eu/environment/climat/emission/pdf/citl_pr.pdf
FINAL REPORT 16
2006 quoted a Commission spokesperson as saying, “We have two basic criteria [in analysing
Phase II NAPs], 2005 emissions and Member States’ Kyoto targets”. The Commission have so far
indicated that some proposed Phase II caps have “disproportionately” overshot their 2005
emissions and are expected to be rejected17.
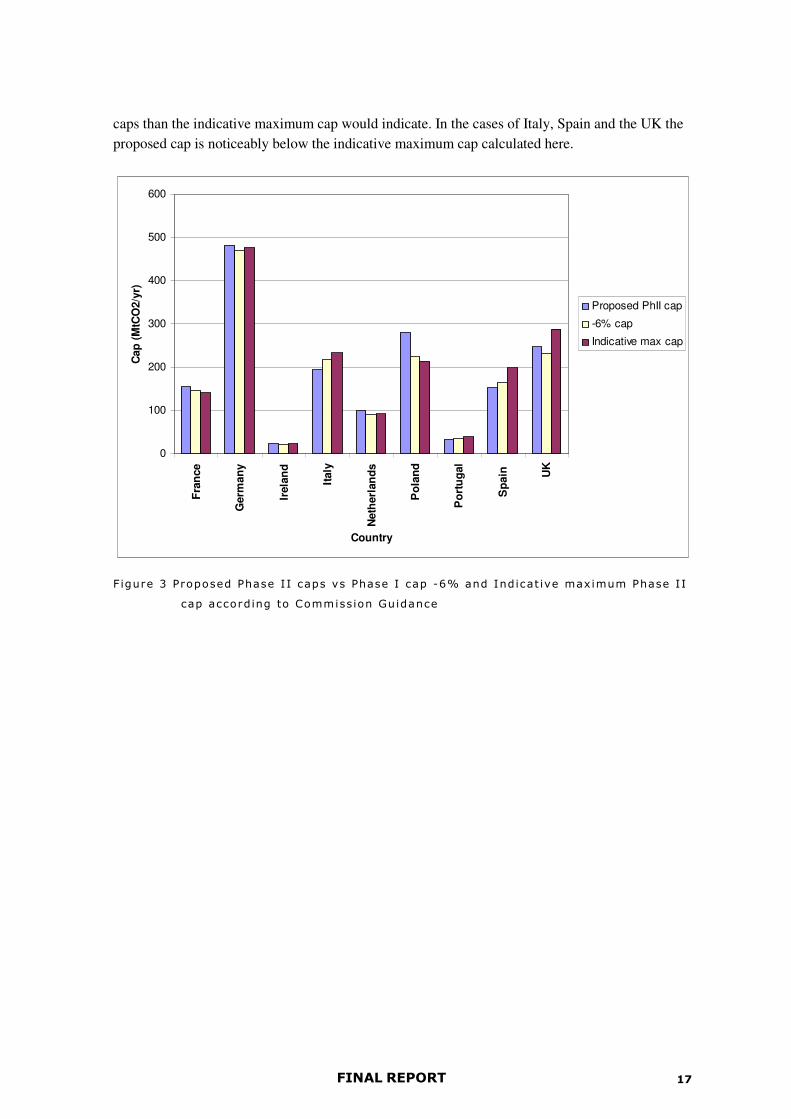
Figure 3 on page 17 shows the proposed Phase II caps compared to the indicative maximum Phase
II cap and the minus 6% cap. The data show that the -6% cap is lower than the proposed Phase II
cap for 6 out of the 9 Member States considered here, indicating that only 3 of the countries, Italy,
Portugal and Spain, are proposing Phase II caps that are more than 6% below their Phase I cap
(taking into account the change of scope). It is worth noting here however that the Commission
intended the -6% cap to be a guideline for those Member States who were not on track to meeting
their Kyoto target, rather than applying this figure across the board. Therefore it is useful to take
into account the progress towards Kyoto targets and the contribution of the ETS sectors to that
target.
Text Box 1 on page 18 compares both cap and BAU (based on the NAPII and on PRIMES 2005)
to a virtual Kyoto commitment for the ETS sectors (see explanation in the Text Box). Figure 4 in
Text Box 1 shows, for example, that for the UK (both cap and) the ETS BAU emissions are below
what would be required under the virtual Kyoto commitment, while (cap and official) BAU
emissions for Poland are exactly in line with the virtual Kyoto commitment. This suggests that for
these countries a 6% cut compared to the Phase I cap would not be in line with the Commission’s
interpretation.
The virtual Kyoto commitment provides a useful indication of the extent to which Member States
intend to use the EU ETS to move towards their Kyoto target. It must however be noted that the
calculation of a virtual Kyoto commitment relies on one key assumption: that the ETS sector will
make an even contribution to meeting the Kyoto target as other sectors and gases in the economy.
This may not be the case if, for example, non-CO2 greenhouse gases outside the ETS are reducing
faster than emissions within the ETS, or conversely if emissions from other sectors of the economy
(eg. transport) are growing faster than the ETS sector.
The virtual Kyoto commitment also does not include possible use of the Kyoto mechanisms by
Governments (i.e. JI, CDM and International Emissions Trading). A number of EU Member States
have intentions to purchase JI/CDM credits at a Government level (see Table 2 on page 13), with
varying levels of commitment already made. In particular the EEA (2005) concluded that the
Netherlands, Italy, Ireland and Spain had put, at least partial, budgets in place to purhcase JI/CDM
credits.
Figure 3 on page 17 also shows that proposed Phase II caps are higher than the indicative
maximum cap calculated here for 4 of the 9 Member States studied (France, Germany, the
Netherlands and Poland). The other Member States considered here are proposing more ambitious
17 Euractiv 27/10/06, Commission set to reject ‘overblown’ CO2 plans. Available from:
http://www.euractiv.com/en/sustainability/commission-set-reject-overblown-co2-plans/article-159116
FINAL REPORT 17
caps than the indicative maximum cap would indicate. In the cases of Italy, Spain and the UK the
proposed cap is noticeably below the indicative maximum cap calculated here.
0
100
200
300
400
500
600F
ran
ce
Germ
an
y
Irela
nd
Italy
Neth
erl
an
ds
Po
lan
d
Po
rtu
gal
Sp
ain
UK
Country
Cap
(M
tCO
2/y
r)
Proposed PhII cap
-6% cap
Indicative max cap
Figure 3 Proposed Phase I I caps vs Phase I cap -6% and Indicat ive maximum Phase I I
cap according to Commission Guidance
FINAL REPORT 18
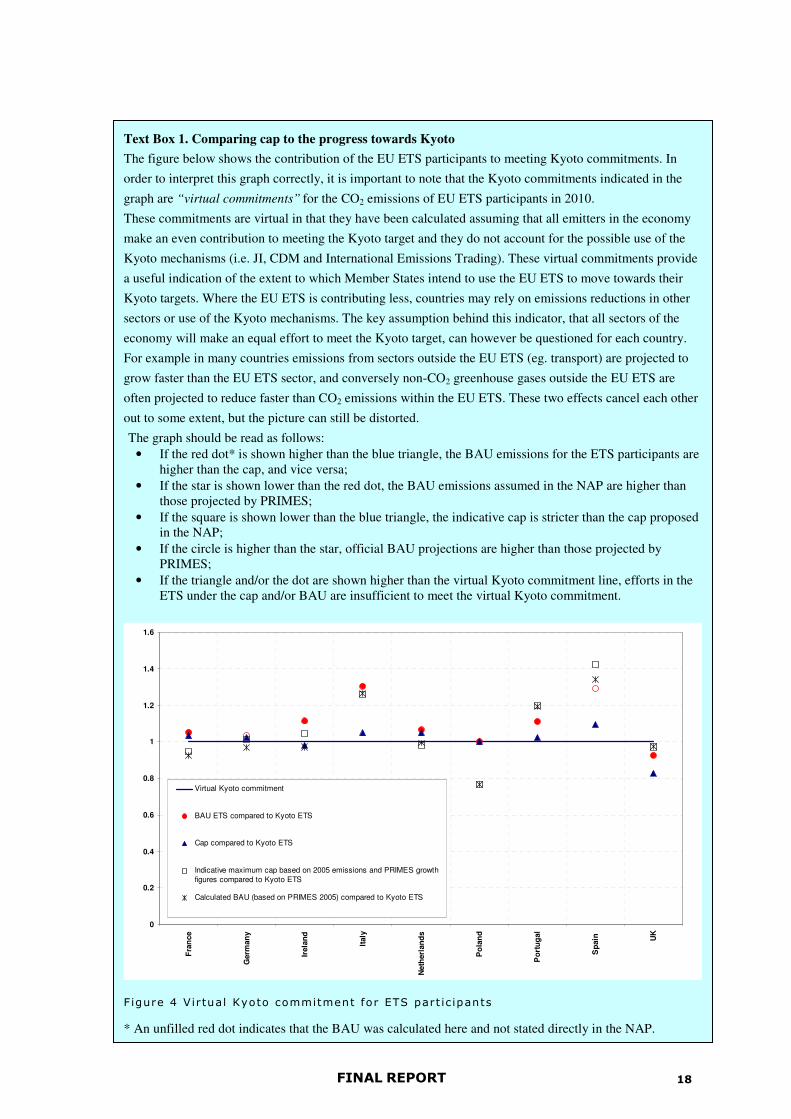
Text Box 1. Comparing cap to the progress towards Kyoto
The figure below shows the contribution of the EU ETS participants to meeting Kyoto commitments. In
order to interpret this graph correctly, it is important to note that the Kyoto commitments indicated in the
graph are “virtual commitments” for the CO2 emissions of EU ETS participants in 2010.
These commitments are virtual in that they have been calculated assuming that all emitters in the economy
make an even contribution to meeting the Kyoto target and they do not account for the possible use of the
Kyoto mechanisms (i.e. JI, CDM and International Emissions Trading). These virtual commitments provide
a useful indication of the extent to which Member States intend to use the EU ETS to move towards their
Kyoto targets. Where the EU ETS is contributing less, countries may rely on emissions reductions in other
sectors or use of the Kyoto mechanisms. The key assumption behind this indicator, that all sectors of the
economy will make an equal effort to meet the Kyoto target, can however be questioned for each country.
For example in many countries emissions from sectors outside the EU ETS (eg. transport) are projected to
grow faster than the EU ETS sector, and conversely non-CO2 greenhouse gases outside the EU ETS are
often projected to reduce faster than CO2 emissions within the EU ETS. These two effects cancel each other
out to some extent, but the picture can still be distorted.
The graph should be read as follows:
• If the red dot* is shown higher than the blue triangle, the BAU emissions for the ETS participants are higher than the cap, and vice versa;
• If the star is shown lower than the red dot, the BAU emissions assumed in the NAP are higher than those projected by PRIMES;
• If the square is shown lower than the blue triangle, the indicative cap is stricter than the cap proposed in the NAP;
• If the circle is higher than the star, official BAU projections are higher than those projected by PRIMES;
• If the triangle and/or the dot are shown higher than the virtual Kyoto commitment line, efforts in the ETS under the cap and/or BAU are insufficient to meet the virtual Kyoto commitment.
0
0.2
0.4
0.6
0.8
1
1.2
1.4
1.6
Fra
nce
Germ
an
y
Irela
nd
Italy
Neth
erl
an
ds
Po
lan
d
Po
rtu
gal
Sp
ain
UK
Virtual Kyoto commitment
BAU ETS compared to Kyoto ETS
Cap compared to Kyoto ETS
Indicative maximum cap based on 2005 emissions and PRIMES growth
figures compared to Kyoto ETS
Calculated BAU (based on PRIMES 2005) compared to Kyoto ETS
Figure 4 Vir tual Kyoto commitment for ETS part ic ipants
* An unfilled red dot indicates that the BAU was calculated here and not stated directly in the NAP.

FINAL REPORT 19
Figure 5 on page 20 compares the proposed Phase II caps to BAU projections for the ETS sector in
Phase II. In one country, Germany, it was not possible to take official BAU projections directly
from the NAP. The “official” BAU figure was therefore calculated separately using national CO2
projections for 2010 from the fourth National Communication (submitted to the UNFCCC October
2006) and the projected share of national CO2 emissions that the EU ETS sector accounts for from
NAP II. For Spain, the BAU also had to be calculated, but this time using official data contained
within the Phase II NAP.
For all countries an independent BAU calculation for the ETS sector has also been made, based on
verified 2005 emissions data and sector level emissions projections from PRIMES 2005 18.
PRIMES projections were chosen due to the fact that they provide a consistent methodological
approach across all Member States, and as such provide a useful independent comparison to
Member States’ own BAU emissions projections. There are limitations to this approach and in
some cases Member States have highlighted that PRIMES projections do diverge from their own
emissions projections. There are valid reasons why Member States may have a more accurate view
of individual circumstances in their country and hence may provide more accurate BAU
projections to the PRIMES model. However, equally Member State BAU scenarios can reflect
political considerations.
For the majority of countries considered here the official BAU figure is higher than the calculated
PRIMES-based BAU. Exceptions to this are Portugal, Spain and the UK, though differences are
small.
All countries assessed here show official BAU estimates for the ETS sector higher than their
proposed Phase II cap.
18 Sectors: industry, electricity/steam production, district heating and energy branch. Emissions projections
corrected for Phase I EU ETS scope. Phase II allocation for additional installations again added to make the
calculated BAU comparable to proposed Phase II caps.

FINAL REPORT 20
0
100
200
300
400
500
600
Fra
nce
Germ
an
y
Irela
nd
Italy
Neth
erl
an
ds
Po
lan
d
Po
rtu
gal
Sp
ain
UK
Country
MtC
O2/y
r Proposed PhII cap
Official ETS BAU
from NAP2
Calculated ETS
BAU
Figure 5 Proposed annual average Phase I I cap vs off ic ia l and ca lcu lated ETS BAU
project ions

FINAL REPORT 21
Annual EU ETS shortage 2008-2012
In order to get an initial feeling for the potential “shortage” of allowances in the 9 Member States
considered it was necessary to subtract BAU figures from the proposed caps. The table in the
Annex shows the “cap minus BAU” calculation for each of the official ETS cap and the -6% Phase
I cap (shown in Figure 3), and each of the 2 alternative BAU figures (shown in Figure 5).
Figure 6 on page 22 shows the proposed caps minus each of the BAU alternatives. If the official
BAU figures are used then the majority of countries are short. Poland and the Netherlands show a
0 MtCO2/yr difference19.
When the official BAU data are compared to the proposed Phase II caps, the total shortage
estimated for the 9 Member States considered here is -118 MtCO2/yr. There can be doubts raised
however here on the accuracy of some of the official BAU estimates from Member States ie. some
BAU projections may be over-optimistic in their growth assumptions.
When the proposed cap is compared to the independent BAU calculated from PRIMES data
however, 4 countries are long, one has a zero difference and the remaining 4 are short. Overall
there is a total net shortage of -8 MtCO2/yr.
Note that the above figures represent “net shortage” ie. (part of) the shortage in some countries is
cancelled out by an excess of allowances in other countries).
It is however also important to note the “gross shortage” of allowances in the EU ETS. If a
company is short of allowances then logically it could be expected that the company would opt for
the cheapest compliance option. Current estimates for JI/CDM credit prices are lower than
predicted EUA prices. There is expected to be some convergence of prices once JI/CDM credits
are allowed to enter the EU ETS trading market, but this price convergence may not be complete,
depending partly on the liquidity of the overall market as it develops and individual company
preferences and risk strategies. As such it could be argued that if the price differential between
cheaper JI/CDM credits and more expensive EUAs remains, then companies who are short of
allowances may tend towards purchasing JI/CDM credits before they would choose to buy EUAs.
The gross shortage of allowances is therefore the total sum of estimated shortage, excluding any
countries that are estimated to be long. The total gross shortage estimated here for the countries
analysed ranges from -118 MtCO2/yr (compared to official BAU estimates) to -123 MtCO2/yr
(compared to calculated PRIMES BAU). The range between these two figures is much smaller
than that for the two estimates of net shortage.
19 It must be noted here that Member States differ in their approach to BAU calculation (and in fact in the
extent to which they carry out projections at all). Data quality and the transparency of the calculations differ between countries. Importantly also the number of policies and measures already included in a “with policies and measures” BAU scenario differ between Member States due to national historical differences in the design and implementation of climate change policies. These factors must be borne in mind when directly comparing BAU figures. The number of policies and measures included in the “with measures” BAU scenario is very important to consider when comparing the Netherlands and Poland for example.

FINAL REPORT 22
Taken together these data suggest that if JI/CDM prices converge with EUA prices in Phase II and
the market has high liquidity then the maximum potential for JI/CDM credits to be used by EU
ETS participants might be expected to be in the range suggested by the net shortage for the
countries analysed here of 8 to 118 MtCO2/yr. If however a constant price differential remains and
JI/CDM credits are cheaper than EUAs, participants may choose to purchase JI/CDM credits in
preference to EUAs. The maximum potential for JI/CDM credits to be used by EU ETS
participants could then be expected to be higher and may be more in line with the gross shortage
estimate of 118 to 123 MtCO2/yr.
-300
-250
-200
-150
-100
-50
0
50
100
Fra
nce
Germ
an
y
Irela
nd
Italy
Neth
erl
an
ds
Po
lan
d
Po
rtu
gal
Sp
ain
UK
To
tal
Country
MtC
O2/y
r Cap - official BAU
Cap - calculated BAU
Max JI/CDM use
Figure 6 Proposed Phase I I cap minus of f ic ia l and calcu lated ETS sector BAU f igures
(=est imated EU ETS shortage) and Theoret ica l maximum JI/CDM cred it use
FINAL REPORT 23
JI/CDM restr ic t ions
One of the criteria that Member States must comply with in the EU ETS Directive20 (as amended
by the Linking Directive concerning the linking of the Kyoto mechanisms to the EU ETS21) states:
“The plan [NAP] shall specify the maximum amount of CERs and ERUs which may be used by
operators in the Community scheme [EU ETS] as a percentage of the allocation of the allowances
to each installation.”
The Commission however gives no quantitative guidance on an appropriate level of a JI/CDM
credit limit, so it could theoretically be possible for a Member State to propose a limit of 100%,
effectively setting no limit. The Directive does however also state that:
“The percentage shall be consistent with the Member State’s supplementarity obligations under the
Kyoto Protocol.”
Supplementarity is the idea that any international credit purchases by Member States must be in
addition to (“supplemental” to) emissions abatement action at home, so Member States should not
be able to purchase all of their emissions abatement across the economy from other countries.
Within the EU the term has however not been quantitatively defined, but informally a 50:50
division is often used within the EU as a maximum for purchasing international credits.
Member States can also set restrictions on the type of JI/CDM credits that installations may use,
for example restricting the use of credits from projects that mitigate non-CO2 greenhouse gases or
sinks. Under the EU ETS guidance Member States must specify to the European Commission in
their Phase II NAP any such qualitative restrictions to the use of JI/CDM credits they wish to
apply in their country.
As proposed by the Commission, restrictions have been proposed on the basis of a maximum
percentage of an installation’s allocation (on an annual basis). This has enabled us to calculate a
theoretical maximum volume of project based credits that could be used in these Member States
each year, if it was assumed that every installation in each country would use their maximum
permitted number of JI/CDM credits. This was calculated by multiplying the maximum percentage
of an installation’s allocation by the proposed Phase II cap.
The total theoretical maximum amount of credits to be used by EU ETS participant in Phase II is
281 million per year, for these 9 Member States.
20 Directive 2003/87/EC of the European Parliament and of the Council of 13 October 2003 establishing a
scheme for greenhouse gas emission allowance trading within the Community and amending Council Directive 96/61/EC, OJ L 275 of 25.10.2003 21 Directive 2004/101/EC of the European Parliament and of the Council of 27 October 2004 amending
Directive 2003/87/EC establishing a scheme for greenhouse gas emission allowance trading within the Community, in respect of the Kyoto Protocol’s project mechanisms, OJ L 338/18 of 13.11.2004.

FINAL REPORT 24
Table 3 overleaf shows restrictions on JI/CDM project credit use by participants in Phase II of the
EU ETS, as proposed by the 9 Member States in the NAPs analysed. Figure 6 on page 22
compares the theoretical maximum JI/CDM credit use in the 9 Member States considered here to
the estimated allowance shortage when the proposed caps are compared to official and PRIMES-
derived BAU scenarios.
The theoretical maximum calculated here may be unlikely to be met in these Member States as it is
unlikely that every installation in every Member State would use the maximum number of project-
based credits towards its target. However it must be noted that the implementation of restrictions
in only some of the Member States will not result in a cap on the inflow of JI/CDM credits into the
EU ETS. As companies can always exchange JI/CDM credits for EUAs, in this case restrictions do
not necessarily result in more domestic reductions.
Table 3 JI/CDM cred it restr ic t ions proposed by Member States for Phase I I
JI/CDM
restriction
from NAP
Theoretical
maximum
JI/CDM credits
in EU ETS
NAP2 NAP2
% of allocation Mt/yr
France 10 15
Germany 12 58
Ireland 50 11
Italy 10 19
Netherlands 8 8
Poland 25 70
Portugal 22 10 3
Spain 50 76
UK 8 20
Total - 281
22 Note the Portuguese NAP states that “in exceptional cases” new installations will be able to exceed this
limit, on approval of the Ministry of Environment and the Ministry of Economics and Innovation.

FINAL REPORT 25
5 Emiss ion reduct ion potent ia ls wi th in the EU ETS
Currently, limited up to date and consistent data are available on emission reduction potentials and
cost within EU ETS sectors. In the decision-making on the implementation of the EU ETS a large
study was carried out by Ecofys et al (Sectoral Objectives23) to assess cost and potentials for all
greenhouse gases, all sectors and all (then 15) Member States. A main conclusion of that study
was that the Kyoto target for the EU as a whole could be reached at a cost of €20/t if full trading is
assumed24. A follow-up study covering all 27 (upcoming) Member States will be carried out, but
results will not be available for the next two years.
A more recent analysis has been carried out by Ecofys25, looking at the emission reduction
potentials and cost within the industry sectors covered by the EU ETS (iron & steel, cement,
ceramics, glass, other minerals, pulp & paper and refineries) in the EU25. This analysis suggests
that emissions in these sectors in 2010 could technically be reduced by about 110 MtCO2 (EU25).
It is estimated that around 35 Mt/yr abatement would be achievable within the timeframe of Phase
II of the EU ETS at zero or low cost per tonne carbon saved.
Note that the estimated price level expected for JI/CDM credits ranges from the current €8/t to
prices close to EUA prices. However no estimates are currently available for abatement levels at
prices around current JI/CDM credit levels, between the €0 and €20/t marks. The Sectoral
Objectives study mentioned above suggests that if the carbon price considered increases from €0/t
to €20/t, roughly another 50% of achievable emission abatement can be added to the estimate of
emission reduction potential26, which would suggest emissions abatement of around 50 Mt in the
industry sectors with that carbon price. On the other hand, however, experience has shown that
even cost-effective internal emission reduction potentials are usually not fully implemented, due to
a variety of barriers, including lack of information, low priority and management attention, limited
access to capital and, importantly here, carbon price volatility and risk. This suggests that
implementation rates may be closer to lower estimates of emission reduction potential.
Note that the estimate here excludes any quantitative potential for emission reductions in the
electricity sector. However, recent discussions suggest that emission reductions in this sector at
low cost are limited. The high carbon prices of last year were insufficient to drive a switch from
coal to gas-fired power stations, and renewable electricity generation is often more expensive.
Current increases in co-firing of biomass with fossil fuels and increases in renewable electricity
23 Economic Evaluation of Sectoral Emission Reduction Objectives for Climate Change, carried out by
Ecofys, AEA Technology and National Technical University of Athens, 2001, commissioned by the European
Commission: http://ec.europa.eu/environment/enveco/climate_change/sectoral_objectives.htm 24 Across the entire economy, not just the ETS sectors. 25 Ecofys (August 2006), CO2 reduction potentials in the EU25. Confidential draft report for corporate client. 26 NB based on EU15.
FINAL REPORT 26
generation are being driven by the renewable electricity legislation and targets, rather than the
price of carbon.
The above estimate of 35 Mt/yr can therefore be considered to be a reasonable estimate of the
emission reduction potential available at relatively low cost within the EU ETS sectors.
FINAL REPORT 27
6 Conc lus ions
The analysis shows that:
- Global JI/CDM credit supply is estimated at around 400 Mt/yr during 2008-1012, with a
possible range from 200 to 600 Mt/yr.
- Based on initial estimates one quarter to one third of JI/CDM credits in 2008-2012 may be
expected to originate from non-CO2 emission reductions projects, which are likely to have
a lower cost to generate than credits from CO2 emission reduction projects.
- A conservative global demand for JI/CDM credits from governments of 130 MtCO2eq/yr,
assuming zero purchase from the Canadian Government and excluding countries with
announced but non-quantified intentions to purchase credits. Note that not all intentions
that have been quantified are at this moment backed up with budget commitments.
- If market liquidity is high and JI/CDM prices converge with EUA prices in Phase II, then
the shortage that EU ETS participants aim to cover through the purchase of JI/CDM
credits might be expected to be in the range suggested by the net shortage for the countries
analysed here of 8 to 118 MtCO2/yr. If however a price differential remains and JI/CDM
credits are cheaper than EUAs, then the gap that EU ETS participants may choose to fill
by purchasing JI/CDM credits could be expected to be larger. The purchase of JI/CDM
credits by EU ETS participants may then be more in line with the gross shortage estimate
for the 9 countries here of 118 to 123 MtCO2/yr.
- A theoretical maximum of 280 Mt/yr (9 Member States) of JI/CDM credits has been
calculated here that installations would be allowed to use under the EU ETS, creating no
effective restriction when compared to the estimated shortage.
- Around 110 MtCO2/yr of technical emissions reduction potential exists within the industry
sectors, of which about 35Mt abatement would be relatively easily achievable within the
timeframe of the second Phase. Little low cost emissions abatement exists within the
energy sector.
The above leads to the following conclusions:
• Allowed use of JI/CDM credits in the EU ETS is significantly larger than expected
shortage;
• Allowed use of JI/CDM credits in the EU ETS is below the expected supply of credits.
This is also likely to be the case if government demand is taken into account, especially
recognising that governments can also use AAUs to meet their Kyoto target.
• Sufficient low cost emission reductions seem to be available within the EU ETS sectors
to meet a substantial part of the expected shortage.
• Use of JI/CDM credits is likely to depend on other aspects than just the carbon price, e.g.
barriers to implementation of internal emission reductions (lack of information, low
priority and management attention, limited access to capital, high (perceived) risks),
familiarity with trading and the internal carbon market, etc.
FINAL REPORT 28
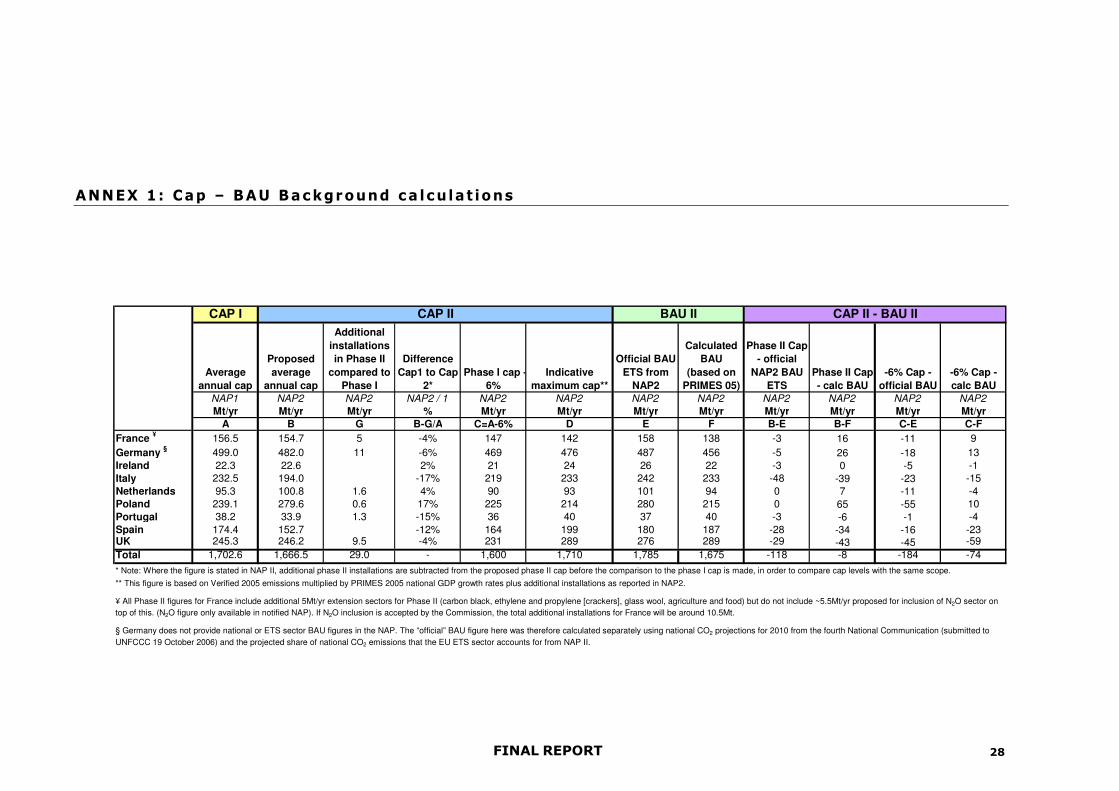
ANNEX 1: Cap – BAU Background ca lcu la t ions
CAP I
Average
annual cap
Proposed
average
annual cap
Additional
installations
in Phase II
compared to
Phase I
Difference
Cap1 to Cap
2*
Phase I cap -
6%
Indicative
maximum cap**
Official BAU
ETS from
NAP2
Calculated
BAU
(based on
PRIMES 05)
Phase II Cap
- official
NAP2 BAU
ETS
Phase II Cap
- calc BAU
-6% Cap -
official BAU
-6% Cap -
calc BAU
NAP1 NAP2 NAP2 NAP2 / 1 NAP2 NAP2 NAP2 NAP2 NAP2 NAP2 NAP2 NAP2
Mt/yr Mt/yr Mt/yr % Mt/yr Mt/yr Mt/yr Mt/yr Mt/yr Mt/yr Mt/yr Mt/yr
A B G B-G/A C=A-6% D E F B-E B-F C-E C-F
France ¥
156.5 154.7 5 -4% 147 142 158 138 -3 16 -11 9
Germany §
499.0 482.0 11 -6% 469 476 487 456 -5 26 -18 13
Ireland 22.3 22.6 2% 21 24 26 22 -3 0 -5 -1
Italy 232.5 194.0 -17% 219 233 242 233 -48 -39 -23 -15
Netherlands 95.3 100.8 1.6 4% 90 93 101 94 0 7 -11 -4
Poland 239.1 279.6 0.6 17% 225 214 280 215 0 65 -55 10
Portugal 38.2 33.9 1.3 -15% 36 40 37 40 -3 -6 -1 -4
Spain 174.4 152.7 -12% 164 199 180 187 -28 -34 -16 -23UK 245.3 246.2 9.5 -4% 231 289 276 289 -29 -43 -45 -59
Total 1,702.6 1,666.5 29.0 - 1,600 1,710 1,785 1,675 -118 -8 -184 -74
* Note: Where the figure is stated in NAP II, additional phase II installations are subtracted from the proposed phase II cap before the comparison to the phase I cap is made, in order to compare cap levels with the same scope.
** This figure is based on Verified 2005 emissions multiplied by PRIMES 2005 national GDP growth rates plus additional installations as reported in NAP2.
¥ All Phase II figures for France include additional 5Mt/yr extension sectors for Phase II (carbon black, ethylene and propylene [crackers], glass wool, agriculture and food) but do not include ~5.5Mt/yr proposed for inclusion of N2O sector on
top of this. (N2O figure only available in notified NAP). If N2O inclusion is accepted by the Commission, the total additional installations for France will be around 10.5Mt.
CAP II BAU II CAP II - BAU II
§ Germany does not provide national or ETS sector BAU figures in the NAP. The “official” BAU figure here was therefore calculated separately using national CO2 projections for 2010 from the fourth National Communication (submitted to
UNFCCC 19 October 2006) and the projected share of national CO2 emissions that the EU ETS sector accounts for from NAP II.
FINAL REPORT 29
ANNEX 2: Compar ison to other s tudies
Recent work for the Climate Strategies group27 concluded that if currently proposed Phase II NAPs
were approved, carbon prices would tend to be low and only small volumes of JI/CDM would
enter the EU ETS. It must be noted that the study did not conclude that the international market for
JI/CDM credits would be weak. The report concluded that internationally Government demand for
JI/CDM credits would be high, however without significant strengthening of the proposed Phase II
caps, demand for JI/CDM creidts within the EU ETS would be low.
These conclusions were based on a study that collated information from available Phase II NAPs
and compared the resulting proposed cap with different projections of emissions. Power station
emissions were projected separately using a dedicated model. For the industry sectors, two
approaches were taken: starting with verified emissions for 2005 and applying sector specific
growth rates28 and country specific CO2 growth rates; and using sector specific CO2 growth rates
from the E3ME model of Cambridge Econometrics. The work assumed that up to 1,000 MtCO2 of
project based credits would be available to enter the EU ETS during the period 2008-2012 (200
MtCO2/yr), which matches with the lower end of the range estimated here.
Several scenarios for the projections were considered in the Climate Strategies work. Even with a
zero carbon price (ie. without any inflow of project credits to the EU ETS), they concluded that
allowance supply would exceed demand in the EU ETS in 20% of the scenarios. With a €20/tCO2
carbon price, allowance supply would exceed demand in 50% of the scenarios.
Frederico Ferrario29, whose work fed into that of the Climate Strategies network, compared
different BAU projections with proposed Phase II caps. BAU projections (based on a trend
extrapolation of the available sample of total greenhouse gas emissions for each country) are less
than 50 MtCO2/yr higher than the NAP II cap. Projections based on a methodology developed by
Georgopoulou et al (2005) and projections from the UK DTI (2006) are more than 300 MtCO2/yr
higher that the proposed NAP II cap. This gives a very wide range of estimated shortage of
allowances each year within the EU ETS. Nevertheless the results are within the estimated
shortage range found here, especially given methodological issues related to the extrapolation of
individual country scenarios to other countries. Note that at the time of the Ferrario study
information was not available for Poland, which could be significant as it represents more than
10% of the EU total allowances and, as shown in this report, is likely to be long. The results are
therefore likely to be relatively close to those shown here given the lack of data from Poland.
27 Emission projections 2008-2012 versus NAPs II http://www.climate-strategies.org/ 28 From Oxford Economic Forecasting emissions projections calculated for the UK Department of Trade and
Industry during preparations for the Phase II UK NAP. 29 The European Emissions Trading Scheme: an assessment of the Second Phase National Allocation Plans
and Business as Usual emissions projections, Frederico Ferrairo, Imperial College Sept 2006.