Embed Size (px)
Citation preview
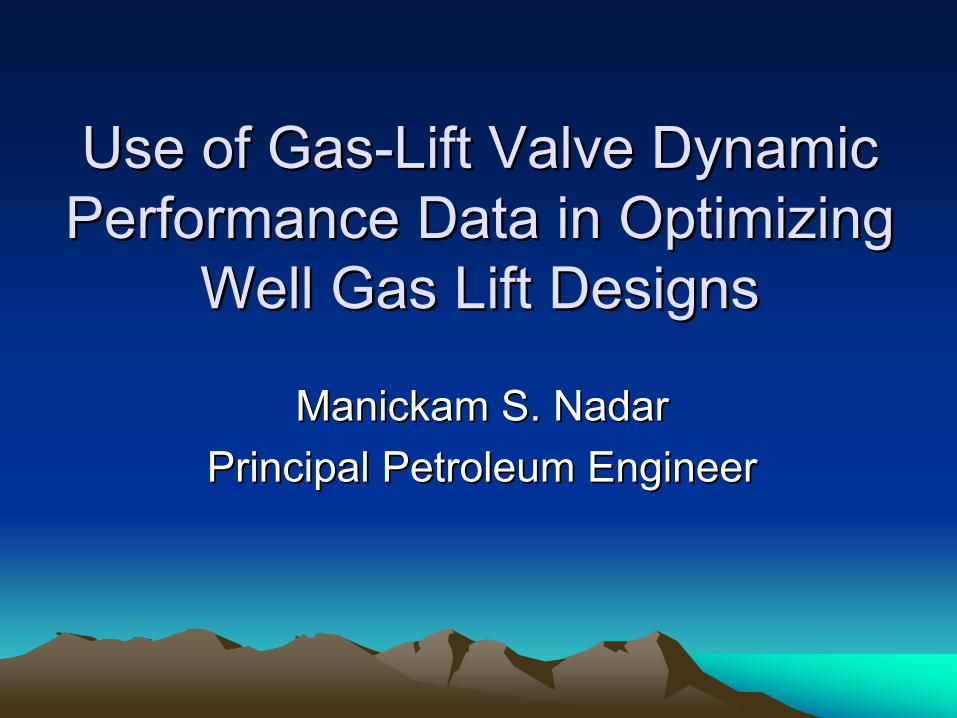
Use of GasUse of Gas--Lift Valve Dynamic Lift Valve Dynamic Performance Data in Optimizing Performance Data in Optimizing
Well Gas Lift DesignsWell Gas Lift Designs
Manickam S. NadarManickam S. NadarPrincipal Petroleum EngineerPrincipal Petroleum Engineer
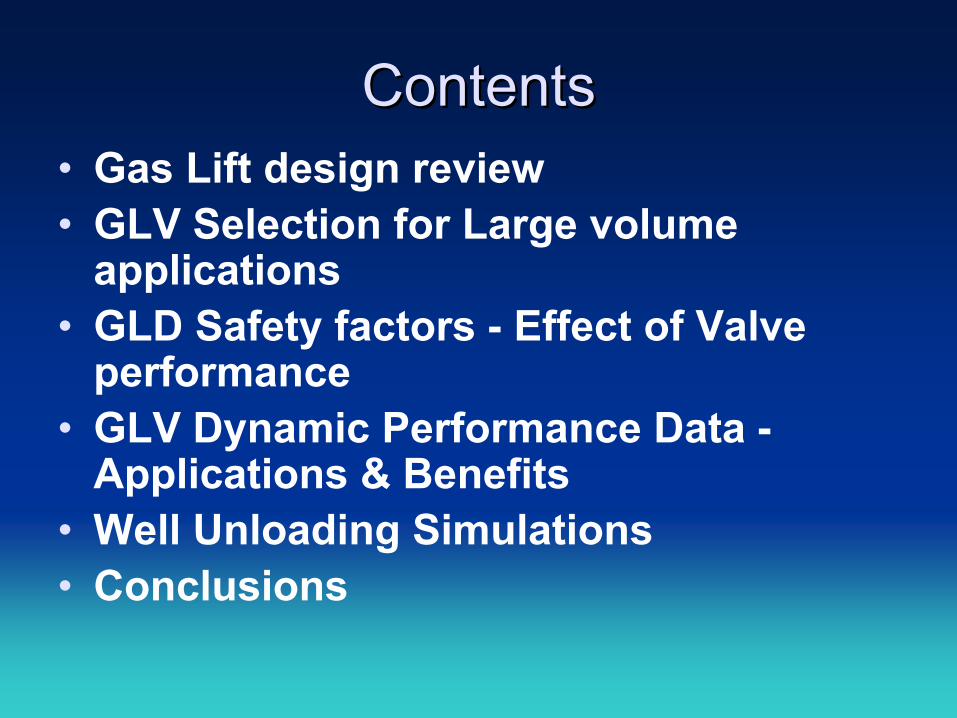
ContentsContents• Gas Lift design review • GLV Selection for Large volume
applications• GLD Safety factors - Effect of Valve
performance • GLV Dynamic Performance Data -
Applications & Benefits• Well Unloading Simulations• Conclusions

Why do we need a Why do we need a reliablereliable Gas Lift Design?Gas Lift Design?
• Should unload the well to the operating point smoothly– Failure / interruption of the unloading process
leads to loss of production and has cost and safety impact
• Puts stress on unloading valves – can easily get damaged, causing permanent leak at shallow depths
• May require intervention to discover that well is not operating as designed and to fix the problem
• Design should be flexible – Should work for a range of BSW or produced GOR– Should withstand many unloading cycles

Gas Lift String DesignGas Lift String Design• Unloading valves to unload the well to the
desired operating point– Valves to close sequentially, once the unloading
is transferred to the next mandrel– No unloading valves required if sufficient kick off
pressure is available to unload to orifice directly• Operating valve (usually orifice) to ensure
single point lift for normal operation• May have dummy valves in optional
mandrels below the operating point (future use)
• Unloading procedure to be followed

Gas Lift well with no unloading Gas Lift well with no unloading mandrelmandrel
GLM
Pressure
Unloading Gradient
Operating Injection Pressure
GL Kick off Pressure
TVD
Perforations

Gas Lift Design with Unloading Gas Lift Design with Unloading Mandrel StationsMandrel Stations
• Mandrels 1-4 have unloading valves
• Mandrel 5 is the operating point
• M-6 and 7 may have dummy valves
• Operating gas injection pressure is clearly lower than kick off pressure
M-1
M-2
M-3
M-4M-5M-6M-7
Pressure
TVD

Unloading valve vs. Orifice: Unloading valve vs. Orifice: Gas Passage comparisonGas Passage comparison
Qgi
PcsgPtbg
Orifice
Unloading Valve
Throttling RangeDifferential Range
Maximum Flow

GLV Types used for GLV Types used for Large Volume ApplicationsLarge Volume Applications
• Tubing pressure sensitive (PPO) Valve– Deeper gas lift (uses full gas lift pressure)– May require more number of mandrels– Gas passage at deeper mandrels is a challenge
• Casing pressure sensitive (IPO) Valve– Gas lift depth compromised by decrease in injection
pressure– May use less number of mandrels– Gas passage is usually not a problem
• Constant Flow (CF) Valve– This balanced casing pressure sensitive valve works like an
IPO valve, but closes on sensing decrease in production pressure
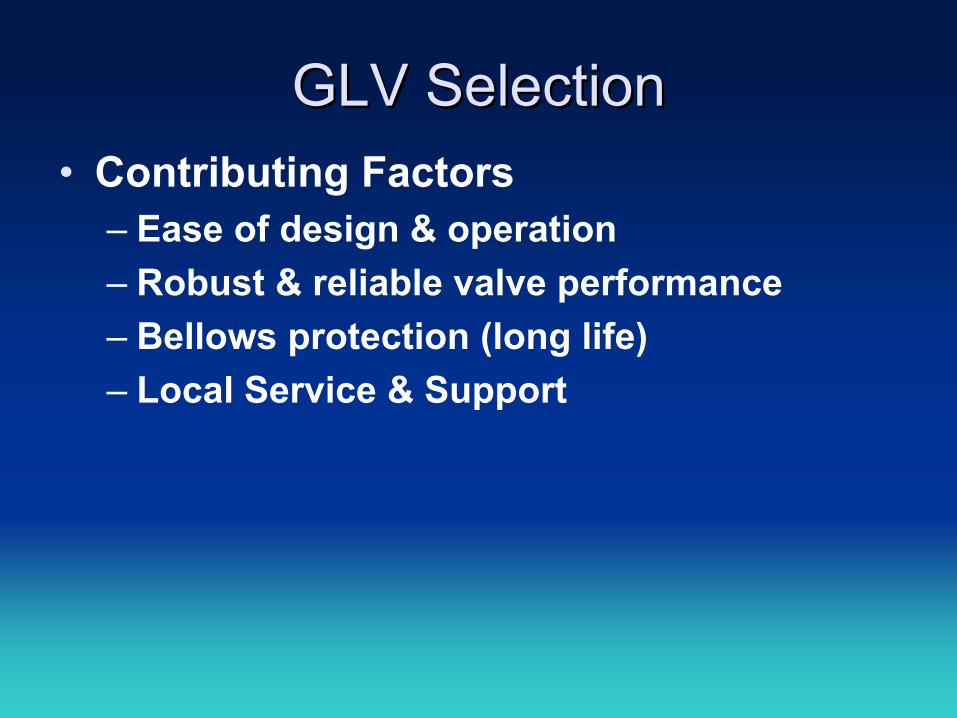
GLV SelectionGLV Selection• Contributing Factors
– Ease of design & operation– Robust & reliable valve performance– Bellows protection (long life)– Local Service & Support

Performance of PPO valvesPerformance of PPO valves
1.5” PPO (mod C/O port)•Port 3/8”, Ptro: 1032 psi•Port 5/16”, Ptro: 969 psi•Port 1/4”, Ptro: 920 psi
All valves designed for
Ptov=1150 psi; Pc=1500 psi & Temp = 216°F

Performance Comparison: Performance Comparison: CF & PPO ValvesCF & PPO Valves
•CF Valve, Port 3/8”, Ptro: 1485 psi•PPO, Port 3/8”, Ptro: 1032 psi
Both valves designed for
Ptov=1150 psi; Pc=1500 psi & Temp = 216°F
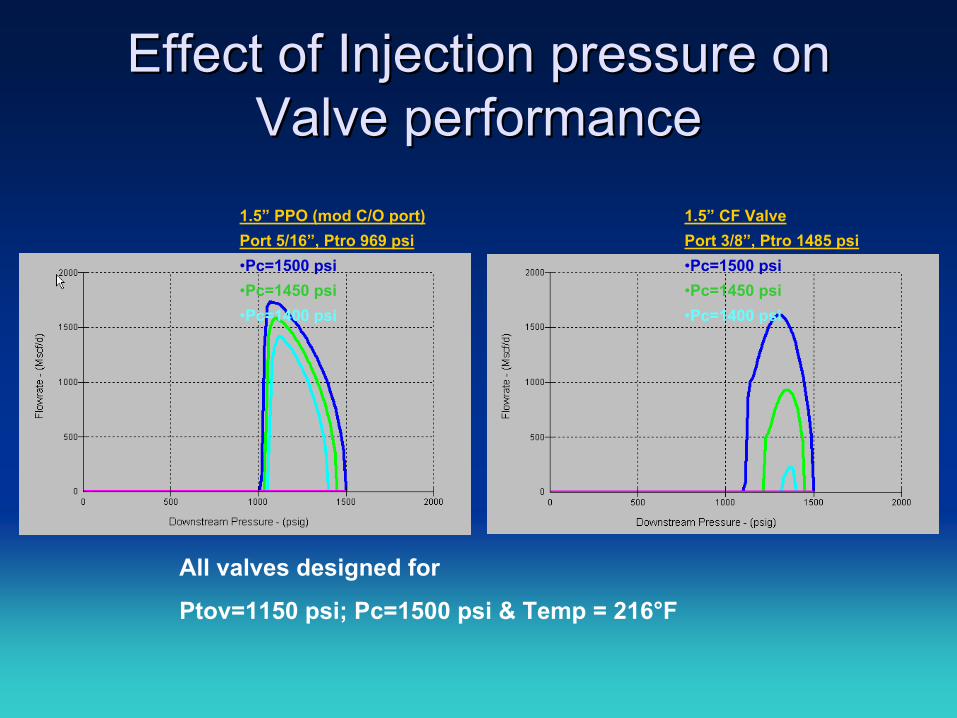
Effect of Injection pressure on Effect of Injection pressure on Valve performanceValve performance
1.5” PPO (mod C/O port) Port 5/16”, Ptro 969 psi•Pc=1500 psi•Pc=1450 psi•Pc=1400 psi
1.5” CF ValvePort 3/8”, Ptro 1485 psi•Pc=1500 psi•Pc=1450 psi•Pc=1400 psi
All valves designed for
Ptov=1150 psi; Pc=1500 psi & Temp = 216°F

Transfer PointTransfer Point
M-1
M-2
M-3
M-4M-5M-6M-7
Pressure
TVD
Ptr
Lift gas
Production
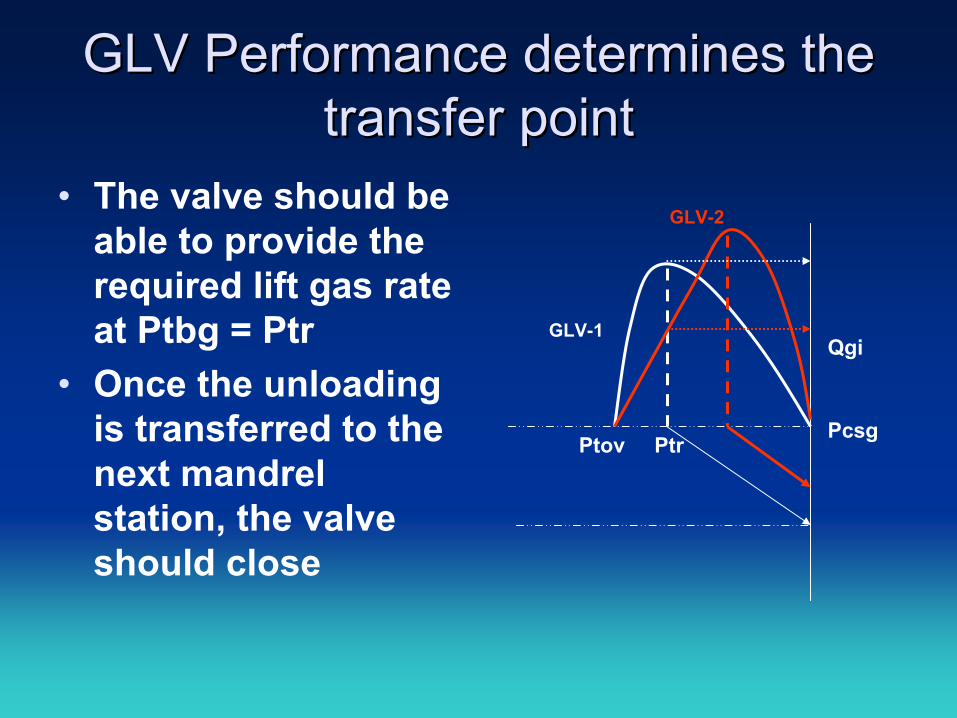
GLV Performance determines the GLV Performance determines the transfer pointtransfer point
• The valve should be able to provide the required lift gas rate at Ptbg = Ptr
• Once the unloading is transferred to the next mandrel station, the valve should close
Qgi
PcsgPtov Ptr
GLV-1
GLV-2

Need for GLV PerformanceNeed for GLV Performance• Gas passage at Ptr is lower than required
– Well unable to transfer deeper• Valve does not close after unloading
– Results multi-point lifting (inefficiency)– Sometimes well does not transfer to the designed
operating depth• No. of gas lift mandrels more than optimum
– Additional leak path in the completion– More initial cost, but not value adding

Published results of Dynamic Published results of Dynamic performance testingperformance testing
• Using Thornhill Craver equation for gas passage calculations – Reasonably accurate for orifice valves (with suitable
coefficients), but not good for unloading valves• Valve internals and moving parts have significant
effect on the unloading valve performance – Bellows configuration, distance between the ball and seat,
cross-over port design (PPO Valves), reverse flow check (nose section) affect the valve performance
– True for bellows charged and spring loaded valves
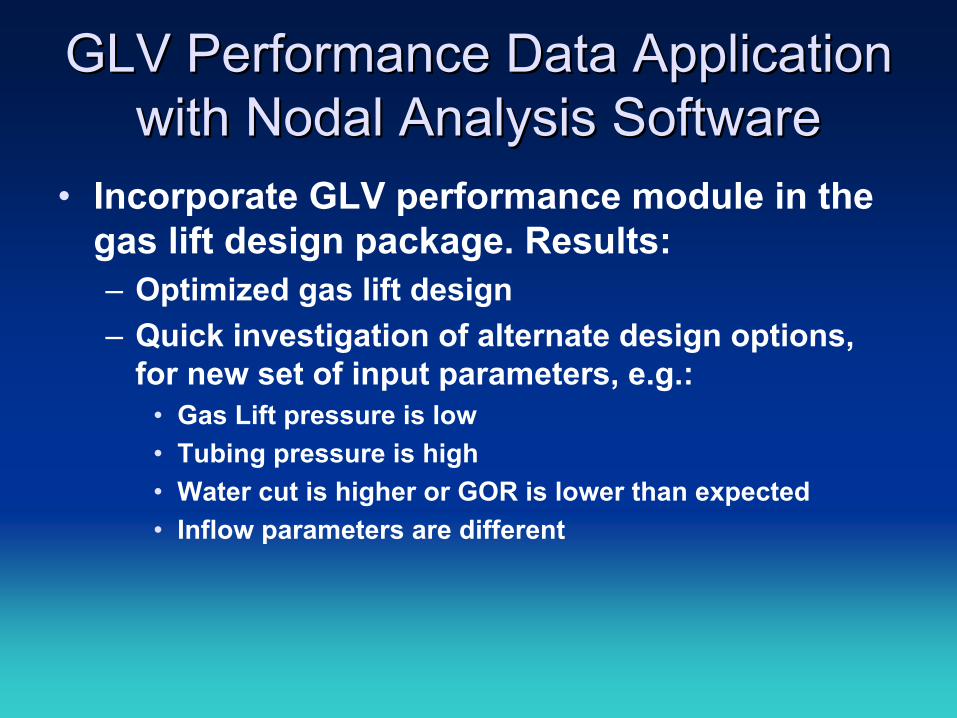
GLV Performance Data Application GLV Performance Data Application with Nodal Analysis Softwarewith Nodal Analysis Software
• Incorporate GLV performance module in the gas lift design package. Results: – Optimized gas lift design– Quick investigation of alternate design options,
for new set of input parameters, e.g.:• Gas Lift pressure is low• Tubing pressure is high• Water cut is higher or GOR is lower than expected• Inflow parameters are different

GLDesignGLDesign with PPO valveswith PPO valvesGas Lift Diagnosis Plot for Well A
5-1/2" Tubing, 8128 BPD, 75% BSW
Layer name Pressure Liquid rate Gas GOR Water WCpsia STB/day MMSCF/day SCF/STB STB/day per cent
Layer_1 2115.297 8127.612 0.734 361.000 6095.709 75.000Qgi = 8.2 MMscf/day
8313.9
6253.675
4193.45
2133.225
73
True
Ver
tical
Dep
th (f
t)
40003000200010000Pressure (psia)
200150100500Temperature (degrees F)
Tubing pressure to open valvePressure: Q liq = 8127.612 STB/dayCasing Pressure: Q liq = 8127.612 STB/dayTemperature: Q liq = 8127.612 STB/day
Ptov Pc Temp

Unloading investigation Unloading investigation Qgi versus Tubing Pressure At Valve
No Operating point (Cannot unload for Pc=1100 and 1200 psia)
Tubing Liquid Gas Temperature CasingPressure Rate Rate at Valve Pressure(psia) (STB/day) (MMSCF/day) (degrees F) (psia)1121.326 6554.489 2.477 169.432 1557.7201066.399 6865.172 3.075 169.617 1681.997
0
1
2
3
4
5G
as In
ject
ion
Rat
e Q
gi (M
MS
CF/
day)
18001600140012001000800Tubing Pressure (psia) at GL Valve, MD = 5388.0 ft
5555555555555555555555555555 5
55
55
55
55
55
55
55
55
55
55
55
55
5555
44444444444444444444444 4
44
44
44
44
44
44
44
44
44
44444
3333333333333333333
33
33
33
33
33
33
33
3333
222222222222
22
22
22
22
222
Well PerformancePort Size = 20 64th in, Casing Head Pressure = 1100.000 psiaPort Size = 20 64th in, Casing Head Pressure = 1200.000 psiaPort Size = 20 64th in, Casing Head Pressure = 1300.000 psiaPort Size = 20 64th in, Casing Head Pressure = 1400.000 psia
2345

Dynamic Unloading SimulationDynamic Unloading Simulation• Uses Well data and gas lift valve
performance data to simulate well unloading operation in real time
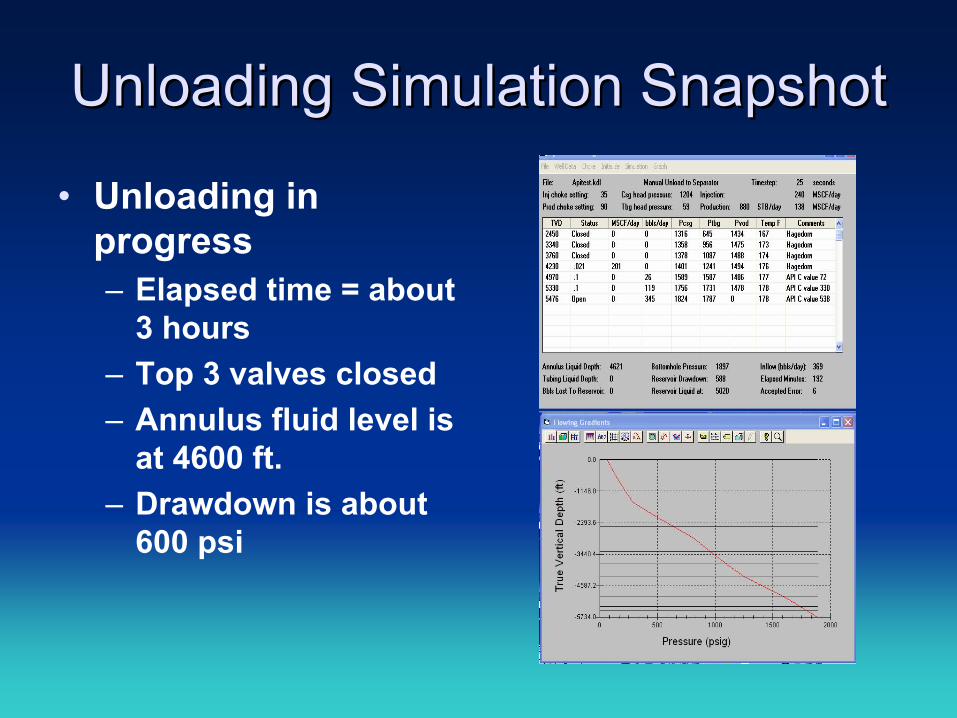
Unloading Simulation SnapshotUnloading Simulation Snapshot
• Unloading in progress– Elapsed time = about
3 hours– Top 3 valves closed– Annulus fluid level is
at 4600 ft.– Drawdown is about
600 psi

Unloading Simulation Snapshot Unloading Simulation Snapshot (Contd.) (Contd.)
• Unloading completed– Elapsed time = about
5-1/2 hours– All the six unloading
valves closed (Gas injection only through orifice valve)
– Drawdown is about 1500 psi

ConclusionsConclusions• Use of GLV performance data helps generate
reliable gas lift designs• Allows to narrow down the safety margins
and optimizes the number of gas lift mandrels and valves required
• Incorporating the GLV performance data in well gas lift design software helps quick investigation of many alternative valve string designs – efficient and accurate
• Using the data for dynamic simulation allows to check the unloading function even before installing the design in the well
Use of GasUse of Gas--Lift Valve Dynamic Performance Lift Valve Dynamic Performance Data in Optimizing Data in Optimizing
Well Gas Lift DesignsWell Gas Lift DesignsManickam S. NadarManickam S. Nadar
Principal Petroleum EngineerPrincipal Petroleum Engineer
Thank You