Embed Size (px)
Citation preview
USE OF EMERGENCY DEPARTMENTS FOR
CONDITIONS RELATED TO POOR ORAL
HEALTH CARE
Final Report August 2010 Emily F. Shortridge, PhD, MPH, MPP Jonathan R. Moore
4350 East West Highway, Suite 800 Bethesda, MD 20814
301-634-9324
This study was funded under a cooperative agreement with the Health Resources and Services Administration, Office of Rural Health Policy (ORHP), DHHS, Grant Number 1U1CRH03715. The conclusions and opinions expressed in this report are the author’s alone; no endorsement by NORC, ORHP, or other sources of information is intended or should be inferred.

The Walsh Center’s mission is to conduct timely policy analyses and research that address the needs of government policy makers, clinicians, and the public on issues that affect health care and public health in rural America. The Walsh Center is part of the Public Health Research Department at NORC at the University of Chicago, and its offices are located in Bethesda, Maryland. The Center is named in honor of William B. Walsh, M.D., whose lifelong mission was to bring health care to under-served and hard-to-reach populations. For more information about the Walsh Center and its publications, please contact:
Michael Meit The Walsh Center for Rural Health Analysis
NORC at the University of Chicago 4350 East West Highway, Suite 800
Bethesda, Maryland 20814 301-634-9324
301-634-9301 (fax)
http://walshcenter.norc.org

i
TABLE OF CONTENTS
Tables, Figures and Equations……………………………………………………………………...ii
Acknowledgements………………………………………………………………………………...iii
Executive Summary ………………………………………………………………………………..v
Background …………………………………………………………….….……………………- 1 -
Methodology…………………………………………………………………………….………- 3 -
Findings…………………………………………………………………………………………- 6 -
Discussion...……………………………………………………………………………………- 21 -
Policy Implications……………………………………………………………………………..- 24 -
References……………………………………………………………………………………...- 26 -
Appendix A. Schema Organizing Oral Health ICD-9-CM Codes by Preventability, Incidence, and
Severity………………………………………………………………………………………...- 29 -
Appendix B. Percent of Emergency Department Visits with Oral Health Disorder ICD-9-CM Code
in Select States…………………………………………………………………………………- 33 -
Appendix C. Percent of Oral Health Emergency Department Visits Constituted by ICD-9-CM
Codes in Select States…………………………………………………………………………..- 34 -
Appendix D. Sociodemographic Information…………………………………………………..- 39 -
Appendix E. Additional State Maps……………………………………………………………- 40 -
ii
TABLES, FIGURES AND EQUATIONS
Table 1. Frequencies of key variables by all ED visits and only oral health complaints....................- 8 -
Table 2. Percentage of ED visits comparing patients by urban or rural residency for seven
States......................................................................................................................................................- 12 -
Table 3. Percentage of payer type for oral health ED visits comparing patients by urban or rural
residency, for seven states..................................................................................................................- 14 -
Table 4. Dental services covered by state Medicaid programs.............................................................- 18 -
Figure 1. Schematic drawing for patterns of oral health care-seeking in the ED................................- 3 -
Figure 2. Proportion prevention oral health complaints in Arizona, Vermont and Wisconsin........- 6 -
Figure 3. Predicted probabilities modeling ED visits based on any oral health complaint,
by state..................................................................................................................................................- 15 -
Figure 4. Predicted probabilities modeling ED visits based on preventability of oral health
complaints, by state.............................................................................................................................- 16 -
Figure 5. Predicted probabilities modeling ED visits based on severity of oral health complaints, by
state........................................................................................................................................................- 16 -
Figure 6. Overrepresentation of Medicaid beneficiaries among those seeking care for oral health-
related complaints in the ED.....................................................................................................................- 17 -
Figure 7. Rankings of state Medicaid reimbursement amounts, 2004.................................................- 19 -
Figure 8. Dentist Medicaid acceptance rates, 2008.................................................................................- 20 -

iii
ACKNOWLEDGMENTS
The authors would like to thank Dr. Robert Weyant, DMD, DrPH, of the University of Pittsburgh's
School of Dental Medicine, for thoughtful guidance from the onset of this project. We would also
like to thank our reviewers - Michael Meit and Caitlin Oppenheimer of the National Opinion
Research Center at the University of Chicago, and Cara James of the Kaiser Family Foundation -
who provided several rounds of insightful suggestions. Finally, we would like to thank the audience
at the National Rural Health Association's Annual Meeting in New Orleans, who commented on
early results of the study and provided unique interpretations of the data based on their experiences
in the field.

iv
v
EXECUTIVE SUMMARY
Persistent and worsening shortages of oral health care providers in rural areas,3 combined with limited acceptance of Medicaid and the Children’s Health Insurance Program (CHIP),i have left many patients without adequate access to dental care. Evidence suggests such patients seek treatment in emergency departments (EDs) for problems that might have been prevented given adequate oral health care. This finding has public policy implications that are explored by this study in answering the following questions for seven states (Arizona, Florida, Iowa, Maryland, Utah, Vermont, and Wisconsin):
1. Are there state differences in the types of oral health conditions that drive patients to seek care at the ED?
2. Are these factors different in ruralii and urban areas?
3. Are observed state differences in patterns of oral health care-seeking in EDs associated with state Medicaid policy?
Our analyses demonstrate that the effect of oral health complaints on ED utilization is small but significant and remediable. There is considerable between-state variation in patterns of oral health disease at the ED, potentially burdening the safety net disproportionately in certain areas. Use of the ED for preventive and low-severity oral health problems amounts to a public health problem as emergency department providers, who may not be best qualified to address oral health complaints, are forced to divert attention from less avoidable, more remediable health problems. Substandard care at the ED may result in additional visits and corrective procedures, adding additional burden to the dental safety net and contributing to more disjointed patterns of dental care generally. Such concerns are especially important given the existence of alternative, effective strategies for providing oral health care. The recent dental home model, specifically, has shown promise in emphasizing preventive care and personal behavior change – factors that influence long-term oral health.
Not all Americans are achieving the same level of oral health or accessing the same high quality oral health care. Our analyses highlight several regional and geographic characteristics that may contribute to the structural, financial, and personal barriers that some Americans may face in seeking care in dentist’s offices or dental clinics. The approaches below, organized by a framework originally put forth by the Institute of Medicine in Access to Health Care in America, highlight the
i Although the data for this report are from 2005, when CHIP was known as the State Children’s Health Insurance
Program (SCHIP), we refer to the program as CHIP throughout.
ii Rural was defined by collapsing the 33 item Rural-Urban Commuting Area (RUCA) code into a dichotomous variable
following recommendations from the Washington, Wyoming, Alaska, Montana, and Idaho Rural Health Research
Center (WWAMI RHRC).24, 25 The urban category included metropolitan areas and towns greater than 10,000 residents.
The rural category included towns with fewer than 10,000 residents and census tracts without towns, including isolated
rural and frontier areas.24

vi
importance of engaging various stakeholders at all levels to address the diverse access barriers that confront rural America.4
Approaches that may be considered to reduce structural barriers:
o Attaching transportation vouchers to Medicaid or other low-income dental benefits, especially in rural areas;5
o Relying on existing providers: pediatricians, family physicians, emergency room physicians,
dental hygienists where dental providers are unavailable;
o Strengthening connections between dental care, medical care, and other community social
services;6 and
o Increasing provider participation in state Medicaid programs by reaching out to state dental
associations and through vehicles like newsletters, dental ambassadors, and by creating
communities of participating dentists.6
Approaches that may be considered to reduce financial barriers:
o Tailoring coverage strategies based on state populations and their specific needs;6 and
o Making dental workforce issues central in Medicaid planning and implementation.
Approaches that may be considered to reduce personal barriers:
o Targeted funding for outreach, especially to rural areas; and
o Conducting additional research to identify innovative ways to improve personal oral health behaviors, including publicizing and evaluating promising existing programs.
Cross-cutting themes:
o Several possible approaches to improving access to oral health services cut across the issues of structure, financing and personal barriers. These included:
o Making current Medicaid dentist participation and acceptance data readily available for both policymakers and eligible populations;
o Increasing the presence of dentists and allied health professionals in state Medicaid programs;6
o Tailoring funding for oral health coverage based on state populations and their
needs;6
o Focusing on outreach to and engagement with providers and potential beneficiaries;
and
o Further exploring the use of teledentistry and other kinds of technology to address
the needs of rural Medicaid beneficiaries.

vii
o Finally, additional research is needed on the implications of increasing reimbursements and scope-of-practice expansions for rural settings, including pilot studies that allow for greater practice experimentation.

- 1 -
BACKGROUND Oral health problems are inextricably linked to general health status and quality of life.7 Most
oral health problems are either avoidable, with regular preventive practices and screening, or treatable with routine quality dental care. The costs of delaying oral health care are significant: needless pain; complications that develop into serious oral health problems or trigger systemic diseases; the social costs of having the sequelae of poor oral health; the personal financial burden of accessing expensive emergency department (ED) medical care; and financial costs to the community for underwriting uninsured and Medicaid patients at a more expensive point-of-care. Many Americans, and especially low income Americans, delay seeking preventive care or treatment because they lack access to dental care services.2,3,4 Thus, the social burden of delaying care and experiencing preventable advanced dental disease lies more heavily on more vulnerable populations.1,4 Rural areas may be especially plagued by oral health problems because of geographic isolation, a higher concentration of poverty, a higher concentration of elderly residents, and shortages of dental care providers.
The Institute of Medicine (IOM) was charged with developing a set of indicators to monitor health care access, generally.4 IOM defined access as “the timely use of personal health services to achieve the best possible health outcomes.”4 Further, they found that “access problems are created when barriers cause underuse of services, which in turn leads to poor outcomes.”4 This framework led the group to identify three categories of access barriers, including structural barriers, like transportation problems, financial barriers, like lack of insurance coverage, and personal barriers, like attitudes towards health services.4 Barriers in all of these domains likely contribute to oral health care seeking in the ED by certain populations, as they may put off seeking needed care until pain or tooth loss force them to seek care. Residents of rural communities may experience more barriers to oral health care, especially in the structural domain – including longer drive times to providers, no providers in the region, or living in communities lacking fluoridated water – than their urban counterparts. In addition, rural residents are less likely to have dental insurance than urban residents because they are more likely to work for a small employer.
Some structural barriers, like provider-side issues – too few dentists to meet regional demand or too few dentists who will provide care to Medicaid beneficiaries and low income, uninsured patients – limit the use of oral health services, especially for Medicaid, Children’s Health Insurance Programs (CHIP), and low income uninsured patients.5, 8-10 Despite dental coverage by states for all children qualifying for CHIP and many adults qualifying for Medicaid, the evidence strongly indicates that these populations are not receiving levels of dental care treatment on par with privately insured patients.8, 9, 11 Despite the disproportionate burden of poor oral health on low income Americans, there is significant variation across state dental Medicaid programs and it remains an optional coverage area under federal guidelines. Further, the dental safety net, a network of public and voluntary sector organizations that provide dental services to low income patients, lacks the capacity to meet the demand for dental care in the US.12 Evidence suggests that service capacity constraints lead to a greater use of hospital EDs for acute problems, at least among certain populations, that might have been prevented with earlier, regular dental care. Several studies have found that the majority of children who seek oral health care in a children’s hospital ED had no usual source of dental care.13, 14 The lack of a regular source of dental care for children has prompted a growing body of literature promoting the idea of a dental home for all children, and encouraging it for adults, as well. The concept of a dental home emerged from over a decade’s research on

- 2 -
developing medical home,15 and describes an ongoing relationship between and dentist and a patient that provides comprehensive, individualized oral health care, including screening and treatment, health education, counseling on issues like dietary needs, and referrals for specialty care.16, 17 Medical homes have been found to be cost-effective and to produce higher quality care,18 and children who have dental homes are more likely to receive preventive primary dental care than children without a dental home; taken together, the research on medical homes generally, and dental homes for children indicate that dental homes may be a tool to improve overall oral health, especially among people with low oral health literacy.
Even with a broader use of preventive dental services, like those provided in dental homes, EDs will continue to provide some oral health care. EDs perform important services for communities, including providing health care services on demand and offering treatment for emergent, urgent, and non-urgent conditions. In addition, EDs serve as safety net providers for communities by offering services to patients who have limited access to physician offices or clinics due to lack of insurance, immigration status or a number of other reasons. While EDs clearly play an important role in their respective communities, reliance on the ED for non-emergent care carries significant costs. Higher health system costs and poorer patient outcomes are only some of the results of non-emergent ED use.11, 19 Physician offices and clinics often represent the most appropriate setting to treat many illnesses and injuries.19-21
The literature provides little information about the magnitude of ED use for oral health care in rural and urban areas.21 This analysis addresses this gap by examining several dimensions of oral health care seeking patterns in EDs. Specifically, this analysis seeks to answer the following questions:
1. Are there state differences in the types of oral health conditions that drive patients to seek care at the ED?
2. Are these factors different in rural and urban areas?
3. Are observed state differences in patterns of oral health care-seeking in EDs associated with state Medicaid policy?
We examine ED claims data in seven states – Arizona, Florida, Iowa, Maryland, Utah, Vermont, and Wisconsin – to understand between and within state differences in ED use.

- 3 -
METHODOLOGY
DATA ANALYTIC PLAN
Broadly, there are some types of oral health complaints that should, rightly, be seen in the ED, while there are others that should not. There are at least two important dimensions to consider: (1) the degree of severity of the complaint, with more severe complaints being more appropriately handled in the ED, and (2) the degree that the complaint might be preventable given earlier preventive care, with preventable complaints being less appropriately seen in the ED (Figure 1). An important caveat to the preventability axis is that it represents an upstream measure – by the time the patient arrives at the ED with a preventable condition, their dental disease may be quite advanced.
DATA AND SAMPLE SELECTION
We used the 2005 State Emergency Department Databases (SEDD) made available by the Agency for Healthcare Research and Quality (AHRQ) and produced by its Healthcare Cost and Utilization Project (HCUP). These databases provide encounter-level data for ED visits that do not result in an inpatient admission. Since the SEDD covers all patients from reporting hospitals regardless of age or insurance status, the database is well suited to our research questions.
We linked the SEDD database to the 2004 Area Resource File (ARF), which consists of county-level data on economic activity, health status, housing quality, and so on. The main variable from this file identifies counties according to dental Health Provider Shortage Area (HPSA) status. This label is determined by the Department of Health and Human Services, and identifies areas with few dentists or unusually high need for dental services and insufficient capacity.22
Some variables may be missing observations so overall ED usage may differ from individual variable totals.
For specific state Medicaid reimbursement and coverage policies, we compiled data elements from sources including: state Medicaid websites and various reports for information about provider acceptance and eligible populations, documents on state administrative rules to validate the website information, personal communication with state Medicaid offices to solicit provider acceptance rate information and data collected by the Kaiser Family Foundation’s State Health Facts division.
We selected seven states to study: Arizona, Florida, Iowa, Maryland, Utah, Vermont, and Wisconsin. These states were chosen because they are among the twenty-five states that participate in the centralized SEDD data collection, and they demonstrate diversity in terms of geographical location, racial and ethnic make-up, income distribution, and degree of rurality.
Dentalcaries
Exfoliation of teeth-systemic causes
Disturbance in tooth eruption
Anodontia
Less likely to benefit from prevention
More likely to benefit from prevention
Higher severity condition
Lower severity condition
Figure 1: Schematic drawing for patterns of oral health care-seeking in the ED
Figure 1. Schematic drawing for patterns of oral health
care-seeking in the ED

- 4 -
VARIABLES
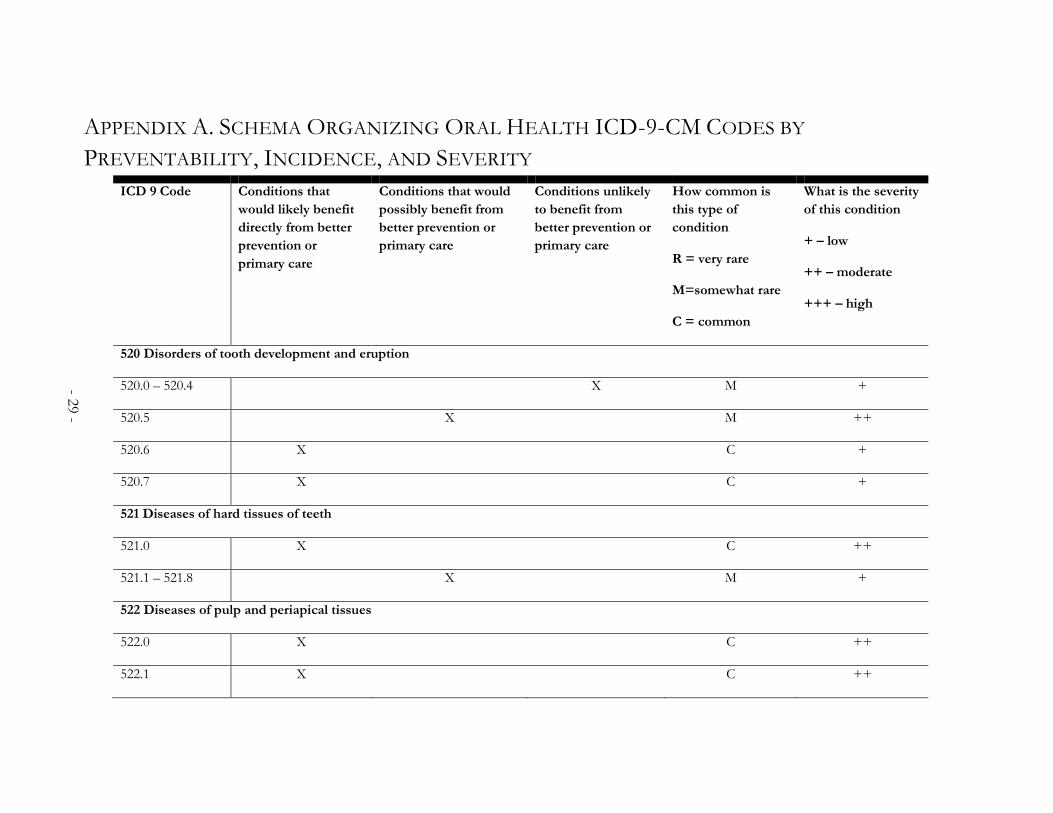
We used diagnosis and procedure codes from the International Classification of Diseases, Ninth Revision, Clinical Modification (ICD-9-CM) classification system to identify ED visits for conditions related to oral health.23 The principal focus was on the dental diagnosis codes (520.0-529.9), supplemented by expert clinical consultants to develop a list of codes to identify cases. The consultants also developed the schema, described above, grouping dental diagnoses according to (a) whether they are conditions that would likely be avoidable through early preventive or primary care and (b) by the severity of the condition. (Appendix A presents the structure for the schema. Appendix B presents the frequencies for all oral health complaints by ICD-9-CM classification.)
The preventable domain is an upstream domain, as, by the time patients are visiting the ED for these types of complaints, the dental disease is advanced. Severity, on the other hand, is a downstream domain because it reflects the current state or symptomology of the oral disease. Examples of conditions that would likely benefit from preventive or primary dental care include dental caries (521.0) and chronic gingivitis (523.1). Examples of conditions that are unlikely to benefit from primary or preventive care include sialoadenitis, or infections of the salivary gland or duct, (527.2) and diseases of the lip (528.5). Examples of low severity dental conditions include disturbances in tooth eruption (520.6) and oral aphthae, or recurrent ulcers in the oral mucosa (528.2). Examples of oral health condition of high severity include inflammatory conditions (526.4) and cancrum oris, or gangrene of the mucous membrane of the mouth (528.1).
We also collapsed the 33 item Rural-Urban Commuting Area (RUCA) code into a dichotomous variable following recommendations from the Washington, Wyoming, Alaska, Montana, and Idaho Rural Health Research Center (WWAMI RHRC).24, 25 The urban category included metropolitan areas and towns greater than 10,000 residents. The rural category included towns with fewer than 10,000 residents and census tracts without towns, including isolated rural and frontier areas.24
Because financial access to oral health care through dental health insurance is one of the best predictors of receiving preventive oral health care,7 we also focus on differences in health insurance status between states and in rural and urban areas. Comparative research on state Medicaid programs presents a number of methodological issues. While Medicaid relies heavily on federal support in all 50 states, there is substantial variation between states’ Medicaid incarnations. These differences, along with less than robust reporting requirements at the federal level, make comparing state programs and their effects a significant challenge. Some states choose to assiduously track provider acceptance rates and other specific details, while others either do not track such data or do not make them readily available to the public. Further, some data elements are only documented in specific years, making precise comparisons related to timing even more difficult.
To develop data sources on state Medicaid policy, we draw from multiple data sources and various years, which is problematic. State Medicaid policies can change drastically from year to year with changing administrations at both the state and federal levels. Since we utilized HCUP data from 2005, we rely on 2005 data wherever available. When 2005 data is not available, we note this.
STATISTICAL ANALYSIS
Descriptive statistics summarized characteristics of urban and rural ED visits. We conducted bivariate analyses to compare visit characteristics by urban-rural locality utilizing the χ2- and Student’s t-tests. We then developed three logistic models to measure the combined contribution of

- 5 -
significant variables from the bivariate analysis. The first model examined the relative effect of (a) living in a rural or urban area, (b) living in a dental health professional shortage area, and (c) having a form of health insurance, for predicting any oral health-related complaint, adjusting for significant sociodemographic variables – age, gender, race, and income (Equation 1).
Equation 1
logit (poral health complaint)= β0 + β1*X1rural-urban + β2*X2HPSA + β3*X3health insurance + βk*Xkcovariates
In this equation, p is the probability that the patient will report an oral health-related complaint and 1-p is the probability that the patient will report any other kind of complaint.
The second model examined the impact of living in an urban or rural area, living in a health professional shortage area, and having a form of health insurance on having a preventable oral health complaint, adjusting for sociodemographic variables and the severity of the diagnosis (Equation 2).
Equation 2
logit (ppreventable complaint)= β0 + β1*X1rural-urban + β2*X2HPSA + β3*X3health insurance + βk*Xkcovariates
In this equation, p is the probability that the patient will report a preventable complaint and 1-p is the probability that the patient will report an oral health condition that is not preventable given earlier primary care.
The third model examined the impact of living in an urban or rural area, living in a health professional shortage area, and having a form of health insurance on having a low severity oral health complaint, adjusting for sociodemographic variables (Equation 3).
Equation 3
logit (plow severity complaint)= β0 + β1*X1rural-urban + β2*X2HPSA + β3*X3health insurance + βk*Xkcovariates
In this equation, p is the probability that the patient will report a low severity oral health complaint and 1-p is the probability that the patient will report a high severity oral health complaint.
Finally, we predicted the probability of each type of each type of ED visit, based on Equations 1-3, according to health insurance status. Predicted probabilities are easier to interpret than odds ratios.26
All analyses were carried out using Stata 8.2, Special Edition data analysis software.27 This study used only patient un-identifiable secondary data, and was approved by the National Opinion Research Center Institutional Review Board.
- 6 -
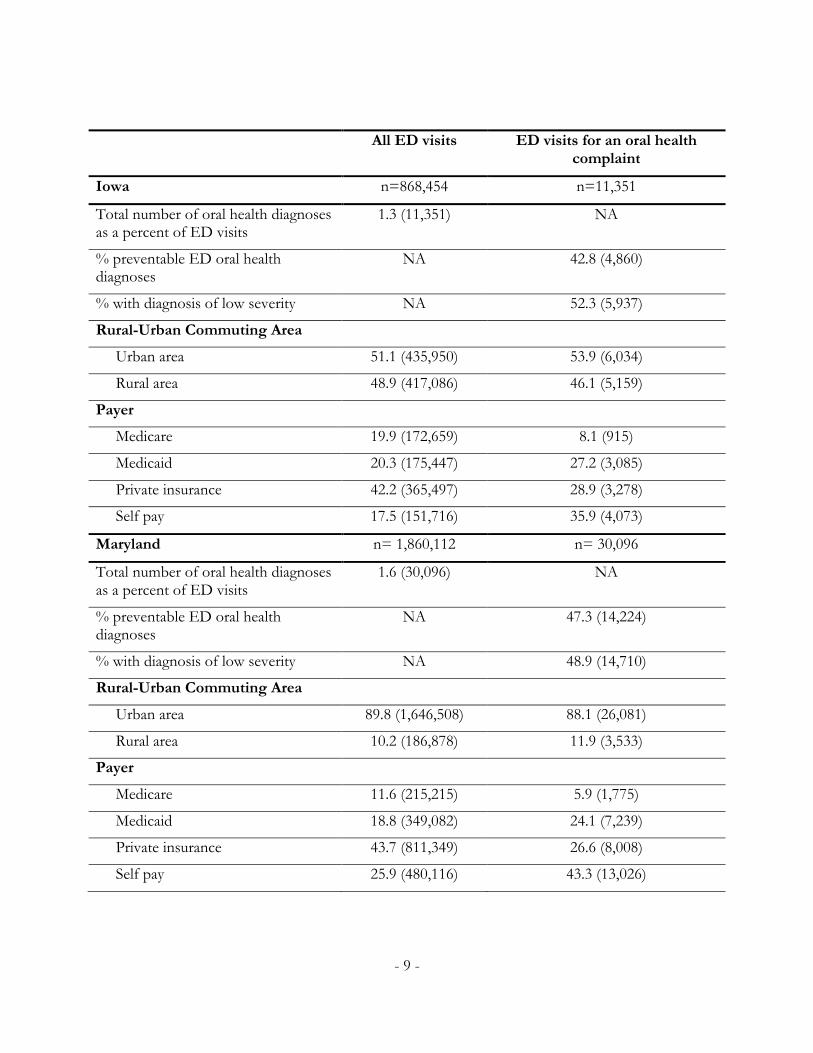
FINDINGS There was considerable heterogeneity among the seven states we examined on all dimensions – from overall ED use for oral health complaints to levels of preventability and severity in diagnoses. Overall, oral health complaints constitute between 1.3% and 2.7% of all ED visits that do not result in an inpatient admission, with Utah reporting the smallest percentage and Vermont reporting the largest (Table 1). To put these numbers in context, this is similar to the total percentage of ED visits for symptoms of psychological and mental disorders (2.2%) and greater
than the percentage of ED visits for symptoms related to the cardiovascular or lymphatic systems (0.7%).28 We provide additional state-level sociodemographic variables by all ED visits and ED visits for oral health complaints in Appendix C.
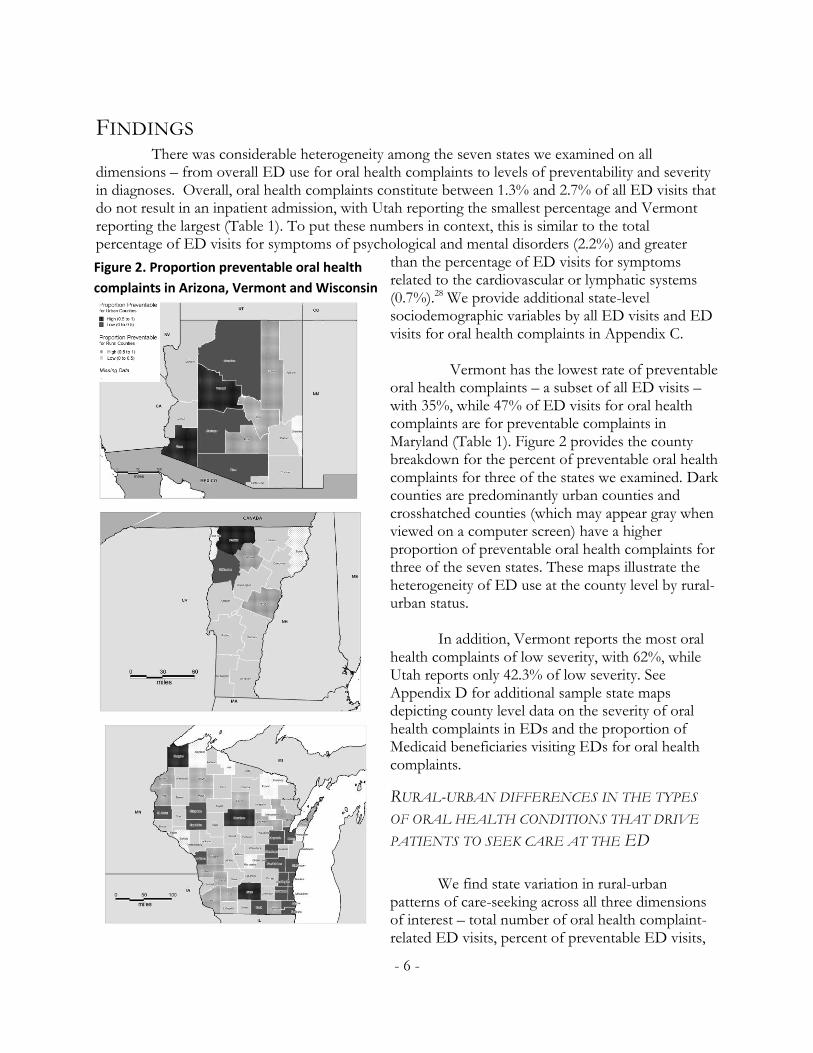
Vermont has the lowest rate of preventable oral health complaints – a subset of all ED visits –with 35%, while 47% of ED visits for oral health complaints are for preventable complaints in Maryland (Table 1). Figure 2 provides the county breakdown for the percent of preventable oral health complaints for three of the states we examined. Dark counties are predominantly urban counties and crosshatched counties (which may appear gray when viewed on a computer screen) have a higher proportion of preventable oral health complaints for three of the seven states. These maps illustrate the heterogeneity of ED use at the county level by rural-urban status.
In addition, Vermont reports the most oral
health complaints of low severity, with 62%, while Utah reports only 42.3% of low severity. See Appendix D for additional sample state maps depicting county level data on the severity of oral health complaints in EDs and the proportion of Medicaid beneficiaries visiting EDs for oral health complaints.
RURAL-URBAN DIFFERENCES IN THE TYPES
OF ORAL HEALTH CONDITIONS THAT DRIVE
PATIENTS TO SEEK CARE AT THE ED
We find state variation in rural-urban patterns of care-seeking across all three dimensions of interest – total number of oral health complaint-related ED visits, percent of preventable ED visits,
Figure 2. Proportion preventable oral health
complaints in Arizona, Vermont and Wisconsin
- 7 -
and percent of ED visits with low-severity complaints. Arizona shows no significant rural-urban difference in the percent of all ED visits that did not result in an admission that were for oral health-related complaints (Table 2). In Florida, Maryland, and Vermont rural residents are significantly more likely to visit the ED for oral health-related complaints. In contrast, in Iowa, Utah, and Wisconsin, residents in urban areas are significantly more likely to visit the ED for any oral health complaint than their rural counterparts.
When we look at preventable oral health complaints and less severe oral health complaints, we also find the importance of rurality varies by state (Table 2). There are no rural-urban differences in Florida or Utah for care-seeking for preventable oral health complaints, although rural residents are significantly more likely to seek care for low-severity complaints in both states. With the exception of Vermont, rural residents in all other states that we examined are more likely to go to the ED for preventable complaints than their urban counterparts. Over 53% of ED visits for preventable oral health complaints in Maryland are from rural residents, while nearly 44% of ED visits for preventable complaints are from rural residents in Wisconsin, providing the bookends for this category. In Vermont, nearly 40% of visits to the ED for oral health complaints by urban residents are for preventable complaints, while 31% of ED visits by rural residents are for preventable complaints. Finally, urban residents in Arizona, Iowa, Maryland, and Vermont are significantly more likely to go the ED for low-severity complaints, compared to their rural counterparts. The opposite is true for Wisconsin.

- 8 -
Table 1. Frequencies of key variables by all ED visits and only oral health complaints
All ED visits ED visits for an oral health complaint
Arizona n = 1,688,438 n = 23,113
Total number of oral health diagnoses as a percent of ED visits
1.4 (23,113) NA
% preventable ED oral health diagnoses NA 42.7 (9,876)
% with diagnosis of low severity NA 49.3 (11,391)
Rural-Urban Commuting Area
Urban area 84.5 (1,355,857)
84.6 (18,619)
Rural area 15.5 (248,827)
15.4 (3,386)
Payer
Medicare 14.5 (244,787) 7.2 (1,664)
Medicaid 33.7 (569,250) 46.2 (10,672)
Private insurance 31.2 (526,650) 19.0 (4,385)
Self pay 20.6 (347,669) 27.7 (6,392)
Florida n = 2,031,799 n = 34,805
Total number of oral health diagnoses as a percent of ED visits
1.7 (34,805) NA
% preventable ED oral health diagnoses NA 44.1 (15,348)
% with diagnosis of low severity NA 50.4 (17,551)
Rural-Urban Commuting Area
Urban area 95.2 (1,861,607)
94.3 (31,777)
Rural area 4.8 (93,861) 5.7 (1,909)
Payer
Medicare 14.5 (295,068) 6.5 (2,260)
Medicaid 22.2 (450,229) 25.3 (8,792)
Private insurance 30.0 (610,426) 17.8 (6,213)
Self pay 33.3 (676,075) 50.4 (17,540)
- 9 -
All ED visits ED visits for an oral health complaint
Iowa n=868,454 n=11,351
Total number of oral health diagnoses as a percent of ED visits
1.3 (11,351) NA
% preventable ED oral health diagnoses
NA 42.8 (4,860)
% with diagnosis of low severity NA 52.3 (5,937)
Rural-Urban Commuting Area
Urban area 51.1 (435,950) 53.9 (6,034)
Rural area 48.9 (417,086) 46.1 (5,159)
Payer
Medicare 19.9 (172,659) 8.1 (915)
Medicaid 20.3 (175,447) 27.2 (3,085)
Private insurance 42.2 (365,497) 28.9 (3,278)
Self pay 17.5 (151,716) 35.9 (4,073)
Maryland n= 1,860,112 n= 30,096
Total number of oral health diagnoses as a percent of ED visits
1.6 (30,096) NA
% preventable ED oral health diagnoses
NA 47.3 (14,224)
% with diagnosis of low severity NA 48.9 (14,710)
Rural-Urban Commuting Area
Urban area 89.8 (1,646,508) 88.1 (26,081)
Rural area 10.2 (186,878) 11.9 (3,533)
Payer
Medicare 11.6 (215,215) 5.9 (1,775)
Medicaid 18.8 (349,082) 24.1 (7,239)
Private insurance 43.7 (811,349) 26.6 (8,008)
Self pay 25.9 (480,116) 43.3 (13,026)

- 10 -
All ED visits ED visits for an oral health complaint
Utah n = 668,615 n = 8,513
Total number of oral health diagnoses as a percent of ED visits
1.3 (8,513) NA
% preventable ED oral health diagnoses
NA 46.5 (3,971)
% with diagnosis of low severity NA 42.3 (3,599)
Rural-Urban Commuting Area
Urban area 86.6 (549,592) 87.5 (6,993)
Rural area 13.4 (85,219) 12.5 (997)
Payer
Medicare 12.3 (79,229) 6.1 (482)
Medicaid 21.8 (140,096) 33.2 (2,637)
Private insurance 47.5 (305,840) 27.5 (2,182)
Self pay 18.4 (118,533) 33.2 (2,640)
Vermont n = 216,138 n = 5,936
Total number of oral health diagnoses as a percent of ED visits
2.7 (5,936) NA
% preventable ED oral health diagnoses
NA 35.0 (2,076)
% with diagnosis of low severity NA 62.3 (3,697)
Rural-Urban Commuting Area
Urban area 29.4 (61,162) 27.7 (1,573)
Rural area 70.6 (146,542) 72.3 (4,100)
Payer
Medicare 17.8 (38,486) 5.9 (348)
Medicaid 27.0 (58,362) 45.7 (2,711)
Private insurance 36.8 (79,483) 17.4 (1,036)
Self pay 18.4 (39,763) 31.0 (1,841)

- 11 -
All ED visits ED visits for an oral health complaint
Wisconsin n = 1,568,786 n = 25,991
Total number of oral health diagnoses as a percent of ED visits
1.7 (25,991) NA
% preventable ED oral health diagnoses
NA 41.7 (10,846)
% with diagnosis of low severity NA 54.1 (14,069)
Rural-Urban Commuting Area
Urban area 70.6 (1,097,452) 73.5 (18,907)
Rural area 29.4 (456,372) 26.5 (6,801)
Payer
Medicare 17.3 (270,308) 7.5 (1,945)
Medicaid 22.5 (350,808) 37.0 (9,545)
Private insurance 42.6 (664,293) 25.5 (6,580)
Self pay 17.5 (272,840) 29.9 (7,712)

Table 2. Percentage of ED visits comparing patients by urban or rural residency for seven states
Arizona Florida Iowa Maryland
Urban Rural p-value Urban Rural p-value Urban Rural p-value Urban Rural p-value
ED visit due to oral health problem
1.4 1.4 0.624 1.7 2.0 <.001 1.4 1.2 <.001 1.6 1.9 <.001
ED visit due to preventable oral health problem
40.8 52.5 <.001 44.2 42.6 0.169 40.3 45.7 <.001 46.5 53.4 <.001
Less severe oral health problem 50.9 41.1 <.001 50.1 55.4 <.001 54.2 50.0 <.001 49.4 43.8 <.001
Utah Vermont Wisconsin
Urban Rural p-value Urban Rural p-value Urban Rural p-value
ED visit due to oral health problem
1.3 1.2 0.013 2.6 2.8 0.004 1.7 1.5 <.001
ED visit due to preventable oral health problem
47.0 47.3 0.822 39.5 31.1 <.001 40.9 43.9 <.001
Less severe oral health problem 57.5 62.3 0.004 43.7 35.3 <.001 45.2 48.0 <.001
- 12 -

- 13 -
THE ASSOCIATION OF STATE MEDICAID POLICY WITH PATTERNS OF ORAL HEALTH
CARE-SEEKING IN EDS
There are state differences in the insurance status distribution for ED visits for any oral health complaint (Table 3). Unsurprisingly, the uninsured and Medicaid recipients are most likely in all states to visit an ED for an oral health complaint, though there are differences in the proportion by state. When looking between states, Medicaid recipients in Arizona are the most likely to visit the ED for an oral health complaint, with Medicaid recipients comprising over 46% of ED visits for oral health complaints, while uninsured patients in Florida were the most likely to visit the ED for oral health complaints (50.4%).
We observe urban-rural insurance coverage differences both within and between states (Table 3). Maryland does not have urban-rural differences in payer type, although uninsured patients constitute the bulk of oral health complaints in the ED. Arizona and Vermont both show higher levels of Medicaid recipients visiting the ED for oral health complaints, especially in rural areas (52.1% and 46.6%, respectively). Maryland and Florida, in contrast, present the lowest rates of Medicaid beneficiaries visiting the ED for these types of complaints, with Maryland’s Medicaid beneficiaries constituting 24% of oral health complaints, and Florida recipients constituting approximately 24% of rural ED visits and 26% of urban ED visits. Iowa, Utah, and Wisconsin show relatively uniform reports of Medicaid, private insurance, and no insurance coverage, with around 30% for each category. There are rural-urban differences for these states in types of coverage – for example, in Iowa there is little rural-urban difference in having Medicaid among those seeking care in the ED for oral health complaints, while in Utah, urban ED care seekers are much more likely to report having Medicaid coverage and rural residents are more likely to report private health insurance coverage.

Table 3. Percentage of payer type for oral health ED visits comparing patients by urban or rural residency, for seven states
Arizona Florida Iowa Maryland
Payer Urban Rural p-value Urban Rural p-value Urban Rural p-value Urban Rural p-value
Medicare 6.8 8.2 <.001 6.4 7.6 0.004 6.8 9.6 <.001 5.8 6.4 0.253
Medicaid 45.3 52.1 25.7 23.8 27.1 27.2 24.3 23.3
Private insurance 19.6 16.2 18.0 16.0 28.1 29.9 26.8 26.2
No insurance 28.3 23.4 49.9 52.5 38 33.2 43.1 44.1
Utah Vermont Wisconsin
Payer Urban Rural p-value Urban Rural p-value Urban Rural p-value
Medicare 6.0 6.9 0.006 5.1 6.2 0.004 7.2 8.5 <.001
Medicaid 34.1 29.5 42.4 46.6 37.6 35.7
Private insurance 26.8 31.2 18.9 16.9 24.5 28.6
No insurance 33.1 32.4 33.6 30.2 30.7 27.1
- 14 -
- 15 -
0
0.01
0.02
0.03
0.04
0.05
0.06
Me
dic
aid
Pri
vate
Un
insu
red
Me
dic
aid
Pri
vate
Un
insu
red
Me
dic
aid
Pri
vate
Un
insu
red
Me
dic
aid
Pri
vate
Un
insu
red
Me
dic
aid
Pri
vate
Un
insu
red
Me
dic
aid
Pri
vate
Un
insu
red
Me
dic
aid
Pri
vate
Un
insu
red
Arizona Florida Iowa Maryland Utah Vermont Wisconsin
Figure 2: Predicted probabilities modeling ED visits based on any oral health complaint, by state
Urban
Rural
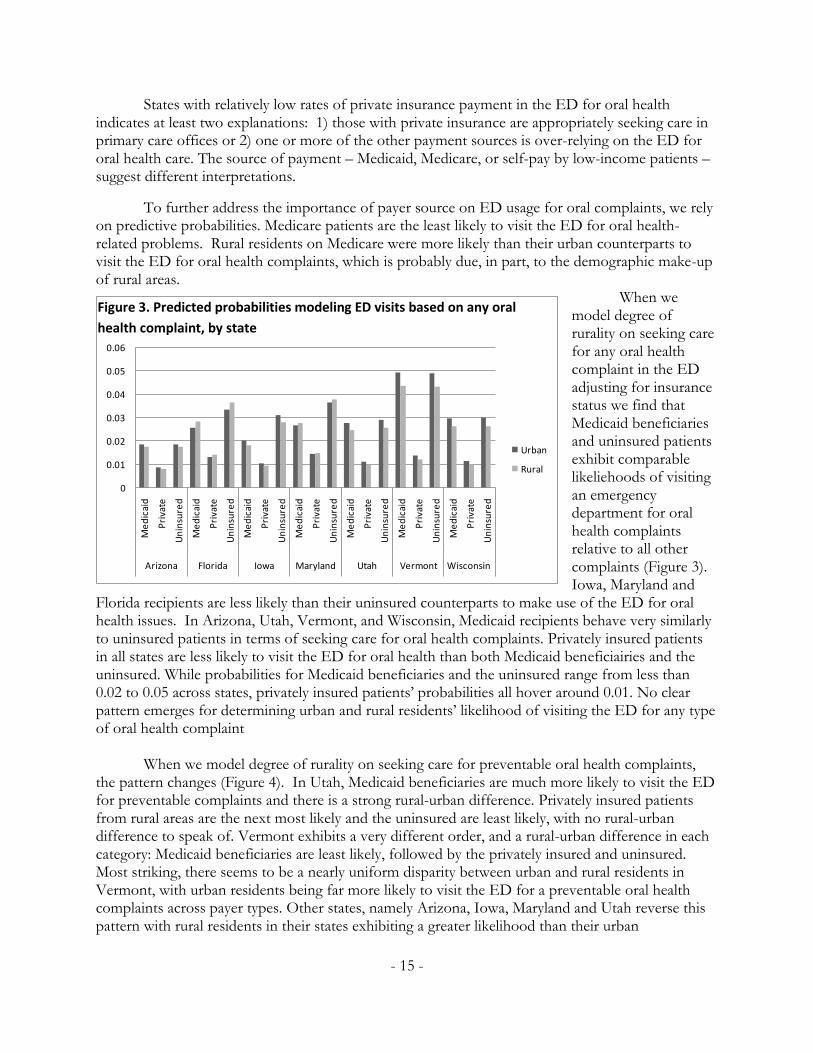
States with relatively low rates of private insurance payment in the ED for oral health indicates at least two explanations: 1) those with private insurance are appropriately seeking care in primary care offices or 2) one or more of the other payment sources is over-relying on the ED for oral health care. The source of payment – Medicaid, Medicare, or self-pay by low-income patients – suggest different interpretations.
To further address the importance of payer source on ED usage for oral complaints, we rely on predictive probabilities. Medicare patients are the least likely to visit the ED for oral health-related problems. Rural residents on Medicare were more likely than their urban counterparts to visit the ED for oral health complaints, which is probably due, in part, to the demographic make-up of rural areas.
When we model degree of rurality on seeking care for any oral health complaint in the ED adjusting for insurance status we find that Medicaid beneficiaries and uninsured patients exhibit comparable likeliehoods of visiting an emergency department for oral health complaints relative to all other complaints (Figure 3). Iowa, Maryland and
Florida recipients are less likely than their uninsured counterparts to make use of the ED for oral health issues. In Arizona, Utah, Vermont, and Wisconsin, Medicaid recipients behave very similarly to uninsured patients in terms of seeking care for oral health complaints. Privately insured patients in all states are less likely to visit the ED for oral health than both Medicaid beneficiairies and the uninsured. While probabilities for Medicaid beneficiaries and the uninsured range from less than 0.02 to 0.05 across states, privately insured patients’ probabilities all hover around 0.01. No clear pattern emerges for determining urban and rural residents’ likelihood of visiting the ED for any type of oral health complaint
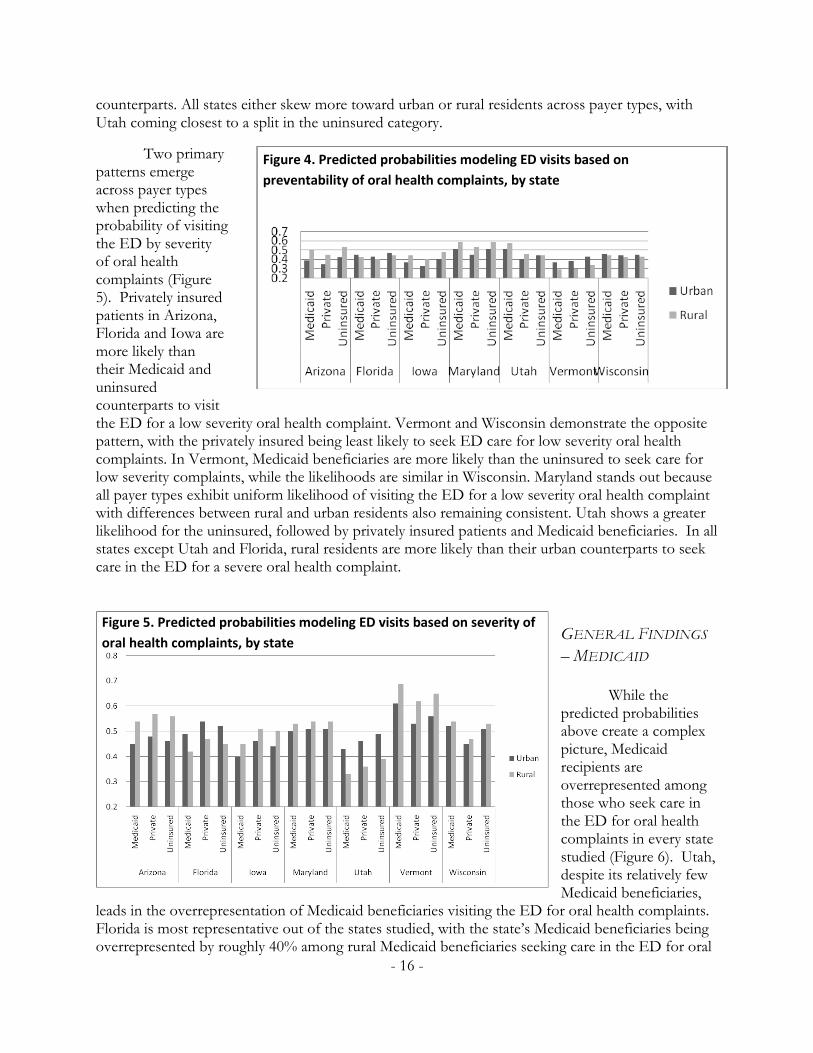
When we model degree of rurality on seeking care for preventable oral health complaints, the pattern changes (Figure 4). In Utah, Medicaid beneficiaries are much more likely to visit the ED for preventable complaints and there is a strong rural-urban difference. Privately insured patients from rural areas are the next most likely and the uninsured are least likely, with no rural-urban difference to speak of. Vermont exhibits a very different order, and a rural-urban difference in each category: Medicaid beneficiaries are least likely, followed by the privately insured and uninsured. Most striking, there seems to be a nearly uniform disparity between urban and rural residents in Vermont, with urban residents being far more likely to visit the ED for a preventable oral health complaints across payer types. Other states, namely Arizona, Iowa, Maryland and Utah reverse this pattern with rural residents in their states exhibiting a greater likelihood than their urban
Figure 3. Predicted probabilities modeling ED visits based on any oral
health complaint, by state
- 16 -
counterparts. All states either skew more toward urban or rural residents across payer types, with Utah coming closest to a split in the uninsured category.
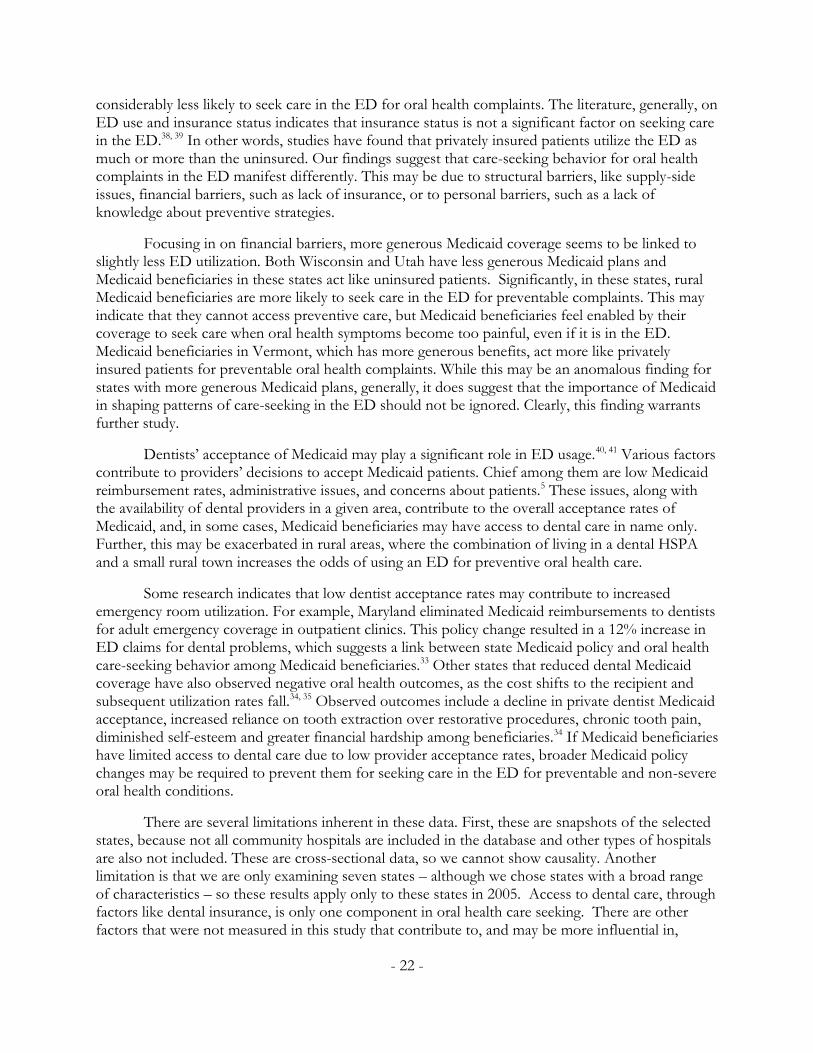
Two primary patterns emerge across payer types when predicting the probability of visiting the ED by severity of oral health complaints (Figure 5). Privately insured patients in Arizona, Florida and Iowa are more likely than their Medicaid and uninsured counterparts to visit the ED for a low severity oral health complaint. Vermont and Wisconsin demonstrate the opposite pattern, with the privately insured being least likely to seek ED care for low severity oral health complaints. In Vermont, Medicaid beneficiaries are more likely than the uninsured to seek care for low severity complaints, while the likelihoods are similar in Wisconsin. Maryland stands out because all payer types exhibit uniform likelihood of visiting the ED for a low severity oral health complaint with differences between rural and urban residents also remaining consistent. Utah shows a greater likelihood for the uninsured, followed by privately insured patients and Medicaid beneficiaries. In all states except Utah and Florida, rural residents are more likely than their urban counterparts to seek care in the ED for a severe oral health complaint.
GENERAL FINDINGS
– MEDICAID
While the
predicted probabilities above create a complex picture, Medicaid recipients are overrepresented among those who seek care in the ED for oral health complaints in every state studied (Figure 6). Utah, despite its relatively few Medicaid beneficiaries,
leads in the overrepresentation of Medicaid beneficiaries visiting the ED for oral health complaints. Florida is most representative out of the states studied, with the state’s Medicaid beneficiaries being overrepresented by roughly 40% among rural Medicaid beneficiaries seeking care in the ED for oral
Figure 4. Predicted probabilities modeling ED visits based on
preventability of oral health complaints, by state
Figure 5. Predicted probabilities modeling ED visits based on severity of
oral health complaints, by state

- 17 -
health problems. Arizona, Utah and Wisconsin exhibit greater overrepresentation among rural beneficiaries while Florida, Maryland and Vermont skew toward urban beneficiaries. Iowa is roughly even in its degree of overrepresentation, roughly 90% in both rural and urban
areas. The degree to which Medicaid beneficiaries are overrepresented across states suggests that state Medicaid policy and implementation may prove crucial in addressing overall reliance on the ED for oral health complaints. In order to identify patterns exhibited across states to identify potential strategies for improving conditions, more information is needed on differences between state Medicaid programs and the realities of implementation across states. While some of this information is available through resources such as statehealthfacts.org, much has to be obtained directly from state Medicaid offices. Pulling together existing and previously unreported data on state Medicaid dental programs may clarify ways to address ED seeking behaviors for oral health problems.
Dental coverage in Medicaid programs exists as an optional coverage area. States decide whether to provide dental coverage, to whom, and for how much. This level of freedom, not seen in many other aspects of the Medicaid program, results in vastly different dental coverage and access across states. Further, Medicaid policy does not exist in a vacuum. Outside forces such as market rates and geographic distribution of care have important effects on state dental Medicaid programs.
A large part of states’ variation exists due to differing levels of coverage across states (Table 4). This variation makes it difficult to compare the generosity of coverage because the covered service mix varies so substantially. From Table 4, however, it is clear that there are significant differences in types of dental insurance coverage by state.
Figure 6. Overrepresentation of Medicaid beneficiaries among those seeking
care for oral health-related complaints in the ED

- 18 -
Table 4. Dental services covered by state Medicaid programs
State Label Covered services
Arizona Emergency Emergencies, medically-necessary dentures, and pre-transplant
services
Florida Emergency Medically necessary, emergency dental procedures to alleviate pain
or infections and dentures
Iowa Limited Exams, x-rays, amalgam/composites, dentures, partials, bridges and oral surgery (uncovered services include: crowns, posts and
cores, periodontal, endodontic and orthodontic services)
Maryland Emergency None in the fee-for-service (unless for trauma, treated in a hospital ED), 90% of Medicaid beneficiaries are enrolled in
HealthChoice managed care which provides some care
Utah Limited Dental adult benefits are primarily limited to emergency exams, x-rays and extractions for the relief of pain and infection (benefits
later eliminated and restored).
Vermont Limited
Emergency care for the relief of pain, bleeding and infection, selected preventive and restorative procedures rendered to limit disease progression and necessary diagnostic and consultative
services. Not covered: sealants, periodontal surgery comprehensive periodontal care, orthodontia and prosthodontics.
Annual benefit maximum of $475/person.
Wisconsin Full Exam and cleaning 1/year, frequency of x-rays limited by type,
orthodontia not covered
Sources: Medicaid/SCHIP Dental Association and the Kaiser Family Foundation29, 30
Note: This table draws on 2005 and 2006 benefit information. As Table 4 demonstrates, Wisconsin generally has generous coverage, followed closely by
Vermont. Maryland has the least inclusive level of dental Medicaid coverage, followed by Utah and Arizona. Iowa falls in the middle. Preventive care services covered by Vermont and Wisconsin would not be covered by Utah, Maryland, Florida or Arizona. Notably, emergency services are covered by all of the states included here. Maryland creates additional criteria for coverage, specifying that emergency care must be provided in emergency departments and is limited to trauma care. On the other hand, some states also determine coverage by specifying the procedures they will not cover. These states tend to be more generous in their overall dental coverage than states that single out specific procedures that will be covered by the state’s Medicaid program. For example, Vermont explicitly states that orthodontia is not covered. While this may appear to limit the program’s scope, no other state studied covers orthodontia through Medicaid.
Provider reimbursement rates represent another important variable across state Medicaid dental programs (Figure 7). While market rates for a given procedure vary across regions, Medicaid reimbursement rates are generally comparable. Figure 7 plots state rankings for reimbursement rates for both preventive and treatment dental procedures. Arizona maintains the most generous reimbursement rates to dentists through their Medicaid program, while Florida ranks near 50th for

- 19 -
both preventive and treatment care. Some states offer more generous reimbursement for either treatment or preventive care, signified by greater distance from the diagonal line. Vermont, for instance, fares better than most its peers for treatment than preventive care reimbursement.
Reimbursement rates have been cited as important contributors to Medicaid beneficiaries’
level of access to dental care.31-33 In states that have significantly reduced or eliminated dentists’ reimbursement rates, provider participation has been significantly reduced and in some cases, reliance on emergency care has increased.33, 34
While other factors such as paperwork burdens and perceived difficulty scheduling patients contribute to lower provider participation in Medicaid,5, 6 lower reimbursement rates also have an effect on provider participation and beneficiaries’ access to primary dental care.35 Vermont supports this link, with better than average reimbursement rates and the highest participation rates among states where data are available (about 79%) (Figure 7 and Figure 8). Florida also supports this idea, ranking the lowest for reimbursement and the lowest for provider participation (about 15%).
ARIZONA
FLORDIA
IOWA
MARYLANDUTAH
VERMONT
WISCONSIN
0
5
10
15
20
25
30
35
40
45
50
0 5 10 15 20 25 30 35 40 45 50
De
nta
ltre
atm
ent r
eiu
mbu
rsem
ent
rank
ing
Dental prevention reimbursement ranking
Figure 6: Rankings of state Medicaid reimbursement amounts, 2004
Source: American Dental Association1
Figure 7. Rankings of state Medicaid reimbursement amounts, 2004

- 20 -
While provider enrollment figures offer an important check on the reimbursement link, participation in Medicaid programs ultimately comes down to providers’ willingness to accept new Medicaid patients. If providers do not accept new Medicaid patients, the program’s reach effectively freezes. New beneficiaries who do not have access to participating providers must rely on the health care safety net in the same way many uninsured patients do: seeking care in
EDs for both emergent and non-emergent oral health problems and simply doing without care until minor oral health complaints become significant oral disease. States with greater provider enrollment experience higher percentages of dentists who are willing to accept new Medicaid patients (Figure 8). Once again, Vermont has the highest percentage of providers willing to accept new Medicaid patients (39% of the state’s total dentists) and Florida has the lowest percentage (9% of the state’s dentists). These percentages present a picture of the reality of seeking dental care as a Medicaid beneficiary. Even in the most successful states, six out of ten dentists in the state are not willing to see new Medicaid patients. In Florida, which limits dental coverage to emergency situations, there is only a one in ten chance that a newly enrolled Medicaid beneficiary would be able to secure access to appropriate care in an outpatient facility. Interestingly, the rate of increase in provider acceptance of new Medicaid patients seems to have an inverse relationship with the percentage of a state’s dentists enrolled as Medicaid providers. Maryland, with a relatively low provider participation rate of 20%, experiences the highest percentage of provider enrollees who accept new Medicaid patients (69%). Vermont, with the highest enrollment and provider acceptance, has the lowest percentage (50%). While this remains a relatively minor consideration, it does highlight an important point. Some states’ Medicaid beneficiaries may have greater difficulty using state-provided resources to secure access to dental care. While Vermont may include 80% of providers in a state database of dental Medicaid providers, a new beneficiary who relied on that resource would have roughly a one in two chance of actually securing an appointment. In Maryland, resources would be accurate in more than two out of every three attempts. This may be a relatively minor point, but one or two extra phone calls could amount to a significant barrier for some Medicaid beneficiaries.
Source: Medicaid/SCHIP Dental Association2
Figure 8. Dentist Medicaid acceptance rates, 2008

- 21 -
DISCUSSION There is evidence in the literature that EDs serve as safety net dental providers for a
significant number of low income and uninsured Americans.1-4 These findings are often attributed to structural barriers, such as shortages of providers and driving distance, and to financial barriers, such as problematic dental health insurance coverage.1,2,4 There are other factors that may also contribute to the problem, including structural factors like the lack of fluoridation in non-public water supplies – for example only 63% of the population of Wisconsin is on a properly fluoridated water supply36 – and personal barriers, like health behaviors and oral health care-seeking norms.8iii While measuring these additional factors is beyond the scope of this paper, our findings must be considered within the broad framework of barriers to access. Our study moves the discussion of oral health care seeking in the ED beyond a single ED or hospital system to consider practices in seven states.
We find that between 1% and 3% of all ED visits that do not result in inpatient care are due to various types of oral health problems. While this seems like a small percentage of ED visits, many of these complaints are preventable, given earlier dental care, or are of low severity, suggesting a non-emergent concern. This suggests a fairly widespread pattern of less-optimal care-seeking, and it also leads to higher costs to the healthcare system, overall. Oral health problems in the ED for the seven states we examine cost considerably more than the average cost of dental care. For example, in the Midwest, the median expense per person in 2005 was $1,338 for office-based oral health care, while the median ED charge in Wisconsin was $6,227 and in Iowa it was $4,626 (Appendix C).37 These discrepant values suggest that dental care can likely be obtained more cost effectively in the outpatient setting. In addition, the quality of care for oral health problems in the ED may not be as high as in dental clinics or outpatient offices, as few EDs provide comprehensive dental services.33 Instead, patients typically receive costly temporary relief of pain that may result in unnecessary return visits, or, in extreme cases, surgical care.11, 33
Some of the oral health care-seeking behavior we observe may be related to provider shortages, which we measure using the relatively crude tool of HPSA designation. Florida and Wisconsin qualify for fewer designated shortage areas, while at least part of almost every county in Arizona, Iowa, Maryland, Utah and Vermont has dental HPSA designation. The dental HPSA designation itself may be problematic. For example, we observe that Wisconsin has higher rates of ED use for oral health care than Utah despite having fewer HPSAs. Vermont, despite having statewide dentist shortages, shows lower percentages of preventable diagnoses in the ED. Section 5602 of the Patient Protection and Affordable Care Act of 2010 mandates a review of HPSA designations, so problematic associations such as those between outcomes and HPSA-status may be minimized in the future.
When we model all variables together, there are important state differences in patterns of care for any oral health complaint by insurance status. Medicaid recipients and the uninsured in Vermont seek care in the ED at a considerably higher rate than in the other states. This evidence supports the distance barrier argument, as driving distances in rural Vermont, for example, are shorter, generally, than in the rural Midwest and West. In all states, privately insured residents are
iii Section 4102 of the Patient Protection and Affordable Care Act of 2010 may address some of these issues, such as
dental sealants.
- 22 -
considerably less likely to seek care in the ED for oral health complaints. The literature, generally, on ED use and insurance status indicates that insurance status is not a significant factor on seeking care in the ED.38, 39 In other words, studies have found that privately insured patients utilize the ED as much or more than the uninsured. Our findings suggest that care-seeking behavior for oral health complaints in the ED manifest differently. This may be due to structural barriers, like supply-side issues, financial barriers, such as lack of insurance, or to personal barriers, such as a lack of knowledge about preventive strategies.
Focusing in on financial barriers, more generous Medicaid coverage seems to be linked to slightly less ED utilization. Both Wisconsin and Utah have less generous Medicaid plans and Medicaid beneficiaries in these states act like uninsured patients. Significantly, in these states, rural Medicaid beneficiaries are more likely to seek care in the ED for preventable complaints. This may indicate that they cannot access preventive care, but Medicaid beneficiaries feel enabled by their coverage to seek care when oral health symptoms become too painful, even if it is in the ED. Medicaid beneficiaries in Vermont, which has more generous benefits, act more like privately insured patients for preventable oral health complaints. While this may be an anomalous finding for states with more generous Medicaid plans, generally, it does suggest that the importance of Medicaid in shaping patterns of care-seeking in the ED should not be ignored. Clearly, this finding warrants further study.
Dentists’ acceptance of Medicaid may play a significant role in ED usage.40, 41 Various factors contribute to providers’ decisions to accept Medicaid patients. Chief among them are low Medicaid reimbursement rates, administrative issues, and concerns about patients.5 These issues, along with the availability of dental providers in a given area, contribute to the overall acceptance rates of Medicaid, and, in some cases, Medicaid beneficiaries may have access to dental care in name only. Further, this may be exacerbated in rural areas, where the combination of living in a dental HSPA and a small rural town increases the odds of using an ED for preventive oral health care.
Some research indicates that low dentist acceptance rates may contribute to increased emergency room utilization. For example, Maryland eliminated Medicaid reimbursements to dentists for adult emergency coverage in outpatient clinics. This policy change resulted in a 12% increase in ED claims for dental problems, which suggests a link between state Medicaid policy and oral health care-seeking behavior among Medicaid beneficiaries.33 Other states that reduced dental Medicaid coverage have also observed negative oral health outcomes, as the cost shifts to the recipient and subsequent utilization rates fall.34, 35 Observed outcomes include a decline in private dentist Medicaid acceptance, increased reliance on tooth extraction over restorative procedures, chronic tooth pain, diminished self-esteem and greater financial hardship among beneficiaries.34 If Medicaid beneficiaries have limited access to dental care due to low provider acceptance rates, broader Medicaid policy changes may be required to prevent them for seeking care in the ED for preventable and non-severe oral health conditions.
There are several limitations inherent in these data. First, these are snapshots of the selected states, because not all community hospitals are included in the database and other types of hospitals are also not included. These are cross-sectional data, so we cannot show causality. Another limitation is that we are only examining seven states – although we chose states with a broad range of characteristics – so these results apply only to these states in 2005. Access to dental care, through factors like dental insurance, is only one component in oral health care seeking. There are other factors that were not measured in this study that contribute to, and may be more influential in,

- 23 -
primary dental care seeking. The HCUP does not allow linking across patients, so we cannot observe whether the patients return to the ED for oral health care during the course of the year. Finally, the providers coding the data reported in the HCUP may not be familiar with oral health complaints, and hospitals may code dental complaints differently.
Despite these limitations, this study provides important evidence to inform two current policy debates over increasing access to dental care among low-income populations – (a) expand access through improved dentist acceptance rates for Medicaid patients by raising reimbursements, supporting school screening programs, and other methods, and (b) expand the scope of practice laws to allow dental hygienists and other allied dental health workers to be reimbursed directly by Medicaid. These competing policy approaches address different levels of the oral health disease trajectory. Increasing dental acceptance rates may improve both the upstream problem of too few low income people receiving primary care and education as well as addressing the downstream problem of existing high levels of dental disease in the low income population. Expanding scope of practice laws will mostly effect the upstream problem, as dental hygienists are trained in preventive practices and teaching patients about appropriate dental health behavior. The Patient Protection and Affordable Care Act of 2010 includes a provision to expand training and use of alternative health care providers that could lead to greater use of dental hygienists.42 The results from our study suggest that there are significant state-level differences in factors that motivate both Medicaid beneficiaries and other patients to seek oral health care from the ED, so no one policy solution will effectively expand access to dental care in all areas. These two policy threads may provide some solutions to address the observed inappropriate use of the ED for oral health care complaints, especially among residents of rural areas and for individuals in other underserved areas.
The effect of oral health complaints on ED utilization is small but significant and remediable. This study shows that there is considerable between-state variation in patterns of oral health disease at the ED, potentially burdening the safety net disproportionately in certain areas. Use of the ED for preventive and low-severity oral health problems amounts to a public health problem as emergency department providers, who may not be best qualified to address oral health complaints, are forced to divert attention from less avoidable health problems. Substandard care at the ED may result in additional visits and corrective procedures, adding additional burden to the dental safety net and contributing to more disjointed patterns of dental care generally. Such concerns are especially important given the important role that a dental home can play in emphasizing preventive care and personal behavior change – factors that influences long-term oral health.16

- 24 -
POLICY IMPLICATIONS
Not all Americans are achieving the same level of oral health or accessing the same high quality oral health care. Our analyses highlight several regional and geographic characteristics that may contribute to the structural, financial, and personal barriers that some Americans, particularly those in rural areas, may face in seeking care in dentist’s offices or dental clinics. The barriers are organized using the access framework developed by the IOM.4
Approaches that may be considered to reduce structural barriers:
o Attaching transportation vouchers to Medicaid or other low-income dental benefits, especially in rural areas;5
o Relying on existing providers: pediatricians, family physicians, emergency room physicians,
dental hygienists where dental providers are unavailable;
o Strengthening connections between dental care, medical care, and other community social
services;6 and
o Increasing provider participation in state Medicaid programs by reaching out to state dental
associations and through vehicles like newsletters, dental ambassadors, and by creating
communities of participating dentists.6
Approaches that may be considered to reduce financial barriers:
o Tailoring coverage strategies based on state populations and their specific needs;6 and
o Making dental workforce issues central in Medicaid planning and implementation.iv
Approaches that may be considered to reduce personal barriers:
o Targeted funding for outreach, especially to rural areas; and
o Conducting additional research to identify innovative ways to improve personal oral health behaviors, including publicizing and evaluating promising existing programs.
Cross-cutting themes:
o Several possible approaches to improving access to oral health services cut across the issues of structure, financing and personal barriers. These included:
o Making current Medicaid dentist participation and acceptance data readily available for both policymakers and eligible populations;
iv Some workforce issues may receive greater attention following the passage of the Patient Protection and Affordable
Care Act of 2010. Section 5105 establishes the National Health Care Workforce Commission and directs it to prioritize
dental workforce issues.

- 25 -
o Increasing the presence of dentists and allied health professionals in state Medicaid programs and on state Medicaid boards;6
o Tailoring funding for oral health coverage based on state populations and their
needs;6
o Strategies might include providing additional federal funds to states facing
financial crises with documented high levels of oral health care need to keep
these states from cutting existing Medicaid dental benefits.
o Focusing on outreach to and engagement with providers and potential beneficiaries;
and
o Further exploring the use of teledentistry and other kinds of technology to address
the needs of rural Medicaid beneficiaries.
o Finally, additional research is needed on the implications of increasing reimbursements and scope-of-practice expansions for rural settings, including pilot studies that allow for greater practice experimentation.
o Several pilots have provided provocative results – including the Alaska Dental Health Aids program, community funded dental practices, attaching dental practices to rural health networks, and expanding mobile dental units.

- 26 -
REFERENCES
1. American Dental Association. Medicaid Reimbursement for Pacific Region – Using Marketplace Principles to Increase Access to Dental Services 2004.
2. Medicaid/SCHIP Dental Association. Medicaid Financing 2005. 2007; http://www.medicaiddental.org/Docs/Medicaid_Financing_2005.pdf.
3. Doescher MP, Keppel GA, Skillman SM, Rosenblatt RA. The Crisis in Rural Dentistry. Seattle, WA: WWAMI Rural Health Research Center; April 2009.
4. Millman ML, ed. Access to Health Care in America: Institute of Medicine; 1993. 5. United States General Accounting Office. Oral health: Factors contributing to low use of
dental services by low-income populations. Washington, DC; 2000. 6. Report on the June 23, 2008 Medicaid Provider Symposium. Chicago, Illinois: Council on Access,
Prevention, and Interprofessional Relations; June 23 2008. 7. U.S. Department of Health and Human Services. Oral health in America: A Report of the
Surgeon General. Rockville, MD: U.S. Department of Health and Human Services, National Institute of Dental and Craniofacial Research and National Institutes of Health; 2000.
8. Vargas CM, Dye BA, Hayes K. Oral health care utilization by US rural residents, National Health Interview Survey 1999. Journal of Public Health Dentistry. 2003;63(3):150-157.
9. National Rural Health Association. Oral health in America: a rural perspective. Kansas City, MO: National Rural Health Association; 2001.
10. Manning W, Bailit H, Benjamin B, Newhouse J. The demand for dental care: Evidence from a randomized trial in health insurance. Santa Monica, CA 1986.
11. US Department of Health and Human Services. Oral health in America: A report of the Surgeon General. Rockville, MD: U.S. Department of Health and Human Services, National Institute of Dental and Craniofacial Research and National Institutes of Health; 2000.
12. Bailit H, Beazoglou T, Demby N, McFarland J, Robinson P, Weaver R. Dental safety net: Current capacity and potential for expansion. The Journal of the American Dental Association. 2006;137(6):807.
13. Zeng Y, Sheller B, Milgrom P. Epidemiology of dental emergency visits to an urban children's hospital. Pediatr Dent. 1994;16(6):419-423.
14. Von Kaenel D, Vitangeli D, Casamassimo PS, Wilson S, Preisch J. Social factors associated with pediatric emergency department visits for caries-related dental pain. Pediatr Dent. 2001;23(1):56-60.
15. Section on Pediatric Dentistry. Oral Health Risk Assessment Timing and Establishment of the Dental Home. Pediatrics. May 1 2003;111(5):1113-1116.
16. Nowak AJ, Casamassimo PS. The dental home A primary care oral health concept. The Journal of the American Dental Association. 2002;133(1):93-98.
17. American Association of Pediatric Dentistry (AAPD). Policy on the Dental Home. 2008-09 Definitions, Oral Health Policies, and Clinical Guidelines. Vol 29; 2008.
18. Starfield B, Shi L. The Medical Home, Access to Care, and Insurance: A Review of Evidence. Pediatrics. May 1, 2004 2004;113(5):1493-1498.
19. Derlet RW. Overcrowding in emergency departments: increased demand and decreased capacity. Annals of Emergency Medicine. 2002;39(4):430-432.

- 27 -
20. Olshaker JS, Rathlev NK. Emergency Department overcrowding and ambulance diversion: The impact and potential solutions of extended boarding of admitted patients in the Emergency Department. Journal of Emergency Medicine. 2006;30(3):351-356.
21. Harris L, Bombin M, Chi F, Bortoli T, Long J. Use of the emergency room in Elliot Lake, a rural community of Northern Ontario, Canada. Rural and Remote Health. 2004;4(1):240.
22. Health Professional Shortage Area Designation Criteria: Relevant excerpts from 42 code of federal regulations (CFR), Chapter 1, Part 5 (October 1, 1993, pp. 34-48) Designation of Health Professional(S) Shortage Areas. http://bhpr.hrsa.gov/shortage/hpsacrit.htm, 2008.
23. Moles E, Andrews R. Emergency department data evaluation. Rockville, MD: U.S. Agency for Healthcare Research and Quality; June 3 2005.
24. WWAMI Rural Health Research Center. The use of RUCAS (Version 1.11) in health care. http://depts.washington.edu/uwruca/ruca1/use_healthcare.html. Accessed February 25, 2008.
25. Hart LG, Larson EH, Lishner DM. Rural definitions for health policy and research. American Journal of Public Health. 2005;95(7):1149-1155.
26. Long JS, Freese J. Regression Models for Categorical Outcomes Using Stata. College Station, TX: Stata Press; 2001.
27. Stata Statistical Software [computer program]. Version 8. College Station, TX: StataCorp LP; 2003.
28. McCaig L, Nawar E. National Hospital Ambulatory Medical Care Survey: 2004 emergency department summary. Advance data from vital and health statistics. 2006(372).
29. Medicaid/SCHIP Dental Association. Adult Dental Benefits in Medicaid 2005. 30. Henry J. Kaiser Family Foundation. Benefits by service: Dental services (October 2006).
http://www.kff.org/medicaid/benefits/service.jsp?gr=off&nt=on&so=0&tg=0&yr=3&cat=6&sv=6. Accessed Feb 20, 2008.
31. Hughes D, Diringer J. Adult Dental Medi-Cal Cuts: Costs & Consequences: Dental Health Foundation and the California Primary Care Association; May 2008.
32. Haley J, Kenney GP, Jennifer. Access to Affordable Dental Care: Gaps for Low-Income Adults. Washington, DC: The Kaiser Commission on Medicaid and the Uninsured; July 2008.
33. Cohen LA, Manski RJ, Magder LS, Mullins CD. Dental visits to hospital emergency departments by adults receiving Medicaid: Assessing their use. J Am Dent Assoc. June 1, 2002 2002;133(6):715-724.
34. Pryor C, Monopoli M. Eliminating adult dental coverage in Medicaid: An analysis of the Massachusetts experience. Washington, DC: Kaiser Commission on Medicaid and the Uninsured; September 2005.
35. Borchgrevink A, Snyder A, Gehshan S. The Effects of Medicaid Reimbursement Rates on Access to Dental Care: National Academy for State Health Policy; March 2008.
36. Wisconsin Department of Health and Family Services. Wisconsin public water supply fluoridation census – 2007. Madison, WI: Division of Public Health, Oral Health Program; 2007.
37. Agency for Healthcare Research and Quality. Total health services - mean and median expenses per person with expense and distribution of expenses by source of payment: United States, 2005. Medical Expenditure Panel Survey Component Data. http://usgovinfo.about.com/gi/dynamic/offsite.htm?zi=1/XJ&sdn=usgovinfo&cdn=newsissues&tm=36&f=00&tt=2&bt=0&bts=0&zu=http%3A//www.meps.ahrq.gov/PrintProducts/PrintProd_Detail.asp%3FID%3D614. Accessed February 28, 2008.
38. Cunningham PJ. What Accounts For Differences In The Use Of Hospital Emergency Departments Across US Communities? Health Affairs. 2006;25(5):324-336.

- 28 -
39. Weber EJ, Showstack JA, Hunt KA, et al. Are the Uninsured Responsible for the Increase in Emergency Department Visits in the United States? Ann Emerg Med. 2008;52(2):108–115e101.
40. Mofidi M, Rozier RG, King RS. Problems with access to dental care for Medicaid-insured children: What caregivers think. American Journal of Public Health. January 1, 2002 2002;92(1):53-58.
41. Savage MF, Lee JY, Kotch JB, Vann WF. Early preventive dental visits: effects on subsequent utilization and costs. Pediatrics. 2004;114(4):1072.
42. Mueller KJ. The Patient Protection and Affordable Care Act: A Summary of Provisions Important to Rural Health Care Delivery. Omaha, NE: RUPRI Center for Rural Health Policy Analysis; June 2010.
APPENDIX A. SCHEMA ORGANIZING ORAL HEALTH ICD-9-CM CODES BY
PREVENTABILITY, INCIDENCE, AND SEVERITY
ICD 9 Code Conditions that
would likely benefit
directly from better
prevention or
primary care
Conditions that would
possibly benefit from
better prevention or
primary care
Conditions unlikely
to benefit from
better prevention or
primary care
How common is
this type of
condition
R = very rare
M=somewhat rare
C = common
What is the severity
of this condition
+ – low
++ – moderate
+++ – high
520 Disorders of tooth development and eruption
520.0 – 520.4 X M +
520.5 X M ++
520.6 X C +
520.7 X C +
521 Diseases of hard tissues of teeth
521.0 X C ++
521.1 – 521.8 X M +
522 Diseases of pulp and periapical tissues
522.0 X C ++
522.1 X C ++
- 29 -

ICD 9 Code Conditions that
would likely benefit
directly from better
prevention or
primary care
Conditions that would
possibly benefit from
better prevention or
primary care
Conditions unlikely
to benefit from
better prevention or
primary care
How common is
this type of
condition
R = very rare
M=somewhat rare
C = common
What is the severity
of this condition
+ – low
++ – moderate
+++ – high
522.2 – 522.3 X M +
522.4 – 522.8 X C ++
523 Gingival and periodontal diseases
523.0 –523.9 X C +
524 Dentofacial anomalies, including malocclusion
524.0 – 524.2 X C +
524.3 – 524.6 X C +
524.7 – 524.9 X C +
525 Other diseases and conditions of the teeth and supporting structures
525.0 X M ++
525.1 X C ++
525.2 X R ++
525.3 – 525.9 X M +
526 Diseases of the jaw
- 30 -

ICD 9 Code Conditions that
would likely benefit
directly from better
prevention or
primary care
Conditions that would
possibly benefit from
better prevention or
primary care
Conditions unlikely
to benefit from
better prevention or
primary care
How common is
this type of
condition
R = very rare
M=somewhat rare
C = common
What is the severity
of this condition
+ – low
++ – moderate
+++ – high
526.0 – 526.3 X R +
526.4 X M +++
526.5 X M ++
526.8 X R +
527 Diseases of the salivary glands
527.0 – 527.8 X R ++
528 Diseases of the oral soft tissues excluding lesions specific for gingival and tongue
528.0 X M ++
528.1 X R +++
528.2 X C +
528.3 X R +++
528.4 X R +
528.5 X R ++
528.6 X C +
- 31 -
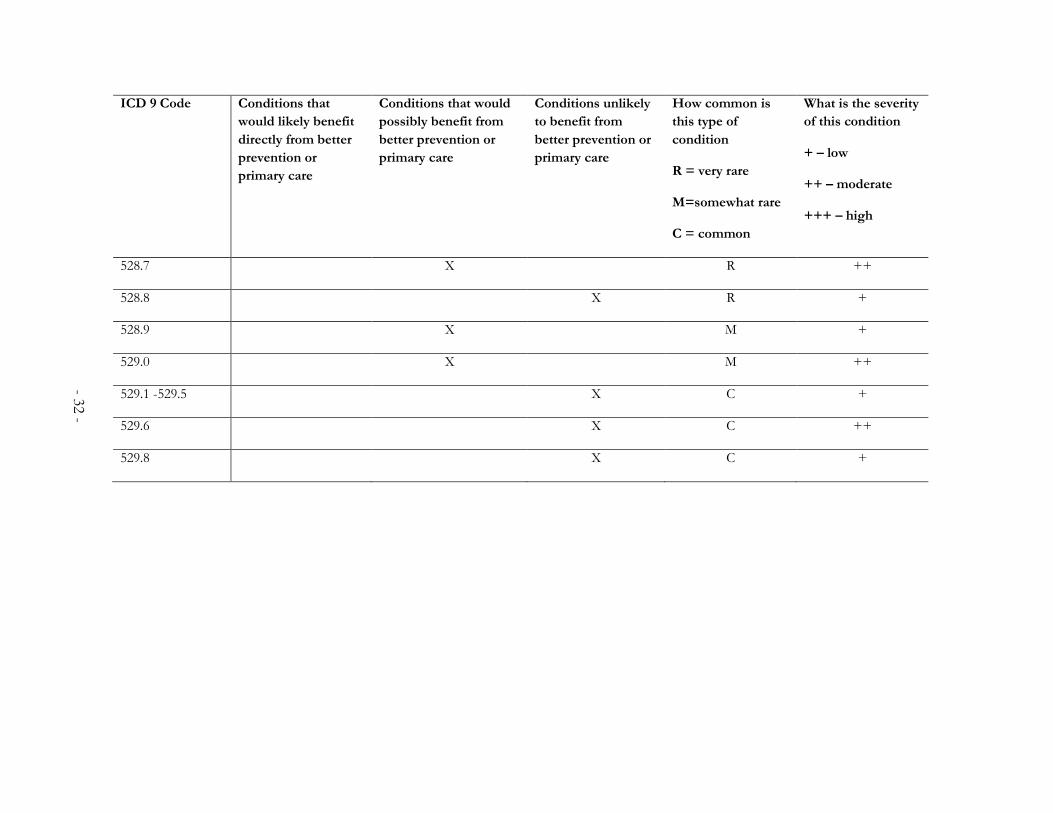
ICD 9 Code Conditions that
would likely benefit
directly from better
prevention or
primary care
Conditions that would
possibly benefit from
better prevention or
primary care
Conditions unlikely
to benefit from
better prevention or
primary care
How common is
this type of
condition
R = very rare
M=somewhat rare
C = common
What is the severity
of this condition
+ – low
++ – moderate
+++ – high
528.7 X R ++
528.8 X R +
528.9 X M +
529.0 X M ++
529.1 -529.5 X C +
529.6 X C ++
529.8 X C +
- 32 -

- 33 -
APPENDIX B. PERCENT OF EMERGENCY DEPARTMENT VISITS
WITH ORAL HEALTH DISORDER ICD-9-CM CODE IN SELECT
STATES
Arizona % (n)
Florida % (n)
Iowa % (n)
Maryland % (n)
Utah % (n)
Vermont % (n)
Wisconsin % (n)
1.70 (28,776) 2.10
(42,605) 1.66 (14,395) 2.19 (14,917)
1.65 (11,004)
3.13 (6,755)
1.99 (31,200)

- 34 -
APPENDIX C. PERCENT OF ORAL HEALTH EMERGENCY
DEPARTMENT VISITS CONSTITUTED BY ICD-9-CM CODES IN
SELECT STATES
ICD-9-CM code
Arizona % (n)
Florida % (n)
Iowa % (n)
Maryland % (n)
Utah % (n)
Vermont % (n)
Wisconsin % (n)
520 Disorders of tooth development and eruption
5200 0.02 (6) 0.04 (17) 0.03 (4) 0.02 (3) 0.05 (6) 0 (0) 0.04 (12)
5201 0 (0) 0 (0) 0 (0) 0 (0) 0 (0) 0 (0) 0.01 (4)
5202 0 (0) 0 (0) 0.01 (1) 0 (0) 0 (0) 0.01 (1) 0.00 (1)
5203 0 (0) 0 (0) 0 (0) 0 (0) 0 (0) 0 (0) 0.00 (1)
5204 0.00 (1) 0.02 (4) 0.01 (1) 0 (0) 0 (0) 0 (0) 0.02 (6)
5205 0.00 (1) 0.01 (3) 0 (0) 0 (0) 0.01 (1) 0 (0) 0.01 (3)
5206 1.01 (292) 1.05 (446) 0.81 (117) 0.86 (128) 0.69 (76) 1.64 (111) 1.20 (373)
5207 2.33 (671) 1.12 (479) 3.39 (488) 1.07 (159) 1.21 (133) 0.47 (32) 1.91 (596)
5208 0 (0) 0.01 (3) 0.01 (1) 0.01 (1) 0 (0) 0.01 (1) 0.03 (10)
5209 0.01 (2) 0.02 (7) 0.01 (2) 0.02 (3) 0 (0) 0.01 (1) 0.02 (6)
521 Diseases of hard tissues of teeth
52100 19.61 (5,642)
24.47 (10,427)
19.24 (2,769)
21.02 (3,136)
18.55 (2,041)
20.80 (1,405)
19.17 (5,982)
52101 0.02 (6) 0.01 (2) 0.01 (1) 0.02 (3) 0 (0) 0 (0) 0 (0)
52102 0.06 (18) 0.01 (3) 0.09 (13) 0.08 (12) 0 (0) 0 (0) 0.04 (12)
52103 0.03 (8) 0.02 (4) 0.14 (20) 0.10 (15) 0 (0) 0.03 (2) 0.05 (17)
52105 0 (0) 0.00 (1) 0 (0) 0 (0) 0 (0) 0.07 (5) 0 (0)
52106 0.01 (2) 0 (0) 0.01 (1) 0 (0) 0 (0) 0 (0) 0.00 (1)
52107 0 (0) 0.01 (3) 0.01 (1) 0 (0) 0 (0) 0.01 (1) 0.00 (1)
52108 0.01 (2) 0 (0) 0.01 (2) 0.05 (8) 0 (0) 0 (0) 0.01 (2)
52109 1.07 (309) 2.45 (1,045)
2.23 (321) 3.39 (506) 1.94 (214) 1.45 (98) 1.08 (337)
52110 0 (0) 0 (0) 0 (0) 0 (0) 0.02 (2) 0 (0) 0.01 (2)
52120 0.05 (15) 0.10 (41) 0.06 (8) 0.09 (13) 0.07 (8) 0.01 (1) 0.06 (18)
52121 0.00 (1) 0 (0) 0 (0) 0 (0) 0 (0) 0 (0) 0.01 (2)
52124 0 (0) 0.00 (1) 0 (0) 0.01 (1) 0 (0) 0.01 (1) 0.01 (2)
52125 0 (0) 0.01 (5) 0.01 (1) 0 (0) 0.01 (1) 0 (0) 0.00 (1)
52130 0.04 (13) 0.04 (18) 0.01 (2) 0.07 (11) 0.06 (7) 0 (0) 0.08 (26)
52131 0 (0) 0 (0) 0 (0) 0.01 (1) 0 (0) 0 (0) 0.01 (2)
52132 0 (0) 0 (0) 0 (0) 0.02 (3) 0 (0) 0 (0) 0 (0)
52133 0 (0) 0 (0) 0 (0) 0.01 (1) 0 (0) 0 (0) 0.00 (1)

- 35 -
5238 0.39 (112) 0.50 (214) 0.49 (70) 0.72 (108) 0.25 (27) 0.37 (25) 0.51 (160)
5239 0.19 (54) 0.15 (66) 0.28 (41) 0.13 (19) 0.10 (11) 0.16 (11) 0.35 (109)
524 Dentofacial anomalies, including malocclusion
52400 0.00 (1) 0.01 (3) 0 (0) 0 (0) 0.01 (1) 0 (0) 0.01 (3)
52402 0 (0) 0.00 (1) 0 (0) 0 (0) 0.01 (1) 0 (0) 0.00 (1)
52403 0 (0) 0.01 (2) 0 (0) 0 (0) 0.01 (1) 0 (0) 0 (0)
52404 0 (0) 0 (0) 0.01 (2) 0 (0) 0 (0) 0 (0) 0.01 (2)
52406 0 (0) 0 (0) 0 (0) 0 (0) 0 (0) 0 (0) 0.00 (1)
ICD-9-CM code
Arizona % (n)
Florida % (n)
Iowa % (n)
Maryland % (n)
Utah % (n)
Vermont % (n)
Wisconsin % (n)
52134 0.00 (1) 0 (0) 0 (0) 0 (0) 0 (0) 0 (0) 0.00 (1)
52140 0 (0) 0 (0) 0 (0) 0 (0) 0 (0) 0 (0) 0.00 (1)
5215 0 (0) 0 (0) 0 (0) 0 (0) 0 (0) 0.01 (1) 0.00 (1)
5217 0.01 (2) 0.00 (1) 0.01 (1) 0.01 (1) 0.01 (1) 0 (0) 0.00 (1)
5218 0 (0) 0.01 (2) 0 (0) 0.34 (51) 0 (0) 0.30 (20) 0.00 (1)
5219 0 (0) 0.01 (3) 0.01 (1) 0.01 (1) 0 (0) 0.01 (1) 0.01 (3)
522 Diseases of pulp and periapical tissues
5220 0.27 (77) 0.05 (21) 0.46 (66) 0.46 (69) 0.13 (14) 0.30 (20) 0.49 (153)
5221 0.00 (1) 0.02 (8) 0.03 (5) 0.02 (3) 0 (0) 0 (0) 0.01 (2)
5222 0 (0) 0 (0) 0 (0) 0 (0) 0.02 (2) 0 (0) 0 (0)
5224 5.15 (1,481)
3.15 (1,342)
5.11 (736) 5.26 (785) 10.22 (1,125)
5.55 (375) 4.72 (1,473)
5225 14.62 (4,206)
19.15 (8,160)
15.16 (2,182)
16.07 (2,397)
18.88 (2,078)
12.07 (815) 15.68 (4,892)
5226 0.01 (2) 0.01 (6) 0 (0) 0.02 (3) 0 (0) 0.01 (1) 0.01 (4)
5227 0.05 (15) 0.06 (25) 0.08 (12) 0.03 (4) 0.02 (2) 0.04 (3) 0.04 (13)
5228 0 (0) 0.01 (6) 0.01 (2) 0.03 (4) 0 (0) 0.01 (1) 0.01 (3)
5229 0.07 (20) 0.03 (14) 0.08 (11) 0.05 (8) 0.02 (2) 1.38 (93) 0.03 (10)
523 Gingival and periodontal diseases
5230 0.72 (206) 0.71 (304) 1.03 (148) 0.50 (74) 0.64 (70) 0.53 (36) 0.47 (146)
5231 3.42 (984) 4.84 (2,062)
2.85 (411) 3.83 (572) 2.74 (301) 1.87 (126) 2.36 (735)
52320 0.01 (4) 0.01 (3) 0.01 (1) 0.02 (3) 0.02 (2) 0.01 (1) 0 (0)
52324 0 (0) 0 (0) 0 (0) 0 (0) 0.01 (1) 0 (0) 0 (0)
52325 0 (0) 0 (0) 0 (0) 0 (0) 0 (0) 0 (0) 0.01 (2)
5233 1.42 (409) 0.94 (399) 1.78 (256) 0.93 (139) 0.65 (71) 0.77 (52) 1.44 (448)
5234 0.94 (271) 0.68 (290) 0.84 (121) 0.73 (109) 0.67 (74) 0.70 (47) 0.58 (180)
5235 0 (0) 0.01 (4) 0 (0) 0.01 (1) 0 (0) 0 (0) 0.01 (3)
5236 0 (0) 0.00 (1) 0.01 (1) 0 (0) 0 (0) 0 (0) 0.04 (14)
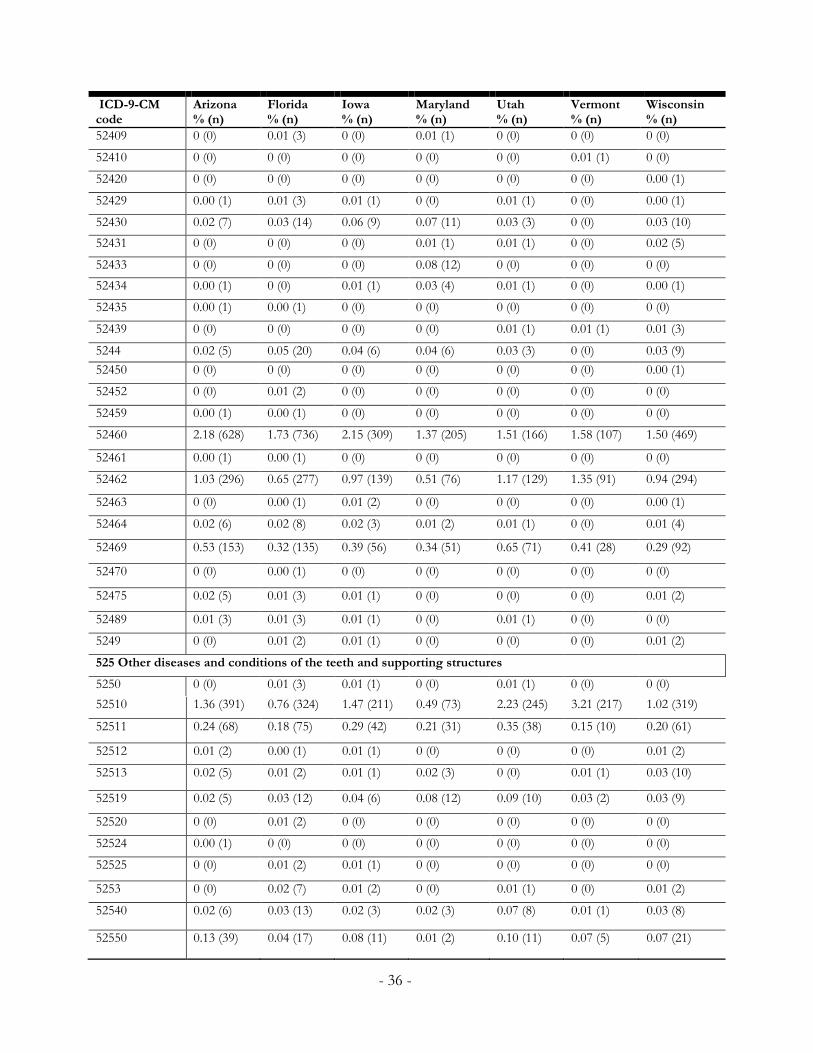
- 36 -
52510 1.36 (391) 0.76 (324) 1.47 (211) 0.49 (73) 2.23 (245) 3.21 (217) 1.02 (319)
52511 0.24 (68) 0.18 (75) 0.29 (42) 0.21 (31) 0.35 (38) 0.15 (10) 0.20 (61)
52512 0.01 (2) 0.00 (1) 0.01 (1) 0 (0) 0 (0) 0 (0) 0.01 (2)
52513 0.02 (5) 0.01 (2) 0.01 (1) 0.02 (3) 0 (0) 0.01 (1) 0.03 (10)
52519 0.02 (5) 0.03 (12) 0.04 (6) 0.08 (12) 0.09 (10) 0.03 (2) 0.03 (9)
52520 0 (0) 0.01 (2) 0 (0) 0 (0) 0 (0) 0 (0) 0 (0)
52524 0.00 (1) 0 (0) 0 (0) 0 (0) 0 (0) 0 (0) 0 (0)
52525 0 (0) 0.01 (2) 0.01 (1) 0 (0) 0 (0) 0 (0) 0 (0)
5253 0 (0) 0.02 (7) 0.01 (2) 0 (0) 0.01 (1) 0 (0) 0.01 (2)
52540 0.02 (6) 0.03 (13) 0.02 (3) 0.02 (3) 0.07 (8) 0.01 (1) 0.03 (8)
52550 0.13 (39) 0.04 (17) 0.08 (11) 0.01 (2) 0.10 (11) 0.07 (5) 0.07 (21)
ICD-9-CM code
Arizona % (n)
Florida % (n)
Iowa % (n)
Maryland % (n)
Utah % (n)
Vermont % (n)
Wisconsin % (n)
52409 0 (0) 0.01 (3) 0 (0) 0.01 (1) 0 (0) 0 (0) 0 (0)
52410 0 (0) 0 (0) 0 (0) 0 (0) 0 (0) 0.01 (1) 0 (0)
52420 0 (0) 0 (0) 0 (0) 0 (0) 0 (0) 0 (0) 0.00 (1)
52429 0.00 (1) 0.01 (3) 0.01 (1) 0 (0) 0.01 (1) 0 (0) 0.00 (1)
52430 0.02 (7) 0.03 (14) 0.06 (9) 0.07 (11) 0.03 (3) 0 (0) 0.03 (10)
52431 0 (0) 0 (0) 0 (0) 0.01 (1) 0.01 (1) 0 (0) 0.02 (5)
52433 0 (0) 0 (0) 0 (0) 0.08 (12) 0 (0) 0 (0) 0 (0)
52434 0.00 (1) 0 (0) 0.01 (1) 0.03 (4) 0.01 (1) 0 (0) 0.00 (1)
52435 0.00 (1) 0.00 (1) 0 (0) 0 (0) 0 (0) 0 (0) 0 (0)
52439 0 (0) 0 (0) 0 (0) 0 (0) 0.01 (1) 0.01 (1) 0.01 (3)
5244 0.02 (5) 0.05 (20) 0.04 (6) 0.04 (6) 0.03 (3) 0 (0) 0.03 (9)
52450 0 (0) 0 (0) 0 (0) 0 (0) 0 (0) 0 (0) 0.00 (1)
52452 0 (0) 0.01 (2) 0 (0) 0 (0) 0 (0) 0 (0) 0 (0)
52459 0.00 (1) 0.00 (1) 0 (0) 0 (0) 0 (0) 0 (0) 0 (0)
52460 2.18 (628) 1.73 (736) 2.15 (309) 1.37 (205) 1.51 (166) 1.58 (107) 1.50 (469)
52461 0.00 (1) 0.00 (1) 0 (0) 0 (0) 0 (0) 0 (0) 0 (0)
52462 1.03 (296) 0.65 (277) 0.97 (139) 0.51 (76) 1.17 (129) 1.35 (91) 0.94 (294)
52463 0 (0) 0.00 (1) 0.01 (2) 0 (0) 0 (0) 0 (0) 0.00 (1)
52464 0.02 (6) 0.02 (8) 0.02 (3) 0.01 (2) 0.01 (1) 0 (0) 0.01 (4)
52469 0.53 (153) 0.32 (135) 0.39 (56) 0.34 (51) 0.65 (71) 0.41 (28) 0.29 (92)
52470 0 (0) 0.00 (1) 0 (0) 0 (0) 0 (0) 0 (0) 0 (0)
52475 0.02 (5) 0.01 (3) 0.01 (1) 0 (0) 0 (0) 0 (0) 0.01 (2)
52489 0.01 (3) 0.01 (3) 0.01 (1) 0 (0) 0.01 (1) 0 (0) 0 (0)
5249 0 (0) 0.01 (2) 0.01 (1) 0 (0) 0 (0) 0 (0) 0.01 (2)
525 Other diseases and conditions of the teeth and supporting structures
5250 0 (0) 0.01 (3) 0.01 (1) 0 (0) 0.01 (1) 0 (0) 0 (0)

- 37 -
5280 5.35 (1,539)
3.22 (1,374)
1.75 (252) 1.69 (252) 4.18 (460) 0.58 (39) 1.89 (590)
5281 0 (0) 0 (0) 0.01 (1) 0 (0) 0.02 (2) 0 (0) 0 (0)
5282 2.31 (664) 1.27 (540) 2.45 (353) 1.26 (188) 2.14 (236) 0.89 (60) 1.60 (499)
5283 1.11 (319) 1.01 (431) 1.18 (170) 1.37 (205) 1.66 (183) 0.80 (54) 1.46 (456)
5284 0.03 (8) 0.04 (19) 0.05 (7) 0.06 (9) 0.02 (2) 0.01 (1) 0.03 (10)
5285 1.46 (420) 1.34 (573) 0.58 (84) 1.28 (191) 0.88 (97) 0.38 (26) 0.84 (262)
5286 0.02 (6) 0.04 (19) 0.09 (13) 0.04 (6) 0.02 (2) 0.01 (1) 0.04 (11)
52879 0.01 (3) 0.01 (4) 0.03 (5) 0.01 (1) 0.01 (1) 0 (0) 0.01 (3)
5288 0.01 (2) 0.01 (4) 0 (0) 0.01 (1) 0 (0) 0 (0) 0.00 (1)
ICD-9-CM code
Arizona % (n)
Florida % (n)
Iowa % (n)
Maryland % (n)
Utah % (n)
Vermont % (n)
Wisconsin % (n)
5258 1.37 (394) 1.49 (635) 2.02 (291) 1.06 (158) 0 (0) 0 (0) 0 (0)
5259 35.09 (10,098)
43.64 (18,594)
39.82 (5,732)
43.94 (6,554)
29.89 (3,289)
58.48 (3,950)
40.68 (12,693)
526 Diseases of the jaw
5260 0.00 (1) 0.00 (1) 0.01 (1) 0 (0) 0.01 (1) 0.01 (1) 0.01 (2)
5261 0.00 (1) 0.01 (3) 0.01 (1) 0 (0) 0 (0) 0 (0) 0.01 (2)
5262 0.04 (11) 0.05 (20) 0.02 (3) 0.04 (6) 0.08 (9) 0 (0) 0.03 (9)
5263 0 (0) 0 (0) 0 (0) 0 (0) 0 (0) 0 (0) 0.01 (2)
5264 0.58 (166) 0.51 (216) 0.40 (58) 0.35 (52) 0.88 (97) 0.21 (14) 0.37 (114)
5265 0.30 (86) 0.15 (66) 0.43 (62) 0.14 (21) 0.52 (57) 0.77 (52) 0.39 (122)
52681 0.00 (1) 0.02 (7) 0.01 (2) 0.01 (2) 0 (0) 0 (0) 0.01 (2)
52689 0.07 (19) 0.03 (15) 0.05 (7) 0.06 (9) 0.07 (8) 0 (0) 0.03 (10)
5269 5.54 (1,593)
6.78 (2,890)
7.72 (1,112)
4.42 (659) 5.83 (641) 3.80 (257) 3.40 (1,061)
527 Diseases of the salivary glands
5270 0 (0) 0 (0) 0 (0) 0 (0) 0 (0) 0.01 (1) 0 (0)
5271 0.03 (9) 0.03 (12) 0.04 (6) 0.03 (5) 0.08 (9) 0.01 (1) 0.02 (5)
5272 1.81 (522) 1.60 (682) 2.35 (339) 1.17 (174) 1.95 (215) 1.08 (73) 1.74 (542)
5273 0.03 (8) 0.02 (8) 0.04 (6) 0.01 (1) 0.02 (2) 0 (0) 0.03 (8)
5275 0.22 (64) 0.23 (100) 0.35 (50) 0.22 (33) 0.22 (24) 0.24 (16) 0.28 (86)
5276 0.04 (13) 0.04 (16) 0.02 (3) 0.05 (7) 0.04 (4) 0.04 (3) 0.02 (7)
5277 0.40 (114) 0.40 (169) 0.50 (72) 0.50 (74) 0.53 (58) 0.38 (26) 0.53 (164)
5278 0.11 (32) 0.12 (52) 0.15 (22) 0.15 (23) 0.07 (8) 0.15 (10) 0.18 (56)
5279 0.03 (8) 0.01 (3) 0.03 (4) 0.01 (1) 0.01 (1) 0.01 (1) 0.05 (16)
528 Diseases of the oral soft tissues, excluding lesions specific for gingival and tongue

- 38 -
ICD-9-CM code
Arizona % (n)
Florida % (n)
Iowa % (n)
Maryland % (n)
Utah % (n)
Vermont % (n)
Wisconsin % (n)
5289 3.46 (997) 3.45 (1,470)
4.70 (676) 3.02 (451) 3.59 (395) 2.16 (146) 3.17 (990)
529 Diseases and other conditions of the tongue
5290 0.47 (134) 0.42 (180) 0.49 (71) 0.34 (51) 0.37 (41) 0.28 (19) 0.38 (118)
5291 0.07 (20) 0.06 (24) 0.11 (16) 0.07 (10) 0.05 (6) 0.07 (5) 0.07 (22)
5292 0 (0) 0.00 (1) 0 (0) 0.01 (1) 0 (0) 0 (0) 0.00 (1)
5293 0.06 (16) 0.06 (26) 0.08 (12) 0.07 (11) 0.04 (4) 0.03 (2) 0.07 (21)
5294 0 (0) 0 (0) 0.01 (1) 0.01 (2) 0 (0) 0 (0) 0 (0)
5295 0.01 (2) 0.01 (4) 0.02 (3) 0.01 (1) 0.01 (1) 0 (0) 0.03 (8)
5296 0.18 (51) 0.19 (81) 0.36 (52) 0.23 (34) 0.22 (24) 0.19 (13) 0.23 (71)
5298 0.32 (93) 0.27 (116) 0.38 (55) 0.25 (38) 0.27 (30) 0.15 (10) 0.33 (102)
5299 0.08 (23) 0.05 (21) 0.09 (13) 0.05 (7) 0.11 (12) 0.03 (2) 0.09 (28)

APPENDIX D. SOCIODEMOGRAPHIC INFORMATION
Arizona Florida Iowa Maryland Utah Vermont Wisconsin
Age, mean (st. dev.) 40.93 (18.15) 44.27 (17.29) 36.97 (17.35) 40.43 (16.10) 34.00 (16.69) 31.32 (13.72) 36.89 (16.48)
Gender (ref.=female) 52.3 (12,095) 54.3 (18,900) 51.4 (5,836) 54.3 (16,341) 53.8 (4,583) 42.3 (2,806) 53.2 (13,834)
Race NA
White 62.6 (21,698) 87.8 (7,903) 49.0 (14,697) 78.3 (2,874) 97.9 (5,694) 70.8 (10,802)
African American 26.0 (8,996) 10.8 (971) 47.6 (14,294) 2.5 (94) 1.1 (65) 20.4 (3,115)
Other 11.4 (3,963) 1.4 (130) 3.4 (1,028) 19.1 (701) 0.9 (54) 8.8 (1,342)
Median household income for patient’s zip code
1st quartile 35.1 (7,725) 39.9 (13,429) 39.3 (4,400) 53.1 (15,720) 33.7 (2,695) 36.0 (2,044) 40.3 (10,355)
2nd quartile 29.3 (6,457) 31.7 (10,691) 25.6 (2,869) 22.3 (6,609) 30.9 (2,468) 29.4 (1,669) 30.0 (7,706)
3rd quartile 23.2 (5,117) 19.4 (6,531) 22.5 (2,523) 14.9 (4,414) 23.2 (1,859) 22.4 (1,274) 17.7 (4,546)
4th quartile 12.3 (2,705) 9.0 (3,034) 12.5 (1,395) 9.7 (2,862) 12.1 (967) 12.1 (686) 12.1 (3,100)
Average charges for oral
health ED visits, mean
(st. dev.)
6,301 (2,775) 10,724
(5,331)
4,626 (2,706) 1,793 (1,620) 2,792 (2,337) 2,802 (2,256) 6,227 (3,695)
- 39 -

- 40 -
APPENDIX E. ADDITIONAL STATE MAPS
Proportion low-severity oral health complaints in Arizona, Vermont and Wisconsin

- 41-
Proportion of Medicaid beneficiaries to all other payers in Arizona, Vermont and Wisconsin