Embed Size (px)
Citation preview

Comptroller and Auditor General
Special Report
Health Service Executive
Emergency Departments
November 2009

© Government of Ireland 2009
This report was prepared on the basis of information, documentation and explanationsobtained from the public bodies referred to in the report. The draft report was sent tothe Department of Health and Children and the Health Service Executive. Whereappropriate, the comments received were incorporated in the final version of the report.
The official website of the Comptroller and Auditor General, www.audgen.gov.ie, is theprimary means of publication and errata noted will be corrected thereon.

Report of the Comptroller and Auditor General Emergency Departments I have, in accordance with the provisions of Section 9 of the Comptroller and Auditor General (Amendment) Act, 1993, carried out an examination of emergency departments. I hereby submit my report on the above examination for presentation to Dáil Éireann pursuant to Section 11 of the said Act.
John Buckley Comptroller and Auditor General 13 November 2009


Table of Contents
Page Summary of Findings 9 Emergency Departments 1 Introduction 13 2 Emergency Department Performance 19 3 Care in Emergency Departments 35 4 Influence of Wider Hospital Organisation 53 5 Managing Emergency Demand 67 Appendices A HSE Corporate Plan 79 B 10-Point Plan 81 C Report References 85 D Winter Initiative 87

Abbreviations and References AMAU Acute Medical Admissions Unit AMU Acute Medical Unit ANP Advanced Nurse Practitioner CDU Clinical Decision Unit CiEM Consultant in Emergency Medicine CIT Community Intervention Team CNS Clinical Nurse Specialist ESRI Economic and Social Research Institute GP General Practitioner HIPE Hospital In Patient Enquiry Scheme HIQA Health Information and Quality Authority HSCN Health and Social Care Network HSE Health Service Executive ICGP Irish College of General Practitioners ICU Intensive Care Unit LOS Length of Stay MAU Medical Assessment Unit NHO National Hospitals Office NHS National Health Service NSP National Service Plan PCCC Primary Community and Continuing Care PCT Primary Care Team RCSI Royal College of Surgeons in Ireland SDM Senior Decision Maker TARN Trauma Audit Research Network
Reference in this report to the eight major hospitals refers to Emergency Departments at
The Adelaide and Meath Hospital, Dublin Incorporating the National Children's Hospital(Tallaght)
Beaumont Hospital
Connolly Hospital Blanchardstown
Cork University Hospital (CUH)
Galway University Hospital
Mater Misericordiae University Hospital
St James’s Hospital
St Vincent’s University Hospital.

Summary of Findings

Summary of Findings There are 50 acute public hospitals in the State. The examination reviewed emergency departments in 33 of those hospitals. In 2008, the emergency departments examined had over one million attendances. Approximately 25% of emergency cases were admitted to hospital following assessment while the remainder were treated and discharged. While the direct cost of emergency departments before taking account of overheads is estimated at €196 million, ultimately in the hospitals examined, care for those patients who had to be admitted cost an additional €1.5 billion in 2008.
The objective of the examination was to review service performance and assess the steps that the Health Service Executive (HSE) has taken to address key findings from a range of reviews conducted during the period 2002 – 2007. The following broad areas were examined
the extent to which measures to improve care within emergency departments have been implemented and the scope for further improvement
the impact of wider hospital organisation on the effectiveness of emergency departments
the scope for further measures to divert cases currently handled by emergency departments to a more appropriate care setting.
Service Performance There are significant variations in resources devoted to attendances at emergency departments. The number of patients handled by medical staff ranged from 8.15 to 30.57 per day across the different emergency departments. This pattern was mirrored in a wide divergence in the cost of treating persons who present at emergency departments, ranging from €85 to €281 per attendance.
The examination found that the provision of appropriate care in all types of emergency cases within a reasonable timeframe is adversely affected by the restricted availability of key resources.
23 of the 33 emergency departments had delays in accessing senior decision makers.
Access to consultations from specialities within the wider hospital was rated as unsatisfactory in most cases.
In most cases, there was considerable scope to improve the timeliness of diagnostic support and four departments had unsatisfactory access to those services.
The waiting time for bed accommodation following decisions to hospitalise emergency patients was unsatisfactorily long in most cases.
Care in Emergency Departments
Fundamental prerequisites to the care of patients in emergency situations include on-site availability of senior clinical decision makers and prompt access to other specialist consultants. The recently negotiated contract with medical consultants which provides for increased working hours should extend the time decision makers are available and reduce patient waiting times. However, the HSE will need to put procedures in place to confirm that the service gain envisaged under the new arrangements is achieved.
A factor that will fall to be addressed in attempting to improve access to diagnostic services is the restricted working arrangements in the diagnostic disciplines. Current arrangements limit access to services at night and at weekends. Standards and norms in the provision of diagnostic services and the organisation of work in diagnostic disciplines need to be developed.
The two performance measures consistently used in emergency departments are the count of total attendances and the measurement of time between decisions to admit and the provision of a bed for the

10 Emergency Departments
patient. In October 2007, a maximum twelve-hour target was introduced by the HSE and in January 2009, a total waiting time target of 6 hours was set from the registration of the patient in the emergency department to admission or discharge. A comparison of the average waiting time for admission from emergency departments in the period January to May 2008 with the same period in 2009 indicated that there had been an increase in the number of patients waiting 12 hours or more. 46% of patients were waiting 12 hours or more in early 2009.
Overall, the introduction of a comprehensive set of performance measures that are applicable to all emergency departments would help to drive performance and allow for comparability across hospitals. The Health Information and Quality Authority is developing such a suite of indicators including quality of care indicators. A pilot project is proposed for early 2010. When developed, the feedback should help emergency departments and the HSE to better manage the emergency services.
From an operational viewpoint, the streaming of emergency cases and the routing of appropriate cases through special clinics has the potential to improve emergency department efficiency and effectiveness. In addition, it would be worth evaluating the contribution of rapid access initiatives which hold the prospect of allowing quicker access to diagnostics and treatment.
Impact of Hospital Organisation
Emergency departments cannot operate in isolation from the wider hospital. Consequently, their effectiveness is tied into the way that the overall hospital in which they function is organised.
The examination noted some potential to improve emergency department effectiveness through
better planning of discharges and finding alternative lower cost accommodation for patients whose acute care needs have been dealt with
improving hospital capacity through a combination of day care, same day admission and, where necessary, increased bed numbers.
The examination concluded that the length of stay of patients could be better managed through
a wider use of early discharge planning based on standard targets for each condition
more even discharging across the week
discharge of patients earlier in the day which could favourably impact on bed availability since attendance in emergency departments tends to increase in the afternoon.
A dedicated bed management function operating on the basis of norms established in an evidence-based way could provide coordination of these functions.
As the cost of step-down beds is considerably lower than the cost of acute beds there may be scope for cost efficiencies through development of a strategy to provide more beds in the community.
Many hospitals have begun initiatives to improve patient flows and establish patient pathways through the hospital and some good practice opportunities were identified during the course of the examination. However, a systematic mechanism to provide for the sharing of these good practice initiatives is needed to facilitate replication on a wider basis.
Community Care Initiatives
The provision of alternatives to acute hospital care through strengthening primary and community care services could reduce reliance on the acute hospital services and demand on emergency departments.

Introduction 11
Community intervention teams provide a rapid response to patients who are deemed medically suitable for treatment in the home. Four teams are in operation two of which are in Dublin and one each in Cork and Limerick. These services have the potential to generate significant efficiency savings relative to hospital care as well as better patient care.
In November 2006, a rapid access clinic in the community was opened in Smithfield in Dublin to provide care for older people with urgent but non-emergency care on the basis of referrals by their GPs or by emergency departments. A review of the clinic by the HSE found that 42% of new patients had avoided hospital admission through an emergency department. It is likely that the clinic has provided significant savings by comparison with the cost of acute hospital care.
The inadequate and fragmented arrangements for the management of chronic illnesses has been recognised for some time and both the Department of Health and Children and the HSE have been working to re-orient the related services towards a primary care setting and bring about a more integrated approach between hospital and primary care services. Bringing this re-orientation to completion will require the development of a robust change management programme, the setting of standards of care and clinical guidelines, as well as developing a framework for implementation at local level.
The HSE has developed a number of hospital avoidance measures such as home help and home care packages for older people who might otherwise occupy an acute hospital bed. An evaluation of home care packages is being finalised by consultants on behalf of the Department.
In 2008, there were nearly one million attendances at out-of-hours GP services which are provided to 90% of the population. This service should be evaluated to assess its cost effectiveness and whether it has the potential to impact on reducing demand in emergency departments. In addition, in order to assess the scope for savings from the further development of community intervention teams and community based rapid access clinics, a full overall costing exercise taking account of all overheads should be completed.
Overall Conclusions The examination found that there were considerable differences in emergency department capacity and that cost per attendance also varied significantly across the service.
Some of the pressure on emergency departments could be ameliorated by more streamlined hospital processes particularly in managing discharges and increasing the volume of work completed on a day case basis.
Community initiatives need to be evaluated to determine their relative cost effectiveness and, to the extent that they are found to be more economic and effective, integrated into the primary care team model. This could also help reduce recourse to the emergency services.
As part of its Transformation Programme the HSE plans to reconfigure its acute services and concentrate emergency, urgent and complex acute care into regional centres with skilled clinicians. The intention is that regional centres will be supported by a network of minor injury units in outlying facilities. The report findings suggest that considerable work remains to be done to bring about change consistent with these objectives and align current service provision with the objectives of the desired reconfiguration.


1 Introduction
1.1 An emergency department is an important component of the larger health care system. There are 50 acute public hospitals in the State. Emergency departments range from small casualty units to complex departments in larger hospitals. The examination reviewed emergency departments in 33 hospitals.1. Emergency care accounted for 55% of inpatient care2 in the hospitals concerned in 2008. The total estimated cost of care of emergency cases in the hospitals examined was €1.7 billion.
1.2 The primary purpose of emergency departments is to deliver care in the case of those medical, surgical or psychiatric conditions that require urgent attention in order to save a life or prevent permanent impairment. Emergency care is typically provided in response to serious accidental injuries or the sudden onset of an acute medical condition but also entails the treatment of patients with less serious conditions who are released without being admitted to hospital.
1.3 Emergency departments treat over one million patients annually. Because they do not operate in isolation from the wider hospital and health system, their capacity, efficiency and effectiveness can be influenced by factors outside their immediate control. In addition, the fact that the population is ageing impacts on the demand for their services.
Health Service Structures
1.4 The Irish health system is delivered by a mix of public and private institutions. The Department of Health and Children (the Department) is responsible for the strategic development of the health system including policy and legislation. Since January 2005, operational responsibility for providing health and personal social services rests with the Health Service Executive (HSE). The HSE is responsible for the promotion and protection of the health of the population, the delivery of care in the community and the provision of acute hospital and ambulance services.
1.5 The strategy for the delivery and development of health and personal social services up to 2010 was set out in a National Health Strategy3 adopted in 2001. The current Corporate Plan of the HSE covering the period 2008-2011 sets out its overall strategic direction. Annually, the HSE also produces a National Service Plan which sets out the outputs and deliverables for the year based on the objectives in the Corporate Plan. The key objectives of its Corporate Plan 2008-2011 are set out in Appendix A.
Emergency Department Process
1.6 In 2008, there were 1.15 million attendances at the 33 emergency departments. Around 3,100 people attend emergency departments each day and approximately 25% of them need to be admitted to hospital following assessment while the remainder are treated and discharged.
1.7 In the larger hospitals, when a patient arrives at an emergency department, the case is registered and the patient is triaged4 by a nurse and rated according to the severity of the illness. The triage rating determines the order in which a clinician sees the patient.
1.8 The possible review and treatment elements in an episode of emergency care are
1 Emergency departments in paediatric, maternity, single speciality and some smaller hospitals were not examined. 2 Inpatient care refers to care for a patient who is formally admitted to a hospital for treatment and/or care and stays
for a minimum of one night in the hospital providing inpatient care. 3 National Health Strategy – Quality and Fairness (Department of Health and Children) 2001. 4 Triage is a process of sorting patients into groups based on the urgency of care required or likely benefit from
immediate medical treatment.

14 Emergency Departments
initial assessment by a triage nurse
being seen by an emergency department clinician
having diagnostic tests performed
observation and monitoring
receiving test results
post test review by an emergency department clinician
review by an admitting speciality consultant
discharge or admission to hospital or to another hospital.
Health Service Development Goals
1.9 The HSE is pursuing changes to services including emergency care under a Transformation Programme (2007-2010). This Programme encompasses more than 100 interlinked projects, designed to change the way patients access health and social care services. The programme sets out a number of key priority areas which directly relate to service delivery and include the development of integrated services, the configuration of hospital, primary and continuing care services and the implementation of a model for the prevention and management of chronic illness.
1.10 The HSE has stated that it is developing a clinical network of services, designed to international ‘best practice’ standards which includes establishing
local centres of excellence to provide patients with access to a wide range of services for the investigation and management of most routine conditions and
a single, regional centre of excellence to manage the more complex conditions which need particular clinical expertise, continuous medical supervision and the support of critical care.
1.11 One component of this programme is the reconfiguration of acute services involving a concentration of emergency, urgent and complex acute care into regional centres with skilled specialist clinicians. The intention is that regional centres will be supported by a network of minor injury units in outlying facilities.
Measures to Improve Performance
1.12 In addition to ongoing investment in measures which may have a positive impact on emergency services a number of specific initiatives have been taken from time to time. These were associated with once-off resource inputs. The largest such initiative for which specific funding was provided was a 10-point national plan for which €70 million was provided in 2005. The 10-Point Plan is further outlined in Appendix B.
Measures to Improve Monitoring
1.13 The HSE has developed some performance indicators in respect of emergency departments, including indicators relating to the number of patients waiting in the emergency department and the length of time each patient is waiting.
1.14 HealthStat is a performance information system which, since early 2009, publishes monthly reports on the HSE website. One of the Healthstat indicators for measuring access to services is the time waiting for a bed in an emergency department after a decision to admit has been made. This system is reviewed in detail in my Annual Report on the Accounts of the Public Services 2008.

Introduction 15
Recent Developments
1.15 Since April 2009, the opening hours of the emergency departments at Ennis and Nenagh General Hospitals were changed to a twelve-hour service. Patients requiring emergency care are treated in Limerick Regional Hospital outside these hours.
1.16 The HSE is currently reviewing the need for 24-hour cover in eight adult and three paediatric emergency departments in Dublin and three adult emergency departments in Cork City.
Emergency Care Reviews
1.17 A wide range of reports on emergency care have been published in the period 2002 to 2007. In the course of this examination, twelve reports were identified as significant in the area of emergency care. In addition to proposed changes in the emergency departments themselves, the reports proposed changes that could be made elsewhere in acute hospitals and in the wider health sector (e.g. primary care, care in the community) with the aim of improving efficiency in the operation of emergency departments. The main reports published in the period 2002 to 2007 are set out in Figure 1.1.
Figure 1.1 Emergency Care Reviews
Reportsa Year Abbreviated Title for this Report
1 Report of the Committee on Accident and Emergency Services
2002 –
2 Acute Hospital Bed Capacity – A National Review 2002 Acute Hospital Bed Capacity Report
3 Admissions and Discharge Guidelines – Health Strategy Implementation Project
2003 –
4 National Review of Bed Management Function – Report to the Employers and Unions
2003 Capita Report
5 The Commission on Financial Management and Control Systems in the Health Service
2003 Brennan Report
6 Report of the National Task Force on Medical Staffing 2003 Hanly Report 7 Report on Nurse Staffing Levels in Emergency Departments
in the Republic of Ireland 2003 –
8 Comhairle Na nOispidéal – Acute Medical Units 2004 Acute Medical Units Report
9 A&E Mapping and Efficiency Review Across 10 National Hospitals – Tribal Secta
2005 Tribal Secta Report
10 Emergency Department Task Force Report 2007 Task Force Report 11 Acute Hospital Bed Review – A Review of Acute Hospital
Bed Use in Hospitals in the Republic of Ireland with Emergency Departments
2007 Bed Review Report
12 Acute Hospital Bed Capacity Review – A Preferred Health System in Ireland to 2020
2007 Bed Capacity Review Report
Note: a The full reference of each report is set out in Appendix C. These reports are referred to throughout the remainder
of this report as “the review reports”.

16 Emergency Departments
Objectives and Scope of the Examination
1.18 The examination looked at the steps which the HSE has taken to implement key recommendations in the reports outlined in Figure 1.1 insofar as they impact on patient care in emergency departments. The examination reviewed implementation steps under the following broad headings
the extent to which measures to improve care in emergency departments have been implemented and the scope for further improvement
the impact of the wider hospital organisation on the effectiveness of emergency departments
the scope for further measures to divert cases handled by emergency departments to a more appropriate care setting.
Methodology
1.19 The examination was conducted by staff of the Office of the Comptroller and Auditor General. A management consultant, who is also a qualified and practising medical consultant in the UK, provided assistance.5
1.20 The methodology included the issue of a questionnaire to the 33 hospitals with emergency departments, interviews with relevant personnel in the Department and the HSE, and with key stakeholders. Seven hospitals6 were also visited in the course of which interviews were conducted with key personnel including Chief Executive Officers or General Managers, Consultants in emergency medicine, other Consultants, Nurses and administrative staff. A multi-disciplinary workshop was also held with representatives from different health care functions.
1.21 The examination also involved a review by an independent consultant7 of the evaluation methodology used to assess the performance of emergency departments and to advise the Office on quality issues.
1.22 A number of key examination issues, classified under three broad categories, emerged when the findings of the review reports were classified. These are set out in Figure 1.2.
5 Dr Bairbre Golden. 6 St. James’s Hospital, St. Vincent’s University Hospital, Mater Misericordiae University Hospital, Cork University
Hospital, Our Lady of Lourdes, Drogheda, Portiuncula Hospital, Ballinasloe and St. Luke’s General Hospital, Kilkenny.
7 Professor Matthew Cooke, Emergency Medicine Consultant and Director of Emergency Care and Systems Improvement Group, Warwick Medical School.

Introduction 17
Figure 1.2 Examination Issues
Broad Classifications Key Examination Issues
Care in the Emergency Department Availability of Diagnostic Services Availability and Access to Senior Decision Makers Improvement in Infrastructure Monitoring of Timeliness of Care Implementation of Rapid Access Initiatives Development of Streaming of Emergency Cases
Influence of Wider Hospital Organisation Improvement in Discharge Planning Management of Delayed Discharge Improvement of Bed Capacity Improvement in Bed Management Patient Flow Management Transport Availability
Managing Emergency Demand Community Care Service Initiatives Community Supports Improvement in Chronic Disease Management Access to Diagnostic Services for GPs Development of Primary Care Teams Integration Challenges
Source: Office of Comptroller and Auditor General
International Reviews of Emergency Care
1.23 Two international reports that examined emergency department reforms and opportunities for better practice were reviewed in the course of the examination
Reducing Attendances and Waits in Emergency Departments – A systematic review of present innovations: Report to the National Co-ordinating Centre for NHS Service Delivery and Organisation, January 2004
A US report, published in April 2008, by the American College of Emergency Physicians: Emergency Department Crowding: High-Impact Solutions.
1.24 These reports combined with the twelve Irish reports provided the basis against which the progress in improving service efficiency and effectiveness in emergency departments was reviewed. In Chapters 3 and 4 each area examined commences with a synthesis of the findings of the review reports commissioned and then outlines the examination findings on the matter in question.
Structure of the Report
1.25 Chapter 2 gives an overview of the examination findings relating to performance of emergency departments. Chapter 3 examines the progress that has been achieved in improving care within emergency departments. Chapter 4 reviews wider hospital impacts on emergency departments including bed management, capacity, discharge arrangement and operational issues. Chapter 5 looks at issues in the areas of primary and community care that impact on the demand for emergency department services.


2 Emergency Department Performance 2.1 The effective performance of emergency departments depends on achieving a balance between the quality of patient care and the efficient operation of the department. This Chapter outlines the resources devoted to the emergency departments examined and reviews the extent to which resources that are key to their effective functioning are available to them. It goes on to summarise the scope for improvement in the delivery of service within emergency departments and in the general functioning of hospitals in areas that impact on emergency department operation. It also examines the potential of measures in the community to divert cases from emergency departments and hospitals. Chapters 3 to 5 review these matters in greater detail.
Application of Resources
2.2 Emergency departments dealt with 1.14 million patient attendances in 2008. When the throughput is examined in terms of resources applied to deal with these attendances, the position by hospital is as set out in Figure 2.1.
2.3 The results shown in Figure 2.1 suggest that a significant difference exists between hospitals in terms of staff resources devoted to each attendance. Attendance per whole time equivalent (WTE) medical staff member ranged from 8.15 per day in St Vincent’s University Hospital to 30.57 per day in Portlaoise General Hospital with an overall average of 13.24.
2.4 There are also significant variances within hospital types. For example, the attendances per WTE medical staff in the eight major hospitals ranged from 8.15 to 13.01. While it might be expected that the complexity of cases would impact on staffing levels and account for some variation, it was found that the differences in triage categories are insufficient to explain the variances in staffing between the hospitals.
2.5 It is recognised that resources devoted to each attendance, while adequate to measure the amount of resources used, would in a developed performance management system need to be supplemented with a measure of clinical care quality. However, the extent of the variation suggests that further investigation is warranted, with a view to determining its causes and setting norms for activity bands based on the level of throughput.

20 Emergency Departments
Figure 2.1 Resource Application by Emergency Departments
Hospital Attendanceª Medical Staff b
Nursing
Staff b
Attendance per Medical
Staff per Day c
Attendance per Nursing Staff
per Day d
Tallaght 76,775 39.00 54.20 9.65 6.35 Limerick 59,356 17.00 54.50 17.12 4.88 Galway University 58,367 22.00 50.73 13.01 5.16 Cork University 56,810 24.20 71.31 11.51 3.57 Waterford 52,442 15.00 31.00 17.14 7.59 Mater 47,077 24.00 67.07 9.62 3.15 St. James’s 46,581 27.00 90.50 8.46 2.31 Drogheda 46,119 13.00 40.00 17.39 5.17 Beaumont 45,959 22.00 54.75 10.24 3.76 St. Vincent’s 42,409 25.50 52.50 8.15 3.62 Portlaoise 41,910 6.72 19.25 30.57 9.76 St. Luke’s, Kilkenny 36,601 7.30 23.25 24.58 7.06 Wexford 34,676 6.00 24.41 28.33 6.37 Mullingar 34,474 9.00 21.58 18.78 7.16 Kerry 34,230 7.00 29.25 23.97 5.25 Connolly 32,570 16.00 51.50 9.98 2.84 Mayo 32,430 9.00 31.18 17.66 4.66 Sligo 31,816 14.00 27.19 11.14 5.25 Letterkenny 31,625 14.00 27.70 11.07 5.12 Tullamore 31,552 13.00 28.73 11.90 4.92 Naas 27,565 13.00 26.11 10.39 4.73 Cavan 27,115 10.00 22.60 13.29 5.38 Tipperary 26,071 8.73 22.60 14.64 5.17 Mercy 24,184 10.00 26.00 11.85 4.17 St. Columcille’s 23,734 10.00 19.00 11.63 5.60 South Infirmary 22,409 11.00 18.50 9.99 5.43 Portiuncula, Ballinasloe 21,261 6.50 18.50 16.03 5.15 Our Lady’s, Navan 20,717 6.00 14.00 16.93 6.64 Ennis 19,662 4.00 11.00 24.10 8.02 St. John’s, Limerick 18,552 4.75 11.18 19.15 7.44 Louth County 17,180 5.00 12.30 16.84 6.26 Nenagh 16,257 4.00 8.00 19.92 9.11 Roscommon 14,161 3.18 19.75 21.83 3.22 National 1,152,647 426.88 1080.14 13.24 4.79 Source: Analysis by the Office of the Comptroller and Auditor General Notes: a Attendance figures are based on actual numbers of patients that attend the emergency department and can
include both new and return visits. b Medical staff are consultants, registrars, senior house officers and interns. The staff numbers consist of the
number of Whole Time Equivalent staff in the emergency department which could be a mix of full-time, part-time or agency staff. The figures were compiled from information supplied by each hospital as part of a survey performed in August 2008.
c Available working days are estimated at 204 days after allowing for weekends , public holidays , annual leave, rest days and study leave. Annual leave, rest days and study leave are weighted averages to allow for the different entitlements of consultants and other medical staff.
d Available working days are estimated at 223 days after allowing for weekends, public holidays, annual leave and professional development.
Emergency Department Performance 21
Performance of Emergency Departments
2.6 The examination sought to review the extent to which specific functions necessary for fully functioning emergency departments were available within reasonable timeframes as well as the cost per attendance and the extent of waiting time following clinicians’ decisions to admit.
2.7 Fully functioning emergency departments should be capable of accepting all types of cases and delivering all the appropriate care that would be expected in the first few hours of a medical emergency or injury.
2.8 The performance of the 33 emergency departments examined was rated under the following headings
cost per attendance – the average cost per attendance in the emergency department
decision capacity – the extent to which consultants and specialist registrars (4/5)8 in emergency medicine are available in the emergency department
speciality access and availability – the extent of access by the emergency department to consultants and medical staff from other specialities
diagnostics – the availability of diagnostic support to the emergency department
bed waiting time – the length of time a patient waits from the time a decision is taken to admit until that patient is provided with a bed.
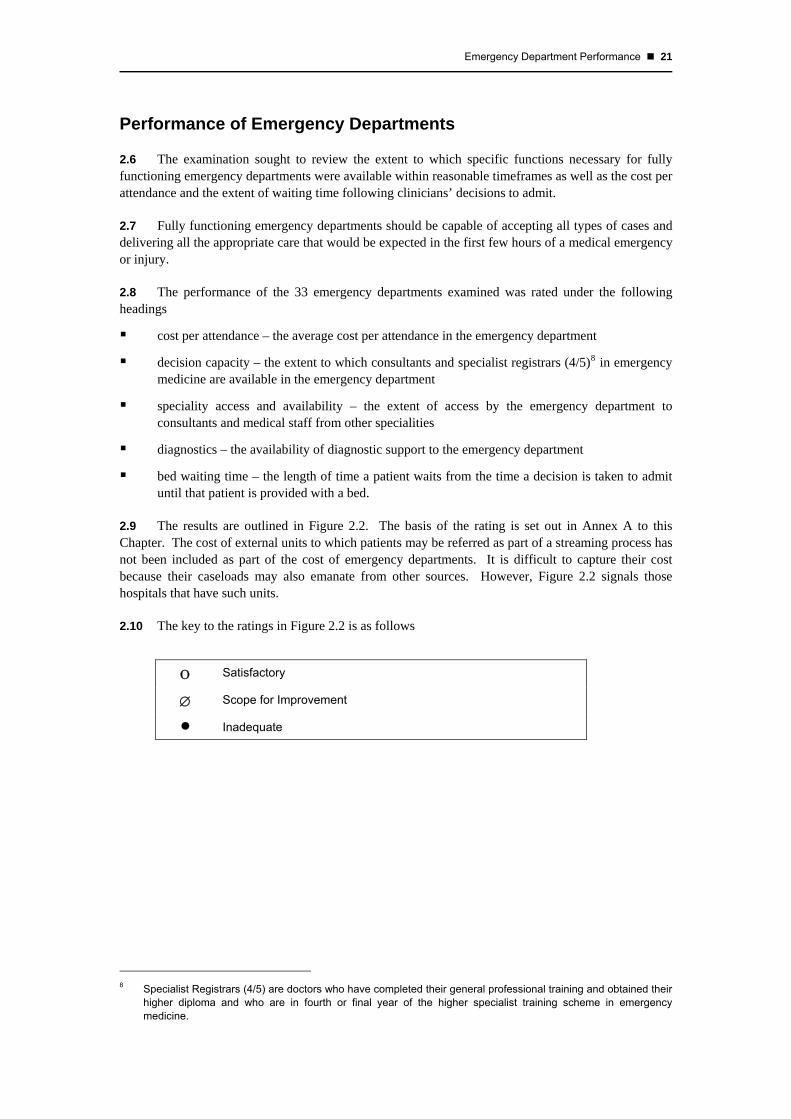
2.9 The results are outlined in Figure 2.2. The basis of the rating is set out in Annex A to this Chapter. The cost of external units to which patients may be referred as part of a streaming process has not been included as part of the cost of emergency departments. It is difficult to capture their cost because their caseloads may also emanate from other sources. However, Figure 2.2 signals those hospitals that have such units.
2.10 The key to the ratings in Figure 2.2 is as follows
Ο Satisfactory
∅ Scope for Improvement
n Inadequate
8 Specialist Registrars (4/5) are doctors who have completed their general professional training and obtained their
higher diploma and who are in fourth or final year of the higher specialist training scheme in emergency medicine.

22 Emergency Departments
Figure 2.2 Relative Performance of Emergency Departments a
Hospital Attendances 2008
Direct Cost per
Attendance
Decision Capacity
Speciality Access Diagnostics
Bed Waiting
Time
Existence and Type
of Streamingb
St. Vincent’s 42,409 281 Ο Ο Ο n CDU
St. James’s 46,581 262 Ο ∅ Ο n AMAU
Connolly 32,570 250 ∅ n Ο n
Beaumont 45,959 239 ∅ ∅ Ο n AMU
Mater 47,077 237 Ο ∅ Ο n AMAU,
AMU, MAU,CDU
Letterkenny 31,625 221 n n ∅ Ο
Tallaght 76,775 213 n Ο Ο n AMAU,CDU
Mercy University 24,184 189 n n Ο n
Naas 27,565 182 n n Ο n AMU
South Tipperary 26,071 177 n n ∅ n
St. Columcille’s 23,734 174 n n Ο n
Portiuncula, Ballinasloe 21,261 166 n n Ο n
Limerick 59,356 163 n Ο Ο n MAU
Sligo 31,816 163 n Ο Ο n MAU
Cork University 56,810 162 Ο ∅ ∅ n CDU
Mayo 32,430 156 n ∅ ∅ n MAU,CDU
South Infirmary 22,409 151 n n n ∅
Roscommon 14,161 151 n n n n MAU
Tullamore 31,552 147 ∅ n ∅ ∅
Drogheda 46,119 145 n ∅ ∅ n
Galway University 58,367 145 n ∅ Ο n
Ennis 19,662 141 n n Ο n
Kerry 34,230 131 n n ∅ n AMAU,
AMU, CDU
Waterford 52,442 127 ∅ ∅ ∅ ∅ MAU
Wexford 34,676 124 Ο n Ο n AMAU,
MAU
Mullingar 34,474 119 n ∅ Ο ∅ MAU
Louth County 17,180 118 n n ∅ n
Portlaoise 41,910 117 n n Ο n
Cavan 27,115 115 n n Ο n
Our Lady’s, Navan 20,717 112 n n ∅ n
St. Luke’s, Kilkenny 36,601 110 ∅ ∅ ∅ n
AMAU
Nenagh 16,257 107 n n n Ο
St. John’s, Limerickc 18,552 85 n n n Ο
MAU
Source: Analysis by the Office of the Comptroller and Auditor General Notes: a Decision capacity, speciality access and diagnostics are based on information gathered in the survey conducted
for the purposes of the examination in 2008. Bed waiting time is based on data for the period January to May 2009 supplied by Performance Management Unit of the HSE.
b These abbreviations are for Acute Medical Unit (AMU), Medical Assessment Unit (MAU), Acute Medical Admission Unit (AMAU) and Clinical Decision Unit (CDU).
c St. John’s Limerick results are based on their service provision of 12 hours per weekday.

Emergency Department Performance 23
2.11 It has been estimated that the direct cost of emergency departments is in the region of €196 million of which €164 million consisted of pay costs9. Figure 2.2 discloses significant differences in direct emergency department costs per attendance ranging from €85 to €281. Hospital overheads and services, if apportioned to emergency departments, could impact on the relative cost of emergency care. Since no such data is captured, the data in Figure 2.2 is the best currently available starting point for a review of costs in emergency departments.
2.12 In order to achieve more accurate and consistent costing the HSE needs to
distinguish emergency departments that have their own dedicated diagnostics from those that do not
distinguish emergency departments that provide services such as same day endoscopy services and chest pain clinics, which are usually provided within the wider hospital in most cases
review the treatment of costs related to streaming units where these costs are allocated to emergency departments
review the accuracy of its cost capture systems and design an overhead allocation model.
2.13 There would be merit in improving costing methods so that the HSE could take account of factors such as
fixed and variable costs in order to isolate costs associated with emergency departments which arise irrespective of throughput because a level of service has to be available
the impact of patient mix – the mix of adults and children can influence the cost
the boundary between hospital costs and emergency costs – if patients in the emergency department for whom the decision to admit has been made but who have not yet been allocated a bed require diagnostics these costs are charged to the emergency department
the age profile of patients
the impact of streaming systems.
Quality of Care
2.14 This examination noted that emergency department clinical performance outcome indicators have not been set in most hospitals. The quality of the clinical data collected is variable and consequently open to misinterpretation.
2.15 The Health Information and Quality Authority (HIQA) have completed a review of international and national key performance indicators and will be working in consultation with internal and external stakeholders in developing a suite of key performance indicators for emergency departments in Ireland. It is planning to establish a project to develop and pilot the indicators in early 2010.
2.16 In the UK, a Trauma Audit Research Network (TARN) provides a multidisciplinary clinical audit service and reports confidential comparative statistics to clinicians about hospital performance. Currently two Irish hospitals are members - Beaumont and Waterford.
9 The estimated costs are based on 2007 costs indexed in respect of 6% health inflation over the year.

24 Emergency Departments
Trauma Audit Research Network (TARN)
TARN is a well-established system, which allows hospitals to audit their performance in treating trauma patients. The data is forwarded to UK TARN and the hospital receives an indication of how the hospital is performing against other hospitals in both the UK and Ireland.
The benefit to the hospital is that it gets an indication of its performance against outcomes of other hospitals anonymously. It also allows for identification of results that require review to determine if there is a reason for an unexpectedly poor outcome for a particular patient.
2.17 Regular surveys of patients can also provide information to gauge the quality of patient care. In 2006, the HSE commissioned a survey of patients who had attended emergency departments. The survey found that 76% of patients surveyed expressed satisfaction with the service provided. The survey also indicated that satisfaction rates are determined by factors such as the knowledge and skill of staff, the level of information/communication, staff interaction with patients and the level of respect shown by staff.
2.18 Overall, in order to get a comprehensive view of emergency department performance, the HSE should, in consultation with HIQA, examine how comparators and indicators on the lines of those in Figure 2.2 might be supplemented with qualitative indicators. Annex B to this Chapter sets out some considerations that would need to be taken into account in order to achieve an overall balanced measurement system.10
Service Delivery in Emergency Departments
2.19 Chapter 3 examines the delivery of services within emergency departments and sets out detailed findings in that regard. Based on those findings, Figure 2.3 rates the scope for improvement in a number of key component functions.
10 This is drawn from work done by Professor Matthew Cooke, who provided consultancy input into this
examination.

Emergency Department Performance 25
Figure 2.3 Scope for Service Improvement
Scope for Improvementa
Administrative Area High Some Little
Diagnostic Services √ Senior Decision Makers √ Infrastructure √ Monitoring Timeliness of Care √ Rapid Access Initiatives √ Streaming of Emergency Cases √ Note:
a High – Improvement necessary in most (≥ 20 hospitals) Some – Improvement necessary in some (5-19 hospitals) Little – Most hospitals performing adequately (< 5 with scope to improve)
Impact of Wider Hospital Organisation
2.20 Because most inpatients arise from emergency admissions there is a considerable challenge to manage demand led emergency cases while maintaining a capacity to treat elective cases in a planned and organised way. Chapter 4 sets out a range of in-hospital functions which have the potential to impact on emergency admissions. It was found that there is some scope for efficiency gains in the following areas
discharge planning
managing delayed discharge
bed capacity and use
bed management
patient flow management
transport.
There also appeared to be some scope to improve hospitals’ functioning through
the use of information from the casemix11 system to establish length of stay norms
more active monitoring and decision-making
more dedicated access to theatres.
Diversion of Patients from Emergency Departments
2.21 In the medium to longer term, the reconfiguration of services within the community has the potential to provide for the care of certain emergency cases in that setting.
11 Casemix provides a means for standardising data collected on activity and costs within acute hospitals so that
meaningful comparisions can be made between different areas of activity and different hospitals.

26 Emergency Departments
2.22 A range of potential measures to divert appropriate cases away from emergency departments have been examined. Chapter 5 outlines the extent to which these measures have been embedded. Figure 2.5 sets out a rating of the implementation of the measures and the scope for further contribution from their implementation.
Figures 2.5 Diversion Measures
Measure Status Potential Contributiona
Community Care Service Initiatives – Community Intervention Teams
Four in place High
Community Care Service Initiatives – Rapid Access Clinics
One in place High
Community Care Service Initiatives – Out-of-Hours Service
90% coverage Low
Community Supports Basic services in place but scope for integration with hospital services.
Some
Chronic Disease Management Strategy in place High GP Access to Diagnostic Services Pilot completed. Alternatives
including using private provision being considered.
High
Primary Care Teams 120 teams in place out of a possible 530 teams.
High
Integration of Primary Care and Hospital Services At development stage High Note: a High – Improvement possible on a larger scale Some – Room for some improvement Low – Service well established
Service Initiatives
2.23 A set of initiatives introduced from 2006 classified as the Winter Initiative has been adopted by the HSE with the aim of reducing waiting times in emergency departments. Appendix D outlines the initiative.

Emergency Department Performance 27
General Conclusions
2.24 This Chapter seeks to bring together the overall findings of the examination by rating service performance and the scope for efficiency gains.
2.25 The results suggest considerable variation in the direct cost of treating persons who present at emergency departments. However, it is also clear that the HSE needs to refine its costing systems to more accurately record the resources used in emergency medicine and investigate the major variations highlighted in this Chapter.
2.26 Considerable differences were found in the extent to which resources, key to the effective functioning of emergency departments, are available on a timely basis
23 of the 33 had less than satisfactory access to senior decision makers
Access by emergency departments to consultations with consultants and medical staff of other specialities was rated as unsatisfactory in most departments
Four emergency departments have unsatisfactory access to diagnostic support and in most cases there was considerable scope for improvement
Waiting times for beds following decisions to admit was unsatisfactorily long in most cases.
2.27 Indicators of the quality of care are limited. HIQA intends developing and piloting a set of indicators by 2010. When developed the feedback should help emergency departments and the HSE to better manage the service provided. Overall, there is a need to examine how qualitative indicators can best be combined with other performance measures to give a comprehensive balanced scorecard for emergency departments. In general, the results would suggest that, as well as reviewing the national configuration of emergency medicine, it would be useful to develop and implement a set of joined-up local actions designed to
improve internal capacity within departments
improve in-hospital coordination
identify practical local actions to divert patients to alternative appropriate care settings.


Annex A Rating of Emergency Department Performance Figure 2.2 assesses the performance of emergency departments under five main headings
the emergency department cost of each attendance
the department’s decision capacity
its access to on-site consultants for key specialties and the availability of those consultants
the availability and access to diagnostic support
the length of time a patient waits from the decision to admit to the allocation of a bed.
The basis of that assessment is set out in the sections that follow.
Emergency Department Cost per Attendance
The cost per attendance is based on the direct cost of each emergency department. It does not include costs for services provided to the department by the wider hospital including diagnostics and specialty consultations. The cost reported is the cost of the emergency department as configured in the hospital. While a more refined basis of costing would be preferable the figures reported are adequate to initiate a consideration of relative costs.
Decision Capacity
Decision capacity refers to the extent to which consultants or specialist registrars (4/5) in emergency medicine are available to the emergency department – on-site and off-site. Decision capacity was rated by reference to the factors set out in Figure A.1.
Figure A.1 Decision Capacity Rating
Rating Minimum Standard
Satisfactory at least 24 hour cover for week days and at least part time off-site cover for weekends or
seven day cover for 12 hours and at least part time off -site cover
Scope to Improve not meeting satisfactory criteria but
at least 24 hour cover for weekdays without off -site weekend cover or
5 day cover for 12 hours with full off- site cover or
9 – 5 cover for seven days with full off- site cover
Inadequate lower levels of cover
Specialty Access and Availability
The rating in relation to specialty access and availability was based on the level of access by the emergency department to consultants and medical staff from seven key specialities within the wider hospital and the timeliness of the response of those consulted. The specialities considered were general surgery, general medicine, obstetrics, paediatrics, cardiology, orthopaedics and psychiatry. Access to obstetrics and paediatrics was rated in hospitals providing these services only. Anaesthetics and critical care were not covered in the survey. The basis of the rating is set out in Figure A.2.

30 Emergency Departments
Figure A.2 Rating of Specialty Access and Availability
Rating Minimum Standard
Satisfactory Cardiology - Consultant, Specialist Registrar or Registrar available within one hour
Other Specialties - Consultant, Specialist Registrar or Registrar available within at least four hours
Scope to Improve
Cardiology - Medical team member only available within one hour
Other Specialties - Consultant, Specialist Registrar or Registrar available within eight hours or medical team member available within four hours
Inadequate Any lower level of availability
Classification of speciality access and availability was calculated on the basis of assigning marks within each rating category suitably weighted within and between categories on the basis of the relative performance in response times and availability windows. The overall rating was calculated on the basis of the percentage of the total marks available.
Satisfactory (90 – 100%)
Scope to Improve (75 – 89%)
Inadequate (Less than 75%)
Diagnostics
The rating for diagnostics was based on the availability and response time for diagnostic services in the following eight diagnostics
all plain film x-rays
echocardiograms
CT scans
ultrasounds
Doppler monitoring
full blood tests
biochemistry tests
toxicology.
The basis of rating for blood tests, biochemistry, x-rays, CT scans and ultrasounds (Diagnostics A) is set out in Figure A.3.
Figure A.3 Rating of Diagnostics A
Rating Minimum Standard
Satisfactory 24/7 availability within two hours or
8am to 8pm availability within one hour
Scope to Improve 24/7 availability within two – four hours or
Weekday availability for at least eight hours with a response time of less than two hours
Inadequate Any lower level of availability

Emergency Department Performance 31
The rating for toxicology, Doppler monitoring and echocardiograms (Diagnostics B) was as set out in Figure A.4.
Figure A.4 Rating of Diagnostics B
Minimum Standard
Rating Toxicology Doppler Monitoring Echocardiograms
Satisfactory Availability for at least 12 hours seven days a week
with a response time of less than four hours
Availability for at least eight hours, seven
days a week
Availability for at least eight hours on five days a week
Scope to Improve
Availability for at least 12 hours seven days a week
with a response time of four to six hours
Availability for at least eight hours, five days
a week
Not applicable
Inadequate Any lower level of availability Any lower level of availability
Any lower level of availability
Classification of diagnostics within each rating was calculated on the basis of assigning marks suitably weighted within and between rating categories on the basis of the relative performance in response times and availability windows. The overall rating was calculated on the basis of the percentage of the total marks available.
Satisfactory (90 – 100%)
Scope to Improve (75 – 89%)
Inadequate (Less than 75%)
Bed Waiting Times
Bed waiting time covers the time a patient is waiting in the emergency department from the decision to admit to the time a bed is provided. The measurement is taken at 2pm each day. This is the only measure in use across all hospitals. Data on bed waiting times for the five- month period January to May 2009 was used to measure the percentage of patients which exceeded a six-hour waiting time. The rating was calculated on the basis of the standard in Figure A.5.
Figure A.5 Bed Waiting Time
Rating Standard
Satisfactory 0 – 10% waiting more than six hours
Scope to Improve 11 – 25% waiting more than six hours
Inadequate More than 25% waiting more than six hours


Annex B Quality Measures in Emergency Care Measurement is necessary to inform assessment, monitoring and improvement of the system with the ultimate aim of providing high quality, timely and cost effective care. However, it is not possible to develop a single measure to capture all performance elements. This is partly because improving one component of care can often impact on another and so it is vital to set any measures in the context of the whole system.
The general consensus is that high quality care consists of accurate diagnosis with appropriate treatment undertaken in a safe and timely manner, within a supportive and pleasant environment. Therefore, any measures of quality need to assess each of these dimensions.
When considering qualitative indicators it is important to take account of the available literature which indicates that a patient’s perception of high quality care and that of professionals may differ. Professionals focus more on treatment outcome whereas patients have a broader view including information availability, interpersonal reactions and environment.
The key factors that need to be addressed when setting qualitative measures are depicted graphically at Figure B.1.
Figure B.1 Components of a Balanced Measurement System
Domains
Primary Measures
Elements
Cost
Timeliness
Staff
User
Morbidity
Outcome
Safety
Satisfaction
Response
Delivery
Return to normality
Quality
Recovery
Mortality

34 Emergency Departments
Focus of Measurement
In systems with developed performance measurement, quality measures often address structures and processes rather than outcomes.
This is because outcomes are particularly difficult to assess in emergency care, often needing to be measured after completion of the patient episode and in a different location.
However, in principle it may be best to focus on appropriate high-level measures since if high quality safer care is achieved in a cost effective way it is irrelevant to the patient how that is done.
Principles of Quality Measurement
Certain principles of quality measurement include
Measures should be patient focused, in that they reflect their values and clinical need and are measured along the whole patient journey.
Measures should be timely – the ideal is to be able to measure in real time. The greater the delay between occurrence and measurement the less the likely impact on behaviour and, therefore, improvement in service delivery.
Measures should be defined so that they can be consistently measured and compared.
When measuring time it is important that the whole process is measured.
Measures should be balanced. The key balance is between the three domains of quality, timeliness and cost effectiveness.
Measures should be triangulated. If any item is measured in several ways then it adds validity and also reduces the risk of data manipulation.
Countermeasures should be in place i.e. measures that look for any adverse effects caused by improvement in a single area.
Use of Measurement
There are conflicting views on how measurement should be used to promote continuous improvement. There is a need to be vigilant, watching for undesired, unintended or dysfunctional results.
Benchmarking may mean that units achieving above the average become complacent and do not look to improve.
Targets may result in a culture of ‘hitting the target and missing the point’ whereby the target becomes the ultimate goal rather than a global improvement in the quality of care.
Fixed targets may provide initial impetus but then produce stagnation once the target is achieved.
Continuously advancing targets may lead to demoralisation (‘they keep moving the goalposts’).
An effective alternative to measurement may be to ask hospitals to demonstrate how they deliver high quality, timely and cost effective care by means of a ‘quality case’ rather than to impose measures. This concept of a quality case is developed from the safety cases used in industry, whereby an organisation has to demonstrate to the regulator that their operations are safe using defined principles rather than by achieving certain results.

3 Care in Emergency Departments
3.1 Reports commissioned by the Department and the HSE identified a number of key elements that would need to be in place to support efficient and effective running of emergency departments. This Chapter examines these elements seeking to establish, in particular
whether adequate diagnostic services were available to emergency departments
if senior decision makers in emergency departments were available during the normal working hours12 and the access to those decision makers and consultants generally
how identified infrastructure deficits have been addressed
monitoring of timeliness of care
what rapid access initiatives have been implemented within emergency departments
the state of development of streaming methods for patients presenting for treatment in emergency departments.
Diagnostic Services
Findings of Review Reports
Amongst the key recommendations relating to diagnostic services were
speeding up of tests
expediting test reporting
a dedicated radiology service for emergency departments
extension of the working day of the radiology department.
Availability of Diagnostic Services
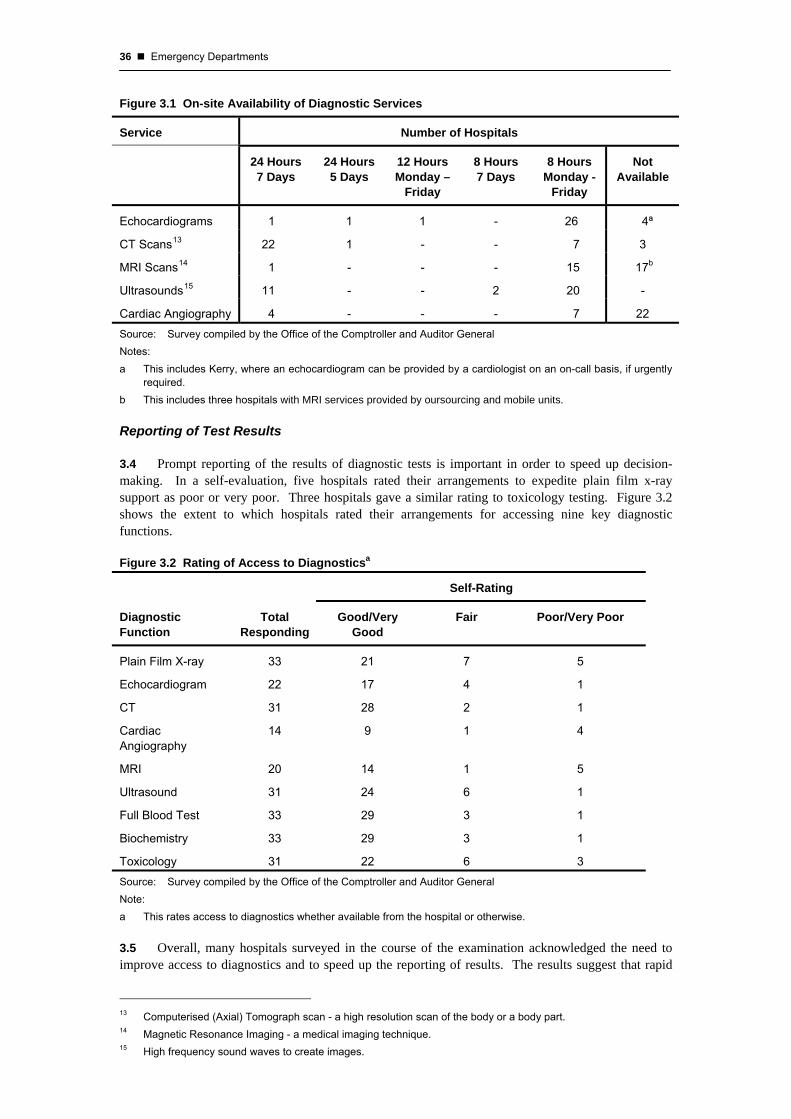
3.2 Diagnostic services are crucial to the care of patients both within the emergency department itself and the in-hospital system generally. Diagnostic services in Irish hospitals were traditionally geared towards inpatient services. As a result, delays could occur in receiving reports from the pathology and radiology service in respect of emergency department patients.
3.3 The examination set out to determine the extent of coverage of diagnostic services. Figure 3.1 outlines on-site availability of five key diagnostic services. Most emergency departments have reasonable access to laboratory services. 20 of the 33 hospitals have dedicated diagnostic services for emergency departments. Of the remaining hospitals, the lack of resources was cited as the main reason for non-provision. It is recognised that there may be alternative pathways to diagnostic facilities where these do not exist within hospitals. In particular, there can be indirect availability via mobile units and outsourcing to nearby private hospitals.
12 Normal working hours are the hours between 9am and 5pm, Monday to Friday.
36 Emergency Departments
Figure 3.1 On-site Availability of Diagnostic Services
Service Number of Hospitals
24 Hours 7 Days
24 Hours 5 Days
12 Hours Monday –
Friday
8 Hours 7 Days
8 Hours Monday -
Friday
Not Available
Echocardiograms 1 1 1 - 26 4ª
CT Scans13 22 1 - - 7 3
MRI Scans14 1 - - - 15 17b
Ultrasounds15 11 - - 2 20 -
Cardiac Angiography 4 - - - 7 22 Source: Survey compiled by the Office of the Comptroller and Auditor General Notes: a This includes Kerry, where an echocardiogram can be provided by a cardiologist on an on-call basis, if urgently
required. b This includes three hospitals with MRI services provided by oursourcing and mobile units.
Reporting of Test Results
3.4 Prompt reporting of the results of diagnostic tests is important in order to speed up decision-making. In a self-evaluation, five hospitals rated their arrangements to expedite plain film x-ray support as poor or very poor. Three hospitals gave a similar rating to toxicology testing. Figure 3.2 shows the extent to which hospitals rated their arrangements for accessing nine key diagnostic functions.
Figure 3.2 Rating of Access to Diagnosticsa
Self-Rating
Diagnostic Function
Total Responding
Good/Very Good
Fair Poor/Very Poor
Plain Film X-ray 33 21 7 5
Echocardiogram 22 17 4 1
CT 31 28 2 1
Cardiac Angiography
14 9 1 4
MRI 20 14 1 5
Ultrasound 31 24 6 1
Full Blood Test 33 29 3 1
Biochemistry 33 29 3 1
Toxicology 31 22 6 3 Source: Survey compiled by the Office of the Comptroller and Auditor General Note: a This rates access to diagnostics whether available from the hospital or otherwise.
3.5 Overall, many hospitals surveyed in the course of the examination acknowledged the need to improve access to diagnostics and to speed up the reporting of results. The results suggest that rapid
13 Computerised (Axial) Tomograph scan - a high resolution scan of the body or a body part. 14 Magnetic Resonance Imaging - a medical imaging technique. 15 High frequency sound waves to create images.

Care in Emergency Departments 37
and streamlined access to diagnostics could have a significant impact on patient care in emergency departments.
Response Time
3.6 The elapsed time from requesting the diagnostic test to providing the results to a senior decision maker responsible for the patient can impact on the quality of care. Figure 3.3 outlines the availability of diagnostics in the 33 hospitals surveyed and the elapsed time for the availability of diagnostic results to a senior decision maker.
Figure 3.3 Response Time For Diagnostic Servicesa – Availability and Response Time
Service Not
Available On-Site
Available On- Site
Waiting Time Under
4 Hours
Waiting Time Over 4 Hours
No Reply Given on
Waiting Time
Echocardiograms 4b 29 9 9 15
CT Scans 3 30 30 2 1
MRI Scans 17c 16 6 12 15
Ultrasounds - 33 26 7 -
Cardiac Angiography 22 11 8 3 22 Source: Survey compiled by the Office of the Comptroller and Auditor General Notes: a Although services may not be available on-site they are often received from other hospitals. The response time
statistics take account of this. b This includes Kerry, where an echocardiogram can be provided by a cardiologist on an on-call basis, if urgently
required. c This includes three hospitals with MRI services provided by outsourcing and mobile units.
3.7 22 hospitals do not have direct access to cardiac angiography despite the national incidence of cardiac disease16 and of those that did have services available nine hospitals had patients waiting over four hours for an echocardiogram, of which the waiting time in six of these was twelve hours or more. Echocardiograms facilities are not available in three hospitals.
3.8 Seven emergency departments reported a response time of over four hours for ultrasound scans. In addition, while seventeen emergency departments have no MRI17 and three hospitals failed to reply, those that can access this service wait over four hours in 12 hospitals. More than 60% of emergency departments have a waiting time of twelve hours or more for MRI scan results.
3.9 One of the major constraints to improving services is the restricted working arrangements that apply to Allied Health Professionals working in the diagnostic disciplines. Diagnostic services remain limited at night and at weekends.18
3.10 While there are on call arrangements to cover night time need, invoking those arrangements has a knock-on effect on normal rostering which impacts on service effectiveness. In the course of the examination consultants outlined their reluctance to order a scan after midnight due to the fact that staff called up would not be available to perform their duties as rostered the next day.
16 Ireland has above average death rates from diseases of the circulatory system (0-64yrs), as compared with the
original EU 15. In 2007, 21% of all deaths in those under 65 were as a result of coronary heart disease, stroke or other diseases of the circulatory system. Source: WHO, Health For All database 2007.
17 MRI services may be available in these cases from the larger hospitals within the network or through outsourcing to private hospitals in the area.
18 The HSE is currently in negotiation with staff representatives regarding more flexible working arrangements including an extended working day and the optimal use of facilities.

38 Emergency Departments
Senior Decision Makers
Findings of Review Reports
A fundamental element in caring for emergency patients is the availability on-site of emergency department senior decision makers to ensure that appropriate diagnostic investigations are requested and clinical decisions are made in a timely manner. Recent reports have drawn attention to shortages in this area.
3.11 The examination assessed the availability of Senior Decision Makers (SDMs) in emergency departments. For the purpose of the examination, SDMs in emergency departments include Consultants in Emergency Medicine or Specialist Registrars (4/5).19 Figure 3.4 outlines the extent of access to SDMs in the 33 emergency departments surveyed.
Figure 3.4 Access to Senior Decision Makers
Extent of Coverage Number of Hospitals
24 Hours – 7 Days 1
12 Hours – 7 Days 4
12 Hours – Monday to Friday 2
8 to 9 Hours – Monday to Friday and 12 Hour Cover at Weekends 2
8 to 9 Hours – Monday to Friday 16
Sessional Coverª Only 8 Source: Survey compiled by the Office of the Comptroller and Auditor General Note: a Sessions are for time periods of three hours.
3.12 The restricted availability of key SDMs contributes to delays in the patient journey and to prolonged waits within the system. This militates against best practice patient care and service delivery.
3.13 According to the HSE, there were 56 Consultants in Emergency Medicine in August 2009 working in the 33 emergency departments. 28 of these are available on a whole time basis in the eight major hospitals. Consequently, the other 28 cover 25 hospitals. The Royal College of Surgeons in Ireland (RCSI) are of the view that because emergency medicine is a specialised discipline, all emergency departments should be under the direction and leadership of a Consultant in Emergency Medicine as other specialists would not necessarily have a corresponding required range of training and experience.
19 Specialist Registrars (4/5) are doctors who have completed their general professional training and obtained their
higher diploma and who are in fourth or final year of the higher specialist training scheme in emergency medicine.

Care in Emergency Departments 39
Impact of Medical Consultants’ Contract 2008
The recently negotiated medical consultants’ contract has been taken up by about 70% of all consultants in emergency medicine. Consultants will provide service under three types of contract. These arrangements make available an extra four hours of consultant time. Consultant delivery should improve decision-making in emergency departments and the additional four-hour coverage by hospital consultants generally should help to reduce waiting times in emergency departments. Under the new arrangements each consultant will report to a clinical director. The clinical directorate model should ensure that service standards and governance requirements are met.
The new consultants’ contract provides for consultants to be rostered to work on-site for up to five hours on Saturday, Sunday and public holidays. It also introduces the concept of team working, whereby the consultant provides diagnosis, treatment and care to patients under the care of other consultants on his/her team and vice versa. This has the potential to enable consultants to treat or discharge all patients within the speciality area, particularly at weekends and public holidays, which should facilitate more timely discharge of patients and speedier admissions.
Out-of-Hours Access to SDMs in Emergency Medicine
3.14 As part of this examination access to Emergency Medicine SDMs off-site20 and out-of-hours21 was also reviewed. Figure 3.5 sets out the level of access off-site and out-of-hours of emergency departments of SDMs categorised by level of cover.
Figure 3.5 Level of Access of Emergency Departments to Senior Decision Makers – Off-Site/Out-of-Hours
Time Period Number of Hospitals
Full Cover 21
Limited Cover 2
No Cover 8
No Reply 2 Source: Survey compiled by the Office of the Comptroller and Auditor General
Access to Admitting Specialist Consultants
3.15 The nature of particular emergency cases may demand prompt access to admitting Specialist Consultants.22 As part of the examination survey emergency department teams were asked to rate access to a number of specialties. Figure 3.6 shows the extent to which hospitals rated their access by specialty.
20 Off-site coverage refers to a consultant who is on-call and available to the hospital within a certain timeframe. 21 In general, out-of-hours work refers to work performed outside the hours of 9am to 5pm, Monday to Friday.
Under the new consultants’ contract this will be the period 8pm to 8am and the time outside a scheduled five hours at weekends.
22 A Specialist Consultant is a consultant who has completed training in any speciality recognised by the Irish Medical Council and who works within the hospital. A specialist consultant interacts with emergency departments by confirming diagnoses and admitting patients to their area of care.

40 Emergency Departments
Figure 3.6 Rating of Access to Specialist Consultationsa
0 3 6 9 12 15 18 21 24 27 30 33
Medicine for the Elderly
Psychiatry
Orthopaedics
Cardiology
General Medicine
General Surgery
No. of Hospitals
Access Rated Very Good to Fair Access Rated Poor/Very Poor
Note: a For the remainder, these specialist consultations were not available.
3.16 Figure 3.6 shows that access to general medicine and general surgery was rated as poor or very poor in two hospitals. Access to medicine for the elderly and psychiatry consultations was not available in seven hospitals and was rated as poor or very poor in two emergency departments for medicine for the elderly and in three cases for psychiatric consultations. Orthopaedic consultations were available in 24 emergency departments but four rated access as poor or very poor. Cardiology was available in 23 hospitals of which one had poor or very poor access.
3.17 Figure 3.7 shows the extent to which patients in emergency departments are reviewed by junior doctors in certain specialties. It also shows the number of hospitals where the waiting time exceeds four hours and a junior doctor performs the review.
Figure 3.7 Level of Review and Waiting Times
Speciality
Number of Hospitals
Providing the Specialityª
Review at Senior Levelb
Waiting Times for Review at
Senior Level Exceeds Four
Hours
Review at Junior Levelc
Waiting Time for Review at Junior Level
Exceeds Four Hours
General Surgery 32 17 2 15 2
General Medicine 32 19 1 13 0
Cardiology 21 18 2 3 0
Orthopaedics 17 6 1 11 3
Psychiatry 21 14 1 7 5
Medicine for the Elderly
24 15 1 9 0
Source: Survey compiled by the Office of the Comptroller and Auditor General Notes: a These only include valid replies and also exclude phone consultations. b Senior level denotes doctors who are consultants, specialist registrars or registrars. c Junior level reviews are carried out by doctors who are not listed in note b.

Care in Emergency Departments 41
General Overview – Access to Specialist Consultations
3.18 Care for the elderly is a key demand in most emergency departments. Of the 33 acute hospitals reviewed, over one in five hospitals do not have specialists to advise them in regard to medicine for the elderly. In nine hospitals providing medicine for the elderly when an opinion is available, it is usually from a junior team member.
3.19 Nine acute hospitals do not have an admitting specialist consultant in orthopaedics. Where this service is available, four emergency departments described it as poor or very poor and nine as fair, with 11 emergency departments relying on junior team members for any specialist advice required. In four emergency departments, there was a waiting time of over four hours for a review.
3.20 Although all emergency departments have a general surgery service, two describe access as poor. Fifteen emergency departments have specialist opinions coming from junior staff. In two emergency departments, patients wait over four hours to be seen by a junior doctor.
3.21 Seven emergency departments do not have direct access to psychiatry specialists. Furthermore, when this service is available emergency departments describe access as poor or very poor in three cases and fair in 12 cases. In seven emergency departments, psychiatry specialists’ opinions were given by a junior team member and in five of these hospitals patients generally had to wait over four hours for a psychiatric opinion. In four of these hospitals, some patients waited over a day for review.
3.22 During visits to hospitals as part of the examination, some Consultants in Emergency Medicine expressed dissatisfaction with the level of communication with locally based psychiatrists and the availability of psychiatrists to carry out timely assessment of patients in emergency departments.
Infrastructure
Findings of Review Reports
The Task Force Report found that infrastructure within emergency departments was inadequate at a number of sites. It found that emergency departments in seven of the 18 hospitals visited by them were “not fit for purpose”.
3.23 Emergency departments with poor infrastructure can find it challenging to achieve any degree of improvement in operational efficiency. The status of measures to address deficiencies in these seven emergency departments at October 2009 is outlined in Figure 3.8. Of the seven emergency departments found by the Task Force Report to be “not fit for purpose”, a new emergency department has opened in the Mercy University Hospital and redevelopment work is underway in the other six sites.

42 Emergency Departments
Figure 3.8 Hospital Project Status
Hospitals Original Issue Capital Project Project Status
Mercy The physical capacity was found to be totally inadequate.
New Department Completed in early 2007 and opened in December 2008
Drogheda The emergency department was found to be totally unfit for purpose.
New Department Construction completed
Mater The overall infrastructure and emergency department space was deemed inadequate.
Extension (interim)
New Department
Construction of extension completed, and operational since April 2009
New emergency department at planning
Letterkenny General
The emergency department space was found to be inappropriate and insufficient to accommodate and process presenting patient volumes.
New Department (as part of a larger development)
New emergency department is under construction
Sligo General
The hospital had a Medical Assessment Unit in place but it was not working at full capacity. Reconfiguration proposals were also highlighted as a requirement to improve patient flow and streaming.
New Medical Assessment Unit
Construction completed
Wexford General
The emergency department was deemed not fit for purpose.
New Department At Design stage
Cavan General
The inadequacies of the infrastructure of the emergency department were highlighted and more appropriate accommodation for patients was required.
New Medical Assessment Unit
Under Construction. New emergency department being planned
Source: HSE
3.24 When benchmarked against IAEM/International23 recommendations for best practice in the area of emergency department facilities, 25 hospitals stated that they were not compliant. Of particular concern was that
resuscitation areas24 were rated as poor/very poor in 12 hospitals
examination areas in 12 of the hospitals and facilities for staff in 18 hospitals were rated as poor or very poor
almost two out of three hospitals did not provide separate paediatric waiting rooms, facilities for the elderly and nurse practitioner areas.
23 Further information on the recommendations can be found at www.iaem.ie and www.nhs.uk 24 A resuscitation area is a clinical area within the emergency department that has equipment and drugs to faciliate
rapid resuscitation of patients.

Care in Emergency Departments 43
Monitoring Timeliness of Care
Findings of Review Reports
Waiting time is useful as an overall aggregate indicator of performance delivery and can be valuable in helping to assess aspects of emergency department services.
3.25 Length of stay in emergency departments is influenced by medical considerations including the time necessary to observe the patient’s evolving condition. Most stakeholders, including management and consultants accept that the most reliable overall metric is the time-in/time-out measurement. According to the survey 21 hospitals reported having this in place.
3.26 Reducing waiting times is a government priority. The examination found that at national level the only measurements relating to emergency departments uniformly reported were total attendance and time from decision to admit to acquiring a bed.
3.27 While those were the only universal metrics in individual hospitals a range of waiting times were being measured and at least 17 such metrics were reported in the survey of hospitals. The examination found that 18 hospitals were measuring waiting time from time of registration to triage, 15 were measuring triage to assessment and 12 were measuring waiting time from treatment to decision to admit. In addition, ten hospitals were measuring waiting time from assessment to treatment. These are set out in Figure 3.9.
Figure 3.9 Other Waiting Timeª Measurement by Hospital
0 3 6 9 12 15 18 21 24 27 30 33
Waiting time from treatment to decision to admit
Waiting time from assessment to treatment
Waiting time from triage to assessment
Waiting time from registration to triage
No. of Hospitals
Source: Survey compiled by the Office of the Comptroller and Auditor General Note: a This figure only includes types of waiting time that were measured by ten or more hospitals.
3.28 Many emergency departments do not capture details of time and milestones electronically. Electronic recording could improve the capacity of hospitals to analyse emergency department operations.

44 Emergency Departments
Consistency of Waiting Times Reported
3.29 The overall consistency of data collected and reported at national level needs to be improved. Based on its analysis, the HIQA expressed reservations about the quality and the accuracy of the data. In addition, internal audit work at Waterford Regional Hospital and a review by medical consultants based in the Mater University Hospital suggest that there is a need for more accurate definitions. Different interpretations of HSE definitions were being applied to population fields25 and measurement stages thereby affecting overall consistency and making it difficult for meaningful hospital comparisons and accurate tracking of improvements.
Mater University Hospital Statistics
The data consistency issue is highlighted in the contrast between local and national reporting in respect of the Mater University Hospital. In this respect, the HSE figures for emergency department waiting times appeared to be consistently under-reported. Over eight consecutive weeks, data on the number of patients waiting in the emergency department recorded by the Mater University Hospital was reviewed and significant differences were found. The HSE has acknowledged this problem and is undertaking an audit to assess the reasons. A contributory factor may be that the HSE excludes patients in the admission lounge and those on telemetryª from their numbers of trolley waits.
Source: Presentation document at College of Emergency Medicine Scientific Conference May 2008 Note: a Telemetry is used to monitor heart rhythms on a continous basis.
Recent Developments
3.30 The HSE acknowledges that the focus for performance measurement must move from analysis of waiting numbers to time spent waiting. The HSE has stated that under the National Service Plan 2009 it has committed to providing a Patient Time Indicator. This will involve gathering information on the total time that patients experience in the emergency department from the time they register to the time they leave the emergency department. This measure has a number of advantages as it measures all the steps in the patient’s journey and not just one part of the journey (from decision to admit to admission) and also allows for measurement of the experience of all patients who attend emergency departments including those not admitted, which have not been previously systematically collected. By August 2009, 11 hospitals were collecting this information electronically and the remainder should have systems in place by 2010. The HSE is currently undertaking a project to provide all emergency departments with an information system solution to collect the information and, in the interim, hospitals that cannot yet provide the information are participating in a daily sampling exercise.
Admission Timeliness
3.31 Figure 3.10 sets out over different timeframes the percentage of patients awaiting admission following the decision to admit in the period January to May 2009 compared with the corresponding months in 2008.
25 Population fields are the categories that different patient groups can be included in, in order to have data that
when measured is accurate, uniform and reliable.

Care in Emergency Departments 45
Figure 3.10 Percentage of Patients Awaiting Admission over Different Timeframes
Timeframe January to May 2008
January to May 2009
Actual % Cumulative % Actual % Cumulative %
Less than 6 hours 32 32 28 28
6 to 12 hours 27 59 26 54
12 to 24 hours 34 93 38 92
More than 24 hours 7 100 8 100 Source: Compiled from HSE data of patients waiting for admission at 2pm
3.32 Figure 3.10 suggests that the overall average waiting time for admission in excess of 12 hours increased from 41% to 46% in the January to May 2009 period compared to the same period in 2008. The percentage of these patients waiting more than 24 hours increased marginally from 7% to 8% over the two periods.
Admission Targets
In January 2006, the HSE introduced a target that no patient should be waiting for a hospital bed for more than 24 hours after the decision to admit. Analysis in early 2008 by HIQA of publicly available data suggests that a number of hospitals regularly failed to meet this target.
Subsequently, the Task Force Report recommended that a target of 12 hours from the decision to admit should be set but with the ultimate objective of a total waiting time target of six hours from arrival to discharge from any emergency department. In October 2007, a maximum 12-hour target was introduced by the HSE and in January 2009, a total waiting time target of six hours was set from the registration of the patient in the emergency department to admission or discharge.
Rapid Access Initiatives
Findings of Review Reports
Most reports on the reform of emergency departments agreed on the need to increase rapid access to hospital services. Rapid access initiatives allow for quicker access to hospital services for patients, increasing the efficiency and speed of the assessment process.
3.33 Rapid access initiatives that have been developed include fast track clinics, medical registrars rostered to the emergency department, same-day endoscopies, dedicated diagnostics for emergency departments and the introduction of Advanced Nurse Practitioners. The main characteristics of these initiatives are outlined in Figure 3.11.

46 Emergency Departments
Figure 3.11 Rapid Access Initiatives
Initiative Description Intended Effect
Fast Track Clinics
Dedicated slots are reserved in regular outpatient clinics specifically for the use of emergency departments and/or GPs requiring an urgent specialist opinion.
The result can be either a rapid discharge from the
emergency department as the patient will be seen by a specialist within the week or
the prevention of attendance of the patient in the emergency department in the first place as the GP can access the required opinion via the emergency clinic service.
Medical Registrars
Medical registrars are doctors training to be medical specialists working as part of a team under a medical consultant, e.g. cardiology, respiratory medicine.
The advantage of their presence in the emergency department or rapid availability on demand is to prevent delays when requesting specialist advice for patients.
Same Day Endoscopies
Endoscopies are diagnostic examinations of the gastrointestinal tract.
Rapid availability allows for the diagnosis and early management of many diseases.
Dedicated Diagnostics
Dedicated Diagnostics can be dedicated slots in the
radiology unit an ability to fast track certain
blood tests point of care testing such as
arterial blood gas sampling which could be analysed in the emergency department itself.
Dedicated Diagnostics can be rapid access to assessment and
speedier results prevention of delays in care or
discharge.
Advanced Nurse Practitioners
These are senior clinical nurses who have undergone advanced clinical training in emergency medicine and who can work independently in the emergency department within the context of the multi-disciplinary team.
Advanced nurse practitioners working in emergency departments can provide for the efficient management and effective flow of patients especially less urgent cases and care of the elderly.
3.34 Figure 3.12 sets out the number of hospitals, in each network area26 that has introduced these measures.
26 A hospital network is a group of hospitals in one geographic area under the direct control of one manager.

Care in Emergency Departments 47
Figure 3.12 Implementation of Rapid Access Initiatives
Network Area No. of
Hospitals Fast
Track Clinics
Medical Registrarsa
Same Day Endoscopies
Dedicated Diagnosticsb
Advanced Nurse
Practitionersc
Dublin North 3 3 2 3 3 3
Dublin Midlands 5 3 2 - 4 1
Dublin South 3 3 3 3 2 2
North East 4 - 2 3 2 1
West /NorthWest 6 - 3 1 2 -
Mid West 4 1 1 - 1 -
South 4 3 3 1 3 2
South East 4 2 1 1 3 3
National Total 33 15 17 12 20 12 Source: Survey compiled by the Office of the Comptroller and Auditor General Notes: a Medical Registrars rostered only to the emergency department. b Dedicated diagnostics available to the emergency department. c Advanced Nurse Practitioners in Cardiology/Emergency Medicine available within the emergency department.
3.35 There is considerable variability across hospitals in the implementation of rapid access initiatives. Some areas have almost 100% implementation rates whereas others have not introduced any of these measures. Since they appear to have the potential of providing quicker access to diagnostics, treatment and reducing waiting times in the emergency department it would be desirable to evaluate their contribution to date and to review the scope for further implementation in the light of local circumstances.
3.36 The Health Strategy (2001) envisaged that Advanced Nurse Practitioners would be appointed to emergency departments. In April 2009, there were 31 Advanced Nurse Practitioners in place.27 These specialist nurses have the potential to enhance the speed and quality of care in the emergency departments. Advanced Nurse Practitioners (ANPs) can provide
fast-track systems for minor injuries and, therefore, reduce waiting time
specialist nursing care in cases of heart failure, chronic obstructive pulmonary disease and deep vein thrombosis and can have an effect on hospital admissions
improved continuity and consistency of care.
3.37 Currently, ANPs report to nursing management. In the context of clinical directorates, it may be useful to review their reporting lines so as to allow them to play a fuller role within medical teams.
Streaming of Emergency Cases
Findings of Review Reports
Quicker classification of patients and their streaming by category whether within emergency departments or out of emergency departments can ensure that bottlenecks are avoided. This holds out the prospect of improving the patient’s journey experience and of ensuring that minor cases are quickly treated and do not block up waiting areas.
27 These figures were supplied by National Council for the Professional Development of Nursing and Midwifery.

48 Emergency Departments
3.38 According to the HSE, 12 hospitals operate minor injury clinics. These clinics are dedicated areas in or next to the emergency department that are specifically designed for the separate streaming and treatment of patients with minor injuries and illnesses. During the visits to selected hospitals as part of the examination, consultants in emergency medicine expressed a view that while minor injury clinics enable prompt and more efficient treatment of cases they have little impact on overall waiting times for complex cases.
3.39 In May 2005, an audit by the Population Health Division of the HSE of triage Category 4 and 528 emergency attendances in HSE –Eastern Region found that waiting times for patients with minor injuries were not excessive. Initiatives to divert this group from attending the emergency departments to other care sources such as out-of-hours services, to GPs with access to diagnostic facilities or to stand alone minor injury units had limited success as a perception remained among this group of a need to attend the emergency departments for treatment.
3.40 The survey of hospitals found that a range of streaming initiatives were found to be in operation in the different hospitals. These are outlined in Figure 3.13.
Figure 3.13 Streaming of Patients
Streaming Initiative Number of Hospitals with Availability
Clinics
Chest Pain Clinics 9
Special Units
Acute Medical Units (AMU) 5
Medical Assessment Units (MAU) 8
Acute Medical Admission Units (AMAU) 6
Clinical Decision Units (CDU) 6
Other Streaming Methods
GP Direct Access to Endoscopies 17 Source: Survey compiled by the Office of the Comptroller and Auditor General
3.41 17 hospitals of the 33 examined have at least one type of assessment or decision unit. 17 hospitals also have GP direct access to endoscopies. There may be scope to examine the potential contribution of specific initiatives with a view to expanding their use in appropriate circumstances.
28 Attenders classified under the Category 4 and 5 are deemed non urgent or standard under the Manchester
triage system.

Care in Emergency Departments 49
For the purpose of this examination Special Units are classified as
AMUs treat patients referred for urgent medical assessment and/or admission by providing rapid assessment, diagnosis and treatment of acute medically ill patients referred from GPs, the emergency department and the hospital’s outpatient department
MAUs are designated hospital wards that are specially staffed and equipped to receive medical patients for assessment, care and treatment for a designated period prior to transfer to medical wards or home, if appropriate
AMAUs - The primary aim of the unit is to proactively facilitate early diagnosis, treatment and discharge of acute medical patients admitted through the emergency department
CDUs – These units allow admission of patients requiring investigation and treatment to agreed protocols and within agreed time intervals.
3.42 Two examples of the operation of assessment units are set out in the Annex to this Chapter.

50 Emergency Departments
Conclusions
3.43 Currently, the only uniform and centrally collected measurement relating to emergency departments are the total attendance and the time from the decision to admit to acquiring a bed. Individual hospitals also use a variety of other measurements of waiting times for internal management purposes but these are not uniform across the system. With effect from January 2009 the HSE has introduced a six-hour target waiting time from the patient’s arrival in the emergency department to admission or discharge.
3.44 The introduction of a standard set of performance measures would help to drive performance and enable comparability across hospitals. Reporting of achievement should combine assessments of timeliness with indicators of clinical outcome, patient safety, patient satisfaction and cost in order to give a balanced indication of performance achievement.
3.45 A comparison of the period January to May 2008 with the same five-month period in 2009 indicates that there has been an increase in the percentage of patients waiting for twelve hours or more for admission from the emergency department.
3.46 There is considerable scope to improve the timeliness of emergency care and the quality of patient experience through better access to diagnostic services and availability of senior decision makers. In addition, it would be worth evaluating the contribution of rapid access initiatives which hold the prospect of allowing quicker access to diagnostics and treatment.
3.47 The streaming of emergency cases and the routing of appropriate cases through special clinics and units has the potential to improve emergency department efficiency and effectiveness. While minor injury clinics should improve treatment in such cases they are unlikely to have to a significant impact on waiting times in complex cases.
3.48 In the medium term, there is a need to establish standards and norms of practice in areas like
the availability of diagnostic services
the organisation of work in the diagnostic disciplines
the availability of key decision makers
the type and timing of service provision by departments.
3.49 The new medical consultants’ contract arrangements with revised working hours should help to improve the availability of decision makers in emergency departments and reduce patient waiting times. In this connection, the HSE needs to monitor the operation of departments to ensure that the service gain envisaged in the contract is achieved.
3.50 Some good practice opportunities which might be explored more widely are outlined in Annex A.
Annex A Good Practice Opportunities Examples of good practice opportunities, noted in the course of the examination, which may be capable of being adopted were noted in how heart care is managed at St. Vincent’s University Hospital and in the operation of medical assessment units at
St. Luke’s General Hospital, Kilkenny
St. James’s Hospital.
Heart Care - St Vincent’s University Hospital
An example of good chronic disease care in practice was the Heart Failure Community Care Unit set up by the Cardiology team in St. Vincent’s University Hospital. This has been running for the past eight years and involves early diagnosis, treatment and review by a consultant cardiologist. The aim is to discharge patients as early as possible with family support.
Patients are seen and treated in an outpatient clinic in St. Michael’s Hospital, Dun Laoghaire. They are educated to recognise the signs of deterioration and to present early to the clinic for review and assessment. In addition, the Unit’s Advanced Nurse Practitioner makes home visits in certain cases. While studies show that 40% of patients who present to emergency departments with congestive cardiac failure will present again within a month, this Unit has reported reducing this to just 20%.
Medical Assessment Unit - St Luke’s General Hospital, Kilkenny
St. Luke’s Hospital in Kilkenny introduced a Medical Assessment Unit (MAU) in 2000. Prior to that it averaged 20 to 40 beds in corridors on a daily basis. The unit operates on a 12-hour day between 8am to 8pm with the last patient access at 7pm to facilitate time for the patients’ transfer to other wards.
Previously, the local practice had been that GPs admitted patients directly into hospital beds. Now they contact the bed manager who accepts medical patients into the MAU. Immediately on arrival, their discharge plan is considered, identifying whether the next likely move is home, the hospital or transfer elsewhere. The hospital also received 34 additional beds at the time of introduction, which greatly facilitated the unit.
The 12-hour operational span has positive features. The 8pm deadline ensures that timely decisions are made. On the input side GPs hold off referring patients to the MAU until 8am where the nature of the case allows for this. As a result of the limited time window staff have to make decisions and progress care as the unit closes at 8pm. It is considered that moving to a 24-hour service would create a risk that the unit would become a ward. In practice, over the past four years only a small number of patients have had to be referred elsewhere for interim care until a bed was available.
Doctors working under close supervision of a consultant are assigned to the MAU for the full 12-hour period. A critical success factor is the expansion of the work practices of senior clinical nurses to take on greater clinical responsibility, while working to hospital protocols for certain disease patterns such as deep vein thrombosis and chest pain. Success factors in the case of these units include
easy access to diagnostics and radiology
supportive clinical leadership from the supervising consultant and other specialist consultants in the hospital
good communication between the hospital general manager and the relevant consultant.
52 Emergency Departments
Acute Medical Assessment Unit - St James’s Hospital
St. James Hospital is the largest hospital in the country with a catchment area of 300,000 to 400,000 patients and over 147 consultants. Their Acute Medical Admissions Unit (AMAU) had 6,000 attendances during 2007. Their outcome data shows a decrease in mortality from 12.7% in 2002 to 6.8% in 2007. The average length of stay has decreased from three days to two days. Studies have shown that this is equivalent to generating an extra 15 beds per day per annum.
The unit comprises two wards, 60 nurses and ten support staff. The unit centralises medical patients on arrival into the hospital into one area. The unit is located next to the Radiology Unit and emergency department. One of its strengths is that all nursing staff are skilled in the care of acutely ill patients as opposed to having several acutely ill patients competing for care on wards of 20 or 30 patients. In addition, the ward has its own dedicated Senior House Officer with a Special Registrar covering just the AMAU and medical emergencies in the emergency department. Physiotherapy, occupational therapy, social workers, speech and language therapists, pharmacy and administrative staff support the unit.

4 Influence of Wider Hospital Organisation 4.1 363,000 inpatient cases in 2008 were treated on an emergency basis. 283,000 of these cases were admitted through emergency departments. The balance was emergency admissions that were referred through outpatient clinics or admitted directly to wards.
4.2 The quality of the interaction between the emergency department and the rest of the hospital and, in turn, between the hospital and community care services impacts on the effectiveness of overall care. How the hospital manages its capacity pressures is central to the optimisation of emergency care. This chapter reviews the wider hospital administration insofar as it impacts on the effectiveness of emergency departments looking, in particular, at
the scope to process patient discharges in a more planned way
methods to improve delayed discharge29 management
bed capacity and use
the scope for improving bed management
the impact of patient flow management issues
how transport arrangements impact on the service.
Discharge Planning
Findings of Review Reports
The Tribal Secta Report noted that failure to introduce planning for discharges, beginning with admission, could lead to extended lengths of stay, confusion for staff and patients and more pressure on hospital beds.
4.3 While it is recognised that each emergency case varies, ideally the process of planning for discharging an inpatient should commence upon admission and be based on norms for the presenting condition. The aim would be to set a target based on the standard time required for treatment and recovery from the condition. This would provide a planning starting point which would need to be reviewed as treatment progressed. Active management of variations in patient discharge is important as these can be unpredictable and prolonged lengths of stay affect the whole hospital system, especially bed management and the patient experience.
4.4 Some hospitals have adopted a system of discharge planning. The survey carried out as part of this examination found that discharge dates formulated within 24 hours of admission were in place in twelve hospitals. The examination also found that 29 hospitals had discharge guidelines.
4.5 When discharge planning is in place, it can reduce lengths of stay (LOS) for patients. For example nine of the twelve hospitals that formulated discharge dates within 24 hours of admission during the month of August 2008 had lower than average lengths of stay for patients discharged in that month.
29 Delayed discharge refers to patients whose treatment has concluded but who cannot or will not leave the
hospital for other reasons.

54 Emergency Departments
Findings of Review Reports
The Tribal Secta report concluded that there was not consistent application of national admission and discharge advice, contributing to unnecessary variability in patient management within and across hospitals.
The Bed Capacity Review report found that in Ireland
there was no discharge planning in place for 60% of in-patients
there was no estimated date of discharge for 83% of in-patients
surgery on the day of admission rates were below international norms and there was the potential to save up to 140,000 bed days each year
the rates of day surgery in substitution for in-patient surgery was 12% below the international norm.
4.6 The Winter Initiative Team30 did some work related to patterns of discharging across the week. A summary of their findings is
the day of the week is an important determinant of admission and discharge patterns
the pattern appears to be that there is a significant increase in discharge rates on Fridays, followed by more admissions than discharges on Saturday, Sunday and Monday
this pattern correlates with admission wait figures which are typically lowest from Friday to Sunday and particularly high on Tuesday to Thursday when bed availability is limited
this pattern is consistent across time. It is typical across most hospitals but not universal
there is evidence of elective admissions from Friday to Sunday. It is possible that these elective admissions limit bed availability for peak emergency weekday admissions (particularly Tuesday to Thursday)
GP referrals decrease significantly over the weekend and ambulance arrivals increase over the weekend. There may be an association between these two. It is not possible to test whether lack of availability of GP out-of-hours services leads to higher attendance rates.
4.7 More regular discharging of patients across the week can help to reduce pressure on bed availability. The discharging of patients each day during the week is reported to be in place in 91% of cases. Based on the latest HIPE statistics31 for 2006 and 2007 the pattern of discharges continues to be heavily skewed towards weekdays, and in particular, Fridays as outlined in Figure 4.1.
30 Further information on the Winter Initiative is contained in Appendix D. 31 These statistics are compiled by the Economic and Social Research Institute and record the discharges from
acute public hospitals participating in the Hospital Inpatient Enquiry (HIPE) scheme.

Influence of Wider Hospital Organisation 55
Figure 4.1 Discharge Numbers by Day of the Week in 2006 and 2007
45000
55000
65000
75000
85000
95000
105000
115000
125000
Monda
y
Tuesd
ay
Wed
nesd
ay
Thursd
ayFrid
ay
Saturda
y
Sunda
y
2007 2006
Source: Annual Report by ESRI - Activity in Acute Public Hospitals in Ireland 2006 and 2007
4.8 Since attendance at emergency departments increases in the afternoon, planning of discharge before the daily peak is an effective way to smooth out the daily demand for beds. Early daily discharge rounds were reported in 23 hospitals. The introduction of earlier discharge rounds in the remaining ten hospitals could help to alleviate pressure on beds.
4.9 Good practice opportunities which were noted in the course of the examination included
23 hospitals had specialty proactive discharge teams to facilitate the management of older patients.
St. Luke’s Hospital in Kilkenny runs a pre-discharge group where a multi-disciplinary team meet once per week to plan the discharge of patients with challenging accommodation and care needs. The group can make discharge decisions on all such patients as part of its function.
The endocrinology department in Portiuncula hospital, Ballinasloe has developed a 33-hour patient admission protocol and management plan to assess and optimise patients’ diabetes care. This includes early morning investigations, discharge planning on day of arrival and organisation of further outpatient care, if required.
4.10 Interventions that decrease hospital inpatient lengths of stay (LOS) improve capacity and directly decrease the length of time patients are necessarily accommodated on trolleys in emergency departments. Monitoring of LOS can be used to drive efficiencies in hospital systems. Healthstat now provides the information to achieve this and reports the following performance indicators for length of stay for 29 hospitals
overall hospital LOS
deviation from target overall average LOS by hospital
deviation from target by selected specialty for each hospital and
deviation from target by selected primary diagnosis per hospital.

56 Emergency Departments
Recent Developments
4.11 The HSE has developed a code of practice for integrated discharge planning. This was introduced in November 2008. The code provides the operational framework for the management of pathways of patient care across the hospital and community services. This code has the potential to address many of the bottlenecks identified by providing an operational framework for the management of length of stay.
Code of Practice for Integrated Discharge Planning
The HSE established a National Integrated Discharge Planning Steering Committee to address the deficiencies in current arrangements for discharging. A code of practice for integrated discharge planning was developed utilising published guidance from expert bodies and existing best practice guidance and standards as well as information from various expert groups and reference sources. The purpose of the code is to support effective discharge planning and to address existing impediments to improved practice by providing
a framework for management of integrated discharge planning that facilitates efficient patient care, effective case management and provides clarity around key roles, responsibilities and performance standards
a reference point against which continual improvement and consultation can take place.
The code comprises a suite of national standards, recommended practices, forms, toolkits, key metrics and audit tools. The implementation of the code of practice commenced in November 2008 following regional workshops. Some of the main provisions are that
all patients are assigned a treatment plan and an expected date of discharge/estimated LOS within 24 hours of arrival into hospital
the expected date of discharge is proactively managed against the treatment plan on a daily basis and changes are communicated to the patient
ward rounds are scheduled in a way that facilitates appropriate and timely clinical review of all patients
a comprehensive and standardised discharge summary has been introduced which is available to patients, their carers and other relevant care providers such as GPs, Pharmacists and Nursing Homes
discharges take place on Saturdays and Sundays at the same level as on weekdays
nurses and other members of the multi-disciplinary team play a more central role in discharging patients from hospital once criteria set out by medical staff are met.
4.12 National guidelines to support the central role of nurses in facilitating the discharge process on a seven-day basis have been finalised and disseminated. In July 2009, five pilot sites (Tallaght, Our Lady of Lourdes Drogheda, Beaumont, Cork University Hospital and Limerick Regional Hospital) were chosen to test new admission, discharge and escalation procedures that have the aim of transferring patients earlier to ward areas in order to match the vacancies likely to arise from planned discharges on any given day. This work will continue up to year-end.

Influence of Wider Hospital Organisation 57
Managing Delayed Discharge
Findings of Review Reports
The Tribal Secta Report noted that many hospitals within the review were regularly managing up to 90 delayed discharge patients.
4.13 The length of time a patient spends in the hospital should be the minimum without compromising care. Delays in the discharge of patients accommodated in acute beds whose episode of care is completed and who are medically fit for discharge32 impact directly on bed capacity and the hospital’s scope to admit emergency patients.
4.14 In the current situation of curtailed budgets for hospitals, any reduction in LOS could be significant considering that the cost of acute care per day is estimated at €875.33
4.15 The examination found that the average number of delayed discharges nationally between October 2007 and August 2009 had risen from 580 patients per week to 919 per week.
4.16 A more detailed review of delayed discharges for the week ending 31 August 2009 found that a lack of residential care beds accounted for 87% of all delayed discharges in that week. The highest number of delayed discharge patients in a network for that week was recorded in the Dublin North network at 324. Delays discharges were attributed to patients
waiting for beds in public owned residential care facilities (33%)
requiring long term care beds (40%)
who require hospice care, rehabilitation or are wards of court (10%)
awaiting publicly subvented beds in private nursing homes (4%)
waiting on home care packages to be set up or adaptations to their home to facilitate their new circumstances (8%)
waiting for psychiatric care placements or other placements (5%).
4.17 The growing number of elderly patients, particularly in the Dublin region, who have finished their acute care, but who are occupying beds in acute settings pose management challenges. Patients requiring long-term care occupied on average 23% of beds in five major hospitals surveyed. At least two of these hospitals have already begun to address the problem by purchasing beds privately in private nursing homes and moving patients to them in order to alleviate bed shortages in the hospital.
4.18 Apart from the impact on the effectiveness of emergency and elective care, there is a cost associated with delayed discharges. The average weekly cost to keep a patient in an acute setting is estimated at €6,125. This is significantly higher than the cost of step down beds from other providers.
4.19 Figure 4.2 shows the number of bed days blocked in 2008 in the 33 hospitals reviewed and a comparison of the cost of an acute hospital bed and a nursing home bed in 2008.
32 The operational definition of a delayed discharge patient as per Performance Monitoring Unit (PMU) HSE. 33 The daily cost of an inpatient bed in 28 hospitals based on casemix data (see note 11).

58 Emergency Departments
Figure 4.2 Cost of Beds Blocked due to Delayed Discharges in 2008
Bed Days Lost Patients over 65
Bed Days Lost Patients less than 65
Total Bed Days Lost
Number of Bed Daysª 182,084 31,492 213,576
Percentage of Total 85% 15% 100%
Gross Cost per Inpatient Bed Day
€875 €875 €875
Gross Cost of a Nursing Home Bedb
€138 €138 €138
Notes: a This information is compiled from HSE statistics for 2008. b This figure is the average cost of a nursing home bed in the Dublin area only.
4.20 It is acknowledged that the capacity to realise savings on the transfer of patients to less costly community facilities is likely to be well below the difference between the accommodation costs in the two systems because
realisation of savings would depend on ward closures and the capacity to terminate temporary employment contracts
existing delayed discharge patients are less resource demanding (because their episode of acute care is completed)
hospital overheads could only be reduced to the extent that they are variable.
4.21 However, short of closures to effect savings the most likely beneficial effect of such a move would be to create greater capacity for the efficient use of existing facilities as a response to demand increases.
Recent Developments
4.22 Long-term care provision will be influenced by a scheme which became operational in October 2009 - the Fair Deal Scheme.34 The purpose of the scheme is to equalise State support for public and private patients by providing that patients seeking a bed in either the public or private system will have the same means test and the same assessment of need. Its objective is also to remove the incentive to avail of a public long-term care bed rather than a private nursing home bed. The scheme is designed to free up beds in acute hospitals as patients can be moved to either public or private nursing homes. It is too early to review its impact.
34 The scheme was introduced under the Nursing Homes Support Scheme Act, 2009.

Influence of Wider Hospital Organisation 59
Bed Capacity and Use
Findings of Review Reports
Under the Health Strategy (2001) there was a commitment to increase public acute hospital bed numbers by 3,000 over ten years. This commitment included both acute inpatient beds and day places.
The Acute Hospital Bed Capacity Report (2002) estimated future needs in the light of demographic changes, hospital surgery changes and changes in primary care and recommended that an additional net 2,840 inpatient beds across the acute system were needed by 2011.
The Acute Hospital Bed Capacity Review Report (2007) estimated that, based on existing practice, there was a need in 2007 for an extra 1,118 beds. The overall supply of public beds in 2007 was estimated at 11,660. It estimated that by 2020 based on existing practice, 19,822 beds would be required. However, it acknowledged that bed capacity was intimately related to the actual health system structure and if it were successfully reconfigured there would only be a need for 8,834 beds by 2020, a reduction of acute beds of 2,826.
4.23 New beds have been introduced in 16 hospitals and these hospitals reported that they had a positive effect on bed capacity. According to the Department the average available number of acute hospital beds (including day places) increased by over 1,500 between 2001 and 2007 and further investment has continued to provide new acute beds in the acute hospital system.
4.24 The Department recognises that there is a continuing need for the provision of new or replacement beds as part of the development of an integrated system by the HSE and it anticipates that this matter will be addressed by the national hospital co-location and capital programme. The HSE Transformation Programme also proposes the integration of acute hospital services with Primary, Community and Continuing Care Services.
4.25 The capacity of hospitals can be positively influenced by altering treatment patterns in appropriate cases. The Acute Hospital Bed Review 2007 suggests that 75% of elective surgery patients were admitted to hospital earlier than necessary. Admission of patients on day of surgery had been used by 27 hospitals and 637,140 cases were treated in day surgeries in 2008.
4.26 The examination found that 23 hospitals have separate day surgery units, with 18 hospitals having stand-alone facilities with dedicated theatre spaces, beds and staff. Stand-alone day surgery units are an effective way of achieving more efficient use of hospital facilities. Systematic increases in the use of day case surgery have the potential to have a positive impact on bed capacity.
4.27 The HSE has stated that a reconfiguration of hospitals currently underway in the North East, the Mid West, the South and South East should lead to a greater emphasis on day case work in smaller hospitals with dedicated units. Based on international norms, there is significant scope to increase the level of day surgery beyond the current position. Many countries have delivered improved capacity in their health system by moving to day case surgery as standard. Ireland’s day case rate is 12% below the OECD average and less than half that of Canada. The constraining factor may be the fact that dedicated facilities do not exist in all areas and, in advance of reconfiguration, there is no clearly defined role statement on the type of surgery to be undertaken at each hospital i.e. the balance between inpatient and day case surgery. According to the HSE, there can also be differences between consultant practices within the same disciplines that impact on levels of day case surgery.
Recent Developments
4.28 The National Service Plan 2009 has set targets for overall patient length of stay and day case surgery as well as seeking to establish norms for day of admission elective surgery.

60 Emergency Departments
Intensive Care
4.29 The Acute Hospital Bed Capacity Report (2002) stated that an additional 33 beds were required to bring occupancy levels in Intensive Care Units (ICUs) back to the recommended average occupancy level of 75%.
4.30 An accessibility survey in 2002 of intensive care facilities in Ireland for critically ill patients showed that among the nine University teaching hospitals35 surveyed, bed occupancy ran at 97%, which is significantly higher than a recommended figure of 75%.
4.31 Demands for critical care beds for the emergency department are increasing internationally. An unpublished Mater Hospital report suggests that critical care admissions through emergency departments in 2006 and 2007 stood at 20%. As a result, ICU demand has to be taken into consideration in any reconfiguration of bed capacity.
4.32 Emergency department patients often have to wait for a bed in an ICU but no figures are available on waiting time or numbers. Treating patients with intensive care needs in the emergency department is not efficient and a delay in admission to the ICU may result in a delay in definitive care that is crucial to the outcome of high-risk patients.
Recent Developments
4.33 A Review of Adult Critical Care Services has been commissioned by the HSE in order to inform the future planning of the organisation and delivery of adult critical care services within the acute hospital system. The report is expected to be completed shortly.
Bed Management
Findings of Review Reports
The management of discharges and admissions needs to be assigned to a dedicated function with appropriate authority. A dedicated bed management function can facilitate efficient planning and management of available beds. The Capita Report recommended that a single bed management control function should be established in each hospital.
4.34 The survey carried out as part of this examination showed that all 33 hospitals have bed management arrangements in place during weekdays either on a 24-hour basis or during normal working hours. However, at weekends, while18 hospitals have cover in place, either on a 24-hour or on a restricted basis, 14 hospitals have no arrangements in place.
4.35 To be effective, bed management needs the active involvement of clinicians. The Tribal Secta Report noted that clinical involvement in bed management was inconsistent from hospital to hospital. It pointed out that some bed management functions were often run in isolation without consistent input from clinical staff. Central organisation of the bed management function is unlikely to be effective unless it is systematically linked to operational routines.
4.36 It is critical that bed management teams have timely and reliable information available in order to plan and make informed decisions about beds. Real time information relating to bed management is available in two thirds of hospitals. An example of good practice in this area was noted in St Vincent’s University Hospital.
35 Galway University Hospital, Mater Misericordiae University Hospital, St. Vincent’s University Hospital, St.
James’s Hospital, Beaumont Hospital, Tallaght Hospital, Limerick Regional Hospital, Our Lady’s Children’s Hospital, Crumlin and Temple Street Children’s University Hospital.

Influence of Wider Hospital Organisation 61
Bed Management in St. Vincent’s University Hospital
Over time, the role of the hospital bed manager in St. Vincent’s University Hospital has evolved into a bed management function complete with a dedicated team. While bed managers traditionally coordinated the availability of beds, this bed management team now looks at how to increase bed capacity, manage patient throughput and facilitate discharge planning. A bed management committee, which includes senior management and clinical and nursing leadership, supports the team giving it greater authority and credibility. The knowledge gained from this work has also been transferred to other health facilities within the St. Vincent’s Hospital group a.
Note: a St. Vincent’s Hospital Group incorporates St. Vincent’s University Hospital, St. Vincent’s Private Hospital and St.
Michael’s Hospital, Dun Laoghaire.
4.37 The examination found that four fifths of hospitals now had clinician involvement in bed management but differences in clinical input persist. It also found that there was no consistency from hospital to hospital in the definition of the role of the bed manager or to whom the bed manager reports on a daily basis.
Addressing Overcrowding
The inability to transfer emergency patients to inpatient beds is a major factor in overcrowding36 in emergency departments. Over time, hospitals have developed plans to address overcrowding. The level of overcrowding that triggers these plans is defined on a hospital/region specific basis because of variation in the size and capacity of emergency departments and the wider range of system and infrastructural supports. There are tiered suites of plans, which are adapted to local needs and circumstances as follows
admission and discharge policies
escalation plans
full capacity protocols.
The plans define actions, roles, responsibilities and trigger points.
Under the full capacity protocol37, patients are admitted to inpatient wards within the hospital until a bed in the appropriate ward becomes available. Each ward must accept a patient from the emergency department. Studies have shown that implementation has a positive effect on overcrowding, length of stay and patient satisfaction. 16 hospitals in Ireland have introduced the full capacity protocol. Hospitals have stated that they already take extra beds onto specific wards in particular clinical circumstances, e.g. cardiology, neurosurgery or endocrinology but that it would be beneficial to have a systematic process for hospital wide escalation or response mechanisms in defined circumstances to facilitate the movement of patients from emergency departments where the decision to admit has been made.
36 Overcrowding in emergency departments is a situation where the demand for emergency services exceeds the
ability of a department to provide quality care within acceptable time frames. In its simplest form, it exists when there is no space left to meet the timely needs of the next patient who needs emergency care.
37 The full capacity protocol was championed by Dr. Peter Viccellio, of Stony Brook University Hospital, Stony Brook, New York and is now being used throughout North America.

62 Emergency Departments
Patient Flow Management
Findings of Review Reports
Many health service reports highlighted the need for changes in practice and culture. Areas particularly emphasised included
to learn lessons based on casemix data
to have defined care delivery routines
to reengineer services to improve the flow of patients through the system.
Use of Casemix Data
4.38 Some review reports recommend the use of casemix38 information in order to guide clinical practices on LOS. The extent of review by hospitals of casemix data in order to guide clinical practice for LOS is outlined in Figure 4.4.
Figure 4.4 Use of Casemix Data to Inform Length of Stay
Region Number of Hospitals
Hospitals Participating in
Casemix
Number of Participating Hospitals using Casemix Data
to Inform LOS
Dublin North 3 3 2
Dublin Midlands 5 4 3
Dublin South 3 3 2
North East 4 4 2
West /North West 6 5 4
Mid West 4 1 –
South 4 4 3
South East 4 3 3
National Level 33 27 19 Source: Survey compiled by the Office of the Comptroller and Auditor General
4.39 Reviews of data have been introduced in only 19 hospitals participating in casemix. No hospital in the Mid West area has adopted this practice and only two hospitals in the North East have done so. The South East is the only network area where all hospitals have implemented this programme. National direction is required to push these reforms forward.
38 Casemix provides a means for standardising data collected on activity and costs within acute hospitals so that
meaningful comparisions can be made between different areas of activity and different hospitals.

Influence of Wider Hospital Organisation 63
Care Delivery
4.40 There appears to be scope to improve care delivery across the system. While most hospitals have routines that guarantee active management some have scope to improve their practice to the extent outlined in Figure 4.5.
Figure 4.5 Delivery Routines
Routine Number of
Hospitals where not in Place
Daily specialist consultant ward rounds in the acute specialities 10
Daily specialist emergency department rounds of patients admitted but awaiting a bed
8
Daily handover of admitted patients to care of the relevant consultant or specialty team
6
Participation of the on call admitting team in escalation measures 4 Source: Survey compiled by the Office of the Comptroller and Auditor General
4.41 It was also noted that half of the hospitals in both the West/North West and Mid West do not provide daily specialist emergency department rounds for patients admitted but awaiting a bed. 27 hospitals have daily handover of emergency patients who have been admitted to the care of the relevant consultant.
Speciality Specific Admission
In the area of cardiology, St. Vincent’s Hospital introduced a policy to improve use of their bed base, provide consultant delivered integrated care to all acutely ill patients, create streamlined care pathways for local patients and reduce attendance and waiting times in the emergency department.
According to the bed management team at the hospital data shows that cardiac patients treated by the hospital’s cardiologists had an average LOS of 5.8 days compared to those treated by general physicians who had an average LOS of 16.3 days. This translates to an overall bed stay reduction of 60%. The results are achieved by a team of cardiologists working in a geographically defined space within the hospital. St. Vincent’s Hospital is now working to replicate these bed day savings in other disciplines.
Escalation Measures
The Mater Hospital has developed a process to reduce the number of patients waiting in the emergency department for admission when a certain threshold is reached. This is led by the Director of the Emergency Medicine Division and involves Registrars of all medical teams attending meetings at short notice to provide an update on progress of all medical patients in the hospital in order to identify those where immediate intervention (e.g. access to diagnostics) could speed up discharging.

64 Emergency Departments
Theatre Utilisation and Access
4.42 In the busier hospitals, it is important to have a rational means of allocating theatre time between elective and emergency cases. This could be achieved by extending the working day to create more capacity or by having dedicated theatre streams.
In regard to utilisation it was found in the survey carried out as part of this examination that only 14 hospitals had introduced an extended working day and that only eight hospitals carry out elective work at weekends.
In regard to access it was found that 11 hospitals do not have dedicated theatre access for emergency trauma patients and 16 do not have dedicated access for emergency non-trauma patients.
4.43 While this may not impact equally across all hospitals, there would be merit in reviewing the extent to which adjustments in theatre utilisation or access could impact on treatment capacity.
Internal Initiatives to Improve Patient Flows
4.44 Many hospitals have instigated initiatives to address their internal patient flows and speed up the patient pathway through the hospital. Some good practice opportunities were identified during hospital visits and interviews.
Good Practice Opportunities – Patient Flows
A challenge is to ensure that newly appointed consultants have access to necessary supports. In Beaumont, when a new consultant is appointed resource sharing by existing consultants including secretarial support, office space, outpatient space and theatre space, has helped to speed up the delivery of patient care and reduce a time lag which would traditionally have existed until resources were allocated to the new consultant.
St. Luke’s Kilkenny has rearranged its outpatient appointment system to facilitate urgent referrals for the outpatient clinic by allowing specific slots to be available at the next clinic for such referrals.
In order to streamline General Practitioner (GPs) access to diagnostics, St. Vincent’s University Hospital developed GP direct referral to the gastroscopy services. This service was first introduced in 1998 with strict protocols. Over time, this diagnostic service has improved with the development of stronger professional relationships and education initiatives. Many GPs call into the unit and discuss a case directly with the clinical nurse specialist or send their referral information directly by email.
4.45 At present there is no systematic mechanism to share such solutions and allow for replication in other facilities or at a minimum to pilot the initiative in other hospitals to see if any improvement can be achieved.
4.46 In December 2007, a consultancy firm looked at work practices and ways to improve service delivery within the three main hospitals in North Dublin39 and in Tallaght. The consultants developed an action plan for a ‘whole system’ change in order to optimise patient flows. The resulting action plans have been implemented on a phased basis and positive results are reported.
Transport
4.47 In the case of emergency departments with limited Senior Decision Maker (SDM) cover, the ambulance service will generally take the patient to the most appropriate treatment centre. Protocols to address this matter have been put in place in the North East and more recently in the Mid West under a
39 Mater Misericordiae University Hospital, Beaumont Hospital and Connolly Hospital, Blanchardstown.

Influence of Wider Hospital Organisation 65
reconfiguration process. Protocols have also been developed in Dublin covering three hospitals - St. Vincent’s, St. Columcille’s in Loughlinstown, and St. Michael’s in Dun Laoghaire.
4.48 There may be merit in introducing protocols covering all hospitals to guide the ambulance service as to the appropriate hospital to which an emergency patient should be taken. This could reduce the risk that emergency ambulance services might not make informed decisions and ensure they brought their major emergency medical or trauma cases to the best equipped centre at the time.
4.49 Availability of ambulance services to transport patients from acute hospitals to other care settings was an issue highlighted during interviews with hospital management as part of the examination, particularly in hospitals outside the Dublin area. Delays could impact on bed management.

66 Emergency Departments
Conclusions
4.50 Emergency departments do not operate in isolation from the hospital in which they are functioning. Consequently, their effectiveness is tied into that of the wider hospital organisation within which they function.
4.51 The examination noted that there is potential to improve emergency department effectiveness through
better planning of discharges and finding alternative less costly accommodation for patients whose acute care needs have been dealt with
addressing capacity issues in the wider hospital through a combination of day care, same day admission and, where necessary, increased bed numbers.
4.52 A dedicated bed management function operating on the basis of norms established in an evidence-based way could help coordinate these functions.
4.53 Overall, the examination concluded that
a wider use of early discharge planning based on standard targets and norms for each condition could improve bed capacity management
more even discharging across the week could free up resources
as attendance in emergency departments tends to increase in the afternoon, discharge of patients earlier in the day could favourably impact on bed availability
as the cost of step-down beds is considerably lower than the cost of acute beds there may be scope for cost efficiencies through development of a strategy to provide more beds in the community. The recently introduced Fair Deal Scheme should help address this issue.
4.54 In busier hospitals, the rational allocation of theatre time between elective and emergency cases is important to ensure the most efficient and effective use of these facilities. This might involve greater utilisation of theatres through an extension of the working day or dedicated theatre access for emergency cases.
4.55 Consideration should be given to developing a more structured approach to sharing identified good practice.

5 Managing Emergency Demand 5.1 International experience as well as experience in Ireland has shown that a comprehensive range of alternatives to acute hospital care can be provided through strengthening of primary care services. For example, the Bed Review Report into bed utilisation in hospitals that had emergency departments found that nationally 13% of patients surveyed could potentially have avoided admission through access to assessment/diagnostics, access to a non-acute bed or through home based community care including GP support, therapy, specialist and community nursing and home care packages.
5.2 This Chapter examines key elements in the Health Strategy and recommendations in the Review Reports which could reduce reliance on hospital services and demand in emergency departments. These are
community care service initiatives
community supports
chronic disease management
GP access to diagnostic services
the development of Primary Care Teams
integration of primary care and hospital services.
Community Care Service Initiatives
5.3 Community care services include public health nursing, home help, physiotherapy, occupational therapy, day care and respite care services. The HSE is the main provider of these services but they may also be provided by voluntary organisations in conjunction with, or on behalf of the HSE. The main initiatives with a potential to divert patients from emergency departments are
Community Intervention Teams
Rapid Access Clinics in the Community
GP Co-operatives/Out-of-Hours Services.
Community Intervention Teams
5.4 Community Intervention Teams (CITs) were first established in 2006 to provide a rapid response from the community services to patients who are deemed medically suitable for treatment in the home. This should prevent unnecessary referrals to the emergency department and facilitate early discharge from hospital. A team of nurses and home help services provide immediate supports until mainstream community services can take over – usually within 72 hours. The main source of referrals to CITs are emergency departments, hospital consultants, Public Health Nurses and GPs.
5.5 Four teams are in operation, one in Cork City, one in Limerick City and two in Dublin, serving a population of approximately 850,000.
5.6 Figure 5.1 shows the cost of the service and the number of patients treated during 2008

68 Emergency Departments
Figure 5.1 Cost of Community intervention Teams for 2008
CIT Direct Costsa Number of Patients
Treated
Cost per Patient
Treated
€ €
Cork 602,657 886 680 Limerick 400,739 924 434 Dublin North 680,029 1,777 383 Dublin South 995,209 2,337 426
Total 2,678,634 5,924
Source: HSE Note: a Direct costs include pay and non-pay costs.
5.7 Figure 5.1 shows that the costs of the teams varied significantly with cost per patient treated ranging from €383 to €680 and an average cost of €452.
5.8 According to the HSE in the period from 1 January 2009 to 10 May 2009 over 2,300 patients were treated by the four CITs. A breakdown of the referrals shows that 49% of patients were either accepted by CITs following referral from emergency departments or resulted in hospital avoidance, and 33% were accepted on their early discharge from hospital.
5.9 The indications are that as well as providing appropriate patient care, the CITs provide significant savings compared to hospital admission.
Rapid Access Clinics in the Community
5.10 A rapid access clinic based in the community can provide older people with access to urgent non-emergency care, which should reduce the need for those patients to attend an emergency department and assist in avoiding admission to hospital. In November 2006, under an agreement with a private provider, a rapid access clinic was opened at Smithfield in Dublin to which patients aged over 70 could be referred by GPs and emergency departments within the catchment area of North Dublin for an appointment within 48 to 72 hours. The centre has the capacity to treat up to 4,000 patients per year. The HSE was charged €518 per new patient and €341 per return visit in 2008.
5.11 Figure 5.2 shows the cost of the clinic and the number of patients treated during 2008.
Figure 5.2 Cost of Rapid Access Clinic
Year Cost No. of Patients
No. of Patients
Patients Referred by
GPs
Patients Referred by Emergency
Department
€m New Follow-ups % %
2007 1.92 1,455 3,413 83 17 2008 2.83 1,755 5,642 94 6 Source: HSE /Charter Medical Group – Private Provider
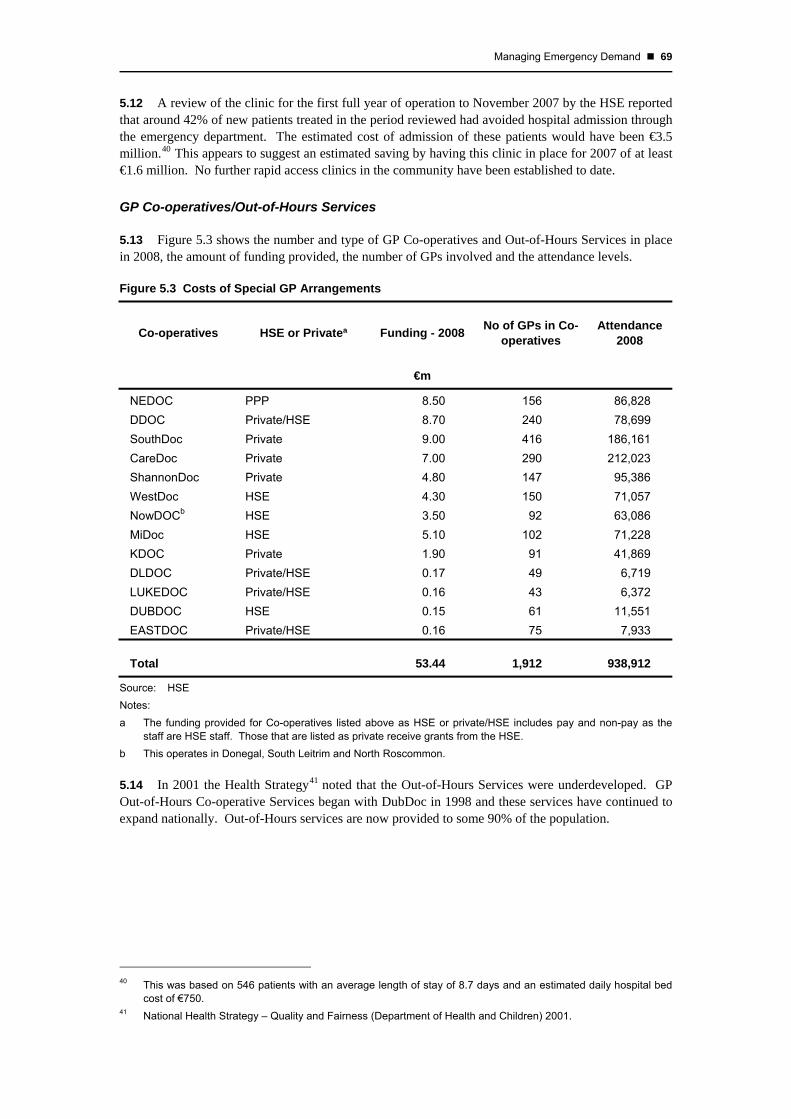
Managing Emergency Demand 69
5.12 A review of the clinic for the first full year of operation to November 2007 by the HSE reported that around 42% of new patients treated in the period reviewed had avoided hospital admission through the emergency department. The estimated cost of admission of these patients would have been €3.5 million.40 This appears to suggest an estimated saving by having this clinic in place for 2007 of at least €1.6 million. No further rapid access clinics in the community have been established to date.
GP Co-operatives/Out-of-Hours Services
5.13 Figure 5.3 shows the number and type of GP Co-operatives and Out-of-Hours Services in place in 2008, the amount of funding provided, the number of GPs involved and the attendance levels.
Figure 5.3 Costs of Special GP Arrangements
Co-operatives HSE or Privateª Funding - 2008 No of GPs in Co-operatives
Attendance 2008
€m
NEDOC PPP 8.50 156 86,828 DDOC Private/HSE 8.70 240 78,699 SouthDoc Private 9.00 416 186,161 CareDoc Private 7.00 290 212,023 ShannonDoc Private 4.80 147 95,386 WestDoc HSE 4.30 150 71,057 NowDOCb HSE 3.50 92 63,086 MiDoc HSE 5.10 102 71,228 KDOC Private 1.90 91 41,869 DLDOC Private/HSE 0.17 49 6,719 LUKEDOC Private/HSE 0.16 43 6,372 DUBDOC HSE 0.15 61 11,551 EASTDOC Private/HSE 0.16 75 7,933
Total 53.44 1,912 938,912
Source: HSE Notes: a The funding provided for Co-operatives listed above as HSE or private/HSE includes pay and non-pay as the
staff are HSE staff. Those that are listed as private receive grants from the HSE. b This operates in Donegal, South Leitrim and North Roscommon.
5.14 In 2001 the Health Strategy41 noted that the Out-of-Hours Services were underdeveloped. GP Out-of-Hours Co-operative Services began with DubDoc in 1998 and these services have continued to expand nationally. Out-of-Hours services are now provided to some 90% of the population.
40 This was based on 546 patients with an average length of stay of 8.7 days and an estimated daily hospital bed
cost of €750. 41 National Health Strategy – Quality and Fairness (Department of Health and Children) 2001.

70 Emergency Departments
5.15 The Task Force Report noted that
The period of highest demand and self-referrals to emergency departments is between 8.00am and 8.00pm which are largely times when GPs are available in surgeries.
Out-of-Hours services do not act to reduce the number of patients waiting in emergency departments for admission to a hospital bed. However, if utilised correctly by patients they can provide alternative rapid access to care for patients with non-life threatening illness or injury.
5.16 While there was nearly a million attendances at out-of-hours services in 2008, the impact on reducing demand on emergency departments has not been evaluated. A national review of GP out-of-hours services by the HSE commenced in 2009.
Community Supports
5.17 One of the largest groups in hospital care are people aged 65 years and over. The HSE has two main initiatives in place with the objective of maintaining older people in their communities and reducing length of stay in acute hospital beds. These are
community and home based care and
long-term care arrangements.
5.18 A number of hospital avoidance measures are in place to treat older people at home who would otherwise occupy an acute hospital bed. People aged over 65 normally have a higher level of dependence and a higher risk of injury through falls or through developing illness. The measures include home help hours or home care packages provided in the community. Figure 5.4 shows the amount provided under these measures in the period January to April 2008 and January to April 2009.
Figure 5.4 Home Care Based Measures
January to April 2008 January to April 2009
Home Help Hours 4.02 million 3.95 million Home Care Packages 8,600 recipients 8,800 recipients
5.19 To date, there has been no formal evaluation of home care packages and their impact on long term care or on admissions to emergency departments or other acute hospital services. However, an evaluation of home care packages by external consultants for the Department is being finalised. In June 2009, over 28,700 long term care beds were being provided through HSE units, the voluntary sector and private nursing home units.
5.20 The development of these interventions is highly dependent on a coordinated approach between the hospitals and the HSE’s Primary Community and Continuing Care (PCCC) programme with a patient centred approach to care planning and budget application.
5.21 The HSE proposes to develop consultant led geriatrician teams which will act as an interface between hospital and community based services and will include acute hospital and community components. These teams will provide specialist support to community based services to maintain greater numbers of high dependent elderly in the community. The HSE plans to have four consultant geriatricians in place by the end of 2009.

Managing Emergency Demand 71
Chronic Disease Management
5.22 Chronic diseases are long-term conditions, usually incurable, which are non-communicable and involve some functional impairment or disability. They include conditions such as cardiovascular disease, diabetes, cancer, asthma and chronic bronchitis and are major causes of death and disability in Ireland. Approximately 80% of GP consultations and 60% of hospital bed days are related to chronic diseases and their complications. In all, it is estimated that chronic diseases account for two thirds of emergency medical admissions to hospitals.
5.23 The Health Strategy 2001 recognised that care of people with chronic disease is best provided within the primary care system and the Strategy proposed that chronic disease management protocols should be developed to promote integrated care planning and support self-management.
5.24 In November 2006 the HSE published a report42 on developing patient support programmes for chronic disease management. A pilot programme was planned to begin in October 2007 but budget constraints prevented implementation.
5.25 In April 2008 the Department published a Policy Framework for the Management of Chronic Disease43 which pointed to the need for a re-orientation of services towards primary care and for an integrated approach to tackle both the prevention and the management of chronic illnesses.
5.26 The inadequate and fragmented service for chronic disease management, which results in unnecessary hospital admissions and inconvenience for patients, is being addressed under the Transformation Programme which aims to implement a model for the prevention and management of chronic disease by 2010. In July 2008, under the Transformation Programme a Chronic Illness Framework was finalised by the HSE specifying the actions required to prevent and manage chronic disease.
5.27 In November 2008, an Expert Advisory Group produced a report on diabetes in Ireland. It recommended the development of a national standard of care and clinical guidelines to provide national leadership and a framework to enable local implementation. Implementation was projected to have a positive effect on bed days, drug costs and social care costs. These recommendations align with the HSE transformation priorities. A report on a Diabetes Retinopathy Screening Programme was also launched.44 According to the HSE, local implementation groups are currently being formed and local initiatives are being streamlined to produce a national service for diabetes care in the community.
5.28 It is clear that for chronic disease management to be tackled in any meaningful way, leadership, guidance and a robust change management programme are necessary. While sporadic programmes have been driven by local leadership, central direction could play a greater role in this area.
Integration Challenges
5.29 Challenges to the development of hospital based outreach programmes for the management of chronic disease which will have to be addressed include governance of the programme, leadership and responsibility for the patients involved. Shared records also present a number of issues including access rights, confidentiality and control of the records.
42 A National Chronic Disease Management Patient Support Programme for HSE- Report of the National Steering
Committee 43 Tackling Chronic Disease – A Policy Framework for the Management of Chronic Disease 44 Roll out of retinopathy screening in the West/North West has started.

72 Emergency Departments
5.30 Clarification will be required to delineate the difference between outreach hospital based and community GP based chronic disease management programmes. It may well be that initially leadership should come from the acute hospital sector with a gradual transition of some of the programmes into primary care. Ultimately, solutions will have to be localised, i.e. take into account the regional environment and the availability of local consultants and primary care practitioners.
Initiatives to Manage Chronic Disease
5.31 Examples of promising chronic disease management programmes exist, both in a hospital setting and in the community. These programmes have the potential to reduce demand on hospital beds and attendance at emergency departments. Some examples are set out below.
Heartwatch Programme
The Heartwatch Programme, which started in 2003, is an example of chronic disease management in Primary Care, which can have the effect of reducing demand on emergency departments by reducing the risk of heart attacks or strokes. This programme extends to over 16,000 patients and more than 40,000 patient consultations. It has led to the development of one of the largest databases on patients with chronic cardiovascular disease in Ireland. It operates in about 20% of GP practices nationally. The programme provides a set of defined clinical protocols, in line with international cardiovascular prevention guidelines. Patients are reviewed using these protocols up to four times a year and corrective action is taken, if required. A report published by the Heartwatch Steering Group in 2006 stated that the programme was successful in reducing certain risk factors (blood pressure, cholesterol and smoking) and preventing heart attacks and strokes as well as being cost effective. A subsequent review of Heartwatch45 by Professor Murphy of University College Galway in 2009 found that the Heartwatch Programme
was a suitable initial model for chronic disease management in Ireland
led to a reduction in patient blood pressures across GP practices.
Areas noted for improvement were
patient visit numbers could be reduced in accordance with the evidence from Heartwatch analysis
Heartwatch could be integrated with other programmes such as cardiac rehabilitation
adjustment in the dataset and analysis to facilitate governance and better communication with GPs.
Lifford/Castlefinn Primary Care Team
This Primary Care Team has developed a specialist clinic for patients with Type Π diabetes. As the clinic is locally based, it eliminates the need for hospital visits and the Team is able to closely and routinely monitor people with diabetes from their catchment population. An evaluation found that hospital visits were minimised and the length of hospital stays were shortened. In addition, the transfer of care from the hospital setting to the clinic has reduced pressure on the local acute hospital.
45 Advancing Healthier Hearts: A comprehensive review of the Heartwatch programme.

Managing Emergency Demand 73
Views of General Practitioners
5.32 In general, representatives of the Irish College of General Practitioners (ICGP) were of the view that the organisation of chronic disease management could be more efficient, but acknowledged that improvements were being made.
5.33 Clinicians involved in primary care recognise that patients may have several chronic diseases requiring the input of a number of physicians. For example, patients with cardiac disease often have concomitant diabetes. GPs also recognise thay they are in the unique position of looking after their patients in a more holistic fashion. However, as some 30% of GPs still operate as sole practitioners, the option of providing a greater range of services remains limited in these cases.
5.34 The ICGP’s view was that under existing contractural arrangements and practice structure GPs are largely confined to reviewing patients when acute conditions arise rather than being involved health promotion and disease prevention activities.
5.35 GPs identify diabetes, cardiovascular disease, asthma/chronic obstructive pulmonary disease and warfarin therapy as their priorities for chronic disease management. A major difficulty with the development of chronic disease management is dissemination of successful practice initiatives. The ICGP is aware of a large number of small pilot projects of best practice in this area but progress was hampered by a lack of coordination, funding and resources at a national level. This would seem to be a role best suited to the combined efforts of the NHO and PCCC.
GP Access to Diagnostic Services
5.36 GPs rely on diagnostic services to confirm diagnoses, the absence of pathology and to support decision-making. X-rays, ultrasounds, endoscopies and blood tests are the most common diagnostic procedures used by GPs.
5.37 According to the Tribal Secta report the most important factor militating against treatment of patients by GPs was access to diagnostic services. GPs often refer patients to the hospital emergency department due to a lack of diagnostic facilities in the community and long waiting times for outpatient appointments. This may lead to inappropriate admissions, sub-optimal bed utilisation and increased costs to the Health Service. The Tribal Secta report recommended that capacity planning and option appraisal should be undertaken to address the gaps in diagnostic services, the use of mobile diagnostic units and the procurement of additional capacity within the private sector.
5.38 The 10-Point Action Plan introduced in 2005 proposed enhanced access by GPs to diagnostic services and the wider availability of acute diagnostic services, particularly MRI, to reduce GP referral to the emergency department and to reduce bottlenecks in hospital treatment. A Community Diagnostic Initiative was developed in late 2005 to improve access for GPs to particular diagnostic services in response to concerns about waiting times for access to x-ray and ultrasound. The initiative was developed within four regional areas between January and December 2007 and was provided with an allocation of €6 million towards running costs. The initiative has since been halted.
5.39 A review of the initiative was carried out by the HSE in January 2008 and found that
it was a successful project in reducing waiting times and easing access, but waiting lists and waiting times would increase if the initiative was halted
there was spare diagnostic capacity within the acute hospital settings. This spare capacity was accessed by making better use of current equipment and by extending the hours provided in some settings

74 Emergency Departments
there was capacity in the private sector which could also be utilised to improve access to services but this would require cost benefit analysis to ensure value was being obtained for the services being provided
there was under utilisation of the diagnostic services, especially x-ray
access to ultrasound was particularly valued by GPs.
5.40 The review recommended that this initiative should continue in a modified form and that costing for future developments should be informed by calculation of savings from reduced demand on other services. In particular, it noted that
expenditure in the period reviewed was €2.2 million, which was less than half of the amount allocated
while there may have been efficiency savings from reduced attendances at outpatients and emergency departments, it was not possible to quantify this due to insufficient information.
5.41 According to the HSE, different approaches have been taken to enhance capacity since this initiative ceased. Initially, private providers had been approached to identify capacity and interest. This was followed through by a more detailed tendering exercise in the Dublin North East and Dublin Mid Leinster areas leading to the commissioning of private providers in both areas. In the other areas, there was insufficient private capacity but extra funding was provided to enhance the service.
5.42 Within the initiative an interesting approach was the use of a voucher scheme in North Dublin.
Voucher Scheme
As part of the 2007 initiative, GPs in North Dublin were issued with vouchers for ultrasounds and x-rays in a private hospital, as there were delays in outpatient appointments in the area. According to the IGCP the GPs accumulated the vouchers until a strong clinical need arose. This scheme worked well over the six-month trial. It was extended for a further six months and cost €441,000.
The Development of Primary Care Teams
5.43 A core element of the Health Strategy 2001 was to develop Primary Care46 as the central focus for the delivery of health and personal social services. The aim of the Strategy was to provide
a strengthened primary care system, which would play a more central role within the health system
an integrated, inter-disciplinary, high quality team-based set of services
enhanced capacity of primary care in the areas of disease prevention and personal social services.
5.44 It was envisaged that a restructured primary care system would provide between 90% and 95% of people’s day-to-day health and personal social needs. Delivery in the new setting would have the potential to prevent the development of conditions requiring hospitalisation, facilitate early discharge, and lessen the reliance on hospital services, in particular emergency departments and outpatient services.
46 Primary Care is the term used for healthcare provided at the lowest level of complexity and is usually the first
point of contact that people have with the health and social services. This usually involves visits to the GPs, Public Health Nurses, etc.

Managing Emergency Demand 75
Primary Care Strategy
The Primary Care Strategy proposed the development of integrated, multi-disciplinary Primary Care Teams (PCTs) to provide health and social services in the community, which would be more cost effective and reduce reliance on hospital services. The PCTs include GPs, public health nurses, practice nurses, home help personnel and administrative staff and are designed to serve a population of between 4,000 and 10,000 people. Depending on location, it is also envisaged that a wider health and social care network (HSCN) of primary care professionals such as speech and language therapists, dieticians, social workers, community welfare officers and psychologists would be established to provide a more integrated service covering a population of between 30,000 and 50,000 people.
Progress in Establishing Primary Care Teams
5.45 In 2003, ten PCTs were established on a pilot basis but there was no further development until 2006 when the HSE decided to proceed with the development of 530 PCTs by 2011. In 2006, under the Towards 2016 Agreement there was a commitment to establish 300 PCTs by 2008, 400 by 2009 and 500 by 2011. In early 2008 the PCCC management team reviewed the targets for the development of PCTs and amended the targets to 97 teams fully functioning and 113 teams at development stage by December 2008 with a further 100 developed in 2009 and the remaining 220 teams in 2010 and 2011. At June 2009, 120 teams were functioning and 88 were at development stage. No HSCNs have been established.
5.46 In 2006 the HSE conducted an internal review of the ten pilot primary care projects to provide guidance for the further development of PCTs. The review did not evaluate the impact of the PCTs on hospitals generally or on emergency departments. In 2008 the HSE established a project to develop an evaluation framework and performance measures for PCTs, which will include examining ways of measuring the impact on hospital services.
5.47 Any review of the PCT concept should take account of performance generally as well as opportunities for better organisation of services based on best practice.
Primary Care Team Initiatives
5.48 A number of PCTs have developed initiatives, which should have a positive impact on quality of care, integration of the service and prevention of hospital and emergency department attendance. The following are two examples of initiatives in operation.
PCT Initiatives
Arklow PCT - X-ray and Ultrasound Facility
A community based x-ray and ultrasound service began at Arklow PCT in February 2008 which can be used by local GPs. In the period to August 2008 approximately 3,500 x-rays and ultrasounds were provided through the PCT which would previously have required attendance at local hospitals.
Irishtown PCT- Chronic Disease Programme
This PCT developed a six-week programme to assist patients with chronic illness to develop skills to manage their health and lead active lives. An internal evaluation found that the participating group showed significant improvements, spent fewer days in hospital and required fewer outpatient visits in comparison with a non-participating group.
Source: HSE

76 Emergency Departments
Integration of Primary Care and Hospital Services
5.49 Lack of integration militates against the achievement of effective care. As long as community and acute services are managed and funded separately, there can be a perverse incentive for the PCCC in managing its overall budget not to provide step-down or nursing home beds to facilitate more rapid discharge of patients from hospitals. While these long-term dependent patients remain in hospital and the relatively greater cost of care is met from the acute hospitals budget, the PCCC do not have to fund the care.
5.50 A key element of the Health Strategy was to improve integration between primary and secondary care services. These have traditionally operated under separate structures which resulted in poor communication and coordination, inappropriate decision-making, inefficient use of resources, and lack of accountability. These issues were regularly highlighted during interviews for this examination with hospital managements, consultants and other health service staff.
Service Integration
The separation of responsibility and accountability between the NHO and PCCC leads to issues over resource utilisation. This is very apparent in the area of community beds. A smooth transition of patients from the hospital setting to the community is vital to ease pressure on emergency departments. The following examples were noted
According to a consultant in Beaumont Hospital the numbers of delayed discharges in 2007 had fallen from between 120 and 130 to just 40 patients per day before the funding for extra community beds was discontinued or restricted. The consultant also gave an example of a patient who needed additional home care costing about €200 per week. Lack of PCCC funds resulted in the patient remaining in the hospital bed at a cost to the NHO of €6,125 per week.
According to a consultant in the Mater Hospital, it was estimated that five to seven patients daily who start in the emergency department require discharge from the hospital into long-term care. The Mater finds it difficult to plan patient discharges as enhanced subvention47 can be intermittent causing patient flows to be uneven.
The lack of community and nursing home beds has resulted in some hospitals purchasing community and long term beds in private facilities in order to discharge patients from the acute sector into the community. The result is that there is less funding available for hospital services.
Recent Service Developments
5.51 The HSE has stated that it is in the process of transforming the way its services are organised by adopting an integrated care approach which will deliver improved integration between primary, community and hospital care. The goal of these reforms is to provide more accessible and higher quality patient care, where possible outside the hospital setting and closer to home.
5.52 In July 2008, an Integrated Service Delivery Change Programme was established to speed up service integration and devolve local responsibility for services as part of the Transformation Programme. The changes proposed included the bringing together of the NHO and PCCC under a single Directorate for Integration. Two directors are to be appointed, one responsible for reconfiguration of services at hospital, primary and community level and the other who will be responsible for service and financial performance.
47 An enhanced subvention is an additional discretionary contribution which may be paid by the HSE in addition to
basic subvention. Basic subvention is a payment made by the HSE to help eligible people to pay for private nursing home residential care in a registered nursing home.

Managing Emergency Demand 77
5.53 A National Directorate for Quality and Clinical Care has been established and a senior clinician has been appointed. This directorate will have a central role in further strengthening clinical leadership of services, improving clinical performance and implementing changes in the funding system.
5.54 It is also planned to appoint four Regional Operations Directors and to design the operational arrangement to facilitate this new regional structure by December 2009.
5.55 The new Clinical Directorate structure will also drive change by facilitating the participation of clinicians in the management process. Clinicians will become more involved in the planning and operation of services provided in hospitals and community settings. At June 2009, 47 out of a possible 77 clinical directors have been appointed.

78 Emergency Departments
Conclusions
5.56 There appears to be scope to reduce reliance on emergency services on the part of some patients who present at emergency departments.
Since 60% of hospital bed days relate to chronic disease management, reorientation of services towards primary care and better integration of hospital and community services could contribute to more efficient and effective services in that area and ease bed waiting times for emergency cases.
Community Intervention Teams appear to be a cost effective response for patients who are suitable for treatment in the home.
The results from one rapid access clinic based in the community, providing care to older patients with non emergency conditions, appear to suggest a potential to divert such patients from emergency departments and for over 40% of them from subsequent inpatient admission.
There would be merit in examining the overall cost effectiveness of these measures as well as completing evaluations of the contribution of out-of-hours GP services and home care packages in order to allow for evidence based decision making in regard to them.
5.57 The HSE is working to integrate hospital care and primary and community care. As part of its Transformation Programme it proposes to do so under a single directorate and to have four Regional Operations Directors to facilitate a regional structure. Successful integration of the two major service streams could provide greater balance and efficiency in the use of resources and improve service effectiveness.
5.58 By June 2009 120 PCTs were in place and 88 were at development stage. No linked Health and Social Care Networks have yet been established. The HSE has established a project to develop an evaluation framework and performance measures for PCTs which will include measuring their impact on hospital services. Any review of the PCT concept should take account of performance generally as well as opportunities for better organisation of services based on best practice.
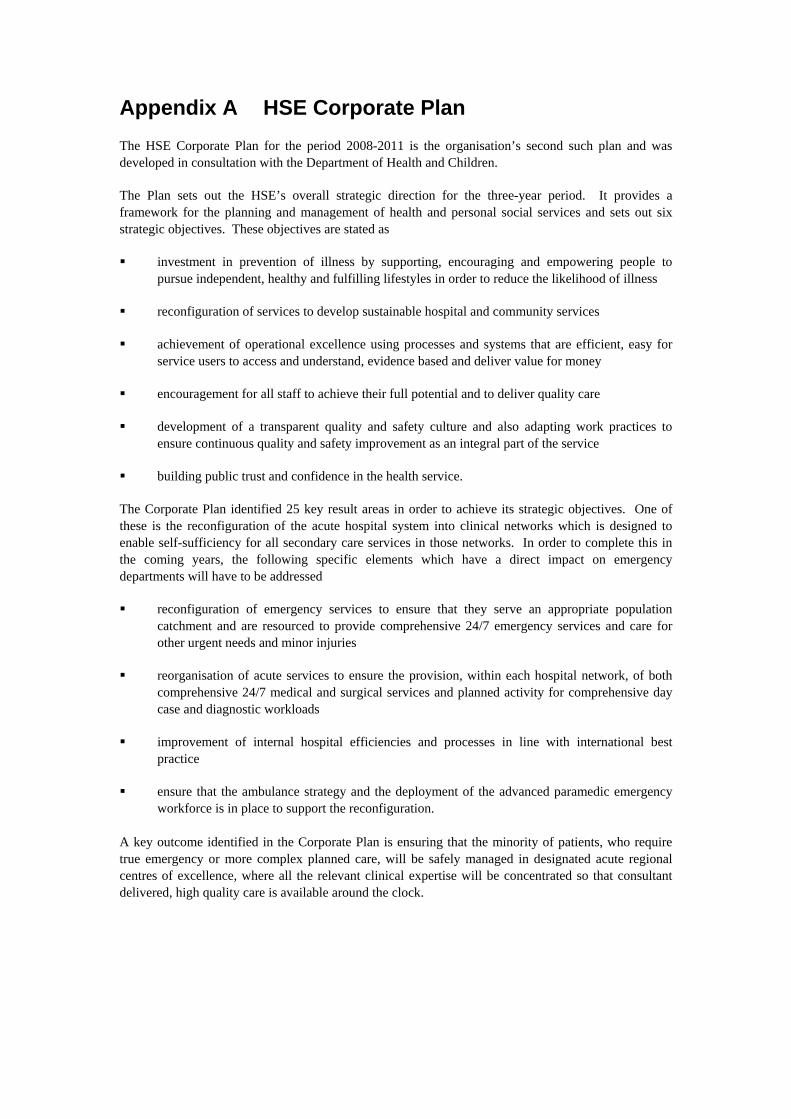
Appendix A HSE Corporate Plan The HSE Corporate Plan for the period 2008-2011 is the organisation’s second such plan and was developed in consultation with the Department of Health and Children.
The Plan sets out the HSE’s overall strategic direction for the three-year period. It provides a framework for the planning and management of health and personal social services and sets out six strategic objectives. These objectives are stated as
investment in prevention of illness by supporting, encouraging and empowering people to pursue independent, healthy and fulfilling lifestyles in order to reduce the likelihood of illness
reconfiguration of services to develop sustainable hospital and community services
achievement of operational excellence using processes and systems that are efficient, easy for service users to access and understand, evidence based and deliver value for money
encouragement for all staff to achieve their full potential and to deliver quality care
development of a transparent quality and safety culture and also adapting work practices to ensure continuous quality and safety improvement as an integral part of the service
building public trust and confidence in the health service.
The Corporate Plan identified 25 key result areas in order to achieve its strategic objectives. One of these is the reconfiguration of the acute hospital system into clinical networks which is designed to enable self-sufficiency for all secondary care services in those networks. In order to complete this in the coming years, the following specific elements which have a direct impact on emergency departments will have to be addressed
reconfiguration of emergency services to ensure that they serve an appropriate population catchment and are resourced to provide comprehensive 24/7 emergency services and care for other urgent needs and minor injuries
reorganisation of acute services to ensure the provision, within each hospital network, of both comprehensive 24/7 medical and surgical services and planned activity for comprehensive day case and diagnostic workloads
improvement of internal hospital efficiencies and processes in line with international best practice
ensure that the ambulance strategy and the deployment of the advanced paramedic emergency workforce is in place to support the reconfiguration.
A key outcome identified in the Corporate Plan is ensuring that the minority of patients, who require true emergency or more complex planned care, will be safely managed in designated acute regional centres of excellence, where all the relevant clinical expertise will be concentrated so that consultant delivered, high quality care is available around the clock.


Appendix B 10-Point Plan The 10-point plan of November 2004 focused on the wider health system. The actions were
The development and expansion of minor injury units, chest pain clinics and respiratory clinics in hospitals to relieve pressure on emergency departments.
The provision of a second MRI at Beaumont Hospital.
The provision of acute medical units for non-surgical patients at Tallaght, St. Vincent’s University Hospital and Beaumont Hospital.
The transfer of 100 high dependency patients to suitable private nursing home care. The scope for using greater numbers of private nursing home beds to alleviate pressure on acute hospitals would also be actively pursued.
Negotiation with the private sector to meet the needs of 500 people annually for intermediate care of up to six weeks. These are older people who are awaiting discharge to nursing home care or back to their own home with appropriate supports.
Expanded home care packages to support 500 additional older people at homes.
Provision of more out-of-hours GP services in order to keep people's need to attend emergency departments to a minimum.
Dedicated cleaning services and security measures for emergency departments.
The further expansion of palliative care facilities.
Measures to enhance direct access for GPs to diagnostic services.
The €70 million allocated under the 10-point plan was mostly allocated in 2005 with subsequent years 2006 to 2008 receiving the balance. The €70m was a ring-fenced allocation. The 10-point plan was incorporated into the current budget of the HSE and allocated as set out in Figure B.1.

82 Emergency Department
Figure B.1 10-Point Plan Allocations
Areas € Million
Minor Injuries Clinics 13.05
MRI Beaumont 0.70
Acute Medical Units (AMUs) 6.75
100 High Dependency Beds 18.68
Intermediate Care 7.95
Home Care Packages 9.93
Out-of-Hours GP Services 2.37
Cleaning and Security 0.57
Palliative Care 3.48
Diagnostics 1.07
Other Allocations to Hospitalsa 5.45
Total 70.00
Source: HSE Note: a Within these allocations resources were used to open closed wards and improve access to intensive care beds.
Figure B.2 outlines what had been achieved by April 2009, according to the HSE.

Appendix B 83
Figure B.2 Achievements by April 2009
Minor Injury Clinics Minor injury clinics have been provided in four Dublin based emergency departments and one at Waterford Regional Hospital and additional funding has been provided for the expansion of the minor injuries services at St John’s in Limerick.
MRI Beaumont The second MRI has now been commissioned. Additional staffing is required to fully optimise the use of both scanners.
Acute Medical Units (AMUs)
In Tallaght Hospital, an Acute Medical Assessment Unit (AMAU) is in place.
In St. Vincent’s University Hospital, a Clinical Decision Unit was opened in place of the AMU.
In Beaumont Hospital, a 29 bed AMAU is under construction.
100 High Dependency Beds
No information.
Intermediate Care No information.
Home Care Packages The HSE has stated that steady progress has been made towards providing Home Care Packages (HCPs). At January 2008, 8,035 HCPs were provided and this had increased to 8,818 by April 2009.
Out-of-Hours GP Services
90% of the population is now covered by an out-of-hours GP service.
Cleaning and Security Dedicated cleaning and security measures were improved in the North Dublin Hospitals.
Palliative Care Facilities Palliative Care Facilities have been developed at Our Lady’s Hospice in Harold’s Cross. These have been in operation since October 2005.
Direct Access for GPs to Diagnostic Services
The HSE has stated that GP access to diagnostic services has improved in Dublin, Sligo, Galway, Mayo, Limerick, Kilkenny, Wexford and Kerry.


Appendix C Report References
Title of Report Author Date Publisher Report Commissioned by
1 Report of the Committee on Accident and Emergency Services
Comhairle na nOspidéal
2002 Comhairle na nOspidéal
Comhairle na nOspidéal
2 Acute Hospital Bed Capacity – A National Review
The Department of Health and Children
2002 - The Department of Health and Children
3 Admissions and Discharge Guidelines – Health Strategy Implementation Project
The Health Boards Executive
2003 - The Health Boards Executive
4 National Review of Bed Management Function – Capita’s Report to the Employers and Unions
Capita Consultants
2003 The Health Service Employers Agency
The Health Service Employers Agency
5 The Commission on Financial Management and Control Systems in the Health Service
The Commission on Financial Management and Control Systems
2003 The Department of Health and Children
The Department of Health and Children
6 Report of the National Task Force on Medical Staffing
The National Task Force
2003 The Department of Health and Children
The Department of Health and Children
7 Report on Nurse Staffing Levels in Emergency Departments in the Republic of Ireland
Healthcare Consulting Limited
2003 The Health Service Employers Agency
The Health Service Employers Agency
8 Comhairle na nOspidéal Acute Medical Units
Comhairle na nOspidéal
2004 Comhairle na nOspidéal
Comhairle na nOspidéal
9 A&E Mapping and Efficiency Review Across 10 National Hospitals
Tribal Secta 2005 Tribal Secta HSE
10 Emergency Department Task Force Report
HSE 2007 HSE HSE
11 Acute Hospital Bed Review A Review of Acute Hospital Bed Use in Hospitals in the Republic of Ireland with Emergency Departments
PA Consulting Group
2007 PA Consulting Group
HSE
12 Acute Hospital Bed Capacity Review A Preferred Health System in Ireland to 2020
PA Consulting Group
2007 PA Consulting Group
HSE


Appendix D The Winter Initiative
In July 2006, the HSE established a programme called the Winter Initiative to address problems within emergency departments. Its primary goal is to reduce waiting times in emergency departments by supporting the development of hospital avoidance initiatives and by focusing on improving hospital processes to generate greater operational capacity. The main focus in the first year was on hospital avoidance measures, increasing capacity and promotion and prevention measures.
An additional fourth element was introduced in 2007 and this was to improve processes within hospitals. These processes were mainly related to reducing length of stays in hospitals in line with best practice such as integration of discharge planning, increasing usage of day surgery and improving access to diagnostics.
A National Director was appointed to direct, monitor and control the programme. Management of the Winter Initiative consists of an executive team, a corporate team, a project team and eight Local Implementation Teams (LITs). The executive team holds teleconferences fortnightly and meets on an ad hoc basis. The Corporate Team, and the Project Team meet fortnightly and the LITs meet monthly. The Corporate Team is chaired by an advisor to the CEO, and is attended by the CEO and the National Directors.
The LITs are made up of hospital network managers, hospital managers, local health managers and other local area health managers. A key task for these teams is the identification and management of resources, local integration mechanisms and the establishment and implementation of integrated care pathways.
The LITs have responsibility for implementation of objectives at local level, as well as devising and implementing local solutions to address specific winter demands. They also work closely with the Population Health function of the HSE at local level.
Regular communications between the LITs and the Winter Initiative Project Team take place to ensure co-ordination of the overall project and to review progress. Weekly Winter Initiative Performance Monitoring reports are circulated.


![[HOW TO] Create High Performance Emergency Departments](https://img.dokumen.tips/doc/110x75/554b8c25b4c90574668b51da/how-to-create-high-performance-emergency-departments.jpg)