Embed Size (px)
Citation preview

Paper No.
337
CORROSION 96The NACE international Annual Conference and Exposition
USE OF ELECTROCHEMICAL NOISE TO MONITORMULTIPHASE FLOW AND CORROSION
Y. P. DEVA, M. GOPAL AND W. P. JEPSONNSF I/UCR<’ CENTER FOR CORROSION IN MULTIPHASE SYSTEMS
DEPARTMENT OF CHEMICAL ENGINEERING
OHIO UNIVERSITYATHENS, OHIO
USA
ABSTRACT
Electrochemical noise measurements were taken in a 7.5 cm diameter, 10 m long lmultiphaseoi I/water/gas flow system. Full pipe flow studies were conducted for liquid velocities of 0,8, 1.0 and 1.5ntis and slug flow for Froude numbers 4, 6, 9 and 12, using two phase (ASTM standard saltwater and carbondioxide gas) and three phase (oil of 2cP viscosity. saltwater and gas) flow. The pressure was maintained at134 KPa and temperature at 40 C. Noise data was measured with a Zero Resistance Ammeter and analyzedusing software provided with the instrument. The noise fluctuations show trends which can be related tothe type of 11ow. Full pipe flow studies show random fluctuations around the mean for both potential andcurrent noise.This implies the occurrence of uniform corrosion. The Fast Fourier Transform (FFT) showsroll-off greater than -40 dB/decade in magnitude, characteristic of unifoml or general corrosion. In slug flowthe potential noise fluctuations take the form of characteristic transients. The frequency of these transientscorrespond to the observed frequency of slugs. The FFT of this data shows roll-off slopes less than -20dB/decade shown to be characteristic of pitting corrosion. A second slope of magnitude greater than -30dB/decade is observed at higher frequencies and this might signify the presence of a second time constantcontrolling the corrosion reaction. This is due to the unique mechanisms associated with the mixing zoneof slugs. Peaks in the Fast Fourier Transform (FFT) are also seen at particular frequencies. One of thesecorresponds to the slugging frequency. An increase in the percent change in standard deviation of currentwith Froude number implies enhanced corrosion activity on the surface of the electrode.
The electrochemical noise technique is extremely useful for studying corrosion mechanisms andtlow parameters in multiphase flow pipelines. Its ability to isolate dynamic incidents and study them both
CopyrightW 996 by NACE International. Requests for permission to pubhsh this manuscript in any form, in part or in whole must be made in writing to NACEInternational, Conferences Division, PO. BOX 218340, Houston, Texas 77218-8340. The material presented and the wews expressed in thspaper are solely those of the author(s) and are not necessarily endorsed by the Association. Printed in the U.S.A.

in the time and frequency domain makes it a powerful tool for gaining an insight into mechanisticinformation on corrosion in multiphase pipelines.
Keywords Electrochemical noise. horizontal multiphase flow, corrosion, slug ilow, pitting, localizedcorrosion, roll-off slope
INTRODUCTION
The depletion of accessible oil resources has directed oil production to remote areas, such as the sub-sea and Alaska. A multiphase mixture of oil, seawater, carbon dioxide, and natural gas which is requiredto be transported in pipelines to central gathering stations. The water cut can be up to 90!40. The presenceof carbon dioxide causes internal sweet corrosion (i.e., carbon dioxide corrosion). The carbon dioxide andsaltwater mixture results in the formation of a weak, corrosive carbonic acid which significantly incrcasl~sthe corrosion rates in carbon steel pipelines. Maintenance operations are very difficult and expensive. Itis imperative that proper design and operating conditions be maintained to Iminimize corrosion. For theselection of appropriate mechanical design parameters, it is imperative to quantify corrosion.
In oil-gas production pipelines, there are many different types of flow regimes (Lee and Jepson(1993) 1. At a higher gas velocity, turbulent nlixing between liquid and gas results in tile formation Ofhighlyaerated bodies of liquid called slugs. Slug flow is mainly composed of a slow moving liquid film beingscooped up by an extremely turbulent slug front, resulting in liquid and gas entrainment.
The intluence of these flow regimes on corrosion processes is not well understood. Multiphase sl~lgflow is known to significantly enhance internal corrosion in oil-gas production pipelines. This is due to theintermittent nature of slug flow and the high levels of shear stress and turbulence occurring at (he slug front.Green, Johnson and Choi ( 1989)? investigated the effects of’different flow regimes on corrosion rates inIield studies. They showed that instantaneous corrosion values when a slug passes are at least two ordersof magnitude higher than those existing under stratified flow.
Sweet corrosion has been studied by various researchers though most of the earlier studies werecarried out in single phase systems using deionized water or brine solutions saturated with carbon dioxicle.Moreover, these studies were mainly conducted in rotating cylinders and autoclaves. Recently, studies ha+ebeen conducted in smaller diameter pipelines for single phase flow-s. However, Efird et al. (1993)3 showedthat the extrapolation of these to larger diameter pipelines or to multiphase flows can lead to grave errors.
Zhou and Jepson (1993J) studied flow and corrosion at several slug flow conditions. In her studies,she used Linear Polarization Resistance and Electrical Resistance techniques, and Weight Loss
]measurements to quantify overall corrosion rates for full pipe flow and slug flow. However, an insight intothe type of corrosion or the mechanisms involved was required.
Vuppu and .lepson (1994)5. studied corrosion products on carbon steel coupons at various
temperatures and at different flow conditions. They observed uniform corrosion for full pipe flow and
pitting type corrosion under slug flow. The measurements were taken over long periods of time andinstantaneous effects could not be isolated
Extensive research has been conducted to develop the electrochemical noise technique as an effective
337/2

analysis tool for corrosion studies. Hladky and Dawson (1981 )b studied the voltage noise output underuniform or general corroding conditions. They found that pit initiation occurs when the environmentalconditions become aggressive, i.e. after chloride ion addition. The potential signals were characterized bynoise bursts. Moreover, random fluctuations about a mean was observed for uniform corrosion.
Eden and Rothw-ell. (1992)7 have shown that during pitting corrosion, the current transients arenormally bidirectional with both positive and negative excursions. The duration of the transients identifieswhether the specimen is undergoing pit propagation or pit initiation. The potential time records are typifiedby electronegative excursions followed by an exponential recovery as the current transient ceases.
Webster et. al. (1994)8 applied the electrochemical noise technique to monitor corrosion under threephase multiphase flow. They found that the technique can detect changes in flow regime and discriminatethe performance of inhibitors on a qualitative basis. They observed characteristic transients in the currentand potential noise as the slug goes by.
This paper reports the use of electrochemical noise to study the effect of multiphase flow oncorrosion in horizontal pipes.
EXPERIMENTAL PROCEDURE
The flow loop schematic is shown in Figure 1. Liquid is pumped by a 2.3 kW stainless steelcentrifugal pump from a 0.6 ms stainless steel storage tank through a 50 mm I.D. PVC Pipe into a 0.03 rn3stainless steel mixing tank.. The liquid flow rate is controlled by valves and a by-pass line and is monitoredby means of an orifice plate.
Carbon dioxide gas, from a pressurized 1.67 m3 tank is introduced into the system at an inlet pressureof 900 kPa (100 psi). The gas flow rate is controlled by a gate valve and is monitored by means of variablearea gas flow meters.
The multiphase mixture then flow-s through a 75 mm I.D., 10 m long acrylic pipeline, where all themeasurements are made. The mixture is discharged into the liquid storage tank where it is separated bymeans of a perforated separator plate. The gas is exhausted to the atmosphere. The system is equipped witha back pressure regulator to maintain a constant system pressure.
Measurements are taken in the test section as shown in Figure 2. At position A, the ElectrochemicalNoise probe is inserted. At position B and C, flush mounted Electrical Resistance and Linear PolarizationResistance probes respectively can be inserted to measure the corrosion rate at the bottom of the pipe.Pressure tappings are located at point D and upstream of the test section.
The temperature of the liquid is measured using a Type J-K-T thermocouple inserted at position E.At position F, flush mounted hot film sensor inlets are provided for measurement of the wall shear stressand turbulent intensity of the flow at the bottom of the pipe. However, these are not used in this study
G is a 6 mm diameter sampling probe used to withdraw fluid samples from the bottom of the pipeand into a graduated cylinder. The volumes of oil and water are measured and the oil fraction at the bottomof the pipe calculated.
337/3

The level of oxygen in the system is monitored using CHEMets Dissolved Oxygen Test Kits. andoxygen in the liquid is maintained at less than 10 ppb. The iron concentration in the system is monitored byusing CH13Mets Dissolved Iron Kits and is maintained at less than 10 ppm.
The electrochemical noise probe is shown in Figure 3. It is a three electrode Cormon (UK) probe andis inserted through a 3.18 cm inlet. The three electrodes are set in an 3.18 cm O.D. tube. The exposedsurface of the electrodes are flush mounted on the pipe wall. The working electrode area exposed is 0.38Cnlz.Current and Voltage measurements across the probes are measured with an ACM Instrument Inc. AutoZero Resistance Ammeter V2. The instrument allows current measurements ranging from 325 mA to 1()pAand resistances 10. 100, 1K, 10K, 100K, 1M, and 10M Ohms where the range selection could beautomatic or manual. Two 5 ?4 digit Analog to Digital convertor are integrated into the Auto ZRA, Thisallow-s up to 50 measurements of current and voltage every second complete with real time display.
The Auto ZRA is connectedtoa386 SX/20C Gateway 2000 microcomputer. The data is logged andanalyzed using software provided with the Auto ZRA. The software runs in Microsoft Windowsenvironment with a real time Excel link,
System temperature and pressure are maintained constant at 40C and 136 KPa for all experirnenis.The oil used is a low viscosity oil. similar to that in condensate systems, of density 800 kg/ins and viscosity~ Cp at ZH)C,Experiments are conducted for full pipe liquid flow and slug flow. Liquid velocities of 0.8, 1.0.
and 1.5 m/s are used for full pipe flow and slug flow experiments are conducted at Froude numbers of 4.6.9, and 12. The gases used are carbon dioxide and nitrogen. ECN and ER measurements are taken at eachcondition,
Additionally, an experiment is conducted for no flow condition, wherein the entire system includingthe pipes is filled with salt water and measurements are taken for 24 hours under no flow.
RESULTS AND DISCUSSIONFull Pi~e Flow
1000/0 saltwater
Figure 4 shows voltage and current data for 100% saltwater, after 5 hours of operation for a velocitjof 1.0 m/s for full pipe flow. Random fluctuations around a mean are seen in the voltage and current
response. This response is similar to that obtained by Hladky and Dawson (1981 )6. These types offluctuations have been described as the characteristic response of uniformly corroding systems. The typeof corrosion taking place in full pipe flow conditions can hence be qualitatively interpreted as uniformcorrosion. Data is collected at a rate of 5 Hz. The magnitude of mean voltage and current does not show anycorrelation with the flow velocity. This is seen to be typical of electrochemical noise systems. However.the effect of flow velocity is seen in the average peak to peak fluctuation in the voltage response.
60’!!ooil
The 1 rds full pipe flow noise response for 60% oil, in Figure 5, shows similar random tl actuationsindicative of uniform corrosion. The peak to peak fluctuations in the voltage noise are around 0.3 mV whichis the same as that observed for saltwater and lower oil percentages. The visibly greater density of
337/4

fluctuation is due to a higher data collection rate and does not characterize the response of the system. Thepeak to peak current fluctuations are around 0.3 mA/cmz which is also the same as that observed with 20(%oil. This is because water is still the continuous phase at the bottom of the pipe.
800/0 oil
Increasing the oil in the liquid phase to 80 Yo, also results in random fluctuations around a mean fix-1 m/s full pipe flow, shown in Figure 6. However, these are characterized by high voltage bursts in thevoltage fluctuations. These bursts are of the order of magnitude of 10-15 mV. The oil fraction at the bottomof the pipe is seen to be 0.72. This implies that the 20°/0 seawater phase contacting the bottom of the pipeis responsible for uniform corrosion taking place on the surface of the electrode. The high magnitude burstsin voltage indicate instantaneous oil continuous phase effects. The average peak to peak voltage fluctuationsare 5 nlV in magnitude. These types of fluctuations characterize the response of a system wherein thereaction process is suppressed due to the presence of a non-conducting solution.
100% saltwater-nitrogen gas
To isolate the effect of flow on the noise response, nitrogen gas was used instead of carbon dioxide,and full pipe flow study conducted for 1 m/s flow velocity. Since the solution is basic in nature (pH isaround 8) for this system, a lack of hydrogen ions can significantly suppress the cathodic reaction whichinvolves the reduction of hydrogen ions. Hence. corrosion is expected to be none or little.
The voltage and current response for full pipe flow 1 rrds is also characterized by random fluctuationsaround a mean similar to those obtained for 100°/0saltwater with carbon dioxide as the gas phase. as shownin Figure 7. However, the density (or frequency) of fluctuations at the same data collection rate, is reduced.compared to the corresponding response for carbon dioxide/ saltwater system shown in Figure 4. The peakto peak voltage fluctuation is 0.5 mV which is much higher than the corresponding value with carbondioxide gas. l’he peak to peak current fluctuation is 0.2 mA/cmg, which is the same as that for the carbon-dioxide system. The peak to peak voltage fluctuation is seen to increase with increase in oil percentage al:soas explained earlier. It appears to characterize the extent of reaction. For less corrosive systems, the voltagepeak to peak fluctuations appear to increase, whereas, the current peak to peak fluctuations appear to
increase with decrease in conductivity of the solution.
10O(YISaltwater, No flow, Carbon-dioxide gas
For no-flow condition, the entire system including the pipes are filled with saltwater, ECN readingsare taken without switching on the pump. Noise response is shown in Figure 8. Random fluctuations arounda mean are seen for both voltage and current data. On comparing this response with that obtained for fhl 1pipe flow, similar random fluctuations are observed, however, the magnitude of the voltage is much lowerand the degree of fluctuations at the same data collection rate lesser for no-flow condition. Jones (1991 )()has explained that the corrosion of carbon steel in chloride based acidic solution is uniform in nature for nonflowing liquid. The noise response seen here confirms that the type of corrosion seen for the full pipe ilcw-and no-flow conditions here is uniform. The peak to peak voltage flactuations are seen to be the same asthat for full pipe flow.
337/5
Shw Flow
1000/0 Saltwater
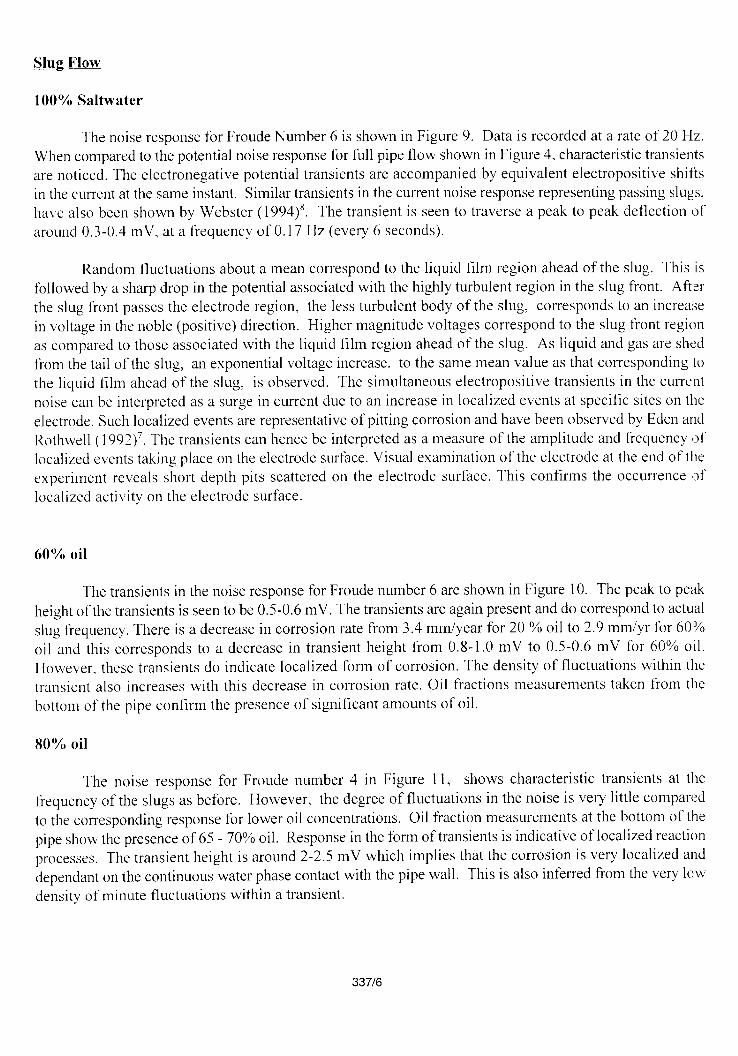
The noise response for Froude Number 6 is shown in Figure 9. Data is recorded at a rate of 20 Hz.When compared to the potential noise response for full pipe flow-shown in Figure 4, characteristic transientsare noticed. The electronegative potential transients are accompanied by equivalent electropositive shiitsin the current at the same instant. Similar transients in the current noise response representing passing slugs.have also been shown by Webster (1994)8. The transient is seen to traverse a peak to peak deflection of’around 0.3-0,4 mV, at a frequency of 0.17 Hz (every 6 seconds).
Random fluctuations about a mean correspond to the liquid film region ahead of the slug. This isfollowed by a sharp drop in the potential associated with the highly turbulent region in the slug front. Aft:rthe slug front passes the electrode region, the less turbulent body of the slug, corresponds to an increasein voltage in the noble (positive) direction. Higher magnitude voltages correspond to the slug front regionas compared to those associated with the liquid film region ahead of the slug. As liquid and gas are shedfrom the tail of the slug, an exponential voltage increase, to the same mean value as that corresponding tothe liquid film ahead of the slug, is observed. The sinlultaneous electropositive transients in the currentnoise can be interpreted as a surge in current due to an increase in localized events at specific sites on theelectrode. Such localized events are representative of pitting corrosion and have been observed by Eden andRothwell ( 1992)7. The transients can hence be interpreted as a measure of the amplitude and frequency of’localized events taking place on the electrode suriace. Visual examination of the electrode at the end of theexperiment reveals short depth pits scattered on the electrode surfiace. This confirms the occurrence (oflocalized activity on the electrode surface.
60’!/0 oil
The transients in the noise response for Froude number 6 are shown in Figure 10. The peak to peakheight of the transients is seen to be 0.5-0.6 mV. The transients are again present and do correspond to actualslug frequent y. There is a decrease in corrosion rate from 3.4 mm/year for 20 0/0 oil to 2.9 mm/yr for 60’%oil and this corresponds to a decrease in transient height from 0.8- 1.0 mV to 0.5-0.6 mV for 60°/0 oil.IHowever, these transients do indicate localized form of corrosion. The density of fluctuations within thetransient also increases with this decrease in corrosion rate. Oil fractions measurements taken from thebottom of the pipe coniirrn the presence of significant amounts of oil.
80”/0 oil
The noise response for Froude number 4 in Figure 11, shows characteristic transients at the
frequency of the slugs as before. However, the degree of fluctuations in the noise is very little compared
to the corresponding response for lower oil concentrations. Oil fraction measurements at the bottom of thepipe show the presence of 65- 70°A oil. Response in the form of transients is indicative of localized reactionprocesses. The transient height is around 2-2.5 mV which implies that the corrosion is very localized anddependant on the continuous water phase contact with the pipe wall. This is also inferred from the very lowdensity of minute fluctuations within a transient.
33716

100°/0 saltwater, Nitrogen gas
Figure 12 shows the potential and current fluctuations for a Froude number of 6. The degree offluctuation in the noise response is seen to be less than those with carbon dioxide as the gaseous phase.Moreover. a sharp increase is seen in the magnitude of mean voltage from that observed with carbonclioxide for 100°/0 brine. Since the nitrogen gas changes the pH of the solution to 8, the corrosion isexpected to be much lower for this system. However, the noise response is characterized by transients andfluctuations which clearly indicate that the flow is having a significant effect on the reaction taking placeon the electrode surface. The high mean voltage value is probably a result of low hydrogen ionconcentration affecting the ionic flow in the corrosion reaction.
Freauency Res~onse
Parameters typically studied in the frequency spectrum are the low-frequency cut-off, roll-off slopes,and peaks in the spectrum. Researchers have found a correlation between these parameters and the corrosiontype and mechanism. In a typical spectrum plotted on a logarithmic scale a high magnitude of noiseamplitude occurs at low frequency. This remains constant at very low frequencies and then, rolls off at ahigher frequency to much lower amplitudes of noise. The slope of this roll-off suggests the type of corrosiontaking place.
The amplitude is calculated by a Fast Fourier Transform algorithm in mV/Hzl’~. However, the unitwhich best quantifies levels of noise is the dB. Therefore, it has been adopted in this analysis. The referencevoltage has been taken as 1 V. The slope is calculated in dB/decade by taking the drop in this amplitudeover a decade of frequency.
Full Pipe Flow
Potential noise spectra of the 1 m/s full pipe flow data for 0?40,60°/0, and 80 ‘A are shown in Figures13, 14, and 15, respectively. Units on the y-axis for the noise amplitude are in mV/Hz’ ~. However, Mdiscussed earlier, these are converted to dB and analyzed. The figures show roll-off values of -42, -34, and-30 dB/decade respectively. These correspond to uniform corrosion or general corrosion as shown by
Searson and Dawson ( 1988)1[). This also confirms earlier visual observations of uniform corrosion oncoupons Vuppu and Jepson (1994)5.
Slug Flow
Frequency transforms of the potential noise data for Froude number 4, 6 and 12 for 10OOAsaltwaterare plotted in Figures 16, 17, and 18 respectively. For a Froude number of 4, the roll-off slope is -31dB/decade at frequencies below ().8 HZ and -11 dB/&ca& at higher frequencies between 0.6 HZ and 61 Iz.
The change in the slope has been explained as the presence of two time constants controlling the reactionmechanism by Chavarin (1991)11. Hladky and Dawson (1982)6 have shown that shallow slopes less than-QOdB/decade in magnitude are characteristic of pitting COITOSiOIl and slopes greater than -40 dB/decade
w-e characteristic of uniform corrosion. A low frequency slope of -31 dB/decade for Froude number 4suggests a mixed type of mechanism.
337/7

For Froude number 6. -18 dB/decade slope is seen both in the low frequency region of 0.03 Hz andin the higher frequency region of 0.3 Hz, indicating pitting as the type of corrosion. Visual examination ofthe electrode shows shallow pits on the surface of the electrode. For Froude number 12, the high low-frequency cut-off is accompanied by very high magnitude peaks. The observed slugging frequency of 0.’25Hz corresponds to a high noise level of-124 dB/Hzl’z. A shallow slope of-16 dB/decade is observed in thespectra. This again indicates the occurrence of pitting type of corrosion.
Two high amplitude peaks at low frequencies of 0.14 Hz and 0.32 Hz are observed for Froudenumber 4. Of these, the lower frequency, 0.14 Hz. corresponds to the observed slug frequency, The secondpeak is indicative of the corrosion mechanism.
From Figures 15-17 it is noted that the low frequency roll-off slopes in slug flow are always less than-20 dB/decade in magnitude. These shallow slopes have been shown by Hladky and Dawsond to be
characteristic of pitting corrosion. Also, visual inspection of the probe does confirm the presence of shallowpits.
CONCLUSION
Full pipe flow studies at 1 m/s velocity are conducted for oil compositions upto 80 Yo. Randomfluctuations in the voltage and current noise around a mean are seen at all oil compositions, implyinguniform corrosion. However. the magnitude of fluctuations is seen to increase with oil composition. Asharp increase in the magnitude of fluctuation is seen when the oil composition is increased from 60°/0 to80 YOand the response is characterized by instantaneous fluctuations in the noise response. This indicatesthe presence of-a continuous oil phase wherein the conductivity of the solution is very low resulting in largemagnitude voltage fluctuations. Corrosion rate for 80 0/0oil composition is seen to be negligible comparedto the OO/O.20 ‘Yo.and 60°/0 oil cuts.
Voltage vs time plots for Froude Nos. 4, 6, 9 and 12 show characteristic transients at the sameji-equency of the observed slugs for up to 60°/0 oil in the liquid phase. Random fluctuations about a meancorrespond to the liquid film region ahead of the slug. This is followed by a sharp drop in the potential
associated with the highly turbulent region in the slug front. After the slug front passes the electrode region,the less turbulent body of the slug, corresponds to an increase in voltage in the noble (positive) direction.IHigher magnitude voltages correspond to the slug front region as compared to those associated with theliquid film region ahead of the slug. As liquid and gas are shed from the tail of the slug, an exponentialvoltage increase, to the same mean value as that corresponding to the liquid film ahead of the slLlg, areobserved. The simultaneous electropositive transients in the current noise can be interpreted as a surge incurrent due to an increase in localized events at specific sites on the electrode. Hence, these transientsrepresent slugs and signify the occurrence of localized activity on the electrode surface. Electronegativetransient trends in potential plots correspond to electropositive trends in the current plots, characteristic of’pitting corrosion.
For 80 YO oil composition, transients are observed for Froude number 4, however, they disappearat Froude number 9 and 12 and are replaced by instantaneous large magnitude fluctuations similar to thoseseen for full pipe flow at the same oil composition. These imply oil continuous phase at the bottom of tnepipe even at these high Froude numbers. The corrosion is expected to be very little because the magnitudeof these fluctuations is similar to that for no flow condition.
337/8

Low frequency roll-off slopes less than -20 db/decade are observed in the spectra of the slug tlowtime records for up to 60°/0 oil composition. These shallow slopes have been shown to be characteristic ofpitting corrosicm. The presence of a second slope at higher frequency signifies the presence of a second timeconstant controlling the reaction. The presence of peaks in the spectra at particular frequencies has also beenrecorded. (he of the peaks corresponds to the slugging frequency for all the Froude numbers studied.
REFERENCES
1. Lee. A-H, Sun, J-Y, and Jepson, W. P.. ‘bStudy of Flow Regime Transitions of Oil-Water-GasMixtures in Horizontal pipelines+’, 3rd Int. Proc. ISOPE, Vol. II., (1993): p. 159.
-)-. Green, A. S., Johnson, B. V., and Choi. H. J., “FIOW Related Corrosion in Large Diameta-Multiphase Flowlines”. SPE paper 20685, (Houston. TX: SPE 1989).
3. Eflrd. K. D., Wright. E. J., Boros, J. A., and Hailey, T. G., ‘“Wall Shear Stress and Flow AcceleratedCorrosion of Carbon Steel in Sweet Production”, NACE/93, (Houston, TX: NACE International, 1993).
4. Zhou. X., and Jepson, W. P., “Corrosion in Three-Phase Oil/Water/Gas Slug Flow in HorizontalPipes”, Corrosion/94. Paper no, 94026, (Houston, TX: NACE International, 1994).
5. Vuppu, A.K,, and Jepson, W.P., “Study of Sweet Corrosion in Horizontal Multiphase, Carbon SteelPipelines”. Offshore Technology Conference, 7494/265-7494/276, (Houston, TX: SPE 1994).
6. Hladky, K., and Dawson, J.L.. “The Measurement of Localized Corrosion Using Electrochemical
Noise”. Corrosion Science. 21, (1981): p, 317.
7. Eden, D. A., and Rothwell, A. N., “Electrochenlical Noise Data: Analysis, Interpretation and
Presentation,” Corrosion/92, paper no. 292. (Houston, TX: NACE International, 1992).
8. Webster, A. S. et. al.. “The Application of the Electrochemical Noise Technique for CorrosionMonitoring [Jnder Multiphase Flow Conditions”, First International Symposium on Electrochemical Noise
Measurement for Corrosion Applications, Montreal, Canada, Paper 28, May 16-17, 1994.
9 Jones, D. A., “Principles and Prevention of Corrosion”, (New York, NY: Macmillan Publishing
Company, 19c~l).
10. Searson. P. C,, and Dawson, J.L., “Analysis of Electrochemical Noise Generated by Corroding
Electrodes under Open-Circuit Conditions”, J. Electrochem. Sot., 135, (1988): p. 1908.
11. Chavarin, J. U.. “Electrochemical Investigations of the Activation Mechanism of Aluminum”,
Corrosion, 47, (1991): p. 472.
337/9

/-”-RingFlange
3 : ~ ‘Uuu
Flange B FLOW DIRECTION Flan~A Flange B
o-- ~ –
-.f J
:7’CY2C:02J
A B
~ ,Icm 56cm~
A. CORMON PROBE (3 Electrodes of lcm diameter set into a 3.2 cm tube)B. ER PROBES (3.2 cm diameter)C. LPR PROBE (3.2 cm diameter)D. PRESSURE TAPPINGS (2 cm diameter X 2 cm thickness block with 0S2 cm hole)E. DIGITAL THERMOMETER PROBE (0,32 cm Probe diameter)F. SHEAR STRESS PROBES ( 2 cm diameter X S cm thkk block with 0.32 cm hole)G, SAMPLING PROBE (0.8 cm diameter)
Figure 1 : Test Section

It
II337/11

3’z+
#111111’111’’’’’’’”” ‘“ I I I I I 4
0200
1“” Time (seconds)
I I I I I I I II I I I I I I i i I I I 1
4.2 i i I I i I I I I
a-l
-4+
I I I I I I I I
I I 1 I I I I i I I I I I I I I I I I I
o 100 200
Time (seconds)
Figure 4: Voltage and current noise response after 4 hours for 1.0 nds full pipeflow. 100 % saltwater with carbon dioxide Sampling rate= 5 HZ
337112

-.6 I I i I I 1 I I i I I I I I I 1 II
I I I I I I I I I
# I
1’1
kill 1,1, ,,, , [,,,,,,,,,1,,,,, ,,l,j100 200
Time (seconds)
[ I 1 I I I I I I I I I i I I I I I I I I I I I I i
El 1 I I ,!1, I I 1 I I I I 1 1 I I I I I I I I I ! I I i
100 200
Time (seconds)
Figure 5: Voltage and current noise response after 4 hours for 1.0 mk full pipeflow. 40% saltwater - 60% oil with carbon dioxide. Sampling rate = 10 Hz
337113

ft- 1 I I I II I I I I i I I I I I I I I i I I I i I I I
II 4
-20I}1 I I I I I I I I I I I I I I n
100 200
Time (seconds)
# I I I 1, J I I I I I I P I I I I I I I I I i I I I I I I Ifl
‘EL_Ju_I I I I I I I \ I I
1. y --j
100 2W
Time (seconds)
I I I I I I I I 1 4..-
Figure 6: Voltage and current noise response after 4 hours for 1.0 nds fill pipeflow. 20% saltwater - 80% oil with carbon dioxide. Sampling rate =10 HZ
337fl4

I Illr 1 I n
-2
.25
tLI I [ I I I I
I
200
111111 1111
J 1 II
I 1 I I 1 I I I [ I I I 1 11400
Time (seconds)
IFII I I [ II I I I I I I i I I [ I I I I I I I I 1 I I I I I A
4.9
4a
4.7
4.6
4s &
4.4L
I II -a
I I I I [ I I I I I I I II
J I I I 1 ! [ [
200 400
Time (seconds)
Figure 7: Voltage and current noise response for 1 nds f~l pipe flow100% saItwater with nitrogen. Sampling rate= 2 HZ
337fl5

t“’’’’’ ’’l ’’’’’’’’’l’’’’’”” 1“’’’”
tllllll 1111111 lflflll l’’’’”” 1“I
---
50 15U
Time(secm%)
3.7 ~1 I I I I I I I I 1 I i I I i I 1 I i I I I I I I I I1“””~
I
t I 1., 1
33 —I I I I I I I I I ,,1,,,1 1,1,111111111,1,, d
50 100 150
Time(seconds)
Figure 8: Voltageandcmrentnoiser~Ponse fornOflOW
100 % saltwater with carbon dioxide. Sampling rate= 1 HZ
337116

k’1’ I I I I I I I I I I i I I I I II
I I I I I I i I I l-l
-.6
-.65
7-.
-.75!1
i-u- 1 I I I I I I I I I I I I I I I I I I I I I I 1 1 d
‘0 Time (seconds)300 w
E’ I I I i I I I II
I I I I i I I I II
i i I I i I i I IH
.75
.7
~’,,,1,1,,11’,,1200 300 do(l
I I
I I I I I I I I I I I 1 1 I I 1
Time (seconds)
Figure 9: Voltage and current noise response after 4 hours for 0.8 rrdsfull pipeflow. 100 % saltwater with carbon dioxide. Sampling rate= 5 HZ
337117

-.8 I I I I I I I I 1I
i I I I I I I I I I I I I I i 1 i I
tt I I i I I I I I I I I I I I I I I I I I I I I I I I I +i
oM Time (seconds)
40
I I I I i i I IEl I I I I 1 I I I I I i I I \ I I 1
Ii I ‘1 d
2.7
2.6
2s
2.4
0 20 40
Time (seconds)
III-a
1“1
J-l_uuJ
Figure 10: Voltage and current noise response for Froude number 6 movingslug flow. 40 YOsaltwater -60 Yooil with carbon dioxide. Sampling rate= 20 HZ
337118

E’ [ I I I i i I 1 I I i I I 1 I I I Ii 1 I i I I i I i a
it
-7 —
-8~
-9 —
-lo r-
24
2.7
2.6
2s
k I I I I I I I 1 I I I I I I I I I I I 1 I I I I I I I
20 40
Time (seconds)
[111111 lllflll 11111, ,1, ,,, ,,~20 40
Time (seconds)
Figure 11: Voltage and current noise response for Froude number 4 movingslug flow. 20 % saltwater -80 YO oil with carbon dioxide Sampling rate = 20 HZ
337119

0
-1
-2 —
Jlllllllllllllll’’’’l’” “’’”
o 20 40
Time(seconds)
1
E“’’’’’ ’’l ’’’’’’’’’l’” “’”I d
4
39
3A
3.7
1=
EI I I
Tlme(seconds)
‘1 -2
3tJ_u_L J 1 I I I I I I [ I I
o 20 40
I I I I I I I 1 I
Figure 12:Volt.agemdcurrent noise response forFroudenumber6 movingslug flow. 100 %saltwater with nitrogen. Sampling nte=20Hz
337/20

l-’ I I I 1 1 I I I I [ I I I I I I [ I I I I I I
1
lmooEM1II .
1MOE45 b ‘\/\ A 4v \ II II
MOOE-08~
r I I I I I II I I I 1 I I I I I I I 1 I I I I I 1
LOOOE-02 I.000IM1 1.000E+OO
Frequency (Hz)
Figure 13: ECN amplitude spectrum for lm/s full pipe flow100% saltwater with carbon dioxide
337/21

1 I IIu I I I I 1 II1 I I I I I I II I I I I
LOOOE-02 LOOOE-01 1.WOE+OO
Frequency W)
Figure 14: ECN amplitude spectrum for lm/s full pipe flow40% saltwater - 60% oil with carbon dioxide
337/22

E-’[”l i I [ I 1 I I I I I I I 1 [ I I I [ Iy
LOOOE-01 y-3
h I’1IL!AA1JCIOE42& II Vvll L1’
v-
LOWE-03 L- 1 1!1!
lDwE-a4 k ‘a
LOWE-OSL 4
1ROOE4M!- 3
I 1 II I 1 I I I I ! I I I 1 1 I I II 1 I I il
1.WOE-02 1.llooE411 1.000E+OO
Frequency (Hz)
Figure 15: ECN amplitude spectrum for lnds full pipe flOW
20% saltwater - 80% oil with carbon dioxide
337123

R I I I I I I I I I [ I i I i I I1
l.woE-o&\ n 1
lDOOE-OS
1.000E-06
1
t
lMIOE-07 L
1.000E43k 7
L I I I ! I I I I I I I I I I 1 I I I I I I I I I
1.000E-01 LOWE+(YI
Frequency @z)
Figure 16: ECN amplitude spectrum for Froude number 4 meting slug flow100% saltwater with carbon dioxide
337124

\
I 2
M
L
1LOOOEJMr
1.OWE-05~
1.U30E-06r
LoooE41 r
1.000EJM:
J I I 1 I 1I I II I I I I I I I I I I I I I I I 1
I.ooal%.oz IJ300E41 LOOOE+OO
Frequency (Hz)
Fire= 17: ECN amplitude spectrum for Froude number 6 moving slug flow100%saltwater with carbon dioxide
337125

P i I I I I 1 I I i I I I I I I I I I I I I i [
t
LDOOE-05
LMOM611.000E-07
L
1.000E-08&
t1.000E-09~
E , Ill I I I I I I I I I I [ I I I I I
1.000E-01 1.000E+OO
Figure 18: ECN amplitude spectrum for Froude number 12 rnoting slug flow100% saltwater with carbon dioxide
337f26