Embed Size (px)
Citation preview

Use of a Genesis Potential Index to Diagnose ENSO Effects on TropicalCyclone Genesis
SUZANA J. CAMARGO
International Research Institute for Climate and Society, Lamont Campus, Palisades, New York
KERRY A. EMANUEL
Program in Atmospheres, Oceans, and Climate, Massachusetts Institute of Technology, Cambridge, Massachusetts
ADAM H. SOBEL
Department of Applied Physics and Applied Mathematics, and Department of Earth and Environmental Sciences,Columbia University, New York, New York
(Manuscript received 20 June 2006, in final form 12 February 2007)
ABSTRACT
ENSO (El Niño–Southern Oscillation) has a large influence on tropical cyclone activity. The authorsexamine how different environmental factors contribute to this influence, using a genesis potential indexdeveloped by Emanuel and Nolan. Four factors contribute to the genesis potential index: low-level vorticity(850 hPa), relative humidity at 600 hPa, the magnitude of vertical wind shear from 850 to 200 hPa, andpotential intensity (PI). Using monthly NCEP Reanalysis data in the period of 1950–2005, the genesispotential index is calculated on a latitude strip from 60°S to 60°N. Composite anomalies of the genesispotential index are produced for El Niño and La Niña years separately. These composites qualitativelyreplicate the observed interannual variations of the observed frequency and location of genesis in severaldifferent basins. This justifies producing composites of modified indices in which only one of the contrib-uting factors varies, with the others set to climatology, to determine which among the factors are mostimportant in causing interannual variations in genesis frequency. Specific factors that have more influencethan others in different regions can be identified. For example, in El Niño years, relative humidity andvertical shear are important for the reduction in genesis seen in the Atlantic basin, and relative humidity andvorticity are important for the eastward shift in the mean genesis location in the western North Pacific.
1. Introduction
Understanding the influence of large-scale environ-mental factors on tropical cyclogenesis is a problem ofgreat scientific and societal importance. While much isknown about which factors influence genesis, a quanti-tative theory is lacking. In the absence of such a theory,empirical methods are useful. Gray (1979) developedan index that was able to replicate key features of theseasonal and spatial variability of observed genesis us-ing a handful of environmental parameters. Such anindex is useful in several ways. First, it provides anempirical quantification of the relative contributions of
various environmental factors toward genesis. Second,it may conceivably be useful in developing schemes forforecasting tropical cyclone (TC) number, to the extentthat an independent capability exists to forecast thelarge-scale environmental variables which enter the in-dex.
Here, we present another genesis index and constructcomposites of it with respect to both the annual cycleand the El Niño–Southern Oscillation (ENSO) phe-nomenon. Our first goal is to evaluate the ability torepresent observed variations of tropical cyclone num-ber with the annual cycle and ENSO in various basins.These are fair tests of the index since the index wasconstructed with only climatological information foreach hemisphere as a whole. The test of the ability ofthe index to reproduce observed ENSO signals is per-haps the first one the index must pass in order to be
Corresponding author address: Suzana Camargo, IRI—225Monell Bldg., P.O. Box 1000, Palisades, NY 10964-8000.E-mail: [email protected]
1 OCTOBER 2007 C A M A R G O E T A L . 4819
DOI: 10.1175/JCLI4282.1
© 2007 American Meteorological Society
JCLI4282
useful for forecasting, since ENSO is the largest singlepredictable factor influencing genesis in some basins.Our second goal is to use the index to determine whichspecific environmental factors are most influential indetermining ENSO-related variations in genesis in thevarious basins. The index weights the various factors(sea surface temperature, wind shear, etc.) with specificfunctional dependences, which empirically have beenfound to be appropriate to represent their relative im-portance in the climatology (and, in this study, also totheir variability with ENSO). Modified indices wereconstructed in which all but one factor is set to theclimatology, while the interannual variability is re-tained in the remaining factor. ENSO composites werethen constructed for these modified indices in order toasses the role of each particular factor in ENSO vari-ability. By repeating this procedure for each factorseparately and comparing the results, we provide aquantitative basis for stating that one factor is moreimportant than another in inducing the ENSO signal ina given region.
2. Development of the genesis potential index
The genesis potential (GP) index developed byEmanuel and Nolan (2004) was motivated by the workof Gray (1979). Here we describe the development ofthe index in more detail.
We began with a large set of environmental variablesthat, on physical grounds, we believed might be impor-tant predictors. In selecting combinations of such vari-ables, we avoided the use of parameters that might bespecific to the present climate. For example, we did notuse a specific threshold for SST (sea surface tempera-ture), as in Gray’s index, as we wanted an index thatwould be valid in different climate scenarios. There areno grounds for believing that 26°C is a constant of na-ture. Royer et al. (1998) show that the use of this SSTthreshold limits the validity of Gray’s index under cli-mate change.
The initial set of predictors included the potentialintensity (PI; Emanuel 1988), relative humidity, abso-lute vorticity at various levels, and wind shear. Thewind shear is defined as the magnitude of the vectordifference between the horizontal winds at 850 and 200hPa, as is often used in empirical studies of tropicalcyclone genesis and intensity change. While in principleit would be desirable to include as predictors windshears defined between different levels, the classicaldefinition was retained primarily because satellitecloud-track winds are most abundant in the lower tro-posphere, where trade cumulus develop, and near thetropical tropopause, where cirrus clouds are oftenfound.
The predictors were evaluated using the NationalCenters for Environmental Prediction (NCEP) Re-analysis data (Kalnay et al. 1996) from 1950 to 2004.The potential intensity Vpot is obtained from sea surfacetemperature, sea level pressure, and vertical profiles ofatmospheric temperature and humidity using a tech-nique that is a generalization of that described inEmanuel (1995) to take into account dissipative heat-ing, as discussed in Bister and Emanuel (1998). Tech-nical details of the calculation of potential intensity maybe found in Bister and Emanuel (2002a,b), who alsopresented some estimates of its climatological, low-frequency variability. A short definition of the potentialintensity can be found in the appendix.
Genesis locations and times were taken from so-called “best track” datasets maintained for the Atlanticand eastern North Pacific by the NOAA National Hur-ricane Center, and for the rest of the world oceans bythe U.S. Navy’s Joint Typhoon Warning Center. Onlypost-1970 data were used. Monthly average values ofeach of the predictors were then tested individually andin combination for their ability to replicate the annualcycle of tropical cyclogenesis rates in each hemisphere,as well as for their ability to replicate the spatial distri-bution of genesis in each month of the year. This pro-cess was partly objective, using standard multiple re-gression techniques, but also partly subjective, in theselection of combinations of variables and the choice ofwhich variables to retain. We make no claim that theresulting index represents a globally optimum combi-nation of the chosen predictors.
The index, as presented by Emanuel and Nolan(2004), is defined as
GP � |105�|3�2� H
50�3�Vpot
70 �3
�1 � 0.1Vshear��2,
where � is the absolute vorticity at 850 hPa (in s�1), His the relative humidity at 600 hPa in percent, Vpot is thepotential intensity (in m s�1), and Vshear is the magni-tude of the vertical wind shear between 850 hPa and200 hPa (in m s�1). Aside from the coefficient multi-plying the shear, the constants that appear in this defi-nition are entirely arbitrary and simply designed to givean index value of order unity. Although the indexshould be interpreted as a rate per unit time per unitarea, a constant multiplier would have to be included inthe index to give it the appropriate magnitude and di-mensions. In developing the index, its log was fit to thebest track data using multiple regression, but experi-menting empirically with the shear factor to optimize itsfit to the data. The exponents that appear in the indexhave been rounded to the nearest half integer as the fitto the data does not warrant more precision.
4820 J O U R N A L O F C L I M A T E VOLUME 20

The seasonal genesis index developed by Gray (1979;Watterson et al. 1995) has some similarities with GP,but also some important differences. A few of the vari-ables are common to both indices, such as the verticalwind shear (though using different pressure levels) andthe midtropospheric relative humidity. Other variablesare somewhat equivalent; for example, while here theabsolute low-level vorticity is one of the factors, inGray’s index the Coriolis parameter and the relativevorticity are separate variables. The main difference
between these indices is in the thermodynamic variable.Here GP uses the potential intensity, which depends onthe air–sea thermodynamic disequilibrium and the dif-ference between the sea surface temperature and thetemperature at the level of neutral buoyancy for anadiabatically lifted boundary layer parcel. In contrast,Gray’s index uses the near-surface ocean thermal en-ergy with a specific threshold (26°C) and the verticalgradient of the equivalent potential temperature be-tween the surface and 500 hPa.
FIG. 1. Genesis potential index climatology in (a) February and (b) September. The blackdots show individual genesis events over the period from (a) 1970 to 2004 and (b) 1970 to2005.
1 OCTOBER 2007 C A M A R G O E T A L . 4821
Fig 1 live 4/C

Besides the difference in variables used, the indicesalso differ in the powers and constants used in theirdefinitions. Gray’s index is able to reproduce approxi-mately the regions of tropical cyclogenesis in the sea-sons and basins of tropical cyclone activity (see, e.g.,Watterson et al. 1995). An alternative modification ofthe Gray’s index to suppress the dependence on theSST threshold using a convective parameter is dis-cussed in Royer et al. (1998). These genesis indiceshave also been applied to output from climate models(Ryan et al. 1992; McDonald et al. 2005; Chauvin et al.2006).
In the following section, we compare the spatial andseasonal distributions of genesis events to those pre-dicted by the GP.
3. Climatology of the genesis potential index
Figure 1 shows the climatological values of the gen-esis potential in February and September, within thepeak of the tropical cyclone season in the Southern andNorthern Hemisphere, respectively. In Fig. 2 the an-nual maximum of the genesis potential climatology ateach grid point is shown, with all well-known tropical-cyclone-prone regions appearing as maxima of the gen-esis potential index. While the spatial patterns agreewell in a qualitative sense, the spatial distributions ofgenesis potential and genesis itself do not correspondwith great quantitative precision.
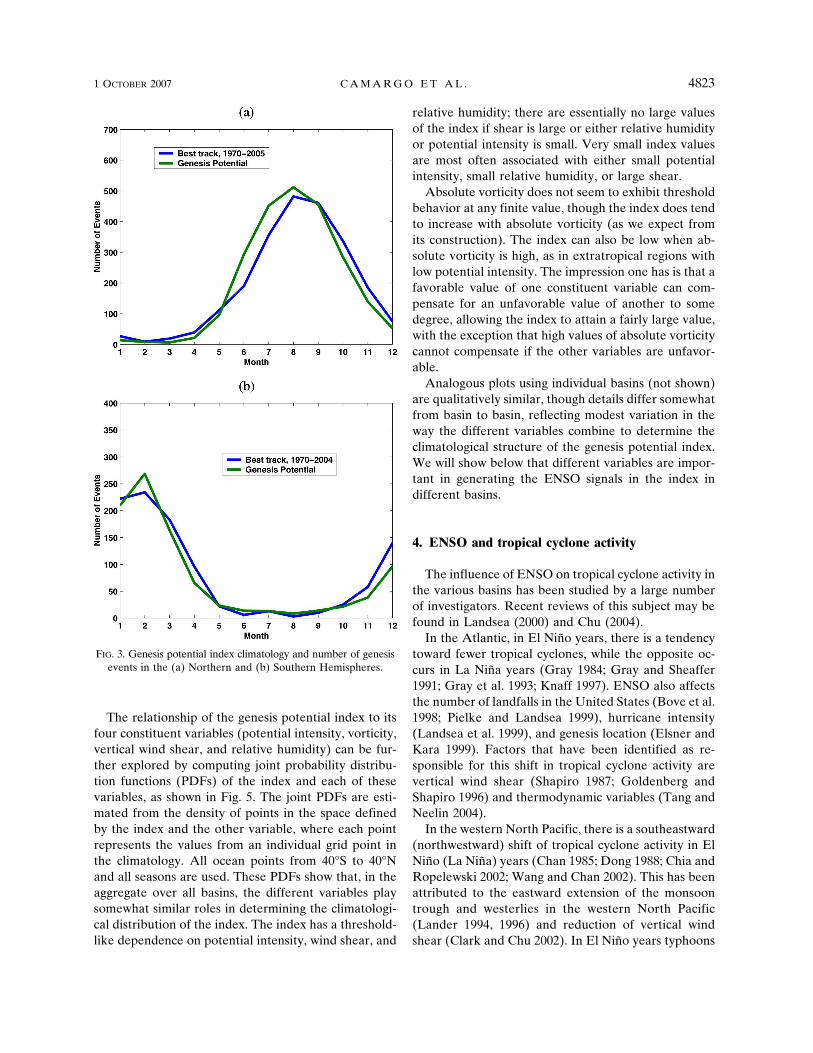
The annual cycles of genesis events in each hemi-sphere are shown in Fig. 3 and compared to the pre-
dictions using the genesis potential index. The genesispotential captures the main elements of the seasonalcycle of tropical cyclones.
The index was optimized to give the best fit to thespatial and temporal distributions shown in Figs. 1 and3. No attempt was made to optimize the index for vari-ability within individual ocean basins, so it is instructiveto evaluate the local performance of the index.
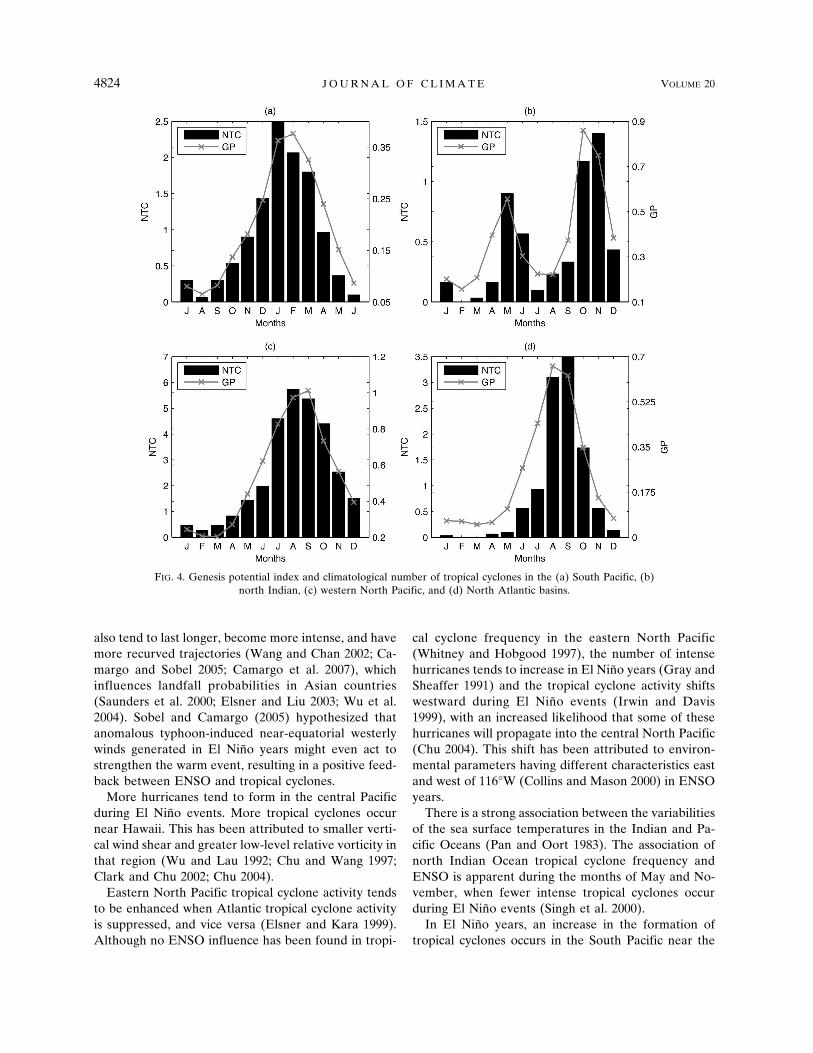
The climatology of the genesis potential per basin(for the definitions of the basins used to compute thearea averages, see the caption of Table 2), comparedwith the climatology of the number of tropical cyclones,is shown in Fig. 4 for several basins. The agreement inall basins is very good, with the genesis potential annualcycle’s being very similar to that of the number of tropi-cal cyclones. Even in the case of the north IndianOcean, which has an annual cycle with two peaks, pre-and postmonsoon, the genesis potential index followsthe number of tropical cyclones very closely.
The average number of tropical cyclones observedover each entire basin varies significantly more, frombasin to basin, than does the genesis potential. That is,in Fig. 4, there is more variation in the scale on the leftthan on the right. It seems reasonable to attribute thisin large part to the different size of the basins. Thewestern North Pacific, for example, has a much largerarea over which conditions are favorable for genesisthan do the other basins. This alone should be expectedto lead to a larger number of cyclones in the westernNorth Pacific than the other basins—as is observed—even for the same genesis potential per unit area.
FIG. 2. Maximum value per year of the genesis potential index climatology at each gridpoint.
4822 J O U R N A L O F C L I M A T E VOLUME 20
Fig 2 live 4/C
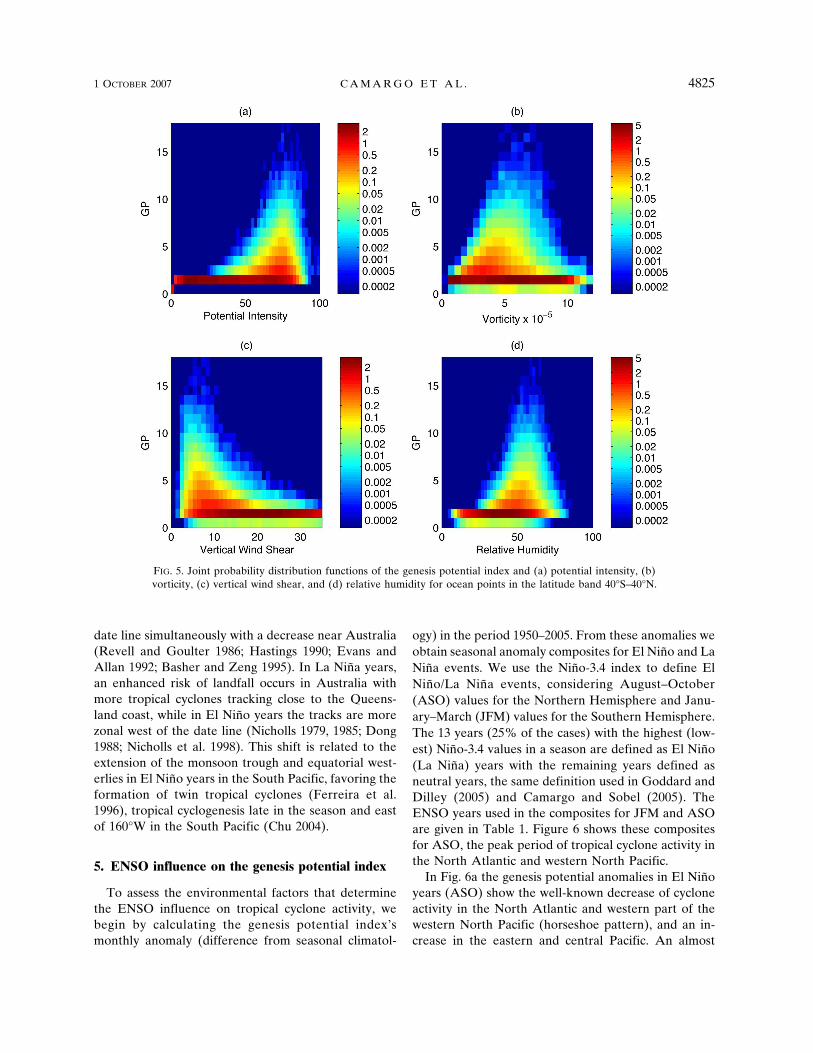
The relationship of the genesis potential index to itsfour constituent variables (potential intensity, vorticity,vertical wind shear, and relative humidity) can be fur-ther explored by computing joint probability distribu-tion functions (PDFs) of the index and each of thesevariables, as shown in Fig. 5. The joint PDFs are esti-mated from the density of points in the space definedby the index and the other variable, where each pointrepresents the values from an individual grid point inthe climatology. All ocean points from 40°S to 40°Nand all seasons are used. These PDFs show that, in theaggregate over all basins, the different variables playsomewhat similar roles in determining the climatologi-cal distribution of the index. The index has a threshold-like dependence on potential intensity, wind shear, and
relative humidity; there are essentially no large valuesof the index if shear is large or either relative humidityor potential intensity is small. Very small index valuesare most often associated with either small potentialintensity, small relative humidity, or large shear.
Absolute vorticity does not seem to exhibit thresholdbehavior at any finite value, though the index does tendto increase with absolute vorticity (as we expect fromits construction). The index can also be low when ab-solute vorticity is high, as in extratropical regions withlow potential intensity. The impression one has is that afavorable value of one constituent variable can com-pensate for an unfavorable value of another to somedegree, allowing the index to attain a fairly large value,with the exception that high values of absolute vorticitycannot compensate if the other variables are unfavor-able.
Analogous plots using individual basins (not shown)are qualitatively similar, though details differ somewhatfrom basin to basin, reflecting modest variation in theway the different variables combine to determine theclimatological structure of the genesis potential index.We will show below that different variables are impor-tant in generating the ENSO signals in the index indifferent basins.
4. ENSO and tropical cyclone activity
The influence of ENSO on tropical cyclone activity inthe various basins has been studied by a large numberof investigators. Recent reviews of this subject may befound in Landsea (2000) and Chu (2004).
In the Atlantic, in El Niño years, there is a tendencytoward fewer tropical cyclones, while the opposite oc-curs in La Niña years (Gray 1984; Gray and Sheaffer1991; Gray et al. 1993; Knaff 1997). ENSO also affectsthe number of landfalls in the United States (Bove et al.1998; Pielke and Landsea 1999), hurricane intensity(Landsea et al. 1999), and genesis location (Elsner andKara 1999). Factors that have been identified as re-sponsible for this shift in tropical cyclone activity arevertical wind shear (Shapiro 1987; Goldenberg andShapiro 1996) and thermodynamic variables (Tang andNeelin 2004).
In the western North Pacific, there is a southeastward(northwestward) shift of tropical cyclone activity in ElNiño (La Niña) years (Chan 1985; Dong 1988; Chia andRopelewski 2002; Wang and Chan 2002). This has beenattributed to the eastward extension of the monsoontrough and westerlies in the western North Pacific(Lander 1994, 1996) and reduction of vertical windshear (Clark and Chu 2002). In El Niño years typhoons
FIG. 3. Genesis potential index climatology and number of genesisevents in the (a) Northern and (b) Southern Hemispheres.
1 OCTOBER 2007 C A M A R G O E T A L . 4823
Fig 3 live 4/C
also tend to last longer, become more intense, and havemore recurved trajectories (Wang and Chan 2002; Ca-margo and Sobel 2005; Camargo et al. 2007), whichinfluences landfall probabilities in Asian countries(Saunders et al. 2000; Elsner and Liu 2003; Wu et al.2004). Sobel and Camargo (2005) hypothesized thatanomalous typhoon-induced near-equatorial westerlywinds generated in El Niño years might even act tostrengthen the warm event, resulting in a positive feed-back between ENSO and tropical cyclones.
More hurricanes tend to form in the central Pacificduring El Niño events. More tropical cyclones occurnear Hawaii. This has been attributed to smaller verti-cal wind shear and greater low-level relative vorticity inthat region (Wu and Lau 1992; Chu and Wang 1997;Clark and Chu 2002; Chu 2004).
Eastern North Pacific tropical cyclone activity tendsto be enhanced when Atlantic tropical cyclone activityis suppressed, and vice versa (Elsner and Kara 1999).Although no ENSO influence has been found in tropi-
cal cyclone frequency in the eastern North Pacific(Whitney and Hobgood 1997), the number of intensehurricanes tends to increase in El Niño years (Gray andSheaffer 1991) and the tropical cyclone activity shiftswestward during El Niño events (Irwin and Davis1999), with an increased likelihood that some of thesehurricanes will propagate into the central North Pacific(Chu 2004). This shift has been attributed to environ-mental parameters having different characteristics eastand west of 116°W (Collins and Mason 2000) in ENSOyears.
There is a strong association between the variabilitiesof the sea surface temperatures in the Indian and Pa-cific Oceans (Pan and Oort 1983). The association ofnorth Indian Ocean tropical cyclone frequency andENSO is apparent during the months of May and No-vember, when fewer intense tropical cyclones occurduring El Niño events (Singh et al. 2000).
In El Niño years, an increase in the formation oftropical cyclones occurs in the South Pacific near the
FIG. 4. Genesis potential index and climatological number of tropical cyclones in the (a) South Pacific, (b)north Indian, (c) western North Pacific, and (d) North Atlantic basins.
4824 J O U R N A L O F C L I M A T E VOLUME 20
date line simultaneously with a decrease near Australia(Revell and Goulter 1986; Hastings 1990; Evans andAllan 1992; Basher and Zeng 1995). In La Niña years,an enhanced risk of landfall occurs in Australia withmore tropical cyclones tracking close to the Queens-land coast, while in El Niño years the tracks are morezonal west of the date line (Nicholls 1979, 1985; Dong1988; Nicholls et al. 1998). This shift is related to theextension of the monsoon trough and equatorial west-erlies in El Niño years in the South Pacific, favoring theformation of twin tropical cyclones (Ferreira et al.1996), tropical cyclogenesis late in the season and eastof 160°W in the South Pacific (Chu 2004).
5. ENSO influence on the genesis potential index
To assess the environmental factors that determinethe ENSO influence on tropical cyclone activity, webegin by calculating the genesis potential index’smonthly anomaly (difference from seasonal climatol-
ogy) in the period 1950–2005. From these anomalies weobtain seasonal anomaly composites for El Niño and LaNiña events. We use the Niño-3.4 index to define ElNiño/La Niña events, considering August–October(ASO) values for the Northern Hemisphere and Janu-ary–March (JFM) values for the Southern Hemisphere.The 13 years (25% of the cases) with the highest (low-est) Niño-3.4 values in a season are defined as El Niño(La Niña) years with the remaining years defined asneutral years, the same definition used in Goddard andDilley (2005) and Camargo and Sobel (2005). TheENSO years used in the composites for JFM and ASOare given in Table 1. Figure 6 shows these compositesfor ASO, the peak period of tropical cyclone activity inthe North Atlantic and western North Pacific.
In Fig. 6a the genesis potential anomalies in El Niñoyears (ASO) show the well-known decrease of cycloneactivity in the North Atlantic and western part of thewestern North Pacific (horseshoe pattern), and an in-crease in the eastern and central Pacific. An almost
FIG. 5. Joint probability distribution functions of the genesis potential index and (a) potential intensity, (b)vorticity, (c) vertical wind shear, and (d) relative humidity for ocean points in the latitude band 40°S–40°N.
1 OCTOBER 2007 C A M A R G O E T A L . 4825
Fig 5 live 4/C

mirror image appears in the La Niña years (Fig. 6b), ascan be seen especially easily in the difference betweenEl Niño and La Niña years (Fig. 6c).
To provide objective observational metrics withwhich to compare the genesis index, we compute gen-esis density and track density from best track data. Thegenesis density is calculated by counting the number oftropical cyclones with genesis (first position) in each2.5° � 2.5° latitude and longitude square. Similarly, forthe track density, we count the number of 6-hourlytropical cyclone positions within each 2.5° � 2.5° lati-tude and longitude square, normalized such that 24 h ina particular location for one tropical cyclone is countedas one.
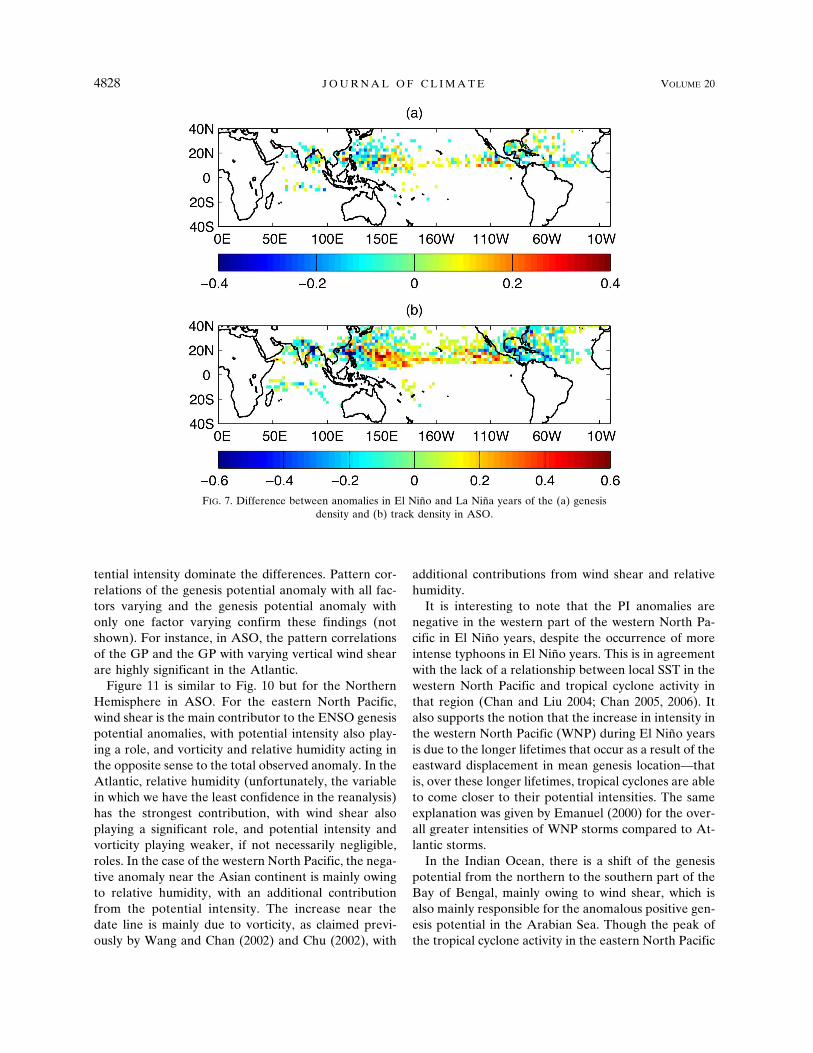
The difference in observed ASO genesis and trackdensity anomalies between El Niño and La Niña yearsis shown in Fig. 7. In the Northern Hemisphere thesedifferences are clearly similar to those exhibited by thegenesis potential index anomalies (cf. Fig. 6c to Fig. 7).The genesis potential index composites in Fig. 6 areable to reproduce the shift in the distribution of Atlan-tic tropical cyclones between El Niño and La Niñayears, for instance. In the next section, we use the gen-esis potential index to further explore which factors aremost responsible for some of these ENSO signals intropical cyclone activity.
The agreement between observed and predicted ElNiño � La Niña differences is not good in the SouthernHemisphere during ASO. There are very few tropicalcyclones in the Southern Hemisphere during August–October, so this disagreement is not important.
The JFM genesis potential ENSO anomalies areshown in Fig. 8 [(a) El Niño and (b) La Niña] togetherwith the difference between the El Niño and La Niña
anomalies. The El Niño � La Niña differences in gen-esis density and track density for JFM are shown in Fig.9. The ENSO-related shifts are more zonal in theNorthern Hemisphere (though few tropical cyclonesform there in JFM) and more meridional in the South-ern Hemisphere. There is also, however, a longitudinalshift in the South Pacific with a positive genesis poten-tial anomaly in El Niño years east of 160°E in the SouthPacific and a negative anomaly near the Australian con-tinent.
The genesis potential ENSO anomaly differences inASO and JFM are generally consistent with the knowneffects of ENSO on tropical cyclones discussed in theprevious section, such as the decrease of tropical cy-clone activity in the Atlantic in El Niño years accom-panied by an increase in the eastern and central Pacific,with a southeastern shift in the western North Pacific.
Table 2 shows the values of the interannual correla-tions between the genesis potential index and the num-ber of tropical cyclones in the different basins for dif-ferent seasons. All basins, with the exception of thenorth Indian Ocean, have significant skill at least in afew seasons. The western North Pacific has significantcorrelation in the early and late season, but not duringthe peak of its tropical cyclone activity, when the cen-tral North Pacific region has significant skill. This shiftin skill is probably related to the spatial shift of tropicalcyclone activity in the western North Pacific withENSO. The Atlantic and the eastern North Pacific havesignificant correlation in the August–October period,when most of their peak tropical cyclone activity oc-curs. In the Southern Hemisphere, the south Indianand the South Pacific have significant correlations inNovember–January (NDJ) and December–February(DJF) seasons.
6. Factors influencing ENSO effects on the genesispotential index
Here we assess the individual importance of the fourvariables that are comprised in the genesis potential(vorticity, vertical wind shear, potential intensity, andhumidity) in determining the ENSO anomalies. To dothis, we recalculate the genesis potential using the long-term climatology of three of the variables but the un-modified, interannually varying values for the fourthvariable. This is then repeated for each of the otherthree variables. The anomalies and the ENSO compos-ites are then recalculated in all four cases. Owing to thenonlinearity of the GP index, the net anomaly cannotbe described as the sum of the four fields described
TABLE 1. El Niño and La Niña years for JFM and ASO used inthe composites of the genesis potential index in Figs. 6–11.
JFM ASO
El Niño La Niña El Niño La Niña
1958 1950 1951 19501966 1955 1957 19541969 1956 1963 19551970 1968 1965 19561973 1971 1969 19641977 1974 1972 19701983 1976 1982 19711987 1985 1986 19731988 1986 1987 19751992 1989 1991 19881995 1996 1997 19951998 1999 2002 19982003 2000 2004 1999
4826 J O U R N A L O F C L I M A T E VOLUME 20

here. Nonetheless, to the extent that the index providesweights that appropriately quantify the roles of the dif-ferent factors in genesis and the nonlinearities are nottoo large, the attributions obtained by this methodshould be meaningful.
Figure 10 shows the El Niño � La Niña difference ingenesis potential anomalies for the Southern Hemi-sphere in JFM, in the cases of varying (a) vorticity (Fig.10a), (b) vertical wind shear (Fig. 10b), (c) potentialintensity (Fig. 10c), and (d) relative humidity (Fig. 10d),in each case with the other three variables fixed at theirlong-term climatological values. Comparing this withthe pattern obtained when all four factors are varying
(Fig. 8c), it is apparent that different factors contributeto the genesis potential anomaly shifts in different re-gions. The increase in the genesis potential anomaliesaround 10°S is mainly owing to vertical wind shear andvorticity (South Pacific) or vertical wind shear and PI(south Indian). The decrease of the genesis potentialanomalies in the south Indian Ocean around 15°S andin the Mozambique Channel is mainly owing to verticalwind shear and relative humidity changes. In the SouthPacific, from the eastern Australian coast to the east ofthe date line, the main contribution to the negativegenesis potential anomaly is the relative humidity,while east of the date line vertical wind shear and po-
FIG. 6. Genesis potential anomalies in ASO for (a) El Niño and (b) La Niña years; (c)difference of the anomalies in El Niño and La Niña years.
1 OCTOBER 2007 C A M A R G O E T A L . 4827
Fig 6 live 4/C
tential intensity dominate the differences. Pattern cor-relations of the genesis potential anomaly with all fac-tors varying and the genesis potential anomaly withonly one factor varying confirm these findings (notshown). For instance, in ASO, the pattern correlationsof the GP and the GP with varying vertical wind shearare highly significant in the Atlantic.
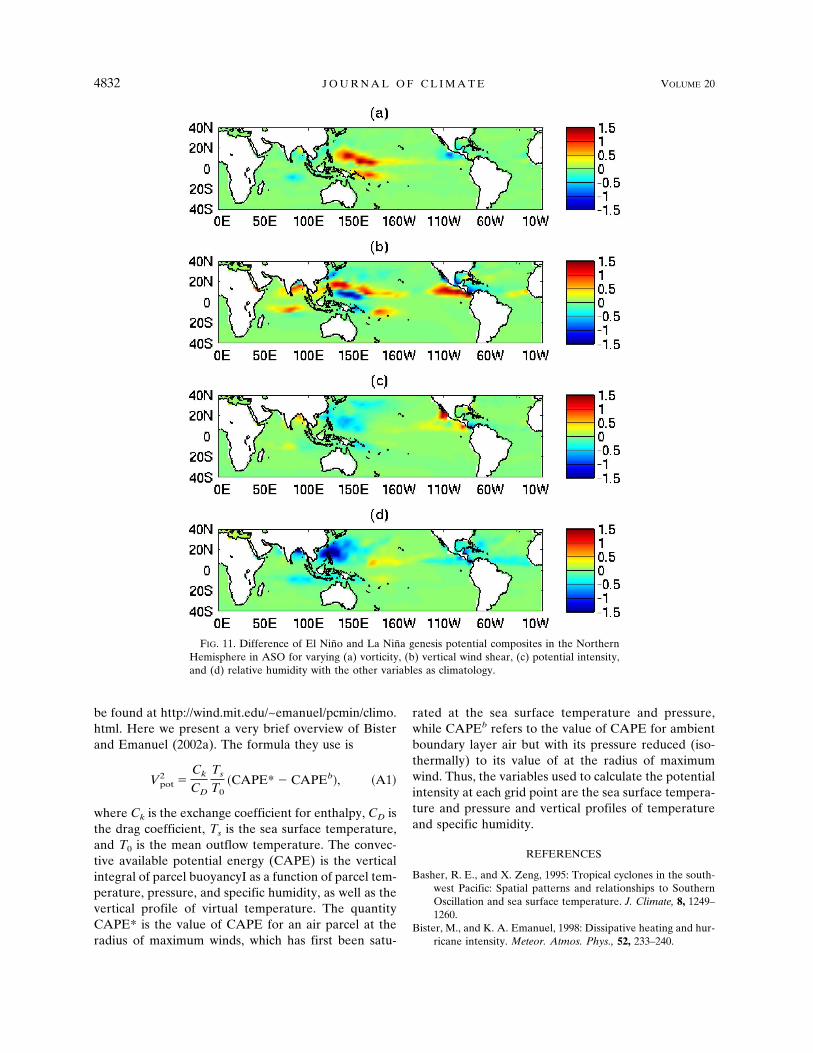
Figure 11 is similar to Fig. 10 but for the NorthernHemisphere in ASO. For the eastern North Pacific,wind shear is the main contributor to the ENSO genesispotential anomalies, with potential intensity also play-ing a role, and vorticity and relative humidity acting inthe opposite sense to the total observed anomaly. In theAtlantic, relative humidity (unfortunately, the variablein which we have the least confidence in the reanalysis)has the strongest contribution, with wind shear alsoplaying a significant role, and potential intensity andvorticity playing weaker, if not necessarily negligible,roles. In the case of the western North Pacific, the nega-tive anomaly near the Asian continent is mainly owingto relative humidity, with an additional contributionfrom the potential intensity. The increase near thedate line is mainly due to vorticity, as claimed previ-ously by Wang and Chan (2002) and Chu (2002), with
additional contributions from wind shear and relativehumidity.
It is interesting to note that the PI anomalies arenegative in the western part of the western North Pa-cific in El Niño years, despite the occurrence of moreintense typhoons in El Niño years. This is in agreementwith the lack of a relationship between local SST in thewestern North Pacific and tropical cyclone activity inthat region (Chan and Liu 2004; Chan 2005, 2006). Italso supports the notion that the increase in intensity inthe western North Pacific (WNP) during El Niño yearsis due to the longer lifetimes that occur as a result of theeastward displacement in mean genesis location—thatis, over these longer lifetimes, tropical cyclones are ableto come closer to their potential intensities. The sameexplanation was given by Emanuel (2000) for the over-all greater intensities of WNP storms compared to At-lantic storms.
In the Indian Ocean, there is a shift of the genesispotential from the northern to the southern part of theBay of Bengal, mainly owing to wind shear, which isalso mainly responsible for the anomalous positive gen-esis potential in the Arabian Sea. Though the peak ofthe tropical cyclone activity in the eastern North Pacific
FIG. 7. Difference between anomalies in El Niño and La Niña years of the (a) genesisdensity and (b) track density in ASO.
4828 J O U R N A L O F C L I M A T E VOLUME 20
Fig 7 live 4/C

and north Indian Ocean occurs in July–September(JAS) and October–December (OND), respectively(not shown here), the ASO figures are in agreementwith those.
7. Conclusions
We have constructed annual cycle and ENSO com-posites of an empirical index of tropical cyclone gen-esis. The index was constructed from only the climato-logical annual cycle in each hemisphere as a whole,using no information from individual basins nor anyinterannual variability whatsoever. Our goals were totest the ability of the index to reproduce observed
variations in tropical cyclone activity with the annualcycle and ENSO and then to use modified versions ofthe index to determine which individual physical factorsare most important in causing these variations.
The primary findings are as follows:
1) The index tracks the observed climatological annualcycles of tropical cyclone number in each individualbasin separately.
2) The index successfully reproduces the most well-known ENSO signals in the best-observed basins,such as the suppression of genesis in the Atlanticand the eastward shift in mean genesis location inthe western North Pacific during El Niño.
FIG. 8. Genesis potential anomalies in JFM for (a) El Niño and (b) La Niña years; (c)difference of the anomalies in El Niño and La Niña years.
1 OCTOBER 2007 C A M A R G O E T A L . 4829
Fig 8 live 4/C

3) The different factors entering the index contributedifferently to its ENSO anomalies in different re-gions. Vertical wind shear and midlevel relative hu-midity are consistently important in many basins,
especially the western North Pacific near the Asiancontinent, the North Atlantic, and the SouthernHemisphere. Vorticity anomalies contribute mostsignificantly in the central Pacific (both north and
TABLE 2. Correlations of the number of named tropical cyclones and the basin average genesis potential index in the period1970–2005. The basins are defined by oceanic regions within the following ranges: in the Southern Hemisphere (40°S–0°), in theNorthern Hemisphere (0°–40°N); longitudes: south Indian—SI (30°–100°E), Australian—AUS (100°E–180°), South Pacific—SP (180°–110°W), north Indian—NI (40°–100°E), western North Pacific—WNP (100°E–180°), central North Pacific—CNP (180°–140°W), east-ern North Pacific—ENP (140°W to American coast), Atlantic (American coast to African coast). Twelve 3-month continuous seasonswere used from JFM to DJF. Only shown are seasons and basins in which tropical cyclones occurred in at least more than 50% of theyears. Statistical significance was obtained using a two-tailed test, taking into account the autocorrelations of each time series followingLivezey and Chen (1983). Bold face (underlined) indicates statistical significance at the 95% (90%) level.
Season
Region
SI AUS SP NI WNP CNP ENP ATL
JFM 0.23 0.25 0.18 — 0.27 — — —FMA 0.19 0.34 0.25 — 0.54 — — —MAM �0.15 0.35 — 0.18 0.65 — �0.05 —AMJ �0.14 0.16 — 0.28 0.50 — 0.07 0.11MJJ �0.24 — — 0.37 0.46 — �0.10 0.29JJA — — — 0.56 0.29 — 0.00 0.54JAS — — — — 0.10 0.45 0.26 0.63ASO 0.15 — — 0.10 0.16 0.60 0.51 0.60SON 0.14 �0.13 — 0.13 0.21 0.63 0.48 0.28DND 0.17 0.24 — 0.06 0.45 — 0.05 0.28NDJ 0.36 0.32 0.42 0.03 0.33 — — —DJF 0.42 0.29 0.38 — 0.44 — — —
FIG. 9. Difference of the anomalies in El Niño and La Niña years for the (a) genesisdensity and (b) track density in JFM.
4830 J O U R N A L O F C L I M A T E VOLUME 20
Fig 9 live 4/C

south), where during El Niño events the tropicalcyclones tend to form nearer the equator. Potentialintensity plays a secondary role in the Atlantic, andvaries oppositely to the observed variations in totalgenesis potential in the western North Pacific.
Acknowledgments. We thank Anthony G. Barnstonfor valuable discussions, and two anonymous reviewerswho provided useful comments that led to improve-ments of the manuscript. This paper is funded in part bya grant/cooperative agreement from the National Oce-anic and Atmospheric Administration (NOAA), GrantNA050AR4311004. The views expressed herein arethose of the authors and do not necessarily reflect theviews of NOAA or any of its subagencies. AHS
acknowledges support from NSF Grant ATM-05-42736.
APPENDIX
Potential Intensity
The definition of potential intensity is based on thatgiven by Emanuel (1995) as modified by Bister andEmanuel (1998). Details of the calculation may be foundin Bister and Emanuel (2002a). The definition is alsodiscussed online (http://wind.mit.edu/~emanuel/pcmin/pclat/pclat.html). A FORTRAN subroutine to calculatethe potential intensity is available online (http://wind.mit.edu/~emanuel/home.html). Monthly mean values may
FIG. 10. Difference of El Niño and La Niña genesis potential composites in the SouthernHemisphere in JFM for varying (a) vorticity, (b) vertical wind shear, (c) potential intensity,and (d) relative humidity with the other variables as climatology.
1 OCTOBER 2007 C A M A R G O E T A L . 4831
Fig 10 live 4/C
be found at http://wind.mit.edu/~emanuel/pcmin/climo.html. Here we present a very brief overview of Bisterand Emanuel (2002a). The formula they use is
Vpot2 �
Ck
CD
Ts
T0�CAPE* � CAPEb�, �A1�
where Ck is the exchange coefficient for enthalpy, CD isthe drag coefficient, Ts is the sea surface temperature,and T0 is the mean outflow temperature. The convec-tive available potential energy (CAPE) is the verticalintegral of parcel buoyancyI as a function of parcel tem-perature, pressure, and specific humidity, as well as thevertical profile of virtual temperature. The quantityCAPE* is the value of CAPE for an air parcel at theradius of maximum winds, which has first been satu-
rated at the sea surface temperature and pressure,while CAPEb refers to the value of CAPE for ambientboundary layer air but with its pressure reduced (iso-thermally) to its value of at the radius of maximumwind. Thus, the variables used to calculate the potentialintensity at each grid point are the sea surface tempera-ture and pressure and vertical profiles of temperatureand specific humidity.
REFERENCES
Basher, R. E., and X. Zeng, 1995: Tropical cyclones in the south-west Pacific: Spatial patterns and relationships to SouthernOscillation and sea surface temperature. J. Climate, 8, 1249–1260.
Bister, M., and K. A. Emanuel, 1998: Dissipative heating and hur-ricane intensity. Meteor. Atmos. Phys., 52, 233–240.
FIG. 11. Difference of El Niño and La Niña genesis potential composites in the NorthernHemisphere in ASO for varying (a) vorticity, (b) vertical wind shear, (c) potential intensity,and (d) relative humidity with the other variables as climatology.
4832 J O U R N A L O F C L I M A T E VOLUME 20
Fig 11 live 4/C

——, and ——, 2002a: Low frequency variability of tropical cy-clone potential intensity. 1. Interannual to interdecadal vari-ability. J. Geophys. Res., 107, 4801, doi:10.1029/2001JD000776.
——, and ——, 2002b: Low frequency variability of tropical cy-clone potential intensity. 2. Climatology for 1982–1995. J.Geophys. Res., 107, 4621, doi:10.1029/2001JD000780.
Bove, M. C., J. B. Elsner, C. W. Landsea, X. Niu, and J. O’Brien,1998: Effect of El Niño on U.S. landfalling hurricanes, revis-ited. Bull. Amer. Meteor. Soc., 79, 2477–2482.
Camargo, S. J., and A. H. Sobel, 2005: Western North Pacifictropical cyclone intensity and ENSO. J. Climate, 18, 2996–3006.
——, A. W. Robertson, S. J. Gaffney, P. Smyth, and M. Ghil,2007: Cluster analysis of typhoon tracks. Part II: Large-scalecirculation and ENSO. J. Climate, 20, 3654–3676.
Chan, J. C. L., 1985: Tropical cyclone activity in the northwestPacific in relation to the El Niño/Southern Oscillation phe-nomenon. Mon. Wea. Rev., 113, 599–606.
——, 2005: Interannual and interdecadal variations of tropicalcyclone activity over the western North Pacific. Meteor. At-mos. Phys., 89, 143–152.
——, 2006: Comment on “Changes in tropical cyclone number,duration, and intensity in a warming environment.” Science,311, 1713, doi:10.1126/science.1121522.
——, and K. S. Liu, 2004: Global warming and western NorthPacific typhoon activity from an observational perspective. J.Climate, 17, 4590–4602.
Chauvin, F., J.-F. Royer, and M. Déqué, 2006: Response of hur-ricane-type vortices to global warming as simulated byARPEGE-Climat at high resolution. Climate Dyn., 27, 377–399.
Chia, H. H., and C. F. Ropelewski, 2002: The interannual variabil-ity in the genesis location of tropical cyclones in the north-west Pacific. J. Climate, 15, 2934–2944.
Chu, P.-S., 2002: Large-scale circulation features associated withdecadal variations of tropical cyclone activity over the centralNorth Pacific. J. Climate, 15, 2678–2689.
——, 2004: ENSO and tropical cyclone activity. Hurricanes andTyphoons, Past, Present and Future, R. J. Murnane and K.-B.Liu, Eds., Columbia University Press, 297–332.
——, and J. Wang, 1997: Tropical cyclone occurrences in the vi-cinity of Hawaii: Are the differences between El Niño andnon–El Niño years significant? J. Climate, 10, 2683–2689.
Clark, J. D., and P.-S. Chu, 2002: Interannual variation of tropicalcyclone activity over the Central North Pacific. J. Meteor.Soc. Japan, 80, 403–418.
Collins, J. M., and I. M. Mason, 2000: Local environmental con-ditions related to seasonal tropical cyclone activity in theNortheast Pacific basin. Geophys. Res. Lett., 27, 3881–3884.
Dong, K., 1988: El Niño and tropical cyclone frequency in theAustralian region and the North-western Pacific. Aust. Me-teor. Mag., 36, 219–255.
Elsner, J. B., and A. B. Kara, 1999: Hurricanes of the North At-lantic: Climate and Society. Oxford University Press, 488 pp.
——, and K. B. Liu, 2003: Examining the ENSO-typhoon hypoth-esis. Climate Res., 25, 43–54.
Emanuel, K. A., 1988: The maximum intensity of hurricanes. J.Atmos. Sci., 45, 1143–1155.
——, 1995: Sensitivity of tropical cyclones to surface exchangecoefficients and a revised steady-state model incorporatingeye dynamics. J. Atmos. Sci., 52, 3969–3976.
——, 2000: A statistical analysis of tropical cyclone intensity.Mon. Wea. Rev., 128, 1139–1152.
——, and D. S. Nolan, 2004: Tropical cyclone activity and globalclimate. Preprints, 26th Conf. on Hurricanes and TropicalMeteorology, Miami, FL, Amer. Meteor. Soc., 240–241.
Evans, J. L., and R. J. Allan, 1992: El Niño/Southern Oscillationmodification to the structure of the monsoon and tropicalcyclone activity in the Australian region. Int. J. Climatol., 12,611–623.
Ferreira, R. N., W. H. Schubert, and J. J. Hack, 1996: Dynamicalaspects of twin tropical cyclones associated with the Madden–Julian oscillation. J. Atmos. Sci., 53, 929–945.
Goddard, L., and M. Dilley, 2005: El Niño: Catastrophe or op-portunity? J. Climate, 18, 651–665.
Goldenberg, S. B., and L. J. Shapiro, 1996: Physical mechanismsfor the association of El Niño and West African rainfall withAtlantic major hurricane activity. J. Climate, 9, 1169–1187.
Gray, W. M., 1979: Hurricanes: Their formation, structure andlikely role in the tropical circulation. Meteorology over theTropical Oceans, D. B. Shaw, Ed., Royal Meteorological So-ciety, 155–218.
——, 1984: Atlantic seasonal hurricane frequency. Part I: El Niñoand 30 mb quasi-biennial oscillation influences. Mon. Wea.Rev., 112, 1649–1668.
——, and J. D. Sheaffer, 1991: El Niño and QBO influences ontropical cyclone activity. Teleconnections Linking WorldwideAnomalies, M. H. Glantz, R. W. Katz, and N. Nicholls, Eds.,Cambridge University Press, 257–284.
——, C. W. Landsea, P. W. Mielke Jr., and K. J. Berry, 1993: Pre-dicting Atlantic basin seasonal tropical cyclone activity by 1August. Wea. Forecasting, 8, 73–86.
Hastings, P. A., 1990: Southern Oscillation influences on tropicalcyclone activity in the Australian/South-west Pacific region.Int. J. Climatol., 10, 291–298.
Irwin, R. P., and R. Davis, 1999: The relationship between theSouthern Oscillation Index and tropical cyclone tracks in theeastern North Pacific. Geophys. Res. Lett., 26, 2251–2254.
Kalnay, E., and Coauthors, 1996: The NCEP/NCAR 40-Year Re-analysis Project. Bull. Amer. Meteor. Soc., 77, 437–471.
Knaff, J. A., 1997: Implications of summertime sea level pressureanomalies in the tropical Atlantic region. J. Climate, 10, 789–804.
Lander, M. A., 1994: An exploratory analysis of the relationshipbetween tropical storm formation in the western North Pa-cific and ENSO. Mon. Wea. Rev., 122, 636–651.
——, 1996: Specific tropical cyclone track types and unusual tropi-cal cyclone motions associated with a reverse-oriented mon-soon trough in the western North Pacific. Wea. Forecasting,11, 170–186.
Landsea, C. W., 2000: El Niño–Southern Oscillation and the sea-sonal predictability of tropical cyclones. El Niño: Impacts ofMultiscale Variability on Natural Ecosystems and Society,H. F. Díaz and V. Markgraf, Eds., Cambridge UniversityPress, 149–181.
——, R. A. Pielke Jr., A. M. Mestas-Nuñez, and J. A. Knaff, 1999:Atlantic basin hurricanes: Indices of climatic changes. Cli-matic Change, 42, 89–129.
Livezey, R. E., and W. Y. Chen, 1983: Statistical field significanceand its determination by Monte Carlo techniques. Mon. Wea.Rev., 111, 46–59.
McDonald, R. E., D. G. Bleaken, D. R. Cresswell, V. D. Pope,and C. A. Senior, 2005: Tropical storms: Representation anddiagnosis in climate models and the impacts of climatechange. Climate Dyn., 25, 19–36.
Nicholls, N., 1979: A possible method for predicting seasonal
1 OCTOBER 2007 C A M A R G O E T A L . 4833
tropical cyclone activity in the Australian region. Mon. Wea.Rev., 107, 1221–1224.
——, 1985: Predictability of interannual variations of Australianseasonal tropical cyclone activity. Mon. Wea. Rev., 113, 1144–1149.
——, C. W. Landsea, and J. Gill, 1998: Recent trends in Austra-lian region tropical cyclone activity. Meteor. Atmos. Phys., 65,197–205.
Pan, Y. H., and A. H. Oort, 1983: Global climate variations con-nected with sea surface temperature anomalies in the easternequatorial Pacific Ocean for the 1958–73 period. Mon. Wea.Rev., 111, 1244–1258.
Pielke, R. A., Jr., and C. W. Landsea, 1999: La Niña, El Niño andAtlantic hurricane damages in the United States. Bull. Amer.Meteor. Soc., 80, 2027–2033.
Revell, C., and S. Goulter, 1986: South Pacific tropical cyclonesand the Southern Oscillation. Mon. Wea. Rev., 114, 1138–1144.
Royer, J.-F., F. Chauvin, B. Timbal, P. Araspin, and D. Grimal,1998: A GCM study of the impact of greenhouse gas increaseon the frequency of occurrence of tropical cyclone. ClimaticChange, 38, 307–343.
Ryan, B. F., I. G. Watterson, and J. L. Evans, 1992: Tropical cy-clone frequencies inferred from Gray’s yearly genesis param-eter: Validation of GCM tropical climates. Geophys. Res.Lett., 19, 1831–1834.
Saunders, M. A., R. E. Chandler, C. J. Merchant, and F. P. Rob-erts, 2000: Atlantic hurricanes and NW Pacific typhoons:ENSO spatial impacts on occurrence and landfall. Geophys.Res. Lett., 27, 1147–1150.
Shapiro, L. J., 1987: Month-to-month variability of the Atlantictropical circulation and its relationship to tropical storm for-mation. Mon. Wea. Rev., 115, 2598–2614.
Singh, O. P., T. M. A. Khan, and M. S. Rahman, 2000: Changes inthe frequency of tropical cyclones over the North IndianOcean. Meteor. Atmos. Phys., 75, 11–20.
Sobel, A. H., and S. J. Camargo, 2005: Influence of western NorthPacific tropical cyclones on their large-scale environment. J.Atmos. Sci., 62, 3396–3407.
Tang, B. H., and J. D. Neelin, 2004: ENSO influence on Atlantichurricanes via tropospheric warming. Geophys. Res. Lett., 31,L24204, doi:10.1029/2004GL021072.
Wang, B., and J. C. L. Chan, 2002: How strong ENSO eventsaffect tropical storm activity over the western North Pacific.J. Climate, 15, 1643–1658.
Watterson, I. G., J. L. Evans, and B. F. Ryan, 1995: Seasonal andinterannual variability of tropical cyclogenesis: Diagnosticsfrom large-scale fields. J. Climate, 8, 3052–3066.
Whitney, L. D., and J. Hobgood, 1997: The relationship betweensea surface temperatures and maximum intensities of tropicalcyclones in the eastern North Pacific Ocean. J. Climate, 10,2921–2930.
Wu, G., and N.-C. Lau, 1992: A GCM simulation of the relation-ship between tropical-storm formation and ENSO. Mon.Wea. Rev., 120, 958–977.
Wu, M. C., W. L. Chang, and W. M. Leung, 2004: Impacts of ElNiño–Southern Oscillation events on tropical cyclone land-falling activity in the western North Pacific. J. Climate, 17,1419–1428.
4834 J O U R N A L O F C L I M A T E VOLUME 20