Embed Size (px)
Citation preview
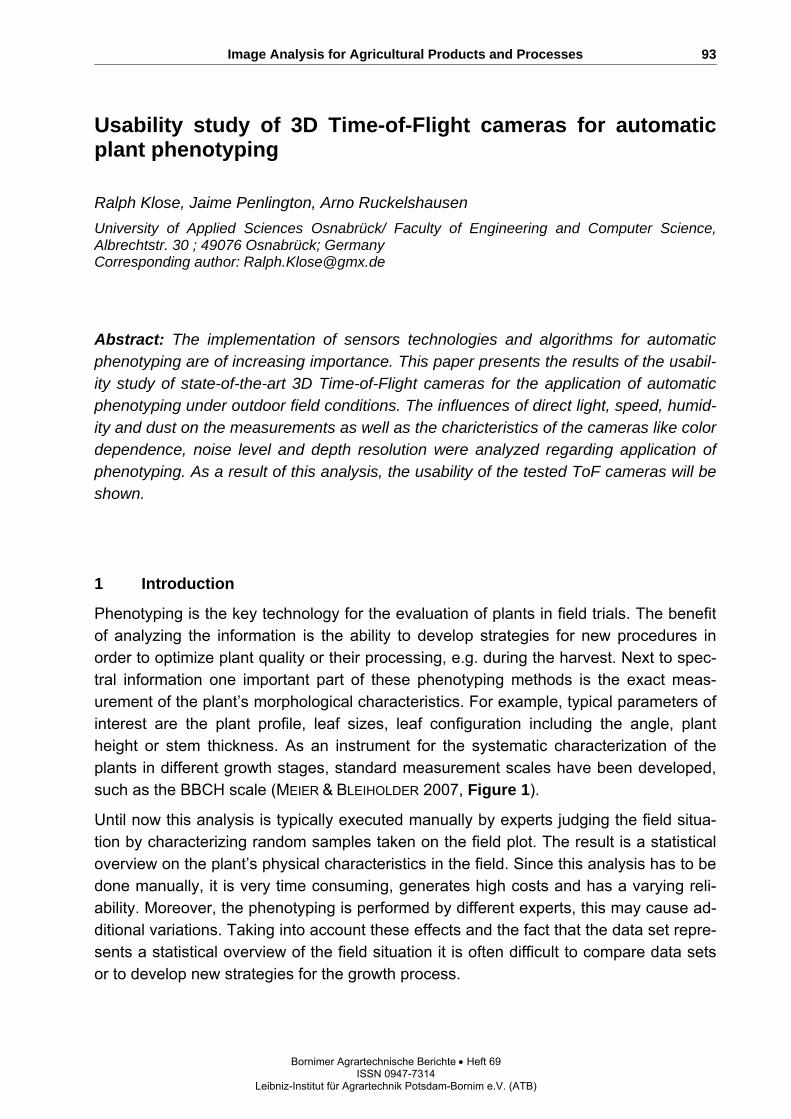
Image Analysis for Agricultural Products and Processes
Bornimer Agrartechnische Berichte Heft 69 ISSN 0947-7314 Leibniz-Institut für Agrartechnik Potsdam-Bornim e.V. (ATB)
93
Usability study of 3D Time-of-Flight cameras for automatic plant phenotyping
Ralph Klose, Jaime Penlington, Arno Ruckelshausen
University of Applied Sciences Osnabrück/ Faculty of Engineering and Computer Science, Albrechtstr. 30 ; 49076 Osnabrück; Germany Corresponding author: [email protected]
Abstract: The implementation of sensors technologies and algorithms for automatic phenotyping are of increasing importance. This paper presents the results of the usabil-ity study of state-of-the-art 3D Time-of-Flight cameras for the application of automatic phenotyping under outdoor field conditions. The influences of direct light, speed, humid-ity and dust on the measurements as well as the charicteristics of the cameras like color dependence, noise level and depth resolution were analyzed regarding application of phenotyping. As a result of this analysis, the usability of the tested ToF cameras will be shown.
1 Introduction
Phenotyping is the key technology for the evaluation of plants in field trials. The benefit of analyzing the information is the ability to develop strategies for new procedures in order to optimize plant quality or their processing, e.g. during the harvest. Next to spec-tral information one important part of these phenotyping methods is the exact meas-urement of the plant’s morphological characteristics. For example, typical parameters of interest are the plant profile, leaf sizes, leaf configuration including the angle, plant height or stem thickness. As an instrument for the systematic characterization of the plants in different growth stages, standard measurement scales have been developed, such as the BBCH scale (MEIER & BLEIHOLDER 2007, Figure 1).
Until now this analysis is typically executed manually by experts judging the field situa-tion by characterizing random samples taken on the field plot. The result is a statistical overview on the plant’s physical characteristics in the field. Since this analysis has to be done manually, it is very time consuming, generates high costs and has a varying reli-ability. Moreover, the phenotyping is performed by different experts, this may cause ad-ditional variations. Taking into account these effects and the fact that the data set repre-sents a statistical overview of the field situation it is often difficult to compare data sets or to develop new strategies for the growth process.
Klose, Penlington, Ruckelshausen
Bornimer Agrartechnische Berichte Heft 69 ISSN 0947-7314 Leibniz-Institut für Agrartechnik Potsdam-Bornim e.V. (ATB)
94
Figure 1: Parts of the BBCH Scale (MEIER & BLEIHOLDER 2007)
As a consequence, the implementation of sensors, system technologies and algorithms for automatic phenotyping are of increasing importance to overcome the disadvantages of the manual methods described above. While static measurements – typically imaging applications – can be performed under well-defined measurement conditions, online applications in the field are still a challenge for corresponding technologies. The benefits of such methods are the comparability of data sets, the objectivity of the data and the measurement in real-time on moving vehicles. The authors have recently shown that a sensor fusion concept together with a high resolution GPS system is even able to ana-lyze (and re-analyze) each single plant (FENDER et al. 2006). In combination with an autonomous field robot, it should even be possible to detect all plants in their different growth stages. This work is part of the development of such a field scout, named Boni-Rob (RUCKELSHAUSEN et al. 2009), one application will be the phenotyping of maize plants. To be able to use this new method in combination with an autonomous field ro-bot it is necessary to be able to perform the phenotyping of maize plants while the robot is moving in the field. However, the quality of the phenotyping strongly depends on the quality of the sensor information. For the physical characterization in particular, reliable distance information is the key element. This is especially true for the detection and as-signment of overlapping leaves.
2 3D Time-of-Flight
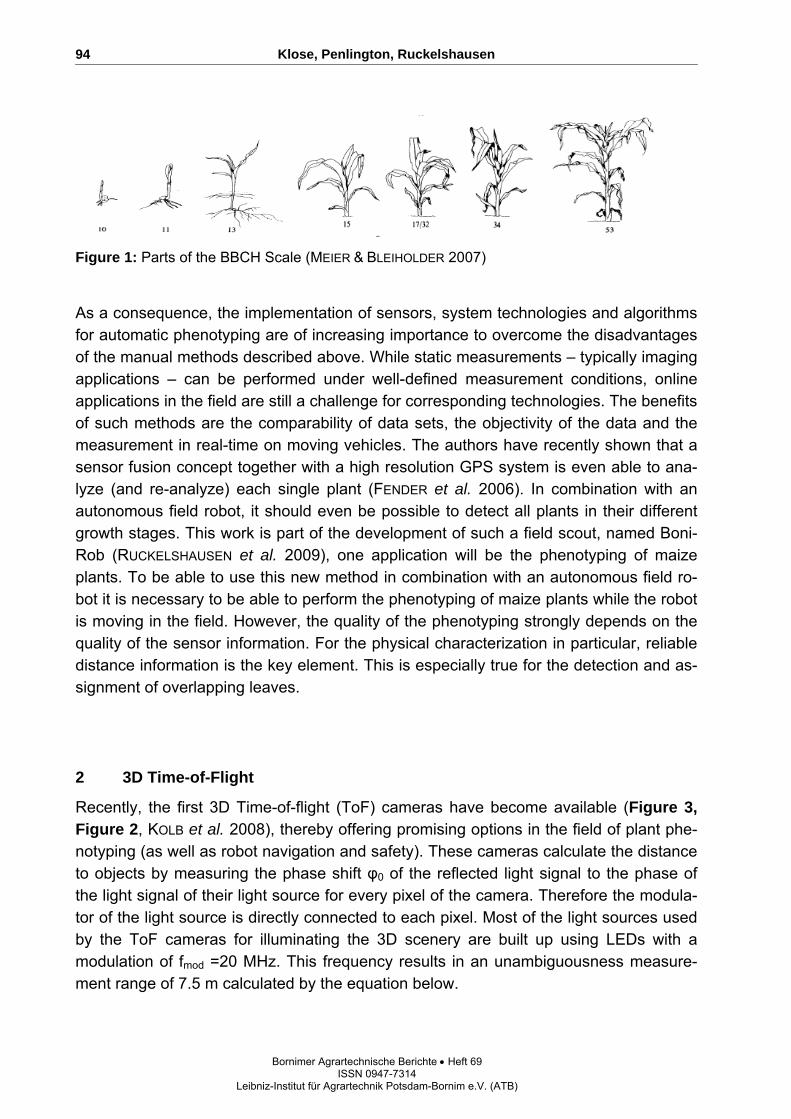
Recently, the first 3D Time-of-flight (ToF) cameras have become available (Figure 3, Figure 2, KOLB et al. 2008), thereby offering promising options in the field of plant phe-notyping (as well as robot navigation and safety). These cameras calculate the distance to objects by measuring the phase shift φ0 of the reflected light signal to the phase of the light signal of their light source for every pixel of the camera. Therefore the modula-tor of the light source is directly connected to each pixel. Most of the light sources used by the ToF cameras for illuminating the 3D scenery are built up using LEDs with a modulation of fmod =20 MHz. This frequency results in an unambiguousness measure-ment range of 7.5 m calculated by the equation below.
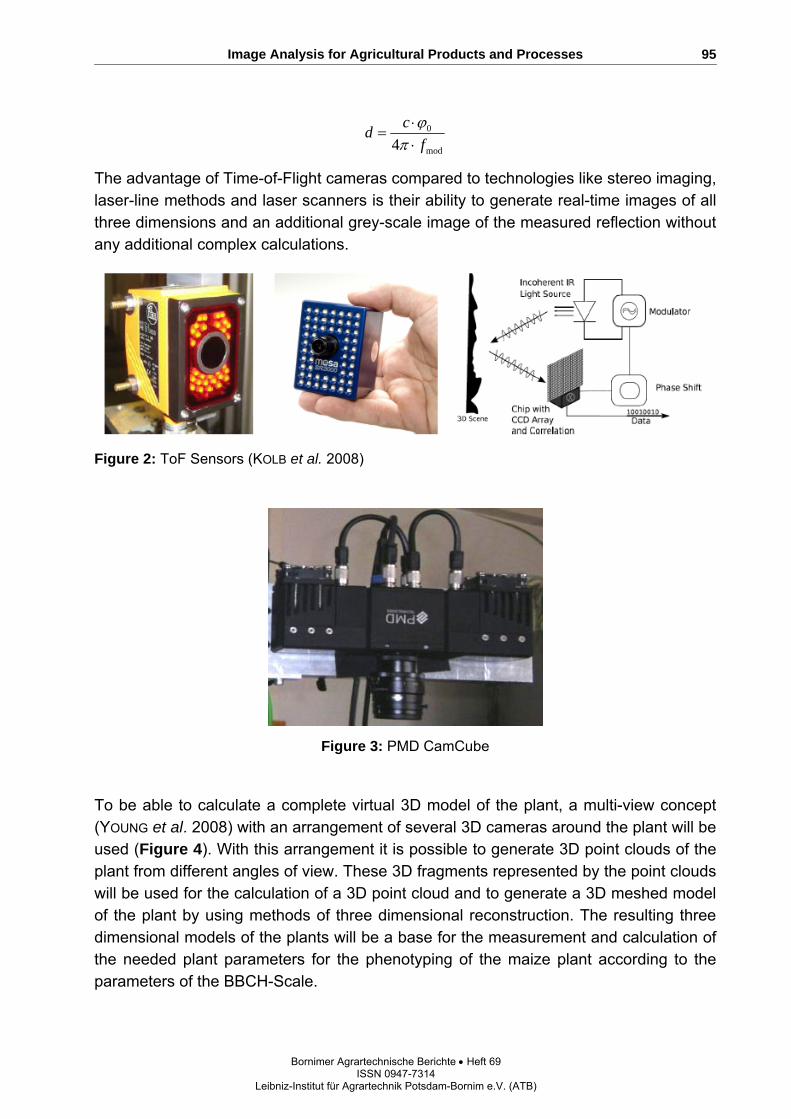
Image Analysis for Agricultural Products and Processes
Bornimer Agrartechnische Berichte Heft 69 ISSN 0947-7314 Leibniz-Institut für Agrartechnik Potsdam-Bornim e.V. (ATB)
95
mod
0
4 f
cd
The advantage of Time-of-Flight cameras compared to technologies like stereo imaging, laser-line methods and laser scanners is their ability to generate real-time images of all three dimensions and an additional grey-scale image of the measured reflection without any additional complex calculations.
Figure 2: ToF Sensors (KOLB et al. 2008)
Figure 3: PMD CamCube
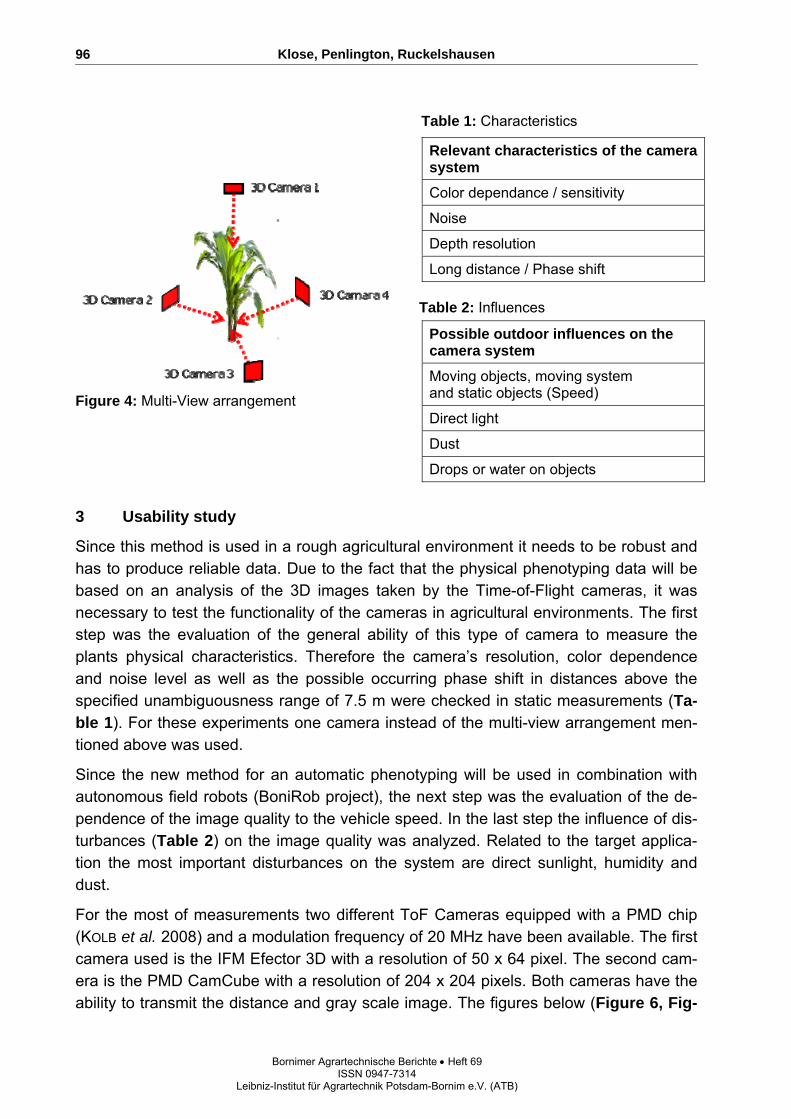
To be able to calculate a complete virtual 3D model of the plant, a multi-view concept (YOUNG et al. 2008) with an arrangement of several 3D cameras around the plant will be used (Figure 4). With this arrangement it is possible to generate 3D point clouds of the plant from different angles of view. These 3D fragments represented by the point clouds will be used for the calculation of a 3D point cloud and to generate a 3D meshed model of the plant by using methods of three dimensional reconstruction. The resulting three dimensional models of the plants will be a base for the measurement and calculation of the needed plant parameters for the phenotyping of the maize plant according to the parameters of the BBCH-Scale.
Klose, Penlington, Ruckelshausen
Bornimer Agrartechnische Berichte Heft 69 ISSN 0947-7314 Leibniz-Institut für Agrartechnik Potsdam-Bornim e.V. (ATB)
96
Table 1: Characteristics
Table 2: Influences
Figure 4: Multi-View arrangement
3 Usability study
Since this method is used in a rough agricultural environment it needs to be robust and has to produce reliable data. Due to the fact that the physical phenotyping data will be based on an analysis of the 3D images taken by the Time-of-Flight cameras, it was necessary to test the functionality of the cameras in agricultural environments. The first step was the evaluation of the general ability of this type of camera to measure the plants physical characteristics. Therefore the camera’s resolution, color dependence and noise level as well as the possible occurring phase shift in distances above the specified unambiguousness range of 7.5 m were checked in static measurements (Ta-ble 1). For these experiments one camera instead of the multi-view arrangement men-tioned above was used.
Since the new method for an automatic phenotyping will be used in combination with autonomous field robots (BoniRob project), the next step was the evaluation of the de-pendence of the image quality to the vehicle speed. In the last step the influence of dis-turbances (Table 2) on the image quality was analyzed. Related to the target applica-tion the most important disturbances on the system are direct sunlight, humidity and dust.
For the most of measurements two different ToF Cameras equipped with a PMD chip (KOLB et al. 2008) and a modulation frequency of 20 MHz have been available. The first camera used is the IFM Efector 3D with a resolution of 50 x 64 pixel. The second cam-era is the PMD CamCube with a resolution of 204 x 204 pixels. Both cameras have the ability to transmit the distance and gray scale image. The figures below (Figure 6, Fig-
Relevant characteristics of the camera system
Color dependance / sensitivity
Noise
Depth resolution
Long distance / Phase shift
Possible outdoor influences on the camera system
Moving objects, moving system and static objects (Speed)
Direct light
Dust
Drops or water on objects

Image Analysis for Agricultural Products and Processes
Bornimer Agrartechnische Berichte Heft 69 ISSN 0947-7314 Leibniz-Institut für Agrartechnik Potsdam-Bornim e.V. (ATB)
97
ure 7) show the resulting distance image of the two mentioned cameras taken of plants of different development stages (Figure 5).
Figure 6: 3D Image of Plants taken with the PMD CamCube
Figure 5: Plants with different growstages
Figure 7: 3D Image of Plants taken with the IFM Efector 3D
The image’s colors represent the measured distance to the object, where red is close distance to the camera of 80 cm and blue is representing a distance of 1.10 m. Besides the obvious visible difference in the resolution of the images, it can be seen, that it is possible to detect and to distinguish the leaves of the plants by analyzing their height and geometry, although the depth resolution represented by the different colors is not as high as the resolution of the raw data transmitted by the camera.
For the following measurements of the camera characteristics and the results of influ-ences on the system described above, different experimental rigs (Figure 8) were used containing a horizontal rotating table, a conveyor belt and two carriages for indoor and outdoor field measurements with battery power supply. With these rigs it was possible to perform the measurements with adjustable linear and rotational speeds of objects and adjustable height and angle of the cameras under constant repeatable conditions.
Klose, Penlington, Ruckelshausen
Bornimer Agrartechnische Berichte Heft 69 ISSN 0947-7314 Leibniz-Institut für Agrartechnik Potsdam-Bornim e.V. (ATB)
98
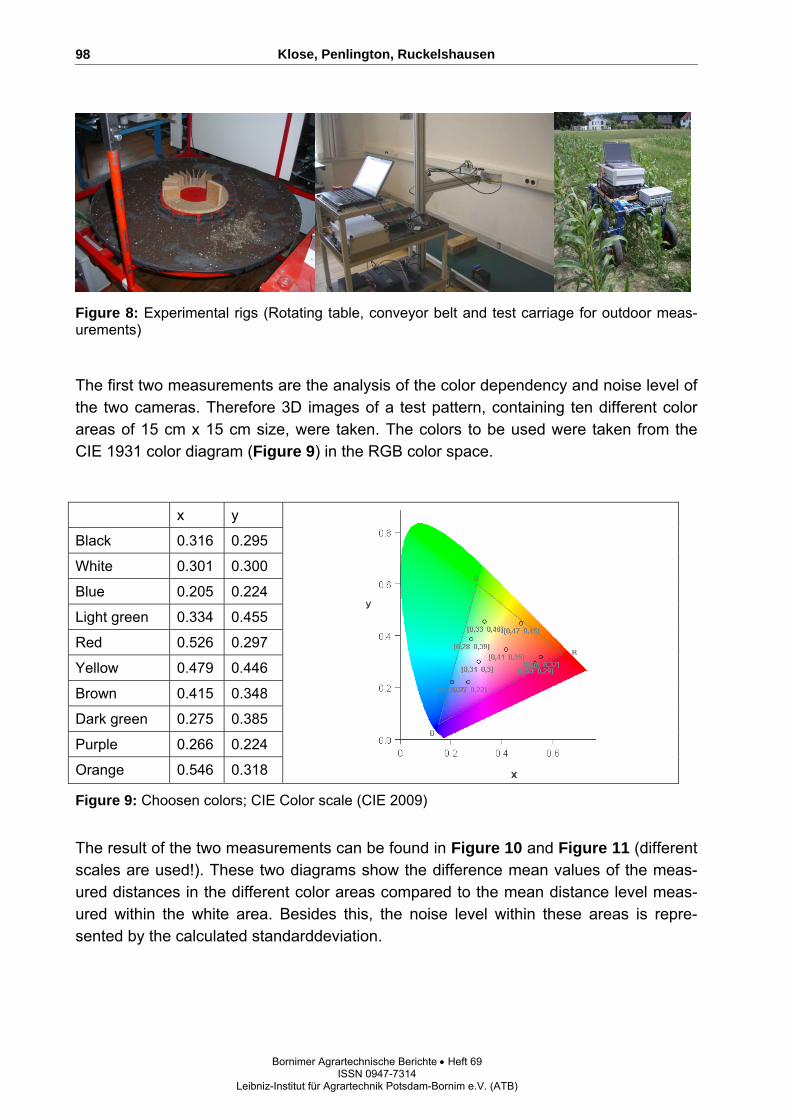
Figure 8: Experimental rigs (Rotating table, conveyor belt and test carriage for outdoor meas-urements)
The first two measurements are the analysis of the color dependency and noise level of the two cameras. Therefore 3D images of a test pattern, containing ten different color areas of 15 cm x 15 cm size, were taken. The colors to be used were taken from the CIE 1931 color diagram (Figure 9) in the RGB color space.
x y
Black 0.316 0.295
White 0.301 0.300
Blue 0.205 0.224
Light green 0.334 0.455
Red 0.526 0.297
Yellow 0.479 0.446
Brown 0.415 0.348
Dark green 0.275 0.385
Purple 0.266 0.224
Orange 0.546 0.318
Figure 9: Choosen colors; CIE Color scale (CIE 2009)
The result of the two measurements can be found in Figure 10 and Figure 11 (different scales are used!). These two diagrams show the difference mean values of the meas-ured distances in the different color areas compared to the mean distance level meas-ured within the white area. Besides this, the noise level within these areas is repre-sented by the calculated standarddeviation.
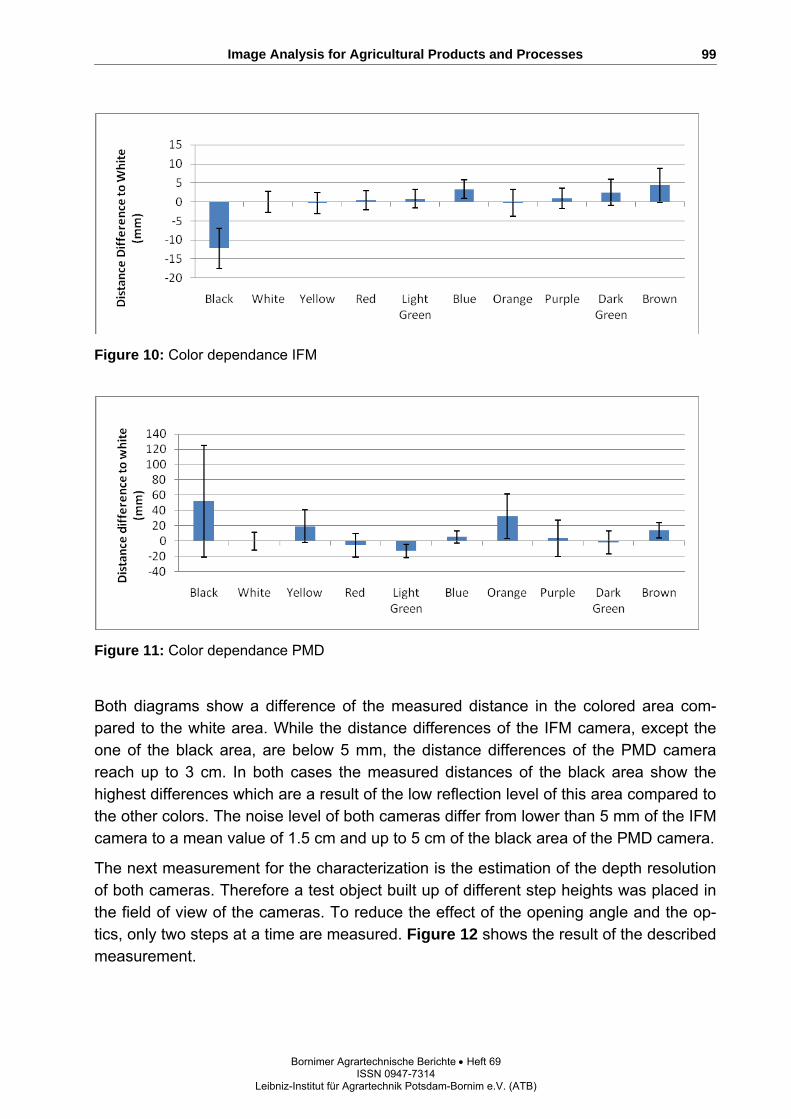
Image Analysis for Agricultural Products and Processes
Bornimer Agrartechnische Berichte Heft 69 ISSN 0947-7314 Leibniz-Institut für Agrartechnik Potsdam-Bornim e.V. (ATB)
99
Figure 10: Color dependance IFM
Figure 11: Color dependance PMD
Both diagrams show a difference of the measured distance in the colored area com-pared to the white area. While the distance differences of the IFM camera, except the one of the black area, are below 5 mm, the distance differences of the PMD camera reach up to 3 cm. In both cases the measured distances of the black area show the highest differences which are a result of the low reflection level of this area compared to the other colors. The noise level of both cameras differ from lower than 5 mm of the IFM camera to a mean value of 1.5 cm and up to 5 cm of the black area of the PMD camera.
The next measurement for the characterization is the estimation of the depth resolution of both cameras. Therefore a test object built up of different step heights was placed in the field of view of the cameras. To reduce the effect of the opening angle and the op-tics, only two steps at a time are measured. Figure 12 shows the result of the described measurement.
Klose, Penlington, Ruckelshausen
Bornimer Agrartechnische Berichte Heft 69 ISSN 0947-7314 Leibniz-Institut für Agrartechnik Potsdam-Bornim e.V. (ATB)
100
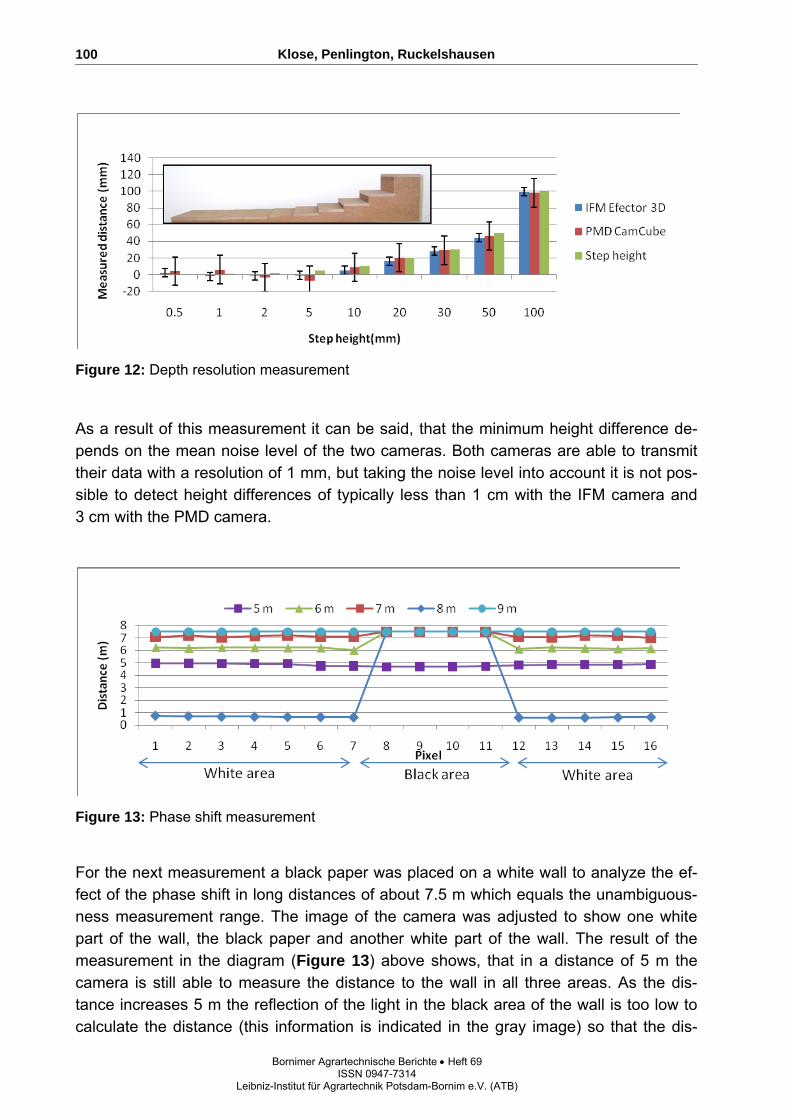
Figure 12: Depth resolution measurement
As a result of this measurement it can be said, that the minimum height difference de-pends on the mean noise level of the two cameras. Both cameras are able to transmit their data with a resolution of 1 mm, but taking the noise level into account it is not pos-sible to detect height differences of typically less than 1 cm with the IFM camera and 3 cm with the PMD camera.
Figure 13: Phase shift measurement
For the next measurement a black paper was placed on a white wall to analyze the ef-fect of the phase shift in long distances of about 7.5 m which equals the unambiguous-ness measurement range. The image of the camera was adjusted to show one white part of the wall, the black paper and another white part of the wall. The result of the measurement in the diagram (Figure 13) above shows, that in a distance of 5 m the camera is still able to measure the distance to the wall in all three areas. As the dis-tance increases 5 m the reflection of the light in the black area of the wall is too low to calculate the distance (this information is indicated in the gray image) so that the dis-
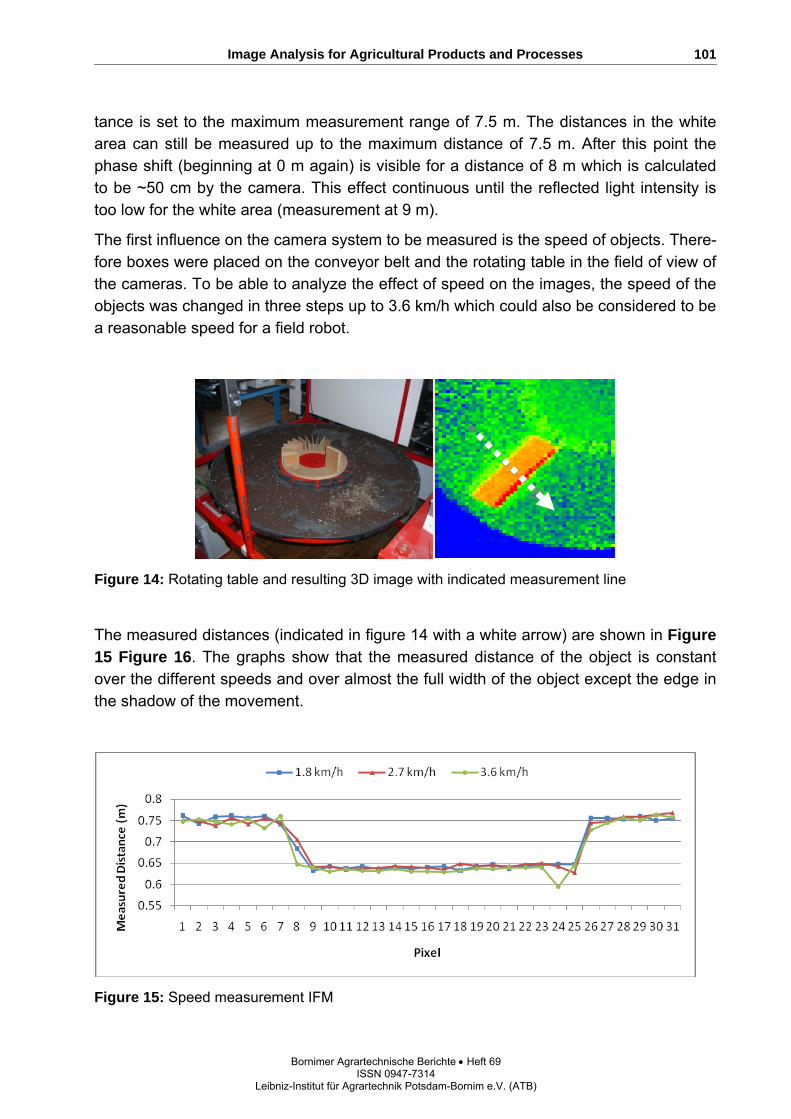
Image Analysis for Agricultural Products and Processes
Bornimer Agrartechnische Berichte Heft 69 ISSN 0947-7314 Leibniz-Institut für Agrartechnik Potsdam-Bornim e.V. (ATB)
101
tance is set to the maximum measurement range of 7.5 m. The distances in the white area can still be measured up to the maximum distance of 7.5 m. After this point the phase shift (beginning at 0 m again) is visible for a distance of 8 m which is calculated to be ~50 cm by the camera. This effect continuous until the reflected light intensity is too low for the white area (measurement at 9 m).
The first influence on the camera system to be measured is the speed of objects. There-fore boxes were placed on the conveyor belt and the rotating table in the field of view of the cameras. To be able to analyze the effect of speed on the images, the speed of the objects was changed in three steps up to 3.6 km/h which could also be considered to be a reasonable speed for a field robot.
Figure 14: Rotating table and resulting 3D image with indicated measurement line
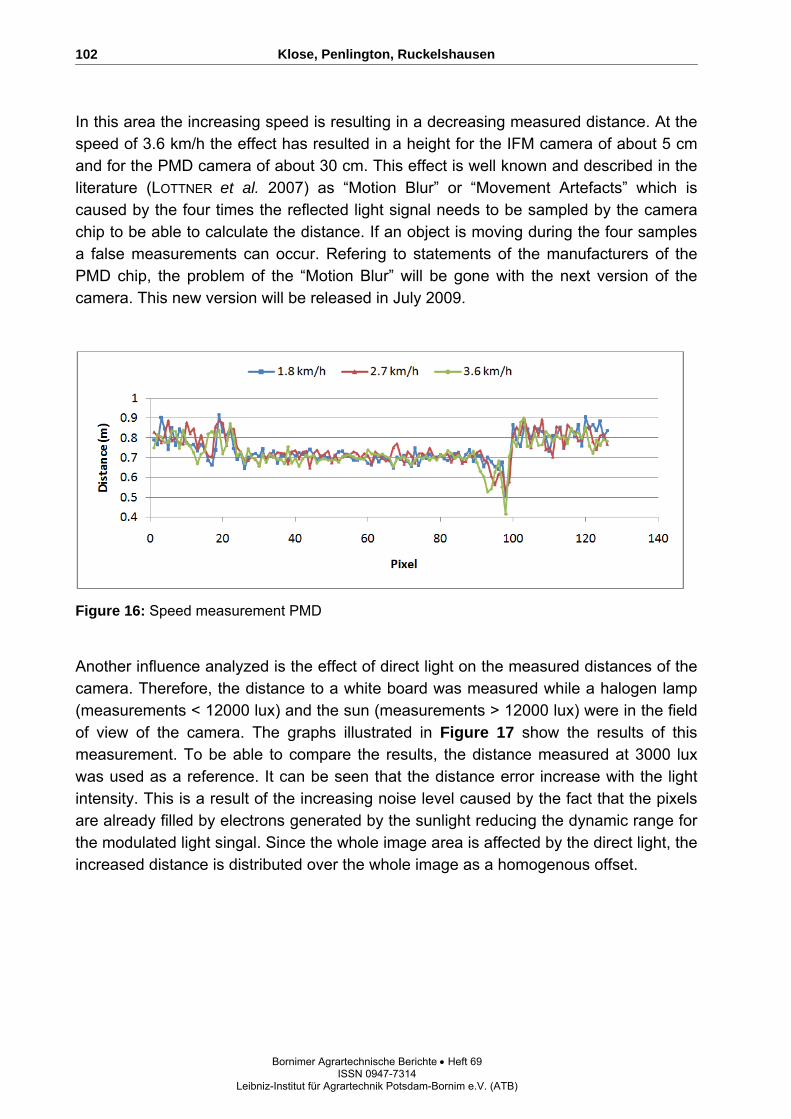
The measured distances (indicated in figure 14 with a white arrow) are shown in Figure 15 Figure 16. The graphs show that the measured distance of the object is constant over the different speeds and over almost the full width of the object except the edge in the shadow of the movement.
Figure 15: Speed measurement IFM
Klose, Penlington, Ruckelshausen
Bornimer Agrartechnische Berichte Heft 69 ISSN 0947-7314 Leibniz-Institut für Agrartechnik Potsdam-Bornim e.V. (ATB)
102
In this area the increasing speed is resulting in a decreasing measured distance. At the speed of 3.6 km/h the effect has resulted in a height for the IFM camera of about 5 cm and for the PMD camera of about 30 cm. This effect is well known and described in the literature (LOTTNER et al. 2007) as “Motion Blur” or “Movement Artefacts” which is caused by the four times the reflected light signal needs to be sampled by the camera chip to be able to calculate the distance. If an object is moving during the four samples a false measurements can occur. Refering to statements of the manufacturers of the PMD chip, the problem of the “Motion Blur” will be gone with the next version of the camera. This new version will be released in July 2009.
Figure 16: Speed measurement PMD
Another influence analyzed is the effect of direct light on the measured distances of the camera. Therefore, the distance to a white board was measured while a halogen lamp (measurements < 12000 lux) and the sun (measurements > 12000 lux) were in the field of view of the camera. The graphs illustrated in Figure 17 show the results of this measurement. To be able to compare the results, the distance measured at 3000 lux was used as a reference. It can be seen that the distance error increase with the light intensity. This is a result of the increasing noise level caused by the fact that the pixels are already filled by electrons generated by the sunlight reducing the dynamic range for the modulated light singal. Since the whole image area is affected by the direct light, the increased distance is distributed over the whole image as a homogenous offset.
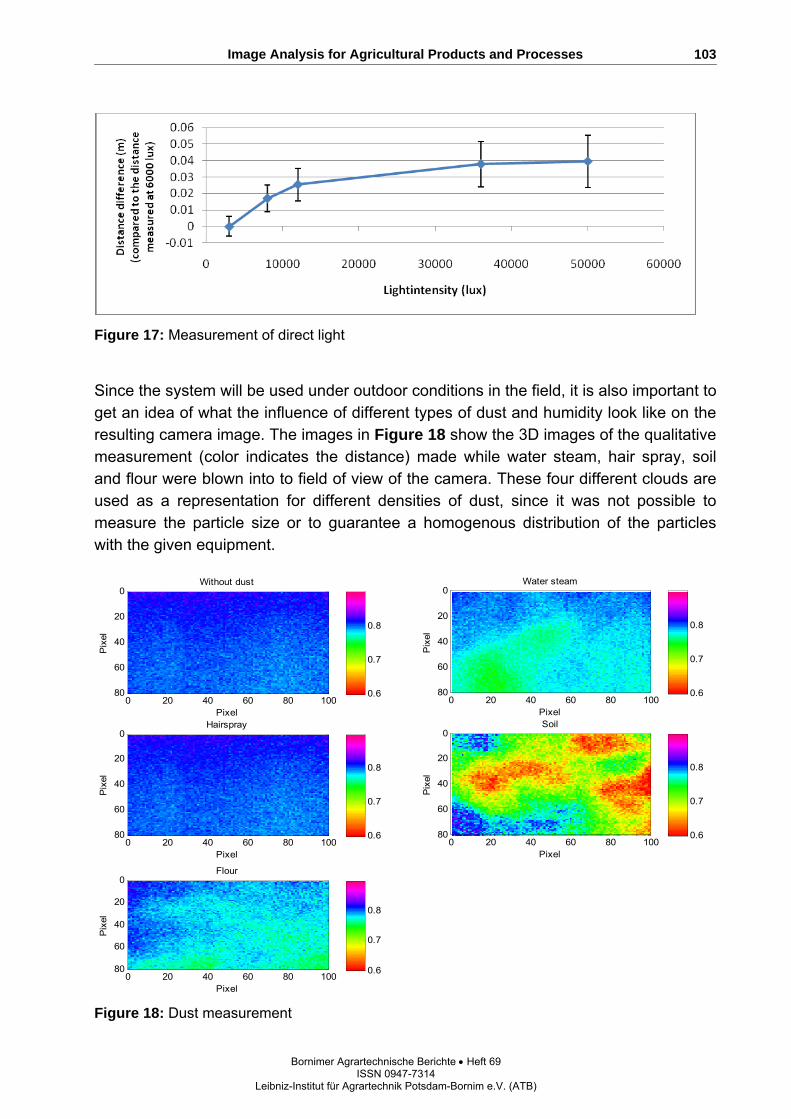
Image Analysis for Agricultural Products and Processes
Bornimer Agrartechnische Berichte Heft 69 ISSN 0947-7314 Leibniz-Institut für Agrartechnik Potsdam-Bornim e.V. (ATB)
103
Figure 17: Measurement of direct light
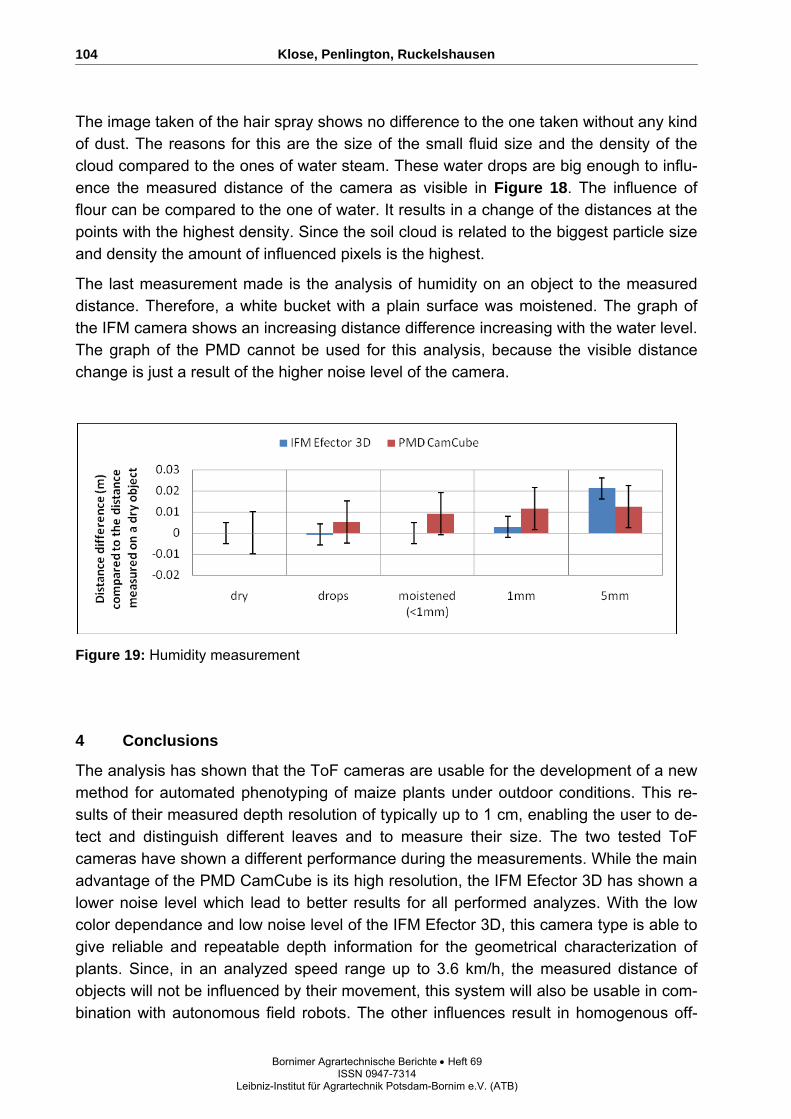
Since the system will be used under outdoor conditions in the field, it is also important to get an idea of what the influence of different types of dust and humidity look like on the resulting camera image. The images in Figure 18 show the 3D images of the qualitative measurement (color indicates the distance) made while water steam, hair spray, soil and flour were blown into to field of view of the camera. These four different clouds are used as a representation for different densities of dust, since it was not possible to measure the particle size or to guarantee a homogenous distribution of the particles with the given equipment.
Pixel
Pix
el
Without dust
0 20 40 60 80 100
0
20
40
60
80
Hairspray
Pixel
Pix
el
0 20 40 60 80 100
0
20
40
60
80 0.6
0.7
0.8
0.6
0.7
0.8
Flour
Pixel
Pix
el
0 20 40 60 80 100
0
20
40
60
80 0.6
0.7
0.8
Water steam
Pixel
Pix
el
0 20 40 60 80 100
0
20
40
60
80 0.6
0.7
0.8
Soil
Pixel
Pix
el
0 20 40 60 80 100
0
20
40
60
80 0.6
0.7
0.8
Figure 18: Dust measurement
Klose, Penlington, Ruckelshausen
Bornimer Agrartechnische Berichte Heft 69 ISSN 0947-7314 Leibniz-Institut für Agrartechnik Potsdam-Bornim e.V. (ATB)
104
The image taken of the hair spray shows no difference to the one taken without any kind of dust. The reasons for this are the size of the small fluid size and the density of the cloud compared to the ones of water steam. These water drops are big enough to influ-ence the measured distance of the camera as visible in Figure 18. The influence of flour can be compared to the one of water. It results in a change of the distances at the points with the highest density. Since the soil cloud is related to the biggest particle size and density the amount of influenced pixels is the highest.
The last measurement made is the analysis of humidity on an object to the measured distance. Therefore, a white bucket with a plain surface was moistened. The graph of the IFM camera shows an increasing distance difference increasing with the water level. The graph of the PMD cannot be used for this analysis, because the visible distance change is just a result of the higher noise level of the camera.
Figure 19: Humidity measurement
4 Conclusions
The analysis has shown that the ToF cameras are usable for the development of a new method for automated phenotyping of maize plants under outdoor conditions. This re-sults of their measured depth resolution of typically up to 1 cm, enabling the user to de-tect and distinguish different leaves and to measure their size. The two tested ToF cameras have shown a different performance during the measurements. While the main advantage of the PMD CamCube is its high resolution, the IFM Efector 3D has shown a lower noise level which lead to better results for all performed analyzes. With the low color dependance and low noise level of the IFM Efector 3D, this camera type is able to give reliable and repeatable depth information for the geometrical characterization of plants. Since, in an analyzed speed range up to 3.6 km/h, the measured distance of objects will not be influenced by their movement, this system will also be usable in com-bination with autonomous field robots. The other influences result in homogenous off-
Image Analysis for Agricultural Products and Processes
Bornimer Agrartechnische Berichte Heft 69 ISSN 0947-7314 Leibniz-Institut für Agrartechnik Potsdam-Bornim e.V. (ATB)
105
sets over the object, in case of wet objects, or as homogenous offsets in the whole im-age, in case of direct light. Since these offsets are homogenous they do not affect the calculation of the plants morphological parameters. In contrast to this the occurring of dust with a high density can be a problem for the analysis of the measured distances. However, further investigations are needed to check the ability image processing meth-ods filter the false measurements in case of dust with a low density.
Acknowledgement
This work is supported by the Federal Ministry of Food, Agriculture and Consumer Pro-tection BMELV (Germany).
References
FENDER F., HANNEKEN M., IN DER STROTH S., KIELHORN A., LINZ A., RUCKELSHAUSEN A. (2006): Sensor Fusion Meets GPS: Individual Plant Detection”, Proceedings of CIGR Eur-AgEng/VDI-MEG, 2006
RUCKELSHAUSEN A., BIBER P., DORNA M., ET AL. (2009): “BoniRob – an autonomous field robot platform for individual plant phenotyping” JIAC 2009 Wageningen (to be published)
KOLB A., BARTH E., KOCH R. (2008): “ToF-Sensors: New Dimensions for Realism and Interactiv-ity”; Computer Vision and Pattern Recognition Workshops, 2008. CVPR Workshops 2008. IEEE Computer Society Conference on 23-28 June 2008 Page(s):1 - 5
MEIER U., BLEIHOLDER H. (2007): “The BBCH scale – codification and description of phonologi-cal growth stages of plants and their international use in agricultural research”; Proceedings of the International Symposium 08 –10 October 2007 in Stuttgart-Hohenheim, ISBN 978-3-86186-5414, Page(s): 122-125
LOTTNER O., SLUITER A., HARTMANN K., WEIHS W. (2007): “Movement Artefacts in Range Im-ages of Time-of-Flight Cameras”; International Symposium on Signals, Circuits and Sys-tems, 2007. ISSCS 2007. Page(s): 1 - 4
YOUNG MIN K., CHAN D., THEOBALT C., THRUN S. (2008): “Design and calibration of a multi-view TOF sensor fusion system.” Computer Vision and Pattern Recognition Workshops, 2008. CVPR Workshops 2008. IEEE Computer Society Conference 2008 Page(s):1 – 7
CIE (2009) – Interactive CIE Software; www.pfk.ff.vu.lt/cie/