Embed Size (px)
Citation preview

Nafta SteelMarket trends and forecasts for the North American steel industry
J A N U A R Y / 2 0 0 3
• U.S. steel prices continued to fall in February. Price riseannouncements for 2Q03 will face strong resistance fromconsumers.
• Mexican consumption will show growth in 2003 while priceswill continue to hold better than U.S. prices.
[email protected]. Lázaro Cárdenas 2400 Pte. Edificio Losoles A-23Garza García, N.L. MÉXICO 66267Tel. +52 81 8363 8360 y 61Fax +52 81 8363 8369
February 28th, 2003

U.S. steel producers struggle to rise prices
• Nucor, US Steel Corp., Bethlehem Steel Corp., Wheeling-Pittsburgh Steel Corp., Gallatin Steel, and Steel Dynamics Inc.announced a $30 per ton increase for flat-rolled steel products2Q03 shipments. International Steel Group announced it will alsoattempt to increase prices by $20 per ton. from April 1 onwards.
• The increases are supported on the back of higher energy andscrap prices. It is estimated that during 1Q03 scrap costs will beapproximately $2-$3/ton higher than 4Q02, but for 2Q03 millsare anticipating an increase of up to $15/ton vs. 1Q03. If therises take place, it will be the first increase on strip products inthe U.S. since last September. High demand in China is boostingsteel prices globally, adding export opportunities to U.S. mills.
• In this context, producers hope to rise prices in the secondquarter of this year. Nevertheless, consumers will be reluctant tocope with the price rise as they still perceive an oversupplied andweak market. The performance of the market during March willbe crucial to determine the future of prices in 2Q03.
U.S. Steel Prices(in dollars per metric ton., Midwest region)
NAFTA Steel / Feb 2003
2001
Feb Feb Jan Feb*Hot-rolled steel sheet 248 253 330 308Cold-rolled steel sheet 374 352 451 440HD galvanized steel sheet 374 363 528 484Coiled steel plate 264 264 330 341CF steel bar (grade 1018 carbon) 473 451 506 523Structural beams (A36 W8 wide-flange) 330 391 336 330Low-carbon wire rod 308 303 336 319Concrete reinforcing bar (#6) n/a 280 280 270
2002 2003
* Late January.Source: Cahners.
U.S. steel prices continued to fall in February.Price rise announcements for 2Q03 will facestrong resistance from consumers.
2
2000
Feb363484473352506330330325

Source: HARBOR intelligence with U.S. Imports for Steel Consumption Data.Final data for December 2002 (Census Basis).
• Of all 36 countries from which the U.S. imports steel, only 9reported a rise in import volume in January. Canada, Mexico,and Spain accounted for the highest tonnage increases (50,083,40,476 and 15,924 tonnes of increase respectively). We believethe reduction in January preliminary U.S. imports is due to betterprices in Asia rather than the effectiveness of Section 201 tariffs.
• Russian and Ukrainian (CIS) flat product prices are continuing torise. Chinese demand is still strong but now the demand hasincreased in other areas. Product is moving towards the MiddleEast, Turkey, Philippines, and Vietnam where there has been ashortage due to the large tonnage going to China in the last sixmonths. Customers restocking is being driven by the threat of awar in Iraq.
• Steel markets in the U.S. continue to suffer from weak demand.The low prices in the U.S. reduced imports (according to Januarypreliminary imports data). In order to see an import rise in theU.S., a price improvement must take place.
U.S. Imports of Steel Products(metric tons., year total)
U.S. steel imports are being diverted towards Asian markets
U.S. imports grew 8.4% during 2002. Though, inJanuary imports showed a 15.7% decline due toimproving prices in Asia (specially China).
3
Section 201 Products
2002 2001%
Change
Blooms, Billets And Slabs 7,981,624 5,783,833 38.0%Wire Rods 3,166,452 2,733,351 15.8%Plates In Coils 883,706 649,104 36.1%Bars - Hot Rolled 1,465,805 1,328,468 10.3%Bars - Reinforcing 1,157,753 1,595,036 -27.4%Standard Pipe 989,239 1,041,374 -5.0%Oil Country Goods 444,052 890,765 -50.1%Line Pipe > 16 Inches In Diameter 660,598 882,186 -25.1%Line Pipe <= 16 Inches In Diameter 237,933 257,651 -7.7%Mechanical Tubing 488,378 451,409 8.2%Sheets Hot Rolled 3,524,844 2,186,323 61.2%Sheets Cold Rolled 1,733,945 2,786,509 -37.8%Sheets & Strip Galv Hot Dipped 1,919,964 1,337,960 43.5%Sheets & Strip Galv Electrolytic 166,415 159,415 4.4%Sheets & Strip All Other Metals Coated 299,503 240,502 24.5%
TOTAL U.S. Imports for Consumption of Steel Products 29,652,212 27,350,808 8.4%
NAFTA Steel / Feb 2003

0
50
100
150
200
250
300
Jan-9
4Se
p-94
May-9
5Ja
n-96
Sep-
96Ma
y-97
Jan-9
8
Sep-
98Ma
y-99
Jan-0
0Se
p-00
May-0
1Ja
n-02
Sep-
02
-40
-30-20
-100
1020
30
050
100150200250300350
Jan-9
4
Oct-9
4
Jul-9
5
Apr-9
6
Jan-9
7
Oct-9
7
Jul-9
8
Apr-9
9
Jan-0
0
Oct-0
0
Jul-0
1
Apr-0
2
Jan-0
3
-40-30-20-100102030
Mexican prices continue their upward trend (in peso terms)
• According to our Producer´s Price Index analysis, Mexican steelprices continue on an upward trend. Galvanized sheet producerprice index rose 4.9% annually in January 2003 (in peso terms),and wire rod prices increased 10.4% during the same period.Mexican wire rod prices have fully recovered, starting anexpansion phase on November. Medium-term cycle (light blueline in graphs) is above zero implying an expansion phase.Nevertheless, once we take into account the peso devaluationvs. the dollar (14% in 2002 and 6% in the first 2 months of theyear), steel prices in Mexico show a fall in dollar terms.
• Galvanized sheet medium-term cycle is getting closer to zero(right graph up) implying that prices for galvanized sheet arerecovering and will start to expand in 2003. Our model showsthat the mid-term outlook for Mexican steel prices is positive. Thelong term trend of our model also suggest an upward cycle forgalvanized steel prices. Similar trends were found in Mexicancorrugated rod and tinplate prices (rose annually 21.0 and 5.3%in peso terms, respectively in January this year).
Mexican prices continue to improve in pesoterms but weak in dollar terms (due to therecent peso´s depreciation.
Mexican Wire Rod(NSA Producer Price Index, 1994 = 100)
Mexican Galvanized Sheet(NSA Producer Price Index, 1994 = 100)
Source: HARBOR intelligence with Banxico data.
Producer Price Index (PPI)(left scale)
Medium-term cycle(PPI - LTT, above 0
implies an expansion)
Long-term trend (LTT)(left scale)
Upwardtrend
Producer Price Index(left scale)
Long-term trend(left scale)
Upwardtrend
4
Medium-term cycle(PPI - LTT, above 0
implies an expansion)
NAFTA Steel / Feb 2003
Jan-
03
Mexican export markets remain the most attractive
• As shown in the tables at right, practically all Mexican steelproducts exports to the U.S. market have risen in year-on-yearterms (except CR where the negative ITC ruling on imposinghigher import tariffs affected their average prices and volume,and wire rod which was also subject to ITC ruling in earlyOctober 2002). Mexico is the third country with largest exports tothe U.S. Market (in volume terms), only behind Canada andBrazil. From January to October 2002, the U.S. imported 2.88million tons of steel products from Mexico (11.8% of total U.S.imports during that period).
• The acquisition of VP Buildings in 2001, and Pinole Street andLightfield in 2002 by IMSA Acero reflect how Mexican mills seethe U.S. market as an attractive business opportunity (speciallywith the recent peso devaluation). On the other hand, Imexsaexpects slab demand to increase in East Asia, China and theU.S. in 2003. Once Section 201 tariffs reduce in March, Imexsaexpects to export an additional 500,000 tonnes of merchant slabinto the U.S. market. Increases in export prices and shipmentswere made by Mexican mills last year. Hylsamex average exportprices rose 4% in 3Q02 from 2Q02 and 9% from 1Q02. Hylsa´sexport sales increased 61% annually during the Jan-Sep period.
Mexican Export Prices to U.S.(average dollars per metric ton.)
2001
Jan Jan DecHot-rolled steel sheet 254 249 336Cold-rolled steel sheet 840 774 624HD galvanized steel sheet 553 563 679Slab 190 228 264Mechanical Tubing 573 513 604Line Pipe (≤ 16 inches in diameter) 503 440 537Wire rod 238 311 323
2002 2003
Almost all U.S. steel imports from Mexico haverisen year-on-year (both in volume and price).
Reinforcing bar 264 254 252
Source: HARBOR intelligence with Bancomext, SE and USDOC data.
Mexican Export Volume to U.S.(metric tons.)
2001
Jan Jan Jan*Hot-rolled steel sheet 8,343 7,774 14,463Cold-rolled steel sheet 17,714 11,985 30,775HD galvanized steel sheet 16,286 15,990 17,150Slab 97,402 2,088 157,912Mechanical Tubing 8,735 8,303 11,003Line Pipe (≤ 16 inches in diameter) 4,937 3,132 4,503Wire rod 25,695 4,748 3,183
2002 2003
Reinforcing bar 2,896 4,637 12,060
Jan*374614623258630559355245
5
Dec32,07329,11714,836
110,38811,0831,6513,5699,248
* Preliminary
* Preliminary
NAFTA Steel / Feb 2003

129.7
131.1
106.4
109.4
129
130
131
132
133
134
OCT
NOV
DEC
JAN
FEB
MAR
APR
MAY
JUN
JUL
AUG
SEP
OCT
NOV
DIC
106
107
108
109
110
111
Nafta industrial recovery remains uncertain
• The Philadelphia Fed manufacturing survey was weaker thanexpected in February. The general business activity index fell to2.3 from 11.2 in January. The components of the survey weremore mixed than suggested by the headline index. New ordersdropped to 14.1 from 17.3 but the shipments index dropped to0.0 from 21.3. Unfilled orders dropped to -9.1 from -1.5.Indicators on employment were mixed with the number ofemployees index rising to -0.9 from -6.1 but the average workweek falling to -5.1 from 3.8. The prices paid index rose to 16.2from 11.6, reflecting higher energy prices.
• In December, Mexico´s seasonally adjusted (SA) industrialactivity index grew by 0.46% compared to the same month in2001. Also, Mexican construction showed an annual SA 1.77%growth on the same month due to an increase in infrastructureconstruction (electricity, petroleum and petrochemical oriented)which increased demand for corrugated rod and steel sheet.There is a growing concern regarding natural gas price in theMexican steel industry as it consumes 31.5% of Mexican totalgas output and for some mills represent around 20% of it costs.
SOURCE: HARBOR intelligence with Federal Reserve Board data.
U.S. Industrial Production Index(Seasonally Adjusted Index, 1997 = 100)
108.3
110.3
111.1111.6
108.0108.5109.0109.5110.0110.5111.0111.5112.0
NOV
DEC
JAN
FEB
MAR AP
R
MAY JU
N
JUL
AUG
SEP
OCT
NOV
DEC
JAN
2001 2002
U.S. economy still shows mixed signals, whileMexican industrial activity holds on the back ofthe construction sector.
Mexico´s Industrial and Construction Activity Indexes(Seasonally Adjusted Index, 1993 = 100)
SOURCE: HARBOR intelligence with INEGI data.
2001 2002
Construction activity(right scale)
Industrial activity(left scale)
6
NAFTA Steel / Feb 2003
2003
Auto market is very important for steel in Mexico
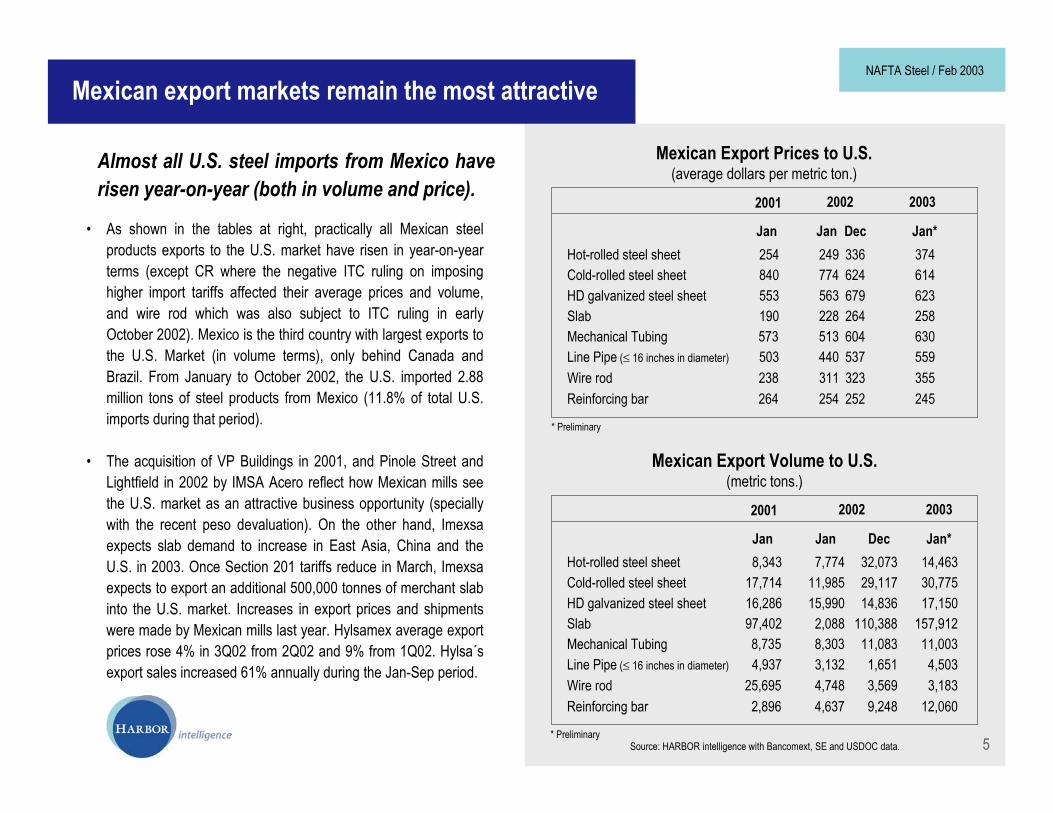
• According to our estimates, production from domestic steel millsdestined to the Mexican automotive industry (OEM) in 2002oscilate around 650,000 tonnes. At the same time, steel importsdestined to the auto industry are close to 900,000 tonnes (wereclose to 650,000 in the first 9 months of 2002). In consequence,the total automotive steel market in Mexico (domestic production+ imports) is estimated at 1.55 million tonnes for 2002. Totalautomotive production in Mexico fell 2.4% in 2002 for the secondconsecutive year, given the sharp fall in U.S. sales, whichaccounts for 86% of total Mexican auto exports.
• Our steel import analysis shows mixed signal in import volumes,depending on the type of steel product. For instance, while HRimports fell 31% in the first 9 month of 2002 (latest availabledata), CR imports rose 30% in the same period. While theMexican automotive industry (both assembly and auto parts) hasboomed in the past 10 years due to increasing assemblyfacilities installed in Mexico and domestic content of exportedcars growing in tandem, certain components such as exteriorbodies and high-resistance steels are not produced in Mexico yetdue to the lack of technology.
SOURCE: HARBOR intelligence with AMIA and Mavel historical data.
Mexico´s Automotive Production Forecast 2003-2010(Thousands on units)
U.S. industrial production shows no signs ofimprovement, while Mexican industrial activityholds thanks to the construction sector.
Mexico´s Share of Steel Production destined to Auto Market(Based on 1999 domestic shipments data)
SOURCE: HARBOR intelligence with CANACERO and domestic mills data. 7
NAFTA Steel / Feb 2003
3,055
1,728
0500
1,0001,5002,0002,5003,0003,500
1997
1998
1999
2000
2001
2002
2003
2004
2005
2006
2007
2008
2009
2010
as % of total in metric tons.Total steel products 11,474,105 11,942,655 5.1% 612,482Plate 1,029,145 1,017,575 12.9% 131,226Hot rolled coil 2,206,197 2,378,526 8.8% 208,161Cold rolled coil 1,796,475 1,933,520 5.1% 98,490Galvanized coil 1,077,831 1,179,964 5.1% 59,956Tinplate 104,173 73,146 1.3% 924Wire rod 1,613,294 1,809,282 0.6% 10,237Commercial profiles 680,961 736,883 8.3% 60,890Bars 470,744 358,393 5.1% 18,124Seamless tube 671,337 637,542 1.3% 8,287Welded tube (<115 diameter) 357,889 350,799 4.6% 16,187Total 10,008,046 10,475,630 5.8% 612,482
Of which auto steel2001 2002

• Although U.S. steel mills production remains at year-on-yearhigher levels (see figures at right), rated capacity was stableduring February. Mills have realized that the U.S. economy isjust not responding and amid the consolidation wave takingplace in the domestic market, they are trying to set control inorder to impose higher prices in the near future. The oversupplyproblem is in the mind of the customers who are reluctant to takeany price increases. There remain the issues we pointed out lastedition: growing imports due to Section 201 reduced tariffs(starting in March), a weak economy, and high production rates.
• Mexican steel production for 2002 was around 14.05 milliontonnes (5.6% up from 2001). Increased production and efficiencyon some Mexican plants (specially Hylsamex and IMSA),allowed steel production to grow. Aside from good fundamentalsin the construction sector (internally driven) during 2003, theMexican steel market outlook will be highly dependant on theU.S. recovery (manufacturing related steel demand) as well ason needed reforms in Mexico that could boost steel demand(allow for private investment in electricity and petrochemicalsectors, as well to an urgent restructure to the railway system).
Weekly U.S. Steel Production and Rated Capacity(production in thousand tons., capacity = production as % of total capacity)
Supply excess gains momentum in the U.S.
1,2591,131
1,2641,3571,2201,2951,2851,255
1,0681,0951,011
826
JAN FEB MAR APR MAY JUN JUL AUG SEP OCT NOV DEC
SOURCE: HARBOR intelligence with AISI data
Mexican Steel Production in 2002(total steel monthly production, thousand of metric tons.)
SOURCE: HARBOR intelligence with CANACERO data.
U.S. steel capacity has been fluctuatingbetween 80 and 90% during February, U.S. millstry to take control.
8
1,878
1,992
Feb 15, 2002 Feb 15, 2003
87.3%85.1%
Feb 15, 2002 Feb 15, 2003
6.1%
Production Rated Capacity
-2.5%
NAFTA Steel / Feb 2003

Mexican Apparent Steel Consumption(Volume in thousand of metric tons. ; real % annual change)
The outlook for Mexican steel consumption is attractive...
Mexico´s total steel consumption will grow at an annualaverage rate of 6.7% between 2003 and 2006.
SOURCE: Forecast by HARBOR intelligence with CANACERO historical data.
F = Forecast* As defined by CANACERO. Some market sources take into account only selected non-flat and flat products which in 2001 represented only 68% of total steel consumption reported by CANACERO.** Annual average rate.
Volume % Volume % Volume % Volume % Volume % Volume % Volume % Volume %
Total Steel Consumption* Hot Rolled Sheet Seamless Pipe Welded Pipe
(diameter < 115mm)Galvanized SheetCold Rolled Sheet Wire Rod Corrugated Rod
1999 17,623 4.7 2,162 6.8 2,296 -3.8 871 -4.9 1,732 6.0 2,485 5.2 175 -33.1 243 -20.1
2000 19,800 12.4 2,596 20.1 2,458 7.1 1,093 25.5 1,908 10.2 2,658 6.9 206 18.2 242 -0.4
2001 18,788 -5.1 2,578 -0.7 2,084 -15.2 1,429 30.8 1,576 -17.4 2,516 -5.3 210 1.9 303 24.9
2002 19,807 5.4 2,623 1.7 2,306 10.7 1,433 0.3 1,821 15.5 2,590 3.0 215 2.5 262 -13.4
2003F 20,832 5.2 2,997 8.8 2,371 2.8 1,511 5.5 1,896 4.1 2,647 2.2 234 8.5 276 5.1
2004F 22,417 7.6 3,191 7.8 2,533 6.9 1,658 9.7 2,028 7.0 2,983 12.7 262 12.1 285 3.3
2005F 23,953 6.9 3,371 4.8 2,691 6.2 1,928 16.3 2,156 6.3 3,249 8.9 290 10.5 293 2.9
2006F 25,751 7.5 3,576 7.8 2,879 7.0 2,230 15.7 2,305 6.9 3,475 7.0 325 12.2 303 3.3
1990-2002** 9.3 10.7 7.4 15.4 7.6 6.4 10.7 3.3
2003-2006** 6.7 7.1 5.9 11.3 6.4 7.5 10.5 3.0
9
NAFTA Steel / Feb 2003

Forecast Assumptions for Mexico
... under our base scenario economic assumptions
SOURCE: Forecast by HARBOR intelligence with INEGI and Banxico historical data.F = Forecast* Annual average rate** End of period
% annual change % annual change % annual change % annual change % annual change % annual change % annual change
Total GDP ConstructionGDP
Total PublicInvestment
Consumer PriceIndex**
Metal products, machineryand equipment GDP
ManufacturingGDP
Total Investment
1999 3.7 5.0 6.9 4.2 7.7 10.7 12.3
2000 6.6 4.1 13.6 6.9 11.4 24.5 9.0
2001 -0.3 -5.3 -6.9 -3.7 -5.9 -9.6 4.4
2002 0.9 1.7 -1.7 -0.6 -1.2 -2.5 5.7
2003F 3.0 4.1 5.4 2.3 5.5 11.4 4.0
2004F 4.3 6.8 10.4 5.3 9.9 19.8 3.6
2005F 4.0 5.5 8.7 4.9 8.6 15.7 3.4
2006F 4.5 6.4 8.9 5.6 9.9 17.2 3.4
1990-2002* 3.1 2.9 6.4 3.7 5.5 2.0 17.0
2003-2006* 3.9 5.7 8.3 4.5 8.5 16.0 3.6
10
NAFTA Steel / Feb 2003

Mexican Slab
Production and Consumption(monthly data in thousands of metric tons.)
Exports(monthly data in thousands of metric tons.)
• Slab consumption in Mexico increased 1.6% during 2002(reached 982,488 tonnes). During the current year, Imexsa (onlyslab producer in Mexico) is planning to raise its slab productionto full capacity (close to 4m tonnes, mainly export) with theexpectation that prices will rise on the back of strong demand,particularly from East Asia and China. East Asian demand couldtighten the slab market and push demand in the U.S. (additionalto the announced price rise by U.S. flat steel producers).
• Imexsa became California Steel Industries´ largest individualslab supplier in 2002 and is expected to maintain this positionthis year. Out of 2002 total slab output (2.76 million tonnes),64.4% headed to the export market (mainly the U.S. market). Onthe other hand, Section 201 restrictions will be eased fromMarch to allow a further 500,000 tonnes of merchant slab intothe U.S. market in the year from that date. Currently, prices areat $225-230/tonne fob in the U.S. market. We expect theseprices to increase in 2Q03 and 3Q03 as U.S. flat products pricesbegin to rise (as planned by U.S. domestic mills).
Slab prices to increase during 2003 as demandin Asia will remains strong and the U.S. flatproduct planned price increase will take place.
127
6462
164
263320
211
050
100150200250300350
Jan Mar May July Sep Nov Jan Mar May July Sep Nov
Production
Consumption
Strike Effect
2001 2002
SOURCE: HARBOR Intelligence with CANACERO data.
79
136
230
162149
252
0255075
100125150175200225250275
Jan Mar May July Sep Nov Jan Mar May July Sep Nov
Exports
2001 2002
Imexsaresumes fullcapacityafter strike
11
Dec
Dec
NAFTA Steel / Feb 2003
153
270
185
225
168
155
205
125150175200225250275300
Jan Mar May July Sep Nov Jan Mar May July Sep Nov
Production
Consumption
2001 2002
Mexican Hot Rolled Sheet
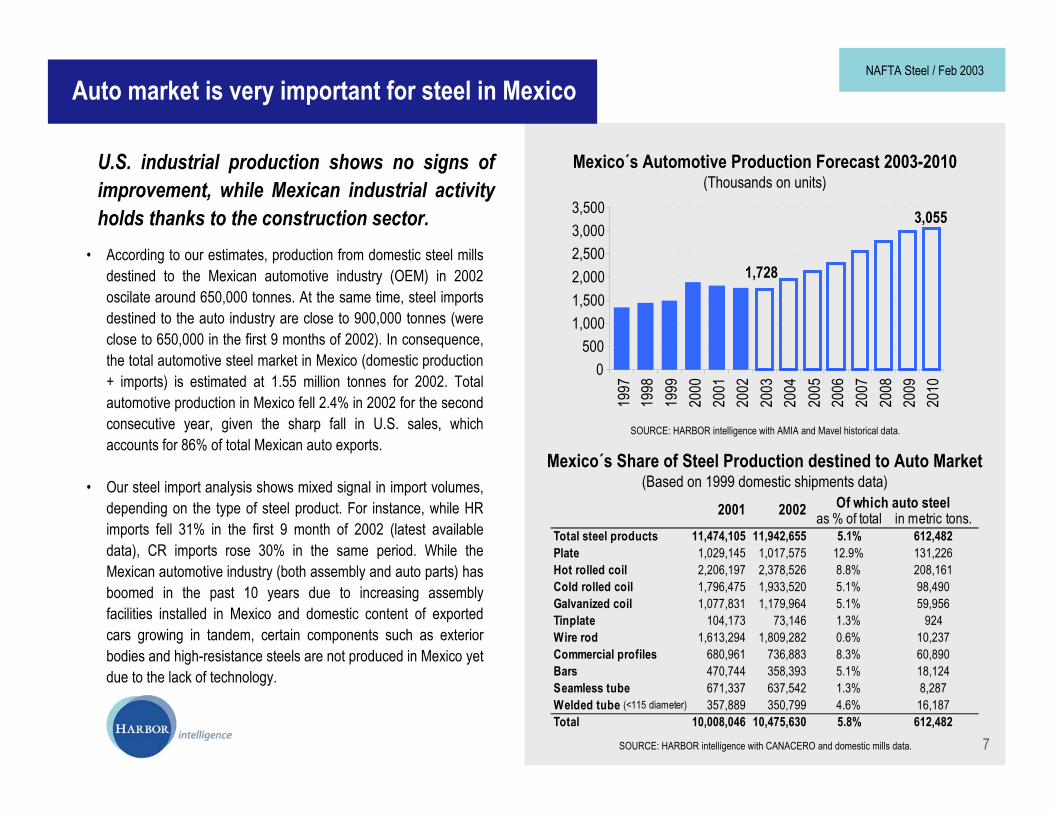
• HR sheet volume and price scenario is improving for Mexicanmills who are enjoying increased sales in foreign markets. HRexports increased 59.3% year-on-year in 2002 (reached 314,361tonnes). IMSA´s export volume reached 473,000 tonnes in 4Q02(2.7% higher compared to 4Q01). IMSA Acero will continue itsinvestment program to reach a HR production capacity of 2.2million tonnes in 2004. At the end of 2002, IMSA had a HRcapacity of 1.5 million, they expect to reach 1.9 million by theend of 2003. We know that APM and Hylsa are studying theopportunity to export HR to China.
• Mexican HR consumption reached 2,623,339 tonnes in 2002(1.7% higher than 2001) and HR production grew 7.8% in thesame period (reached 2,378,526 tonnes). As we know,Hylsamex reopened its Mill#1 Flat Products Division in 2002,increasing its production rates from 13,000 tons in 1Q02 to66,000 tons in 2Q02. Currently, it is producing around 350,000tonnes per year. Hylsa´s HRC lines are located in Monterrey witha combined capacity of 2.11 million tonnes per year.
Production and Consumption(monthly data in thousands of metric tons.)
Imports and Exports(monthly data in thousands of metric tons.)
SOURCE: HARBOR Intelligence with CANACERO data.
Due to the high demand in Asia, Mexican HRsheet production is being driven by a rise inexports.
3940
53
100
1020304050607080
Jan Mar May July Sep Nov Jan Mar May July Sep Nov
Exports
Imports
2001 2002
12
Dec
Dec
NAFTA Steel / Feb 2003

54
37
40
90
102030
40506070
Jan Mar May July Sep Nov Jan Mar May July Sep Nov
Exports
Imports
2001 2002
SOURCE: HARBOR Intelligence with CANACERO data.
Production and Consumption(monthly data in thousands of metric tons.)
Imports and Exports(monthly data in thousands of metric tons.)
Mexican Cold Rolled Sheet
• Domestic consumption of cold rolled steel showed a significantrise during 2002, reaching 2,306,403 tonnes (10.7% y-o-y). CRproduction increased to 1,933,520 tonnes (7.6% y-o-y) in thesame period. CR steel demand and production were mainlydriven by a strong heavy appliances demand and autoproduction (domestic oriented), which rose 4.1 and 4.5%,respectively in 2002. APM (IMSA´s flat rolled division) hascarried out an investment program to increase productioncapacity at his Cold Tandem Mill to 1 million tonnes per year.
• Higher consumption fueled imports as well. During 2002, CRimports surged 35.2% annually to 620,967 tonnes. Only in lastDecember, imports rose 34.1% vs December 2001. Close to70% of the steel used in Mexican produced cars (but not in lightor heavy trucks) is estimated to be imported (CR, HDG, andothers). Total auto production (cars, light, and heavy trucks) inMexico (domestic and export oriented) will fall around 2.6% in2003 until new production lines come into stream (from 2004onwards) but CR demand will maintain in 2003 driven mainly bythe heavy appliances sector which will growth by 4.7% in 2003.
Cold rolled sheet production is attractive inMexico. In 2002, Mexican CR consumption andimports rose 10.7 and 35.2% y-o-y, respectively.
13
183
211
168 169
140
188
120130140150160170180190200210220
Jan Mar May July Sep Nov Jan Mar May July Sep Nov
Consumption
Production
2001 2002Dec
Oct
NAFTA Steel / Feb 2003

Mexican Galvanized Sheet
• Mexican integrated mills are focusing on high value steelproducts. Galvak (Hylsamex) will invest US$40 million in theexpansion of all its production lines within the next 2 years.Currently, Hylsamex has a galvanized sheet producing facility inMonterrey (appliances and auto bodies oriented) with an annualcapacity of 420,000 tonnes.
• Galvanized sheet consumption is high in Mexico, specially inconstruction, heavy appliances and auto industry. Domesticproduction does not meet domestic consumption so importsaccount for more than 600,000 tonnes per year. The intendedboost in domestic production aims to substitute some of theseimports. In 2002, Mexican HDG imports only rose 0.8% annuallyto 614,535 tonnes while production accumulated an annualincrease of 9.5%, representing 1,179,964 tonnes. Consumptionaccounted for 1,432,706 tonnes.
• Mexican HDG imports did not decrease because domestic millswere also focusing on the export market as export volumes endup 2002 with a 40% annual increase.
Production and Consumption(monthly data in thousands of metric tons.)
Imports and Exports(monthly data in thousands of metric tons.)
SOURCE: HARBOR Intelligence with CANACERO data.
124
82
131
114
8581
60708090
100110120130140
Jan Mar May July Sep Nov Jan Mar May July Sep Nov
6455
25
69
22
1020304050607080
Jan Mar May July Sep Nov Jan Mar May July Sep Nov
Consumption
Production
Exports
Imports
2001 2002
2001 2002
Galvanized production continues to grow asMexican mills are focusing production on highvalue steel products and import substitution.
14
101
Dec
Dec
NAFTA Steel / Feb 2003
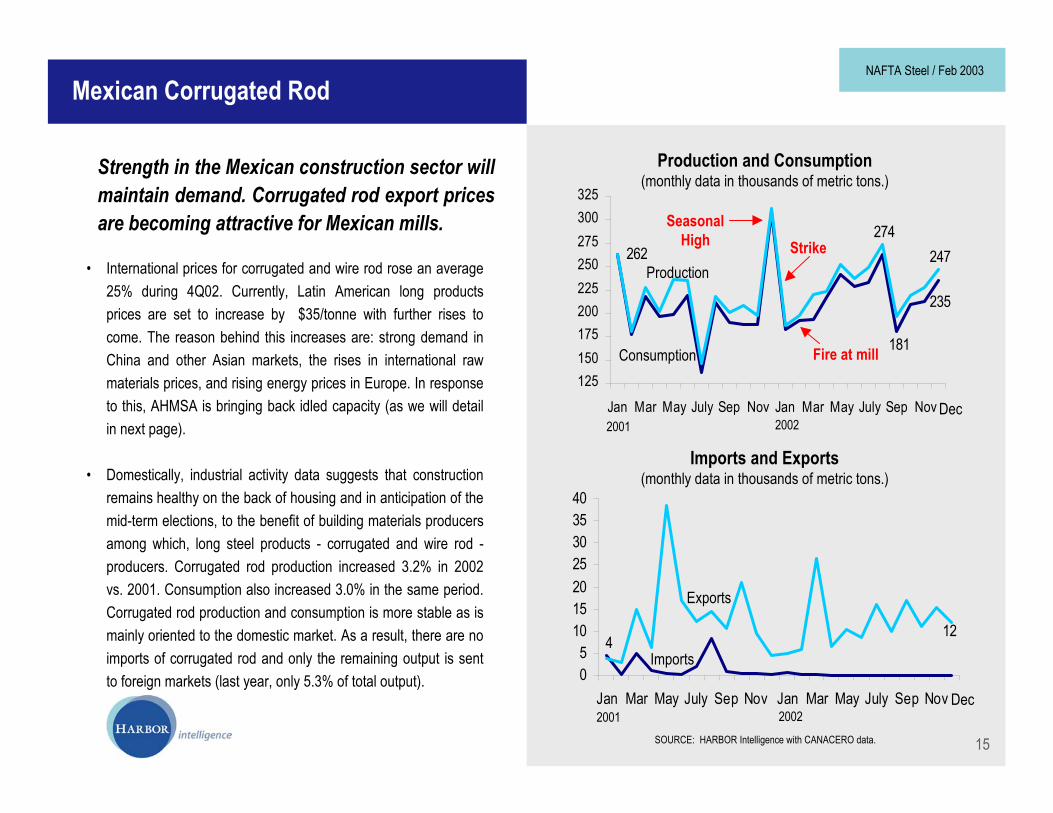
• International prices for corrugated and wire rod rose an average25% during 4Q02. Currently, Latin American long productsprices are set to increase by $35/tonne with further rises tocome. The reason behind this increases are: strong demand inChina and other Asian markets, the rises in international rawmaterials prices, and rising energy prices in Europe. In responseto this, AHMSA is bringing back idled capacity (as we will detailin next page).
• Domestically, industrial activity data suggests that constructionremains healthy on the back of housing and in anticipation of themid-term elections, to the benefit of building materials producersamong which, long steel products - corrugated and wire rod -producers. Corrugated rod production increased 3.2% in 2002vs. 2001. Consumption also increased 3.0% in the same period.Corrugated rod production and consumption is more stable as ismainly oriented to the domestic market. As a result, there are noimports of corrugated rod and only the remaining output is sentto foreign markets (last year, only 5.3% of total output).
Mexican Corrugated Rod
Production and Consumption(monthly data in thousands of metric tons.)
Imports and Exports(monthly data in thousands of metric tons.)
SOURCE: HARBOR Intelligence with CANACERO data.
124
05
10152025303540
Jan Mar May July Sep Nov Jan Mar May July Sep Nov
Exports
Imports
Strength in the Mexican construction sector willmaintain demand. Corrugated rod export pricesare becoming attractive for Mexican mills.
2001 2002
235
181
247274
262
125150175200225250275300325
Jan Mar May July Sep Nov Jan Mar May July Sep Nov
Consumption
Production
2001 2002
SeasonalHigh Strike
Fire at mill
15
Dec
Dec
NAFTA Steel / Feb 2003

167
151
167
181
162146
100110120130140150160170180190
Jan Mar May July Sep Nov Jan Mar May July Sep Nov
• AHMSA has a combined (corrugated + wire rod) productioncapacity of 280,000 tonnes per year at its main mill, and has anadditional 100,000 tonnes of capacity at a second mill. The mill isset to start in March this year. To “feed” this restart AHMSA isplanning to reopen its current furnace “Alto Horno 3”.
• Domestically, just as corrugated rod, wire rod consumption ishighly related to the construction sector which has beensupported by government spending focused on mid-termelections during 2002 and 2003.
• Wire rod production and consumption grew 12.1 and 15.5%,respectively in the 2002 period compared to 2001. Exportsaccumulated a 39.1% fall during 2002 so Mexican producers arefocusing on the domestic market as demand and prices areimproving in the Mexican long products market. Since October2002, Sicartsa, Hylsa and DeAcero (only producers of wire rod inMexico) have a 20.11% import tariff on their wire rod productsshipped into the U.S. As a result, Mexican wire rod exports to theU.S. dropped in January by an annual 33%.
9
36
5
22
15
05
10152025303540
Jan Mar May July Sep Nov Jan Mar May July Sep Nov
Imports and Exports(monthly data in thousands of metric tons.)
Mexican Wire Rod
Exports
Imports
Production and Consumption(monthly data in thousands of metric tons.)
SOURCE: HARBOR Intelligence with CANACERO data.
Mexican wire rod industry is operating at fullcapacity. AHMSA is about to join Sicartsa,Hylsamex and Deacero.
2001 2002
2001 2002
Consumption
Production Strike
Fire
16
Dec
Dec
NAFTA Steel / Feb 2003

308
440
231
330
396
275
374
237200250300350400450500
Jan'9
6M
ay Sep
Jan'9
7M
ay Sep
Jan'9
8M
ay Sep
Jan'9
9M
ay Sep
Jan'0
0M
ay Sep
Jan'0
1M
ay Sep
Jan'0
2M
ay Sep
Jan'0
3
U.S. Coiled Plate and Hot Rolled Sheet
Hot Rolled Steel Sheet (Midwest Monthly Transaction Price, $/metric ton.)
Coiled Steel Plate (Midwest Monthly Transaction Price, $/metric ton.)
374
517
429 363
264 286330
200250300350400450500550600
Jan'9
6M
ay Sep
Jan'9
7M
ay Sep
Jan'9
8M
ay Sep
Jan'9
9M
ay Sep
Jan'0
0M
ay Sep
Jan'0
1M
ay Sep
Jan'0
2M
ay Sep
Jan'0
3
SOURCE: HARBOR Intelligence with Cahners data.
SOURCE: HARBOR Intelligence with Cahners data.
In average, coiled plate increased toUS$341/tonne in February, while HR sheet fellto US$308/tonne in the same period.
• Steel buyers still believe there is plenty of HR supply in the U.S.steel market even when demand is high in Asia. Perhaps themixed signals sent by economic indicators are the main factorsbehind the HR sheet fall. We believe that price increasesannounced by U.S. flat producers will take place until 2Q03despite customers reluctance.
• Prices have behaved as we expected, with a weak start in 2003due to economic reasons mainly and weak demand. Weestimate that HR sheet prices will end up at an averagetransaction price of $314/tonne during 1Q03 and coiled plateprice will average at $337/tonne during the same period.
17
Feb
NAFTA Steel / Feb 2003
Feb
341

440
577.5
330374
484
396
550
300350400450500550600
Jan'9
6M
ay Sep
Jan'9
7M
ay Sep
Jan'9
8M
ay Sep
Jan'9
9M
ay Sep
Jan'0
0M
ay Sep
Jan'0
1M
ay Sep
Jan'0
2M
ay Sep
Jan'0
3
U.S. Cold Rolled and Galvanized Sheet
HD Galvanized Steel Sheet(Midwest Monthly Transaction Price, $/metric ton.)
Cold Rolled Steel Sheet(Midwest Monthly Transaction Price, $/metric ton.)
484
588.5
352385
484
451
660
300350400450500550600650700750
Jan'9
6M
ay Sep
Jan'9
7M
ay Sep
Jan'9
8M
ay Sep
Jan'9
9M
ay Sep
Jan'0
0M
ay Sep
Jan'0
1M
ay Sep
Jan'0
2M
ay Sep
Jan'0
3
SOURCE: HARBOR Intelligence with Cahners data.
SOURCE: HARBOR Intelligence with Cahners data.
CR sheet prices fell in February whileproducers look for price increase. HDG fell aswell after monthly increase in January.
• Chinese consumers of plate, cold rolled and galvanized sheetare continuing to build inventories in anticipation of a slump indomestic output, pushing prices to new highs in the process.According to sources there is not enough CR available in Chinaas material is sitting in ports and stocks are not yet too high. Allthese is diverting material from the U.S. market as tonnage issent to better priced regions and since prices in the U.S. marketremain weak.
• We forecast CR and HDG prices to be around an average ofUS$444/tonne and US$497/tonne, respectively for the firstquarter of 2003. Nevertheless, it is likely that CR and HDG pricescould weaken further by 3 and 4% during March. Feb
18
NAFTA Steel / Feb 2003
Feb

319
352
308 302.5
341
330
286
401.5
250275300325350375400425
Jan'9
6M
ay Sep
Jan'9
7M
ay Sep
Jan'9
8M
ay Sep
Jan'9
9M
ay Sep
Jan'0
0M
ay Sep
Jan'0
1M
ay Sep
Jan'0
2M
ay Sep
Jan'0
3
U.S. Reinforcing Bar and Wire Rod
Low Carbon Wire Rod(Midwest Monthly Transaction Price, $/metric ton.)
Concrete Reinforcing Bar(#6, Midwest Monthly Transaction Price, $/metric ton.)
270260
306
350325
290275
225250275300325350375
Jan'9
6M
ay Sep
Jan'9
7M
ay Sep
Jan'9
8M
ay Sep
Jan'9
9M
ay Sep
Jan'0
0M
ay Sep
Jan'0
1M
ay Sep
Jan'0
2M
ay Sep
Jan'0
3
No
Data
Available Feb
SOURCE: HARBOR Intelligence with Cahners data.
SOURCE: HARBOR Intelligence with Cahners data.
Wire rod producers plan to raise prices inrespond to high scrap costs. U.S. rebar outlookwill depend on construction spending.
• Total construction put in place during December 2002 wasestimated at a seasonally adjusted annual rate of $692.7 billionof constant (1996) dollars, 0.7% above the revised Decemberestimate of $687.7 billion. Breaking down total construction, wesee that the biggest increases are on public construction(specially military facilities, housing and redevelopment, andhospital segments). Public construction spending has not beenenough to increase rebar consumption. Private consumptionremains -1.2% in December 2002 vs. December 2001.
• Rising scrap costs have unleashed a series of price moves bywire rod producers. Georgetown kicked off on January 22 withthe announcement of a two-phase increase that included a$15/ton increase effective March 3 and a $10/ton increaseeffective May 1. Nucor´s Nebraska mill would boost prices by$15/ton effective March 1 and another $15/ton effective withApril 1 shipments. Ivaco Rollings Mills announced theintroduction of a scrap surcharge that goes into effect April 1 tohelp it recoup margins lost to scrap hikes.
19
NAFTA Steel / Feb 2003
Feb
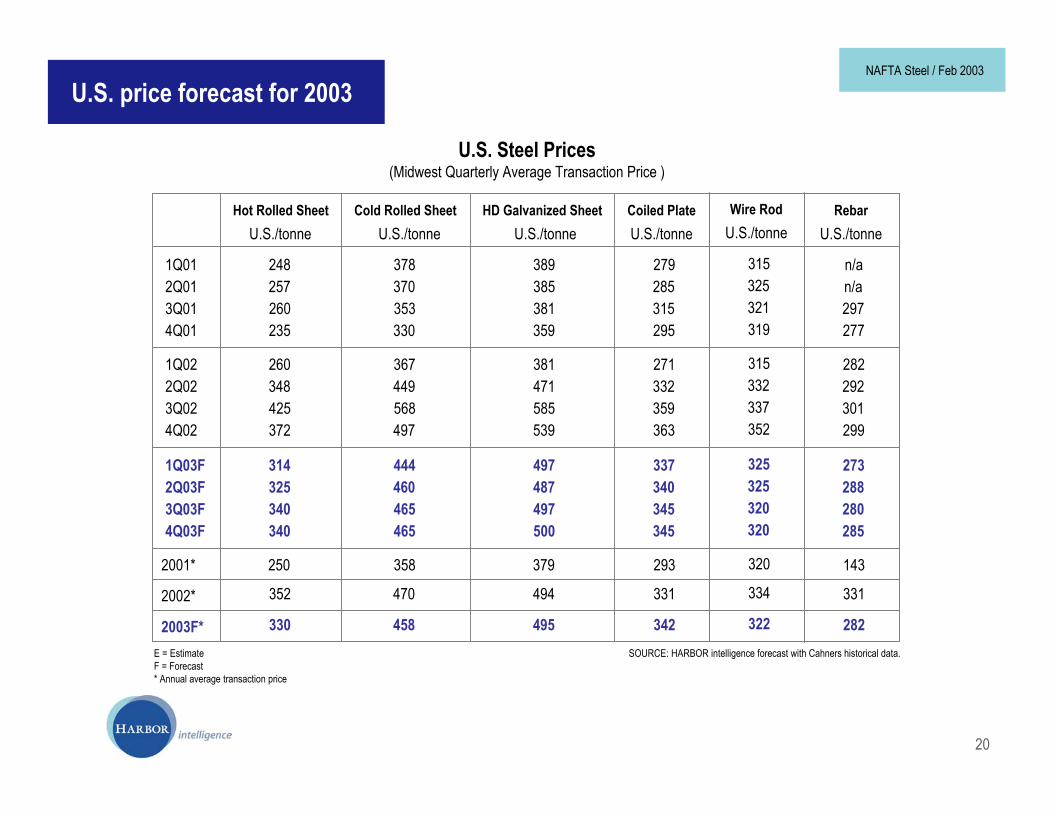
U.S. price forecast for 2003
SOURCE: HARBOR intelligence forecast with Cahners historical data.E = EstimateF = Forecast* Annual average transaction price
U.S. Steel Prices(Midwest Quarterly Average Transaction Price )
20
NAFTA Steel / Feb 2003
370
1Q022Q023Q02
U.S./tonne U.S./tonne U.S./tonne U.S./tonneHot Rolled Sheet Cold Rolled Sheet HD Galvanized Sheet Coiled Plate
260 367 381 271348 449 471 332425 568 585 359
4Q02 372 497 539 363
1Q03F 314 444 497 3372Q03F 325 460 487 3403Q03F 340 465 497 3454Q03F 340 465 500 345
2001* 250 358 379 293
2002* 352 470 494 331
1Q012Q013Q01
248 378 389 279257 385 285260 353 381 315
4Q01 235 330 359 295
2003F* 330 458 495 342
U.S./tonneWire Rod
315332337352
325325320320
320
334
315325321319
322
U.S./tonneRebar
282292301299
273288280285
143
331
n/an/a297277
282

[email protected] Losoles Nivel A-23 Ave. Lázaro Cárdenas 2400 Pte.San Pedro, Garza García N.L. MÉXICO 66267Tel. +52 81 8363 8360 y 61Fax +52 81 8363 8369