Embed Size (px)
Citation preview

1 Principal Bridge Engineer, Structural Engineering Team Leader, Office of Bridges and
Structures, Federal Highway Administration, 1200 New Jersey Avenue S.E., Washington, DC
20590
2 Structural Steel Research Program Manager, Turner Fairbank Highway Research, Federal
Highway Administration, McLean VA
ORTHOTROPIC STEEL DECK BRIDGES IN THE U.S.
Brian M. Kozy1 and Justin Ocel
2
Abstract
This paper summarizes some of the recent developments in the U.S. on the subject of
orthotropic steel deck (OSD) bridges. The Federal Highway Administration published a manual
to provide up-to-date technical guidance on the proper design, construction and maintenance of
OSDs for bridges and the AASHTO bridge design specifications have been greatly revised and
expanded. The rib-to-deck weld continues to be an area of difficulty in OSD construction; due to
competing desire for fabrication economy and fatigue longevity in the detail. Preliminary results
from FHWA research on this detail are presented.
Background
Many of the world’s notable major bridge structures utilize the orthotropic steel plate
system as one of the basic structural building blocks for distribution of traffic loads in decks and
for the stiffening of slender plate elements in compression. Examples include the new San
Francisco Oakland Bay Bridge, Self-Anchored Suspension Span in California and the proposed
Strait of Messina Bridge in Italy. Stiffened steel plates have been used for many years in a wide
range of steel construction applications. They are particularly prevalent in the ship building
industry and for hydraulic applications such as tanks, gates, and locks. The first orthotropic steel
deck (OSD) bridge was developed by German engineers in the 1930's and the first such deck was
constructed in 1936. In the United States, a similar system was built and often referred to as a
“battle deck” because it was considered to be as strong as a battleship. In recent years in the
United States, there has been focused interest in bridge design concepts that are modular,
prefabricated, and rapidly constructible. To provide updated guidance and encourage the use of
OSDs, the U.S. Federal Highway Administration (FHWA) published the Manual for Design,
Construction, and Maintenance of Orthotropic Steel Deck Bridges (Connor, et al. 2012).
An OSD typically consists of a steel deck plate with welded stiffeners or ribs parallel to
each other in the longitudinal direction. Transverse cross beams are typically used to support the
ribs and provide stiffness in the transverse direction. The transverse cross beams typically serve
as floor beams transferring the deck loads to the main structure. These floor beams are often
integrated with the deck structure where the top flanges of the floor beams are often the deck
plate itself. The stiffening ribs can be open shapes such as plates, inverted T-sections, angles,
and channels or closed box-type ribs with different geometric shapes; trapezoidal closed ribs are

the most common. Figure 1 gives an illustration of a typical trapezoidal closed-rib OSD panel.
The first orthotropic steel deck with closed ribs was constructed in Germany in 1954. Compared
to open stiffeners, the closed ribs have many advantages. First, closed ribs can transfer the
traffic load much more efficiently in the transverse direction. As a result, closed ribs can have
wider spacing than open ribs. This results in fewer ribs that results in lighter weight, and less
welding compared to open rib systems. Second, closed ribs can provide much higher flexural
and torsional rigidity in the longitudinal direction allowing longer spans between transverse
elements. In other words, fewer cross-beams are required, which further reduces the deck self-
weight and the number of welds associated with the cross-beams. Lastly, since single-sided
welds are used to attach the closed ribs to the deck versus double-sided welds for open ribs, the
number of rib-to-deck welds is reduced by half. However, the one-sided welds required for
closed-ribs can cause quality control and inspection issues which can be costly.
Figure 1. Typical closed-rib OSD panel
To overcome the challenges of one-sided welding and prevent premature fatigue failure,
more careful consideration is needed to design rib-to-deck welds, and ongoing research is being
done. Many of the earlier vintage orthotropic decks with closed ribs experienced fatigue
cracking problems. There was a lack of knowledge about fatigue and a lack of guidance in the
structural design codes. The complex stress state present at the rib-to-deck welds makes fatigue
design even more difficult. The quest for lighter self-weight led to relatively thin deck plates in
the structural design. However, many of the designs with thinner deck plates were vulnerable to
high local stress effects from wheel loads. The contribution of the wheel-load effect was not
fully considered in early deck designs and many bridges experienced fatigue cracking problems.
Compared to main structural members, orthotropic steel decks tend to have a higher incidence of
fatigue problems because of the local effects of wheel loads. Wheel loads cause large local
stress variations, stress reversals, and an increased number of stress cycles that must be

considered in fatigue design.
Design Methodology According to AASHTO LRFD
The applicable limit states for the design of OSDs include Strength, Service, and Fatigue,
according the AASHTO LRFD Bridge Design Specifications (AASHTO 2014), here forth
referred to as just “AASHTO”. All limit states need to be considered for complete design, but
generally it is the Fatigue limit state that will control the majority of design details.
Strength
Strength design must consider the following demands: rib flexure and shear, floorbeam
flexure and shear, and axial compression. The rib, including the effective portion of deck plate,
must be evaluated for flexural and shear strength for its span between the floorbeams. The
floorbeam, including the effective portion of the deck plate, must be evaluated for flexural and
shear strength for its span between primary girders or webs. The reduction in floorbeam cross-
section due to rib cutouts must be considered by checking flexure and shear where the portion of
web is removed. When the panel is part of a primary girder flange, the panel must be evaluated
for in-plane compressive strength based on stability considerations.
Testing has shown that OSD panels can have tremendous reserve strength for lateral
loading beyond yield point due to membrane stiffening. This reserve, however, is dependent
upon the boundary support conditions. For simplicity, the approach to strength design should
conservatively limit stresses to the specified minimum yield strength or critical buckling stress.
Service
The Service limit state must be satisfied by limiting overall deflection for the deck plate
to be less than the span length divided by 300, rib deflection less than their span length divided
by 1000, and relative deflection between adjacent ribs less than 2.5mm (0.10 in.). These
deflection limits are intended to prevent premature deterioration of the wearing surface.
Another applicable service limit state is the Service II limit state for the design of bolted
connections against slip in the overload scenario. This should be considered for the design of
bolted rib and floorbeam splices.
Fatigue
AASHTO introduces two fatigue limit states: Fatigue I for infinite-life design and Fatigue
II for finite-life design. Due to fact that OSDs are governed by wheel loads (in particular the rib-
to-deck connection), they experience multiple cycles of stress from every truck passage and thus
will most often be designed for infinite life. However, finite life design may produce more cost-
effective proportions when the traffic volume is not excessively high.
Design Load
For OSDs, it must be recognized that the AASHTO LRFD-specified 145 kN (32 kip)
truck axle in the HL-93 load model actually represents a tandem consisting of two 71 kN (16

kip) axles spaced at 1220mm (4ft.). Thus, each wheel of the 71 kN (16 kip) axle is properly
modeled in more detail as two closely spaced 45 kN (8 kip) wheels, 1220mm (4ft.) apart to
accurately reflect an actual Class 9 tractor-trailer with tandem rear axles (see Figure 2). The
single axle simplification is acceptable for main members not directly subjected to axle loads,
such as girders, floorbeams, truss members, etc. However, research has shown that for elements
directly loaded by wheels, such as expansion joints, the OSD plate, etc, this assumption is
inappropriate.
Figure 2 – Refined Fatigue Design Truck Footprint (all dimensions in mm)
Load Factors
For AASHTO fatigue design of OSD components and connections, the fatigue load
factors are taken as 1.50 for Fatigue I and 0.75 for Fatigue II. There is an exception to this where
it is increased to 2.25 for Fatigue I when checking connections to the deck plate and details
around the floorbeam cut-out. The increased Fatigue I load factor is based on stress range
spectra monitoring on both the Williamsburg Bridge and the Bronx Whitestone Bridge, which
indicate that the standard Fatigue I load factor, which was developed for girders, floorbeams,
truss members and other “global” components is unconservative for the design of certain OSD
components. These studies indicate that the ratio of maximum stress range to effective stress
range is approximately 3.0, which is larger compared to standard bridge girders. This is likely
due to a number of factors such as occasional heavy wheels and reduced local load distribution
that occurs in deck elements, as opposed to a main girder.
Cycles per Truck
The frequency of loading is critical for finite life design in OSDs. The Average Daily
Truck Traffic (ADTT) and cycles per truck passage (n) both influence the total number of cycles
for design. For components and connections of the OSD subjected to direct wheel loads, the
number of cycles for design is governed by the number of axles expected to cross the bridge.
Conversely, it is the number of truck crossings that equate to fatigue cycles for the main load-
carrying members. For the refined tandem-axle truck, this results in five cycles per truck
passage. However, it has been found that other components such as the rib and floorbeam
typically experience only one primary stress cycle per truck passage. Thus, for design of all
welded connections to the deck plate use n = 5.0 and for all others use n = 1.0.

Design Level
There are three acceptable Levels of analysis for design verification of OSDs that have
been identified and are contained in the AASHTO specifications.
Level 1 Design
Level 1 Design is based on little or no structural analysis, but is done by selection of
details that are verified to have adequate resistance by experimental testing (new or previous).
When appropriate laboratory tests have been conducted for previous projects or on specimens
similar in design and details to those proposed for a new project, the previous tests may be used
as the basis for the design on the new project. All details must provide a level of safety
consistent with the AASHTO LRFD specifications. Previously verified Level 1 designs may be
used as the basis for design on new projects without additional testing, subject to approval by the
Owner.
It is emphasized that the testing protocol must envelope the structural design loads and
stresses for the new application. Test loading should be equivalent to the maximum truck load,
and stress ranges at details should accurately simulate expected in service demands and should
have accurate boundary conditions. For finite fatigue life design, the resistance shall provide
97.5 percent confidence of survival. For infinite fatigue life design, the constant amplitude
fatigue limit (CAFL) should be exceeded no more than one in 10,000 cycles (0.01 percent).
Full-scale test should include a minimum of 2 rib-spans with 3 floorbeams.
Level 2 Design
Level 2 design is based on simplified 1-D or 2-D analysis of certain panel details where
such analysis is sufficiently accurate or for certain details that are similar to previous tested
details as described in Level 1. Calculations consider only nominal stresses and not local stress
concentrations. This is primarily intended to allow incremental improvement of previously
tested details as verified by Level 1.
Details that are not subjected to local distortional mechanisms similar to those previously
proven by appropriate laboratory testing or those that have been proven effective by Level 3
designs and long-term observation while subjected to the appropriate loads may be verified
considering only nominal stresses with simplified analysis. Strength, Service, and
Constructability limit states generally only require a Level 2 design.
Level 3 Design
Level 3 design is based on refined 3-D analysis of the panel to quantify the local stresses
to the most accurate extent reasonably expected from a qualified design engineer. Level 3
designs will be dictated by the requirements to provide safety against fatigue failure. If no test
data are available for a panel, Level 3 design is required unless it can be proven that the local
distortional mechanisms (floorbeam distortion and rib distortion) will not lead to fatigue
cracking. Level 3 is required for all bridge redecking applications unless the redecking
procedure can be demonstrated as meeting the requirements of a Level 1 design and if approved
by the owner.
Level 3 design is an extension of current AASHTO methodology for fatigue evaluation

by nominal stresses. The proposed Level 3 design method is also a similar methodology applied
by the American Petroleum Institute and American Welding Society and is well documented by
the International Institute of Welding. It is used extensively for the fatigue evaluation of tubular
structures and plate-type structures with complex geometries by various industries, where there
is no clearly defined nominal stress due to complicated geometric effects. These are conditions
very similar to orthotropic deck details. This approach recognizes that fatigue damage is caused
by stress raisers that exist at details and attempts to quantify them by refined analysis rather than
classification into general categories.
For fatigue design by such refined analysis, research has shown that the structural
modeling techniques shall include:
Use of shell or solid elements with acceptable formulation to accommodate steep stress
gradients
Mesh density of t x t, where t is the thickness of the plate component
Local Structural Stresses shall be determined
FHWA’s Rib to Deck Weld Research
Beginning in 2011, FHWA executed a multi-year program of research on the fatigue
performance of OSD rib to deck welds. Fatigue design of the rib-to-deck weld is more
complicated compared to the AASHTO fatigue design procedures for typical bridge members
such as girders and crossframes. The AASHTO methodology relies on calculating a far-field
(nominal) stress range that ignores any local stress concentration effects close to welded details.
The stress ranges are caused by the overall truck loading event on the bridge. This contrasts with
the rib-to-deck weld where local wheel load effects combine with the global truck event loads to
create a complicated stress state. Because the closed rib-to-deck weld is typically a one-sided
partial penetration weld, a crack-like condition remains at the root, which may initiate fatigue.
Additionally, the weld toe is subjected to localized bending from the wheel load effects and
cannot be reliably predicted with a far-field stress approach. Therefore, alternative approaches
need to be established to analyze the fatigue resistance of the rib-to-deck weld. This section
provides a brief overview of several alternative approaches that are currently available, with an
emphasis on those chosen for study in this research.
Fatigue resistance is typically characterized into S-N curves where fatigue test data is
plotted based on the stress range (S) and the number of cycles to failure (N) on a logarithmic
scale. In logarithmic space, the fatigue data can be characterized by a straight line relationship
for metallic materials. If the live load stress range is known at the detail, this relatively simple
straight line relationship can be used to predict the number of cycles needed to cause fatigue
failure. In fatigue assessment, the stress range values are calculated and used to predict the
fatigue life, while in fatigue design the required number of service load cycles is used to
determine the allowable stress range. The S-N curve is determined experimentally by
performing logarithmic linear regression on test data developed at different stress ranges.
Different welded details will have different S-N curves; therefore the curves need to be
developed individually for each detail type. When fatigue resistance of a new type of structural
detail needs to be evaluated, new fatigue tests need to be conducted to establish the S-N curve.
Alternative approaches have been developed where a locally calculated stress range is compared
to a master S-N curve for the fatigue resistance of all weldments. This was investigated as part
of this research, and will be referred to as the hot-spot stress approach.
To perform hot-spot S-N curve analysis, both the stress range local to the weld toe and
the number of cycles to failure need to be obtained. The local weld toe stress range can be
calculated using finite element modeling (FEM) of the welded structure. Because the local stress
predicted by FEM is dependent on the element type and mesh density, the linear surface
extrapolation (LSE) method is used. While this still requires special considerations for element
type and mesh density, the results have essentially been normalized to one type of mesh size.
Welds can be included or excluded in the modeling methodology.
The following section describes the experimental study and results from it. More details
are forthcoming as the final report is still in review and is expected for publication in early 2015.
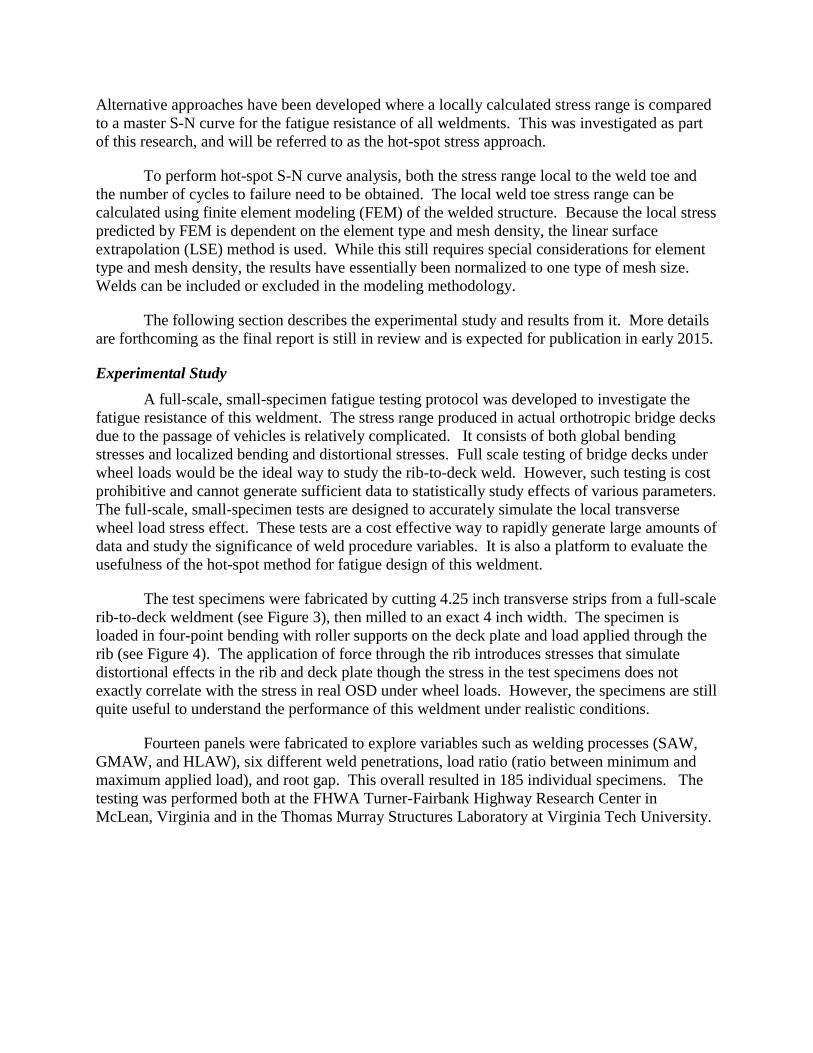
Experimental Study
A full-scale, small-specimen fatigue testing protocol was developed to investigate the
fatigue resistance of this weldment. The stress range produced in actual orthotropic bridge decks
due to the passage of vehicles is relatively complicated. It consists of both global bending
stresses and localized bending and distortional stresses. Full scale testing of bridge decks under
wheel loads would be the ideal way to study the rib-to-deck weld. However, such testing is cost
prohibitive and cannot generate sufficient data to statistically study effects of various parameters.
The full-scale, small-specimen tests are designed to accurately simulate the local transverse
wheel load stress effect. These tests are a cost effective way to rapidly generate large amounts of
data and study the significance of weld procedure variables. It is also a platform to evaluate the
usefulness of the hot-spot method for fatigue design of this weldment.
The test specimens were fabricated by cutting 4.25 inch transverse strips from a full-scale
rib-to-deck weldment (see Figure 3), then milled to an exact 4 inch width. The specimen is
loaded in four-point bending with roller supports on the deck plate and load applied through the
rib (see Figure 4). The application of force through the rib introduces stresses that simulate
distortional effects in the rib and deck plate though the stress in the test specimens does not
exactly correlate with the stress in real OSD under wheel loads. However, the specimens are still
quite useful to understand the performance of this weldment under realistic conditions.
Fourteen panels were fabricated to explore variables such as welding processes (SAW,
GMAW, and HLAW), six different weld penetrations, load ratio (ratio between minimum and
maximum applied load), and root gap. This overall resulted in 185 individual specimens. The
testing was performed both at the FHWA Turner-Fairbank Highway Research Center in
McLean, Virginia and in the Thomas Murray Structures Laboratory at Virginia Tech University.

Figure 3 Example of full weldment, and cutting into smaller specimens.
34" THK PL (4)
4" dia. roller (4)
Bearing Take-up
Unit (8)
5"x5"x12 " HSS
1x12 threaded rod (8)
Actuator piston
Load cell
1" THK PL washers (2)
5" TFHRC
3 34" VT
24.00Spherical washer
Figure 4. Test Setup.
Results
From the fatigue tests three failure modes were observed: fatigue cracks at the weld toe
into the deck plate (WT@DECK), at the weld toe into the rib wall (WT@RIB) and from the
weld root through the weld (WR). Testing performed at TFHRC mainly had WT@DECK

failures, and the testing at VT obtained more WT@RIB and WR failure modes. Two reasons
explain this difference, 1) TFHRC did not test specimens with intentional root gaps, which
would increase the propensity of WR failures, and 2) the bearing plates used in VT were
narrower (3.75 inches) than the ones used in TFHRC (5 inches), causing more rib distortional
bending that slightly elevated the stress at the rib weld toe (see 04).
Solid element models of the specimens were used to calculate the local hot-spot stress at
the weld toes for each specimen. If failure occurred at the weld toe, the hot-spot stress range was
used to plot the data. For failures that originated at the weld root, there is no definition for the
hot-spot stress range, and nominal stress range was used to report the data. The S-N data for
many of the specimens is shown in 05. The data set have been combined based on the failure
location (WR, WT@RIB, and WT@DECK) and the load ratio (R= -1 or 0). A load ratio of -1
implies complete load reversal, and zero is pure tension cycling. Also shown in this graph are
the lower bound (mean minus two standard deviations) for each data set, and the AASHTO B,
B’, and C curves.
Prior to testing, all specimens had their welds etched and photographed. The digital
photos were measured in a CAD program to determine the hypothesized critical dimension of
each weld. These dimensions are identified in 0 and are defined as follows:
d1 – leg size on deck plate
d2 – penetration
d2/d4 – percent weld penetration
d3 – length of the gap behind the weld
d1+d2 – total length along deck plate
h – leg size on rib
t – minimum throat size
Aw – total area of weld nugget
Once the weld dimensions were obtained, multiple linear regression was performed to
determine the effect they had on the fatigue resistance. The result of this is shown in 07 as a
Venn diagram where the circle entitled “Response” represents the fatigue strength. The other
circles represent the weld dimensions that had a statistical significance on the fatigue strength,
where circles with larger overlap are more influential on the fatigue strength. The three circles
that overlap the most are the two leg dimension, and area of weld. The area of weld is
proportional to the leg dimensions, so the finding was the rib-to-deck weld is primarily
influenced by the size of the weld, not so much its penetration.

Figure 5. Lower bound S-N curves for all specimens.
Figure 6. Measured dimensions of welds.
Number of Cycles1e+5 1e+6 1e+7 1e+8
Str
ess
Ran
ge
(ksi
)
10
100
R=-1 WR
R=-1 WT@DECK
R=-1 WT@RIB
R=0
R=-1 WR
R=-1 WT@DECK
R=-1 WT@RIB
R=0
AASHTO C Curve
AASHTO B' Curve
AASHTO B Curve

Response
d1 Aw
Weld Penetration
t
h
Figure 7. Interactions among weld dimensions on predicting the response (fatigue life).
Conclusions and Recommendations
1) The hot-spot fatigue analysis method was shown to provide good predictions of
fatigue cracking initiating at the weld toes. For a lower bound, the fatigue life can be accurately
predicted by comparing the hot-spot stress to AASHTO Category C.
2) The distance the weld toe extends beyond the plates was determined to have a
significant effect on fatigue life. Viewed from the weld surface, this corresponds to the leg size
of a fillet weld. Many of the welds tested had unequal legs. The fatigue resistance of the long
leg weld toe increased while there was a corresponding decrease at the short leg weld toe. For a
given weld area, altering the leg lengths had little overall effect since increased fatigue resistance
at one weld toe was offset by decreased fatigue resistance at the other. In general, welds with
relatively equal leg lengths are preferred. It was found that the leg size should be greater than
0.7 times the rib wall thickness to achieve AASHTO Category C fatigue resistance.
3) The weld area or weld size has a significant effect on fatigue resistance with larger
welds providing better performance.
4) Weld penetration was found to have little effect on fatigue resistance as long as the
root gap is closed after welding. In this case, fatigue cracks will occur at either of the two weld
toes. The current requirements for 80% minimum penetration can be substantially relaxed if the
root gap opening is controlled through proper fit-up and tacking of the plates prior to welding.
5) The openness of the root gap after welding is the significant parameter affecting
fatigue cracking from the weld root. The root gap openness has little effect of fatigue cracks that
initiate at the weld toes. The test results indicate that if the weld root gap is closed after welding
than root cracking will not occur. There is a substantial benefit to designing the joint and
controlling fit-up so that the root gap will close due to weld shrinkage.
6) The current 80% penetration requirement also appears to be an effective means of
preventing root cracking since the crack size is limited. Linear elastic fracture mechanics
predicts that a smaller root crack size will reduce the stress intensity at the root crack tip.
Reducing weld penetration without designing the weld for a closed root crack is not
recommended since it will increase the probability of root cracking.
7) Holding a maximum gap tolerance of 0.020 in. during tack welding will result in a
closed root gap after finish welding. Weld shrinkage is sufficient to close a 0.020 in gap as the
weld solidifies and cools.
8) For specification requirements, it is recommended that the current 80% minimum
penetration requirement can be reduced to 70% provided that the fit-up gap is less than or equal
to 0.020 in. following tack welding. The data suggests that further penetration reductions may be
possible under some conditions.
9) The recommended fatigue design philosophy for the rib-to-deck wild is to calculate the
fatigue resistance at the weld toes using the hot-spot method based on FEA. FEA can capture the
cumulative effect of stress from both local and global effects and can directly capture the effects
of plate distortion. Root cracking should be prevented by controlling the weld geometry and fit-
up tolerances of the joint.
References
AASHTO. (2014). AASHTO LRFD Bridge Design Specifications (7th ed.). American
Association of State Highway and Transportation Officials. Washington, DC.
Connor, R., Fisher, J., Gatti, W., Gopalaratnam, V., Kozy, B., Leshko, B., McQuaid, D.
L., Medlock, R. Mertz, D., Murphy, T., Paterson, D., Sorensen, O., and Yadlosky, J. (2012).
Manual for design, construction, and maintenance of orthotropic steel deck bridges. Publication
FHWA-IF-12-027. Washington, D.C.: Federal Highway Administration, US Department of
Transportation.


