Embed Size (px)
Citation preview

msci.com 1
US Spotlight: Future MobilityA change of pace and direction?
msci.com
THEMATIC INSIGHT

2 msci.com msci.com 3
Future Mobility Trends Accelerate
Electrifying the States
New Administration, New Supply, New Attitudes?
Biden Administration Appears Supportive
New Supply
New Attitudes?
EVs and the Need for Infrastructure Investment
Bipartisan US Infrastructure Plan Exceeds USD 1 Trillion
The Charging Station Gap
Beyond Electrification
A Series of Equity Events
SPAC Bonanza Turns Sour for Some
New Categories Emerging for Public Listing
Conclusions
04
04
06
06
08
12
14
14
16
17
19
19
20
21
Contents

msci.com 5 4 msci.com
Future Mobility
1 Neckermann, Lukas. 2020. “Future Mobility: Understanding a New Transport Ecosystem.” MSCI Thematic Insight and “Post-Pandemic Reflections: Future Mobility COVID-19’s Potential Impact on the New Mobility Ecosystem.” MSCI, 2020.
2 A SPAC or a special purpose acquisition company is a listed shell corporate structure that pools funds in readiness for an M&A opportunity within a specified time frame (often two years). This allows a private company that is acquired to come to market outside the traditional IPO route. See https://www.investor.gov/introduction-investing/investing-basics/glossary/spacs.
3 Jarratt, Emma. 2021. “Zero-Emission Vehicle Market Share in Canada Rose to 3.5 Per Cent in 2020, According to StatsCan’s Official Release.”
4 IHS Markit. 2021. “Electric Vehicle Share in the US Reaches Record Levels in 2020, According to IHS Markit.”
5 European Automobile Manufacturers’ Association (ACEA). 2021. “Fuel Types of New Passenger Cars in the EU.”
In an earlier Thematic Insight, we highlighted the acceleration of certain trends related to the Future Mobility theme that appeared to be occurring as the world first responded to the COVID-19 pandemic.1 Over one year on, those trends seem to have become both more established and more visible, as a wave of well-capitalized businesses in this space have become public companies via traditional initial public offerings (IPOs), direct listings and special purpose acquisition companies (SPACs).2
Future Mobility Trends Accelerate
Exhibit 1: Electric Vehicle Sales in Canada, the US and the EU (1000s)
Source: Neckermann Strategic Advisors analysis, Statistics Canada update (April 22, 2021)
Electrifying the States
In 2020, the share of electric vehicles sold was below 2% in the U.S., below 4% in Canada and almost negligible in Mexico. By comparison, in Europe more than 10% of new cars sold had a plug (5.4% battery-electric, 5.1% plug-in hybrid) and 11.9% more were hybrids (Exhibit 1).3,4,5 Demand for electric vehicles (EVs) across North America is hindered by at least three factors: lack of cohesive government support, the lack of attractive EV supply to bring car buyers to (online) showrooms and infrastructure. As we will see, each of these hindrances is changing.
0
500
1000
1500
2000
2500
3000
2014 2015 2016 2017 2018 2019 2020 2025e 2030e
Canada USA EU

6 msci.com msci.com 7
6 Howard, Phoebe Wall. 2021. “President Biden's F-150 Lightning Moment in Dearborn: How It Really Happened.” Detroit Free Press, May 19, 2021.
7 Shepardson, David. 2021. “Biden Vows to Replace U.S. Government Fleet with Electric Vehicles.” Reuters, Jan. 25, 2021.
8 Nilsen, Ella. 2021. “Biden Announces New Emissions Standards, Target That 50% of Vehicles Sold in US by 2030 Are Electric.” CNN, Aug. 5, 2021.
9 "Gigafactories: Europe´s major commitment to economic recovery through the development of battery factories." CIC energiGUNE
10 Moores, Simon. 2021. “The Global Battery Arms Race: Lithium-Ion Battery Gigafactories and Their Supply Chain.” Oxford Institute for Energy Studies.
11 Blackmon, David. 2021. “Rising U.S. Lithium Industry: A Potential Quandary For Environmental Activists.” Forbes, March 16, 2021.
12 Scheyder, Ernest. 2021. “GM Shakes Up Lithium Industry With California Geothermal Project.” Reuters, July 2, 2021.
Future Mobility
New Administration, New Supply, New Attitudes?Although the U.S. clearly lags China and Europe in vehicle electrification, a new alignment of factors has powered an acceleration of this and other facets of the Future Mobility ecosystem across North America. Among them, changing consumer attitudes, an increase in supply and a change in the U.S. administration.
Biden Administration Appears Supportive
The new U.S. president may be known as “Amtrak Joe” for his affection for trains and other public transport, but he is also a self-described “car guy” and has made it clear that the electrification of vehicles, driven by U.S. companies, is a goal of his administration. This change for American manufacturers toward an “age of electrification” was perhaps crystallized in May 2021. Donning his trademark sunglasses (Exhibit 2), President Biden
comprising thousands of cells. China has over 90 “gigafactories” for lithium-ion cell production and captures more than 70% of the total global production, while Europe has over 25 gigafactories built or planned.9 Yet even by 2030, when global production is forecast to have grown sixfold from 2020, North America’s share of lithium-ion battery production is only expected to rise from 9.2% to 11.9%, while Europe’s is projected to triple from 5.4% to 16.7%.10
The U.S. is largely dependent on South America, Australia and China for the necessary lithium, cobalt, graphite and manganese. China unearths some 10% of critical lithium, but processes over two-thirds of the global demand.11 Nevertheless, some OEMs are taking steps to secure a more national supply chain. GM has made a multimillion-dollar investment in a Californian geothermal brine project that will “supply a sizable amount of our lithium needs,” according to Tim Grewe, GM's director of electrification strategy.12
Exhibit 2: President Biden road-tests a fully electric vehicle, May 2021
Source: https://www.voanews.com/usa/biden-test-drives-new-truck-promote-electric-vehicles
surprised journalists by taking a fully electric, prototype Ford F-150 “Lightning” pickup truck onto a test track, accelerating from 0-60 mph in under five seconds and saying, “This sucker’s quick.”6 During the factory tour, the president was said to have expressed particular interest in the supply-chain implications of increased U.S. vehicle electrification. He has envisioned 1 million new jobs within the “American auto industry, domestic auto supply chains and auto infrastructure, from parts to materials to electric vehicle charging stations.”7 More recently, the Biden administration announced a 2030 target via executive order of 50% of new vehicle sales being battery-electric, fuel-cell electric or plug-in hybrid.8
The implications for supply-chain policy are indeed broad. The key component — the single-largest value-driver for electric vehicles — is the lithium-ion battery,

msci.com 9
13 Benchmark Mineral Intelligence. 2021. “President Biden Issues Rallying Call for More EV Battery Gigafactories.”
14 GoodCarBadCar.Net “Tesla Sales Figures – US Market.”
15 Neckermann Strategic Advisors analysis of: Argonne National Laboratory. 2021. “2018 to 2019: Light Duty Electric Drive Vehicles Monthly Sales Updates.” and BuyAutoInsurance.com. 2021. “10 Most Popular Electric Vehicles: 3-Year Trend.” and Kane, Mark. 2021. “Audi E-Tron Sales Improved in U.S. In 2020.” InsideEVs, January 2021, and GoodCarBadCar.net “Tesla Model 3 Sales Figures.” and “2021 US Vehicle Sales Figures By Model.” and Ravi, Anjan. 2021. “Last Units of VW E-Golf Reach USA Customers in 2021.” ElectricVehicleWeb.in, April 19, 2021.
8 msci.com
Future Mobility
Exhibit 3: North American Gigafactories – Present and Planned Source: CIC energiGUNE
Exhibit 4: Top 10 Best-Selling EV Models in the US from 2018 to 2021E15
Source: Neckermann Strategic Advisors analysis, Argonne National Laboratory, Goodcarbadcar.net, InsideEVs, BuyAutoInsurance.com, ElectricVehicleWeb.in
Once mined and processed, the lithium forms part of the pack that is assembled in battery production gigafactories. Of these, there are currently only 12, with only a modest number in development, in the U.S. by LG Chem, Tesla, A123 and others (Exhibit 3).13
Solid Power LG Chem
QuantumScape
SK InnovationMicrovast
Saft
Sila
Lion Electric
Solid Energy
General Motors and LG Chem
iM3NY
WindsorEssexAkasol
A123 Systems
Tesla
New SupplyTesla was the dominant manufacturer of fully electric vehicles in the U.S. market from 2018 to June 2021 (see Exhibit 4). Over this period, it sold over 800,000 of its Models S, 3, X and Y.14 Most auto manufacturers focused on transitional models (plug-in hybrid or hybrid vehicles) while many anticipated new manufacturers have yet to launch. 2021 (est.)202020192018
0
50000
100000
150000
200000
250000
TeslaModel Y
TeslaModel 3
ChevyBolt
TeslaModel X
Audie-tron
TeslaModel S
NissanLeaf
VW e-Golf
msci.com 11
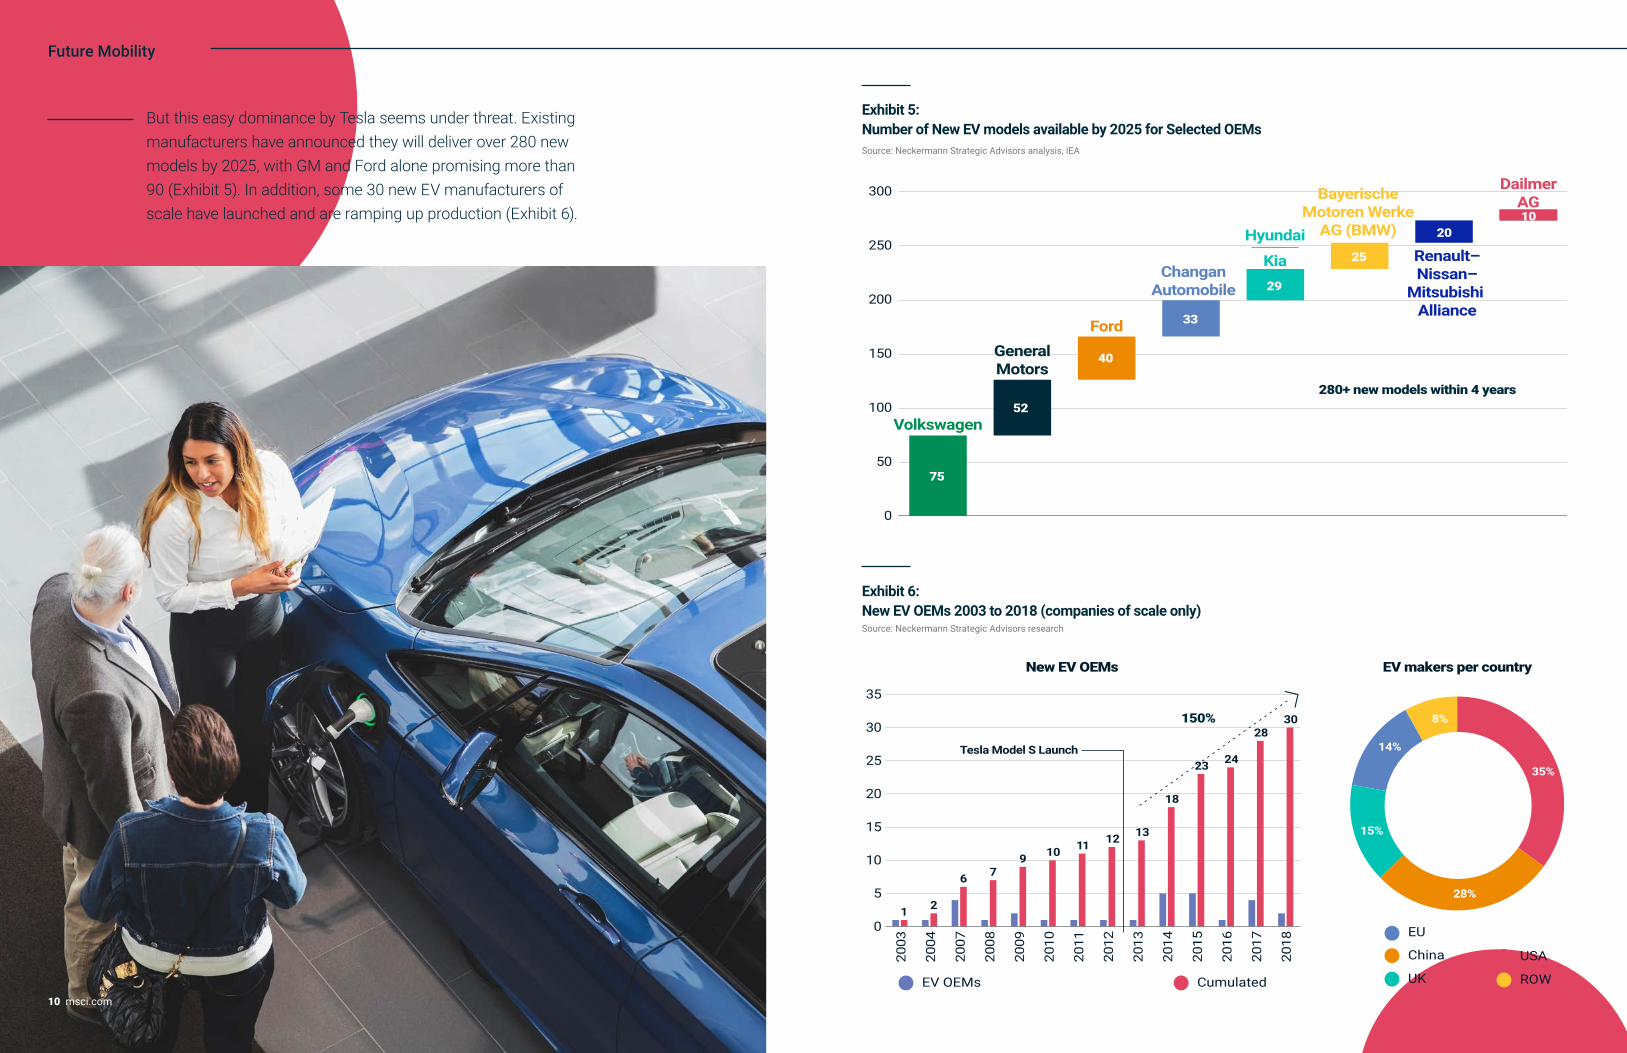
But this easy dominance by Tesla seems under threat. Existing manufacturers have announced they will deliver over 280 new models by 2025, with GM and Ford alone promising more than 90 (Exhibit 5). In addition, some 30 new EV manufacturers of scale have launched and are ramping up production (Exhibit 6).
Future Mobility
Exhibit 5: Number of New EV models available by 2025 for Selected OEMs Source: Neckermann Strategic Advisors analysis, IEA
Exhibit 6: New EV OEMs 2003 to 2018 (companies of scale only) Source: Neckermann Strategic Advisors research
0
50
100
150
200
250
300
75
52
40
33
29
25
2010
280+ new models within 4 years
DailmerAG
Renault–Nissan–
Mitsubishi Alliance
BayerischeMotoren Werke
AG (BMW)Hyundai
ChanganAutomobile
Kia
FordGeneralMotors
Volkswagen
New EV OEMs EV makers per country
0
5
10
15
20
25
30
35
1 2
6 79 10 11 12 13
18
23 24
2830150%
2003
2004
2007
2008
2009
2010
2011
2012
2013
2014
2015
2016
2017
2018
Cumulated
China
EU
UK
USA
ROWEV OEMs
14%
28%
15%
35%
8%
Tesla Model S Launch
10 msci.com

12 msci.com msci.com 13
New Attitudes?
The Ford F-150 pickup truck has been the best-selling vehicle in the U.S. for four decades.16 That makes its electrification a significant step toward greater EV acceptance in North America. The sharp rise in new models arriving at dealers is expected to be met with the potential of more than 40% of Americans in 2020 intending to purchase an EV in the future, according to McKinsey: 10 times the number who said they (actually) “plan to buy an EV for their next vehicle.” (Exhibit 7).
Overall, the US public sentiment about a gradual phase-out of internal-combustion-engine (ICE) vehicles is also surprisingly positive: Fully 57%
16 Edmunds.com “Most Popular Cars in America”
17 2016 and 2019: n=7,103. 2020: “The Road Ahead for E-Mobility.” McKinsey Center for Future Mobility.
18 U.S. Federal Highway Administration. 2021. “State Motor-Vehicle Registrations – 2017.” and Statistics Canada. 2020. “Vehicle Registrations, by Type of Vehicle.”
19 Jato Dynamics
Future Mobility
Exhibit 7: EV Purchase Intentions in the US (2016, 2019, 2020)17 Source: McKinsey
of millennials and almost half of all adults of all ages support such a ban, according to a Pew Research Center poll of more than 13,000 people (Exhibit 8). Moreover, states representing over 40% of the U.S. population have announced plans to ban the sale of ICE vehicles by 2025, 2030 or 2035 (Exhibit 9).
The scale of the potential transformation toward electric vehicles should not be underestimated. Over 91% of households in the U.S. have access to a car and there are close to 110 million commercial and private vehicles registered in the country. Canada adds a further 35 million, and Mexico, an additional 50 million vehicles.18
Together, this is the second-largest automobile market in the world, after China.19 Given the large vehicle mix bias (SUVs and pickups), shifting the North American automobile market to EVs seems to represent a significant potential opportunity for mining, battery production, vehicle design and production within the Future Mobility value chain.
Exhibit 8: Younger generation more willing to ban phase-out of internal-combustion-engineSource: Pew Research Center, n= 13,749 / April 2021
Exhibit 9: US States That Have Declared “End of New Sales” Dates for ICE Vehicles, 2021Source: Neckermann Strategic Advisors research
1% 2%4%
0
10
20
30
40
50
60
70
2016 2019 2020
%71% of Americans have an interest in buying
an EV as the next or a future vehicle
57% of future car buyers are willing to consider buying an EV in the future
40% of (all) Americans said they will buy a car in the future and will consider
buying an EV (in the future)
4% of Americans definitely plan to buy an EV for their next vehicle
US adults:47%
US Millennials:57%
35%
In favor of ICEphase out
20352025 Pushing for 20352030 2040
Population
∼20% ∼20%
Quebec

14 msci.com msci.com 15
Bipartisan US Infrastructure Plan Exceeds USD 1 Trillion
The bipartisan U.S. Infrastructure Investment and Jobs Act put forth by the Biden administration has been touted as the largest instance of government spending in the history of the country. It has become clear that a significant part of the investment could benefit the Future Mobility value chain (Exhibit 10).20
The plan addresses some critical risks in U.S. infrastructure (for example, a report by the American Road & Transportation Builders Association estimated that over 45,000 bridges are “structurally deficient”) but it is aimed more broadly at transforming the use and types of U.S. vehicles by:21, 22
» increasing the availability and use of public transportation
» promoting electric vehicles by providing consumer incentives
» deploying more than 500,000 electric-vehicle charging stations and
» transitioning the government fleet
The federal government directly operates a fleet of 645,000 vehicles across the military and its civilian workforce, and the stated intention is to electrify this entire fleet. The largest number of EVs currently belong to the U.S. Postal Service (Exhibit 11).23 This intention alone already represents a significant investment shift from internal-combustion engines toward electric vehicles, and from the oil industry toward electricity generation, preferably through renewable energy sources.
EVs and the Need for Infrastructure Investment
20 U.S. Senate. 2021. “Invest in America Act.”
21 American Road & Transportation Builders Association. 2021. “Bridge Report.”
22 The White House. 2021. “Fact Sheet: President Biden Announces Support for the Bipartisan Infrastructure Framework.”
23 Shepardson, David. 2021. “Biden Vows to Replace U.S. Government Fleet with Electric Vehicles.” Reuters, Jan. 25, 2021.
24 U.S. General Services Administration. FY 2020. “Federal Fleet Report.”
Future Mobility
Exhibit 10: The US Infrastructure Plan and the Future Mobility Ecosystem
Exhibit 11: US Government Vehicle Fleets in Scope for Electrification24
Source: U.S. General Services Administration
Air Force
Army
Postal Service
0 50 100 150 200 250
HomelandSecurity
Justice
Navy
Agriculture
Interior
Veteran Affairs
Energy
225.5
22.1
14.8
37
32.4
38
47.3
53.4
61.1
50.3
$1,200 bn: Infrastructure plan
$15 bn:EV plan
$109 bn:Repairs
$66 bn:Rail
$80 bn: Amtrak Other $50 bn:
Semicond $25 bn:Airport
$11 bn:Safety
$25 bn: Projects
$100 bn: Consumer rebates $10 bn:Tax credit Other$15 bn: 500k
charging points $45 bn: Electric public
service buses
Other plans$312 bn:
Transportation plan

16 msci.com msci.com 17
While electrification has been a key focus, other elements of the Future Mobility value chain also have started to evolve in the U.S. Mobility operators have shown important overlaps with the last-mile logistics sector. For example, while revenue from Uber’s mobility operations (ride-sharing) dropped by almost half in 2020, its delivery and freight businesses grew strongly. Its “Uber Eats” food delivery bookings grew 130% in the year to a USD 44 billion annual run rate as office workers, people working from home and those self-isolating due to COVID had their meals delivered.29
The December 2020 IPO of food-delivery firm DoorDash was received positively in the market (stock price up 85% in first-day trading, leading to a market capitalization of USD 60 billion).30 However, the company’s current lack of profitability suggests eventual consolidation, potentially with other closely related mobility companies, could be a plausible scenario.31
Meal and grocery delivery is just one example of a widening scope for Future Mobility. Uber added rental cars to its platform through partnerships with Avis, Budget, Hertz and others. In doing so, it is following the lead of Grab, GoJek and the other “superapps” described in our previous Thematic Insight on Asia.32
29 Uber. 2021. “Uber Announces Results for Fourth Quarter and Full Year 2020.”
30 DoorDash, Inc. (DASH) Stock Price History.
31 Bursztynsky, Jessica. “DoorDash Skyrockets in Market Debut, Closes Up 85%.” CNBC, Dec. 9, 2020.
32 Silva, Christianna. “Uber Will Now Deliver a Rental Car to Your Door — and Pick It Up When You're Done.” Mashable, April 28, 2021. and Neckermann, Lukas. 2020. “Asia Spotlight: Future Mobility: Are the Global Trend Leaders Already in Place?” MSCI Thematic Insight.
Future Mobility
The Charging Station Gap
According to a J.D. Power study, over 80% of American EV owners charge their car either at home (overnight) or at their workplace.25 However, the need for so-called destination or en route charging facilities beyond home or work becomes imposing once we recognize the great distances that Americans often travel outside commuting hours and the country’s relative lack of public transportation.
According to a January 2021 California Energy Commission (CEC) estimate, the state of California alone would require over 700,000 charging stations to manage the increase in zero-emission vehicles anticipated through 2030.26 Hence, the infrastructure bill’s 500,000 new charging stations across the U.S. would seem insufficient for tens of millions of new electric vehicles. As a result, private investment appears to be needed as well. A potential indication of how this might play out occurred when Volkswagen was required by the California and U.S. governments to make a USD 2 billion investment in “Electrify America” — a zero-emissions charging network.27 As of April 2021, some 600 stations, with 2,600 charging units, have been built as part of this effort.28
Beyond Electrification
25 Voelcker, John. 2021. “JD Power Study: Electric Vehicle Owners Prefer Dedicated Home Charging Stations.” Forbes, Feb. 5, 2021.
26 California Energy Commission. 2020. “JD Power Study: Electric Vehicle Owners Prefer Dedicated Home Charging Stations.”
27 U.S. Environmental Protection Agency. “Volkswagen Clean Air Act Civil Settlement.”
28 Electrify America. “Find Charging Fast.” and Ramey, Jay. 2021. “Electrify America Hits the 600-Station Mark.” Autoweek, April 30, 2021.

18 msci.com msci.com 19
Public transportation — a preferred mode of travel in few U.S. cities — posted an overall ridership drop of 79% in 2020. Ridership is not projected to fully recover even through the end of 2023, so public transit agencies will face a projected shortfall of over USD 39 billion, according to the American Public Transport Association.33 Much of the missing ridership may be absorbed by private vehicles, ride-sharing, car-sharing and micro-mobility (bicycles and scooters). Bicycle sales were up 65% from 2019 to 2020, while electric bike sales grew by 145% in the same period.34 Some 28 companies in micro-mobility raised over USD 1 billion in total private funding, just in 2020 alone. Many of these are e-scooter companies, (Exhibit 13) and some have shared plans to go public in 2022.35
In our first Thematic Insight on Future Mobility, we mapped out the new ecosystem and remarked how many companies and sub-categories were at that time not directly available to public investors or funds. However, the last two years have brought a wave of IPOs and mergers with SPACs that has both changed the landscape for investors and exposed some companies to heightened scrutiny.
SPAC Bonanza Turns Sour for Some
An early example of using the SPAC process to access public investors was Nikola Motors, a manufacturer of hydrogen-powered long-range trucks. It merged with VectoIQ Acquisition Corp. in March 2020 and began trading on the Nasdaq Stock Market as NKLA on June 4, 2020. During the initial trading period, investors lacked the usual IPO disclosures. Although early market reception to this “pre-revenue” company was positive (the share price doubled in a week), concerns grew about the corporate investment and the time needed to launch its product. One short-seller research firm even catalogued an extensive list of alleged inaccurate corporate statements and dubbed the company “an intricate fraud built on dozens of lies.”36 (Nikola’s share price fell 10% that day.) Numerous partners backed out of agreements, the SEC probed the company, the founder and CEO/
A Series of Equity Events
Exhibit 12: The Changing Revenue Mix at Uber Through the COVID Pandemic
Future Mobility
Source: Uber, Neckermann Strategic Advisors analysis
33 EBP US Inc. 2021. “The Impact of the COVID-19 Pandemic on Public Transit Funding Needs in the U.S.”
34 World Economic Forum. 2021. “Electric Bike Sales Grew by 145% in the US Last Year - Here’s Why That Matters.”
35 Glasner, Joanna. 2020. “For Lime And E-Scooters, 2020 Has Been Tough But Not A Disaster.” Crunchbase News, Dec. 18, 2020.
36 Hindenburg Research. 2020. “Nikola: How to Parlay an Ocean of Lies Into a Partnership With the Largest Auto OEM in America.”
37 Wikipedia on “Nikola Corporation.”
38 Wilhelm, Alex. “Dogs of Lordstown.” Techcrunch, May 25, 2021.
39 Flanagan, Cristin and Ludlow, Edward. 2021. “Former SPAC Darling Fisker Nosedives After Goldman Says Sell.” Bloomberg, April 22, 2021.
40 PitchBook. 2021. “EV/Mobility SPAC Handbook.”
41 PitchBook. 2021. “SPACs in Mobility: A Detailed Look Under the Hood.”
42 Ibid.
chairman was forced to resign (he has since been indicted for fraud) and the share price remains 85% below a peak that pushed its market cap above that of Ford Motor Co.37
Nikola unsurprisingly has become something of a cautionary tale for potential investors in Future Mobility SPAC-based listings. However, even though Nikola, Lordstown38 and Fisker39 have struggled as public companies, the trend toward listing remains intact. In 2020, 26 mobility and automotive tech companies merged with SPACs and went public, for a combined valuation over USD 100 billion.40 A further 325 SPACs are listed in the U.S., and many are linked to other elements of the Future Mobility value chain.41 The trend in the valuation of pre-IPO Future Mobility companies has been striking: Late-stage startups now have a median valuation well over USD 450 million, more than triple the figure in 2019.42
$-
$500
$1,000
$1,500
$2,000
$2,500
$3,000
Q4 2020
Mobility Delivery Freight
$2,377
$239 $127
$2,467
$527
$199
$853
$1,741
$301
Q1 2019 Q1 2020 Q1 2021

msci.com 21 20 msci.com
Future Mobility
The ecosystem we previously mapped for Future Mobility remains comprehensive and relevant. However, this new deep dive for North America illustrates the important influence of state and federal regulation and incentives in reshaping and accelerating lagging activity in the region. The landscape for Future Mobility also has been shaken up by new capital markets activity (which has changed the balance between public and private equity in the sector) and emerging changes in consumer preferences.
Conclusions
Exhibit 14: Mobility Companies That Plan to List Publicly45 as of April 2021
Exhibit 13: E-scooter in public
Source: Neckermann Strategic Advisors research image, www.spacresearch.com, PitchBook
New Categories Emerging for Public Listing
Along the Future Mobility value chain, technology, manufacturing and systems and data companies have broadly dominated the recent first wave of SPAC listings. Of these, an autonomous-tech company like Luminar is typical (it aims to reduce the cost of LiDar43 to under USD 1,000 per unit from USD 75,000+ now as EV adoption accelerates).44
Upcoming SPACs in the Future Mobility theme are projected to include more companies from the customer-facing aspect of the mobility value chain such as mobility operators and aggregators. Of these, micro-mobility companies such as Helbiz, Voi, Tier and Bird all have announced their intentions to go public, as has Asian superapp and mobility aggregator Grab.
lidar…
Service & Data
Commercial
More SPACs to come
Car sharing, micromobility…
Market place,
Mobility Aggregators
Fleet ManagementTechnology
Mobility Operators
VehicleManufacturers
Systems & Data
PassengerBattery, sensor, Charging
QuantumScapeSilaInsight Lidar FreyrRomeo PowerEnevateAEyeMicrovastOusterVelodyne LidarInnoviz Technologies
Faraday FutureRimac AutomobiliLucid Karma
CanooProterraBlade - Urban Air MobilityRivianLordstownRivianHylsionXLFleetArrivalAurora
EVgoEVBOXCharge PointNuvve
MetromileWheels UpOtonomo Technologies
GetaroundLime BirdTier Turo
Grab
MSCI would like to thank Lukas Neckermann, Managing Director of Neckermann Strategic Advisors, for useful discussions and insightful analysis of this megatrend which have greatly facilitated the preparation of this document.
Lukas Neckermann is the author of three books: “The Mobility Revolution” (2015), “Corporate Mobility Breakthrough 2020” (2017) and “Smart Cities, Smart Mobility: Transforming the Way We Live and Work" (2018).

22 msci.com
MSCI is a leading provider of critical decision support tools and services for the global investment community. With over 50 years of expertise in research, data and technology, we power better investment decisions by enabling clients to understand and analyze key drivers of risk and return and confidently build more effective portfolios. We create industry-leading research-enhanced solutions that clients use to gain insight into and improve transparency across the investment process.
To learn more, please visit www.msci.com
About MSCI
Contact us
The information contained herein (the “Information”) may not be reproduced or disseminated in whole or in part without prior written permission from MSCI. The Information may not be used to verify or correct other data, to create indexes, risk models, or analytics, or in connection with issuing, offering, sponsoring, managing or marketing any securities, portfolios, financial products or other investment vehicles. Historical data and analysis should not be taken as an indication or guarantee of any future performance, analysis, forecast or prediction. None of the Information or MSCI index or other product or service constitutes an offer to buy or sell, or a promotion or recommendation of, any security, financial instrument or product or trading strategy. Further, none of the Information or any MSCI index is intended to constitute investment advice or a recommendation to make (or refrain from making) any kind of investment decision and may not be relied on as such. The Information is provided “as is” and the user of the Information assumes the entire risk of any use it may make or permit to be made of the Information. NONE OF MSCI INC. OR ANY OF ITS SUBSIDIARIES OR ITS OR THEIR DIRECT OR INDIRECT SUPPLIERS OR ANY THIRD PARTY INVOLVED IN THE MAKING OR COMPILING OF THE INFORMATION (EACH, AN “MSCI PARTY”) MAKES ANY WARRANTIES OR REPRESENTATIONS AND, TO THE MAXIMUM EXTENT PERMITTED BY LAW, EACH MSCI PARTY HEREBY EXPRESSLY DISCLAIMS ALL IMPLIED WARRANTIES, INCLUDING WARRANTIES OF MERCHANTABILITY AND FITNESS FOR A PARTICULAR PURPOSE. WITHOUT LIMITING ANY OF THE FOREGOING AND TO THE MAXIMUM EXTENT PERMITTED BY LAW, IN NO EVENT SHALL ANY OF THE MSCI PARTIES HAVE ANY LIABILITY REGARDING ANY OF THE INFORMATION FOR ANY DIRECT, INDIRECT, SPECIAL, PUNITIVE, CONSEQUENTIAL (INCLUDING LOST PROFITS) OR ANY OTHER DAMAGES EVEN IF NOTIFIED OF THE POSSIBILITY OF SUCH DAMAGES. The foregoing shall not exclude or limit any liability that may not by applicable law be excluded or limited.
The process for submitting a formal index complaint can be found on the index regulation page of MSCI’s website at: https://www.msci.com/index-regulation.
©2021 MSCI Inc. All rights reserved | CBR0921
1 888 588 4567 * + 1 404 551 3212 + 1 617 532 0920 + 1 312 675 0545 + 52 81 1253 4020 + 1 212 804 3901 + 1 415 836 8800 + 55 11 3706 1360 + 1 416 628 1007
AMERICAS Americas Atlanta Boston Chicago Monterrey New York San Francisco São Paulo Toronto
EUROPE, MIDDLE EAST & AFRICA Cape Town Frankfurt Geneva London Milan Paris
10800 852 1032 * 10800 152 1032 * + 852 2844 9333 + 91 22 6784 9160 00798 8521 3392 * 800 852 3749 * + 61 2 9033 9333 008 0112 7513 * 0018 0015 6207 7181 * + 81 3 5290 1555
ASIA PACIFIC China North China South Hong Kong Mumbai Seoul Singapore Sydney Taipei Thailand Tokyo
+ 27 21 673 0100+ 49 69 133 859 00 + 41 22 817 9777 + 44 20 7618 2222 + 39 02 5849 0415 0800 91 59 17 *
* = toll free