Embed Size (px)
Citation preview

July 2001 37
Line Lines in tablesincl
1 Exports of goods a2 Goods, balance 3 Services (4) .....4 Income receipts
5 Imports of goods a6 Goods, balance 7 Services (21) ...8 Income paymen
9 Unilateral current t
10 Capital account tra
11 U.S.-owned assets(–)) (40) ...........
12 U.S. official rese13 U.S. Governmen
assets, net (414 U.S. private ass
15 Foreign-owned assfinancial inflow (
16 Foreign official a17 Other foreign as
18 Statistical discrepareversed) (70) .
Memoranda:19 Balance on current20 Net financial flows
p Preliminary.
U.S. International Transactions, First Quarter 2001
By Douglas B. Weinberg
The international transactions accounts have been revised toreflect the incorporation of methodological and statisticalimprovements and newly available source data. For more infor-mation, see “U.S. International Transactions, Revised Estimatesfor 1989–2000” in this issue.
HE U.S. current-account deficit—the combin-ed balances on trade in goods and services,
income, and net unilateral current transfers—de-creased to $109.6 billion in the first quarter of2001 from $116.3 billion (revised) in the fourthquarter of 2000 (table A, chart 1).1 The decrease,the first in the current-account deficit since thesecond quarter of 1997, was more than accountedfor by a decrease in the deficit on goods, as importsdecreased more than exports, and by a decline innet outflows for unilateral current transfers. Thesurplus on services decreased, as payments in-
1. Quarterly estimates of U.S. current- and financial-account components areseasonally adjusted when series demonstrate statistically significant patterns.The accompanying tables present both adjusted and unadjusted estimates.
T
Table A.—Summary of U.S. Internation[Millions of dollars, quarters seasonally
1 and 10 in which transactions areuded are indicated in ( ) 1999 2000
1999
I II
Current accountnd services and income receipts (1) ... 1,242,655 1,418,568 296,210 302,880of payments basis (3) ........................... 684,553 772,210 164,716 166,267................................................................. 272,800 293,492 66,601 67,910 (12) ........................................................ 285,302 352,866 64,893 68,703
nd services and income payments (18) –1,518,106 –1,809,099 –351,607 –368,662 –of payments basis (20) ......................... –1,029,987 –1,224,417 –238,709 –250,557 –................................................................. –189,204 –217,024 –45,480 –46,486ts (29) ..................................................... –298,915 –367,658 –67,418 –71,619
ransfers, net (35) ................................... –48,913 –54,136 –11,051 –11,596
Capital accountnsactions, net (39) ................................ –3,491 705 158 167Financial account
abroad, net (increase/financial outflow................................................................. –437,067 –580,952 –43,657 –170,707 –rve assets, net (41) .............................. 8,747 –290 4,068 1,159t assets, other than official reserve6) ........................................................... 2,751 –944 118 –392ets, net (50) ........................................... –448,565 –579,718 –47,843 –171,474 –
ets in the United States, net (increase/+)) (55) ................................................... 813,744 1,024,218 130,758 278,047ssets in the United States, net (56) .... 43,551 37,619 4,164 –736sets in the United States, net (63) ....... 770,193 986,599 126,594 278,783
ncy (sum of above items with sign................................................................. –48,822 696 –20,811 –30,129
account (76) ......................................... –324,364 –444,667 –66,448 –77,378(40 and 55) ........................................... 376,677 443,266 87,101 107,340
creased more than receipts, and the balance on in-come shifted to a deficit from a small surplus.
In the financial account, net recorded financialinflows—net acquisitions by foreign residents ofassets in the United States less net acquisitions byU.S. residents of assets abroad—were $80.6 billionin the first quarter, down from $113.8 billion (re-vised) in the fourth. Financial inflows for foreign-owned assets in the United States decreased morethan financial outflows for U.S.-owned assetsabroad.
The statistical discrepancy—errors and omis-sions in recorded transactions—was a positive$28.8 billion in the first quarter and a positive $2.4billion in the fourth.
al Transactionsadjusted]
2000 2001 Change:2000 IV-2001 IIII IV I II III IV I p
315,099 328,467 339,645 355,075 361,236 362,617 355,905 –6,712173,045 180,525 185,142 191,558 199,273 196,237 194,942 –1,29568,548 69,740 72,114 74,264 73,224 73,894 74,355 46173,506 78,202 82,389 89,253 88,739 92,486 86,608 –5,878
391,401 –406,437 –432,624 –450,748 –463,461 –462,268 –454,010 8,258264,777 –275,944 –292,547 –303,229 –313,884 –314,757 –307,462 7,295–47,951 –49,289 –52,031 –53,377 –55,953 –55,667 –56,850 –1,183–78,673 –81,204 –88,046 –94,142 –93,624 –91,844 –89,698 2,146
–11,761 –14,504 –11,924 –12,461 –13,080 –16,673 –11,457 5,216
173 –3,989 173 173 175 184 174 –10
114,931 –107,769 –198,105 –93,573 –107,727 –181,548 –156,937 24,6111,951 1,569 –554 2,020 –346 –1,410 190 1,600
–686 3,711 –127 –572 114 –359 68 427116,196 –113,049 –197,424 –95,021 –107,495 –179,779 –157,195 22,584
172,119 232,820 256,782 250,007 222,108 295,321 237,503 –57,81812,721 27,402 22,498 6,447 12,247 –3,573 4,091 7,664
159,398 205,418 234,284 243,560 209,861 298,894 233,412 –65,482
30,702 –28,588 46,053 –48,473 749 2,367 28,822 26,455
–88,063 –92,474 –104,903 –108,134 –115,305 –116,324 –109,562 6,76257,188 125,051 58,677 156,434 114,381 113,773 80,566 –33,207

38 ● July 2001
The following are highlights for the first quarterof 2001:
● Imports of goods decreased as a result of theslowdown in U.S. economic activity; exports ofgoods also decreased, but by less than imports.
● The average price of imported petroleumdecreased for the first time in eight quarters.
● Receipts and payments of “other” privateincome both decreased as a result of declines inshort-term interest rates.
● Net foreign purchases of U.S. corporate bondsincreased to a record high, and net foreign pur-chases of U.S. stocks also increased.
● Net financial inflows for foreign direct invest-ment in the United States slowed sharply, largely as
40
20
0
-20
-40
-60
-80
-100
-120
40
20
0
-20
-40
-60
-80
-100
-120
CHART 1
U.S. Current-Account Balance andIts ComponentsBillion $
U.S. Bureau of Economic Analysis
1994 95 96 97 98 99 2000 2001
a result of a drop in foreign acquisitions of U.S.companies.
● U.S. claims reported by U.S. banks increasedvery strongly for the second consecutive quarter.
U.S. dollar in exchange markets
In the first quarter, the U.S. dollar was unchangedon a nominal, trade-weighted quarterly averagebasis against the group of seven major currenciesthat are widely traded in international markets (ta-ble B, chart 2). The U.S. dollar depreciated 6 per-cent against the euro, and it appreciated 8 percentagainst the Japanese yen.
In response to indications that U.S. economicactivity was slowing, U.S. monetary authorities be-gan an easing of monetary policy. The target Fed-eral funds rate was lowered, in a series of three 50-basis-point reductions, to 5.0 percent from 6.5percent (chart 3). (In the second quarter, the targetFederal funds rate was lowered further, in threesteps, to 3.75 percent.) Energy costs remained highbut were viewed as more of a restraint on con-sumer and business purchasing power than as a
CHART 2
Nominal Indexes of Foreign CurrencyPrice of the U.S. DollarJanuary 1999=100
120
110
100
90
80
140
130
120
110
100
90
80
70
Major currencies
Note.–See table B for definitions of the indexes. Monthly average rates.
Data:
Federal
Reserve
Board. Indexes rebased by BEA.
U.S. Bureau of Economic Analysis
Japanese yen
German mark
Euro
1997 1998 1999 2000 2001

July 2001 ● 39
potential contributor to a sustained pickup in U.S.inflation. U.S. stock prices continued to decline,and major indexes fell below important psycholog-ical levels. Yields on U.S. Treasury 10- and 30-yearbonds also decreased.
Economic reports indicated that economic ac-tivity in the euro area was slowing, but remainedmore robust than economic activity in the UnitedStates. Amid indications that inflationary pres-sures in the euro area were stabilizing, prices in fu-tures markets reflected expectations that short-term interest rates would decline in the near fu-ture. (The European Central Bank reduced its rateon refinancing operations by 25 basis points to 4.5percent in May.)
Japanese economic conditions worsened duringthe quarter, partly as a result of falling demand forJapanese exports. Japanese monetary authoritiesattempted to stimulate domestic demand by firstreducing the overnight call rate to 15 basis pointsand then changing its operational target, which ef-fectively lowered the call rate to almost zero. Japa-nese long-term interest rates also decreased,despite a downgrade of the credit rating on Japa-nese Government securities by Standard andPoors.
Against other currencies, the U.S. dollar depre-ciated 1 percent against the British pound and 5percent against the Swiss franc. The U.S. dollar wasunchanged against the Canadian dollar, and it ap-
Table B.—Indexes of
2000 2001
I II III IV I
Nominal: 1
Broad 2 ................................................... 101.5 103.3 104.5 107.3 107.9Major currencies 3 ............................. 103.2 106.1 108.0 111.3 111.0Other important trading partners 4 .... 99.4 99.9 100.3 102.5 104.2
Real: 1
Broad 2 ................................................... 102.0 104.8 106.2 108.6 109.7Major currencies 3 ............................. 104.9 108.3 110.6 114.1 114.6Other important trading partners 4 .... 98.6 100.5 100.8 102.0 103.7
Selected currencies: (nominal) 5
Canada .................................................. 95.6 97.4 97.6 100.4 100.5European currencies:
Euro area 6 ........................................ 117.5 124.2 128.3 133.5 125.7United Kingdom ................................. 102.7 107.6 111.8 114.1 113.2Switzerland ........................................ 117.6 120.9 123.3 126.0 120.0
Japan ..................................................... 94.4 94.2 95.1 97.0 104.3Mexico .................................................... 92.8 94.6 92.3 93.9 95.7Brazil ...................................................... 117.4 119.2 120.1 127.7 133.6
1. For more information on the nominal and real indexes of the foreign exchange value of the UFederal Reserve Bulletin, vol. 84 (October 1998): 811–18.
2. Weighted average of the foreign exchange value of the U.S. dollar against the currencies of of U.S. trading partners, including the currencies of the euro-area countries, Australia, Canada, JaSwitzerland, United Kingdom, Argentina, Brazil, Chile, Colombia, Mexico, Venezuela, China, Hong Konnesia, Korea, Malaysia, the Philippines, Singapore, Taiwan, Thailand, Israel, Saudi Arabia, and RussiaReserve Board. Monthly and quarterly average rates. Index rebased by BEA.
3. Weighted average of the foreign exchange value of the U.S. dollar against broad-index currenciewidely outside the country of issue, including the currencies of euro-area countries, Australia, Canadaden, Switzerland, and the United Kingdom. The weight for each currency is its broad-index weight sum of the broad-index weights for all of the currencies included in the major currency index. Data: FBoard. Monthly and quarterly average rates. Index rebased by BEA.
preciated 2 percent against the Mexican peso and 5percent against the Brazilian real.
Current Account
Goods and services
The deficit on goods and services decreased to$95.0 billion in the first quarter from $100.3 bil-
CHART 3
Official Interest RatesPercent
7
6
5
4
3
2
1
0
-1
Note.–The rates shown are the following: The target level for the federal funds rate in the United States, the bank rate in Canada, the minimum bid rate on main refinancing operations in the euro area, and the target level for the uncollateralized overnight call rate in Japan.Data: Federal Reserve Board and foreign monetary authorities
U.S. Bureau of Economic Analysis
1999 2000 2001
United States
Japan
Canada
Euro area
Foreign Currency Price of the U.S. Dollar[January 1999=100]
2000 2001
Mar. Apr. May June July Aug. Sept. Oct. Nov. Dec. Jan. Feb. Mar.
101.8 102.1 104.4 103.3 103.6 104.3 105.5 107.0 107.9 107.1 106.9 107.5 109.3104.2 104.9 108.1 105.3 106.3 108.0 109.7 111.4 112.3 110.3 109.2 110.5 113.3
98.9 98.9 99.9 100.9 100.4 100.0 100.6 101.9 102.6 103.1 104.2 103.8 104.6
103.0 103.6 105.8 105.0 105.4 106.0 107.1 108.6 109.1 108.1 108.6 109.3 111.2106.3 107.1 110.2 107.7 108.9 110.5 112.4 114.2 115.1 113.0 112.7 114.2 117.0
98.9 99.3 100.4 101.7 101.3 100.4 100.8 101.8 101.9 102.3 103.5 103.4 104.3
96.1 96.7 98.4 97.2 97.3 97.6 97.8 99.5 101.5 100.2 98.9 100.1 102.6
120.2 122.7 128.0 121.9 123.5 128.1 133.3 136.0 135.5 129.0 123.6 125.9 127.6104.4 104.3 109.3 109.3 109.4 110.8 115.1 113.7 115.7 112.8 111.7 113.6 114.2120.1 120.2 124.1 118.5 119.2 123.8 126.9 128.1 128.3 121.6 117.7 120.4 122.093.8 93.2 95.6 93.7 95.5 95.4 94.3 95.7 96.2 99.0 103.0 102.6 107.391.7 92.8 93.9 97.1 93.0 91.5 92.4 94.2 93.9 93.5 96.5 95.9 94.8
115.2 117.0 120.9 119.7 118.9 119.6 121.7 124.4 128.9 129.8 129.4 132.7 138.6
.S. dollar, see
a broad grouppan, Sweden,g, India, Indo-
. Data: Federal
s that circulate, Japan, Swe-divided by theederal Reserve
not circulate widely outside the country of issue, including the currencies of Argentina, Brazil, Chile, Colombia, Mex-ico, Venezuela, China, Hong Kong, India, Indonesia, Korea, Malaysia, the Philippines, Singapore, Taiwan, Thailand,Israel, Saudi Arabia, and Russia. The weight for each currency is its broad-index weight divided by the sum ofthe broad-index weights for all of the currencies included in the other important trading partners index. Data: FederalReserve Board. Monthly and quarterly average rates. Index rebased by BEA.
5. Data: Federal Reserve Board. Monthly and quarterly average rates. Indexes prepared by BEA.6. The euro area includes Austria, Belgium, Finland, France, Germany, Greece, Ireland, Italy, Luxembourg, Nether-
lands, Portugal, and Spain. Exchange rates (but not index values with January 1999=100) for the individual euro-area currencies can be derived from the euro exchange rate by using the fixed conversion rates (in currenciesper euro) as shown below: 13.7603 Austrian schillings; 40.3399 Belgian francs; 5.94573 Finnish markkas; 6.55957French francs; 1.95583 German marks; 340.750 Greek drachmas; .787564 Irish pounds; 1936.27 Italian lira; 40.3399Luxembourg francs; 2.20371 Netherlands guilders; 200.482 Portuguese escudos; 166.386 Spanish pesetas.

40 ● July 2001
T
Exports .............................Agricultural products ....Nonagricultural products
Imports .............................Petroleum and productsNonpetroleum products
Exports .............................Agricultural products ....Nonagricultural products
Imports ..............................Petroleum and productsNonpetroleum products
p Preliminary.1. Because chain indexes u
usually not additive.
lion in the fourth. The decrease was more than ac-counted for by a decrease in the deficit on goods.
Goods.—The deficit on goods decreased $6.0 bil-lion, to $112.5 billion, in the first quarter. Thedecrease, the first since the second quarter of 1997,resulted from a larger decrease in imports than inexports.
Exports.—Exports decreased $1.3 billion, or 1 per-cent, to $194.9 billion in the first quarter.Quantities decreased 1 percent, and prices wereunchanged (table C).2 The value of exportsdecreased for the second consecutive quarter,partly reflecting a slowdown in economic growthin some foreign countries and the cumulativeeffect of the appreciation of the U.S. dollar againstforeign currencies over several recent quarters. Inaddition, the slowdown in U.S. economic activitycurtailed exports of goods that are assembled intofinished products abroad and shipped back to theUnited States for final sale.
In the first quarter, nonagricultural exports de-creased $1.6 billion, or 1 percent, to $181.3 billion;quantities decreased 1 percent, and prices were un-changed. Capital goods except civilian aircraft de-creased for the second consecutive quarter, mostlyas a result of declines in semiconductors and incomputers, parts, and peripherals, mainly to thenewly industrialized countries in Asia. Automotive
2. Quantity (real) estimates are calculated using a chain-type Fisher formulawith annual weights for all years and quarterly weights for all quarters. Real esti-mates are expressed as chained (1996) dollars. Price indexes (1996=100) are alsocalculated using a chain-type Fisher formula.
able C.—U.S. Trade in Goods, Current and Chained (1996) Dollars[Balance of payments basis, millions of dollars, quarte
Current dollars
1999 20002000
I II III IV
............................................... 684,553 772,210 185,142 191,558 199,273 196,2
............................................... 49,661 52,808 12,904 12,977 13,629 13,2............................................. 634,892 719,402 172,238 178,581 185,644 182,9
............................................... 1,029,987 1,224,417 292,547 303,229 313,884 314,7............................................. 67,767 120,185 26,961 29,472 31,982 31,7
.............................................. 962,220 1,104,232 265,586 273,757 281,902 282,9
Percent change from previous period (current dolla
1999 20002000
I II III IV
............................................... 2.1 12.8 2.6 3.5 4.0 –1
............................................... –6.6 6.3 2.3 .6 5.0 –2............................................. 2.9 13.3 2.6 3.7 4.0 –1
............................................... 12.3 18.9 6.0 3.7 3.5............................................. 33.8 77.4 25.9 9.3 8.5 –
.............................................. 11.0 14.8 4.3 3.1 3.0
se weights of more than one period, the corresponding chained-dollar estimates are
products decreased for the second consecutivequarter because of substantial decreases to Canadaand smaller decreases to other areas. Nonagricul-tural industrial supplies and materials also de-creased in the first quarter, largely as a result of adrop in petroleum products. In contrast, both ci-vilian aircraft and consumer goods rebounded.
Agricultural exports increased $0.3 billion, or 2percent, to $13.6 billion; quantities increased 2percent, and prices were unchanged. The increasein value was more than accounted for by increasesin soybeans, mainly to China, and in corn.
Imports.—Imports decreased $7.3 billion, or 2 per-cent, to $307.5 billion in the first quarter. Bothquantities and prices decreased 1 percent (table C).The decrease in the value of imports in the first
Revisions to the Estimates for theFourth Quarter of 2000
The international transactions accounts estimates forthe fourth quarter of 2000 are revised from the prelimi-nary estimates that were published in the April 2001SURVEY OF CURRENT BUSINESS. The current-account deficitfor the fourth quarter was revised to $116.3 billionfrom $115.3 billion. The goods deficit was revised to$118.5 billion from $118.3 billion, the services surpluswas revised to $18.2 billion from $19.4 billion, the bal-ance on income was revised to a surplus of $0.6 billionfrom a deficit of $0.5 billion, and unilateral currenttransfers were revised to net outflows of $16.7 billionfrom net outflows of $15.9 billion. Net recorded finan-cial inflows were revised to $113.8 billion from $86.6billion.
, and Percent Changes from Previous Periodrs seasonally adjusted]
Chained (1996) dollars 1
20011999 2000
2000 2001
I p I II III IV I p
37 194,942 736,671 821,909 197,590 203,785 211,993 208,541 207,38598 13,606 63,284 68,408 16,672 16,595 18,004 17,137 17,44439 181,336 673,184 752,860 180,922 186,996 193,783 191,159 189,682
57 307,462 1,140,013 1,296,872 312,217 322,928 330,752 330,975 327,08770 29,306 81,490 86,002 20,394 22,193 21,920 21,495 22,98587 278,156 1,055,792 1,206,773 290,894 299,188 307,753 308,938 302,672
rs) Percent change from previous period (chained (1996) dollars)
20011999 2000
2000 2001
I p I II III IV I p
.5 –0.7 3.6 11.6 2.2 3.1 4.0 –1.6 –0.6
.4 2.3 1.2 8.1 3.1 –.5 8.5 –4.8 1.8
.5 –.9 3.8 11.8 2.3 3.4 3.6 –1.4 –.8
.3 –2.3 12.1 13.8 4.3 3.4 2.4 .1 –1.2
.7 –7.8 .1 5.5 6.7 8.8 –1.2 –1.9 6.9
.4 –1.7 12.9 14.3 4.1 2.9 2.9 .4 –2.0

July 2001 ● 41
quarter, along with a sharp slowdown in the fourthquarter, was attributable to the slowdown in U.S.economic activity.
In the first quarter, nonpetroleum imports de-creased $4.8 billion, or 2 percent, to $278.2 billion;quantities decreased 2 percent, and prices were un-changed. Capital goods decreased for the secondconsecutive quarter as a result of large declines incomputers, parts, and peripherals, in semiconduc-tors, and in telecommunications equipment thatreflected the reduction in equipment and softwareinvestment in the U.S. economy. Automotiveproducts also decreased substantially for the sec-ond consecutive quarter. The decreases, in con-junction with declines in U.S. domestic motorvehicle production, reflected weak U.S. domesticsales of motor vehicles in past quarters. Consumergoods fell slightly.
Petroleum imports decreased $2.5 billion, or 8percent, to $29.3 billion. The decrease was attrib-utable to the first decrease in the average price perbarrel in eight quarters, to $25.09 from $28.89.The average number of barrels imported daily in-creased to 12.78 million from 12.05 million. In-ventories rose, while both consumption andproduction fell.
CHART 4
100
80
60
40
20
0
Billion $
p Preliminary
U.S. Bureau of Economic Analysis
U.S. Imports of Goods
I II III IV I II III
1998 1999
Asia, excluding JapanWestern EuropeCanadaLatin AmericaJapan
Balances by area.—The deficit on goods with Asiaexcluding Japan decreased $7.1 billion, to $41.7billion.3 U.S. imports fell sharply for the secondconsecutive quarter, contributing to slower eco-nomic growth in some Asian countries (chart 4).U.S. exports also decreased for the second consec-utive quarter. In the first quarter, the deficit withJapan decreased $1.7 billion, to $19.8 billion, as aresult of a much larger decline in imports than inexports. The deficit with Western Europedecreased $0.3 billion, to $17.0 billion.
In contrast, the deficit with Latin America in-creased $1.6 billion, to $11.5 billion, largely as a re-sult of a rise in the deficit with Mexico and adecline in the surplus with Brazil. The deficit withCanada increased $1.3 billion, to $16.9 billion.
Services.—The surplus on services decreased $0.7billion, to $17.5 billion, in the first quarter.
3. Seasonally adjusted estimates for exports for areas and countries arederived by applying seasonal factors for total U.S. agricultural and nonagricul-tural exports to the unadjusted agricultural and nonagricultural exports forareas and countries and then summing the seasonally adjusted estimates. Sea-sonally adjusted estimates for imports for areas and countries are derived byapplying seasonal factors for total U.S. petroleum and nonpetroleum imports tothe unadjusted petroleum and nonpetroleum imports for areas and countriesand then summing the seasonally adjusted estimates. (The seasonal factors arederived from the seasonal adjustment of U.S. exports and U.S. imports byfive-digit end-use commodity category.)
IV I II III IV Ip II III IV 2000 2001 Seasonally adjusted

42 ● July 2001
Receipts increased to $74.4 billion from $73.9 bil-lion, and payments increased to $56.9 billion from$55.7 billion.
Travel receipts edged down to $20.3 billionfrom $20.4 billion. Travel receipts changed little inthe past three quarters because of little changeboth in the number of visitors to the United Statesand in their average expenditures. Travel paymentsincreased to $16.2 billion from $15.9 billion,largely as a result of an increase in payments byU.S. travelers to Canada.
“Other” transportation receipts decreased to$7.4 billion from $7.6 billion, mostly as a result ofa decline in freight receipts. The decline in freightreceipts was partly attributable to the decline inthe volume of U.S. exports. “Other” transporta-tion payments decreased to $10.5 billion from$10.7 billion, mostly as a result of a decline infreight payments. The decline in freight paymentswas partly attributable to the decline in the volumeof U.S. imports.
Receipts for “other” private services increased to$28.3 billion from $27.4 billion. The increase waslargely accounted for by increases in affiliated ser-vices receipts, in net insurance receipts, and inbusiness, professional, and technical services re-ceipts. Payments for “other” private services in-creased to $15.3 billion from $14.6 billion. Theincrease was largely accounted for by increases inaffiliated services payments and in financial ser-vices payments.
Income
The balance on income shifted to a deficit of $3.1billion in the first quarter from a surplus of $0.6billion in the fourth. Income receipts decreased to$86.6 billion from $92.5 billion, and income pay-ments decreased to $89.7 billion from $91.8 bil-lion.
Receipts of investment income on U.S.-ownedassets abroad decreased to $86.0 billion from $91.9billion, and payments of investment income onforeign-owned assets in the United States de-creased to $87.7 billion from $89.9 billion.
Receipts of income on U.S. direct investmentabroad decreased to $38.3 billion from $39.6 bil-lion. Earnings of petroleum affiliates decreased forthe first time in more than 2 years, partly as a re-sult of a drop in petroleum prices. Earnings ofmanufacturing affiliates fell, reflecting declines inearnings of affiliates classified in industrial ma-chinery, in chemicals, and in “other manufactur-ing.” Interest receipts decreased slightly.
Payments of income on foreign direct invest-ment in the United States increased to $15.1 bil-
lion from $13.9 billion. The increase was mostlyattributable to a rise in earnings of petroleum affil-iates. After falling sharply in the previous twoquarters, earnings of manufacturing affiliates in-creased, largely as a result of a shift to profits fromlosses for affiliates in chemicals and in “other man-ufacturing.” In contrast, interest payments de-creased.
“Other” private income receipts decreased to$46.8 billion from $51.5 billion. Receipts on bankclaims, on nonbank claims, and on U.S. holdingsof foreign securities all decreased. The decreaseswere attributable to a decline in average yields,partly reflecting the easing of monetary policy inseveral foreign countries outside of the euro area.
“Other” private income payments decreased to$45.6 billion from $48.7 billion. Payments on bankand on nonbank liabilities decreased. The de-creases were attributable to a decline in averageyields, partly reflecting the easing of monetary pol-icy in the United States. Payments on foreign hold-ings of U.S. securities were boosted by a rise inaverage holdings.
U.S. Government income receipts edged up to$0.9 billion from $0.8 billion, and U.S. Govern-ment income payments decreased to $27.0 billionfrom $27.3 billion.
Unilateral current transfers
Unilateral current transfers were net outflows of$11.5 billion in the first quarter, down from netoutflows of $16.7 billion in the fourth. The de-crease was largely accounted for by a decrease inU.S. Government grants, which were boosted inthe fourth quarter by grants to Israel.
Capital AccountCapital account transactions were unchanged atnet inflows of $0.2 billion in the first quarter.
Financial AccountNet recorded financial inflows—net acquisitionsby foreign residents of assets in the United Statesless net acquisitions by U.S. residents of assetsabroad—were $80.6 billion in the first quarter,down from $113.8 billion (revised) in the fourth.Financial inflows for foreign-owned assets in theUnited States decreased more than financial out-flows for U.S.-owned assets abroad.
U.S.-owned assets abroad
Net U.S.-owned assets abroad increased $156.9 bil-lion in the first quarter, following an increase of$181.5 billion in the fourth. The slowdown wasmore than accounted for by a much smaller in-

July 2001 ● 43
crease in U.S. claims on foreigners reported by U.S.nonbanks in the first quarter than in the fourthand by a slowdown in net outflows for U.S. directinvestment abroad. In contrast, claims on foreign-ers reported by U.S. banks increased a recordamount in the first quarter after a previous recordincrease in the fourth, and net U.S. purchases offoreign securities picked up.
U.S. official reserve assets.—Net U.S. official reserveassets decreased $0.2 billion in the first quarter, incontrast to an increase of $1.4 billion in the fourth(table D). The first-quarter decrease was morethan accounted for by an decrease in the U.S.reserve position in the International MonetaryFund (IMF), reflecting net foreign repayments ofU.S. dollars to the IMF. U.S. holdings of foreigncurrencies and of special drawing rights bothincreased slightly.
Claims reported by banks and by nonbanks.—U.S.claims on foreigners reported by U.S. banksincreased a record $90.0 billion in the first quarter,following the previous record increase of $71.6 bil-lion in the fourth. Banks’ own claims increased forthe eighth consecutive quarter, but the increases inthe last two quarters were exceptionally large.
In the first quarter, banks’ own claims payablein dollars increased a record $82.8 billion, follow-ing an increase of $55.4 billion. The first-quarterincrease was attributable to continued strong in-terbank lending and to a step-up in lending toother private foreigners and to foreign public bor-rowers. Interbank lending was particularly strongto Western Europe, where the modest slowdown ineconomic growth had little impact on the demandfor bank credit. Demand for U.S. bank credit wasalso boosted by the sharp reduction in the cost ofU.S. funds as a result of the easing of U.S. mone-tary policy and by foreigners’ need to finance theirexceptionally large net purchases of U.S. securities.Substantial lending by U.S. brokers and dealerswas largely in the form of resale agreements withinternational mutual funds.
Table D.—Selecte
199
Changes in foreign official assets in the United States, net (decrease –) (table1, line 56) ............................................................................................................. 43,5Industrial countries 1 ............................................................................................. 31,3Members of OPEC 2 ............................................................................................. 1,6Other countries ..................................................................................................... 10,5
Changes in U.S. official reserve assets, net (increase –) (table 1, line 41) ......... 8,7
p Preliminary.1. Western Europe, Canada, Japan, Australia, New Zealand, and South Africa.
Banks’ domestic customers’ claims payable indollars decreased $7.3 billion, in contrast to an in-crease of $18.8 billion. The first-quarter decreasewas more than accounted for by a decrease in for-eign commercial paper outstanding in the UnitedStates. The decrease in foreign commercial paperoutstanding resulted both from a shift to longerterm borrowing by foreigners as yields in manybond markets decreased and from repayments oflarge fourth-quarter commercial paper borrow-ings.
Claims reported by U.S. nonbanking concernsincreased $5.6 billion, following an increase of$44.5 billion. In the first quarter, an increase in fi-nancial intermediaries’ claims more than offset adecrease in deposits abroad.
Foreign securities.—Net U.S. purchases of foreignsecurities were $28.5 billion in the first quarter, upfrom $24.6 billion in the fourth. Net U.S. pur-chases of foreign stocks were $25.5 billion, up from$22.4 billion, and net U.S. purchases of foreignbonds were $3.0 billion, up from $2.3 billion.
Net U.S. purchases of foreign stocks increasedthough stock prices in most foreign countries de-clined as a result of rising concerns about a slow-down in global economic growth. Transactionswith Japan shifted to net U.S. purchases from netU.S. sales, despite the deterioration in Japaneseeconomic conditions. Transactions with Asia ex-cept Japan also shifted to net U.S. purchases fromnet U.S. sales. Net U.S. purchases from WesternEurope decreased as a result of a reduction inmerger-related exchanges of stock. Nonmerger-re-lated transactions with Western Europe shifted tonet U.S. purchases from net U.S. sales, despite sub-stantial declines in most European stock markets.
The small increase in net U.S. purchases of for-eign bonds partly reflected increases in bondprices in many foreign countries. Bond prices wereboosted by the slowdown in global economicgrowth and the easing of monetary policy in sev-eral countries outside of the euro area. New for-eign issues in the United States decreased. A drop
d Transactions with Official Agencies[Millions of dollars]
9 20001999 2000 2001 Change:
2000 IV–2001 II II III IV I II III IV I p
51 37,619 4,164 –736 12,721 27,402 22,498 6,447 12,247 –3,573 4,091 7,66483 14,653 3,226 1,420 14,099 12,638 12,745 14,305 –3,133 –9,264 –7,173 2,09121 11,582 2,156 1,868 –771 –1,632 6,143 1,639 3,636 164 –170 –33447 11,384 –1,218 –4,024 –607 16,396 3,610 –9,497 11,744 5,527 11,434 5,907
47 –290 4,068 1,159 1,951 1,569 –554 2,020 –346 –1,410 190 1,600
2. Based on data for Ecuador, Venezuela, Indonesia, and other Asian and African oil-exporting countries. ExcludesEcuador beginning January 1993 and Gabon beginning January 1995.

44 ● July 2001
in new issues by corporate borrowers from West-ern Europe more than offset an increase in new is-sues by borrowers from Latin America and fromother countries. Transactions in outstanding for-eign bonds shifted to net U.S. purchases from netU.S. sales, largely as a result of a surge in net U.S.purchases from the United Kingdom.
Direct investment.—Net financial outflows for U.S.direct investment abroad were $33.0 billion in thefirst quarter, down from $39.1 billion in thefourth. The decrease was largely accounted for by ashift to net inflows for intercompany debt from netoutflows. Net equity capital outflows decreased bya small amount, as a result of a decline in U.S.acquisitions of foreign companies, and reinvestedearnings edged lower.
Foreign-owned assets in the United States
Net foreign-owned assets in the United States in-creased $237.5 billion in the first quarter, follow-ing an increase of $295.3 billion in the fourth. Thedeceleration was more than accounted for by asmall decrease in U.S. liabilities reported by U.S.banks after a large fourth-quarter increase and by adrop in net inflows for foreign direct investment inthe United States. In contrast, net foreign pur-chases of U.S. securities other than U.S. Treasurysecurities stepped up again, and transactions in
Data AvailabilityThe current and historical estimates that are presentedin tables 1–10a of the U.S. international transactionsaccounts are available as compressed files on BEA’s Website at <www.bea.doc.gov>; click on Catalog of Prod-ucts, and look under International Accounts Products,Balance of Payments.
The estimates are also available from BEA on the fol-lowing diskettes:
U.S. International Transactions. The most recentlyreleased annual and quarterly estimates are available asa 1-year subscription (four installments)—productnumber IDS–0001, price $80.00. The subscription alsoincludes the diskette of the historical series estimates(see below).
U.S. International Transactions, First Quarter 2001.Annual estimates for 1998–2000 and quarterly esti-mates for 1999:I–2001:I on a single diskette—productnumber IDN–0283, price $20.00.
U.S. International Transactions, Historical Series. Allthe available historical annual and quarterly estimateson a single diskette—product number IDN–0282, price$20.00.
To order, call the BEA Order Desk at 1–800–704–0415(outside the United States, call 202–606–9666).
U.S. Treasury securities shifted to small net foreignpurchases from net foreign sales.
Foreign official assets.—Net foreign official assetsin the United States increased $4.1 billion in thefirst quarter, in contrast to a decrease of $3.6 bil-lion in the fourth (table D). The first-quarterincrease was largely accounted for by increases inthe assets of several developing countries in Asia.Assets of industrial countries and of OPEC coun-tries both decreased.
Liabilities reported by banks and by nonbanks.—U.S. liabilities to foreigners reported by U.S. banks,excluding U.S. Treasury securities, decreased $0.5billion in the first quarter, in contrast to anincrease of $43.4 billion in the fourth. The first-quarter decrease was partly attributable to the netrepayment of U.S. dollar funds by U.S. banks.
Banks’ own liabilities payable in dollars de-creased $6.7 billion in the first quarter, in contrastto an increase of $20.6 billion in the fourth. (How-ever, substantial inflows probably resumed inApril.) The first-quarter decrease, the first in sixquarters, was more than accounted for by a reduc-tion in U.S. banks’ liabilities to their own foreignoffices. U.S. demand for funds from abroad wassharply reduced, partly by a decrease in the cost ofalternative funds available domestically. In con-trast, U.S. brokers and dealers borrowed fundsfrom abroad to support their sizable lending toforeigners.
Banks’ custody liabilities payable in dollars de-creased $10.9 billion, in contrast to an increase of$25.1 billion. The first-quarter decrease was largelyaccounted for by decreases in liabilities to Canadaand to Western Europe.
Liabilities reported by U.S. nonbanking con-cerns increased $42.3 billion, following an increaseof $48.3 billion.
U.S. Treasury securities.—Transactions in U.S.Treasury securities shifted to net foreign purchasesof $0.5 billion in the first quarter from net foreignsales of $10.4 billion in the fourth. The slope of theyield curve for U.S. Treasury securities with matu-rities from 1 to 10 years turned positive during thequarter: Yields on short-term securities declinedsharply as a result of the easing of U.S. monetarypolicy, while yields on long-term securitiesdeclined less. The shift to net foreign purchases ofU.S. Treasury securities was more than accountedfor by a shift to net purchases by Western Euro-

July 2001 ● 45
16
14
12
10
8
6
4
1998 1999 2000 2001
10
8
6
4
2
0
CHART 5
U.S. Bond Yields and SpreadsPercent
Source: Merrill Lynch
U.S. Bureau of Economic Analysis
High-yield U.S. corporate bonds
Investment-grade U.S. corporate bonds
U.S. agency securities
U.S. Treasury securities
High-yield U.S. corporate bonds
Investment-grade U.S. corporate bonds
U.S. agency securities
BOND YIELDS
BOND SPREADS OVER U.S. TREASURY SECURITIES
pean investors. In contrast, net sales by Asianinvestors increased, and transactions by invest-ment funds in the Caribbean shifted to net salesfrom net purchases.
Other U.S. securities.—Net foreign purchases ofU.S. securities other than U.S. Treasury securitiesincreased to a record $147.1 billion in the firstquarter from $126.6 billion in the fourth. Net for-eign purchases of U.S. corporate and other bondswere a record $106.1 billion, up from the previousrecord $87.4 billion in the fourth quarter, and netforeign purchases of U.S. stocks were $41.0 billion,up from $39.3 billion.
The step-up in net foreign purchases of U.S.corporate and other bonds was attributable to evi-dence that U.S. inflation was not becoming a seri-ous problem, to sharp declines in U.S. stock prices,and to aggressive action by U.S. monetary authori-ties to counter slowing economic growth. U.S. cor-porate bond yields, measured on a quarterlyaverage basis, decreased—both in absolute termsand in relation to U.S. Treasury bond yields—as aresult of the injection of liquidity into financialmarkets by U.S. monetary authorities (chart 5).Yields on U.S. investment grade corporate bondsdecreased 80 basis points, and yields on U.S. high-yield bonds decreased 113 basis points.
New issues sold abroad by U.S. corporationsstepped up. Foreign demand for these securitieswas boosted, in part, by larger price gains on U.S.issues than on most foreign issues. The U.S. corpo-rate supply of new issues was bolstered by the de-cline in coupon rates paid by issuers. Net foreignpurchases of outstanding U.S. corporate bonds in-creased strongly. Net foreign purchases of U.S. fed-erally sponsored agency bonds increased slightly toa new record, as U.S. agencies boosted their newdebt issues in international markets.
Net foreign purchases of U.S. stocks increaseddespite sharp declines in U.S. stock prices. Allmajor U.S. stock indexes fell during the quarter,amid concern that U.S. economic growth wasslowing and that corporate profitability was de-clining. The bulk of net foreign purchases oc-curred early in the quarter, when stock prices roseafter the initial 50-basis-point reduction in the tar-get Federal funds rate by U.S. monetary authori-ties. Soon thereafter, stock prices fell sharply,despite two additional 50-basis-point reductions,amid signs that corporate profitability and invest-ment spending were declining.
U.S. currency flows.—Net U.S. currency shipmentsto foreigners decreased to $2.3 billion in the firstquarter from $6.2 billion in the fourth.
Direct investment.—Net financial inflows for for-eign direct investment in the United States were$41.6 billion in the first quarter, down from $84.7billion in the fourth. The decrease was more thanaccounted for by a sharp decline in net equity cap-ital inflows, resulting from a drop in large-scaleforeign acquisitions of U.S. companies after anexceptionally strong fourth quarter. The largestfirst-quarter foreign acquisitions were in services,in “other manufacturing,” and in finance. In con-trast, net intercompany debt inflows increased,and reinvested earnings edged higher.
Tables 1 through 10a follow.

46 ● July 2001
Table 1.—U.S. International[Millions
Line (Credits +; debits –) 1 1969 1970 1971 1972 1973 1974 1975 1976 1977 1978 1979 1980 1981 1982
Current account1 Exports of goods and services and income receipts ...................... 60,132 68,387 72,384 81,986 113,050 148,484 157,936 172,090 184,655 220,516 287,965 344,440 380,928 366,983
2 Exports of goods and services ........................................................... 49,220 56,640 59,677 67,222 91,242 120,897 132,585 142,716 152,301 178,428 224,131 271,834 294,398 275,236
3 Goods, balance of payments basis 2 .............................................. 36,414 42,469 43,319 49,381 71,410 98,306 107,088 114,745 120,816 142,075 184,439 224,250 237,044 211,157
4 Services 3 ......................................................................................... 12,806 14,171 16,358 17,841 19,832 22,591 25,497 27,971 31,485 36,353 39,692 47,584 57,354 64,0795 Transfers under U.S. military agency sales contracts 4 ............ 4,138 4,214 5,472 5,856 5,369 5,197 6,256 5,826 7,554 8,209 6,981 9,029 10,720 12,572
6 Travel ........................................................................................... 2,043 2,331 2,534 2,817 3,412 4,032 4,697 5,742 6,150 7,183 8,441 10,588 12,913 12,3937 Passenger fares .......................................................................... 450 544 615 699 975 1,104 1,039 1,229 1,366 1,603 2,156 2,591 3,111 3,1748 Other transportation .................................................................... 2,652 3,125 3,299 3,579 4,465 5,697 5,840 6,747 7,090 8,136 9,971 11,618 12,560 12,317
9 Royalties and license fees 5 ....................................................... 2,019 2,331 2,545 2,770 3,225 3,821 4,300 4,353 4,920 5,885 6,184 7,085 7,284 5,60310 Other private services 5 .............................................................. 1,160 1,294 1,546 1,764 1,985 2,321 2,920 3,584 3,848 4,717 5,439 6,276 1610,250 17,44411 U.S. Government miscellaneous services .................................. 343 332 347 357 401 419 446 489 557 620 520 398 517 576
12 Income receipts .................................................................................... 10,913 11,748 12,707 14,765 21,808 27,587 25,351 29,375 32,354 42,088 63,834 72,606 86,529 91,74713 Income receipts on U.S.-owned assets abroad ............................. 10,913 11,748 12,707 14,765 21,808 27,587 25,351 29,375 32,354 42,088 63,834 72,606 86,529 91,74714 Direct investment receipts .......................................................... 7,649 8,169 9,160 10,949 16,542 19,157 16,595 18,999 19,673 25,458 38,183 37,146 32,549 1629,46915 Other private receipts ................................................................. 2,338 2,671 2,641 2,949 4,330 7,356 7,644 9,043 11,057 14,788 23,356 32,898 50,300 58,16016 U.S. Government receipts .......................................................... 925 907 906 866 936 1,074 1,112 1,332 1,625 1,843 2,295 2,562 3,680 4,11817 Compensation of employees ........................................................... .............. .............. .............. .............. .............. ................ ................ ................ ................ ................ ................ ................ ................ ....................
18 Imports of goods and services and income payments .................... 53,998 –59,901 –66,414 –79,237 –98,997 –137,274 –132,745 –162,109 –193,764 –229,870 –281,657 –333,774 –364,196 –355,975
19 Imports of goods and services ............................................................ 49,129 –54,386 –60,979 –72,665 –89,342 –125,190 –120,181 –148,798 –179,547 –208,191 –248,696 –291,241 –310,570 –299,391
20 Goods, balance of payments basis 2 .............................................. 35,807 –39,866 –45,579 –55,797 –70,499 –103,811 –98,185 –124,228 –151,907 –176,002 –212,007 –249,750 –265,067 –247,642
21 Services 3 ......................................................................................... 13,322 –14,520 –15,400 –16,868 –18,843 –21,379 –21,996 –24,570 –27,640 –32,189 –36,689 –41,491 –45,503 –51,74922 Direct defense expenditures ....................................................... –4,856 –4,855 –4,819 –4,784 –4,629 –5,032 –4,795 –4,895 –5,823 –7,352 –8,294 –10,851 –11,564 –12,460
23 Travel ........................................................................................... –3,373 –3,980 –4,373 –5,042 –5,526 –5,980 –6,417 –6,856 –7,451 –8,475 –9,413 –10,397 –11,479 –12,39424 Passenger fares .......................................................................... –1,080 –1,215 –1,290 –1,596 –1,790 –2,095 –2,263 –2,568 –2,748 –2,896 –3,184 –3,607 –4,487 –4,77225 Other transportation .................................................................... –2,455 –2,843 –3,130 –3,520 –4,694 –5,942 –5,708 –6,852 –7,972 –9,124 –10,906 –11,790 –12,474 –11,710
26 Royalties and license fees 5 ....................................................... –221 –224 –241 –294 –385 –346 –472 –482 –504 –671 –831 –724 –650 –79527 Other private services 5 .............................................................. –751 –827 –956 –1,043 –1,180 –1,262 –1,551 –2,006 –2,190 –2,573 –2,822 –2,909 16–3,562 –8,15928 U.S. Government miscellaneous services .................................. –586 –576 –592 –589 –640 –722 –789 –911 –951 –1,099 –1,239 –1,214 –1,287 –1,460
29 Income payments ................................................................................. –4,869 –5,515 –5,435 –6,572 –9,655 –12,084 –12,564 –13,311 –14,217 –21,680 –32,961 –42,532 –53,626 –56,58330 Income payments on foreign-owned assets in the United States –4,869 –5,515 –5,435 –6,572 –9,655 –12,084 –12,564 –13,311 –14,217 –21,680 –32,961 –42,532 –53,626 –56,58331 Direct investment payments ....................................................... –848 –875 –1,164 –1,284 –1,610 –1,331 –2,234 –3,110 –2,834 –4,211 –6,357 –8,635 –6,898 16–2,11432 Other private payments .............................................................. –3,244 –3,617 –2,428 –2,604 –4,209 –6,491 –5,788 –5,681 –5,841 –8,795 –15,481 –21,214 –29,415 –35,18733 U.S. Government payments ....................................................... –777 –1,024 –1,844 –2,684 –3,836 –4,262 –4,542 –4,520 –5,542 –8,674 –11,122 –12,684 –17,313 –19,28234 Compensation of employees ........................................................... .............. .............. .............. .............. .............. ................ ................ ................ ................ ................ ................ ................ ................ ....................
35 Unilateral current transfers, net ........................................................... –5,735 –6,156 –7,402 –8,544 –6,913 –9,249 –7,075 –5,686 –5,226 –5,788 –6,593 –8,349 –11,702 –16,54436 U.S. Government grants 4 ................................................................... –4,259 –4,449 –5,589 –6,665 –4,748 14–7,293 –5,101 –3,519 –2,990 –3,412 –4,015 –5,486 –5,145 –6,08737 U.S. Government pensions and other transfers ................................. –537 –611 –696 –770 –915 –939 –1,068 –1,250 –1,378 –1,532 –1,658 –1,818 –2,041 –2,25138 Private remittances and other transfers 6 ........................................... –939 –1,096 –1,117 –1,109 –1,250 –1,017 –906 –917 –859 –844 –920 –1,044 16–4,516 –8,207
Capital and financial accountCapital account
39 Capital account transactions, net ........................................................ .............. .............. .............. .............. .............. ................ ................ ................ ................ ................ ................ ................ ................ 199
Financial account40 U.S.-owned assets abroad, net (increase/financial outflow (–)) ...... 11,585 –8,470 –11,758 –13,787 –22,874 –34,745 –39,703 –51,269 –34,785 –61,130 –64,915 –85,815 –113,054 –127,882
41 U.S. official reserve assets, net .......................................................... –1,179 3,348 3,066 706 158 –1,467 –849 –2,558 –375 732 6 –7,003 –4,082 –4,96542 Gold 7 ............................................................................................... –967 787 866 547 .............. ................ ................ ................ –118 –65 –65 ................ (*) ....................43 Special drawing rights ..................................................................... .............. 16 468 7 9 –172 –66 –78 –121 1,249 3 1,136 –730 –1,37144 Reserve position in the International Monetary Fund .................... –1,034 389 1,350 153 –33 –1,265 –466 –2,212 –294 4,231 –189 –1,667 –2,491 –2,55245 Foreign currencies ........................................................................... 822 2,156 382 –1 182 –30 –317 –268 158 –4,683 257 –6,472 –861 –1,041
46 U.S. Government assets, other than official reserve assets, net ...... –2,200 –1,589 –1,884 –1,568 –2,644 366 –3,474 –4,214 –3,693 –4,660 –3,746 –5,162 –5,097 –6,13147 U.S. credits and other long-term assets ........................................ –3,489 –3,293 –4,181 –3,819 –4,638 –5,001 –5,941 –6,943 –6,445 –7,470 –7,697 –9,860 –9,674 –10,06348 Repayments on U.S. credits and other long-term assets 8 ........... 1,200 1,721 2,115 2,086 2,596 4,826 2,475 2,596 2,719 2,941 3,926 4,456 4,413 4,29249 U.S. foreign currency holdings and U.S. short-term assets, net 89 –16 182 165 –602 541 –9 133 33 –131 25 242 164 –360
50 U.S. private assets, net ....................................................................... –8,206 –10,229 –12,940 –12,925 –20,388 –33,643 –35,380 –44,498 –30,717 –57,202 –61,176 –73,651 –103,875 –116,78651 Direct investment ............................................................................. –5,960 –7,590 –7,618 –7,747 –11,353 –9,052 –14,244 –11,949 –11,890 –16,056 –25,222 –19,222 –9,624 16–4,55652 Foreign securities ............................................................................ –1,549 –1,076 –1,113 –618 –671 –1,854 –6,247 –8,885 –5,460 –3,626 –4,726 –3,568 –5,699 –7,98353 U.S. claims on unaffiliated foreigners reported by U.S.
nonbanking concerns .................................................................. –126 –596 –1,229 –1,054 –2,383 –3,221 –1,357 –2,296 –1,940 –3,853 –5,014 –4,023 –4,377 6,82354 U.S. claims reported by U.S. banks, not included elsewhere ....... –570 –967 –2,980 –3,506 –5,980 –19,516 –13,532 –21,368 –11,427 –33,667 –26,213 –46,838 –84,175 –111,070
55 Foreign-owned assets in the United States, net (increase/financialinflow (+)) ............................................................................................ 12,702 6,359 22,970 21,461 18,388 35,341 17,170 38,018 53,219 67,036 40,852 62,612 86,232 96,589
56 Foreign official assets in the United States, net ................................ –1,301 6,908 26,879 10,475 6,026 10,546 7,027 17,693 36,816 33,678 –13,665 15,497 4,960 3,59357 U.S. Government securities ............................................................ –2,343 9,439 26,570 8,470 641 4,172 5,563 9,892 32,538 24,221 –21,972 11,895 6,322 5,08558 U.S. Treasury securities 9 ........................................................... –2,269 9,411 26,578 8,213 59 3,270 4,658 9,319 30,230 23,555 –22,435 9,708 5,019 5,77959 Other 10 ........................................................................................ –74 28 –8 257 582 902 905 573 2,308 666 463 2,187 1,303 –69460 Other U.S. Government liabilities 11 ............................................... 251 –456 –510 182 936 301 1,517 4,627 1,400 2,476 –40 615 –338 60561 U.S. liabilities reported by U.S. banks, not included elsewhere ... 792 –2,075 819 1,638 4,126 5,818 –2,158 969 773 5,551 7,213 –159 –3,670 –1,74762 Other foreign official assets 12 ........................................................ .............. .............. .............. 185 323 254 2,104 2,205 2,105 1,430 1,135 3,145 2,646 –350
63 Other foreign assets in the United States, net .................................. 14,002 –550 –3,909 10,986 12,362 24,796 10,143 20,326 16,403 33,358 54,516 47,115 81,272 92,99764 Direct investment ............................................................................. 1,263 1,464 367 949 2,800 4,760 2,603 4,347 3,728 7,897 11,877 16,918 25,195 1612,63565 U.S. Treasury securities .................................................................. –68 81 –24 –39 –216 697 2,590 2,783 534 152,178 154,060 152,645 152,927 157,02766 U.S. securities other than U.S. Treasury securities ....................... 3,130 2,189 2,289 4,507 4,041 378 2,503 1,284 2,437 2,254 1,351 5,457 6,905 6,08567 U.S. currency ................................................................................... .............. .............. .............. .............. .............. 1,100 1,500 1,500 1,900 3,000 3,000 4,500 3,200 4,00068 U.S. liabilities to unaffiliated foreigners reported by U.S.
nonbanking concerns .................................................................. 792 2,014 369 815 1,035 1,844 319 –578 1,086 1,889 1,621 6,852 917 –2,38369 U.S. liabilities reported by U.S. banks, not included elsewhere ... 8,886 –6,298 –6,911 4,754 4,702 16,017 628 10,990 6,719 16,141 32,607 10,743 42,128 65,633
70 Statistical discrepancy (sum of above items with sign reversed) –1,516 –219 –9,779 –1,879 –2,654 –2,558 4,417 8,955 –4,099 9,236 24,349 20,886 21,792 36,630
Memoranda:71 Balance on goods (lines 3 and 20) ........................................................ 607 2,603 –2,260 –6,416 911 –5,505 8,903 –9,483 –31,091 –33,927 –27,568 –25,500 –28,023 –36,48572 Balance on services (lines 4 and 21) ..................................................... –516 –349 957 973 989 1,213 3,501 3,401 3,845 4,164 3,003 6,093 11,852 12,32973 Balance on goods and services (lines 2 and 19) .................................. 91 2,254 –1,303 –5,443 1,900 –4,292 12,404 –6,082 –27,246 –29,763 –24,565 –19,407 –16,172 –24,15674 Balance on income (lines 12 and 29) ..................................................... 6,044 6,233 7,272 8,192 12,153 15,503 12,787 16,063 18,137 20,408 30,873 30,073 32,903 35,16475 Unilateral current transfers, net (line 35) ................................................ –5,735 –6,156 –7,402 –8,544 –6,913 –9,249 –7,075 –5,686 –5,226 –5,788 –6,593 –8,349 –11,702 –16,54476 Balance on current account (lines 1, 18, and 35 or lines 73, 74, and
75) 13 .................................................................................................... 399 2,331 –1,433 –5,795 7,140 1,962 18,116 4,295 –14,335 –15,143 –285 2,317 5,030 –5,536
See footnotes on page 66.

July 2001 ● 47
Transactionsof dollars]
1983 1984 1985 1986 1987 1988 1989 1990 1991 1992 1993 1994 1995 1996 1997 1998 1999 2000 Line
356,106 399,913 387,612 407,098 457,053 567,862 648,290 706,975 727,557 748,603 777,044 869,328 1,005,935 1,077,966 1,195,538 1,191,932 1,242,655 1,418,568 1
266,106 291,094 289,070 310,033 348,869 431,149 487,003 535,233 578,344 616,547 642,884 703,890 794,433 852,120 934,980 932,694 957,353 1,065,702 2
201,799 219,926 215,915 223,344 250,208 320,230 359,916 387,401 414,083 439,631 456,943 502,859 575,204 612,113 678,366 670,416 684,553 772,210 3
64,307 71,168 73,155 86,689 98,661 110,919 127,087 147,832 164,261 176,916 185,941 201,031 219,229 240,007 256,614 262,278 272,800 293,492 412,524 9,969 8,718 8,549 11,106 9,284 8,564 9,932 11,135 12,387 13,471 12,787 14,643 16,446 16,675 17,450 15,920 14,060 5
10,947 1617,177 17,762 20,385 23,563 29,434 36,205 43,007 48,385 54,742 57,875 58,417 63,395 69,809 73,426 71,286 74,731 82,042 63,610 164,067 4,411 5,582 7,003 8,976 10,657 15,298 15,854 16,618 16,528 16,997 18,909 20,422 20,868 20,098 19,785 20,745 7
12,590 13,809 14,674 1615,438 17,027 19,311 20,526 22,042 22,631 21,531 21,958 23,754 26,081 26,074 27,006 25,604 26,916 30,185 8
5,778 6,177 6,678 8,113 10,174 12,139 13,818 16,634 17,819 20,841 21,695 26,712 30,289 32,470 33,228 35,626 36,420 38,030 918,192 19,255 20,035 1628,027 29,263 31,111 36,729 40,251 47,748 1649,956 53,532 61,477 65,094 73,858 84,456 91,288 98,143 107,568 10
666 714 878 595 526 664 587 668 690 841 883 887 818 928 955 926 885 862 11
90,000 108,819 98,542 97,064 108,184 136,713 161,287 171,742 149,214 132,056 134,159 165,438 211,502 225,846 260,558 259,238 285,302 352,866 1290,000 108,819 98,542 96,156 107,190 135,718 160,270 170,570 147,924 130,631 132,725 163,895 209,741 224,090 258,756 257,304 283,092 350,525 1331,750 35,325 35,410 36,938 46,288 58,445 61,981 65,973 58,718 57,538 67,246 77,344 95,260 102,505 115,323 103,835 123,718 149,240 1453,418 68,267 57,633 52,806 55,592 70,571 92,638 94,072 81,186 65,977 60,353 82,423 109,768 116,994 139,874 149,868 156,177 197,440 15
4,832 5,227 5,499 6,413 5,311 6,703 5,651 10,525 8,019 7,115 5,126 4,128 4,713 4,591 3,559 3,601 3,197 3,845 16.................... ................. ................. 908 994 995 1,017 1,172 1,290 1,425 1,434 1,543 1,761 1,756 1,802 1,934 2,210 2,341 17
–377,488 –473,923 –483,769 –530,142 –594,443 –663,741 –721,607 –759,287 –734,563 –762,105 –821,930 –949,312 –1,081,776 –1,158,822 –1,294,553 –1,364,962 –1,518,106 –1,809,099 18
–323,874 –400,166 –410,950 –448,572 –500,552 –545,715 –580,144 –616,094 –609,479 –653,004 –711,675 –800,568 –890,821 –953,963 –1,042,745 –1,099,522 –1,219,191 –1,441,441 19
–268,901 –332,418 –338,088 –368,425 –409,765 –447,189 –477,665 –498,435 –491,020 –536,528 –589,394 –668,690 –749,374 –803,113 –876,485 –917,112 –1,029,987 –1,224,417 20
–54,973 –67,748 –72,862 –80,147 –90,787 –98,526 –102,479 –117,659 –118,459 –116,476 –122,281 –131,878 –141,447 –150,850 –166,260 –182,410 –189,204 –217,024 21–13,087 –12,516 –13,108 –13,730 –14,950 –15,604 –15,313 –17,531 –16,409 –13,835 –12,086 –10,217 –10,043 –11,061 –11,707 –12,185 –13,334 –13,560 22
–13,149 16–22,913 –24,558 –25,913 –29,310 –32,114 –33,416 –37,349 –35,322 –38,552 –40,713 –43,782 –44,916 –48,078 –52,051 –56,509 –58,865 –64,537 23–6,003 16–5,735 –6,444 –6,505 –7,283 –7,729 –8,249 –10,531 –10,012 –10,603 –11,410 –13,062 –14,663 –15,809 –18,138 –19,971 –21,315 –24,197 24
–12,222 –14,843 –15,643 16–17,766 –19,010 –20,891 –22,172 –24,966 –24,975 –23,767 –24,524 –26,019 –27,034 –27,403 –28,959 –30,363 –34,139 –41,058 25
–943 –1,168 –1,170 –1,401 –1,857 –2,601 –2,528 –3,135 –4,035 –5,161 –5,032 –5,852 –6,919 –7,837 –9,161 –11,235 –12,613 –16,106 26–8,001 –9,040 –10,203 16–13,146 –16,485 –17,667 –18,930 –22,229 –25,590 16–22,296 –26,261 –30,386 –35,249 –37,975 –43,482 –49,298 –46,117 –54,687 27–1,568 –1,534 –1,735 –1,686 –1,893 –1,921 –1,871 –1,919 –2,116 –2,263 –2,255 –2,560 –2,623 –2,687 –2,762 –2,849 –2,821 –2,879 28
–53,614 –73,756 –72,819 –81,571 –93,891 –118,026 –141,463 –143,192 –125,084 –109,101 –110,255 –148,744 –190,955 –204,859 –251,808 –265,440 –298,915 –367,658 29–53,614 –73,756 –72,819 –78,893 –91,553 –116,179 –139,177 –139,728 –121,058 –104,349 –105,123 –142,792 –184,692 –198,559 –245,142 –258,515 –291,603 –360,146 30
–4,120 –8,443 –6,945 –6,856 –7,676 –12,150 –7,045 –3,450 2,266 –2,189 –7,943 –22,150 –30,318 –33,093 –42,950 –37,582 –56,674 –68,009 31–30,501 –44,158 –42,745 –47,412 –57,659 –72,314 –93,768 –95,508 –82,452 –63,079 –57,804 –76,450 –97,004 –97,826 –114,142 –129,814 –139,798 –184,465 32–18,993 –21,155 –23,129 –24,625 –26,218 –31,715 –38,364 –40,770 –40,872 –39,081 –39,376 –44,192 –57,370 –67,640 –88,050 –91,119 –95,131 –107,672 33
.................... ................. ................. –2,678 –2,338 –1,847 –2,286 –3,464 –4,026 –4,752 –5,132 –5,952 –6,263 –6,300 –6,666 –6,925 –7,312 –7,512 34
–17,310 –20,335 –21,998 –24,132 –23,265 –25,274 –26,169 –26,654 10,752 –35,013 –37,637 –38,260 –34,057 –40,081 –40,794 –44,427 –48,913 –54,136 35–6,469 –8,696 –11,268 –11,883 –10,309 –10,537 –10,860 –10,359 29,193 –16,320 –17,036 –14,978 –11,190 –15,401 –12,472 –13,270 –13,774 –16,821 36–2,207 –2,159 –2,138 –2,372 –2,409 –2,709 –2,775 –3,224 –3,775 –4,043 –4,104 –4,556 –3,451 –4,466 –4,191 –4,305 –4,406 –4,705 37–8,635 –9,479 –8,593 –9,877 –10,548 –12,028 –12,534 –13,070 –14,665 –14,650 –16,497 –18,726 –19,416 –20,214 –24,131 –26,852 –30,733 –32,610 38
209 235 315 301 365 493 336 –6,579 –4,479 612 –88 –469 372 693 350 678 –3,491 705 39
–66,373 –40,376 –44,752 –111,723 –79,296 –106,573 –175,383 –81,234 –64,388 –74,410 –200,552 –176,056 –352,376 –413,923 –487,599 –359,632 –437,067 –580,952 40
–1,196 –3,131 –3,858 312 9,149 –3,912 –25,293 –2,158 5,763 3,901 –1,379 5,346 –9,742 6,668 –1,010 –6,783 8,747 –290 41.................... ................. ................. ................. ................. ................. ................. ................. ................. ................. ................. ................. ................... ................... ................... ................... ................... ................... 42
–66 –979 –897 –246 –509 127 –535 –192 –177 2,316 –537 –441 –808 370 –350 –147 10 –722 43–4,434 –995 908 1,501 2,070 1,025 471 731 –367 –2,692 –44 494 –2,466 –1,280 –3,575 –5,119 5,484 2,308 44
3,304 –1,156 –3,869 –942 7,588 –5,064 –25,229 –2,697 6,307 4,277 –797 5,293 –6,468 7,578 2,915 –1,517 3,253 –1,876 45
–5,006 –5,489 –2,821 –2,022 1,006 2,967 1,233 2,317 2,924 –1,667 –351 –390 –984 –989 68 –422 2,751 –944 46–9,967 –9,599 –7,657 –9,084 –6,506 –7,680 –5,608 –8,410 –12,879 –7,408 –6,311 –5,383 –4,859 –5,025 –5,417 –4,678 –6,175 –5,177 47
5,012 4,490 4,719 6,089 7,625 10,370 6,725 10,856 16,776 5,807 6,270 5,088 4,125 3,930 5,438 4,111 9,560 4,257 48–51 –379 117 973 –113 277 115 –130 –974 –66 –310 –95 –250 106 47 145 –634 –24 49
–60,172 –31,757 –38,074 –110,014 –89,450 –105,628 –151,323 –81,393 –73,075 –76,644 –198,822 –181,012 –341,650 –419,602 –486,657 –352,427 –448,565 –579,718 50–12,528 –16,407 –18,927 –23,995 –35,034 –22,528 –43,447 –37,183 –37,889 –48,266 –83,950 –80,167 –98,750 –91,885 –104,803 –142,516 –155,385 –152,437 51
–6,762 –4,756 –7,481 –4,271 –5,251 –7,980 –22,070 –28,765 –45,673 –49,166 –146,253 –60,309 –122,506 –149,829 –118,976 –136,135 –131,217 –124,935 52
–10,954 533 –10,342 –21,773 –7,046 –21,193 –27,646 –27,824 11,097 –387 766 –36,336 –45,286 –86,333 –121,760 –38,204 –85,700 –163,846 53–29,928 –11,127 –1,323 –59,975 –42,119 –53,927 –58,160 12,379 –610 21,175 30,615 –4,200 –75,108 –91,555 –141,118 –35,572 –76,263 –138,500 54
88,694 117,752 146,115 230,009 248,634 246,522 224,928 141,571 110,808 170,663 282,040 305,989 465,684 586,038 759,290 504,464 813,744 1,024,218 55
5,845 3,140 –1,119 35,648 45,387 39,758 8,503 33,910 17,389 40,477 71,753 39,583 109,880 126,724 19,036 –19,948 43,551 37,619 566,496 4,703 –1,139 33,150 44,802 43,050 1,532 30,243 16,147 22,403 53,014 36,827 72,712 120,679 –2,161 –3,589 32,527 30,676 576,972 4,690 –838 34,364 43,238 41,741 149 29,576 14,846 18,454 48,952 30,750 68,977 115,671 –6,690 –9,921 12,177 –10,233 58–476 13 –301 –1,214 1,564 1,309 1,383 667 1,301 3,949 4,062 6,077 3,735 5,008 4,529 6,332 20,350 40,909 59
602 739 844 2,195 –2,326 –467 160 1,868 1,367 2,191 1,313 1,564 –105 –982 –881 –3,371 –2,855 –1,987 60545 555 645 1,187 3,918 –319 4,976 3,385 –1,484 16,571 14,841 3,665 34,008 5,704 22,286 –9,501 12,964 5,803 61
–1,798 –2,857 –1,469 –884 –1,007 –2,506 1,835 –1,586 1,359 –688 2,585 –2,473 3,265 1,323 –208 –3,487 915 3,127 62
82,849 114,612 147,233 194,360 203,247 206,764 216,425 107,661 93,420 130,186 210,287 266,406 355,804 459,314 740,254 524,412 770,193 986,599 6310,372 24,468 19,742 35,420 58,470 57,735 68,274 48,494 23,171 19,823 51,362 46,121 57,776 86,502 105,603 178,209 301,006 287,655 64
158,689 23,001 20,433 3,809 –7,643 20,239 29,618 –2,534 18,826 37,131 24,381 34,274 99,548 154,996 146,433 48,581 –20,490 –52,792 658,164 12,568 50,962 70,969 42,120 26,353 38,767 1,592 35,144 30,043 80,092 56,971 96,367 130,240 197,892 218,091 343,963 485,644 665,400 4,100 5,200 4,100 5,400 5,800 5,900 18,800 15,400 13,400 18,900 23,400 12,300 17,362 24,782 16,622 22,407 1,129 67
–118 16,626 9,851 3,325 18,363 32,893 22,086 45,133 –3,115 13,573 10,489 1,302 59,637 53,736 116,518 23,140 69,075 177,010 6850,342 33,849 41,045 76,737 86,537 63,744 51,780 –3,824 3,994 16,216 25,063 104,338 30,176 16,478 149,026 39,769 54,232 87,953 69
16,162 16,733 16,478 28,590 –9,048 –19,289 49,605 25,208 –45,688 –48,350 1,123 –11,220 –3,782 –51,871 –132,232 71,947 –48,822 696 70
–67,102 –112,492 –122,173 –145,081 –159,557 –126,959 –117,749 –111,034 –76,937 –96,897 –132,451 –165,831 –174,170 –191,000 –198,119 –246,696 –345,434 –452,207 719,335 3,419 294 6,543 7,874 12,393 24,607 30,173 45,802 60,440 63,660 69,153 77,782 89,157 90,354 79,868 83,596 76,468 72
–57,767 –109,073 –121,880 –138,538 –151,684 –114,566 –93,142 –80,861 –31,135 –36,457 –68,791 –96,678 –96,388 –101,843 –107,765 –166,828 –261,838 –375,739 7336,386 35,063 25,723 15,494 14,293 18,687 19,824 28,550 24,130 22,954 23,904 16,694 20,547 20,987 8,750 –6,202 –13,613 –14,792 74
–17,310 –20,335 –21,998 –24,132 –23,265 –25,274 –26,169 –26,654 10,752 –35,013 –37,637 –38,260 –34,057 –40,081 –40,794 –44,427 –48,913 –54,136 75
–38,691 –94,344 –118,155 –147,177 –160,655 –121,153 –99,486 –78,965 3,747 –48,515 –82,523 –118,244 –109,898 –120,937 –139,809 –217,457 –324,364 –444,667 76

48 ● July 2001
Table 1.—U.S. International[Millions
Line (Credits +; debits –) 1
Not seasonally adjusted
1989 1990
I II III IV I II III IV
Current account1 Exports of goods and services and income receipts ...................................................................................................................... 155,481 165,440 160,912 166,457 171,641 176,426 173,303 185,605
2 Exports of goods and services ........................................................................................................................................................... 116,401 124,460 121,456 124,686 129,691 134,396 132,412 138,735
3 Goods, balance of payments basis 2 ............................................................................................................................................. 86,849 94,042 86,863 92,162 95,820 99,205 92,460 99,916
4 Services 3 ........................................................................................................................................................................................ 29,552 30,418 34,593 32,524 33,871 35,191 39,952 38,8195 Transfers under U.S. military agency sales contracts 4 ........................................................................................................... 2,161 2,142 2,417 1,844 2,147 2,327 2,954 2,502
6 Travel .......................................................................................................................................................................................... 7,553 8,643 11,003 9,007 9,289 10,541 12,466 10,7127 Passenger fares ......................................................................................................................................................................... 2,270 2,483 3,387 2,517 3,192 3,663 4,526 3,9178 Other transportation ................................................................................................................................................................... 5,000 5,184 5,087 5,255 5,318 5,334 5,680 5,710
9 Royalties and license fees 5 ...................................................................................................................................................... 3,178 3,301 3,307 4,032 3,579 3,966 4,120 4,97010 Other private services 5 ............................................................................................................................................................. 9,234 8,518 9,251 9,726 10,201 9,160 10,035 10,85511 U.S. Government miscellaneous services ................................................................................................................................. 155 146 143 144 145 200 170 153
12 Income receipts ................................................................................................................................................................................... 39,080 40,980 39,456 41,771 41,951 42,030 40,891 46,87013 Income receipts on U.S.-owned assets abroad ............................................................................................................................ 38,831 40,731 39,200 41,508 41,669 41,738 40,599 46,56414 Direct investment receipts .......................................................................................................................................................... 15,318 15,873 14,434 16,356 16,577 16,830 14,903 17,66315 Other private receipts ................................................................................................................................................................. 22,363 23,870 22,898 23,507 23,001 23,073 23,660 24,33816 U.S. Government receipts .......................................................................................................................................................... 1,150 988 1,869 1,645 2,091 1,835 2,036 4,56317 Compensation of employees .......................................................................................................................................................... 249 249 256 263 282 292 292 306
18 Imports of goods and services and income payments ................................................................................................................... –171,095 –183,837 –183,712 –182,963 –180,893 –186,868 –195,280 –196,246
19 Imports of goods and services ........................................................................................................................................................... –137,028 –146,928 –147,798 –148,391 –145,609 –150,957 –158,252 –161,277
20 Goods, balance of payments basis 2 ............................................................................................................................................. –114,067 –120,898 –119,242 –123,458 –119,839 –121,461 –125,286 –131,849
21 Services 3 ........................................................................................................................................................................................ –22,961 –26,030 –28,556 –24,933 –25,770 –29,496 –32,966 –29,42822 Direct defense expenditures ...................................................................................................................................................... –3,946 –3,908 –3,722 –3,736 –4,006 –3,910 –4,463 –5,152
23 Travel .......................................................................................................................................................................................... –6,438 –8,827 –10,748 –7,403 –7,266 –10,289 –11,935 –7,85924 Passenger fares ......................................................................................................................................................................... –1,739 –2,161 –2,560 –1,790 –2,171 –2,782 –3,224 –2,35425 Other transportation ................................................................................................................................................................... –5,274 –5,499 –5,705 –5,694 –5,928 –5,996 –6,434 –6,608
26 Royalties and license fees 5 ...................................................................................................................................................... –610 –636 –572 –710 –715 –698 –800 –92327 Other private services 5 ............................................................................................................................................................. –4,522 –4,560 –4,763 –5,085 –5,222 –5,326 –5,600 –6,08128 U.S. Government miscellaneous services ................................................................................................................................. –431 –439 –486 –515 –463 –494 –510 –451
29 Income payments ................................................................................................................................................................................ –34,067 –36,910 –35,914 –34,572 –35,284 –35,912 –37,028 –34,96930 Income payments on foreign-owned assets in the United States ................................................................................................ –33,551 –36,383 –35,357 –33,886 –34,493 –35,110 –36,145 –33,98131 Direct investment payments ....................................................................................................................................................... –1,945 –2,964 –2,109 –27 –589 –1,443 –1,883 46432 Other private payments .............................................................................................................................................................. –22,369 –23,893 –23,478 –24,028 –23,882 –23,546 –24,039 –24,04133 U.S. Government payments ....................................................................................................................................................... –9,237 –9,526 –9,770 –9,831 –10,022 –10,121 –10,223 –10,40434 Compensation of employees .......................................................................................................................................................... –516 –527 –557 –686 –791 –802 –883 –988
35 Unilateral current transfers, net .......................................................................................................................................................... –6,115 –5,418 –6,501 –8,135 –6,643 –7,331 –7,213 –5,46736 U.S. Government grants 4 .................................................................................................................................................................. –2,422 –1,995 –2,830 –3,614 –2,556 –3,613 –3,088 –1,10237 U.S. Government pensions and other transfers ................................................................................................................................ –659 –552 –652 –912 –721 –655 –739 –1,10938 Private remittances and other transfers 6 .......................................................................................................................................... –3,034 –2,871 –3,019 –3,609 –3,366 –3,063 –3,386 –3,256
Capital and financial accountCapital account
39 Capital account transactions, net ....................................................................................................................................................... 128 133 139 –64 –19 157 165 –6,882
Financial account40 U.S.-owned assets abroad, net (increase/financial outflow (–)) ..................................................................................................... –55,637 –10,858 –54,099 –54,789 36,491 –39,166 –45,107 –33,452
41 U.S. official reserve assets, net ......................................................................................................................................................... –4,000 –12,095 –5,996 –3,202 –3,177 371 1,739 –1,09142 Gold 7 .............................................................................................................................................................................................. ................ ................ ................ ................ ................ ................ ................ ....................43 Special drawing rights .................................................................................................................................................................... –188 68 –211 –204 –247 –216 363 –9344 Reserve position in the International Monetary Fund ................................................................................................................... 316 –159 337 –23 234 493 8 –445 Foreign currencies .......................................................................................................................................................................... –4,128 –12,004 –6,122 –2,975 –3,164 94 1,368 –995
46 U.S. Government assets, other than official reserve assets, net ..................................................................................................... 891 –287 592 37 –716 –836 –332 4,20147 U.S. credits and other long-term assets ........................................................................................................................................ –1,007 –1,174 –2,136 –1,292 –1,871 –2,019 –1,349 –3,17148 Repayments on U.S. credits and other long-term assets 8 .......................................................................................................... 1,894 834 2,759 1,238 1,229 1,169 1,044 7,41449 U.S. foreign currency holdings and U.S. short-term assets, net .................................................................................................. 3 53 –32 91 –74 14 –28 –43
50 U.S. private assets, net ...................................................................................................................................................................... –52,527 1,524 –48,695 –51,625 40,384 –38,701 –46,514 –36,56251 Direct investment ............................................................................................................................................................................ –13,999 –10,362 –11,228 –7,859 –11,768 –6,573 –19,295 45352 Foreign securities ........................................................................................................................................................................... –2,225 –6,192 –9,149 –4,504 –8,580 –11,037 –1,037 –8,11153 U.S. claims on unaffiliated foreigners reported by U.S. nonbanking concerns ........................................................................... –9,293 –5,767 –5,924 –6,662 3,019 –5,069 –15,514 –10,26054 U.S. claims reported by U.S. banks, not included elsewhere ...................................................................................................... –27,010 23,844 –22,394 –32,600 57,713 –16,022 –10,668 –18,644
55 Foreign-owned assets in the United States, net (increase/financial inflow (+)) .......................................................................... 66,334 11,398 74,367 72,828 –22,960 42,086 64,074 58,371
56 Foreign official assets in the United States, net ............................................................................................................................... 7,700 –5,115 13,060 –7,142 –6,421 6,207 13,937 20,18657 U.S. Government securities ........................................................................................................................................................... 5,355 –9,823 12,966 –6,966 –6,698 4,081 12,469 20,39158 U.S. Treasury securities 9 .......................................................................................................................................................... 4,634 –9,726 12,776 –7,535 –6,177 3,735 12,335 19,68359 Other 10 ....................................................................................................................................................................................... 721 –97 190 569 –521 346 134 70860 Other U.S. Government liabilities 11 .............................................................................................................................................. –307 314 –338 492 –195 1,160 –408 1,31061 U.S. liabilities reported by U.S. banks, not included elsewhere .................................................................................................. 2,197 3,823 –211 –833 598 1,240 2,141 –59462 Other foreign official assets 12 ....................................................................................................................................................... 455 572 643 165 –126 –274 –265 –921
63 Other foreign assets in the United States, net .................................................................................................................................. 58,635 16,512 61,308 79,971 –16,539 35,879 50,137 38,18564 Direct investment ............................................................................................................................................................................ 18,253 15,743 11,819 22,460 15,638 14,644 9,156 9,05765 U.S. Treasury securities ................................................................................................................................................................. 9,561 2,489 12,544 5,024 –1,891 1,857 544 –3,04466 U.S. securities other than U.S. Treasury securities ...................................................................................................................... 8,544 9,365 10,270 10,588 1,311 2,114 –2,874 1,04167 U.S. currency .................................................................................................................................................................................. 1,400 2,300 200 2,000 3,600 4,400 5,500 5,30068 U.S. liabilities to unaffiliated foreigners reported by U.S. nonbanking concerns ......................................................................... 6,637 12,000 –1,121 4,570 12,904 6,713 16,838 8,67869 U.S. liabilities reported by U.S. banks, not included elsewhere .................................................................................................. 14,240 –25,385 27,596 35,329 –48,101 6,151 20,973 17,153
70 Statistical discrepancy (sum of above items with sign reversed) ................................................................................................. 10,903 23,142 8,894 6,666 2,383 14,696 10,058 –1,929
Memoranda:71 Balance on goods (lines 3 and 20) ........................................................................................................................................................ –27,218 –26,856 –32,379 –31,296 –24,019 –22,256 –32,826 –31,93372 Balance on services (lines 4 and 21) .................................................................................................................................................... 6,591 4,388 6,037 7,591 8,101 5,695 6,986 9,39173 Balance on goods and services (lines 2 and 19) ................................................................................................................................. –20,627 –22,468 –26,342 –23,705 –15,919 –16,561 –25,840 –22,54274 Balance on income (lines 12 and 29) .................................................................................................................................................... 5,013 4,070 3,542 7,199 6,667 6,119 3,863 11,90175 Unilateral current transfers, net (line 35) ............................................................................................................................................... –6,115 –5,418 –6,501 –8,135 –6,643 –7,331 –7,213 –5,46776 Balance on current account (lines 1, 18, and 35 or lines 73, 74, and 75) 13 ..................................................................................... –21,729 –23,816 –29,301 –24,641 –15,895 –17,773 –29,190 –16,108
See footnotes on page 66.

July 2001 ● 49
Transactions—Continuedof dollars]
Not seasonally adjusted
Line1991 1992 1993 1994
I II III IV I II III IV I II III IV I II III IV
180,793 182,608 179,128 185,028 185,552 187,984 185,061 190,005 189,752 193,985 191,902 201,404 202,785 213,078 220,538 232,927 1
138,434 145,535 144,126 150,248 151,694 153,674 153,201 157,979 156,808 161,029 158,335 166,712 166,035 173,838 177,966 186,051 2
101,408 105,772 99,438 107,465 108,897 110,683 105,587 114,464 112,161 115,764 108,267 120,751 118,792 124,955 123,800 135,312 3
37,026 39,763 44,688 42,783 42,797 42,991 47,614 43,515 44,647 45,265 50,068 45,961 47,243 48,883 54,166 50,739 42,688 2,748 2,586 3,112 3,399 3,006 3,158 2,824 3,690 3,419 3,625 2,736 2,860 3,244 3,714 2,969 5
9,544 12,033 14,736 12,072 12,283 13,680 15,977 12,802 12,710 14,410 17,156 13,599 12,818 14,644 17,208 13,747 63,094 3,818 5,034 3,908 3,834 4,034 4,944 3,806 3,800 3,989 4,966 3,773 3,870 4,147 5,025 3,955 75,382 5,559 5,806 5,884 5,276 5,343 5,420 5,492 5,392 5,499 5,447 5,620 5,387 5,856 6,099 6,412 8
4,095 4,272 4,263 5,189 4,883 5,113 5,153 5,692 4,994 5,400 5,260 6,040 6,310 6,550 6,497 7,355 912,024 11,189 12,049 12,487 1612,990 11,544 12,663 12,760 13,856 12,262 13,388 14,025 15,747 14,292 15,397 16,041 10
200 145 213 132 131 272 299 139 204 286 225 168 251 150 226 260 11
42,359 37,073 35,002 34,780 33,859 34,310 31,861 32,027 32,945 32,955 33,567 34,692 36,750 39,240 42,572 46,876 1242,041 36,754 34,677 34,452 33,521 33,964 31,498 31,649 32,605 32,605 33,202 34,313 36,384 38,865 42,179 46,467 1316,658 14,593 12,813 14,654 14,719 15,752 13,742 13,326 16,174 16,930 16,628 17,513 17,944 18,460 19,668 21,272 1422,679 20,486 19,821 18,200 17,083 16,678 15,771 16,445 15,040 14,575 15,124 15,614 17,301 19,605 21,437 24,080 15
2,704 1,675 2,043 1,597 1,719 1,534 1,984 1,878 1,390 1,100 1,450 1,186 1,139 800 1,074 1,115 16318 319 325 328 338 346 363 378 340 350 365 379 366 375 393 409 17
–177,773 –182,335 –187,770 –186,686 –177,167 –190,234 –196,545 –198,159 –188,615 –204,948 –210,609 –217,759 –211,159 –231,938 –249,727 –256,488 18
–144,076 –150,126 –156,248 –159,029 –149,969 –161,591 –169,125 –172,319 –163,573 –177,568 –183,471 –187,063 –180,069 –196,594 –210,085 –213,820 19
–116,412 –119,837 –124,527 –130,244 –122,902 –131,734 –138,225 –143,667 –136,194 –146,396 –150,197 –156,607 –150,167 –162,978 –173,862 –181,683 20
–27,664 –30,289 –31,721 –28,785 –27,067 –29,857 –30,900 –28,652 –27,379 –31,172 –33,274 –30,456 –29,902 –33,616 –36,223 –32,137 21–5,169 –3,933 –3,597 –3,710 –3,714 –3,438 –3,309 –3,374 –3,177 –3,194 –2,919 –2,797 –2,695 –2,669 –2,487 –2,366 22
–6,770 –9,816 –10,862 –7,874 –7,772 –10,459 –11,787 –8,534 –8,108 –10,749 –12,265 –9,591 –8,998 –11,848 –13,341 –9,595 23–2,033 –2,641 –2,884 –2,455 –2,371 –2,716 –2,974 –2,542 –2,486 –2,894 –3,281 –2,749 –2,908 –3,401 –3,789 –2,964 24–6,011 –6,181 –6,510 –6,273 –5,768 –5,715 –6,239 –6,045 –5,887 –6,151 –6,239 –6,247 –6,024 –6,390 –6,934 –6,671 25
–882 –1,006 –1,080 –1,067 –1,359 –1,106 –1,520 –1,177 –1,118 –1,219 –1,317 –1,378 –1,591 –1,259 –1,432 –1,570 26–6,328 –6,224 –6,170 –6,869 16–5,592 –5,808 –4,487 –6,409 –6,028 –6,410 –6,652 –7,172 –7,056 –7,411 –7,561 –8,358 27
–472 –489 –618 –537 –491 –616 –584 –572 –575 –556 –601 –523 –630 –638 –679 –613 28
–33,697 –32,209 –31,522 –27,657 –27,198 –28,643 –27,421 –25,840 –25,042 –27,379 –27,138 –30,696 –31,090 –35,344 –39,642 –42,668 29–32,813 –31,277 –30,484 –26,485 –26,092 –27,504 –26,200 –24,554 –23,897 –26,163 –25,814 –29,249 –29,732 –33,905 –38,090 –41,065 30
1,186 –123 –424 1,626 1,032 –1,530 –1,424 –268 288 –2,650 –1,974 –3,607 –3,514 –5,214 –6,725 –6,697 31–23,549 –20,934 –19,794 –18,175 –17,333 –16,152 –14,996 –14,598 –14,483 –13,826 –13,878 –15,617 –16,032 –18,112 –20,225 –22,081 32–10,450 –10,220 –10,266 –9,936 –9,791 –9,822 –9,780 –9,688 –9,702 –9,687 –9,962 –10,025 –10,186 –10,579 –11,140 –12,287 33
–884 –932 –1,038 –1,172 –1,106 –1,139 –1,221 –1,286 –1,145 –1,216 –1,324 –1,447 –1,358 –1,439 –1,552 –1,603 34
14,897 4,211 –2,721 –5,635 –7,526 –8,029 –7,742 –11,716 –7,787 –8,329 –9,123 –12,397 –8,053 –8,033 –9,332 –12,842 3519,445 8,285 1,730 –267 –3,040 –3,532 –3,161 –6,586 –3,007 –3,468 –4,097 –6,463 –2,488 –2,946 –3,323 –6,221 36
–773 –680 –774 –1,548 –722 –1,008 –892 –1,421 –598 –1,036 –813 –1,657 –845 –747 –1,257 –1,707 37–3,775 –3,394 –3,677 –3,820 –3,763 –3,489 –3,689 –3,709 –4,182 –3,825 –4,213 –4,277 –4,720 –4,340 –4,752 –4,914 38
–941 73 –3,786 175 152 111 173 176 –459 147 83 141 152 –704 –70 153 39
–11,679 –1,015 –17,536 –34,159 –12,459 –17,838 –15,015 –29,098 –22,486 –46,952 –53,991 –77,122 –42,259 –44,263 –32,927 –56,607 40
–353 1,014 3,877 1,225 –1,057 1,464 1,952 1,542 –983 822 –545 –673 –59 3,537 –165 2,033 41........................ .................. .................. .................. .................. .................. .................. .................. .................. .................. .................. .................. .................. .................. .................. .................. 42
31 –190 6 –23 –172 –168 –173 2,829 –140 –166 –118 –113 –101 –108 –111 –121 43–341 72 –114 17 111 1 –118 –2,685 –228 313 –48 –80 –3 251 273 –27 44
–43 1,132 3,986 1,232 –996 1,631 2,243 1,398 –615 675 –378 –480 45 3,394 –327 2,181 45
619 –508 3,281 –469 –329 –372 –322 –644 487 –304 –194 –340 399 477 –323 –943 46–2,018 –1,061 –8,724 –1,077 –1,517 –1,247 –1,980 –2,664 –945 –773 –1,668 –2,925 –757 –1,006 –1,372 –2,248 47
2,700 755 12,442 880 1,256 1,014 1,429 2,108 1,763 891 2,036 1,580 1,120 1,648 1,383 937 48–63 –202 –437 –272 –68 –139 229 –89 –331 –422 –562 1,005 36 –165 –334 368 49
–11,945 –1,520 –24,694 –34,916 –11,074 –18,930 –16,645 –29,995 –21,990 –47,470 –53,253 –76,110 –42,599 –48,277 –32,439 –57,697 50–15,497 –2,904 –11,016 –8,472 –21,657 –11,801 –6,672 –8,136 –15,977 –24,373 –14,171 –29,430 –31,073 –16,123 –19,258 –13,713 51
–9,960 –12,021 –12,550 –11,142 –8,668 –8,196 –13,059 –19,243 –28,208 –29,833 –51,940 –36,272 –19,540 –9,229 –12,405 –19,135 52–40 7,902 3,341 –106 7,562 –6,620 –3,737 2,408 –6,130 –725 5,896 1,725 –2,215 –20,966 –960 –12,195 53
13,552 5,503 –4,469 –15,196 11,689 7,687 6,823 –5,024 28,325 7,461 6,962 –12,133 10,229 –1,959 184 –12,654 54
8,118 13,274 33,793 55,624 30,776 50,768 36,118 53,001 24,852 59,450 86,155 111,584 89,869 57,101 82,848 76,171 55
5,569 –4,914 3,854 12,879 20,988 20,879 –7,524 6,133 10,937 17,466 19,073 24,277 10,568 9,455 19,358 202 56126 –3,764 6,095 13,690 15,380 12,950 593 –6,520 1,745 6,750 20,443 24,076 1,074 8,282 18,697 8,774 57155 –3,545 5,621 12,615 14,916 11,251 –319 –7,394 1,080 5,668 19,098 23,106 897 5,922 16,475 7,456 58–29 –219 474 1,075 464 1,699 912 874 665 1,082 1,345 970 177 2,360 2,222 1,318 59769 253 771 –426 –73 518 607 1,138 –469 132 932 718 659 –5 284 626 60
3,908 –1,517 –3,107 –768 5,568 7,486 –7,724 11,241 8,257 9,485 –2,486 –415 9,588 2,143 1,177 –9,243 61766 115 95 383 113 –75 –1,000 274 1,404 1,099 184 –102 –753 –965 –800 45 62
2,549 18,188 29,939 42,745 9,787 29,888 43,642 46,868 13,915 41,984 67,082 87,307 79,301 47,646 63,490 75,969 633,847 13,975 –798 6,147 1,782 6,379 3,547 8,114 7,813 11,798 12,149 19,603 5,472 6,026 14,623 20,000 644,739 13,461 –1,196 1,822 686 10,231 4,908 21,306 13,363 –292 3,258 8,052 9,912 –7,098 5,661 25,799 655,023 14,872 10,310 4,939 4,569 10,467 2,531 12,476 9,694 15,205 17,782 37,411 21,070 12,352 13,389 10,160 664,800 2,200 4,200 4,200 1,300 1,100 6,100 4,900 3,000 5,900 6,400 3,600 5,500 6,300 4,700 6,900 67–586 –2,549 4,761 –4,741 5,689 3,954 4,854 –924 –215 6,531 288 3,885 5,856 4,269 –1,620 –7,203 68
–15,274 –23,771 12,661 30,378 –4,239 –2,243 21,702 996 –19,740 2,842 27,205 14,756 31,491 25,797 26,737 20,313 69
–13,415 –16,817 –1,109 –14,347 –19,328 –22,762 –2,050 –4,210 4,743 6,648 –4,417 –5,851 –31,335 14,759 –11,330 16,686 70
–15,004 –14,065 –25,089 –22,779 –14,005 –21,051 –32,638 –29,203 –24,033 –30,632 –41,930 –35,856 –31,375 –38,023 –50,062 –46,371 719,362 9,475 12,967 13,998 15,729 13,134 16,714 14,863 17,268 14,093 16,794 15,505 17,341 15,267 17,943 18,602 72
–5,642 –4,591 –12,122 –8,781 1,724 –7,917 –15,924 –14,340 –6,765 –16,539 –25,136 –20,351 –14,034 –22,756 –32,119 –27,769 738,663 4,864 3,481 7,123 6,661 5,667 4,440 6,187 7,902 5,576 6,429 3,997 5,660 3,896 2,930 4,208 74
14,897 4,211 –2,721 –5,635 –7,526 –8,029 –7,742 –11,716 –7,787 –8,329 –9,123 –12,397 –8,053 –8,033 –9,332 –12,842 7517,917 4,484 –11,362 –7,293 859 –10,278 –19,226 –19,869 –6,650 –19,293 –27,830 –28,752 –16,427 –26,893 –38,521 –36,403 76

50 ● July 2001
Table 1.—U.S. International[Millions
Line (Credits +; debits –) 1
Not seasonally adjusted
1995 1996 1997
I II III IV I II III IV I II III IV
Current account1 Exports of goods and services and income receipts .................................. 241,126 250,051 253,535 261,223 263,064 266,526 264,415 283,961 285,811 300,897 301,976 306,854
2 Exports of goods and services ....................................................................... 189,624 196,449 201,362 206,998 207,625 211,800 208,189 224,506 223,101 234,906 235,205 241,768
3 Goods, balance of payments basis 2 ......................................................... 138,769 144,742 141,105 150,588 151,603 154,006 145,526 160,978 162,328 172,087 166,183 177,768
4 Services 3 ..................................................................................................... 50,855 51,707 60,257 56,410 56,022 57,794 62,663 63,528 60,773 62,819 69,022 64,0005 Transfers under U.S. military agency sales contracts 4 ........................ 3,407 3,502 4,041 3,693 3,610 3,902 4,341 4,593 3,876 4,672 4,304 3,823
6 Travel ....................................................................................................... 13,157 14,887 19,475 15,876 14,950 17,462 19,386 18,011 16,084 18,167 21,902 17,2737 Passenger fares ...................................................................................... 4,227 4,349 5,653 4,680 4,675 4,914 5,639 5,194 4,800 5,018 5,980 5,0708 Other transportation ................................................................................ 6,180 6,549 6,576 6,776 6,147 6,480 6,482 6,965 6,591 6,755 6,719 6,941
9 Royalties and license fees 5 ................................................................... 6,999 7,280 7,662 8,348 7,682 7,682 8,013 9,093 8,045 8,161 8,272 8,75010 Other private services 5 .......................................................................... 16,683 14,982 16,588 16,841 18,633 17,161 18,576 19,488 21,117 19,836 21,601 21,90211 U.S. Government miscellaneous services ............................................. 202 158 262 196 325 193 226 184 260 210 244 241
12 Income receipts ............................................................................................... 51,502 53,602 52,173 54,225 55,439 54,726 56,226 59,455 62,710 65,991 66,771 65,08613 Income receipts on U.S.-owned assets abroad ......................................... 51,063 53,162 51,731 53,785 55,000 54,288 55,786 59,016 62,259 65,541 66,320 64,63614 Direct investment receipts ...................................................................... 22,893 24,805 22,881 24,681 25,367 24,891 24,721 27,526 28,960 30,185 29,834 26,34415 Other private receipts ............................................................................. 26,855 27,225 27,677 28,011 28,264 28,487 29,646 30,597 32,342 34,606 35,452 37,47416 U.S. Government receipts ...................................................................... 1,315 1,132 1,173 1,093 1,369 910 1,419 893 957 750 1,034 81817 Compensation of employees ...................................................................... 439 440 442 440 439 438 440 439 451 450 451 450
18 Imports of goods and services and income payments ................................ –254,703 –273,549 –279,282 –274,242 –268,680 –287,220 –300,439 –302,483 –301,916 –321,616 –336,317 –334,704
19 Imports of goods and services ....................................................................... –209,408 –226,166 –229,053 –226,194 –221,829 –237,527 –247,133 –247,474 –242,478 –259,013 –271,156 –270,098
20 Goods, balance of payments basis 2 ......................................................... –177,389 –189,998 –190,392 –191,595 –187,681 –199,437 –205,505 –210,490 –205,092 –217,039 –225,297 –229,057
21 Services 3 ..................................................................................................... –32,019 –36,168 –38,661 –34,599 –34,148 –38,090 –41,628 –36,984 –37,386 –41,974 –45,859 –41,04122 Direct defense expenditures ................................................................... –2,572 –2,447 –2,446 –2,578 –2,745 –2,691 –2,811 –2,814 –2,855 –2,737 –2,961 –3,154
23 Travel ....................................................................................................... –9,140 –12,208 –13,457 –10,111 –10,119 –12,611 –14,762 –10,586 –11,030 –13,761 –16,013 –11,24724 Passenger fares ...................................................................................... –3,119 –3,883 –4,232 –3,429 –3,542 –4,158 –4,521 –3,588 –3,930 –4,941 –5,298 –3,96925 Other transportation ................................................................................ –6,595 –6,743 –7,019 –6,677 –6,389 –6,955 –7,124 –6,935 –6,897 –7,290 –7,332 –7,440
26 Royalties and license fees 5 ................................................................... –1,547 –1,567 –1,787 –2,018 –1,780 –1,741 –2,284 –2,032 –2,185 –2,135 –2,389 –2,45227 Other private services 5 .......................................................................... –8,354 –8,684 –9,058 –9,153 –8,915 –9,277 –9,434 –10,349 –9,823 –10,414 –11,144 –12,10128 U.S. Government miscellaneous services ............................................. –692 –636 –662 –633 –658 –657 –692 –680 –666 –696 –722 –678
29 Income payments ............................................................................................ –45,295 –47,383 –50,229 –48,048 –46,851 –49,693 –53,306 –55,009 –59,438 –62,603 –65,161 –64,60630 Income payments on foreign-owned assets in the United States ............ –43,840 –45,877 –48,604 –46,371 –45,432 –48,190 –51,677 –53,260 –57,928 –61,019 –63,424 –62,77131 Direct investment payments ................................................................... –6,626 –7,380 –9,339 –6,973 –6,892 –8,467 –9,150 –8,584 –10,773 –11,098 –11,730 –9,34932 Other private payments .......................................................................... –23,914 –24,391 –24,413 –24,286 –23,389 –23,900 –24,876 –25,661 –26,846 –27,887 –28,840 –30,56933 U.S. Government payments ................................................................... –13,300 –14,106 –14,852 –15,112 –15,151 –15,823 –17,651 –19,015 –20,309 –22,034 –22,854 –22,85334 Compensation of employees ...................................................................... –1,455 –1,506 –1,625 –1,677 –1,419 –1,503 –1,629 –1,749 –1,510 –1,584 –1,737 –1,835
35 Unilateral current transfers, net ....................................................................... –8,715 –7,742 –8,432 –9,168 –10,573 –8,174 –9,101 –12,233 –9,332 –8,838 –9,478 –13,14636 U.S. Government grants 4 ............................................................................... –2,964 –2,491 –2,698 –3,037 –4,509 –2,566 –2,780 –5,546 –2,281 –2,308 –2,476 –5,40737 U.S. Government pensions and other transfers ............................................. –713 –816 –910 –1,012 –1,010 –744 –1,229 –1,483 –1,080 –852 –900 –1,35938 Private remittances and other transfers 6 ....................................................... –5,038 –4,435 –4,824 –5,119 –5,054 –4,864 –5,092 –5,204 –5,971 –5,678 –6,102 –6,380
Capital and financial accountCapital account
39 Capital account transactions, net .................................................................... 146 272 –299 253 156 173 178 186 138 68 41 103
Financial account40 U.S.-owned assets abroad, net (increase/financial outflow (–)) .................. –67,309 –118,914 –48,010 –118,143 –83,909 –70,244 –93,349 –166,421 –155,338 –96,118 –121,435 –114,708
41 U.S. official reserve assets, net ...................................................................... –5,318 –2,722 –1,893 191 17 –523 7,489 –315 4,480 –236 –730 –4,52442 Gold 7 ........................................................................................................... ................ ................ ................ ................ ................ ................ ................ ................ ................ ................ ................ ....................43 Special drawing rights ................................................................................. –867 –156 362 –147 –199 –133 848 –146 72 –133 –139 –15044 Reserve position in the International Monetary Fund ................................ –526 –786 –991 –163 –849 –220 –183 –28 1,055 54 –463 –4,22145 Foreign currencies ....................................................................................... –3,925 –1,780 –1,264 501 1,065 –170 6,824 –141 3,353 –157 –128 –153
46 U.S. Government assets, other than official reserve assets, net .................. –553 –225 252 –458 –210 –568 105 –316 –76 –298 377 6547 U.S. credits and other long-term assets .................................................... –1,622 –862 –1,028 –1,347 –1,076 –1,512 –1,192 –1,245 –1,170 –1,616 –1,426 –1,20548 Repayments on U.S. credits and other long-term assets 8 ....................... 1,072 649 1,522 882 1,013 683 1,214 1,020 1,119 1,329 1,832 1,15849 U.S. foreign currency holdings and U.S. short-term assets, net .............. –3 –12 –242 7 –147 261 83 –91 –25 –11 –29 112
50 U.S. private assets, net ................................................................................... –61,438 –115,967 –46,369 –117,876 –83,716 –69,153 –100,943 –165,790 –159,742 –95,584 –121,082 –110,24951 Direct investment ......................................................................................... –21,684 –16,033 –23,023 –38,010 –26,732 –16,828 –24,803 –23,522 –32,669 –27,385 –23,369 –21,38052 Foreign securities ........................................................................................ –8,775 –27,834 –41,564 –44,333 –44,043 –30,968 –33,273 –41,545 –23,836 –31,739 –51,297 –12,10453 U.S. claims on unaffiliated foreigners reported by U.S. nonbanking
concerns .................................................................................................. –2,631 –24,580 13,729 –31,804 –15,210 –22,000 –9,090 –40,033 –38,112 –9,885 –22,173 –51,59054 U.S. claims reported by U.S. banks, not included elsewhere .................. –28,348 –47,520 4,489 –3,729 2,269 643 –33,777 –60,690 –65,125 –26,575 –24,243 –25,175
55 Foreign-owned assets in the United States, net (increase/financial inflow(+)) .................................................................................................................... 102,765 129,215 125,373 108,331 95,899 110,407 152,840 226,892 183,919 153,991 183,039 238,341
56 Foreign official assets in the United States, net ............................................ 21,956 37,072 39,302 11,550 51,771 13,503 23,020 38,430 27,763 –6,019 23,474 –26,18257 U.S. Government securities ........................................................................ 11,258 26,560 21,116 13,778 55,839 –1,934 26,135 40,639 23,105 –11,411 10,316 –24,17158 U.S. Treasury securities 9 ....................................................................... 10,132 25,234 20,598 13,013 55,685 –3,378 24,908 38,456 22,351 –12,373 7,604 –24,27259 Other 10 ................................................................................................... 1,126 1,326 518 765 154 1,444 1,227 2,183 754 962 2,712 10160 Other U.S. Government liabilities 11 ........................................................... –562 54 –504 907 –554 –65 147 –510 –155 –286 –562 12261 U.S. liabilities reported by U.S. banks, not included elsewhere ............... 10,995 7,510 18,918 –3,415 –3,303 14,217 –1,677 –3,533 8,123 4,643 12,817 –3,29762 Other foreign official assets 12 .................................................................... 265 2,948 –228 280 –211 1,285 –1,585 1,834 –3,310 1,035 903 1,164
63 Other foreign assets in the United States, net .............................................. 80,809 92,143 86,071 96,781 44,128 96,904 129,820 188,462 156,156 160,010 159,565 264,52364 Direct investment ......................................................................................... 9,439 12,198 17,860 18,279 28,133 16,698 16,596 25,075 28,669 23,787 19,094 34,05365 U.S. Treasury securities .............................................................................. 30,011 30,439 37,295 1,803 18,031 26,967 38,727 71,271 33,050 37,928 40,133 35,32266 U.S. securities other than U.S. Treasury securities .................................. 15,734 20,606 32,128 27,899 29,391 31,179 35,118 34,552 45,364 54,286 63,131 35,11167 U.S. currency ............................................................................................... 6,400 1,900 1,900 2,100 –2,391 4,542 7,382 7,829 3,484 4,822 6,576 9,90068 U.S. liabilities to unaffiliated foreigners reported by U.S. nonbanking
concerns .................................................................................................. 17,764 11,864 13,493 16,516 4,350 15,259 28,925 5,202 25,055 6,461 25,550 59,45269 U.S. liabilities reported by U.S. banks, not included elsewhere ............... 1,461 15,136 –16,605 30,184 –33,386 2,259 3,072 44,533 20,534 32,726 5,081 90,685
70 Statistical discrepancy (sum of above items with sign reversed) ............. –13,310 20,667 –42,885 31,746 4,043 –11,468 –14,544 –29,902 –3,282 –28,384 –17,826 –82,740
Memoranda:71 Balance on goods (lines 3 and 20) .................................................................... –38,620 –45,256 –49,287 –41,007 –36,078 –45,431 –59,979 –49,512 –42,764 –44,952 –59,114 –51,28972 Balance on services (lines 4 and 21) ................................................................. 18,836 15,539 21,596 21,811 21,874 19,704 21,035 26,544 23,387 20,845 23,163 22,95973 Balance on goods and services (lines 2 and 19) .............................................. –19,784 –29,717 –27,691 –19,196 –14,204 –25,727 –38,944 –22,968 –19,377 –24,107 –35,951 –28,33074 Balance on income (lines 12 and 29) ................................................................. 6,207 6,219 1,944 6,177 8,588 5,033 2,920 4,446 3,272 3,388 1,610 48075 Unilateral current transfers, net (line 35) ............................................................ –8,715 –7,742 –8,432 –9,168 –10,573 –8,174 –9,101 –12,233 –9,332 –8,838 –9,478 –13,14676 Balance on current account (lines 1, 18, and 35 or lines 73, 74, and 75) 13 –22,292 –31,240 –34,179 –22,187 –16,189 –28,868 –45,125 –30,755 –25,437 –29,557 –43,819 –40,996
See footnotes on page 66.

July 2001 ● 51
Transactions—Continuedof dollars]
Not seasonally adjusted
Line1998 1999 2000 2001
I II III IV I II III IV I II III IV I p
299,414 298,795 289,079 304,644 293,163 303,762 313,050 332,680 337,921 355,842 359,403 365,402 353,123 1
232,843 232,025 226,447 241,379 227,939 234,827 239,644 254,943 254,876 266,347 270,858 273,621 265,831 2
170,134 167,707 157,823 174,752 163,366 168,443 167,141 185,603 185,006 193,698 193,488 200,018 193,701 3
62,709 64,318 68,624 66,627 64,573 66,384 72,503 69,340 69,870 72,649 77,370 73,603 72,130 44,631 4,466 3,993 4,360 4,217 4,526 3,855 3,322 3,401 3,910 3,329 3,420 3,388 5
15,661 18,128 20,363 17,134 15,813 18,542 21,820 18,556 17,892 21,236 23,427 19,487 17,780 64,604 5,021 5,756 4,717 4,466 4,756 5,760 4,803 4,627 5,237 5,874 5,007 4,524 76,071 6,300 6,682 6,551 6,161 6,667 7,054 7,034 7,035 7,615 7,964 7,571 7,024 8
8,318 8,528 8,558 10,222 8,887 8,831 8,966 9,736 9,099 9,270 9,361 10,300 9,615 923,224 21,625 23,065 23,374 24,826 22,839 24,809 25,669 27,612 25,168 27,195 27,593 29,571 10
200 250 207 269 203 223 239 220 204 213 220 225 228 11
66,571 66,770 62,632 63,265 65,224 68,935 73,406 77,737 83,045 89,495 88,545 91,781 87,292 1266,106 66,295 62,142 62,761 64,688 68,386 72,847 77,171 82,470 88,912 87,957 91,186 86,678 1327,782 27,621 23,057 25,375 27,834 30,363 32,268 33,253 35,309 37,955 37,046 38,930 38,955 1437,400 37,908 38,080 36,480 35,889 37,350 39,732 43,206 46,014 49,941 49,971 51,514 46,752 15
924 766 1,005 906 965 673 847 712 1,147 1,016 940 742 971 16465 475 490 504 536 549 559 566 575 583 588 595 614 17
–323,508 –341,315 –349,589 –350,550 –339,309 –369,862 –399,212 –409,723 –419,998 –452,269 –471,062 –465,770 –439,443 18
–259,013 –274,355 –282,316 –283,838 –272,324 –297,755 –320,373 –328,739 –332,427 –357,643 –377,282 –374,089 –350,266 19
–218,010 –227,628 –232,387 –239,087 –230,322 –249,610 –268,525 –281,530 –284,501 –301,727 –317,721 –320,468 –297,588 20
–41,003 –46,727 –49,929 –44,751 –42,002 –48,145 –51,848 –47,209 –47,926 –55,916 –59,561 –53,621 –52,678 21–2,922 –2,855 –3,186 –3,222 –3,186 –3,306 –3,559 –3,283 –3,262 –3,382 –3,541 –3,375 –3,550 22
–11,652 –15,185 –17,226 –12,446 –12,125 –15,884 –17,929 –12,927 –13,874 –18,320 –18,748 –13,595 –13,711 23–4,242 –5,337 –5,735 –4,657 –4,771 –5,655 –5,964 –4,925 –5,296 –6,645 –6,923 –5,333 –5,480 24–7,126 –7,511 –7,795 –7,931 –7,493 –8,218 –9,185 –9,243 –9,305 –10,034 –10,932 –10,787 –10,113 25
–2,690 –2,596 –2,753 –3,196 –2,885 –3,029 –3,044 –3,655 –3,520 –3,644 –4,381 –4,561 –4,423 26–11,699 –12,576 –12,469 –12,554 –10,852 –11,378 –11,401 –12,486 –11,955 –13,177 –14,312 –15,243 –14,666 27
–672 –667 –765 –745 –690 –675 –766 –690 –714 –714 –724 –727 –735 28
–64,495 –66,960 –67,273 –66,712 –66,985 –72,107 –78,839 –80,984 –87,571 –94,626 –93,780 –91,681 –89,177 29–62,909 –65,325 –65,466 –64,815 –65,336 –70,374 –76,914 –78,979 –85,828 –92,836 –91,854 –89,628 –87,337 30
–8,594 –10,504 –8,967 –9,517 –10,691 –14,826 –16,735 –14,422 –18,003 –20,051 –16,369 –13,586 –14,699 31–31,632 –31,861 –33,722 –32,599 –31,976 –32,393 –36,032 –39,397 –41,751 –45,884 –48,116 –48,714 –45,647 32–22,683 –22,960 –22,777 –22,699 –22,669 –23,155 –24,147 –25,160 –26,074 –26,901 –27,369 –27,328 –26,991 33
–1,586 –1,635 –1,807 –1,897 –1,649 –1,733 –1,925 –2,005 –1,743 –1,790 –1,926 –2,053 –1,840 34
–10,074 –9,772 –10,439 –14,142 –11,117 –11,211 –11,625 –14,960 –12,201 –11,978 –12,890 –17,067 –11,768 35–2,365 –2,209 –2,882 –5,814 –2,574 –3,097 –2,847 –5,256 –2,912 –3,232 –3,634 –7,043 –2,299 36–1,026 –919 –815 –1,545 –894 –856 –1,015 –1,641 –1,087 –912 –1,024 –1,682 –1,165 37–6,683 –6,644 –6,742 –6,783 –7,649 –7,258 –7,763 –8,063 –8,202 –7,834 –8,232 –8,342 –8,304 38
163 168 164 183 158 167 173 –3,989 173 173 175 184 174 39
–79,350 –142,160 –62,726 –75,396 –46,661 –172,052 –116,721 –101,633 –200,632 –95,853 –109,669 –174,798 –159,900 40
–444 –1,945 –2,025 –2,369 4,068 1,159 1,951 1,569 –554 2,020 –346 –1,410 190 41............................. ........................ ........................ ........................ ........................ ........................ ........................ ........................ ........................ ........................ ........................ ........................ ........................ 42
–182 73 189 –227 562 –190 –184 –178 –180 –180 –182 –180 –189 43–85 –1,032 –2,078 –1,924 3 1,413 2,268 1,800 –237 2,328 1,300 –1,083 574 44
–177 –986 –136 –218 3,503 –64 –133 –53 –137 –128 –1,464 –147 –195 45
–80 –483 188 –47 118 –392 –686 3,711 –127 –572 114 –359 68 46–1,192 –1,156 –1,286 –1,044 –1,314 –2,167 –1,595 –1,099 –1,750 –1,368 –1,050 –1,009 –1,061 47
1,134 699 1,336 942 1,554 1,887 1,026 5,093 1,329 855 1,265 808 1,029 48–22 –26 138 55 –122 –112 –117 –283 294 –59 –101 –158 100 49
–78,826 –139,732 –60,889 –72,980 –50,847 –172,819 –117,986 –106,913 –199,951 –97,301 –109,437 –173,029 –160,158 50–45,305 –46,900 –22,907 –27,404 –41,531 –37,819 –51,540 –24,495 –40,915 –35,626 –43,576 –32,320 –35,978 51–20,902 –44,282 6,005 –76,956 975 –71,379 –42,415 –18,398 –27,546 –39,639 –33,129 –24,621 –28,535 52
–7,822 –20,363 –15,658 5,639 –33,328 –27,605 –13,555 –11,212 –75,256 –29,491 –14,585 –44,514 –5,618 53–4,797 –28,187 –28,329 25,741 23,037 –36,016 –10,476 –52,808 –56,234 7,455 –18,147 –71,574 –90,027 54
96,955 173,910 97,882 135,717 131,002 278,614 173,313 230,815 257,185 250,178 223,317 293,538 237,937 55
10,999 –10,230 –46,639 25,922 4,164 –736 12,721 27,402 22,498 6,447 12,247 –3,573 4,091 5613,946 –20,051 –30,917 33,433 6,793 –916 14,798 11,852 24,311 6,334 5,271 –5,240 2,547 5711,336 –20,305 –32,823 31,871 800 –6,708 12,963 5,122 16,204 –4,000 –9,001 –13,436 –1,027 58
2,610 254 1,906 1,562 5,993 5,792 1,835 6,730 8,107 10,334 14,272 8,196 3,574 59–1,027 –755 –280 –1,309 –1,461 –1,064 –671 341 –474 –1,000 –220 –293 –1,244 60
–964 9,744 –12,948 –5,333 –1,273 1,761 –1,617 14,093 –2,270 209 6,884 980 1,785 61–956 832 –2,494 –869 105 –517 211 1,116 931 904 312 980 1,003 62
85,956 184,140 144,521 109,795 126,838 279,350 160,592 203,413 234,687 243,731 211,070 297,111 233,846 6319,868 20,821 24,898 112,622 35,465 151,921 51,997 61,623 36,911 90,565 77,255 82,924 42,072 64–2,535 25,814 918 24,384 –7,325 –5,410 9,687 –17,442 –9,348 –20,546 –12,503 –10,395 538 6576,986 70,566 21,138 49,401 63,430 83,903 95,412 101,218 136,208 94,400 128,393 126,643 147,132 66
746 2,349 7,277 6,250 2,440 3,057 4,697 12,213 –6,847 989 757 6,230 2,311 67
39,833 30,722 14,976 –62,391 46,262 16,799 –8,869 14,883 85,188 24,400 19,078 48,344 42,269 68–48,942 33,868 75,314 –20,471 –13,434 29,080 7,668 30,918 –7,425 53,923 –1,910 43,365 –476 69
16,400 20,374 35,629 –456 –27,236 –29,418 41,022 –33,190 37,552 –46,093 10,726 –1,489 19,877 70
–47,876 –59,921 –74,564 –64,335 –66,956 –81,167 –101,384 –95,927 –99,495 –108,029 –124,233 –120,450 –103,887 7121,706 17,591 18,695 21,876 22,571 18,239 20,655 22,131 21,944 16,733 17,809 19,982 19,452 72
–26,170 –42,330 –55,869 –42,459 –44,385 –62,928 –80,729 –73,796 –77,551 –91,296 –106,424 –100,468 –84,435 732,076 –190 –4,641 –3,447 –1,761 –3,172 –5,433 –3,247 –4,526 –5,131 –5,235 100 –1,885 74
–10,074 –9,772 –10,439 –14,142 –11,117 –11,211 –11,625 –14,960 –12,201 –11,978 –12,890 –17,067 –11,768 75–34,168 –52,292 –70,949 –60,048 –57,263 –77,311 –97,787 –92,003 –94,278 –108,405 –124,549 –117,435 –98,088 76

52 ● July 2001
Table 1.—U.S. International[Millions
Line (Credits +; debits –) 1
Seasonally adjusted
1989 1990
I II III IV I II III IV
Current account1 Exports of goods and services and income receipts ...................................................................................................................... 155,805 163,352 163,579 165,556 171,784 174,177 176,450 184,566
2 Exports of goods and services ........................................................................................................................................................... 116,850 122,509 123,078 124,568 130,014 132,172 134,613 138,436
3 Goods, balance of payments basis 2 ............................................................................................................................................. 86,274 91,399 90,762 91,481 94,998 96,184 97,211 99,008
4 Services 3 ........................................................................................................................................................................................ 30,576 31,110 32,316 33,087 35,016 35,988 37,402 39,4285 Transfers under U.S. military agency sales contracts 4 ........................................................................................................... 2,162 2,143 2,417 1,844 2,148 2,327 2,955 2,502
6 Travel .......................................................................................................................................................................................... 8,535 8,679 9,220 9,770 10,435 10,543 10,489 11,5397 Passenger fares ......................................................................................................................................................................... 2,579 2,506 2,723 2,850 3,504 3,714 3,755 4,3268 Other transportation ................................................................................................................................................................... 5,089 5,204 5,000 5,234 5,413 5,356 5,593 5,680
9 Royalties and license fees 5 ...................................................................................................................................................... 3,383 3,382 3,463 3,591 3,807 4,070 4,317 4,44210 Other private services 5 ............................................................................................................................................................. 8,662 9,047 9,375 9,644 9,564 9,778 10,123 10,78611 U.S. Government miscellaneous services ................................................................................................................................. 166 149 118 154 145 200 170 153
12 Income receipts ................................................................................................................................................................................... 38,955 40,843 40,501 40,988 41,770 42,005 41,837 46,13013 Income receipts on U.S.-owned assets abroad ............................................................................................................................ 38,706 40,594 40,245 40,725 41,488 41,713 41,545 45,82414 Direct investment receipts .......................................................................................................................................................... 15,290 15,658 15,511 15,522 16,537 16,680 15,888 16,86715 Other private receipts ................................................................................................................................................................. 22,363 23,870 22,898 23,507 23,001 23,073 23,660 24,33816 U.S. Government receipts .......................................................................................................................................................... 1,053 1,066 1,836 1,696 1,950 1,960 1,997 4,61917 Compensation of employees .......................................................................................................................................................... 249 249 256 263 282 292 292 306
18 Imports of goods and services and income payments ................................................................................................................... –177,206 –183,220 –179,692 –181,489 –187,397 –186,593 –191,570 –193,723
19 Imports of goods and services ........................................................................................................................................................... –142,758 –146,623 –143,963 –146,800 –151,555 –150,993 –154,961 –158,581
20 Goods, balance of payments basis 2 ............................................................................................................................................. –117,618 –121,382 –118,171 –120,494 –123,382 –122,229 –125,038 –127,786
21 Services 3 ........................................................................................................................................................................................ –25,140 –25,241 –25,792 –26,306 –28,173 –28,764 –29,923 –30,79522 Direct defense expenditures ...................................................................................................................................................... –3,946 –3,908 –3,722 –3,736 –4,006 –3,910 –4,463 –5,152
23 Travel .......................................................................................................................................................................................... –8,154 –8,083 –8,404 –8,777 –9,197 –9,490 –9,385 –9,27824 Passenger fares ......................................................................................................................................................................... –2,059 –2,060 –2,090 –2,040 –2,506 –2,669 –2,727 –2,62725 Other transportation ................................................................................................................................................................... –5,374 –5,490 –5,654 –5,652 –6,023 –6,062 –6,308 –6,573
26 Royalties and license fees 5 ...................................................................................................................................................... –622 –647 –581 –678 –732 –710 –797 –89627 Other private services 5 ............................................................................................................................................................. –4,543 –4,615 –4,877 –4,896 –5,246 –5,429 –5,733 –5,81828 U.S. Government miscellaneous services ................................................................................................................................. –442 –438 –464 –527 –463 –494 –510 –451
29 Income payments ................................................................................................................................................................................ –34,448 –36,597 –35,729 –34,689 –35,842 –35,600 –36,609 –35,14230 Income payments on foreign-owned assets in the United States ................................................................................................ –33,936 –36,046 –35,158 –34,035 –35,024 –34,761 –35,742 –34,20131 Direct investment payments ....................................................................................................................................................... –2,330 –2,627 –1,910 –176 –1,120 –1,094 –1,480 24432 Other private payments .............................................................................................................................................................. –22,369 –23,893 –23,478 –24,028 –23,882 –23,546 –24,039 –24,04133 U.S. Government payments ....................................................................................................................................................... –9,237 –9,526 –9,770 –9,831 –10,022 –10,121 –10,223 –10,40434 Compensation of employees .......................................................................................................................................................... –512 –551 –571 –654 –818 –839 –867 –941
35 Unilateral current transfers, net .......................................................................................................................................................... –6,048 –5,753 –6,630 –7,739 –6,540 –7,644 –7,339 –5,13336 U.S. Government grants 4 .................................................................................................................................................................. –2,422 –1,995 –2,830 –3,614 –2,556 –3,613 –3,088 –1,10237 U.S. Government pensions and other transfers ................................................................................................................................ –695 –671 –719 –691 –803 –811 –812 –79838 Private remittances and other transfers 6 .......................................................................................................................................... –2,931 –3,087 –3,081 –3,434 –3,181 –3,220 –3,439 –3,233
Capital and financial accountCapital account
39 Capital account transactions, net ....................................................................................................................................................... 128 133 139 –64 –19 157 165 –6,882
Financial account40 U.S.-owned assets abroad, net (increase/financial outflow (–)) ..................................................................................................... –53,703 –8,202 –51,678 –61,803 37,828 –37,204 –43,716 –38,142
41 U.S. official reserve assets, net ......................................................................................................................................................... –4,000 –12,095 –5,996 –3,202 –3,177 371 1,739 –1,09142 Gold 7 .............................................................................................................................................................................................. ................ ................ ................ ................ ................ ................ ................ ....................43 Special drawing rights .................................................................................................................................................................... –188 68 –211 –204 –247 –216 363 –9344 Reserve position in the International Monetary Fund ................................................................................................................... 316 –159 337 –23 234 493 8 –445 Foreign currencies .......................................................................................................................................................................... –4,128 –12,004 –6,122 –2,975 –3,164 94 1,368 –995
46 U.S. Government assets, other than official reserve assets, net ..................................................................................................... 961 –306 489 87 –756 –796 –338 4,20547 U.S. credits and other long-term assets ........................................................................................................................................ –1,007 –1,174 –2,136 –1,292 –1,871 –2,019 –1,349 –3,17148 Repayments on U.S. credits and other long-term assets 8 .......................................................................................................... 1,965 815 2,657 1,288 1,189 1,209 1,039 7,41949 U.S. foreign currency holdings and U.S. short-term assets, net .................................................................................................. 3 53 –32 91 –74 14 –28 –43
50 U.S. private assets, net ...................................................................................................................................................................... –50,664 4,199 –46,171 –58,688 41,761 –36,779 –45,117 –41,25551 Direct investment ............................................................................................................................................................................ –12,136 –7,686 –8,704 –14,922 –10,391 –4,651 –17,898 –4,24052 Foreign securities ........................................................................................................................................................................... –2,225 –6,192 –9,149 –4,504 –8,580 –11,037 –1,037 –8,11153 U.S. claims on unaffiliated foreigners reported by U.S. nonbanking concerns ........................................................................... –9,293 –5,767 –5,924 –6,662 3,019 –5,069 –15,514 –10,26054 U.S. claims reported by U.S. banks, not included elsewhere ...................................................................................................... –27,010 23,844 –22,394 –32,600 57,713 –16,022 –10,668 –18,644
55 Foreign-owned assets in the United States, net (increase/financial inflow (+)) .......................................................................... 66,666 10,980 74,068 73,215 –22,824 41,215 63,231 59,949
56 Foreign official assets in the United States, net ............................................................................................................................... 7,700 –5,115 13,060 –7,142 –6,421 6,207 13,937 20,18657 U.S. Government securities ........................................................................................................................................................... 5,355 –9,823 12,966 –6,966 –6,698 4,081 12,469 20,39158 U.S. Treasury securities 9 .......................................................................................................................................................... 4,634 –9,726 12,776 –7,535 –6,177 3,735 12,335 19,68359 Other 10 ....................................................................................................................................................................................... 721 –97 190 569 –521 346 134 70860 Other U.S. Government liabilities 11 .............................................................................................................................................. –307 314 –338 492 –195 1,160 –408 1,31061 U.S. liabilities reported by U.S. banks, not included elsewhere .................................................................................................. 2,197 3,823 –211 –833 598 1,240 2,141 –59462 Other foreign official assets 12 ....................................................................................................................................................... 455 572 643 165 –126 –274 –265 –921
63 Other foreign assets in the United States, net .................................................................................................................................. 58,966 16,094 61,008 80,357 –16,403 35,008 49,294 39,76364 Direct investment ............................................................................................................................................................................ 18,584 15,325 11,519 22,846 15,774 13,773 8,313 10,63565 U.S. Treasury securities ................................................................................................................................................................. 9,561 2,489 12,544 5,024 –1,891 1,857 544 –3,04466 U.S. securities other than U.S. Treasury securities ...................................................................................................................... 8,544 9,365 10,270 10,588 1,311 2,114 –2,874 1,04167 U.S. currency .................................................................................................................................................................................. 1,400 2,300 200 2,000 3,600 4,400 5,500 5,30068 U.S. liabilities to unaffiliated foreigners reported by U.S. nonbanking concerns ......................................................................... 6,637 12,000 –1,121 4,570 12,904 6,713 16,838 8,67869 U.S. liabilities reported by U.S. banks, not included elsewhere .................................................................................................. 14,240 –25,385 27,596 35,329 –48,101 6,151 20,973 17,153
70 Statistical discrepancy (sum of above items with sign reversed) ................................................................................................. 14,358 22,710 214 12,324 7,168 15,892 2,779 –63570a Of which seasonal adjustment discrepancy ....................................................................................................................................... 3,455 –432 –8,680 5,658 4,786 1,196 –7,279 1,294
Memoranda:71 Balance on goods (lines 3 and 20) ........................................................................................................................................................ –31,344 –29,983 –27,409 –29,013 –28,384 –26,045 –27,827 –28,77872 Balance on services (lines 4 and 21) .................................................................................................................................................... 5,436 5,869 6,524 6,781 6,843 7,224 7,479 8,63373 Balance on goods and services (lines 2 and 19) ................................................................................................................................. –25,908 –24,114 –20,885 –22,232 –21,541 –18,821 –20,348 –20,14574 Balance on income (lines 12 and 29) .................................................................................................................................................... 4,507 4,246 4,772 6,299 5,928 6,405 5,228 10,98875 Unilateral current transfers, net (line 35) ............................................................................................................................................... –6,048 –5,753 –6,630 –7,739 –6,540 –7,644 –7,339 –5,13376 Balance on current account (lines 1, 18, and 35 or lines 73, 74, and 75) 13 ..................................................................................... –27,449 –25,621 –22,743 –23,672 –22,153 –20,060 –22,459 –14,290
See footnotes on page 66.

July 2001 ● 53
Transactions—Continuedof dollars]
Seasonally adjusted
Line1991 1992 1993 1994
I II III IV I II III IV I II III IV I II III IV
181,195 180,564 181,692 184,112 185,822 186,302 187,644 188,834 190,901 192,641 193,687 199,813 203,793 211,509 222,795 231,233 1
139,048 143,356 146,143 149,798 152,051 151,925 155,389 157,182 158,001 159,646 159,710 165,526 167,281 172,365 179,792 184,455 2
101,157 102,611 104,283 106,032 108,005 107,884 110,851 112,891 112,053 113,202 112,985 118,703 118,782 122,210 128,946 132,921 3
37,891 40,745 41,860 43,766 44,046 44,041 44,538 44,291 45,948 46,444 46,725 46,823 48,499 50,155 50,846 51,534 42,689 2,748 2,586 3,112 3,399 3,005 3,158 2,824 3,690 3,419 3,626 2,736 2,860 3,244 3,714 2,969 5
10,529 12,064 12,533 13,260 13,619 13,716 13,562 13,845 14,204 14,469 14,486 14,716 14,399 14,714 14,493 14,810 63,352 3,964 4,212 4,328 4,152 4,157 4,141 4,168 4,106 4,115 4,207 4,100 4,176 4,280 4,292 4,251 75,480 5,579 5,734 5,837 5,376 5,365 5,352 5,436 5,493 5,517 5,391 5,557 5,496 5,873 6,046 6,339 8
4,348 4,366 4,436 4,668 5,153 5,203 5,295 5,192 5,257 5,504 5,376 5,557 6,541 6,655 6,668 6,849 911,293 11,879 12,146 12,429 1612,216 12,323 12,731 12,687 12,994 13,134 13,414 13,989 14,776 15,239 15,407 16,056 10
200 145 213 132 131 272 299 139 204 286 225 168 251 150 226 260 11
42,147 37,208 35,549 34,314 33,771 34,377 32,255 31,652 32,900 32,995 33,977 34,287 36,512 39,144 43,003 46,778 1241,829 36,889 35,224 33,986 33,433 34,031 31,892 31,274 32,560 32,645 33,612 33,908 36,146 38,769 42,610 46,369 1316,541 14,552 13,459 14,169 14,714 15,548 14,263 13,013 16,199 16,739 17,158 17,150 17,799 18,176 20,207 21,160 1422,679 20,486 19,821 18,200 17,083 16,678 15,771 16,445 15,040 14,575 15,124 15,614 17,301 19,605 21,437 24,080 15
2,609 1,851 1,944 1,617 1,636 1,805 1,858 1,816 1,321 1,331 1,330 1,144 1,046 988 966 1,129 16318 319 325 328 338 346 363 378 340 350 365 379 366 375 393 409 17
–184,921 –182,176 –183,523 –183,948 –183,681 –190,411 –191,986 –196,029 –196,141 –204,858 –205,631 –215,303 –219,175 –231,549 –244,408 –254,181 18
–150,881 –150,244 –152,371 –155,984 –156,059 –162,031 –164,996 –169,919 –170,713 –177,699 –178,894 –184,370 –187,708 –196,451 –205,217 –211,194 19
–121,080 –120,584 –123,171 –126,185 –126,756 –132,983 –136,718 –140,071 –141,057 –147,402 –148,361 –152,574 –155,297 –163,784 –171,869 –177,740 20
–29,801 –29,660 –29,200 –29,799 –29,303 –29,048 –28,278 –29,848 –29,656 –30,297 –30,533 –31,796 –32,411 –32,667 –33,348 –33,454 21–5,169 –3,933 –3,597 –3,710 –3,714 –3,438 –3,309 –3,374 –3,177 –3,194 –2,919 –2,797 –2,695 –2,669 –2,487 –2,366 22
–8,434 –9,065 –8,816 –9,007 –9,475 –9,575 –9,644 –9,858 –9,830 –9,827 –10,045 –11,011 –10,879 –10,882 –11,045 –10,976 23–2,298 –2,527 –2,516 –2,672 –2,626 –2,579 –2,629 –2,769 –2,716 –2,754 –2,906 –3,034 –3,179 –3,227 –3,348 –3,308 24–6,122 –6,262 –6,352 –6,239 –5,902 –5,794 –6,074 –5,999 –6,030 –6,215 –6,076 –6,203 –6,174 –6,439 –6,776 –6,629 25
–916 –1,033 –1,061 –1,025 –1,392 –1,137 –1,497 –1,134 –1,143 –1,258 –1,300 –1,331 –1,612 –1,312 –1,421 –1,508 26–6,390 –6,351 –6,240 –6,609 16–5,703 –5,909 –4,541 –6,142 –6,185 –6,493 –6,686 –6,897 –7,242 –7,500 –7,592 –8,054 27
–472 –489 –618 –537 –491 –616 –584 –572 –575 –556 –601 –523 –630 –638 –679 –613 28
–34,040 –31,932 –31,152 –27,964 –27,622 –28,380 –26,990 –26,110 –25,428 –27,159 –26,737 –30,933 –31,467 –35,098 –39,191 –42,987 29–33,141 –30,951 –30,129 –26,838 –26,445 –27,194 –25,816 –24,894 –24,218 –25,888 –25,454 –29,564 –30,024 –33,604 –37,695 –41,469 30
858 203 –69 1,273 679 –1,220 –1,040 –608 –33 –2,375 –1,614 –3,922 –3,806 –4,913 –6,330 –7,101 31–23,549 –20,934 –19,794 –18,175 –17,333 –16,152 –14,996 –14,598 –14,483 –13,826 –13,878 –15,617 –16,032 –18,112 –20,225 –22,081 32–10,450 –10,220 –10,266 –9,936 –9,791 –9,822 –9,780 –9,688 –9,702 –9,687 –9,962 –10,025 –10,186 –10,579 –11,140 –12,287 33
–899 –981 –1,023 –1,126 –1,177 –1,186 –1,174 –1,216 –1,210 –1,271 –1,283 –1,369 –1,443 –1,494 –1,496 –1,518 34
15,004 3,780 –2,812 –5,224 –7,545 –8,418 –7,837 –11,214 –7,905 –8,576 –9,339 –11,816 –7,971 –8,482 –9,610 –12,194 3519,444 8,285 1,730 –267 –3,040 –3,532 –3,161 –6,586 –3,007 –3,468 –4,097 –6,463 –2,488 –2,946 –3,323 –6,221 36
–869 –877 –880 –1,150 –907 –1,197 –1,021 –919 –904 –1,068 –1,071 –1,061 –964 –974 –1,555 –1,063 37–3,571 –3,628 –3,662 –3,807 –3,598 –3,689 –3,655 –3,709 –3,994 –4,040 –4,171 –4,292 –4,519 –4,562 –4,732 –4,910 38
–941 73 –3,786 175 152 111 173 176 –459 147 83 141 152 –704 –70 153 39
–10,570 745 –15,900 –38,664 –11,428 –16,235 –13,570 –33,177 –21,491 –45,843 –52,975 –80,243 –39,740 –43,072 –30,985 –62,261 40
–353 1,014 3,877 1,225 –1,057 1,464 1,952 1,542 –983 822 –545 –673 –59 3,537 –165 2,033 41................... ................... ................... ................... ................... ................... ................... ................... ................... ................... ................... ................... ................... ................... ................... ................... 42
31 –190 6 –23 –172 –168 –173 2,829 –140 –166 –118 –113 –101 –108 –111 –121 43–341 72 –114 17 111 1 –118 –2,685 –228 313 –48 –80 –3 251 273 –27 44
–43 1,132 3,986 1,232 –996 1,631 2,243 1,398 –615 675 –378 –480 45 3,394 –327 2,181 45
549 –423 3,256 –459 –259 –302 –392 –715 487 –304 –194 –340 399 477 –323 –943 46–2,018 –1,061 –8,724 –1,077 –1,517 –1,247 –1,980 –2,664 –945 –773 –1,668 –2,925 –757 –1,006 –1,372 –2,248 47
2,630 840 12,417 890 1,326 1,084 1,359 2,038 1,763 891 2,036 1,580 1,120 1,648 1,383 937 48–63 –202 –437 –272 –68 –139 229 –89 –331 –422 –562 1,005 36 –165 –334 368 49
–10,766 154 –23,034 –39,431 –10,112 –17,397 –15,130 –34,004 –20,995 –46,361 –52,237 –79,230 –40,080 –47,086 –30,497 –63,351 50–14,318 –1,230 –9,356 –12,987 –20,695 –10,268 –5,157 –12,145 –14,982 –23,264 –13,155 –32,550 –28,554 –14,932 –17,316 –19,367 51
–9,960 –12,021 –12,550 –11,142 –8,668 –8,196 –13,059 –19,243 –28,208 –29,833 –51,940 –36,272 –19,540 –9,229 –12,405 –19,135 52–40 7,902 3,341 –106 7,562 –6,620 –3,737 2,408 –6,130 –725 5,896 1,725 –2,215 –20,966 –960 –12,195 53
13,552 5,503 –4,469 –15,196 11,689 7,687 6,823 –5,024 28,325 7,461 6,962 –12,133 10,229 –1,959 184 –12,654 54
8,347 12,678 33,236 56,549 31,079 50,304 35,469 53,809 25,099 59,038 85,694 112,210 90,280 56,842 81,934 76,933 55
5,569 –4,914 3,854 12,879 20,988 20,879 –7,524 6,133 10,937 17,466 19,073 24,277 10,568 9,455 19,358 202 56126 –3,764 6,095 13,690 15,380 12,950 593 –6,520 1,745 6,750 20,443 24,076 1,074 8,282 18,697 8,774 57155 –3,545 5,621 12,615 14,916 11,251 –319 –7,394 1,080 5,668 19,098 23,106 897 5,922 16,475 7,456 58–29 –219 474 1,075 464 1,699 912 874 665 1,082 1,345 970 177 2,360 2,222 1,318 59769 253 771 –426 –73 518 607 1,138 –469 132 932 718 659 –5 284 626 60
3,908 –1,517 –3,107 –768 5,568 7,486 –7,724 11,241 8,257 9,485 –2,486 –415 9,588 2,143 1,177 –9,243 61766 115 95 383 113 –75 –1,000 274 1,404 1,099 184 –102 –753 –965 –800 45 62
2,778 17,591 29,382 43,670 10,091 29,425 42,993 47,676 14,162 41,572 66,621 87,933 79,712 47,387 62,576 76,731 634,076 13,378 –1,354 7,072 2,086 5,916 2,898 8,922 8,060 11,386 11,688 20,229 5,883 5,767 13,709 20,762 644,739 13,461 –1,196 1,822 686 10,231 4,908 21,306 13,363 –292 3,258 8,052 9,912 –7,098 5,661 25,799 655,023 14,872 10,310 4,939 4,569 10,467 2,531 12,476 9,694 15,205 17,782 37,411 21,070 12,352 13,389 10,160 664,800 2,200 4,200 4,200 1,300 1,100 6,100 4,900 3,000 5,900 6,400 3,600 5,500 6,300 4,700 6,900 67–586 –2,549 4,761 –4,741 5,689 3,954 4,854 –924 –215 6,531 288 3,885 5,856 4,269 –1,620 –7,203 68
–15,274 –23,771 12,661 30,378 –4,239 –2,243 21,702 996 –19,740 2,842 27,205 14,756 31,491 25,797 26,737 20,313 69
–8,114 –15,664 –8,907 –13,000 –14,399 –21,653 –9,893 –2,399 9,996 7,451 –11,519 –4,802 –27,339 15,456 –19,656 20,317 705,301 1,153 –7,798 1,347 4,929 1,109 –7,843 1,811 5,253 803 –7,102 1,049 3,996 697 –8,326 3,631 70a
–19,923 –17,973 –18,888 –20,153 –18,751 –25,099 –25,867 –27,180 –29,004 –34,200 –35,376 –33,871 –36,515 –41,574 –42,923 –44,819 718,090 11,085 12,660 13,967 14,743 14,993 16,260 14,443 16,292 16,147 16,192 15,027 16,088 17,488 17,498 18,080 72
–11,833 –6,888 –6,228 –6,186 –4,008 –10,106 –9,607 –12,737 –12,712 –18,053 –19,184 –18,844 –20,427 –24,086 –25,425 –26,739 738,107 5,276 4,397 6,350 6,149 5,997 5,265 5,542 7,472 5,836 7,240 3,354 5,045 4,046 3,812 3,791 74
15,004 3,780 –2,812 –5,224 –7,545 –8,418 –7,837 –11,214 –7,905 –8,576 –9,339 –11,816 –7,971 –8,482 –9,610 –12,194 7511,278 2,168 –4,643 –5,060 –5,404 –12,527 –12,179 –18,409 –13,145 –20,793 –21,283 –27,306 –23,353 –28,522 –31,223 –35,142 76

54 ● July 2001
Table 1.—U.S. International[Millions
Line (Credits +; debits –) 1
Seasonally adjusted
1995 1996 1997
I II III IV I II III IV I II III IV
Current account1 Exports of goods and services and income receipts .................................. 241,599 249,063 255,633 259,636 262,927 266,859 267,240 280,934 287,373 300,459 305,114 302,595
2 Exports of goods and services ....................................................................... 190,533 195,617 202,980 205,300 208,041 212,264 210,692 221,119 225,292 234,636 238,143 236,911
3 Goods, balance of payments basis 2 ......................................................... 138,330 142,452 146,547 147,875 150,496 152,791 151,884 156,942 162,626 170,171 173,161 172,408
4 Services 3 ..................................................................................................... 52,203 53,165 56,433 57,425 57,545 59,473 58,808 64,177 62,666 64,465 64,982 64,5035 Transfers under U.S. military agency sales contracts 4 ........................ 3,407 3,502 4,041 3,693 3,610 3,902 4,341 4,593 3,876 4,672 4,304 3,823
6 Travel ....................................................................................................... 14,863 15,041 16,357 17,133 16,814 17,722 16,194 19,079 18,351 18,276 18,595 18,2047 Passenger fares ...................................................................................... 4,538 4,500 4,869 5,001 5,015 5,075 4,900 5,432 5,184 5,179 5,234 5,2718 Other transportation ................................................................................ 6,295 6,561 6,528 6,697 6,263 6,490 6,438 6,882 6,701 6,761 6,691 6,855
9 Royalties and license fees 5 ................................................................... 7,219 7,429 7,822 7,819 7,911 7,898 8,198 8,463 8,236 8,358 8,385 8,25010 Other private services 5 .......................................................................... 15,679 15,974 16,554 16,886 17,607 18,193 18,511 19,544 20,058 21,009 21,529 21,85911 U.S. Government miscellaneous services ............................................. 202 158 262 196 325 193 226 184 260 210 244 241
12 Income receipts ............................................................................................... 51,066 53,446 52,653 54,336 54,886 54,595 56,548 59,815 62,081 65,823 66,971 65,68413 Income receipts on U.S.-owned assets abroad ......................................... 50,627 53,006 52,211 53,896 54,447 54,157 56,108 59,376 61,630 65,373 66,520 65,23414 Direct investment receipts ...................................................................... 22,577 24,412 23,502 24,769 24,915 24,563 25,183 27,840 28,426 29,801 30,187 26,91015 Other private receipts ............................................................................. 26,855 27,225 27,677 28,011 28,264 28,487 29,646 30,597 32,342 34,606 35,452 37,47416 U.S. Government receipts ...................................................................... 1,195 1,369 1,032 1,116 1,268 1,107 1,279 939 862 966 881 85017 Compensation of employees ...................................................................... 439 440 442 440 439 438 440 439 451 450 451 450
18 Imports of goods and services and income payments ................................ –263,058 –272,905 –273,684 –272,130 –277,198 –287,257 –294,437 –299,931 –312,810 –321,005 –328,883 –331,858
19 Imports of goods and services ....................................................................... –217,363 –225,806 –223,904 –223,750 –229,830 –237,952 –241,481 –244,701 –252,944 –258,830 –263,923 –267,051
20 Goods, balance of payments basis 2 ......................................................... –182,830 –190,570 –188,239 –187,735 –193,142 –200,825 –203,103 –206,043 –212,725 –218,027 –221,656 –224,077
21 Services 3 ..................................................................................................... –34,533 –35,236 –35,665 –36,015 –36,688 –37,127 –38,378 –38,658 –40,219 –40,803 –42,267 –42,97422 Direct defense expenditures ................................................................... –2,572 –2,447 –2,446 –2,578 –2,745 –2,691 –2,811 –2,814 –2,855 –2,737 –2,961 –3,154
23 Travel ....................................................................................................... –10,982 –11,302 –11,084 –11,550 –11,949 –11,727 –12,140 –12,262 –12,895 –12,840 –13,150 –13,16624 Passenger fares ...................................................................................... –3,404 –3,655 –3,745 –3,861 –3,867 –3,894 –4,002 –4,046 –4,306 –4,629 –4,730 –4,47325 Other transportation ................................................................................ –6,754 –6,781 –6,861 –6,639 –6,526 –6,990 –6,991 –6,895 –7,121 –7,225 –7,113 –7,502
26 Royalties and license fees 5 ................................................................... –1,569 –1,654 –1,773 –1,923 –1,794 –1,812 –2,291 –1,941 –2,208 –2,186 –2,435 –2,33227 Other private services 5 .......................................................................... –8,560 –8,761 –9,094 –8,831 –9,149 –9,356 –9,451 –10,020 –10,168 –10,490 –11,156 –11,66928 U.S. Government miscellaneous services ............................................. –692 –636 –662 –633 –658 –657 –692 –680 –666 –696 –722 –678
29 Income payments ............................................................................................ –45,695 –47,099 –49,780 –48,380 –47,368 –49,305 –52,956 –55,230 –59,866 –62,175 –64,960 –64,80730 Income payments on foreign-owned assets in the United States ............ –44,144 –45,538 –48,219 –46,791 –45,858 –47,745 –51,386 –53,570 –58,260 –60,525 –63,278 –63,08031 Direct investment payments ................................................................... –6,930 –7,041 –8,954 –7,393 –7,318 –8,022 –8,859 –8,894 –11,105 –10,604 –11,584 –9,65832 Other private payments .......................................................................... –23,914 –24,391 –24,413 –24,286 –23,389 –23,900 –24,876 –25,661 –26,846 –27,887 –28,840 –30,56933 U.S. Government payments ................................................................... –13,300 –14,106 –14,852 –15,112 –15,151 –15,823 –17,651 –19,015 –20,309 –22,034 –22,854 –22,85334 Compensation of employees ...................................................................... –1,551 –1,561 –1,561 –1,589 –1,510 –1,560 –1,570 –1,660 –1,606 –1,650 –1,682 –1,727
35 Unilateral current transfers, net ....................................................................... –8,577 –8,080 –8,460 –8,939 –10,519 –8,744 –8,940 –11,878 –9,054 –9,280 –9,561 –12,90236 U.S. Government grants 4 ............................................................................... –2,964 –2,491 –2,698 –3,037 –4,509 –2,566 –2,780 –5,546 –2,281 –2,308 –2,476 –5,40737 U.S. Government pensions and other transfers ............................................. –762 –980 –973 –736 –1,157 –1,103 –1,111 –1,095 –1,027 –1,071 –1,024 –1,06938 Private remittances and other transfers 6 ....................................................... –4,851 –4,609 –4,789 –5,166 –4,853 –5,075 –5,049 –5,237 –5,746 –5,901 –6,061 –6,426
Capital and financial accountCapital account
39 Capital account transactions, net .................................................................... 146 272 –299 253 156 173 178 186 138 68 41 103
Financial account40 U.S.-owned assets abroad, net (increase/financial outflow (–)) .................. –64,950 –117,959 –46,759 –122,706 –80,936 –68,512 –91,675 –172,797 –152,213 –93,616 –119,283 –122,489
41 U.S. official reserve assets, net ...................................................................... –5,318 –2,722 –1,893 191 17 –523 7,489 –315 4,480 –236 –730 –4,52442 Gold 7 ........................................................................................................... ................ ................ ................ ................ ................ ................ ................ ................ ................ ................ ................ ....................43 Special drawing rights ................................................................................. –867 –156 362 –147 –199 –133 848 –146 72 –133 –139 –15044 Reserve position in the International Monetary Fund ................................ –526 –786 –991 –163 –849 –220 –183 –28 1,055 54 –463 –4,22145 Foreign currencies ....................................................................................... –3,925 –1,780 –1,264 501 1,065 –170 6,824 –141 3,353 –157 –128 –153
46 U.S. Government assets, other than official reserve assets, net .................. –553 –225 252 –458 –210 –568 105 –316 –76 –298 377 6547 U.S. credits and other long-term assets .................................................... –1,622 –862 –1,028 –1,347 –1,076 –1,512 –1,192 –1,245 –1,170 –1,616 –1,426 –1,20548 Repayments on U.S. credits and other long-term assets 8 ....................... 1,072 649 1,522 882 1,013 683 1,214 1,020 1,119 1,329 1,832 1,15849 U.S. foreign currency holdings and U.S. short-term assets, net .............. –3 –12 –242 7 –147 261 83 –91 –25 –11 –29 112
50 U.S. private assets, net ................................................................................... –59,079 –115,012 –45,118 –122,439 –80,743 –67,421 –99,269 –172,166 –156,617 –93,082 –118,930 –118,03051 Direct investment ......................................................................................... –19,325 –15,078 –21,772 –42,573 –23,759 –15,096 –23,129 –29,898 –29,544 –24,883 –21,217 –29,16152 Foreign securities ........................................................................................ –8,775 –27,834 –41,564 –44,333 –44,043 –30,968 –33,273 –41,545 –23,836 –31,739 –51,297 –12,10453 U.S. claims on unaffiliated foreigners reported by U.S. nonbanking
concerns .................................................................................................. –2,631 –24,580 13,729 –31,804 –15,210 –22,000 –9,090 –40,033 –38,112 –9,885 –22,173 –51,59054 U.S. claims reported by U.S. banks, not included elsewhere .................. –28,348 –47,520 4,489 –3,729 2,269 643 –33,777 –60,690 –65,125 –26,575 –24,243 –25,175
55 Foreign-owned assets in the United States, net (increase/financial inflow(+)) .................................................................................................................... 103,250 128,905 124,277 109,252 96,284 109,893 151,501 228,359 183,876 153,354 181,810 240,248
56 Foreign official assets in the United States, net ............................................ 21,956 37,072 39,302 11,550 51,771 13,503 23,020 38,430 27,763 –6,019 23,474 –26,18257 U.S. Government securities ........................................................................ 11,258 26,560 21,116 13,778 55,839 –1,934 26,135 40,639 23,105 –11,411 10,316 –24,17158 U.S. Treasury securities 9 ....................................................................... 10,132 25,234 20,598 13,013 55,685 –3,378 24,908 38,456 22,351 –12,373 7,604 –24,27259 Other 10 ................................................................................................... 1,126 1,326 518 765 154 1,444 1,227 2,183 754 962 2,712 10160 Other U.S. Government liabilities 11 ........................................................... –562 54 –504 907 –554 –65 147 –510 –155 –286 –562 12261 U.S. liabilities reported by U.S. banks, not included elsewhere ............... 10,995 7,510 18,918 –3,415 –3,303 14,217 –1,677 –3,533 8,123 4,643 12,817 –3,29762 Other foreign official assets 12 .................................................................... 265 2,948 –228 280 –211 1,285 –1,585 1,834 –3,310 1,035 903 1,164
63 Other foreign assets in the United States, net .............................................. 81,294 91,833 84,975 97,702 44,513 96,390 128,481 189,929 156,113 159,373 158,336 266,43064 Direct investment ......................................................................................... 9,924 11,888 16,764 19,200 28,518 16,184 15,257 26,542 28,626 23,150 17,865 35,96065 U.S. Treasury securities .............................................................................. 30,011 30,439 37,295 1,803 18,031 26,967 38,727 71,271 33,050 37,928 40,133 35,32266 U.S. securities other than U.S. Treasury securities .................................. 15,734 20,606 32,128 27,899 29,391 31,179 35,118 34,552 45,364 54,286 63,131 35,11167 U.S. currency ............................................................................................... 6,400 1,900 1,900 2,100 –2,391 4,542 7,382 7,829 3,484 4,822 6,576 9,90068 U.S. liabilities to unaffiliated foreigners reported by U.S. nonbanking
concerns .................................................................................................. 17,764 11,864 13,493 16,516 4,350 15,259 28,925 5,202 25,055 6,461 25,550 59,45269 U.S. liabilities reported by U.S. banks, not included elsewhere ............... 1,461 15,136 –16,605 30,184 –33,386 2,259 3,072 44,533 20,534 32,726 5,081 90,685
70 Statistical discrepancy (sum of above items with sign reversed) ............. –8,410 20,704 –50,708 34,634 9,286 –12,412 –23,867 –24,873 2,690 –29,980 –29,238 –75,69770a Of which seasonal adjustment discrepancy ................................................... 4,900 37 –7,823 2,888 5,243 –944 –9,323 5,029 5,972 –1,596 –11,412 7,043
Memoranda:71 Balance on goods (lines 3 and 20) .................................................................... –44,500 –48,118 –41,692 –39,860 –42,646 –48,034 –51,219 –49,101 –50,099 –47,856 –48,495 –51,66972 Balance on services (lines 4 and 21) ................................................................. 17,670 17,929 20,768 21,410 20,857 22,346 20,430 25,519 22,447 23,662 22,715 21,52973 Balance on goods and services (lines 2 and 19) .............................................. –26,830 –30,189 –20,924 –18,450 –21,789 –25,688 –30,789 –23,582 –27,652 –24,194 –25,780 –30,14074 Balance on income (lines 12 and 29) ................................................................. 5,371 6,347 2,873 5,956 7,518 5,290 3,592 4,585 2,215 3,648 2,011 87775 Unilateral current transfers, net (line 35) ............................................................ –8,577 –8,080 –8,460 –8,939 –10,519 –8,744 –8,940 –11,878 –9,054 –9,280 –9,561 –12,90276 Balance on current account (lines 1, 18, and 35 or lines 73, 74, and 75) 13 –30,036 –31,922 –26,511 –21,433 –24,790 –29,142 –36,137 –30,875 –34,491 –29,826 –33,330 –42,165
See footnotes on page 66.

July 2001 ● 55
Transactions—Continuedof dollars]
Seasonally adjusted
Line1998 1999 2000 2001
I II III IV I II III IV I II III IV I p
301,933 298,319 291,449 300,229 296,210 302,880 315,099 328,467 339,645 355,075 361,236 362,617 355,905 1
235,743 231,604 228,681 236,664 231,317 234,177 241,593 250,265 257,256 265,822 272,497 270,131 269,297 2
170,998 165,511 164,081 169,826 164,716 166,267 173,045 180,525 185,142 191,558 199,273 196,237 194,942 3
64,745 66,093 64,600 66,838 66,601 67,910 68,548 69,740 72,114 74,264 73,224 73,894 74,355 44,631 4,466 3,993 4,360 4,217 4,526 3,855 3,322 3,401 3,910 3,329 3,420 3,388 5
17,898 18,179 17,284 17,925 18,101 18,339 18,808 19,483 20,448 20,976 20,226 20,392 20,309 64,960 5,179 5,078 4,881 4,839 4,864 5,112 4,970 5,013 5,342 5,213 5,177 4,933 76,385 6,293 6,328 6,599 6,469 6,666 6,707 7,074 7,365 7,619 7,593 7,609 7,357 8
8,574 8,805 8,722 9,524 9,137 9,063 9,097 9,122 9,345 9,525 9,538 9,624 9,883 922,097 22,921 22,988 23,280 23,635 24,229 24,730 25,549 26,338 26,679 27,105 27,447 28,257 10
200 250 207 269 203 223 239 220 204 213 220 225 228 11
66,190 66,715 62,768 63,565 64,893 68,703 73,506 78,202 82,389 89,253 88,739 92,486 86,608 1265,725 66,240 62,278 63,061 64,357 68,154 72,947 77,636 81,814 88,670 88,151 91,891 85,994 1327,471 27,411 23,310 25,644 27,557 29,994 32,469 33,698 34,734 37,591 37,335 39,581 38,349 1437,400 37,908 38,080 36,480 35,889 37,350 39,732 43,206 46,014 49,941 49,971 51,514 46,752 15
854 921 888 937 911 810 746 732 1,066 1,138 845 796 893 16465 475 490 504 536 549 559 566 575 583 588 595 614 17
335,558 –340,566 –341,256 –347,583 –351,607 –368,662 –391,401 –406,437 –432,624 –450,748 –463,461 –462,268 –454,010 18
270,621 –274,076 –274,153 –280,675 –284,189 –297,043 –312,728 –325,233 –344,578 –356,606 –369,837 –370,424 –364,312 19
226,372 –228,721 –228,010 –234,009 –238,709 –250,557 –264,777 –275,944 –292,547 –303,229 –313,884 –314,757 –307,462 20
–44,249 –45,355 –46,143 –46,666 –45,480 –46,486 –47,951 –49,289 –52,031 –53,377 –55,953 –55,667 –56,850 21–2,922 –2,855 –3,186 –3,222 –3,186 –3,306 –3,559 –3,283 –3,262 –3,382 –3,541 –3,375 –3,550 22
–13,770 –14,096 –14,164 –14,479 –14,330 –14,553 –14,763 –15,219 –16,399 –16,123 –16,075 –15,940 –16,176 23–4,650 –4,981 –5,139 –5,201 –5,187 –5,242 –5,346 –5,540 –5,805 –6,146 –6,226 –6,020 –5,994 24–7,404 –7,456 –7,567 –7,937 –7,784 –8,187 –8,952 –9,216 –9,693 –10,097 –10,554 –10,718 –10,527 25
–2,730 –2,659 –2,836 –3,011 –2,946 –3,091 –3,149 –3,428 –3,604 –3,715 –4,535 –4,253 –4,529 26–12,101 –12,641 –12,486 –12,071 –11,357 –11,432 –11,416 –11,913 –12,554 –13,200 –14,298 –14,634 –15,339 27
–672 –667 –765 –745 –690 –675 –766 –690 –714 –714 –724 –727 –735 28
–64,937 –66,490 –67,103 –66,908 –67,418 –71,619 –78,673 –81,204 –88,046 –94,142 –93,624 –91,844 –89,698 29–63,240 –64,784 –65,361 –65,129 –65,654 –69,797 –76,828 –79,323 –86,194 –92,259 –91,771 –89,920 –87,724 30
–8,925 –9,963 –8,862 –9,831 –11,009 –14,249 –16,649 –14,766 –18,369 –19,474 –16,286 –13,878 –15,086 31–31,632 –31,861 –33,722 –32,599 –31,976 –32,393 –36,032 –39,397 –41,751 –45,884 –48,116 –48,714 –45,647 32–22,683 –22,960 –22,777 –22,699 –22,669 –23,155 –24,147 –25,160 –26,074 –26,901 –27,369 –27,328 –26,991 33
–1,697 –1,706 –1,742 –1,779 –1,764 –1,822 –1,845 –1,881 –1,852 –1,883 –1,853 –1,924 –1,974 34
–9,866 –10,154 –10,731 –13,671 –11,051 –11,596 –11,761 –14,504 –11,924 –12,461 –13,080 –16,673 –11,457 35–2,365 –2,209 –2,882 –5,814 –2,574 –3,097 –2,847 –5,256 –2,912 –3,232 –3,634 –7,043 –2,299 36–1,080 –1,094 –1,055 –1,075 –1,066 –1,074 –1,085 –1,181 –1,168 –1,179 –1,183 –1,177 –1,235 37–6,421 –6,851 –6,794 –6,782 –7,411 –7,425 –7,829 –8,067 –7,844 –8,050 –8,263 –8,453 –7,923 38
163 168 164 183 158 167 173 –3,989 173 173 175 184 174 39
–75,937 –139,964 –60,247 –83,486 –43,657 –170,707 –114,931 –107,769 –198,105 –93,573 –107,727 –181,548 –156,937 40
–444 –1,945 –2,025 –2,369 4,068 1,159 1,951 1,569 –554 2,020 –346 –1,410 190 41................... ........................ ........................ ........................ ........................ ........................ ........................ ........................ ........................ ........................ ........................ ........................ ........................ 42
–182 73 189 –227 562 –190 –184 –178 –180 –180 –182 –180 –189 43–85 –1,032 –2,078 –1,924 3 1,413 2,268 1,800 –237 2,328 1,300 –1,083 574 44
–177 –986 –136 –218 3,503 –64 –133 –53 –137 –128 –1,464 –147 –195 45
–80 –483 188 –47 118 –392 –686 3,711 –127 –572 114 –359 68 46–1,192 –1,156 –1,286 –1,044 –1,314 –2,167 –1,595 –1,099 –1,750 –1,368 –1,050 –1,009 –1,061 47
1,134 699 1,336 942 1,554 1,887 1,026 5,093 1,329 855 1,265 808 1,029 48–22 –26 138 55 –122 –112 –117 –283 294 –59 –101 –158 100 49
–75,413 –137,536 –58,410 –81,070 –47,843 –171,474 –116,196 –113,049 –197,424 –95,021 –107,495 –179,779 –157,195 50–41,892 –44,704 –20,428 –35,494 –38,527 –36,474 –49,750 –30,631 –38,388 –33,346 –41,634 –39,070 –33,015 51–20,902 –44,282 6,005 –76,956 975 –71,379 –42,415 –18,398 –27,546 –39,639 –33,129 –24,621 –28,535 52
–7,822 –20,363 –15,658 5,639 –33,328 –27,605 –13,555 –11,212 –75,256 –29,491 –14,585 –44,514 –5,618 53–4,797 –28,187 –28,329 25,741 23,037 –36,016 –10,476 –52,808 –56,234 7,455 –18,147 –71,574 –90,027 54
96,654 173,254 96,248 138,308 130,758 278,047 172,119 232,820 256,782 250,007 222,108 295,321 237,503 55
10,999 –10,230 –46,639 25,922 4,164 –736 12,721 27,402 22,498 6,447 12,247 –3,573 4,091 5613,946 –20,051 –30,917 33,433 6,793 –916 14,798 11,852 24,311 6,334 5,271 –5,240 2,547 5711,336 –20,305 –32,823 31,871 800 –6,708 12,963 5,122 16,204 –4,000 –9,001 –13,436 –1,027 58
2,610 254 1,906 1,562 5,993 5,792 1,835 6,730 8,107 10,334 14,272 8,196 3,574 59–1,027 –755 –280 –1,309 –1,461 –1,064 –671 341 –474 –1,000 –220 –293 –1,244 60
–964 9,744 –12,948 –5,333 –1,273 1,761 –1,617 14,093 –2,270 209 6,884 980 1,785 61–956 832 –2,494 –869 105 –517 211 1,116 931 904 312 980 1,003 62
85,655 183,484 142,887 112,386 126,594 278,783 159,398 205,418 234,284 243,560 209,861 298,894 233,412 6319,567 20,165 23,264 115,213 35,221 151,354 50,803 63,628 36,508 90,394 76,046 84,707 41,638 64–2,535 25,814 918 24,384 –7,325 –5,410 9,687 –17,442 –9,348 –20,546 –12,503 –10,395 538 6576,986 70,566 21,138 49,401 63,430 83,903 95,412 101,218 136,208 94,400 128,393 126,643 147,132 66
746 2,349 7,277 6,250 2,440 3,057 4,697 12,213 –6,847 989 757 6,230 2,311 67
39,833 30,722 14,976 –62,391 46,262 16,799 –8,869 14,883 85,188 24,400 19,078 48,344 42,269 68–48,942 33,868 75,314 –20,471 –13,434 29,080 7,668 30,918 –7,425 53,923 –1,910 43,365 –476 69
22,611 18,943 24,373 6,020 –20,811 –30,129 30,702 –28,588 46,053 –48,473 749 2,367 28,822 706,211 –1,431 –11,256 6,476 6,425 –711 –10,320 4,602 8,501 –2,380 –9,977 3,856 8,945 70a
–55,374 –63,210 –63,929 –64,183 –73,993 –84,290 –91,732 –95,419 –107,405 –111,671 –114,611 –118,520 –112,520 7120,496 20,738 18,457 20,172 21,121 21,424 20,597 20,451 20,083 20,887 17,271 18,227 17,505 72
–34,878 –42,472 –45,472 –44,011 –52,872 –62,866 –71,135 –74,968 –87,322 –90,784 –97,340 –100,293 –95,015 731,253 225 –4,335 –3,343 –2,525 –2,916 –5,167 –3,002 –5,657 –4,889 –4,885 642 –3,090 74
–9,866 –10,154 –10,731 –13,671 –11,051 –11,596 –11,761 –14,504 –11,924 –12,461 –13,080 –16,673 –11,457 75–43,491 –52,401 –60,538 –61,025 –66,448 –77,378 –88,063 –92,474 –104,903 –108,134 –115,305 –116,324 –109,562 76

56 ● July 2001
Table 2.—U.S. Trade[Millions
Line 1987 1988 1989 1990 1991 1992 1993 1994 1995 1996 1997 1998 1999 2000
A Balance of payments adjustments to Census trade data:
EXPORTS
1 Exports of goods, Census basis 1 including reexports andincluding military grant shipments ....................................... 253,904 323,335 362,999 392,967 421,851 448,171 464,858 512,626 584,741 625,075 689,182 682,138 695,797 781,918
Adjustments:
2 Private gift parcel remittances ................................................... 257 253 683 913 1,046 1,224 1,181 866 779 751 685 648 646 5973 Gold exports, nonmonetary ....................................................... 718 593 544 740 225 398 ................ 88 38 264 22 ................ 27 ....................4 Inland U.S. freight to Canada ................................................... 1,607 1,845 1,980 ................ ................ ................ ................ ................ ................ ................ ................ ................ ................ ....................5 U.S.–Canadian reconciliation adjustments, n.e.c., net 2 ........... ................ ................ ................ ................ ................ ................ ................ ................ ................ ................ ................ ................ ................ ....................6 Exports transferred under U.S. military agency sales
contracts identified in Census documents 3 ......................... –5,686 –5,221 –6,109 –7,137 –7,943 –8,531 –7,830 –8,922 –9,278 –12,354 –10,494 –10,855 –9,966 –7,8827 Other adjustments, net 4 ............................................................ –592 –575 –181 –82 –1,096 –1,631 –1,267 –1,799 –1,076 –1,623 –1,030 –1,515 –1,951 –2,423
8 Equals: Exports of goods, adjusted to balance of paymentsbasis excluding ‘‘military’’ (table 1, line 3) .......................... 250,208 320,230 359,916 387,401 414,083 439,631 456,943 502,859 575,204 612,113 678,366 670,416 684,553 772,210
IMPORTS
9 Imports of goods, Census basis 1 (general imports) .............. 406,283 441,926 473,385 495,269 487,128 532,665 580,526 663,256 743,543 795,289 869,704 911,896 1,024,618 1,218,022
Adjustments:
10 Electric energy ........................................................................... 986 826 81 85 84 85 84 84 78 72 1 3 5 411 Gold imports, nonmonetary ....................................................... 2,133 3,577 2,134 1,348 949 1,887 6,775 2,752 3,066 4,948 3,536 2,907 2,727 3,21312 Inland freight in Canada ............................................................ 1,830 2,120 2,120 2,263 2,525 2,809 2,768 3,129 3,358 3,597 3,705 3,572 3,654 3,92913 U.S.–Canadian reconciliation adjustment, n.e.c., net 2 ............ ................ ................ ................ ................ ................ ................ ................ ................ ................ ................ ................ ................ ................ ....................14 Imports of U.S. military agencies identified in Census
documents 3 ........................................................................... –1,330 –1,686 –1,086 –1,050 –936 –871 –704 –546 –683 –751 –451 –1,218 –931 –74315 Other adjustments, net 5 6 ......................................................... –137 426 1,031 520 1,270 –46 –55 15 12 –43 –10 –48 –86 –8
16 Equals: Imports of goods, adjusted to balance of paymentsbasis, excluding ‘‘military’’ (table 1, line 20) ....................... 409,765 447,189 477,665 498,435 491,020 536,528 589,394 668,690 749,374 803,113 876,485 917,112 1,029,987 1,224,417
B Trade in goods, by area and country, adjusted to balanceof payments basis, excluding military: 7
EXPORTS
1 Total, all countries (A–8) ............................................................. 250,208 320,230 359,916 387,401 414,083 439,631 456,943 502,859 575,204 612,113 678,366 670,416 684,553 772,210
2 Western Europe ......................................................................... 68,582 86,409 98,052 110,478 115,856 114,638 111,284 115,418 132,505 136,902 152,410 159,320 162,770 178,7933 European Union ..................................................................... 59,504 74,464 84,303 95,604 100,581 100,679 95,205 100,672 121,728 124,825 138,489 146,297 149,083 162,5834 Belgium and Luxembourg ................................................. 6,143 7,385 8,394 10,303 10,625 9,871 9,293 11,017 12,823 12,681 13,993 14,410 13,265 14,2665 France ............................................................................... 7,947 9,913 11,509 13,428 15,123 14,433 13,109 13,499 14,117 14,374 15,859 17,510 18,584 20,2006 Germany 8 ......................................................................... 11,525 14,252 16,347 18,201 20,557 20,510 18,465 18,745 21,914 22,884 23,811 26,171 26,364 28,9237 Italy .................................................................................... 5,465 6,670 7,115 7,871 8,491 8,619 6,362 7,030 8,753 8,687 8,916 8,922 9,878 10,9518 Netherlands ....................................................................... 8,026 9,714 11,240 12,819 13,368 13,522 12,760 13,464 16,388 16,566 19,817 18,878 19,311 21,7179 United Kingdom ................................................................. 13,749 18,064 20,398 22,731 21,284 22,458 25,859 26,244 28,229 30,448 35,763 38,385 37,659 40,727
10 Other .................................................................................. 6,649 8,466 9,300 10,251 11,133 11,266 9,357 10,673 19,504 19,185 20,330 22,021 24,022 25,79911 Western Europe, excluding EU ............................................ 9,078 11,945 13,749 14,874 15,275 13,959 16,079 14,746 10,777 12,077 13,921 13,023 13,687 16,210
12 Canada 2 .................................................................................... 62,009 74,290 79,888 83,359 85,678 91,103 100,702 114,650 127,388 134,288 151,899 156,735 166,727 178,98713 Japan .......................................................................................... 27,630 37,185 43,996 48,005 47,327 46,961 47,020 52,433 63,619 66,476 64,384 56,477 56,074 63,57614 Australia, New Zealand, and South Africa 9 ............................. ................ ................ ................ ................ ................ ................ ................ ................ ................ ................ ................ ................ ................ ....................15 Australia ................................................................................. 5,289 6,809 8,107 8,232 8,092 8,622 8,073 9,564 10,491 11,748 11,744 11,604 11,540 12,189
16 Eastern Europe .......................................................................... 2,259 3,805 5,363 4,188 4,719 5,223 6,181 5,324 5,717 7,286 7,887 7,441 5,891 5,925
17 Latin America and Other Western Hemisphere ....................... 34,949 43,659 48,793 54,288 63,257 75,419 78,448 92,203 96,218 109,308 135,248 142,195 141,650 170,26218 Brazil ...................................................................................... 4,084 4,244 4,793 5,005 6,106 5,701 6,007 8,065 11,394 12,674 15,877 15,085 13,118 15,25719 Mexico .................................................................................... 14,551 20,583 24,663 28,093 33,104 40,409 41,484 50,635 46,173 56,715 71,218 78,623 86,761 111,17120 Venezuela .............................................................................. 3,530 4,532 2,991 3,071 4,640 5,415 4,574 4,020 4,641 4,693 6,569 6,483 5,314 5,50821 Other ...................................................................................... 12,784 14,300 16,346 18,119 19,407 23,894 26,383 29,483 34,010 35,226 41,584 42,004 36,457 38,326
22 Other countries in Asia and Africa 7 9 ....................................... 49,490 68,021 75,544 78,293 88,764 97,577 105,012 113,178 139,266 146,103 154,794 136,568 139,901 162,47723 Asia 7 9 ................................................................................... 43,685 60,514 67,629 70,240 80,101 88,047 96,166 104,308 129,255 135,185 143,826 125,550 129,622 151,99824 Members of OPEC ............................................................ 5,780 7,399 8,226 7,773 10,820 12,452 11,853 10,457 11,329 12,778 15,600 14,979 11,911 10,51925 China ................................................................................. 3,507 5,100 5,776 4,784 6,259 7,389 8,691 9,223 11,748 11,935 12,823 14,196 13,055 16,13826 Hong Kong ........................................................................ 3,975 5,665 6,232 6,749 8,069 8,987 9,800 11,404 14,199 13,864 15,076 12,860 12,565 14,51027 Korea, Republic of ............................................................ 7,647 10,637 13,190 13,943 14,995 14,116 14,286 17,253 24,178 25,913 24,260 15,648 22,256 27,15028 Singapore .......................................................................... 4,048 5,757 7,193 7,851 8,598 9,386 11,350 12,857 15,206 16,576 17,500 15,413 16,010 17,62129 Taiwan ............................................................................... 7,097 12,066 11,011 11,061 12,464 14,711 15,438 16,195 18,254 17,708 18,888 17,018 17,486 23,83330 Africa 7 9 ................................................................................. 5,596 7,183 7,549 7,764 8,224 9,012 8,409 8,461 9,727 10,486 10,580 10,588 9,491 10,11531 Members of OPEC ............................................................ 783 1,170 1,337 1,623 1,697 1,807 1,892 1,820 1,435 1,753 1,527 1,471 1,092 1,598
32 International organizations and unallocated ............................. ................ 52 173 558 390 88 223 89 ................ 2 ................ 76 ................ 1
Memoranda:33 Industrial countries 7 ....................................................................... 165,613 207,317 232,799 252,924 260,059 265,048 270,511 295,724 338,476 354,276 385,401 389,619 401,584 438,56734 Of which: Euro area 10 .............................................................. ................ ................ ................ ................ ................ ................ ................ ................ ................ ................ ................ ................ 104,692 115,02635 Members of OPEC 7 ...................................................................... 10,714 13,777 13,189 13,141 18,105 20,666 18,319 16,297 17,405 19,224 23,696 22,933 18,317 17,62536 Other countries 7 ............................................................................ 73,881 99,084 113,755 120,778 135,529 153,829 167,890 190,749 219,323 238,611 269,269 257,788 264,652 316,017
See footnotes on page 66.

July 2001 ● 57
in Goodsof dollars]
Not seasonally adjusted Seasonally adjusted
Line1999 2000 2001 1999 2000 2001
I II III IV I II III IV I p I II III IV I II III IV I p
166,604 171,596 169,868 187,729 187,806 195,978 195,675 202,459 196,041 167,955 169,419 175,772 182,651 187,942 193,838 201,460 198,678 197,282 1
152 165 157 172 141 152 144 160 130 152 165 157 172 141 152 144 160 130 227 ................ ................ ................ ................ ................ ................ ................ ................ 27 ................ ................ ................ ................ ................ ................ ................ ................ 3
.................... ................ ................ ................ ................ ................ ................ ................ ................ ................ ................ ................ ................ ................ ................ ................ ................ ................ 4
.................... ................ ................ ................ ................ ................ ................ ................ ................ ................ ................ ................ ................ ................ ................ ................ ................ ................ 5
–2,824 –2,683 –2,331 –2,128 –2,397 –1,861 –1,690 –1,934 –1,764 –2,824 –2,683 –2,331 –2,128 –2,397 –1,861 –1,690 –1,934 –1,764 6–593 –635 –553 –170 –544 –571 –641 –667 –706 –593 –635 –553 –170 –544 –571 –641 –667 –706 7
163,366 168,443 167,141 185,603 185,006 193,698 193,488 200,018 193,701 164,716 166,267 173,045 180,525 185,142 191,558 199,273 196,237 194,942 8
229,688 248,825 266,768 279,337 282,120 300,735 316,508 318,659 295,814 238,075 249,772 263,020 273,751 290,166 302,236 312,671 312,949 305,689 9
1 1 2 1 ................ 2 ................ 2 1 1 1 2 1 ................ 2 ................ 2 1 10.................... 112 1,083 1,532 1,535 161 439 1,078 1,012 ................ 112 1,083 1,532 1,535 161 439 1,078 1,012 11
907 926 888 933 999 1,006 960 964 952 907 926 888 933 999 1,006 960 964 952 12.................... ................ ................ ................ ................ ................ ................ ................ ................ ................ ................ ................ ................ ................ ................ ................ ................ ................ 13
–238 –232 –201 –260 –155 –180 –175 –233 –178 –238 –232 –201 –260 –155 –180 –175 –233 –178 14–36 –22 –15 –13 2 3 –11 –2 –13 –36 –22 –15 –13 2 3 –11 –2 –13 15
230,322 249,610 268,525 281,530 284,501 301,727 317,721 320,468 297,588 238,709 250,557 264,777 275,944 292,547 303,229 313,884 314,757 307,462 16
163,366 168,443 167,141 185,603 185,006 193,698 193,488 200,018 193,701 164,716 166,267 173,045 180,525 185,142 191,558 199,273 196,237 194,942 1
41,117 40,338 37,867 43,448 44,135 44,846 42,620 47,192 47,894 41,512 39,750 39,161 42,347 44,269 44,275 43,807 46,442 48,288 238,370 36,941 34,567 39,205 39,240 40,872 39,245 43,226 43,062 38,740 36,394 35,743 38,206 39,335 40,350 40,340 42,558 43,451 3
3,480 3,198 3,172 3,415 3,371 3,462 3,584 3,849 3,627 3,496 3,155 3,281 3,333 3,369 3,419 3,690 3,788 3,656 44,990 4,674 4,003 4,917 4,921 4,975 4,737 5,567 5,614 5,057 4,595 4,132 4,800 4,939 4,902 4,864 5,495 5,664 56,833 6,487 6,028 7,016 7,040 7,459 6,969 7,455 8,257 6,869 6,400 6,244 6,851 7,035 7,371 7,169 7,348 8,344 62,252 2,542 2,245 2,839 2,542 2,575 3,092 2,742 2,754 2,275 2,507 2,332 2,764 2,546 2,544 3,167 2,694 2,778 74,741 4,680 4,674 5,216 5,222 5,272 5,291 5,932 5,516 4,786 4,622 4,829 5,074 5,229 5,214 5,450 5,824 5,558 89,790 9,440 9,129 9,300 10,074 10,086 9,529 11,038 10,358 9,910 9,274 9,425 9,050 10,124 9,941 9,785 10,877 10,466 96,284 5,920 5,316 6,502 6,070 7,043 6,043 6,643 6,936 6,347 5,841 5,500 6,334 6,093 6,959 6,215 6,532 6,985 102,747 3,397 3,300 4,243 4,895 3,974 3,375 3,966 4,832 2,772 3,356 3,418 4,141 4,934 3,925 3,467 3,884 4,837 11
40,201 42,883 39,779 43,864 45,665 46,698 42,343 44,281 42,649 40,545 42,315 41,089 42,778 45,743 46,187 43,524 43,533 42,942 1214,377 13,259 13,501 14,937 15,369 15,499 15,965 16,743 16,062 14,444 13,164 14,042 14,424 15,285 15,421 16,521 16,349 16,102 13
.................... ................ ................ ................ ................ ................ ................ ................ ................ ................ ................ ................ ................ ................ ................ ................ ................ ................ 142,494 2,739 2,915 3,392 2,971 3,268 3,010 2,940 2,704 2,524 2,698 3,010 3,308 2,987 3,218 3,094 2,890 2,730 15
1,208 1,409 1,759 1,515 1,441 1,329 1,514 1,641 1,694 1,203 1,408 1,826 1,454 1,454 1,318 1,559 1,594 1,698 16
32,357 33,954 35,709 39,630 39,563 42,146 44,480 44,073 41,410 32,649 33,501 36,964 38,536 39,577 41,662 45,801 43,222 41,736 172,982 3,210 3,320 3,606 3,191 3,664 4,229 4,173 3,844 3,028 3,151 3,425 3,514 3,203 3,603 4,342 4,109 3,878 18
18,911 20,326 22,372 25,152 26,031 27,558 29,230 28,352 26,743 19,076 20,052 23,150 24,483 26,048 27,235 30,090 27,798 26,972 191,440 1,274 1,375 1,225 1,259 1,408 1,377 1,464 1,399 1,446 1,253 1,431 1,184 1,255 1,395 1,417 1,441 1,406 209,024 9,144 8,642 9,647 9,082 9,516 9,644 10,084 9,423 9,099 9,045 8,958 9,355 9,071 9,429 9,952 9,874 9,480 21
31,612 33,861 35,611 38,817 35,862 39,911 43,556 43,148 41,288 31,839 33,431 36,953 37,678 35,827 39,476 44,967 42,207 41,446 2229,281 31,320 33,174 35,847 33,636 37,280 40,763 40,319 38,252 29,502 30,901 34,406 34,813 33,604 36,862 42,060 39,472 38,411 23
2,783 2,487 2,237 4,404 2,232 2,340 2,737 3,210 3,324 2,793 2,470 2,356 4,292 2,253 2,319 2,828 3,119 3,279 242,767 3,572 3,541 3,175 3,149 4,087 4,405 4,497 4,341 2,783 3,516 3,670 3,086 3,121 4,048 4,569 4,400 4,308 252,968 2,996 3,265 3,336 3,153 3,550 3,809 3,998 3,570 2,974 2,965 3,387 3,239 3,141 3,519 3,928 3,922 3,578 264,723 5,628 5,998 5,907 6,313 7,196 6,968 6,673 6,085 4,737 5,567 6,220 5,732 6,299 7,125 7,199 6,527 6,131 273,852 3,686 4,369 4,103 4,001 4,055 4,881 4,684 4,595 3,904 3,613 4,495 3,998 4,002 3,994 5,009 4,616 4,635 283,772 4,145 4,522 5,047 5,314 6,051 6,763 5,705 5,097 3,806 4,095 4,704 4,881 5,304 5,968 6,994 5,567 5,156 292,248 2,404 2,316 2,523 2,157 2,552 2,706 2,700 2,960 2,254 2,392 2,424 2,421 2,153 2,536 2,816 2,610 2,959 30
311 239 301 241 365 243 508 482 537 312 239 315 226 368 244 525 461 543 31
.................... ................ ................ ................ ................ 1 ................ ................ ................ ................ ................ ................ ................ ................ 1 ................ ................ ................ 32
99,203 100,185 95,287 106,909 109,106 111,627 105,381 112,453 110,736 100,048 98,880 98,566 104,090 109,251 110,399 108,428 110,489 111,479 3326,692 25,798 23,932 28,270 27,362 29,075 28,070 30,519 31,083 26,926 25,442 24,758 27,566 27,394 28,723 28,866 30,043 31,356 34
4,534 4,000 3,913 5,870 3,856 3,991 4,622 5,156 5,260 4,551 3,962 4,102 5,702 3,876 3,958 4,770 5,021 5,228 3559,629 64,258 67,941 72,824 72,044 78,079 83,485 82,409 77,705 60,117 63,425 70,377 70,733 72,015 77,200 86,075 80,727 78,235 36

58 ● July 2001
Table 2.—U.S. Trade[Millions
Line 1987 1988 1989 1990 1991 1992 1993 1994 1995 1996 1997 1998 1999 2000
B Trade in goods, by area and country, adjusted to balanceof payments basis, excluding military 7—Continued:
IMPORTS
37 Total, all countries (A–16) ........................................................... 409,765 447,189 477,665 498,435 491,020 536,528 589,394 668,690 749,374 803,113 876,485 917,112 1,029,987 1,224,417
38 Western Europe ......................................................................... 96,129 102,597 102,662 109,350 102,139 111,639 121,066 132,956 147,747 161,556 175,999 194,178 214,871 243,42639 European Union ..................................................................... 81,455 86,036 85,631 91,434 85,765 93,983 102,361 112,412 134,298 146,235 160,384 176,212 194,635 219,94640 Belgium and Luxembourg ................................................. 4,223 4,504 4,540 4,585 4,111 4,696 7,086 8,465 8,753 9,483 10,809 8,773 9,503 10,25841 France ............................................................................... 10,506 12,498 12,910 13,043 13,203 14,653 15,234 16,676 17,219 18,619 20,658 24,006 25,705 29,77342 Germany 8 ......................................................................... 26,941 26,313 24,815 28,087 26,039 28,736 28,531 31,683 36,828 38,860 43,047 49,749 55,167 58,50143 Italy .................................................................................... 10,916 11,513 11,895 12,664 11,701 12,246 13,198 14,783 16,332 18,302 19,401 20,940 22,350 25,03144 Netherlands ....................................................................... 4,814 5,950 4,940 4,932 4,854 5,744 8,489 6,013 6,392 7,456 7,608 7,537 8,424 9,62445 United Kingdom ................................................................. 17,210 17,651 17,968 19,965 18,263 19,945 21,509 24,868 26,733 28,756 32,642 34,490 38,789 43,38846 Other .................................................................................. 6,845 7,607 8,563 8,158 7,594 7,963 8,314 9,924 22,041 24,759 26,219 30,717 34,697 43,37147 Western Europe, excluding EU ............................................ 14,674 16,561 17,031 17,916 16,374 17,656 18,705 20,544 13,449 15,321 15,615 17,966 20,236 23,480
48 Canada 2 .................................................................................... 73,600 84,612 89,944 93,147 93,048 100,898 113,080 131,149 146,915 158,545 170,075 175,844 201,288 233,67849 Japan .......................................................................................... 84,578 89,800 93,537 90,378 92,259 97,408 107,242 119,143 123,484 115,180 121,665 121,853 130,878 146,49750 Australia, New Zealand, and South Africa 9 ............................. ................ ................ ................ ................ ................ ................ ................ ................ ................ ................ ................ ................ ................ ....................51 Australia ................................................................................. 2,961 3,519 3,854 4,411 4,074 3,682 3,295 3,203 3,380 3,848 4,868 5,390 5,281 6,422
52 Eastern Europe .......................................................................... 1,919 2,165 1,845 2,096 1,654 1,736 3,530 5,829 7,015 7,008 8,482 10,902 11,818 16,101
53 Latin America and Other Western Hemisphere ....................... 47,295 51,451 57,526 64,354 62,988 69,178 75,191 88,527 105,277 124,959 140,402 145,461 169,030 210,17954 Brazil ...................................................................................... 8,177 9,462 8,438 7,963 6,842 7,609 7,490 8,682 8,832 8,773 9,626 10,102 11,314 13,85355 Mexico .................................................................................... 20,289 23,312 27,128 30,508 31,492 35,610 40,431 50,050 62,794 75,133 86,685 95,401 110,550 136,81156 Venezuela .............................................................................. 5,652 5,168 6,765 9,496 8,179 8,181 8,418 8,371 9,764 13,421 13,477 8,964 11,334 18,62357 Other ...................................................................................... 13,177 13,509 15,195 16,387 16,475 17,778 18,852 21,424 23,887 27,632 30,614 30,994 35,832 40,892
58 Other countries in Asia and Africa 7 9 ....................................... 103,283 113,045 128,297 134,699 134,858 151,987 165,990 187,883 215,556 232,017 254,994 263,484 296,821 368,11459 Asia 7 9 ................................................................................... 91,259 102,098 114,003 118,485 120,310 136,998 150,303 173,507 199,726 212,803 234,821 247,303 279,520 340,26560 Members of OPEC ............................................................ 11,557 11,325 14,843 17,886 15,531 16,205 15,737 16,213 17,697 21,021 21,755 18,877 24,433 35,20461 China ................................................................................. 6,299 8,540 12,005 15,204 19,003 25,729 31,532 38,788 45,544 51,513 62,557 71,170 81,789 100,02162 Hong Kong ........................................................................ 9,830 10,243 9,709 9,475 9,279 9,795 9,557 9,696 10,286 9,854 10,285 10,540 10,524 11,45563 Korea, Republic of ............................................................ 16,963 20,160 19,754 18,438 16,984 16,649 17,093 19,605 24,153 22,620 23,139 23,917 31,154 40,29764 Singapore .......................................................................... 6,149 7,947 8,976 9,802 9,972 11,313 12,805 15,374 18,586 20,349 20,078 18,354 18,202 19,20165 Taiwan ............................................................................... 24,611 24,864 25,482 22,643 23,022 24,597 25,098 26,709 28,971 29,909 32,622 33,110 35,211 40,50766 Africa 7 9 ................................................................................. 11,950 10,865 14,162 16,108 14,418 14,799 15,449 14,090 15,606 18,949 19,894 15,844 16,956 27,54567 Members of OPEC ............................................................ 5,938 5,287 7,566 9,641 8,381 7,989 8,493 7,090 6,804 8,234 8,764 5,832 6,185 13,169
68 International organizations and unallocated ............................. ................ ................ ................ ................ ................ ................ ................ ................ ................ ................ ................ ................ ................ ....................
Memoranda:69 Industrial countries 7 ....................................................................... 259,666 283,229 292,767 300,185 294,461 316,574 347,742 389,909 425,193 442,917 476,699 501,958 557,256 636,31970 Of which: Euro area 10 .............................................................. ................ ................ ................ ................ ................ ................ ................ ................ ................ ................ ................ ................ 144,367 163,41471 Members of OPEC 7 ...................................................................... 24,416 23,016 30,720 38,399 33,430 33,718 32,648 31,674 34,265 42,676 43,996 33,673 41,952 66,99672 Other countries 7 ............................................................................ 125,683 140,944 154,178 159,851 163,129 186,236 209,004 247,107 289,916 317,520 355,790 381,481 430,779 521,102
BALANCE (EXCESS OF EXPORTS +)
73 Total, all countries ....................................................................... –159,557 –126,959 –117,749 –111,034 –76,937 –96,897 –132,451 –165,831 –174,170 –191,000 –198,119 –246,696 –345,434 –452,207
74 Western Europe ......................................................................... –27,547 –16,188 –4,610 1,128 13,717 2,999 –9,782 –17,538 –15,242 –24,654 –23,589 –34,858 –52,101 –64,63375 European Union ..................................................................... –21,951 –11,572 –1,328 4,170 14,816 6,696 –7,156 –11,740 –12,570 –21,410 –21,895 –29,915 –45,552 –57,36376 Belgium and Luxembourg ................................................. 1,920 2,881 3,854 5,718 6,514 5,175 2,207 2,552 4,070 3,198 3,184 5,637 3,762 4,00877 France ............................................................................... –2,559 –2,585 –1,401 385 1,920 –220 –2,125 –3,177 –3,102 –4,245 –4,799 –6,496 –7,121 –9,57378 Germany 8 ......................................................................... –15,416 –12,061 –8,468 –9,886 –5,482 –8,226 –10,066 –12,938 –14,914 –15,976 –19,236 –23,578 –28,803 –29,57879 Italy .................................................................................... –5,451 –4,843 –4,780 –4,793 –3,210 –3,627 –6,836 –7,753 –7,579 –9,615 –10,485 –12,018 –12,472 –14,08080 Netherlands ....................................................................... 3,212 3,764 6,300 7,887 8,514 7,778 4,271 7,451 9,996 9,110 12,209 11,341 10,887 12,09381 United Kingdom ................................................................. –3,461 413 2,430 2,766 3,021 2,513 4,350 1,376 1,496 1,692 3,121 3,895 –1,130 –2,66182 Other .................................................................................. –196 859 737 2,093 3,539 3,303 1,043 749 –2,537 –5,574 –5,889 –8,696 –10,675 –17,57283 Western Europe, excluding EU ............................................ –5,596 –4,616 –3,282 –3,042 –1,099 –3,697 –2,626 –5,798 –2,672 –3,244 –1,694 –4,943 –6,549 –7,270
84 Canada 2 .................................................................................... –11,591 –10,322 –10,056 –9,788 –7,370 –9,795 –12,378 –16,499 –19,527 –24,257 –18,176 –19,109 –34,561 –54,69185 Japan .......................................................................................... –56,948 –52,615 –49,541 –42,373 –44,932 –50,447 –60,222 –66,710 –59,865 –48,704 –57,281 –65,376 –74,804 –82,92186 Australia, New Zealand, and South Africa 9 ............................. ................ ................ ................ ................ ................ ................ ................ ................ ................ ................ ................ ................ ................ ....................87 Australia ................................................................................. 2,328 3,290 4,253 3,821 4,018 4,940 4,778 6,361 7,111 7,900 6,876 6,214 6,259 5,767
88 Eastern Europe .......................................................................... 340 1,640 3,518 2,092 3,065 3,487 2,651 –505 –1,298 278 –595 –3,461 –5,927 –10,176
89 Latin America and Other Western Hemisphere ....................... –12,346 –7,792 –8,733 –10,066 269 6,241 3,257 3,676 –9,059 –15,651 –5,154 –3,266 –27,380 –39,91790 Brazil ...................................................................................... –4,093 –5,218 –3,645 –2,958 –736 –1,908 –1,483 –617 2,562 3,901 6,251 4,983 1,804 1,40491 Mexico .................................................................................... –5,738 –2,729 –2,465 –2,415 1,612 4,799 1,053 585 –16,621 –18,418 –15,467 –16,778 –23,789 –25,64092 Venezuela .............................................................................. –2,122 –636 –3,774 –6,425 –3,539 –2,766 –3,844 –4,351 –5,123 –8,728 –6,908 –2,481 –6,020 –13,11593 Other ...................................................................................... –393 791 1,151 1,732 2,932 6,116 7,531 8,059 10,123 7,594 10,970 11,010 625 –2,566
94 Other countries in Asia and Africa 7 9 ....................................... –53,793 –45,024 –52,753 –56,406 –46,094 –54,410 –60,978 –74,705 –76,290 –85,914 –100,200 –126,916 –156,920 –205,63795 Asia 7 9 ................................................................................... –47,574 –41,584 –46,374 –48,245 –40,209 –48,951 –54,137 –69,199 –70,471 –77,618 –90,995 –121,753 –149,898 –188,26796 Members of OPEC ............................................................ –5,777 –3,926 –6,617 –10,113 –4,711 –3,753 –3,884 –5,756 –6,368 –8,243 –6,155 –3,898 –12,522 –24,68597 China ................................................................................. –2,792 –3,440 –6,229 –10,420 –12,744 –18,340 –22,841 –29,565 –33,796 –39,578 –49,734 –56,974 –68,734 –83,88398 Hong Kong ........................................................................ –5,855 –4,578 –3,477 –2,726 –1,210 –808 243 1,708 3,913 4,010 4,791 2,320 2,041 3,05599 Korea, Republic of ............................................................ –9,316 –9,523 –6,564 –4,495 –1,989 –2,533 –2,807 –2,352 25 3,293 1,121 –8,269 –8,898 –13,147
100 Singapore .......................................................................... –2,101 –2,190 –1,783 –1,951 –1,374 –1,927 –1,455 –2,517 –3,380 –3,773 –2,578 –2,941 –2,192 –1,580101 Taiwan ............................................................................... –17,514 –12,798 –14,471 –11,582 –10,558 –9,886 –9,660 –10,514 –10,717 –12,201 –13,734 –16,092 –17,725 –16,674102 Africa 7 9 ................................................................................. –6,354 –3,682 –6,613 –8,344 –6,194 –5,787 –7,040 –5,629 –5,879 –8,463 –9,314 –5,256 –7,465 –17,430103 Members of OPEC ............................................................ –5,155 –4,117 –6,229 –8,018 –6,684 –6,182 –6,601 –5,270 –5,369 –6,481 –7,237 –4,361 –5,093 –11,571
104 International organizations and unallocated ............................. ................ 52 173 558 390 88 223 89 ................ 2 ................ 76 ................ 1
Memoranda:105 Industrial countries 7 ....................................................................... –94,053 –75,912 –59,968 –47,261 –34,402 –51,526 –77,231 –94,185 –86,717 –88,641 –91,298 –112,339 –155,672 –197,752106 Of which: Euro area 10 .............................................................. ................ ................ ................ ................ ................ ................ ................ ................ ................ ................ ................ ................ –39,675 –48,388107 Members of OPEC 7 ...................................................................... –13,702 –9,239 –17,531 –25,258 –15,325 –13,052 –14,329 –15,377 –16,860 –23,452 –20,300 –10,740 –23,635 –49,371108 Other countries 7 ............................................................................ –51,802 –41,860 –40,423 –39,073 –27,600 –32,407 –41,114 –56,358 –70,593 –78,909 –86,521 –123,693 –166,127 –205,085
See footnotes on page 66.

July 2001 ● 59
in Goods—Continuedof dollars]
Not seasonally adjusted Seasonally adjusted
Line1999 2000 2001 1999 2000 2001
I II III IV I II III IV I p I II III IV I II III IV I p
230,322 249,610 268,525 281,530 284,501 301,727 317,721 320,468 297,588 238,709 250,557 264,777 275,944 292,547 303,229 313,884 314,757 307,462 37
48,317 52,589 54,411 59,554 58,384 59,856 60,335 64,851 63,104 50,045 52,795 53,670 58,361 59,959 60,171 59,588 63,708 65,257 3844,498 48,084 49,117 52,936 52,118 54,548 54,589 58,691 56,885 46,101 48,270 48,429 51,835 53,569 54,840 53,904 57,633 58,870 39
2,449 2,414 2,191 2,449 2,534 2,461 2,469 2,794 2,834 2,525 2,424 2,161 2,393 2,596 2,474 2,444 2,744 2,927 405,980 6,277 6,597 6,851 7,059 7,420 6,921 8,373 8,194 6,203 6,303 6,497 6,702 7,264 7,452 6,827 8,230 8,449 41
12,442 13,759 13,854 15,112 14,088 14,488 14,943 14,982 15,047 12,868 13,820 13,666 14,813 14,480 14,576 14,733 14,712 15,593 425,211 5,602 5,678 5,859 5,901 6,139 6,706 6,285 6,206 5,397 5,619 5,597 5,737 6,074 6,165 6,619 6,173 6,425 431,850 1,953 2,063 2,558 2,332 2,411 2,374 2,507 2,400 1,916 1,962 2,035 2,511 2,397 2,423 2,345 2,459 2,479 448,794 9,654 9,925 10,416 10,564 10,827 10,579 11,418 10,964 9,116 9,687 9,780 10,206 10,837 10,882 10,449 11,220 11,351 457,772 8,425 8,809 9,691 9,640 10,802 10,597 12,332 11,240 8,076 8,455 8,693 9,473 9,921 10,868 10,487 12,095 11,646 463,819 4,505 5,294 6,618 6,266 5,308 5,746 6,160 6,219 3,944 4,525 5,241 6,526 6,390 5,331 5,684 6,075 6,387 47
47,571 50,231 49,842 53,644 57,142 59,582 56,800 60,154 57,875 49,270 50,416 49,075 52,527 58,718 59,826 56,025 59,109 59,833 4831,012 30,785 33,187 35,894 34,742 36,574 36,581 38,600 34,630 32,116 30,896 32,705 35,161 35,765 36,792 36,103 37,837 35,916 49
.................... ................ ................ ................ ................ ................ ................ ................ ................ ................ ................ ................ ................ ................ ................ ................ ................ ................ 501,087 1,380 1,446 1,368 1,345 1,676 1,732 1,669 1,457 1,133 1,384 1,424 1,340 1,388 1,681 1,708 1,645 1,503 51
2,402 3,107 2,853 3,456 4,022 3,686 4,446 3,947 4,438 2,480 3,122 2,816 3,400 4,120 3,701 4,400 3,880 4,562 52
37,281 41,163 44,758 45,828 49,331 52,210 54,674 53,964 51,560 38,551 41,327 44,172 44,980 50,602 52,462 54,055 53,060 53,140 532,383 2,880 3,072 2,979 3,244 3,546 3,816 3,247 3,611 2,476 2,890 3,027 2,921 3,347 3,552 3,758 3,196 3,728 54
24,895 27,150 28,862 29,643 31,840 34,096 35,801 35,074 33,345 25,770 27,264 28,464 29,052 32,744 34,280 35,383 34,404 34,450 551,844 2,626 3,387 3,477 4,295 4,554 4,664 5,110 4,492 1,879 2,636 3,367 3,452 4,331 4,577 4,636 5,079 4,550 568,159 8,507 9,437 9,729 9,952 10,014 10,393 10,533 10,112 8,426 8,537 9,314 9,555 10,180 10,053 10,278 10,381 10,412 57
62,652 70,355 82,028 81,786 79,535 88,143 103,153 97,283 84,524 65,114 70,617 80,915 80,175 81,995 88,596 102,005 95,518 87,251 5859,160 66,210 77,309 76,841 73,609 81,046 95,620 89,990 77,524 61,537 66,460 76,237 75,286 75,994 81,457 94,524 88,290 80,123 59
4,518 5,561 6,882 7,472 7,607 8,519 9,843 9,235 8,479 4,646 5,580 6,822 7,385 7,725 8,559 9,775 9,145 8,651 6016,421 19,300 23,626 22,442 19,911 23,463 29,363 27,284 22,398 17,173 19,385 23,289 21,942 20,681 23,606 29,035 26,699 23,176 61
2,233 2,361 3,084 2,846 2,599 2,663 3,449 2,744 2,353 2,334 2,367 3,039 2,784 2,698 2,668 3,405 2,684 2,434 626,438 7,485 8,137 9,094 8,920 9,574 10,734 11,069 9,453 6,687 7,518 8,026 8,923 9,216 9,617 10,601 10,863 9,788 634,170 4,513 4,754 4,765 4,302 4,536 5,278 5,085 4,182 4,323 4,531 4,686 4,662 4,441 4,556 5,208 4,996 4,334 647,977 8,703 9,110 9,421 9,086 10,113 10,959 10,349 8,800 8,282 8,731 8,970 9,228 9,389 10,159 10,819 10,140 9,100 653,424 4,073 4,607 4,852 5,866 7,027 7,437 7,215 6,928 3,507 4,084 4,567 4,798 5,938 7,068 7,386 7,153 7,053 661,156 1,499 1,826 1,704 2,717 3,457 3,703 3,292 3,279 1,169 1,506 1,815 1,695 2,731 3,480 3,683 3,275 3,309 67
.................... ................ ................ ................ ................ ................ ................ ................ ................ ................ ................ ................ ................ ................ ................ ................ ................ ................ 68
129,076 136,251 140,149 151,780 152,950 159,383 157,144 166,842 158,702 133,695 136,761 138,119 148,681 157,205 160,172 155,102 163,840 164,202 6933,111 35,394 36,559 39,303 38,358 40,442 41,058 43,556 42,765 34,306 35,534 36,049 38,478 39,450 40,663 40,537 42,764 44,250 70
7,518 9,686 12,095 12,653 14,619 16,530 18,210 17,637 16,250 7,694 9,722 12,004 12,532 14,787 16,616 18,094 17,499 16,510 7193,728 103,673 116,281 117,097 116,932 125,814 142,367 135,989 122,636 97,320 104,074 114,654 114,731 120,555 126,441 140,688 133,418 126,750 72
–66,956 –81,167 –101,384 –95,927 –99,495 –108,029 –124,233 –120,450 –103,887 –73,993 –84,290 –91,732 –95,419 –107,405 –111,671 –114,611 –118,520 –112,520 73
–7,200 –12,251 –16,544 –16,106 –14,249 –15,010 –17,715 –17,659 –15,210 –8,533 –13,045 –14,509 –16,014 –15,690 –15,896 –15,781 –17,266 –16,969 74–6,128 –11,143 –14,550 –13,731 –12,878 –13,676 –15,344 –15,465 –13,823 –7,361 –11,876 –12,686 –13,629 –14,234 –14,490 –13,564 –15,075 –15,419 75
1,031 784 981 966 837 1,001 1,115 1,055 793 971 731 1,120 940 773 945 1,246 1,044 729 76–990 –1,603 –2,594 –1,934 –2,138 –2,445 –2,184 –2,806 –2,580 –1,146 –1,708 –2,365 –1,902 –2,325 –2,550 –1,963 –2,735 –2,785 77
–5,609 –7,272 –7,826 –8,096 –7,048 –7,029 –7,974 –7,527 –6,790 –5,999 –7,420 –7,422 –7,962 –7,445 –7,205 –7,564 –7,364 –7,249 78–2,959 –3,060 –3,433 –3,020 –3,359 –3,564 –3,614 –3,543 –3,452 –3,122 –3,112 –3,265 –2,973 –3,528 –3,621 –3,452 –3,479 –3,647 79
2,891 2,727 2,611 2,658 2,890 2,861 2,917 3,425 3,116 2,870 2,660 2,794 2,563 2,832 2,791 3,105 3,365 3,079 80996 –214 –796 –1,116 –490 –741 –1,050 –380 –606 794 –413 –355 –1,156 –713 –941 –664 –343 –885 81
–1,488 –2,505 –3,493 –3,189 –3,570 –3,759 –4,554 –5,689 –4,304 –1,729 –2,614 –3,193 –3,139 –3,828 –3,909 –4,272 –5,563 –4,661 82–1,072 –1,108 –1,994 –2,375 –1,371 –1,334 –2,371 –2,194 –1,387 –1,172 –1,169 –1,823 –2,385 –1,456 –1,406 –2,217 –2,191 –1,550 83
–7,370 –7,348 –10,063 –9,780 –11,477 –12,884 –14,457 –15,873 –15,226 –8,725 –8,101 –7,986 –9,749 –12,975 –13,639 –12,501 –15,576 –16,891 84–16,635 –17,526 –19,686 –20,957 –19,373 –21,075 –20,616 –21,857 –18,568 –17,672 –17,732 –18,663 –20,737 –20,480 –21,371 –19,582 –21,488 –19,814 85
.................... ................ ................ ................ ................ ................ ................ ................ ................ ................ ................ ................ ................ ................ ................ ................ ................ ................ 861,407 1,359 1,469 2,024 1,626 1,592 1,278 1,271 1,247 1,391 1,314 1,586 1,968 1,599 1,537 1,386 1,245 1,227 87
–1,194 –1,698 –1,094 –1,941 –2,581 –2,357 –2,932 –2,306 –2,744 –1,277 –1,714 –990 –1,946 –2,666 –2,383 –2,841 –2,286 –2,864 88
–4,924 –7,209 –9,049 –6,198 –9,768 –10,064 –10,194 –9,891 –10,150 –5,902 –7,826 –7,208 –6,444 –11,025 –10,800 –8,254 –9,838 –11,404 89599 330 248 627 –53 118 413 926 233 552 261 398 593 –144 51 584 913 150 90
–5,984 –6,824 –6,490 –4,491 –5,809 –6,538 –6,571 –6,722 –6,602 –6,694 –7,212 –5,314 –4,569 –6,696 –7,045 –5,293 –6,606 –7,478 91–404 –1,352 –2,012 –2,252 –3,036 –3,146 –3,287 –3,646 –3,093 –433 –1,383 –1,936 –2,268 –3,076 –3,182 –3,219 –3,638 –3,144 92
865 637 –795 –82 –870 –498 –749 –449 –689 673 508 –356 –200 –1,109 –624 –326 –507 –932 93
–31,040 –36,494 –46,417 –42,969 –43,673 –48,232 –59,597 –54,135 –43,236 –33,275 –37,186 –43,962 –42,497 –46,168 –49,120 –57,038 –53,311 –45,805 94–29,879 –34,890 –44,135 –40,994 –39,973 –43,766 –54,857 –49,671 –39,272 –32,035 –35,559 –41,831 –40,473 –42,390 –44,595 –52,464 –48,818 –41,712 95
–1,735 –3,074 –4,645 –3,068 –5,375 –6,179 –7,106 –6,025 –5,155 –1,853 –3,110 –4,466 –3,093 –5,472 –6,240 –6,947 –6,026 –5,372 96–13,654 –15,728 –20,085 –19,267 –16,762 –19,376 –24,958 –22,787 –18,057 –14,390 –15,869 –19,619 –18,856 –17,560 –19,558 –24,466 –22,299 –18,868 97
735 635 181 490 554 887 360 1,254 1,217 640 598 348 455 443 851 523 1,238 1,144 98–1,715 –1,857 –2,139 –3,187 –2,607 –2,378 –3,766 –4,396 –3,368 –1,950 –1,951 –1,806 –3,191 –2,917 –2,492 –3,402 –4,336 –3,657 99
–318 –827 –385 –662 –301 –481 –397 –401 413 –419 –918 –191 –664 –439 –562 –199 –380 301 100–4,205 –4,558 –4,588 –4,374 –3,772 –4,062 –4,196 –4,644 –3,703 –4,476 –4,636 –4,266 –4,347 –4,085 –4,191 –3,825 –4,573 –3,944 101–1,176 –1,669 –2,291 –2,329 –3,709 –4,475 –4,731 –4,515 –3,968 –1,253 –1,692 –2,143 –2,377 –3,785 –4,532 –4,570 –4,543 –4,094 102
–845 –1,260 –1,525 –1,463 –2,352 –3,214 –3,195 –2,810 –2,742 –857 –1,267 –1,500 –1,469 –2,363 –3,236 –3,158 –2,814 –2,766 103
.................... ................ ................ ................ ................ 1 ................ ................ ................ ................ ................ ................ ................ ................ 1 ................ ................ ................ 104
–29,873 –36,066 –44,862 –44,871 –43,844 –47,756 –51,763 –54,389 –47,966 –33,647 –37,881 –39,553 –44,591 –47,954 –49,773 –46,674 –53,351 –52,723 105–6,419 –9,596 –12,627 –11,033 –10,996 –11,367 –12,988 –13,037 –11,682 –7,380 –10,092 –11,291 –10,912 –12,056 –11,940 –11,671 –12,721 –12,894 106–2,984 –5,686 –8,182 –6,783 –10,763 –12,539 –13,588 –12,481 –10,990 –3,143 –5,760 –7,902 –6,830 –10,911 –12,658 –13,324 –12,478 –11,282 107
–34,099 –39,415 –48,340 –44,273 –44,888 –47,735 –58,882 –53,580 –44,931 –37,203 –40,649 –44,277 –43,998 –48,540 –49,241 –54,613 –52,691 –48,515 108

60 ● July 2001
Table 2.—U.S. Trade[Millions
Line 1987 1988 1989 1990 1991 1992 1993 1994 1995 1996 1997 1998 1999 2000
C Trade in goods, by principal end-use category, adjusted tobalance of payments basis, excluding military:
1 Exports of goods, balance of payments basis, excludingmilitary (A–8) ............................................................................ 250,208 320,230 359,916 387,401 414,083 439,631 456,943 502,859 575,204 612,113 678,366 670,416 684,553 772,210
2 Agricultural products .............................................................. 29,847 38,810 41,086 40,224 40,117 44,084 43,611 47,103 57,254 61,531 58,478 53,159 49,661 52,8083 Nonagricultural products ........................................................ 220,361 281,420 318,830 347,177 373,966 395,547 413,332 455,756 517,950 550,582 619,888 617,257 634,892 719,402
4 Foods, feeds, and beverages ................................................... 25,229 33,770 36,338 35,179 35,792 40,341 40,593 41,956 50,474 55,533 51,507 46,397 45,532 47,453
5 Agricultural ............................................................................. 23,059 30,788 33,007 31,433 31,778 35,957 36,548 37,897 46,154 51,257 47,607 43,074 41,587 43,3316 Grains and preparations ................................................... 10,505 15,398 18,029 14,791 13,233 14,838 14,313 13,583 18,613 21,230 16,136 14,362 13,910 13,6507 Wheat ............................................................................ 3,272 5,105 6,131 4,016 3,479 4,647 4,873 4,269 5,688 6,413 4,329 3,808 3,730 3,4998 Corn .............................................................................. 3,267 5,120 6,821 6,246 5,199 5,103 4,643 4,345 7,642 8,874 5,682 4,802 5,267 4,8849 Soybeans ........................................................................... 4,311 4,915 4,026 3,572 4,004 4,452 4,644 4,363 5,426 7,364 7,506 4,941 4,624 5,382
10 Meat products and poultry ................................................ 1,897 2,698 3,019 3,335 3,870 4,477 4,566 5,445 6,618 7,185 7,244 6,751 6,850 7,70811 Vegetables, fruits, nuts, and preparations ....................... 3,484 4,148 4,263 5,614 5,980 6,427 6,700 7,393 7,869 8,080 8,269 8,103 7,955 8,36412 Other agricultural foods, feeds, and beverages .............. 2,862 3,629 3,670 4,121 4,691 5,763 6,325 7,113 7,628 7,398 8,452 8,917 8,248 8,227
13 Nonagricultural (fish, distilled beverages, etc.) .................... 2,170 2,982 3,331 3,746 4,014 4,384 4,045 4,059 4,320 4,276 3,900 3,323 3,945 4,12214 Fish and shellfish .............................................................. 1,843 2,550 2,809 3,101 3,313 3,614 3,204 3,180 3,324 3,117 2,791 2,352 2,970 3,033
15 Industrial supplies and materials ............................................... 70,052 90,019 98,364 105,547 109,693 109,589 111,888 121,546 146,371 147,978 158,317 148,309 147,094 171,956
16 Agricultural ............................................................................. 6,389 7,388 7,960 8,590 8,124 7,903 6,818 8,966 10,861 10,029 10,587 9,781 7,771 9,18717 Raw cotton ........................................................................ 1,660 1,988 2,277 2,799 2,493 2,015 1,542 2,644 3,717 2,745 2,718 2,575 969 1,92518 Tobacco, unmanufactured ................................................ 1,106 1,261 1,301 1,461 1,423 1,641 1,301 1,305 1,390 1,367 1,553 1,451 1,299 1,19619 Hides and skins, including furskins .................................. 1,762 1,868 1,766 1,761 1,383 1,366 1,300 1,535 1,763 1,692 1,665 1,270 1,148 1,60220 Other agricultural industrial supplies ................................ 1,861 2,271 2,616 2,569 2,825 2,881 2,675 3,482 3,991 4,225 4,651 4,485 4,355 4,464
21 Nonagricultural ....................................................................... 63,663 82,631 90,404 96,957 101,569 101,686 105,070 112,580 135,510 137,949 147,730 138,528 139,323 162,76922 Energy products ................................................................ 9,207 9,660 13,275 15,238 15,149 14,364 12,665 12,041 13,775 15,536 16,566 13,335 12,882 16,63723 Fuels and lubricants ..................................................... 9,180 9,580 13,012 14,722 15,072 14,260 12,560 11,959 13,673 15,404 16,291 13,034 12,540 16,20124 Coal and related fuels .............................................. 3,490 4,193 4,990 5,040 5,234 4,924 3,641 3,445 4,295 4,439 4,122 3,683 2,749 2,59825 Petroleum and products ........................................... 4,633 4,480 6,460 8,361 8,396 7,619 7,491 6,968 8,096 9,631 10,419 8,075 8,620 12,012
26 Paper and paper base stocks .......................................... 6,106 7,672 8,278 8,400 8,700 9,298 8,491 10,103 14,487 12,482 12,785 12,151 12,174 14,00027 Textile supplies and related materials ............................. 3,711 4,595 5,389 6,313 6,594 6,808 7,155 8,183 9,284 9,555 10,700 8,918 9,215 10,67128 Chemicals, excluding medicinals ...................................... 20,987 26,116 27,082 27,562 30,432 29,836 30,076 35,132 42,981 42,441 46,829 44,944 45,929 52,24329 Building materials, except metals ..................................... 4,562 6,105 7,149 7,626 7,569 8,078 8,747 8,838 9,062 9,261 9,482 7,977 8,166 8,76230 Other nonmetals ................................................................ 5,537 6,969 7,693 9,130 9,695 10,303 10,768 11,928 13,443 15,302 16,705 18,043 18,503 21,208
31 Metals and nonmetallic products ...................................... 13,553 21,514 21,538 22,688 23,430 22,999 27,168 26,355 32,478 33,372 34,663 33,160 32,454 39,24832 Steelmaking materials .................................................. 1,284 1,752 2,476 2,108 1,687 1,626 1,782 1,853 2,746 2,117 2,266 1,566 1,398 1,72133 Iron and steel products ................................................ 1,546 2,443 3,298 3,479 4,253 3,779 3,656 3,936 5,828 5,448 5,920 5,762 5,741 6,82734 Nonferrous metals ........................................................ 6,841 12,535 10,688 11,435 11,183 10,966 14,588 12,278 14,601 15,481 15,026 14,235 13,541 16,05635 Nonmonetary gold .................................................... 2,627 5,811 3,078 3,730 3,579 4,540 9,064 5,813 5,122 6,940 5,725 5,485 5,263 6,02836 Other precious metals .............................................. 580 701 738 794 897 905 891 1,025 1,595 1,449 1,809 2,018 1,812 2,47637 Other nonferrous metals .......................................... 3,634 6,023 6,872 6,911 6,707 5,521 4,633 5,440 7,884 7,092 7,492 6,732 6,466 7,55238 Other metals and nonmetallic products ....................... 3,882 4,784 5,076 5,666 6,307 6,628 7,142 8,288 9,303 10,326 11,451 11,597 11,774 14,644
39 Capital goods, except automotive ............................................. 92,707 119,103 136,944 153,065 166,715 176,502 182,853 205,823 234,456 253,986 295,874 299,868 311,250 357,037
40 Machinery, except consumer-type ........................................ 74,641 96,014 108,162 119,232 128,472 137,027 148,547 172,665 206,587 221,093 252,201 243,394 255,275 306,48941 Electric generating machinery, electric apparatus, and
parts .............................................................................. 8,596 11,210 11,354 13,392 14,545 15,481 16,875 19,674 23,039 24,113 27,977 27,301 29,403 35,84742 Nonelectric, including parts and attachments .................. 66,045 84,804 96,808 105,840 113,927 121,546 131,672 152,991 183,548 196,980 224,224 216,093 225,872 270,64243 Oil drilling, mining, and construction machinery .......... 4,974 6,564 7,997 8,848 9,636 9,621 9,474 10,213 11,517 12,693 15,965 15,943 11,987 12,62844 Industrial engines, pumps, and compressors .............. 3,133 4,026 4,939 5,359 6,237 6,659 7,533 9,176 10,159 10,287 12,614 11,727 11,899 12,58345 Machine tools and metalworking machinery ............... 2,178 2,638 3,003 3,044 3,028 3,406 3,628 4,379 5,240 5,801 6,502 6,275 6,193 7,47546 Measuring, testing, and control instruments ................ 4,438 5,412 5,371 5,875 6,061 6,430 7,051 7,941 9,019 9,805 11,773 12,540 13,142 16,36947 Other industrial, agricultural, and service industry
machinery ................................................................. 14,975 19,472 21,742 24,187 25,316 26,656 29,058 32,442 37,717 40,960 46,347 43,573 43,768 52,116
48 Computers, peripherals, and parts ............................... 18,817 23,965 24,128 25,888 27,267 28,763 29,316 33,320 39,654 43,719 49,361 45,247 46,725 55,54149 Semiconductors ............................................................. 6,560 9,035 12,169 13,325 14,339 15,987 19,114 25,178 34,153 35,769 38,861 37,650 46,961 60,07750 Telecommunications equipment ................................... 5,097 6,534 8,170 9,397 10,275 11,449 13,502 16,296 20,248 20,217 23,340 23,869 25,367 31,26851 Other office and business machines ........................... 1,647 1,787 2,239 2,136 2,485 2,581 2,382 2,465 2,718 2,925 3,288 3,442 2,999 3,20152 Scientific, hospital, and medical equipment and parts 4,226 5,371 7,050 7,781 9,283 9,994 10,614 11,581 13,123 14,804 16,173 15,827 16,831 19,384
53 Civilian aircraft, engines, parts ............................................. 16,387 21,209 26,935 32,194 36,610 37,726 32,787 31,475 26,129 30,792 41,359 53,547 52,920 48,09154 Civilian aircraft, complete, all types ................................. 7,717 10,538 13,751 18,415 22,767 24,455 20,191 18,704 12,861 15,660 23,584 31,819 28,996 22,69455 Other transportation equipment ............................................ 1,679 1,880 1,847 1,639 1,633 1,749 1,519 1,683 1,740 2,101 2,314 2,927 3,055 2,457
56 Automotive vehicles, engines, and parts .................................. 27,583 33,397 35,047 36,069 39,717 46,712 51,345 57,314 61,261 64,238 73,302 72,386 75,084 80,170
57 To Canada ............................................................................. 20,250 22,948 23,112 21,740 22,548 23,828 27,334 31,651 33,940 35,008 39,610 40,429 45,815 45,66358 Passenger cars, new and used ....................................... 6,610 7,275 7,781 5,890 6,618 6,088 6,435 7,548 7,303 7,840 9,282 8,612 9,212 9,22559 Trucks, buses, and special purpose vehicles .................. 3,169 3,113 3,258 2,523 2,754 2,552 3,197 4,334 4,874 5,010 5,863 6,181 6,677 6,52260 Engines and engine parts ................................................ 2,109 2,508 1,917 2,404 2,704 3,178 3,800 3,365 3,597 3,625 3,899 4,325 5,407 5,61061 Other parts and accessories ............................................ 8,362 10,052 10,156 10,923 10,472 12,010 13,902 16,404 18,166 18,533 20,566 21,311 24,519 24,306
62 To other areas ....................................................................... 7,333 10,449 11,935 14,329 17,169 22,884 24,011 25,663 27,321 29,230 33,692 31,957 29,269 34,50763 Passenger cars, new and used ....................................... 1,313 2,747 3,877 4,648 5,400 8,181 8,138 8,896 9,430 9,126 7,507 7,585 7,243 7,52264 Trucks, buses, and special purpose vehicles .................. 779 1,187 896 1,180 2,149 2,573 2,154 1,917 2,289 3,216 4,288 3,506 2,156 2,85865 Engines and engine parts ................................................ 953 1,246 1,222 1,223 1,329 1,787 1,923 2,157 2,239 2,309 2,911 2,561 3,203 4,49866 Other parts and accessories ............................................ 4,288 5,269 5,940 7,278 8,291 10,343 11,796 12,693 13,363 14,579 18,986 18,305 16,667 19,629
67 Consumer goods (nonfood), except automotive ....................... 20,307 26,981 36,008 43,598 46,650 51,313 54,559 59,864 64,314 70,105 77,962 80,294 81,972 90,554
68 Consumer nondurable goods, manufactured ....................... 10,756 13,539 16,219 19,690 21,938 24,585 25,980 29,089 31,340 34,033 37,225 38,383 39,063 42,57769 Medical, dental, and pharmaceutical preparations,
including vitamins ......................................................... 3,483 4,303 4,389 4,796 5,350 6,215 6,582 6,986 7,282 7,988 9,261 10,642 12,424 14,27470 Consumer durable goods, manufactured ............................. 8,379 11,907 18,092 21,912 22,760 24,873 26,492 28,354 30,271 33,179 37,711 38,657 39,063 43,25371 Household and kitchen appliances and other household
goods ............................................................................ 3,031 4,193 6,423 7,560 8,850 10,014 10,668 11,548 12,128 13,916 16,089 16,431 16,847 18,54672 Unmanufactured consumer goods (gem stones, nursery
stock) ................................................................................. 1,172 1,535 1,697 1,996 1,952 1,855 2,087 2,421 2,703 2,893 3,026 3,254 3,846 4,724
73 Exports, n.e.c ............................................................................. 14,330 16,960 17,215 13,943 15,516 15,174 15,705 16,356 18,328 20,273 21,404 23,162 23,621 25,040
See footnotes on page 66.

July 2001 ● 61
in Goods—Continuedof dollars]
Not seasonally adjusted Seasonally adjusted
Line1999 2000 2001 1999 2000 2001
I II III IV I II III IV I p I II III IV I II III IV I p
163,366 168,443 167,141 185,603 185,006 193,698 193,488 200,018 193,701 164,716 166,267 173,045 180,525 185,142 191,558 199,273 196,237 194,942 1
12,131 11,606 11,957 13,967 13,481 12,274 12,483 14,570 14,150 11,812 12,233 13,003 12,613 12,904 12,977 13,629 13,298 13,606 2151,235 156,837 155,184 171,636 171,525 181,424 181,005 185,448 179,551 152,904 154,034 160,042 167,912 172,238 178,581 185,644 182,939 181,336 3
10,960 10,552 11,220 12,800 11,836 10,930 11,691 12,996 12,543 10,849 11,284 11,789 11,610 11,624 11,749 12,227 11,853 12,317 4
10,054 9,705 10,076 11,752 10,951 9,978 10,455 11,947 11,488 9,916 10,307 10,795 10,569 10,696 10,670 11,156 10,809 11,217 53,407 3,363 3,496 3,644 3,452 3,206 3,530 3,462 3,614 3,301 3,639 3,556 3,414 3,328 3,450 3,551 3,321 3,502 6
798 936 1,054 942 723 866 1,002 908 806 900 1,014 910 906 807 922 869 901 901 71,231 1,391 1,398 1,247 1,235 1,226 1,295 1,128 1,239 1,151 1,491 1,464 1,161 1,168 1,315 1,311 1,090 1,181 81,294 714 882 1,734 1,716 847 885 1,934 1,982 995 1,051 1,446 1,132 1,344 1,292 1,447 1,299 1,556 91,486 1,586 1,736 2,042 1,894 1,853 1,931 2,030 1,893 1,565 1,604 1,753 1,928 1,952 1,874 1,964 1,918 1,962 101,934 2,036 1,880 2,105 1,919 2,100 2,039 2,306 1,997 2,033 1,991 1,969 1,962 2,018 2,069 2,147 2,130 2,100 111,933 2,006 2,082 2,227 1,970 1,972 2,070 2,215 2,002 2,022 2,022 2,071 2,133 2,054 1,985 2,047 2,141 2,097 12
906 847 1,144 1,048 885 952 1,236 1,049 1,055 933 977 994 1,041 928 1,079 1,071 1,044 1,100 13695 605 910 760 667 689 934 743 774 702 728 764 776 687 810 774 762 792 14
33,974 35,806 36,789 40,525 42,461 42,350 43,176 43,969 43,176 34,137 35,082 37,216 40,659 42,124 41,556 43,922 44,354 43,179 15
1,991 1,818 1,830 2,132 2,446 2,221 1,977 2,543 2,580 1,823 1,845 2,137 1,966 2,135 2,236 2,400 2,416 2,317 16186 220 219 344 627 524 366 408 569 122 206 320 321 450 491 550 434 424 17405 401 177 316 384 318 194 300 343 351 352 300 296 323 285 321 267 294 18301 274 285 288 354 393 423 432 499 287 267 286 308 329 383 431 459 474 19
1,099 923 1,149 1,184 1,081 986 994 1,403 1,169 1,063 1,020 1,231 1,041 1,033 1,077 1,098 1,256 1,125 20
31,983 33,988 34,959 38,393 40,015 40,129 41,199 41,426 40,596 32,314 33,237 35,079 38,693 39,989 39,320 41,522 41,938 40,862 212,619 3,081 3,302 3,880 3,770 3,707 4,258 4,902 4,274 2,671 3,076 3,268 3,867 3,779 3,694 4,250 4,914 4,305 222,540 3,020 3,196 3,784 3,718 3,635 4,168 4,680 3,603 2,592 3,015 3,162 3,771 3,728 3,622 4,160 4,691 3,635 23
692 674 720 663 608 643 692 655 547 733 665 696 655 642 631 678 647 584 241,600 2,043 2,217 2,760 2,773 2,636 3,039 3,564 2,660 1,612 2,046 2,207 2,755 2,748 2,635 3,046 3,583 2,656 25
2,853 2,938 3,039 3,344 3,546 3,611 3,543 3,300 3,291 2,853 2,910 3,035 3,376 3,514 3,579 3,554 3,353 3,274 262,169 2,412 2,284 2,350 2,552 2,708 2,757 2,654 2,703 2,194 2,304 2,320 2,397 2,557 2,588 2,807 2,719 2,734 27
10,840 11,341 11,342 12,406 12,408 13,055 13,593 13,187 13,527 10,908 11,035 11,508 12,478 12,318 12,752 13,869 13,304 13,531 281,967 2,092 2,042 2,065 2,145 2,230 2,197 2,190 2,075 2,012 2,014 2,062 2,078 2,173 2,149 2,215 2,225 2,112 294,426 4,572 4,578 4,927 5,261 5,347 5,212 5,388 5,034 4,416 4,473 4,649 4,965 5,208 5,243 5,301 5,456 5,028 30
7,109 7,552 8,372 9,421 10,333 9,471 9,639 9,805 9,692 7,260 7,425 8,237 9,532 10,440 9,315 9,526 9,967 9,878 31274 376 364 384 392 475 434 420 439 297 349 356 396 417 436 433 435 475 32
1,342 1,403 1,452 1,544 1,725 1,712 1,721 1,669 1,664 1,339 1,373 1,467 1,562 1,711 1,683 1,738 1,695 1,656 332,741 2,813 3,577 4,410 4,765 3,426 3,754 4,111 4,259 2,805 2,850 3,458 4,428 4,823 3,482 3,619 4,132 4,331 34
739 811 1,521 2,192 2,404 928 1,066 1,630 1,675 739 811 1,521 2,192 2,404 928 1,066 1,630 1,675 35504 460 386 462 564 609 632 671 874 504 460 386 462 564 609 632 671 874 36
1,498 1,542 1,670 1,756 1,797 1,889 2,056 1,810 1,710 1,562 1,579 1,551 1,774 1,855 1,945 1,921 1,831 1,782 372,752 2,960 2,979 3,083 3,451 3,858 3,730 3,605 3,330 2,819 2,853 2,956 3,146 3,489 3,714 3,736 3,705 3,416 38
74,542 75,685 76,505 84,518 81,684 89,656 91,932 93,765 90,378 75,867 75,267 78,638 81,478 82,608 89,331 93,630 91,468 91,835 39
59,813 61,903 64,266 69,293 70,335 75,280 80,268 80,606 75,698 60,817 62,223 64,922 67,313 70,939 75,767 80,825 78,958 77,135 40
6,850 7,160 7,442 7,951 8,154 8,826 9,611 9,256 8,916 6,974 7,141 7,391 7,897 8,244 8,821 9,505 9,277 9,084 4152,963 54,743 56,824 61,342 62,181 66,454 70,657 71,350 66,782 53,843 55,082 57,531 59,416 62,695 66,946 71,320 69,681 68,051 42
2,935 2,984 3,016 3,052 2,948 3,098 3,233 3,349 3,287 2,994 2,909 3,027 3,057 2,963 3,007 3,281 3,377 3,332 433,009 2,898 2,846 3,146 3,045 3,103 3,192 3,243 3,163 3,083 2,865 2,944 3,007 3,091 3,072 3,276 3,144 3,214 441,373 1,576 1,568 1,676 1,765 1,794 1,904 2,012 1,814 1,404 1,560 1,624 1,605 1,789 1,776 1,957 1,953 1,845 453,107 3,216 3,299 3,520 3,710 4,022 4,284 4,353 3,987 3,098 3,180 3,391 3,473 3,689 3,994 4,380 4,306 4,022 46
10,117 10,993 10,926 11,732 12,558 13,170 13,284 13,104 12,902 10,239 10,711 11,141 11,677 12,623 12,828 13,486 13,179 13,079 47
11,117 11,233 11,544 12,831 12,783 13,390 14,287 15,081 13,933 11,163 11,627 11,837 12,098 12,713 13,870 14,648 14,310 14,001 4810,582 11,085 12,158 13,136 13,247 14,622 16,429 15,779 14,170 10,712 11,331 12,082 12,836 13,375 14,950 16,206 15,546 14,496 49
5,856 5,991 6,641 6,879 6,822 7,754 8,421 8,271 7,469 6,295 6,083 6,516 6,473 7,202 7,877 8,312 7,877 8,031 50694 711 730 864 755 795 835 816 845 725 722 736 816 785 805 839 772 879 51
4,173 4,056 4,096 4,506 4,548 4,706 4,788 5,342 5,212 4,130 4,094 4,233 4,374 4,465 4,767 4,935 5,217 5,152 52
13,904 13,191 11,654 14,171 10,674 13,780 11,133 12,504 13,994 14,225 12,453 13,131 13,111 10,994 12,968 12,274 11,855 14,014 537,918 7,230 5,844 8,004 4,559 7,394 4,887 5,854 7,069 8,248 6,498 7,164 7,086 4,942 6,611 5,881 5,260 7,128 54
825 591 585 1,054 675 596 531 655 686 825 591 585 1,054 675 596 531 655 686 55
18,771 20,058 16,678 19,577 21,106 21,594 17,765 19,705 18,351 18,262 18,647 19,039 19,136 20,549 20,149 20,161 19,311 17,943 56
11,474 12,533 9,944 11,864 12,754 12,716 9,536 10,657 9,717 11,066 11,380 11,725 11,644 12,322 11,551 11,272 10,518 9,384 572,259 2,759 1,673 2,521 2,598 2,854 1,593 2,180 1,830 2,216 2,317 2,295 2,384 2,602 2,367 2,218 2,038 1,806 581,538 1,854 1,499 1,786 1,802 1,882 1,308 1,530 1,201 1,534 1,624 1,789 1,730 1,791 1,658 1,575 1,498 1,209 591,369 1,459 1,230 1,349 1,559 1,462 1,251 1,338 1,308 1,287 1,366 1,396 1,358 1,461 1,391 1,404 1,354 1,220 606,308 6,461 5,542 6,208 6,795 6,518 5,384 5,609 5,378 6,029 6,073 6,245 6,172 6,468 6,135 6,075 5,628 5,149 61
7,297 7,525 6,734 7,713 8,352 8,878 8,229 9,048 8,634 7,196 7,267 7,314 7,492 8,227 8,598 8,889 8,793 8,559 621,940 2,088 1,351 1,864 1,797 2,152 1,556 2,017 2,008 1,900 1,927 1,695 1,721 1,751 1,980 1,931 1,860 1,964 63
593 532 432 599 643 745 664 806 592 572 539 506 539 614 758 759 727 596 64679 791 853 880 1,099 1,150 1,137 1,112 1,065 672 772 883 876 1,090 1,127 1,176 1,105 1,058 65
4,085 4,114 4,098 4,370 4,813 4,831 4,872 5,113 4,969 4,052 4,029 4,230 4,356 4,772 4,733 5,023 5,101 4,941 66
19,654 20,413 20,095 21,810 22,027 22,863 22,782 22,882 23,268 19,995 20,178 20,426 21,373 22,180 22,590 23,104 22,680 23,511 67
9,614 9,725 9,782 9,942 10,078 10,760 11,036 10,703 10,665 9,872 9,639 9,664 9,888 10,229 10,679 10,876 10,793 10,888 68
2,964 3,035 3,090 3,335 3,259 3,648 3,697 3,670 3,872 3,027 2,967 3,129 3,301 3,283 3,573 3,712 3,706 3,921 699,103 9,711 9,510 10,739 10,845 10,946 10,542 10,920 11,282 9,203 9,594 9,869 10,397 10,860 10,770 10,983 10,640 11,303 70
4,004 4,155 4,163 4,525 4,598 4,625 4,620 4,703 4,781 4,018 4,070 4,257 4,502 4,547 4,557 4,740 4,702 4,752 71
937 977 803 1,129 1,104 1,157 1,204 1,259 1,321 920 945 893 1,088 1,091 1,141 1,245 1,247 1,320 72
5,465 5,929 5,854 6,373 5,892 6,305 6,142 6,701 5,985 5,606 5,809 5,937 6,269 6,057 6,183 6,229 6,571 6,157 73

62 ● July 2001
Table 2.—U.S. Trade[Millions
Line 1987 1988 1989 1990 1991 1992 1993 1994 1995 1996 1997 1998 1999 2000
C Trade in goods, by principal end-use category, adjusted tobalance of payments basis, excluding military—Continued:
74 Imports of goods, balance of payments basis, excludingmilitary (A–16) .......................................................................... 409,765 447,189 477,665 498,435 491,020 536,528 589,394 668,690 749,374 803,113 876,485 917,112 1,029,987 1,224,417
75 Petroleum and products 6 ..................................................... 42,944 39,632 50,912 62,295 51,739 51,579 51,483 51,276 56,029 72,746 71,739 50,631 67,767 120,18576 Nonpetroleum products ......................................................... 366,821 407,557 426,753 436,140 439,281 484,949 537,911 617,414 693,345 730,367 804,746 866,481 962,220 1,104,232
77 Foods, feeds, and beverages ................................................... 24,809 24,928 24,900 26,411 26,206 27,609 27,865 30,957 33,176 35,711 39,694 41,242 43,578 45,974
78 Agricultural ............................................................................. 17,266 17,467 17,626 19,204 18,688 19,831 19,934 22,123 24,255 26,659 29,471 30,492 31,679 32,77379 Coffee, cocoa, and sugar ................................................. 3,664 3,145 3,277 3,009 2,908 2,669 2,431 3,259 4,078 4,118 5,039 4,484 3,712 3,25880 Green coffee ................................................................. 2,710 2,284 2,274 1,766 1,737 1,562 1,382 2,270 2,986 2,491 3,575 3,069 2,534 2,35081 Meat products and poultry ................................................ 3,305 3,475 3,385 4,080 4,031 4,071 4,257 3,916 3,928 3,769 4,162 4,314 4,498 5,30982 Vegetables, fruits, nuts, and preparations ....................... 4,426 4,640 4,855 5,711 5,299 5,593 5,560 5,943 6,467 7,390 7,632 8,245 9,135 9,19183 Wine and related products ............................................... 1,916 1,906 1,799 1,865 1,773 1,983 1,944 2,133 2,368 2,793 3,254 3,627 4,163 4,50084 Other agricultural foods, feeds, and beverages .............. 3,955 4,303 4,310 4,537 4,677 5,517 5,742 6,872 7,415 8,589 9,384 9,822 10,173 10,51785 Nonagricultural (fish, distilled beverages, etc) ..................... 7,543 7,461 7,274 7,207 7,518 7,778 7,931 8,834 8,921 9,052 10,223 10,750 11,899 13,20186 Fish and shellfish .............................................................. 5,591 5,423 5,404 5,207 5,651 5,670 5,900 6,642 6,734 6,663 7,702 8,117 8,914 9,90987 Whiskey and other alcoholic beverages .......................... 1,356 1,504 1,591 1,731 1,595 1,828 1,738 1,826 1,845 2,045 2,189 2,300 2,618 2,947
88 Industrial supplies and materials ............................................... 113,746 122,684 135,519 145,284 133,022 140,660 152,230 164,943 184,865 209,498 217,274 202,776 224,717 302,911
89 Agricultural ............................................................................. 3,107 3,404 4,176 3,990 4,244 4,550 4,554 4,720 5,575 6,481 6,274 5,923 5,559 5,61190 Nonagricultural products ........................................................ 110,639 119,280 131,343 141,294 128,778 136,110 147,676 160,223 179,290 203,017 211,000 196,853 219,158 297,30091 Energy products ................................................................ 46,781 43,703 54,930 66,545 56,274 56,822 57,114 58,076 62,037 80,279 80,158 59,119 78,140 138,39792 Fuels and lubricants 6 ................................................... 45,796 42,878 54,290 65,996 55,703 56,147 56,369 57,019 61,101 79,314 79,164 58,055 76,838 135,677
93 Paper and paper base stocks .......................................... 8,669 10,211 9,633 9,472 8,450 8,232 8,322 8,930 12,880 10,872 10,675 11,222 11,614 13,72594 Textile supplies and related materials ............................. 5,417 5,499 5,501 5,655 6,133 6,864 7,545 8,180 8,614 8,835 10,097 10,338 10,293 11,24295 Chemicals, excluding medicinals ...................................... 9,812 12,380 13,955 15,012 15,281 16,861 18,065 21,341 25,526 26,862 29,124 29,183 30,117 34,44996 Building materials, except metals ..................................... 7,391 7,401 7,727 7,411 6,887 8,352 10,623 12,684 12,820 15,035 16,822 17,909 21,824 21,80197 Other nonmetals ................................................................ 4,546 5,027 6,687 7,106 8,108 9,472 10,349 11,070 12,527 13,376 14,177 14,650 15,856 17,914
98 Metals and nonmetallic products ...................................... 28,023 35,059 32,910 30,093 27,645 29,507 35,658 39,942 44,886 47,758 49,947 54,432 51,314 59,77299 Steelmaking materials .................................................. 1,277 1,921 2,243 2,060 1,828 1,719 1,841 2,255 2,957 3,044 2,998 3,273 2,791 3,098
100 Iron and steel products ................................................ 10,822 12,587 11,742 11,121 10,076 10,883 11,760 16,122 16,176 17,221 18,165 21,183 18,125 20,908101 Nonferrous metals ........................................................ 11,893 15,476 15,013 13,094 12,145 13,228 18,138 16,728 20,260 21,678 22,035 22,837 22,797 26,687102 Nonmonetary gold .................................................... 3,784 4,861 3,651 2,452 2,897 3,808 8,820 4,738 5,290 7,747 6,608 6,527 5,768 5,877103 Other precious metals .............................................. 1,889 2,026 2,167 2,522 2,343 2,065 1,822 2,028 2,516 2,494 2,644 3,942 4,463 6,643104 Bauxite and aluminum ............................................. 2,981 3,669 3,525 3,241 2,790 2,894 3,607 5,260 6,218 5,071 5,828 6,211 6,400 6,981105 Other nonferrous metals .......................................... 3,239 4,920 5,670 4,879 4,115 4,461 3,889 4,702 6,236 6,366 6,955 6,157 6,166 7,186106 Other metallic and nonmetallic products ..................... 4,031 5,075 3,912 3,818 3,596 3,677 3,919 4,837 5,493 5,815 6,749 7,139 7,601 9,079
107 Capital goods, except automotive ............................................. 85,128 102,202 112,432 116,257 120,976 134,621 152,870 185,022 222,223 228,478 253,398 269,451 295,271 346,663
108 Machinery, except consumer-type ........................................ 77,408 93,540 101,867 104,816 108,267 120,957 140,508 172,072 209,732 213,861 234,817 244,777 268,385 317,198109 Electric generating machinery, electric apparatus and
parts .............................................................................. 9,518 11,539 12,520 13,847 14,260 15,336 17,428 20,030 24,150 24,749 27,920 29,074 32,835 39,748110 Nonelectric, including parts and attachments .................. 67,890 82,001 89,347 90,969 94,007 105,621 123,080 152,042 185,582 189,112 206,897 215,703 235,550 277,450111 Oil drilling, mining, and construction machinery .......... 3,502 4,231 4,115 3,690 2,942 2,690 3,999 4,947 5,026 5,201 6,382 8,007 7,025 7,210112 Industrial engines, pumps, and compressors .............. 3,215 3,963 3,412 3,462 3,264 3,618 4,098 5,758 6,176 6,267 6,541 7,338 8,258 10,061113 Machine tools and metalworking machinery ............... 3,320 3,686 4,215 4,063 4,098 3,599 4,264 5,163 6,644 7,503 8,250 8,813 7,666 8,549114 Measuring, testing, and control instruments ................ 2,472 2,944 3,026 2,948 3,074 3,456 3,777 4,641 5,601 5,960 6,723 7,360 7,831 9,533115 Other industrial, agricultural, and service industry
machinery ................................................................. 18,073 20,908 22,804 23,363 22,236 23,678 26,512 32,366 37,311 38,386 41,814 44,711 46,170 50,923
116 Computers, peripherals, and parts ............................... 14,839 18,358 21,433 22,941 26,001 31,686 38,036 46,160 56,277 61,514 70,177 72,475 81,457 89,762117 Semiconductors ............................................................. 7,784 10,963 12,331 12,170 13,084 15,475 19,490 26,156 39,042 36,707 36,880 33,416 37,627 48,355118 Telecommunications equipment ................................... 8,129 9,408 9,583 9,492 9,938 10,776 11,278 14,185 15,331 12,788 13,822 15,723 20,922 31,927119 Other office and business machines ........................... 3,605 4,134 4,435 4,153 4,197 4,900 5,416 6,242 6,861 6,794 7,350 7,347 6,398 6,134120 Scientific, hospital, and medical equipment and parts 2,951 3,406 3,993 4,687 5,173 5,743 6,210 6,424 7,313 7,992 8,958 10,513 12,196 14,996
121 Transportation equipment, except automotive ..................... 7,720 8,662 10,565 11,441 12,709 13,664 12,362 12,950 12,491 14,617 18,581 24,674 26,886 29,465122 Civilian aircraft, engines, parts ......................................... 6,577 7,889 9,436 10,474 11,736 12,581 11,294 11,298 10,709 12,671 16,598 21,814 23,773 26,376123 Civilian aircraft, complete, all types ............................. 2,081 3,030 2,926 2,706 3,326 3,806 3,786 3,698 3,590 3,920 4,547 7,049 9,217 12,404
124 Automotive vehicles, engines, and parts .................................. 85,174 87,947 87,245 88,371 85,655 91,706 102,355 118,119 123,632 128,691 139,492 148,680 178,996 195,858
125 From Canada ......................................................................... 24,531 29,198 29,548 29,825 28,762 31,687 37,318 42,201 44,345 45,866 49,275 51,340 63,837 63,946126 Passenger cars, new and used ....................................... 10,185 13,256 12,879 13,702 14,048 14,403 18,272 22,159 23,920 24,139 25,125 27,315 33,792 33,931127 Trucks, buses, and special purpose vehicles .................. 5,261 6,081 6,876 6,888 6,704 8,259 8,725 8,660 8,974 8,787 10,183 9,157 12,830 12,154128 Engines and engine parts ................................................ 1,720 1,977 2,052 1,774 1,373 1,564 1,911 1,960 1,815 2,540 2,824 3,340 4,114 4,217129 Other parts and accessories ............................................ 7,365 7,884 7,741 7,461 6,637 7,461 8,410 9,422 9,636 10,400 11,143 11,528 13,101 13,644
130 From other areas ................................................................... 60,643 58,749 57,697 58,546 56,893 60,019 65,037 75,918 79,287 82,825 90,217 97,340 115,159 131,912131 Passenger cars, new and used ....................................... 37,738 33,797 31,601 32,929 32,262 32,631 34,003 38,952 39,905 41,725 47,097 52,049 62,507 75,266132 Trucks, buses, and special purpose vehicles .................. 5,483 4,267 3,421 2,666 2,469 2,310 2,395 2,986 3,689 4,641 5,264 5,433 7,191 6,487133 Engines and engine parts ................................................ 3,696 4,558 5,622 5,355 5,082 5,502 6,521 8,146 8,901 9,210 8,904 9,195 10,153 10,818134 Other parts and accessories ............................................ 13,726 16,127 17,053 17,596 17,080 19,576 22,118 25,834 26,792 27,249 28,952 30,663 35,308 39,341
135 Consumer goods (nonfood), except automotive ....................... 88,824 96,425 103,597 104,933 107,624 122,370 133,674 145,876 159,399 171,935 194,140 217,133 241,845 281,581136 Consumer nondurable goods, manufactured ....................... 39,432 43,118 46,050 48,665 50,127 57,772 62,710 67,896 74,736 79,995 92,689 103,156 113,839 130,435137 Textile apparel and household goods, except rugs ........ 20,292 20,775 22,756 23,903 24,626 29,304 31,671 34,565 37,783 39,604 46,812 52,689 55,936 63,279138 Footwear of leather, rubber, and other materials ............ 5,558 5,904 5,914 6,607 6,551 7,258 8,369 9,025 9,309 9,724 10,500 10,781 10,757 11,376139 Consumer durable goods, manufactured ............................. 44,893 47,763 51,359 50,573 51,758 58,532 63,892 70,132 76,551 83,215 91,572 103,111 115,584 136,311140 Household and kitchen appliances and other household
goods ............................................................................ 16,066 17,218 18,603 18,697 18,912 21,168 22,472 25,231 27,740 31,608 35,641 40,536 47,356 56,361141 Toys, shooting, and sporting goods, including bicycles 7,196 7,984 8,873 9,729 9,396 11,357 12,466 12,802 13,997 15,479 18,159 19,321 19,831 21,730142 Television and video receivers ......................................... 6,410 5,824 6,861 6,380 6,662 7,459 8,251 9,148 9,819 11,023 11,458 14,325 16,381 21,044143 Radio and stereo equipment, including records, tapes,
and disks ....................................................................... 4,851 5,634 5,651 5,362 6,033 6,877 7,174 8,700 9,277 8,494 8,686 9,553 9,824 11,187144 Unmanufactured consumer goods (gemstones, nursery
stock) ................................................................................. 4,499 5,544 6,188 5,695 5,739 6,066 7,072 7,848 8,112 8,725 9,879 10,866 12,422 14,835
145 Imports, n.e.c., and U.S. goods returned ................................. 12,084 13,003 13,972 17,179 17,537 19,562 20,400 23,773 26,079 28,800 32,487 37,830 45,580 51,430146 U.S. goods returned .............................................................. 7,191 7,878 9,239 10,343 10,576 11,790 12,402 15,042 16,406 18,553 20,581 24,044 28,780 31,858147 Other products, including balance of payments
adjustments not included above (minimum valueshipments and miscellaneous imports) ............................ 4,893 5,125 4,733 6,836 6,961 7,772 7,998 8,731 9,673 10,247 11,906 13,786 16,800 19,572
See footnotes on page 66.
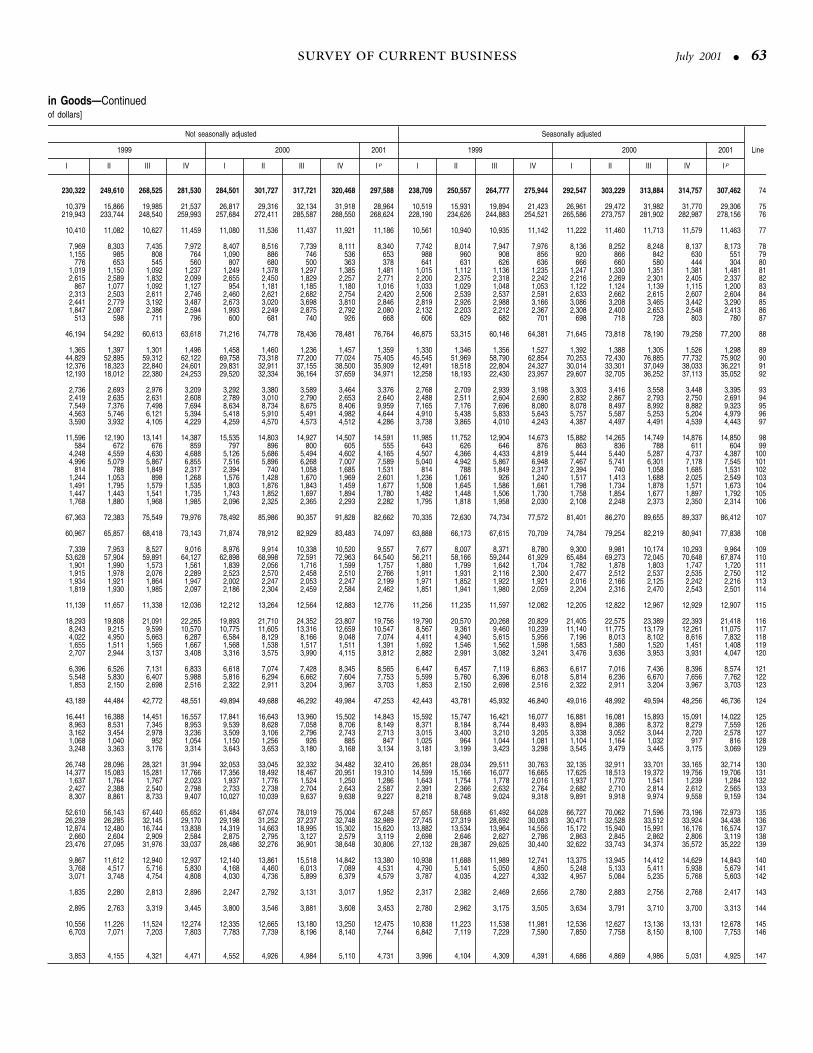
July 2001 ● 63
in Goods—Continuedof dollars]
Not seasonally adjusted Seasonally adjusted
Line1999 2000 2001 1999 2000 2001
I II III IV I II III IV I p I II III IV I II III IV I p
230,322 249,610 268,525 281,530 284,501 301,727 317,721 320,468 297,588 238,709 250,557 264,777 275,944 292,547 303,229 313,884 314,757 307,462 74
10,379 15,866 19,985 21,537 26,817 29,316 32,134 31,918 28,964 10,519 15,931 19,894 21,423 26,961 29,472 31,982 31,770 29,306 75219,943 233,744 248,540 259,993 257,684 272,411 285,587 288,550 268,624 228,190 234,626 244,883 254,521 265,586 273,757 281,902 282,987 278,156 76
10,410 11,082 10,627 11,459 11,080 11,536 11,437 11,921 11,186 10,561 10,940 10,935 11,142 11,222 11,460 11,713 11,579 11,463 77
7,969 8,303 7,435 7,972 8,407 8,516 7,739 8,111 8,340 7,742 8,014 7,947 7,976 8,136 8,252 8,248 8,137 8,173 781,155 985 808 764 1,090 886 746 536 653 988 960 908 856 920 866 842 630 551 79
776 653 545 560 807 680 500 363 378 641 631 626 636 666 660 580 444 304 801,019 1,150 1,092 1,237 1,249 1,378 1,297 1,385 1,481 1,015 1,112 1,136 1,235 1,247 1,330 1,351 1,381 1,481 812,615 2,589 1,832 2,099 2,655 2,450 1,829 2,257 2,771 2,200 2,375 2,318 2,242 2,216 2,269 2,301 2,405 2,337 82
867 1,077 1,092 1,127 954 1,181 1,185 1,180 1,016 1,033 1,029 1,048 1,053 1,122 1,124 1,139 1,115 1,200 832,313 2,503 2,611 2,746 2,460 2,621 2,682 2,754 2,420 2,506 2,539 2,537 2,591 2,633 2,662 2,615 2,607 2,604 842,441 2,779 3,192 3,487 2,673 3,020 3,698 3,810 2,846 2,819 2,926 2,988 3,166 3,086 3,208 3,465 3,442 3,290 851,847 2,087 2,386 2,594 1,993 2,249 2,875 2,792 2,080 2,132 2,203 2,212 2,367 2,308 2,400 2,653 2,548 2,413 86
513 598 711 796 600 681 740 926 668 606 629 682 701 698 718 728 803 780 87
46,194 54,292 60,613 63,618 71,216 74,778 78,436 78,481 76,764 46,875 53,315 60,146 64,381 71,645 73,818 78,190 79,258 77,200 88
1,365 1,397 1,301 1,496 1,458 1,460 1,236 1,457 1,359 1,330 1,346 1,356 1,527 1,392 1,388 1,305 1,526 1,298 8944,829 52,895 59,312 62,122 69,758 73,318 77,200 77,024 75,405 45,545 51,969 58,790 62,854 70,253 72,430 76,885 77,732 75,902 9012,376 18,323 22,840 24,601 29,831 32,911 37,155 38,500 35,909 12,491 18,518 22,804 24,327 30,014 33,301 37,049 38,033 36,221 9112,193 18,012 22,380 24,253 29,520 32,334 36,164 37,659 34,971 12,258 18,193 22,430 23,957 29,607 32,705 36,252 37,113 35,052 92
2,736 2,693 2,976 3,209 3,292 3,380 3,589 3,464 3,376 2,768 2,709 2,939 3,198 3,303 3,416 3,558 3,448 3,395 932,419 2,635 2,631 2,608 2,789 3,010 2,790 2,653 2,640 2,488 2,511 2,604 2,690 2,832 2,867 2,793 2,750 2,691 947,549 7,376 7,498 7,694 8,634 8,734 8,675 8,406 9,959 7,165 7,176 7,696 8,080 8,078 8,497 8,992 8,882 9,323 954,563 5,746 6,121 5,394 5,418 5,910 5,491 4,982 4,644 4,910 5,438 5,833 5,643 5,757 5,587 5,253 5,204 4,979 963,590 3,932 4,105 4,229 4,259 4,570 4,573 4,512 4,286 3,738 3,865 4,010 4,243 4,387 4,497 4,491 4,539 4,443 97
11,596 12,190 13,141 14,387 15,535 14,803 14,927 14,507 14,591 11,985 11,752 12,904 14,673 15,882 14,265 14,749 14,876 14,850 98584 672 676 859 797 896 800 605 555 643 626 646 876 863 836 788 611 604 99
4,248 4,559 4,630 4,688 5,126 5,686 5,494 4,602 4,165 4,507 4,366 4,433 4,819 5,444 5,440 5,287 4,737 4,387 1004,996 5,079 5,867 6,855 7,516 5,896 6,268 7,007 7,589 5,040 4,942 5,867 6,948 7,467 5,741 6,301 7,178 7,545 101
814 788 1,849 2,317 2,394 740 1,058 1,685 1,531 814 788 1,849 2,317 2,394 740 1,058 1,685 1,531 1021,244 1,053 898 1,268 1,576 1,428 1,670 1,969 2,601 1,236 1,061 926 1,240 1,517 1,413 1,688 2,025 2,549 1031,491 1,795 1,579 1,535 1,803 1,876 1,843 1,459 1,677 1,508 1,645 1,586 1,661 1,798 1,734 1,878 1,571 1,673 1041,447 1,443 1,541 1,735 1,743 1,852 1,697 1,894 1,780 1,482 1,448 1,506 1,730 1,758 1,854 1,677 1,897 1,792 1051,768 1,880 1,968 1,985 2,096 2,325 2,365 2,293 2,282 1,795 1,818 1,958 2,030 2,108 2,248 2,373 2,350 2,314 106
67,363 72,383 75,549 79,976 78,492 85,986 90,357 91,828 82,662 70,335 72,630 74,734 77,572 81,401 86,270 89,655 89,337 86,412 107
60,967 65,857 68,418 73,143 71,874 78,912 82,929 83,483 74,097 63,888 66,173 67,615 70,709 74,784 79,254 82,219 80,941 77,838 108
7,339 7,953 8,527 9,016 8,976 9,914 10,338 10,520 9,557 7,677 8,007 8,371 8,780 9,300 9,981 10,174 10,293 9,964 10953,628 57,904 59,891 64,127 62,898 68,998 72,591 72,963 64,540 56,211 58,166 59,244 61,929 65,484 69,273 72,045 70,648 67,874 110
1,901 1,990 1,573 1,561 1,839 2,056 1,716 1,599 1,757 1,880 1,799 1,642 1,704 1,782 1,878 1,803 1,747 1,720 1111,915 1,978 2,076 2,289 2,523 2,570 2,458 2,510 2,766 1,911 1,931 2,116 2,300 2,477 2,512 2,537 2,535 2,750 1121,934 1,921 1,864 1,947 2,002 2,247 2,053 2,247 2,199 1,971 1,852 1,922 1,921 2,016 2,166 2,125 2,242 2,216 1131,819 1,930 1,985 2,097 2,186 2,304 2,459 2,584 2,462 1,851 1,941 1,980 2,059 2,204 2,316 2,470 2,543 2,501 114
11,139 11,657 11,338 12,036 12,212 13,264 12,564 12,883 12,776 11,256 11,235 11,597 12,082 12,205 12,822 12,967 12,929 12,907 115
18,293 19,808 21,091 22,265 19,893 21,710 24,352 23,807 19,756 19,790 20,570 20,268 20,829 21,405 22,575 23,389 22,393 21,418 1168,243 9,215 9,599 10,570 10,775 11,605 13,316 12,659 10,547 8,567 9,361 9,460 10,239 11,140 11,775 13,179 12,261 11,075 1174,022 4,950 5,663 6,287 6,584 8,129 8,166 9,048 7,074 4,411 4,940 5,615 5,956 7,196 8,013 8,102 8,616 7,832 1181,655 1,511 1,565 1,667 1,568 1,538 1,517 1,511 1,391 1,692 1,546 1,562 1,598 1,583 1,580 1,520 1,451 1,408 1192,707 2,944 3,137 3,408 3,316 3,575 3,990 4,115 3,812 2,882 2,991 3,082 3,241 3,476 3,636 3,953 3,931 4,047 120
6,396 6,526 7,131 6,833 6,618 7,074 7,428 8,345 8,565 6,447 6,457 7,119 6,863 6,617 7,016 7,436 8,396 8,574 1215,548 5,830 6,407 5,988 5,816 6,294 6,662 7,604 7,753 5,599 5,760 6,396 6,018 5,814 6,236 6,670 7,656 7,762 1221,853 2,150 2,698 2,516 2,322 2,911 3,204 3,967 3,703 1,853 2,150 2,698 2,516 2,322 2,911 3,204 3,967 3,703 123
43,189 44,484 42,772 48,551 49,894 49,688 46,292 49,984 47,253 42,443 43,781 45,932 46,840 49,016 48,992 49,594 48,256 46,736 124
16,441 16,388 14,451 16,557 17,841 16,643 13,960 15,502 14,843 15,592 15,747 16,421 16,077 16,881 16,081 15,893 15,091 14,022 1258,963 8,531 7,345 8,953 9,539 8,628 7,058 8,706 8,149 8,371 8,184 8,744 8,493 8,894 8,386 8,372 8,279 7,559 1263,162 3,454 2,978 3,236 3,509 3,106 2,796 2,743 2,713 3,015 3,400 3,210 3,205 3,338 3,052 3,044 2,720 2,578 1271,068 1,040 952 1,054 1,150 1,256 926 885 847 1,025 964 1,044 1,081 1,104 1,164 1,032 917 816 1283,248 3,363 3,176 3,314 3,643 3,653 3,180 3,168 3,134 3,181 3,199 3,423 3,298 3,545 3,479 3,445 3,175 3,069 129
26,748 28,096 28,321 31,994 32,053 33,045 32,332 34,482 32,410 26,851 28,034 29,511 30,763 32,135 32,911 33,701 33,165 32,714 13014,377 15,083 15,281 17,766 17,356 18,492 18,467 20,951 19,310 14,599 15,166 16,077 16,665 17,625 18,513 19,372 19,756 19,706 131
1,637 1,764 1,767 2,023 1,937 1,776 1,524 1,250 1,286 1,643 1,754 1,778 2,016 1,937 1,770 1,541 1,239 1,284 1322,427 2,388 2,540 2,798 2,733 2,738 2,704 2,643 2,587 2,391 2,366 2,632 2,764 2,682 2,710 2,814 2,612 2,565 1338,307 8,861 8,733 9,407 10,027 10,039 9,637 9,638 9,227 8,218 8,748 9,024 9,318 9,891 9,918 9,974 9,558 9,159 134
52,610 56,143 67,440 65,652 61,484 67,074 78,019 75,004 67,248 57,657 58,668 61,492 64,028 66,727 70,062 71,596 73,196 72,973 13526,239 26,285 32,145 29,170 29,198 31,252 37,237 32,748 32,989 27,745 27,319 28,692 30,083 30,471 32,528 33,512 33,924 34,438 13612,874 12,480 16,744 13,838 14,319 14,663 18,995 15,302 15,620 13,882 13,534 13,964 14,556 15,172 15,940 15,991 16,176 16,574 137
2,660 2,604 2,909 2,584 2,875 2,795 3,127 2,579 3,119 2,698 2,646 2,627 2,786 2,863 2,845 2,862 2,806 3,119 13823,476 27,095 31,976 33,037 28,486 32,276 36,901 38,648 30,806 27,132 28,387 29,625 30,440 32,622 33,743 34,374 35,572 35,222 139
9,867 11,612 12,940 12,937 12,140 13,861 15,518 14,842 13,380 10,938 11,688 11,989 12,741 13,375 13,945 14,412 14,629 14,843 1403,768 4,517 5,716 5,830 4,168 4,460 6,013 7,089 4,531 4,790 5,141 5,050 4,850 5,248 5,133 5,411 5,938 5,679 1413,071 3,748 4,754 4,808 4,030 4,736 5,899 6,379 4,579 3,787 4,035 4,227 4,332 4,957 5,084 5,235 5,768 5,603 142
1,835 2,280 2,813 2,896 2,247 2,792 3,131 3,017 1,952 2,317 2,382 2,469 2,656 2,780 2,883 2,756 2,768 2,417 143
2,895 2,763 3,319 3,445 3,800 3,546 3,881 3,608 3,453 2,780 2,962 3,175 3,505 3,634 3,791 3,710 3,700 3,313 144
10,556 11,226 11,524 12,274 12,335 12,665 13,180 13,250 12,475 10,838 11,223 11,538 11,981 12,536 12,627 13,136 13,131 12,678 1456,703 7,071 7,203 7,803 7,783 7,739 8,196 8,140 7,744 6,842 7,119 7,229 7,590 7,850 7,758 8,150 8,100 7,753 146
3,853 4,155 4,321 4,471 4,552 4,926 4,984 5,110 4,731 3,996 4,104 4,309 4,391 4,686 4,869 4,986 5,031 4,925 147

64 ● July 2001
Table 3.—Private[Millions
Line 1998 1999 2000
Not seasonally adjusted
1999
I II III IV
1 Exports of private services .......................................................................................................................................................... 243,902 255,995 278,570 60,153 61,635 68,409 65,798
2 Travel (table 1, line 6) ................................................................................................................................................................. 71,286 74,731 82,042 15,813 18,542 21,820 18,5563 Passenger fares (table 1, line 7) ................................................................................................................................................ 20,098 19,785 20,745 4,466 4,756 5,760 4,8034 Other transportation (table 1, line 8) .......................................................................................................................................... 25,604 26,916 30,185 6,161 6,667 7,054 7,0345 Freight ...................................................................................................................................................................................... 11,048 11,560 13,236 2,694 2,815 2,883 3,1696 Port services ............................................................................................................................................................................ 14,557 15,356 16,950 3,467 3,852 4,170 3,865
7 Royalties and license fees (table 1, line 9) ................................................................................................................................ 35,626 36,420 38,030 8,887 8,831 8,966 9,7368 Affiliated ................................................................................................................................................................................... 26,313 25,905 26,621 6,368 6,231 6,297 7,0099 U.S. parents’ receipts ......................................................................................................................................................... 24,362 24,265 24,444 5,912 5,849 5,886 6,618
10 U.S. affiliates’ receipts ........................................................................................................................................................ 1,951 1,640 2,177 456 382 411 39111 Unaffiliated ............................................................................................................................................................................... 9,314 10,515 11,409 2,519 2,600 2,669 2,72712 Industrial processes 1 .......................................................................................................................................................... 3,500 3,987 4,421 943 981 1,016 1,04713 Other 2 ................................................................................................................................................................................. 5,814 6,528 6,987 1,577 1,619 1,653 1,680
14 Other private services (table 1, line 10) ..................................................................................................................................... 91,288 98,143 107,568 24,826 22,839 24,809 25,66915 Affiliated services ..................................................................................................................................................................... 28,176 28,969 31,628 7,029 6,772 6,965 8,20316 U.S. parents’ receipts ......................................................................................................................................................... 18,135 18,340 19,604 4,344 4,336 4,481 5,17917 U.S. affiliates’ receipts ........................................................................................................................................................ 10,041 10,629 12,024 2,685 2,436 2,484 3,02418 Unaffiliated services ................................................................................................................................................................ 63,112 69,174 75,940 17,797 16,067 17,844 17,46619 Education ............................................................................................................................................................................. 9,034 9,604 10,287 3,862 1,206 2,555 1,98120 Financial services ................................................................................................................................................................ 11,327 14,303 17,042 3,030 3,614 3,762 3,89721 Insurance, net ..................................................................................................................................................................... 2,224 1,299 2,412 342 289 300 36922 Premiums received ......................................................................................................................................................... 7,278 7,282 8,898 1,778 1,773 1,818 1,91323 Losses paid ..................................................................................................................................................................... 5,054 5,983 6,486 1,437 1,485 1,518 1,54424 Telecommunications ............................................................................................................................................................ 5,567 3,734 3,843 981 971 918 86425 Business, professional, and technical services ................................................................................................................. 22,676 27,114 28,026 6,494 6,791 6,913 6,91626 Other unaffiliated services 3 ................................................................................................................................................ 12,284 13,120 14,331 3,088 3,197 3,397 3,438
27 Imports of private services ........................................................................................................................................................... 167,376 173,049 200,585 38,126 44,164 47,523 43,236
28 Travel (table 1, line 23) ............................................................................................................................................................... 56,509 58,865 64,537 12,125 15,884 17,929 12,92729 Passenger fares (table 1, line 24) .............................................................................................................................................. 19,971 21,315 24,197 4,771 5,655 5,964 4,92530 Other transportation (table 1, line 25) ........................................................................................................................................ 30,363 34,139 41,058 7,493 8,218 9,185 9,24331 Freight ...................................................................................................................................................................................... 19,412 22,218 26,979 4,790 5,348 6,053 6,02532 Port services ............................................................................................................................................................................ 10,950 11,925 14,083 2,704 2,871 3,132 3,218
33 Royalties and license fees (table 1, line 26) .............................................................................................................................. 11,235 12,613 16,106 2,885 3,029 3,044 3,65534 Affiliated ................................................................................................................................................................................... 8,547 9,791 12,170 2,235 2,340 2,319 2,89735 U.S. parents’ payments ...................................................................................................................................................... 1,782 1,956 2,184 477 485 487 50736 U.S. affiliates’ payments ..................................................................................................................................................... 6,765 7,835 9,986 1,758 1,855 1,832 2,39037 Unaffiliated ............................................................................................................................................................................... 2,688 2,822 3,936 650 689 725 75838 Industrial processes 1 .......................................................................................................................................................... 1,319 1,699 1,852 392 421 440 44739 Other 2 ................................................................................................................................................................................. 1,368 1,125 2,084 259 268 287 311
40 Other private services (table 1, line 27) ..................................................................................................................................... 49,298 46,117 54,687 10,852 11,378 11,401 12,48641 Affiliated services ..................................................................................................................................................................... 19,437 22,588 25,300 4,881 5,635 5,526 6,54642 U.S. parents’ payments ...................................................................................................................................................... 10,415 12,076 12,980 2,576 2,948 2,894 3,65843 U.S. affiliates’ payments ..................................................................................................................................................... 9,022 10,512 12,320 2,305 2,687 2,632 2,88844 Unaffiliated services ................................................................................................................................................................ 29,861 23,529 29,387 5,971 5,743 5,875 5,94045 Education ............................................................................................................................................................................. 1,587 1,829 2,140 342 448 588 45146 Financial services ................................................................................................................................................................ 3,590 3,404 4,482 739 812 940 91347 Insurance, net ..................................................................................................................................................................... 9,240 3,206 9,189 1,063 636 585 92348 Premiums paid ................................................................................................................................................................ 20,398 21,568 27,923 5,147 5,201 5,417 5,80349 Losses recovered ........................................................................................................................................................... 11,158 18,362 18,734 4,085 4,565 4,833 4,88050 Telecommunications ............................................................................................................................................................ 7,682 6,605 5,360 1,738 1,719 1,618 1,53051 Business, professional, and technical services ................................................................................................................. 7,303 8,061 7,776 1,987 2,022 2,039 2,01352 Other unaffiliated services 3 ................................................................................................................................................ 460 425 440 103 107 105 109
Memoranda:53 Balance on goods (table 1, line 71) ............................................................................................................................................... –246,696 –345,434 –452,207 –66,956 –81,167 –101,384 –95,92754 Balance on private services (line 1 minus line 27) ........................................................................................................................ 76,526 82,946 77,985 22,027 17,471 20,886 22,56255 Balance on goods and private services (lines 53 and 54) ............................................................................................................ –170,170 –262,488 –374,222 –44,929 –63,696 –80,498 –73,365
See footnotes on page 66.

July 2001 ● 65
Services Transactionsof dollars]
Not seasonally adjusted Seasonally adjusted
Line2000 2001 1999 2000 2001
I II III IV I p I II III IV I II III IV I p
66,265 68,526 73,821 69,958 68,514 62,181 63,161 64,454 66,198 68,509 70,141 69,675 70,249 70,739 1
17,892 21,236 23,427 19,487 17,780 18,101 18,339 18,808 19,483 20,448 20,976 20,226 20,392 20,309 24,627 5,237 5,874 5,007 4,524 4,839 4,864 5,112 4,970 5,013 5,342 5,213 5,177 4,933 37,035 7,615 7,964 7,571 7,024 6,469 6,666 6,707 7,074 7,365 7,619 7,593 7,609 7,357 43,187 3,319 3,342 3,388 3,094 2,743 2,788 2,908 3,121 3,234 3,297 3,372 3,333 3,140 53,848 4,296 4,622 4,183 3,930 3,726 3,878 3,799 3,953 4,131 4,322 4,221 4,276 4,217 6
9,099 9,270 9,361 10,300 9,615 9,137 9,063 9,097 9,122 9,345 9,525 9,538 9,624 9,883 76,324 6,447 6,485 7,365 6,612 6,618 6,463 6,428 6,395 6,570 6,702 6,662 6,689 6,880 85,903 6,044 5,939 6,558 5,972 6,136 6,011 6,012 6,106 6,123 6,203 6,071 6,047 6,198 9
421 403 546 807 640 482 452 416 289 447 499 591 642 682 102,775 2,823 2,876 2,935 3,003 2,519 2,600 2,669 2,727 2,775 2,823 2,876 2,935 3,003 111,072 1,095 1,116 1,138 1,159 943 981 1,016 1,047 1,072 1,095 1,116 1,138 1,159 121,702 1,728 1,759 1,798 1,843 1,577 1,619 1,653 1,680 1,702 1,728 1,759 1,798 1,843 13
27,612 25,168 27,195 27,593 29,571 23,635 24,229 24,730 25,549 26,338 26,679 27,105 27,447 28,257 147,454 7,505 7,797 8,872 8,584 7,278 6,970 7,114 7,607 7,724 7,738 7,954 8,212 8,883 154,621 4,860 4,701 5,422 5,134 4,500 4,369 4,661 4,810 4,797 4,897 4,894 5,016 5,328 162,833 2,645 3,096 3,450 3,450 2,778 2,601 2,453 2,797 2,927 2,841 3,060 3,196 3,555 17
20,158 17,663 19,398 18,721 20,987 16,357 17,259 17,616 17,942 18,614 18,941 19,151 19,235 19,374 184,103 1,292 2,778 2,114 4,365 2,333 2,369 2,406 2,496 2,472 2,540 2,608 2,668 2,649 194,224 4,371 4,309 4,138 4,110 3,030 3,614 3,762 3,897 4,224 4,371 4,309 4,138 4,110 20
480 595 671 667 770 342 289 300 369 480 595 671 667 770 212,047 2,182 2,294 2,375 2,425 1,778 1,773 1,818 1,913 2,047 2,182 2,294 2,375 2,425 221,568 1,587 1,624 1,708 1,655 1,437 1,485 1,518 1,544 1,568 1,587 1,624 1,708 1,655 23
988 963 952 941 950 981 971 918 864 988 963 952 941 950 246,961 6,949 7,018 7,099 7,149 6,494 6,791 6,913 6,916 6,961 6,949 7,018 7,099 7,149 253,403 3,494 3,671 3,762 3,642 3,177 3,226 3,318 3,399 3,490 3,524 3,594 3,722 3,745 26
43,950 51,820 55,296 49,519 48,393 41,604 42,505 43,626 45,316 48,055 49,281 51,688 51,565 52,565 27
13,874 18,320 18,748 13,595 13,711 14,330 14,553 14,763 15,219 16,399 16,123 16,075 15,940 16,176 285,296 6,645 6,923 5,333 5,480 5,187 5,242 5,346 5,540 5,805 6,146 6,226 6,020 5,994 299,305 10,034 10,932 10,787 10,113 7,784 8,187 8,952 9,216 9,693 10,097 10,554 10,718 10,527 306,012 6,530 7,243 7,192 6,756 4,977 5,273 5,916 6,052 6,283 6,548 6,977 7,171 7,051 313,293 3,504 3,689 3,595 3,357 2,808 2,914 3,038 3,165 3,410 3,549 3,577 3,547 3,476 32
3,520 3,644 4,381 4,561 4,423 2,946 3,091 3,149 3,428 3,604 3,715 4,535 4,253 4,529 332,717 2,807 3,001 3,645 3,527 2,296 2,402 2,424 2,670 2,801 2,878 3,155 3,337 3,633 34
542 530 542 570 562 477 485 487 507 542 530 542 570 562 352,175 2,277 2,459 3,075 2,965 1,819 1,917 1,937 2,163 2,259 2,348 2,613 2,767 3,071 36
803 837 1,380 916 896 650 689 725 758 803 837 1,380 916 896 37456 459 464 472 486 392 421 440 447 456 459 464 472 486 38347 378 916 444 410 259 268 287 311 347 378 916 444 410 39
11,955 13,177 14,312 15,243 14,666 11,357 11,432 11,416 11,913 12,554 13,200 14,298 14,634 15,339 405,704 6,041 6,333 7,222 6,611 5,299 5,687 5,662 5,940 6,201 6,065 6,464 6,568 7,165 413,109 3,138 3,205 3,528 2,959 2,862 2,979 2,999 3,236 3,437 3,140 3,304 3,098 3,275 422,595 2,903 3,128 3,694 3,652 2,437 2,708 2,663 2,704 2,764 2,925 3,160 3,470 3,890 436,251 7,136 7,979 8,021 8,055 6,058 5,745 5,754 5,973 6,353 7,135 7,834 8,066 8,174 44
400 525 689 526 466 428 450 467 484 502 524 544 570 585 451,103 1,157 1,195 1,027 1,187 739 812 940 913 1,103 1,157 1,195 1,027 1,187 461,234 2,058 2,730 3,167 3,100 1,063 636 585 923 1,234 2,058 2,730 3,167 3,100 476,304 6,809 7,242 7,569 7,791 5,147 5,201 5,417 5,803 6,304 6,809 7,242 7,569 7,791 485,071 4,750 4,512 4,401 4,691 4,085 4,565 4,833 4,880 5,071 4,750 4,512 4,401 4,691 491,409 1,337 1,331 1,283 1,252 1,738 1,719 1,618 1,530 1,409 1,337 1,331 1,283 1,252 501,997 1,949 1,925 1,905 1,948 1,987 2,022 2,039 2,013 1,997 1,949 1,925 1,905 1,948 51
108 110 109 113 102 103 107 105 109 108 110 109 113 102 52
–99,495 –108,029 –124,233 –120,450 –103,764 –73,993 –84,290 –91,732 –95,419 –107,405 –111,671 –114,611 –118,520 –112,397 5322,315 16,706 18,525 20,439 20,121 20,577 20,656 20,828 20,882 20,454 20,860 17,987 18,684 18,174 54
–77,180 –91,323 –105,708 –100,011 –83,643 –53,416 –63,634 –70,904 –74,537 –86,951 –90,811 –96,624 –99,836 –94,223 55

66 ● July 2001
General notes for all tables: p Preliminary. r Revised. * Less than $500,000 (+/-) D Suppressed to avoid disclosure ofdata of individual companies.
Table 1:1. Credits, +: Exports of goods and services and income receipts; unilateral current transfers to the United States;
capital account transactions receipts; financial inflows—increase in foreign-owned assets (U.S. liabilities) or de-crease in U.S.-owned assets (U.S. claims).
Debits,–: Imports of goods and services and income payments; unilateral current transfers to foreigners; capitalaccounts transactions payments; financial outflows—decrease in foreign-owned assets (U.S. liabilities) or increasein U.S.-owned assets (U.S. claims).
2. Excludes exports of goods under U.S. military agency sales contracts identified in Census export documents, ex-cludes imports of goods under direct defense expenditures identified in Census import documents, and reflects var-ious other adjustments (for valuation, coverage, and timing) of Census statistics to balance of payments basis; seetable 2.
3. Includes some goods: Mainly military equipment in line 5; major equipment, other materials, supplies, and pe-troleum products purchased abroad by U.S. military agencies in line 22; and fuels purchased by airline and steam-ship operators in lines 8 and 25.
4. Includes transfers of goods and services under U.S. military grant programs.5. Beginning in 1982, these lines are presented on a gross basis. The definition of exports is revised to exclude U.S.
parents’ payments to foreign affiliates and to include U.S. affiliates’ receipts from foreign parents. The definition ofimports is revised to include U.S. parents’ payments to foreign affiliates and to exclude U.S. affiliates’ receipts fromforeign parents.
6. Beginning in 1982, the “other transfers” component includes taxes paid by U.S. private residents to foreign gov-ernments and taxes paid by private nonresidents to the U.S. Government.
7. At the present time, all U.S. Treasury-owned gold is held in the United States.8. Includes sales of foreign obligations to foreigners.9. Consists of bills, certificates, marketable bonds and notes, and nonmarketable convertible and nonconvertible
bonds and notes.10. Consists of U.S. Treasury and Export-Import Bank obligations, not included elsewhere, and of debt securities
of U.S. Government corporations and agencies.11. Includes, primarily, U.S. Government liabilities associated with military agency sales contracts and other trans-
actions arranged with or through foreign official agencies; see table 4.12. Consists of investments in U.S. corporate stocks and in debt securities of private corporations and State and lo-
cal governments.13. Conceptually, line 76 is equal to “net foreign investment” in the national income and product accounts
(NIPA’s). However, the foreign transactions account in the NIPA’s (a) includes adjustments to the internationaltransactions accounts for the treatment of gold, (b) includes adjustments for the different geographical treatment oftransactions with U.S. territories and Puerto Rico, and (c) includes services furnished without payment by financialpension plans except life insurance carriers and private noninsured pension plans. A reconciliation of the balance ongoods and services from the international accounts and the NIPA net exports appears in reconciliation table 2 in ap-pendix A in this issue of the SURVEY OF CURRENT BUSINESS . A reconciliation of the other foreign transactions in the twosets of accounts appears in table 4.5 of the full set of NIPA tables in the August issue of the SURVEY.
Additional footnotes for historical data in July issues of the SURVEY:14. For 1974, includes extraordinary U.S. Government transactions with India. See “Special U.S. Government
Transactions,” June 1974 SURVEY, p. 27.15. For 1978–83, includes foreign currency-denominated notes sold to private residents abroad.16. Break in series. See Technical Notes in the June 1989–90, 1992–95, and July 1996–2001 issues of the SURVEY.Table 2:1. Exports, Census basis, represent transactions values, f.a.s. U.S. port of exportation, for all years; imports, Census
basis, represent Customs values (see Technical Notes in the June 1982 SURVEY), except for 1974–81, when they repre-sent transactions values, f.a.s. foreign port of exportation (see July issues of the SURVEY for historical data).
From 1983 forward, both unadjusted and seasonally adjusted data have been prepared by BEA from “actual” and“revised statistical” monthly data supplied by the Census Bureau (see Technical Notes in the December 1985 SUR-VEY).
Seasonally adjusted data reflect the application of seasonal factors developed jointly by Census and BEA. The sea-sonally adjusted data are the sum of seasonally adjusted five-digit end-use categories (see technical Notes in the June1980 SURVEY, in the June 1988 SURVEY, and in the June 1991 SURVEY). Prior to 1983, annual data are as published bythe Census Bureau, except that for 1975–80 published Census data are adjusted to include trade between the U.S.Virgin Islands and foreign countries.
2. Adjustments in lines A5 and A13, B12, B48, and B84 reflect the Census Bureau’s reconciliation of discrepanciesbetween the goods statistics published by the United States and the counterpart statistics published in Canada.These adjustments are distributed to the affected end-use categories in section C. Beginning in 1986, estimates forundocumented exports to Canada, the largest item in the U.S.-Canadian reconciliation, are included in Census basisdata shown in line A1.
3. Exports of military equipment under U.S. military agency sales contracts with foreign governments (line A6),and direct imports by the Department of Defense and the Coast Guard (line A14), to the extent such trade is identi-fiable from Customs declarations. The exports are included in tables 1 and 10, line 5 (transfers under U.S. militaryagency sales contracts); the imports are included in tables 1 and 10, line 22 (direct defense expenditures).
4. Addition of electrical energy; deduction of exposed motion picture film for rental rather than sale; net change instock of U.S.-owned grains in storage in Canada; coverage adjustments for special situations in which shipmentswere omitted from Census data; deduction of the value of repairs and alterations to foreign-owned equipmentshipped to the United States for repair; and the inclusion of fish exported outside of U.S. customs area. Also includesdeduction of exports to the Panama Canal Zone before October 1, 1979, and for 1975–82, net timing adjustmentsfor goods recorded in Census data in one period but found to have been shipped in another (see July issues of theSURVEY for historical data).
5. Coverage adjustments for special situations in which shipments were omitted from Census data; the deductionof the value of repairs and alterations to U.S.-owned equipment shipped abroad for repair; and the adjustment ofsoftware imports to market value. Also includes addition of understatement of inland freight in f.a.s. values of U.S.imports of goods from Canada in 1974–81; deduction of imports from the Panama Canal Zone before October 1,1979; and for 1975–82, net timing adjustments for goods recorded in Census data in one period but found to havebeen shipped in another (see July issues of the SURVEY for historical data).
6. For 1988–89, correction for the understatement of crude petroleum imports from Canada.7. Annual and unadjusted quarterly data shown in this table correspond to country and area data in table 10, lines
3 and 20. Trade with international organizations includes purchases of nonmonetary gold from the InternationalMonetary Fund, transfers of tin to the International Tin Council (ITC), and sales of satellites to Intelsat. The mem-oranda are defined as follows: Industrial countries: Western Europe, Canada, Japan, Australia, New Zealand, andSouth Africa; Members of OPEC: Venezuela, Ecuador, Iraq, Iran, Kuwait, Saudi Arabia, Qatar, United Arab Emirates,Indonesia, Algeria, Libya, Nigeria, and Gabon (Excludes Ecuador beginning in January 1993 and Gabon beginningin January 1995.); Other countries: Eastern Europe, Latin America and Other Western Hemisphere, and other coun-tries in Asia and Africa, less OPEC. Before 1984, complete geographic area detail was not available for some balanceof payments adjustments. Therefore, the detail shown does not always sum to the values shown for the area aggre-gates. For all years, “Asia” and “Africa” exclude certain Pacific Islands and unidentified countries included in “Othercountries in Asia and Africa.”
8. Includes the former German Democratic Republic (East Germany) beginning in fourth quarter of 1990. In ear-lier periods, the German Democratic Republic was included in Eastern Europe.
9. Beginning in 1986, New Zealand and South Africa are included in “Other countries in Asia and Africa,” withNew Zealand included as part of “Asia” and South Africa as part of “Africa.”
10. The “Euro area,” which formed in January 1999, includes Austria, Belgium, Finland, France, Germany, Ireland,Italy, Luxembourg, Netherlands, Portugal, Spain, and from January 2001, Greece.
Table 3:1. Patented techniques, processes, and formulas and other intangible property rights that are used in goods pro-
duction.2. Copyrights, trademarks, franchises, rights to broadcast live events, software licensing fees, and other intangible
property rights.3. Other unaffiliated services receipts (exports) include mainly expenditures of foreign governments and interna-
tional organizations in the United States and film and television tape rentals. Payments (imports) include mainly ex-penditures of U.S. residents temporarily working abroad and film and television tape rentals.
Table 4:1. Expenditures to release foreign governments from their contractual liabilities to pay for military} goods and ser-
vices purchased through military sales contracts—first authorized (for Israel) under Public Law 93–199, section 4,and subsequently authorized (for many recipients) under similar legislation—are included in line A4. Deliveriesagainst these military sales contracts are included in line C10; see footnote 2. Of the line A4 items, part of these mil-itary expenditures is applied in lines A43 and A46 to reduce short-term assets previously recorded in lines A41 and
C8; this application of funds is excluded from lines C3 and C4. A second part of line A4 expenditures finances futuredeliveries under military sales contracts for the recipient countries and is applied directly to lines A42 and C9. Athird part of line A4, disbursed directly to finance purchases by recipient countries from commercial suppliers in theUnited States, is included in line A37. A fourth part of line A4, representing dollars paid to the recipient countries tofinance purchases from countries other than the United States, is included in line A48.
2. Transactions under military sales contracts are those in which the Department of Defense sells and transfersmilitary goods and services to a foreign purchaser, on a cash or credit basis. Purchases by foreigners directly fromcommercial suppliers are not included as transactions under military sales contracts. The entries for the several cat-egories of transactions related to military sales contracts in this and other tables are partly estimated from incom-plete data.
3. The identification of transactions involving direct dollar outflows from the United States is made in reports byeach operating agency.
4. Line A38 includes foreign currency collected as interest and line A43 includes foreign currency collected as prin-cipal, as recorded in lines A16 and A17, respectively.
5. Includes (a) advance payments to the Department of Defense (on military sales contracts) financed by loans ex-tended to foreigners by U.S. Government agencies and (b) the contraentry for the part of line C10 that was deliveredwithout prepayment by the foreign purchaser. Also includes expenditures of appropriations available to release for-eign purchasers from liability to make repayment.
6. Includes purchases of loans from U.S. banks and exporters and payments by the U.S. Government under com-mercial export credit and investment guarantee programs.
7. Excludes liabilities associated with military sales contracts financed by U.S. Government grants and credits andincluded in line C2.
Table 5:1. Beginning with 1991, payments and receipts of interest related to interest rate and foreign currency swaps be-
tween affiliates and parents are netted and are shown as either net payments or net receipts. Receipts and paymentsof other types of interest are shown on a gross basis.
2. Petroleum includes, and manufacturing and “other” industries exclude, the exploration, development, and pro-duction of crude oil and gas, and the transportation, refining, and marketing of petroleum products, exclusive ofpetrochemicals. “Other” industries includes wholesale trade; banking; finance (except banking), insurance, and realestate; services; and other industries—agriculture, forestry, and fishing; mining construction; transportation, com-munication, and public utilities; and retail trade.
3. Acquisition of equity holdings in existing and newly established companies, capital contributions, capitalizationof intercompany debt, and other equity contributions.
4. Sales (total and partial), liquidations, returns of capital contributions, and other dispositions of equity holdings.Table 6:1. Primarily provincial, regional, and municipal.2. Largely transactions by International Bank for Reconstruction and Development (IBRD), International Devel-
opment Association (IDA), International Finance Corporation (IFC), Asian Development Bank (ADB), and Inter-American Development Bank (IDB).
3. Estimate for scheduled redemptions and identifiable early retirements. Includes estimates based on Canadianstatistics for redemptions of Canadian issues held in the United States. Unidentified and nonscheduled retirementsappear in line A30.
Table 7:1. Estimates of transactions other than those with U.S. banks’ Caribbean branches and with financial intermediar-
ies (F.I.s) are not available. Preliminary estimates of transactions with F.I.s, by area, are commingled in “other” toavoid disclosure of individual companies’ area data.
2. Deposits (line A5) include other financial claims (line A7) for some countries due to the commingling of thesecategories in foreign source data.
3. Primarily mortgages, loans, and bills and notes drawn on foreigners.4. Western Europe, Canada, Japan, Australia, New Zealand, and South Africa.5. Bahamas, British West Indies (Cayman Islands), Netherlands Antilles, and Panama.6. Ecuador, Venezuela, Indonesia, and other Asian and African oil-exporting countries. Excludes Ecuador begin-
ning in January 1993.Table 8:1. Includes central governments and their agencies and corporations; State, provincial, and local governments and
their agencies and corporations; and international and regional organizations.2. U.S.-owned banks are mainly U.S.-chartered banks, Edge Act subsidiaries, and U.S. bank holding companies.
Foreign-owned banks include U.S. branches and agencies of foreign banks and majority-owned bank subsidiaries inthe United States. U.S. brokers and dealers are identified separately beginning with the first quarter of 1997; prior to1997, they are commingled with U.S.-owned banks’ accounts.
3. Commercial paper issued in the U.S. market by foreign incorporated entities; excludes commercial paper issuedthrough foreign direct investment affiliates in the United States.
4. Negotiable and readily transferable instruments other than commercial paper, payable in dollars; consists largelyof negotiable certificates of deposit.
5. Western Europe, Canada, Japan, Australia, New Zealand, and South Africa.6. Bahamas, British West Indies (Cayman Islands), Netherlands Antilles, and Panama.7. Ecuador, Venezuela, Indonesia, and other Asian and African oil-exporting countries. Excludes Ecuador begin-
ning in January 1993.8. Includes Eastern Europe and international and regional organizations.Table 9:1. Negotiable certificates of deposit issued by banks in the United States are included in banks’ custody liabilities
and are separately identified in memorandum line 8. Nonnegotiable certificates of deposit are included in time de-posits.
2. Includes borrowing under Federal funds or repurchase arrangements, deferred credits, and liabilities other thandeposits.
3. Mainly negotiable and readily transferable instruments, excluding U.S. Treasury securities.4. Mainly International Bank for Reconstruction and Development (IBRD), International Development Associa-
tion (IDA), International Finance Corporation (IFC), Asian Development Bank (ADB), Inter-American Develop-ment Bank (IDB), and the Trust Fund of the International Monetary Fund.
5. U.S.-owned banks are mainly U.S.-chartered banks, Edge Act subsidiaries, and U.S. bank holding companies.Foreign-owned banks include U.S. branches and agencies of foreign banks and majority-owned bank subsidiaries inthe United States. U.S. brokers and dealers are identified separately beginning with the first quarter of 1997; prior to1997, they are commingled with U.S.-owned banks’ accounts.
6. Western Europe, Canada, Japan, Australia, New Zealand, and South Africa.7. Bahamas, British West Indies (Cayman Islands), Netherlands Antilles, and Panama.8. Ecuador, Venezuela, Indonesia, and other Asian and African oil-exporting countries. Excludes Ecuador begin-
ning in January 1993.9. Includes Eastern Europe and international and regional organizations.Table 10: For footnotes 1–13, see table 1.14. The “European Union” includes the “European Union (6),” United Kingdom, Denmark, Ireland, Greece,
Spain, and Portugal. Beginning with the first quarter of 1995, the “European Union” also includes Austria, Finland,and Sweden.
15. The “European Union (6)” includes Belgium, France, Germany (includes the former German Democratic Re-public (East Germany) beginning in the fourth quarter of 1990), Italy, Luxembourg, Netherlands, European AtomicEnergy Community, European Coal and Steel Community, and European Investment Bank.
16. Includes, as part of international and unallocated, the estimated direct investment in foreign affiliates engagedin international shipping, in operating oil and gas drilling equipment internationally, and in petroleum trading.Also includes taxes withheld; current-cost adjustments associated with U.S. and foreign direct investment; before1996, small transactions in business services that are not reported by country; and net U.S. currency flows, for whichgeographic source data are not available.
17. Details are not shown separately; see totals in lines 56 and 63.18. Details not shown separately are included in line 69.Table 10a: For footnotes 1–13, see table 1.14. Details not shown separately are included in line 69.NOTE.—Country data are based on information available from U.S. reporting sources. In some instances the sta-
tistics may not necessarily reflect the ultimate foreign transactor. For instance: U.S. export statistics reflect countryof reported destination; in many cases the exports may be transshipped to third countries (especially true for theNetherlands and Germany). The geographic breakdown of security transactions reflects country with which trans-action occurred but may not necessarily reflect the ultimate sources of foreign funds or ultimate destination of U.S.funds. Data for individual countries within the European Union (6) may not add to the published totals for the Eu-ropean Union (6), because in several instances estimates for the group are not available for each country. In addi-tion, country data may not add to the European Union (6) totals because of rounding.
Footnotes to U.S. International Transactions Tables 1–10A

July 2001 ● 67
Table 4.—Selected U.S. Government Transactions[Millions of dollars]
Line 1998 1999 2000
Not seasonally adjusted
1999 2000 2001
I II III IV I II III IV I p
A1 U.S. Government grants and transactions increasing Government assets, total ................................. 17,828 20,651 22,051 4,019 5,379 4,564 6,689 4,372 4,665 4,803 8,212 3,267
By category
2 Grants, net .................................................................................................................................................... 13,294 13,842 16,850 2,582 3,100 2,852 5,307 2,916 3,237 3,652 7,044 2,3053 U.S. Government current grants, net (table 1, line 36, with signs reversed) ....................................... 13,270 13,774 16,821 2,574 3,097 2,847 5,256 2,912 3,232 3,634 7,043 2,2994 Financing military purchases 1 ............................................................................................................ 4,152 3,911 7,205 506 662 630 2,113 1,026 718 1,248 4,213 3265 Other grants ......................................................................................................................................... 9,118 9,862 9,616 2,068 2,434 2,217 3,143 1,886 2,514 2,386 2,830 1,9736 Cash contributions received from coalition partners for Persian Gulf operations ............................ .............. .............. .............. .............. .............. .............. .............. .............. .............. .............. .............. ..............7 Debt forgiveness (table 1, part of Line 39, with sign reversed) ............................................................ 22 69 29 9 3 6 51 5 5 18 1 7
8 Credits and other long-term assets (table 1, line 47, with sign reversed) ................................................ 4,678 6,175 5,177 1,314 2,167 1,595 1,099 1,750 1,368 1,050 1,009 1,0619 Capital subscriptions and contributions to international financial institutions, excluding IMF ............... 1,580 1,451 1,500 394 456 329 272 343 410 335 412 521
10 Credits repayable in U.S. dollars ............................................................................................................ 2,434 3,999 3,679 736 1,544 1,094 626 1,409 958 715 597 54111 Credits repayable in other than U.S. dollars .......................................................................................... –3 –3 –2 –6 1 2 1 –2 .............. .............. .............. ..............12 Other long-term assets ............................................................................................................................ 667 728 .............. 191 167 170 201 .............. .............. .............. .............. ..............
13 Foreign currency holdings and short-term assets, net (table 1, line 49 with sign reversed) ................... –145 634 24 122 112 117 283 –294 59 101 158 –10014 Foreign currency holdings (excluding administrative cash holdings), net ............................................. 22 –24 5 7 –38 4 2 4 –1 1 .............. ..............
Receipts from:15 Sales of agricultural commodities ................................................................................................... .............. (*) .............. .............. (*) .............. .............. .............. .............. .............. .............. ..............16 Interest ............................................................................................................................................. 43 2 (*) 1 1 (*) (*) (*) (*) (*) (*) (*)17 Repayments of principal .................................................................................................................. 22 15 6 8 2 2 3 4 .............. 1 .............. ..............18 Reverse grants ................................................................................................................................ .............. .............. .............. .............. .............. .............. .............. .............. .............. .............. .............. ..............19 Other sources .................................................................................................................................. .............. .............. .............. .............. .............. .............. .............. .............. .............. .............. .............. ..............
Less currencies disbursed for:20 Grants and credits in the recipient’s currency ............................................................................... 2 .............. .............. .............. .............. .............. .............. .............. .............. .............. .............. ..............21 Other grants and credits ................................................................................................................. .............. .............. .............. .............. .............. .............. .............. .............. .............. .............. .............. ..............22 Other U.S. Government expenditures ............................................................................................ 42 42 1 2 41 –2 1 .............. 1 .............. .............. ..............23 Assets acquired in performance of U.S. Government guarantee and insurance obligations, net ....... 44 328 –17 19 139 96 74 –220 40 115 49 1324 Other assets held under Commodity Credit Corporation Charter Act, net ........................................... (*) (*) (*) (*) (*) (*) (*) (*) (*) (*) (*) (*)25 Assets financing military sales contracts, net 2 ...................................................................................... .............. .............. .............. .............. .............. .............. .............. .............. .............. .............. .............. ..............26 Other short-term assets (including changes in administrative cash holdings), net ............................... –210 330 37 96 11 17 206 –78 21 –15 110 –113
By program
27 Capital subscriptions and contributions to international financial institutions, excluding IMF ................... 1,580 1,451 1,500 394 456 329 272 343 410 335 412 52128 Under Agricultural Trade Development and Assistance Act and related programs .................................. 1,144 2,003 1,538 497 571 502 432 507 374 343 314 21929 Under Foreign Assistance Act and related programs ................................................................................. 11,617 11,575 15,654 1,964 2,458 2,496 4,657 2,767 2,756 3,557 6,575 1,81830 Under Export-Import Bank Act ..................................................................................................................... 1,530 1,636 1,499 192 269 750 425 562 246 321 371 44531 Under Commodity Credit Corporation Charter Act ..................................................................................... 325 1,806 436 467 1,204 80 55 44 355 27 11 1432 Under other grant and credit programs ....................................................................................................... 1,150 1,147 1,383 211 282 215 439 224 505 234 420 36433 Other foreign currency assets acquired (lines A16, A17, and A19) .......................................................... 65 18 6 10 3 2 3 4 .............. 1 .............. ..............34 Less foreign currencies used by U.S. Government other than for grants or credits (line A22) ............... 42 42 1 2 41 –2 1 .............. 1 .............. .............. ..............35 Other (including changes in administrative cash holdings), net ................................................................. 457 1,058 37 287 178 186 407 –78 21 –15 110 –113
By disposition 3
36 Estimated transactions involving no direct dollar outflow from the United States .................................... 11,446 13,705 16,880 2,581 3,803 3,220 4,101 3,354 3,200 3,625 6,702 2,02437 Expenditures on U.S. merchandise ......................................................................................................... 5,536 5,655 8,246 818 992 1,504 2,342 1,261 1,011 1,569 4,405 74638 Expenditures on U.S. services 4 .............................................................................................................. 3,061 3,203 4,289 727 874 831 771 1,007 1,245 919 1,118 80639 Financing of military sales contracts by U.S. Government 5 (line C6) .................................................. 2,381 2,644 3,564 527 648 776 693 757 716 968 1,124 31640 By long-term credits ............................................................................................................................. 215 264 422 48 24 182 9 67 34 295 27 241 By short-term credits 1 ......................................................................................................................... .............. .............. .............. .............. .............. .............. .............. .............. .............. .............. .............. ..............42 By grants 1 ........................................................................................................................................... 2,166 2,380 3,143 478 624 594 683 690 683 673 1,097 31543 U.S. Government grants and credits to repay prior U.S. Government credits 1 4 ................................ 391 1,858 496 493 1,191 11 164 282 157 54 3 14344 U.S. Government long- and short-term credits to repay prior U.S. private credits 6 and other assets 133 407 376 20 142 110 135 49 111 126 89 1345 Increase in liabilities associated with U.S. Government grants and transactions increasing
Government assets (including changes in retained accounts) 7 (line C11) ...................................... (*) (*) (*) (*) (*) (*) (*) (*) (*) (*) (*) (*)46 Less receipts on short-term U.S. Government assets (a) financing military sales contracts, 1 (b)
financing repayment of private credits and other assets, and (c) financing expenditures on U.S.merchandise ......................................................................................................................................... 14 20 90 1 3 13 3 1 40 12 37 ..............
47 Less foreign currencies used by U.S. Government other than for grants or credits (line A22) .......... 42 42 1 2 41 –2 1 .............. 1 .............. .............. ..............48 Estimated dollar payments to foreign countries and international financial institutions ............................ 6,382 6,946 5,172 1,438 1,576 1,344 2,588 1,019 1,465 1,178 1,510 1,243
B1 Repayments on U.S. Government long-term assets, total (table 1, line 48) .......................................... 4,111 9,560 4,257 1,554 1,887 1,026 5,093 1,329 855 1,265 808 1,0292 Receipts of principal on U.S. Government credits ...................................................................................... 3,362 4,862 4,257 1,359 1,701 848 955 1,329 855 1,265 808 1,0293 Under Agricultural Trade Development and Assistance Act and related programs ............................. 302 366 512 52 31 106 178 174 25 124 189 1334 Under Foreign Assistance Act and related programs ............................................................................ 1,509 1,672 1,905 574 370 475 253 715 380 586 224 4635 Under Export-Import Bank Act ................................................................................................................ 927 1,066 1,243 252 208 233 372 384 266 498 95 3656 Under Commodity Credit Corporation Charter Act ................................................................................. 375 1,604 175 473 1,089 26 16 48 49 49 30 657 Under other credit programs ................................................................................................................... 249 155 422 8 3 8 136 8 136 8 271 48 Receipts on other long-term assets ............................................................................................................. 748 4,697 (*) 196 186 178 4,138 .............. .............. .............. (*) ..............
C1 U.S. Government liabilities other than securities, total, net increase (+) (table 1, line 60) ................ –3,371 –2,855 –1,987 –1,461 –1,064 –671 341 –474 –1,000 –220 –293 –1,2442 Associated with military sales contracts 2 .................................................................................................... –3,361 –2,849 –1,968 –1,458 –1,064 –669 343 –469 –990 –213 –297 –1,2443 U.S. Government cash receipts from foreign governments (including principal repayments on
credits financing military sales contracts), net of refunds 1 ............................................................... 12,486 10,427 10,494 1,730 1,917 2,860 3,921 2,107 2,171 2,444 3,772 1,2484 Less U.S. Government receipts from principal repayments ................................................................... 809 748 634 289 84 278 97 174 73 296 91 2245 Less U.S. Treasury securities issued in connection with prepayments for military purchases in the
United States ....................................................................................................................................... –32 –748 1,335 –791 –981 171 852 –241 –106 .............. 1,682 –8066 Plus financing of military sales contracts by U.S. Government 5 (line A39) ......................................... 2,381 2,644 3,564 527 648 776 693 757 716 968 1,124 3167 By long-term credits ............................................................................................................................ 215 264 422 48 24 182 9 67 34 295 27 28 By short-term credits 1 ......................................................................................................................... .............. .............. .............. .............. .............. .............. .............. .............. .............. .............. .............. ..............9 By grants 1 ........................................................................................................................................... 2,166 2,380 3,143 478 624 594 683 690 683 673 1,097 315
10 Less transfers of goods and services (including transfers financed by grants for military purchases,and by credits) 1 2 (table 1, line 5) ..................................................................................................... 17,450 15,920 14,060 4,217 4,526 3,855 3,322 3,401 3,910 3,329 3,420 3,388
11 Associated with U.S. Government grants and transactions increasing Government assets (includingchanges in retained accounts) 7 (line A45) ............................................................................................. (*) (*) (*) (*) (*) (*) (*) (*) (*) (*) (*) (*)
12 Associated with other liabilities .................................................................................................................... –10 –6 –18 –3 1 –2 –2 –5 –10 –7 4 ..............13 Sales of nuclear material by Department of Energy/U.S. Enrichment Corporation .............................. –11 .............. .............. .............. .............. .............. .............. .............. .............. .............. .............. ..............14 Sales of space launch and other services by National Aeronautics and Space Administration .......... 3 –7 –6 –3 –2 –1 –1 .............. –3 –5 1 ..............15 Other sales and miscellaneous operations ............................................................................................. –2 1 –12 .............. 2 –1 –1 –5 –7 –2 2 ..............
See footnotes on page 66.

68 ● July 2001
Table 5.—Direct Investment: Income, Capital, Royalties and[Millions
Line (Credits +; debits –) 1998 1999 2000
Not seasonally adjusted
1999
I II III IV
U.S. direct investment abroad:
1 Income with current-cost adjustment, before deduction of withholding taxes (table 1, line 14) .................................... 103,835 123,718 149,240 27,834 30,363 32,268 33,2532 Earnings ......................................................................................................................................................................... 100,777 120,221 145,674 26,996 29,534 31,362 32,3293 Distributed earnings ................................................................................................................................................... 56,742 46,903 45,984 11,823 8,538 10,908 15,6344 Reinvested earnings .................................................................................................................................................. 44,034 73,318 99,691 15,173 20,996 20,454 16,6955 Interest 1 ......................................................................................................................................................................... 3,060 3,499 3,566 839 829 907 9246 U.S. parents’ receipts ................................................................................................................................................ 5,658 6,330 7,150 1,486 1,496 1,607 1,7417 U.S. parents’ payments ............................................................................................................................................. –2,599 –2,832 –3,585 –648 –667 –700 –817
8 Less: Current-cost adjustment ........................................................................................................................................... 11,512 12,835 13,180 3,142 3,200 3,236 3,2579 Less: Withholding taxes ..................................................................................................................................................... 1,648 1,705 1,273 424 252 493 536
10 Equals: Income without current-cost adjustment, after deduction of withholding taxes 2 ............................................... 90,675 109,178 134,787 24,268 26,911 28,539 29,46011 Petroleum ....................................................................................................................................................................... 7,228 10,095 18,523 1,803 2,119 2,836 3,33712 Manufacturing ................................................................................................................................................................. 29,682 33,965 39,268 7,481 8,734 8,977 8,77313 Other .............................................................................................................................................................................. 53,766 65,118 76,996 14,984 16,058 16,727 17,349
14 Capital with current-cost adjustment (table 1, line 51) ..................................................................................................... –142,516 –155,385 –152,437 –41,531 –37,819 –51,540 –24,49515 Equity capital .................................................................................................................................................................. –72,447 –58,786 –49,907 –16,834 –10,365 –23,760 –7,82716 Increases in equity capital 3 ...................................................................................................................................... –96,817 –90,802 –70,273 –20,194 –22,699 –27,552 –20,35717 Decreases in equity capital 4 .................................................................................................................................... 24,370 32,017 20,366 3,360 12,334 3,793 12,53018 Reinvested earnings ...................................................................................................................................................... –44,034 –73,318 –99,691 –15,173 –20,996 –20,454 –16,69519 Intercompany debt ......................................................................................................................................................... –26,035 –23,282 –2,840 –9,524 –6,458 –7,327 2720 U.S. parents’ receivables .......................................................................................................................................... –43,289 –34,040 –15,955 –9,159 –7,226 –14,880 –2,77521 U.S. parents’ payables .............................................................................................................................................. 17,255 10,759 13,115 –365 768 7,554 2,802
22 Less: Current-cost adjustment (line 8 with sign reversed) ............................................................................................... –11,512 –12,835 –13,180 –3,142 –3,200 –3,236 –3,257
23 Equals: Capital without current-cost adjustment 2 ............................................................................................................ –131,004 –142,550 –139,257 –38,389 –34,619 –48,304 –21,23824 Equity capital (line 15) ................................................................................................................................................... –72,447 –58,786 –49,907 –16,834 –10,365 –23,760 –7,82725 Petroleum ................................................................................................................................................................... –7,320 –6,364 –4,553 –1,347 –1,564 –86 –3,36726 Manufacturing ............................................................................................................................................................ –15,403 –14,780 –18,180 –2,791 –5,113 –4,851 –2,02527 Other .......................................................................................................................................................................... –49,725 –37,642 –27,172 –12,696 –3,689 –18,822 –2,43528 Reinvested earnings without current-cost adjustment (line 18 less line 22) ............................................................... –32,522 –60,483 –86,511 –12,031 –17,796 –17,218 –13,43829 Petroleum ................................................................................................................................................................... –512 –4,415 –13,165 –485 –869 –1,629 –1,43230 Manufacturing ............................................................................................................................................................ –10,091 –16,709 –23,466 –3,762 –5,713 –5,231 –2,00331 Other .......................................................................................................................................................................... –21,919 –39,359 –49,881 –7,784 –11,215 –10,357 –10,00332 Intercompany debt (line 19) .......................................................................................................................................... –26,035 –23,282 –2,840 –9,524 –6,458 –7,327 2733 Petroleum ................................................................................................................................................................... 339 –898 7,313 –1,434 1,451 101 –1,01634 Manufacturing ............................................................................................................................................................ 2,371 –2,614 –2,455 –582 –1,581 –2,646 2,19535 Other .......................................................................................................................................................................... –28,745 –19,770 –7,700 –7,508 –6,328 –4,782 –1,152
36 Royalties and license fees, before deduction of withholding taxes, net ......................................................................... 22,580 22,310 22,261 5,436 5,364 5,399 6,11137 U.S. parents’ receipts (table 1, part of line 9) ............................................................................................................. 24,362 24,265 24,444 5,912 5,849 5,886 6,61838 U.S. parents’ payments (table 1, part of line 26) ........................................................................................................ –1,782 –1,956 –2,184 –477 –485 –487 –507
39 Other private services, before deduction of withholding taxes, net ................................................................................. 7,720 6,262 6,623 1,767 1,388 1,587 1,52040 U.S. parents’ receipts (table 1, part of line 10) ........................................................................................................... 18,135 18,340 19,604 4,344 4,336 4,481 5,17941 U.S. parents’ payments (table 1, part of line 27) ........................................................................................................ –10,415 –12,076 –12,980 –2,576 –2,948 –2,894 –3,658
Foreign direct investment in the United States:
42 Income with current-cost adjustment, before deduction of withholding taxes (table 1, line 31) .................................... –37,582 –56,674 –68,009 –10,691 –14,826 –16,735 –14,42243 Earnings ......................................................................................................................................................................... –27,219 –41,284 –48,394 –7,557 –11,110 –12,800 –9,81744 Distributed earnings ................................................................................................................................................... –25,214 –21,299 –24,744 –3,554 –6,390 –4,317 –7,03845 Reinvested earnings .................................................................................................................................................. –2,006 –19,984 –23,651 –4,002 –4,721 –8,482 –2,77946 Interest 1 ......................................................................................................................................................................... –10,362 –15,392 –19,614 –3,135 –3,715 –3,936 –4,60647 U.S. affiliates’ payments ............................................................................................................................................ –12,188 –17,053 –22,278 –3,528 –4,095 –4,327 –5,10348 U.S. affiliates’ receipts ............................................................................................................................................... 1,825 1,662 2,664 393 380 392 497
49 Less: Current-cost adjustment ........................................................................................................................................... –3,775 –6,031 –6,539 –1,363 –1,484 –1,568 –1,61650 Less: Withholding taxes ..................................................................................................................................................... –1,404 –864 –1,312 –136 –207 –262 –259
51 Equals: Income without current-cost adjustment, after deduction of withholding taxes 2 ............................................... –32,403 –49,779 –60,158 –9,192 –13,135 –14,905 –12,54752 Petroleum ................................................................................................................................................................... –1,443 –4,811 –13,915 57 –1,488 –2,387 –99353 Manufacturing ............................................................................................................................................................ –19,319 –26,736 –25,550 –5,730 –6,908 –6,936 –7,16254 Other .......................................................................................................................................................................... –11,640 –18,234 –20,693 –3,520 –4,739 –5,582 –4,393
55 Capital with current-cost adjustment (table 1, line 64) ..................................................................................................... 178,209 301,006 287,655 35,465 151,921 51,997 61,62356 Equity capital .................................................................................................................................................................. 147,091 225,619 216,749 14,731 133,803 30,500 46,58557 Increases in equity capital 3 ...................................................................................................................................... 185,217 254,278 233,864 23,368 138,313 32,607 59,99058 Decreases in equity capital 4 .................................................................................................................................... –38,126 –28,659 –17,115 –8,637 –4,510 –2,107 –13,40559 Reinvested earnings ...................................................................................................................................................... 2,006 19,984 23,651 4,002 4,721 8,482 2,77960 Intercompany debt ......................................................................................................................................................... 29,111 55,404 47,255 16,732 13,398 13,014 12,26061 U.S. affiliates’ payables ............................................................................................................................................. 43,964 55,396 66,674 18,226 5,912 21,212 10,04662 U.S. affiliates’ receivables ......................................................................................................................................... –14,853 10 –19,418 –1,494 7,486 –8,197 2,215
63 Less: Current-cost adjustment (line 49 with sign reversed) ............................................................................................. 3,775 6,031 6,539 1,363 1,484 1,568 1,616
64 Equals: Capital without current-cost adjustment 2 ............................................................................................................ 174,434 294,975 281,116 34,102 150,437 50,429 60,00765 Equity capital (line 56) ................................................................................................................................................... 147,091 225,619 216,749 14,731 133,803 30,500 46,58566 Petroleum ................................................................................................................................................................... 57,337 915 35,599 12 424 271 20867 Manufacturing ............................................................................................................................................................ 59,666 53,065 55,434 7,722 29,697 6,165 9,48168 Other .......................................................................................................................................................................... 30,087 171,637 125,715 6,997 103,681 24,064 36,89569 Reinvested earnings without current-cost adjustment (line 59 less line 63) ............................................................... –1,769 13,953 17,112 2,639 3,237 6,914 1,16370 Petroleum ................................................................................................................................................................... –661 2,844 9,667 –350 1,033 1,944 21771 Manufacturing ............................................................................................................................................................ 545 9,109 5,687 2,959 1,661 3,162 1,32772 Other .......................................................................................................................................................................... –1,654 2,002 1,758 31 543 1,809 –38173 Intercompany debt (line 60) .......................................................................................................................................... 29,111 55,404 47,255 16,732 13,398 13,014 12,26074 Petroleum ................................................................................................................................................................... 2,247 1,890 2,801 587 382 834 8775 Manufacturing ............................................................................................................................................................ 23,196 28,710 33,938 15,005 6,047 3,581 4,07776 Other .......................................................................................................................................................................... 3,670 24,804 10,516 1,140 6,969 8,600 8,095
77 Royalties and license fees, before deduction of withholding taxes, net ......................................................................... –4,814 –6,195 –7,809 –1,301 –1,473 –1,422 –1,99978 U.S. affiliates’ payments (table 1, part of line 26) ....................................................................................................... –6,765 –7,835 –9,986 –1,758 –1,855 –1,832 –2,39079 U.S. affiliates’ receipts (table 1, part of line 9) ............................................................................................................ 1,951 1,640 2,177 456 382 411 391
80 Other private services, before deduction of withholding taxes, net ................................................................................. 1,018 116 –296 380 –251 –149 13681 U.S. affiliates’ payments (table 1, part of line 27) ....................................................................................................... –9,022 –10,512 –12,320 –2,305 –2,687 –2,632 –2,88882 U.S. affiliates’ receipts (table 1, part of line 10) .......................................................................................................... 10,041 10,629 12,024 2,685 2,436 2,484 3,024
See footnotes on page 66.

July 2001 ● 69
License Fees, and Other Private Servicesof dollars]
Not seasonally adjusted Seasonally adjusted
Line2000 2001 1999 2000 2001
I II III IV I p I II III IV I II III IV I p
35,309 37,955 37,046 38,930 38,955 27,557 29,994 32,469 33,698 34,734 37,591 37,335 39,581 38,349 134,469 37,133 36,200 37,872 37,996 26,718 29,165 31,562 32,774 33,894 36,769 36,489 38,523 37,391 2
7,869 10,235 9,327 18,553 9,134 14,549 9,514 12,899 9,943 9,820 12,151 11,559 12,454 11,492 326,601 26,898 26,873 19,319 28,862 12,169 19,651 18,663 22,831 24,074 24,618 24,930 26,069 25,899 4
840 822 846 1,058 958 839 829 907 924 840 822 846 1,058 958 51,628 1,714 1,819 1,989 1,922 1,486 1,496 1,607 1,741 1,628 1,714 1,819 1,989 1,922 6–789 –892 –973 –931 –964 –648 –667 –700 –817 –789 –892 –973 –931 –964 7
3,212 3,254 3,316 3,398 3,500 3,142 3,200 3,236 3,257 3,212 3,254 3,316 3,398 3,500 8298 316 239 420 342 507 274 564 360 344 359 268 302 407 9
31,799 34,385 33,491 35,112 35,113 23,908 26,519 28,669 30,080 31,177 33,978 33,751 35,881 34,443 103,990 4,094 4,736 5,703 5,124 1,573 2,138 2,936 3,446 3,507 4,170 4,929 5,917 4,567 119,822 10,347 9,722 9,377 9,372 7,351 8,323 9,006 9,285 9,683 9,864 9,789 9,932 9,259 12
17,987 19,944 19,033 20,032 20,617 14,984 16,058 16,727 17,349 17,987 19,944 19,033 20,032 20,617 13
–40,915 –35,626 –43,576 –32,320 –35,978 –38,527 –36,474 –49,750 –30,631 –38,388 –33,346 –41,634 –39,070 –33,015 14–15,531 –14,323 –7,885 –12,168 –11,587 –16,834 –10,365 –23,760 –7,827 –15,531 –14,323 –7,885 –12,168 –11,587 15–18,275 –19,324 –13,685 –18,989 –14,967 –20,194 –22,699 –27,552 –20,357 –18,275 –19,324 –13,685 –18,989 –14,967 16
2,744 5,001 5,800 6,821 3,380 3,360 12,334 3,793 12,530 2,744 5,001 5,800 6,821 3,380 17–26,601 –26,898 –26,873 –19,319 –28,862 –12,169 –19,651 –18,663 –22,831 –24,074 –24,618 –24,930 –26,069 –25,899 18
1,217 5,595 –8,819 –833 4,471 –9,524 –6,458 –7,327 27 1,217 5,595 –8,819 –833 4,471 19–3,867 –1,214 –5,635 –5,239 4,363 –9,159 –7,226 –14,880 –2,775 –3,867 –1,214 –5,635 –5,239 4,363 20
5,084 6,809 –3,184 4,406 108 –365 768 7,554 2,802 5,084 6,809 –3,184 4,406 108 21
–3,212 –3,254 –3,316 –3,398 –3,500 –3,142 –3,200 –3,236 –3,257 –3,212 –3,254 –3,316 –3,398 –3,500 22
–37,703 –32,372 –40,260 –28,922 –32,478 –35,385 –33,274 –46,514 –27,374 –35,176 –30,092 –38,318 –35,672 –29,515 23–15,531 –14,323 –7,885 –12,168 –11,587 –16,834 –10,365 –23,760 –7,827 –15,531 –14,323 –7,885 –12,168 –11,587 24
–567 –2,556 –550 –880 –2,335 –1,347 –1,564 –86 –3,367 –567 –2,556 –550 –880 –2,335 25–5,808 –4,637 –2,246 –5,489 –4,308 –2,791 –5,113 –4,851 –2,025 –5,808 –4,637 –2,246 –5,489 –4,308 26–9,156 –7,129 –5,089 –5,798 –4,944 –12,696 –3,689 –18,822 –2,435 –9,156 –7,129 –5,089 –5,798 –4,944 27
–23,389 –23,644 –23,557 –15,921 –25,362 –9,027 –16,451 –15,427 –19,574 –20,862 –21,364 –21,614 –22,671 –22,399 28–3,159 –3,122 –3,433 –3,451 –3,823 –52 –728 –1,503 –2,128 –2,494 –2,971 –3,371 –4,328 –2,987 29–6,501 –6,885 –6,577 –3,503 –5,257 –2,699 –4,690 –4,717 –4,603 –5,513 –5,754 –6,235 –5,964 –4,060 30
–13,729 –13,638 –13,547 –8,967 –16,281 –6,276 –11,033 –9,207 –12,843 –12,855 –12,639 –12,008 –12,379 –15,352 311,217 5,595 –8,819 –833 4,471 –9,524 –6,458 –7,327 27 1,217 5,595 –8,819 –833 4,471 321,725 4,070 –472 1,990 310 –1,434 1,451 101 –1,016 1,725 4,070 –472 1,990 310 33
–3,319 –708 1,819 –247 2,087 –582 –1,581 –2,646 2,195 –3,319 –708 1,819 –247 2,087 342,811 2,233 –10,167 –2,577 2,073 –7,508 –6,328 –4,782 –1,152 2,811 2,233 –10,167 –2,577 2,073 35
5,361 5,515 5,397 5,988 5,410 5,659 5,526 5,525 5,599 5,581 5,673 5,529 5,477 5,636 365,903 6,044 5,939 6,558 5,972 6,136 6,011 6,012 6,106 6,123 6,203 6,071 6,047 6,198 37–542 –530 –542 –570 –562 –477 –485 –487 –507 –542 –530 –542 –570 –562 38
1,511 1,722 1,496 1,894 2,174 1,638 1,390 1,662 1,574 1,360 1,757 1,590 1,918 2,053 394,621 4,860 4,701 5,422 5,134 4,500 4,369 4,661 4,810 4,797 4,897 4,894 5,016 5,328 40
–3,109 –3,138 –3,205 –3,528 –2,959 –2,862 –2,979 –2,999 –3,236 –3,437 –3,140 –3,304 –3,098 –3,275 41
–18,003 –20,051 –16,369 –13,586 –14,699 –11,009 –14,249 –16,649 –14,766 –18,369 –19,474 –16,286 –13,878 –15,086 42–13,972 –15,457 –11,023 –7,942 –9,338 –7,874 –10,534 –12,713 –10,160 –14,338 –14,880 –10,941 –8,234 –9,725 43
–6,417 –5,249 –5,561 –7,517 –6,474 –4,116 –6,381 –5,424 –5,377 –7,186 –4,842 –6,688 –6,026 –7,295 44–7,555 –10,209 –5,462 –425 –2,863 –3,758 –4,153 –7,289 –4,783 –7,152 –10,038 –4,253 –2,208 –2,430 45–4,031 –4,594 –5,345 –5,644 –5,361 –3,135 –3,715 –3,936 –4,606 –4,031 –4,594 –5,345 –5,644 –5,361 46–4,738 –5,217 –5,986 –6,337 –5,981 –3,528 –4,095 –4,327 –5,103 –4,738 –5,217 –5,986 –6,337 –5,981 47
707 623 641 693 620 393 380 392 497 707 623 641 693 620 48
–1,547 –1,595 –1,659 –1,738 –1,833 –1,363 –1,484 –1,568 –1,616 –1,547 –1,595 –1,659 –1,738 –1,833 49–326 –315 –286 –385 –318 –168 –266 –272 –157 –410 –389 –282 –230 –423 50
–16,130 –18,141 –14,424 –11,463 –12,548 –9,479 –12,499 –14,809 –12,994 –16,413 –17,489 –14,345 –11,911 –12,830 51–2,643 –3,920 –4,143 –3,209 –3,922 57 –1,488 –2,387 –993 –2,643 –3,920 –4,143 –3,209 –3,922 52–7,578 –8,340 –6,101 –3,531 –4,012 –6,016 –6,272 –6,840 –7,608 –7,861 –7,688 –6,022 –3,979 –4,295 53–5,909 –5,881 –4,180 –4,723 –4,613 –3,520 –4,739 –5,582 –4,393 –5,909 –5,881 –4,180 –4,723 –4,613 54
36,911 90,565 77,255 82,924 42,072 35,221 151,354 50,803 63,628 36,508 90,394 76,046 84,707 41,638 5525,012 73,056 37,246 81,435 26,264 14,731 133,803 30,500 46,585 25,012 73,056 37,246 81,435 26,264 5630,516 75,614 44,255 83,479 26,994 23,368 138,313 32,607 59,990 30,516 75,614 44,255 83,479 26,994 57–5,504 –2,557 –7,009 –2,045 –730 –8,637 –4,510 –2,107 –13,405 –5,504 –2,557 –7,009 –2,045 –730 58
7,555 10,209 5,462 425 2,863 3,758 4,153 7,289 4,783 7,152 10,038 4,253 2,208 2,430 594,344 7,300 34,547 1,064 12,944 16,732 13,398 13,014 12,260 4,344 7,300 34,547 1,064 12,944 60
10,832 10,461 35,456 9,925 –518 18,226 5,912 21,212 10,046 10,832 10,461 35,456 9,925 –518 61–6,488 –3,160 –909 –8,861 13,463 –1,494 7,486 –8,197 2,215 –6,488 –3,160 –909 –8,861 13,463 62
1,547 1,595 1,659 1,738 1,833 1,363 1,484 1,568 1,616 1,547 1,595 1,659 1,738 1,833 63
35,364 88,970 75,596 81,186 40,239 33,858 149,870 49,235 62,012 34,961 88,799 74,387 82,969 39,805 6425,012 73,056 37,246 81,435 26,264 14,731 133,803 30,500 46,585 25,012 73,056 37,246 81,435 26,264 65
125 34,179 131 1,164 1,378 12 424 271 208 125 34,179 131 1,164 1,378 668,274 10,920 5,824 30,416 8,917 7,722 29,697 6,165 9,481 8,274 10,920 5,824 30,416 8,917 67
16,613 27,957 31,291 49,854 15,969 6,997 103,681 24,064 36,895 16,613 27,957 31,291 49,854 15,969 686,008 8,614 3,803 –1,313 1,030 2,395 2,669 5,721 3,167 5,605 8,443 2,594 470 597 692,192 3,127 2,709 1,639 1,540 –350 1,033 1,944 217 2,192 3,127 2,709 1,639 1,540 701,786 5,186 1,376 –2,661 –707 3,157 739 2,356 2,855 1,920 4,561 521 –1,315 –491 712,030 301 –282 –291 197 –412 897 1,421 95 1,493 755 –636 146 –452 724,344 7,300 34,547 1,064 12,944 16,732 13,398 13,014 12,260 4,344 7,300 34,547 1,064 12,944 73
475 –163 949 1,540 –720 587 382 834 87 475 –163 949 1,540 –720 744,757 4,772 26,733 –2,324 10,976 15,005 6,047 3,581 4,077 4,757 4,772 26,733 –2,324 10,976 75–888 2,692 6,864 1,848 2,689 1,140 6,969 8,600 8,095 –888 2,692 6,864 1,848 2,689 76
–1,754 –1,874 –1,913 –2,268 –2,325 –1,337 –1,465 –1,521 –1,874 –1,812 –1,849 –2,022 –2,125 –2,389 77–2,175 –2,277 –2,459 –3,075 –2,965 –1,819 –1,917 –1,937 –2,163 –2,259 –2,348 –2,613 –2,767 –3,071 78
421 403 546 807 640 482 452 416 289 447 499 591 642 682 79
238 –258 –32 –244 –202 341 –107 –210 93 163 –84 –100 –274 –335 80–2,595 –2,903 –3,128 –3,694 –3,652 –2,437 –2,708 –2,663 –2,704 –2,764 –2,925 –3,160 –3,470 –3,890 81
2,833 2,645 3,096 3,450 3,450 2,778 2,601 2,453 2,797 2,927 2,841 3,060 3,196 3,555 82

70 ● July 2001
Table 6.—Securities Transactions[Millions of dollars]
Line (Credits +; debits –) 1998 1999 2000
Not seasonally adjusted
1999 2000 2001
I II III IV I II III IV I p
A1 Foreign securities, net U.S. purchases (–), (table 1, line 52 or lines 2 + 13 below) ..... –136,135 –131,217 –124,935 975 –71,379 –42,415 –18,398 –27,546 –39,639 –33,129 –24,621 –28,535
2 Stocks, net U.S. purchases ................................................................................................ –101,284 –114,391 –99,735 4,955 –71,089 –30,427 –17,830 –15,638 –46,466 –15,272 –22,359 –25,530
3 New issues in the United States ...................................................................................... –11,608 –8,770 –15,526 –1,121 –3,047 –2,614 –1,988 –1,894 –8,075 –3,641 –1,916 –1,1424 Of which Western Europe ............................................................................................ –3,949 (D) –2,924 .............. (D) –445 –665 .............. –2,645 –279 .............. (D)5 Canada .......................................................................................................... (D) (D) –1,665 .............. –1,361 –1,496 (D) –737 .............. –186 –742 ..............6 Latin America ................................................................................................ (D) (D) –1,477 .............. (D) (D) .............. .............. –1,477 .............. .............. ..............
7 Transactions in outstanding stocks, net ........................................................................... –89,676 –105,621 –84,209 6,076 –68,042 –27,813 –15,842 –13,744 –38,391 –11,631 –20,443 –24,3888 Western Europe ........................................................................................................ –70,515 –43,671 –54,216 15,634 –59,410 –2,957 3,062 –273 –27,193 –12,184 –14,566 –12,9779 Of which United Kingdom .................................................................................... –44,483 –45,270 –41,472 12,991 –56,825 –192 –1,244 –3,157 –23,107 –8,337 –6,871 –9,285
10 Canada ...................................................................................................................... 3,779 –2,456 –17,972 –46 1,280 –3,355 –335 –3,131 –5,413 –2,999 –6,429 25411 Japan ........................................................................................................................ –1,538 –46,045 17,709 –8,720 –8,580 –8,909 –19,836 –1,561 11,729 5,904 1,637 –6,48012 Other ......................................................................................................................... –21,402 –13,449 –29,730 –792 –1,332 –12,592 1,267 –8,779 –17,514 –2,352 –1,085 –5,185
13 Bonds, net U.S. purchases ................................................................................................ –34,851 –16,826 –25,200 –3,980 –290 –11,988 –568 –11,908 6,827 –17,857 –2,262 –3,005
14 New issues in the United States ...................................................................................... –58,295 –34,775 –54,273 –7,791 –14,208 –9,673 –3,103 –11,187 –7,811 –22,864 –12,411 –8,325By issuer:
15 Central governments and their agencies and corporations .................................... –8,701 –11,439 –15,548 –3,790 –4,677 –1,150 –1,822 –6,500 –2,400 –6,648 .............. –3,25316 Other governments and their agencies and corporations 1 .................................... –2,764 –1,450 –1,595 –225 –1,175 .............. –50 –350 .............. –1,000 –245 –5917 Private corporations .................................................................................................. –46,420 –21,886 –36,898 –3,776 –8,356 –8,523 –1,231 –4,337 –5,180 –15,215 –12,166 –4,81318 International financial institutions 2 ........................................................................... –410 ................ –232 .............. .............. .............. .............. .............. –231 –1 .............. –200
By area:19 Western Europe ........................................................................................................ –17,474 –8,797 –26,745 .............. –3,797 –5,000 .............. –872 –3,425 –11,913 –10,535 –35020 Canada ...................................................................................................................... –9,940 –4,794 –2,662 –1,825 –724 –1,545 –700 –385 –615 –1,377 –285 –92321 Japan ........................................................................................................................ –2,271 –50 –2,000 –50 .............. .............. .............. –2,000 .............. .............. .............. ..............22 Latin America ............................................................................................................ –13,011 –12,834 –17,894 –3,460 –6,760 –550 –2,064 –6,070 –2,431 –8,648 –745 –4,76323 Other countries ......................................................................................................... –14,984 –8,300 –4,972 –2,456 –2,927 –2,578 –339 –1,860 –1,340 –926 –846 –2,08924 International financial institutions 2 ........................................................................... –615 ................ ................ .............. .............. .............. .............. .............. .............. .............. .............. –200
25 Redemptions of U.S.-held foreign bonds 3 ....................................................................... 17,522 18,532 20,886 3,463 2,415 6,572 6,082 2,364 5,626 5,951 6,945 7,42226 Western Europe ........................................................................................................ 3,682 5,254 4,120 799 1,403 1,584 1,468 433 491 1,855 1,341 1,67027 Canada ...................................................................................................................... 3,135 4,273 6,927 1,122 572 1,785 794 1,008 3,886 750 1,283 1,57128 Other countries ......................................................................................................... 9,974 6,447 8,148 1,376 185 2,213 2,673 783 853 2,661 3,851 2,32429 International financial institutions 2 ........................................................................... 731 2,558 1,691 166 255 990 1,147 140 396 685 470 1,857
30 Other transactions in outstanding bonds, net 3 ................................................................ 5,922 –583 8,187 348 11,503 –8,887 –3,547 –3,085 9,012 –944 3,204 –2,10231 Western Europe ........................................................................................................ –7,533 –4,895 –19,589 1,754 9,046 –9,506 –6,189 –8,937 –967 –11,733 2,048 –11,32332 Of which United Kingdom .................................................................................... –10,295 –2,449 –26,668 1,251 10,359 –9,070 –4,989 –9,385 –1,124 –13,862 –2,297 –13,83633 Canada ...................................................................................................................... 1,632 328 652 –257 334 –37 288 –530 –2,034 3,844 –628 –24634 Japan ........................................................................................................................ 3,241 2,222 5,608 –1,718 3,206 –788 1,522 1,834 1,515 1,517 742 84035 Other ......................................................................................................................... 8,582 1,762 21,516 569 –1,083 1,444 832 4,548 10,498 5,428 1,042 8,627
B1 U.S. securities, excluding Treasury securities and transactions of foreign officialagencies, net foreign purchases (+), (table 1, line 66 or lines 2 + 10 below) ........... 218,091 343,963 485,644 63,430 83,903 95,412 101,218 136,208 94,400 128,393 126,643 147,132
2 Stocks, net foreign purchases ........................................................................................... 45,647 112,956 192,741 10,400 32,965 24,701 44,890 66,045 33,619 53,825 39,252 41,030
By area:3 Western Europe ............................................................................................................ 62,194 91,932 181,263 18,932 19,336 22,322 31,342 62,150 40,847 44,382 33,884 33,6164 Of which Germany .................................................................................................... 9,067 13,367 31,600 2,370 4,170 1,062 5,765 15,542 9,297 3,649 3,112 3,7385 Switzerland ................................................................................................ 4,836 5,377 11,727 2,090 3,834 –959 412 6,753 2,268 3,548 –842 2,0486 United Kingdom ........................................................................................ 21,776 40,603 71,810 7,690 4,661 17,497 10,755 13,515 15,668 24,430 18,197 11,1647 Canada .......................................................................................................................... –5,634 11,681 7,690 1,170 2,233 –806 9,084 1,730 1,146 604 4,210 4,3838 Japan ............................................................................................................................. –1,680 5,131 2,018 –2,898 2,060 3,452 2,517 –5,344 –1,072 3,540 4,894 8269 Other .............................................................................................................................. –9,233 4,212 1,770 –6,804 9,336 –267 1,947 7,509 –7,302 5,299 –3,736 2,205
10 Corporate and other bonds, net foreign purchases ....................................................... 172,444 231,007 292,903 53,030 50,938 70,711 56,328 70,163 60,781 74,568 87,391 106,102
By type:11 New issues sold abroad by U.S. corporations ............................................................ 53,977 41,843 64,965 9,332 7,823 18,298 6,390 13,560 17,759 23,788 9,858 17,69412 U.S. federally sponsored agency bonds, net .............................................................. 50,397 71,784 111,830 18,100 17,045 21,063 15,576 26,010 18,998 28,589 38,233 38,76813 Other outstanding bonds, net ....................................................................................... 68,070 117,380 116,108 25,598 26,070 31,350 34,362 30,593 24,024 22,191 39,300 49,640
By area:14 Western Europe ............................................................................................................ 125,544 135,088 167,375 31,151 31,415 41,869 30,653 44,702 33,049 42,420 47,204 61,52815 Of which Germany .................................................................................................... 4,431 6,502 3,100 1,851 1,387 2,463 801 190 1,222 837 851 3,33016 Switzerland ................................................................................................ 3,564 4,178 2,883 1,093 475 1,450 1,160 759 565 1,060 499 2,68617 United Kingdom ........................................................................................ 99,095 107,038 141,330 23,535 25,275 32,003 26,225 40,053 27,080 35,850 38,347 48,54918 Canada .......................................................................................................................... 5,911 4,472 10,890 1,081 532 1,066 1,793 3,368 2,147 3,094 2,281 89219 Japan ............................................................................................................................. 8,377 17,560 38,896 1,317 1,527 8,898 5,818 4,217 8,030 12,584 14,065 7,40320 Other countries .............................................................................................................. 32,358 73,451 75,794 19,658 17,467 18,329 17,997 17,987 17,552 16,285 23,970 36,13221 International financial institutions 2 ............................................................................... 254 436 –52 –177 –3 549 67 –111 3 185 –129 147
Memoranda:Other foreign transactions in marketable, long-term U.S. securities included elsewhere in
international transactions accounts:
Foreign official assets in the United States (lines in table 9):1 U.S. Treasury marketable bonds (line A4) ........................................................................... 4,123 –9,861 –6,302 –7,081 –3,076 –1,093 1,389 7,977 3,586 –6,816 –11,049 3,1422 Other U.S. Government securities (line A6) ......................................................................... 6,332 20,350 40,909 5,993 5,792 1,835 6,730 8,107 10,334 14,272 8,196 3,5743 U.S. corporate and other bonds (part of line A14) .............................................................. 202 1,543 2,019 –310 –678 1,590 941 423 491 422 683 1,0334 U.S. stocks (part of line A14) ............................................................................................... –3,689 –628 1,108 415 161 –1,379 175 508 413 –110 297 –305 Other foreign transactions in U.S. Treasury bonds and notes (table 9, line B4) ................... 44,202 –672 –48,025 –9,059 4,682 13,923 –10,218 –9,871 –14,149 –7,984 –16,021 –522
See footnotes on page 66.
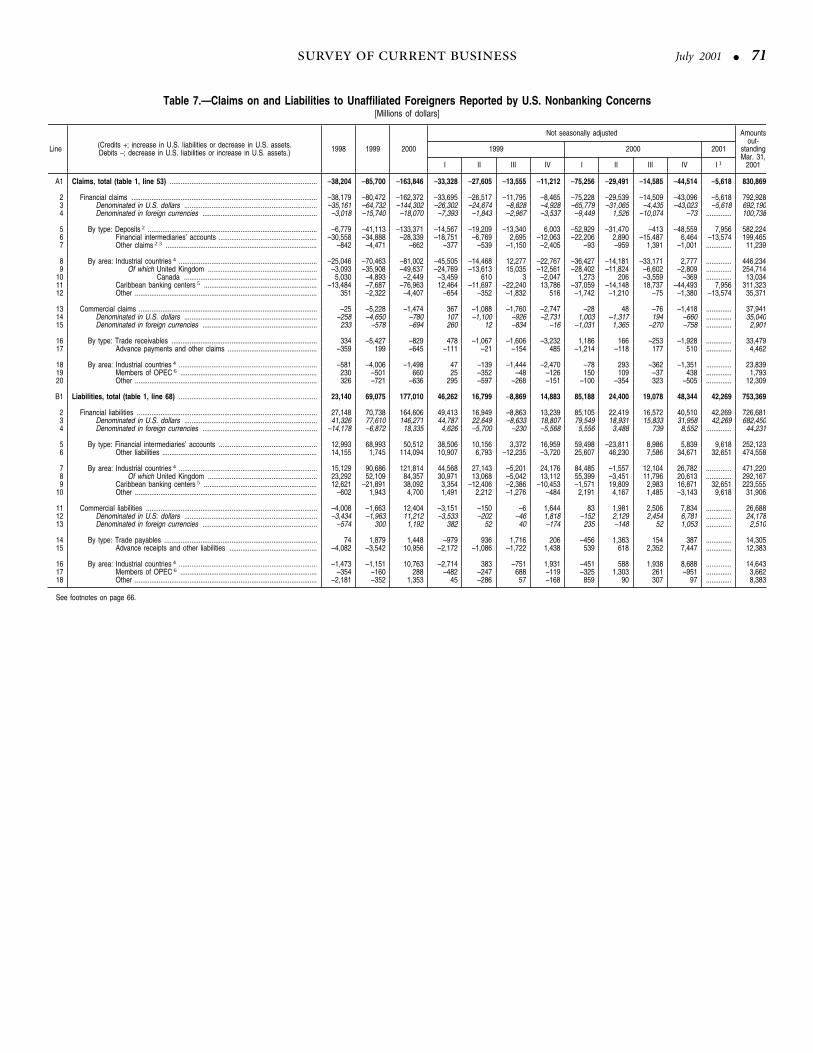
July 2001 ● 71
Table 7.—Claims on and Liabilities to Unaffiliated Foreigners Reported by U.S. Nonbanking Concerns[Millions of dollars]
Line (Credits +; increase in U.S. liabilities or decrease in U.S. assets.Debits –; decrease in U.S. liabilities or increase in U.S. assets.) 1998 1999 2000
Not seasonally adjusted Amountsout-
standingMar. 31,
2001
1999 2000 2001
I II III IV I II III IV I 1
A1 Claims, total (table 1, line 53) ................................................................................. –38,204 –85,700 –163,846 –33,328 –27,605 –13,555 –11,212 –75,256 –29,491 –14,585 –44,514 –5,618 830,869
2 Financial claims ...................................................................................................... –38,179 –80,472 –162,372 –33,695 –26,517 –11,795 –8,465 –75,228 –29,539 –14,509 –43,096 –5,618 792,9283 Denominated in U.S. dollars ......................................................................... –35,161 –64,732 –144,302 –26,302 –24,674 –8,828 –4,928 –65,779 –31,065 –4,435 –43,023 –5,618 692,1904 Denominated in foreign currencies ............................................................... –3,018 –15,740 –18,070 –7,393 –1,843 –2,967 –3,537 –9,449 1,526 –10,074 –73 .............. 100,738
5 By type: Deposits 2 ............................................................................................. –6,779 –41,113 –133,371 –14,567 –19,209 –13,340 6,003 –52,929 –31,470 –413 –48,559 7,956 582,2246 Financial intermediaries’ accounts ...................................................... –30,558 –34,888 –28,339 –18,751 –6,769 2,695 –12,063 –22,206 2,890 –15,487 6,464 –13,574 199,4657 Other claims 2 3 ................................................................................... –842 –4,471 –662 –377 –539 –1,150 –2,405 –93 –959 1,391 –1,001 .............. 11,239
8 By area: Industrial countries 4 ............................................................................ –25,046 –70,463 –81,002 –45,505 –14,468 12,277 –22,767 –36,427 –14,181 –33,171 2,777 .............. 446,2349 Of which United Kingdom ............................................................ –3,093 –35,908 –49,637 –24,769 –13,613 15,035 –12,561 –28,402 –11,824 –6,602 –2,809 .............. 254,714
10 Canada ......................................................................... 5,030 –4,893 –2,449 –3,459 610 3 –2,047 1,273 206 –3,559 –369 .............. 13,03411 Caribbean banking centers 5 .............................................................. –13,484 –7,687 –76,963 12,464 –11,697 –22,240 13,786 –37,059 –14,148 18,737 –44,493 7,956 311,32312 Other .................................................................................................... 351 –2,322 –4,407 –654 –352 –1,832 516 –1,742 –1,210 –75 –1,380 –13,574 35,371
13 Commercial claims .................................................................................................. –25 –5,228 –1,474 367 –1,088 –1,760 –2,747 –28 48 –76 –1,418 .............. 37,94114 Denominated in U.S. dollars ......................................................................... –258 –4,650 –780 107 –1,100 –926 –2,731 1,003 –1,317 194 –660 .............. 35,04015 Denominated in foreign currencies ............................................................... 233 –578 –694 260 12 –834 –16 –1,031 1,365 –270 –758 .............. 2,901
16 By type: Trade receivables ................................................................................ 334 –5,427 –829 478 –1,067 –1,606 –3,232 1,186 166 –253 –1,928 .............. 33,47917 Advance payments and other claims ................................................. –359 199 –645 –111 –21 –154 485 –1,214 –118 177 510 .............. 4,462
18 By area: Industrial countries 4 ............................................................................ –581 –4,006 –1,498 47 –139 –1,444 –2,470 –78 293 –362 –1,351 .............. 23,83919 Members of OPEC 6 ........................................................................... 230 –501 660 25 –352 –48 –126 150 109 –37 438 .............. 1,79320 Other .................................................................................................... 326 –721 –636 295 –597 –268 –151 –100 –354 323 –505 .............. 12,309
B1 Liabilities, total (table 1, line 68) ............................................................................ 23,140 69,075 177,010 46,262 16,799 –8,869 14,883 85,188 24,400 19,078 48,344 42,269 753,369
2 Financial liabilities ................................................................................................... 27,148 70,738 164,606 49,413 16,949 –8,863 13,239 85,105 22,419 16,572 40,510 42,269 726,6813 Denominated in U.S. dollars ......................................................................... 41,326 77,610 146,271 44,787 22,649 –8,633 18,807 79,549 18,931 15,833 31,958 42,269 682,4504 Denominated in foreign currencies ............................................................... –14,178 –6,872 18,335 4,626 –5,700 –230 –5,568 5,556 3,488 739 8,552 .............. 44,231
5 By type: Financial intermediaries’ accounts ...................................................... 12,993 68,993 50,512 38,506 10,156 3,372 16,959 59,498 –23,811 8,986 5,839 9,618 252,1236 Other liabilities ..................................................................................... 14,155 1,745 114,094 10,907 6,793 –12,235 –3,720 25,607 46,230 7,586 34,671 32,651 474,558
7 By area: Industrial countries 4 ............................................................................ 15,129 90,686 121,814 44,568 27,143 –5,201 24,176 84,485 –1,557 12,104 26,782 .............. 471,2208 Of which United Kingdom ............................................................ 23,292 52,109 84,357 30,971 13,068 –5,042 13,112 55,399 –3,451 11,796 20,613 .............. 292,1679 Caribbean banking centers 5 .............................................................. 12,621 –21,891 38,092 3,354 –12,406 –2,386 –10,453 –1,571 19,809 2,983 16,871 32,651 223,555
10 Other .................................................................................................... –602 1,943 4,700 1,491 2,212 –1,276 –484 2,191 4,167 1,485 –3,143 9,618 31,906
11 Commercial liabilities .............................................................................................. –4,008 –1,663 12,404 –3,151 –150 –6 1,644 83 1,981 2,506 7,834 .............. 26,68812 Denominated in U.S. dollars ......................................................................... –3,434 –1,963 11,212 –3,533 –202 –46 1,818 –152 2,129 2,454 6,781 .............. 24,17813 Denominated in foreign currencies ............................................................... –574 300 1,192 382 52 40 –174 235 –148 52 1,053 .............. 2,510
14 By type: Trade payables .................................................................................... 74 1,879 1,448 –979 936 1,716 206 –456 1,363 154 387 .............. 14,30515 Advance receipts and other liabilities ................................................ –4,082 –3,542 10,956 –2,172 –1,086 –1,722 1,438 539 618 2,352 7,447 .............. 12,383
16 By area: Industrial countries 4 ............................................................................ –1,473 –1,151 10,763 –2,714 383 –751 1,931 –451 588 1,938 8,688 .............. 14,64317 Members of OPEC 6 ........................................................................... –354 –160 288 –482 –247 688 –119 –325 1,303 261 –951 .............. 3,66218 Other .................................................................................................... –2,181 –352 1,353 45 –286 57 –168 859 90 307 97 .............. 8,383
See footnotes on page 66.

72 ● July 2001
Table 8.—Claims on Foreigners Reported by U.S. Banks[Millions of dollars]
Line (Credits +; decrease in U.S. assets. Debits –; increase in U.S. assets.) 1998 1999 2000
Not seasonally adjusted Amountsoutstand-ing Mar.31, 2001
1999 2000 2001
I II III IV I II III IV I p
1 Total (table 1, line 54) ........................................................................................... –35,572 –76,263 –138,500 23,037 –36,016 –10,476 –52,808 –56,234 7,455 –18,147 –71,574 –90,027 1,347,402
By type:2 Banks’ own claims .......................................................................................... –18,739 –49,907 –111,665 29,286 –23,505 –14,101 –41,587 –14,840 –23,286 –22,160 –51,379 –101,013 1,055,380
3 Payable in dollars ...................................................................................... –26,770 –58,144 –118,740 35,039 –42,719 –9,843 –40,621 –17,396 –18,056 –27,883 –55,405 –82,788 984,305
By borrower:Claims on:
4 own foreign offices ........................................................................ –52,850 –45,147 –100,423 26,950 –21,764 –272 –50,061 –23,777 –5,686 –33,502 –37,458 –43,493 667,3585 unaffiliated foreign banks .............................................................. 3,024 9,020 –2,436 12,044 –10,483 2,339 5,120 7,263 967 1,812 –12,478 –13,658 108,6236 foreign public borrowers 1 ............................................................. –2,961 –11,548 –3,237 –10,069 –3,078 2,271 –672 –1,496 –4,638 787 2,110 –7,695 49,0977 other private foreigners ................................................................. 26,017 –10,469 –12,644 6,114 –7,394 –14,181 4,992 614 –8,699 3,020 –7,579 –17,942 159,227
By type of reporting institution: 2
U.S.-owned banks’ claims on:8 own foreign offices ........................................................................ 4,432 –5,082 –35,408 21,093 8,391 –13,390 –21,176 13,706 –18,591 –16,354 –14,169 –7,895 211,4989 unaffiliated foreign banks .............................................................. 1,033 –8,446 –3,013 –2,314 388 2,579 –9,099 6,260 –1,950 –542 –6,781 –12,677 54,516
10 other foreigners ............................................................................. –5,366 70 –518 5,498 –1,512 –1,417 –2,499 1,881 972 –11 –3,360 8,533 54,079Foreign-owned banks’ claims on:
11 own foreign offices ........................................................................ –57,282 –40,065 –65,015 5,857 –30,155 13,118 –28,885 –37,483 12,905 –17,148 –23,289 –35,598 455,86012 unaffiliated foreign banks .............................................................. 5,296 18,903 –1,499 9,838 –4,897 1,433 12,529 –3,641 4,906 595 –3,359 –1,368 38,65213 other foreigners ............................................................................. –1,838 –7,175 –7,380 –5,708 –868 471 –1,070 1,334 –3,603 –128 –4,983 –5,880 56,242
U.S. brokers’ and dealers’ claims on:14 unaffiliated foreign banks .............................................................. –3,305 –1,437 2,076 4,520 –5,974 –1,673 1,690 4,644 –1,989 1,759 –2,338 387 15,45515 other foreigners ............................................................................. 30,260 –14,912 –7,983 –3,745 –8,092 –10,964 7,889 –4,097 –10,706 3,946 2,874 –28,290 98,003
16 Payable in foreign currencies .................................................................... 8,031 8,237 7,075 –5,753 19,214 –4,258 –966 2,556 –5,230 5,723 4,026 –18,225 71,075
17 Banks’ domestic customers’ claims ............................................................... –16,833 –26,356 –26,835 –6,249 –12,511 3,625 –11,221 –41,394 30,741 4,013 –20,195 10,986 292,02218 Payable in dollars ...................................................................................... –4,306 –32,004 –27,175 –15,928 –76 –8,315 –7,685 –40,467 27,790 4,334 –18,832 7,257 271,34019 Deposits ................................................................................................. –6,253 –8,643 20,210 –13,668 –1,611 5,853 783 –23,454 23,459 18,715 1,490 –5,230 105,55420 Foreign commercial paper 3 .................................................................. –8,563 –13,102 –39,644 –3,367 5,248 –2,939 –12,044 –15,702 240 –9,526 –14,656 11,521 121,73821 Other negotiable and readily transferable instruments 4 ...................... 6,579 –11,247 –7,649 82 –5,951 –7,449 2,071 –1,935 7,161 –8,097 –4,778 1,672 30,68222 Outstanding collections and other ......................................................... 3,931 988 –92 1,025 2,238 –3,780 1,505 624 –3,070 3,242 –888 –706 13,36623 Payable in foreign currencies .................................................................... –12,527 5,648 340 9,679 –12,435 11,940 –3,536 –927 2,951 –321 –1,363 3,729 20,682
By area:24 Industrial countries 5 ....................................................................................... –36,776 –57,919 –121,683 8,783 –53,422 –3,041 –10,239 –91,630 13,841 –3,489 –40,405 –88,597 806,64025 Western Europe ......................................................................................... –50,296 –99,944 –107,306 –6,433 –74,949 –10,404 –8,158 –84,194 23,559 –8,416 –38,255 –72,500 675,00826 Of which United Kingdom ..................................................................... –14,984 –28,586 –55,861 5,865 –36,509 –1,986 4,044 –12,131 –12,652 –6,958 –24,120 –15,626 275,75227 Canada ....................................................................................................... –22,068 19,106 –3,154 9,242 9,434 1,107 –677 –6,203 –2,019 7,678 –2,610 –5,851 67,53728 Japan .......................................................................................................... 36,548 21,113 –6,335 5,815 15,101 487 –290 886 –5,124 –3,205 1,108 –7,734 45,41129 Other ........................................................................................................... –960 1,806 –4,888 159 –3,008 5,769 –1,114 –2,119 –2,575 454 –648 –2,512 18,684
30 Caribbean banking centers 6 .......................................................................... –13,944 –33,733 –16,228 5,827 12,704 –9,037 –43,227 29,719 –3,445 –14,205 –28,297 489 383,591
31 Other areas ..................................................................................................... 15,148 15,389 –589 8,427 4,702 1,602 658 5,677 –2,941 –453 –2,872 –1,919 157,17132 Of which Members of OPEC, included below 7 ................................... –7,917 5,172 3,808 6,019 3,788 –1,481 –3,154 2,797 –698 1,432 277 1,058 16,01433 Latin America ............................................................................................. 1,587 4,623 –4,693 4,197 1,152 697 –1,423 3,527 701 –1,955 –6,966 –719 94,26834 Asia ............................................................................................................. 16,156 9,973 2,951 5,638 1,883 –387 2,839 763 –3,365 1,800 3,753 –1,258 54,07035 Africa ........................................................................................................... 508 937 –68 656 –147 105 323 118 –142 –477 433 36 1,65636 Other 8 ........................................................................................................ –3,103 –144 1,221 –2,064 1,814 1,187 –1,081 1,269 –135 179 –92 22 7,177
Memoranda:1 International banking facilities’ (IBF’s) own claims, payable in dollars (lines 1–
13 above) ............................................................................................................ 39,271 –26,380 –37,777 18,188 –7,122 –25,501 –11,945 –30,454 13,407 –16,342 –4,388 –12,026 293,558By borrower:
Claims on:2 own foreign offices ........................................................................ 32,970 –34,374 –51,599 10,721 –8,683 –25,358 –11,054 –37,853 9,296 –18,840 –4,202 –15,432 222,5413 unaffiliated foreign banks .............................................................. 5,582 5,495 11,050 7,453 344 –401 –1,901 6,873 3,853 358 –34 674 36,8564 foreign public borrowers ............................................................... –163 451 449 298 380 –351 124 78 –398 796 –27 402 5,3385 all other foreigners ........................................................................ 882 2,048 2,323 –284 837 609 886 448 656 1,344 –125 2,330 28,823
By bank ownership: 2
6 U.S.-owned IBF’s ............................................................................... –1,120 –10,682 3,772 3,559 –4,594 –7,515 –2,132 8,808 –5,585 5,197 –4,648 10,314 70,8787 Foreign-owned IBF’s ......................................................................... 40,391 –15,698 –41,549 14,629 –2,528 –17,986 –9,813 –39,262 18,992 –21,539 260 –22,340 222,6808 Banks’ dollar acceptances payable by foreigners ................................................. 5,104 –152 414 34 30 –164 –52 208 –592 229 569 1,254 2,995
See footnotes on page 66.
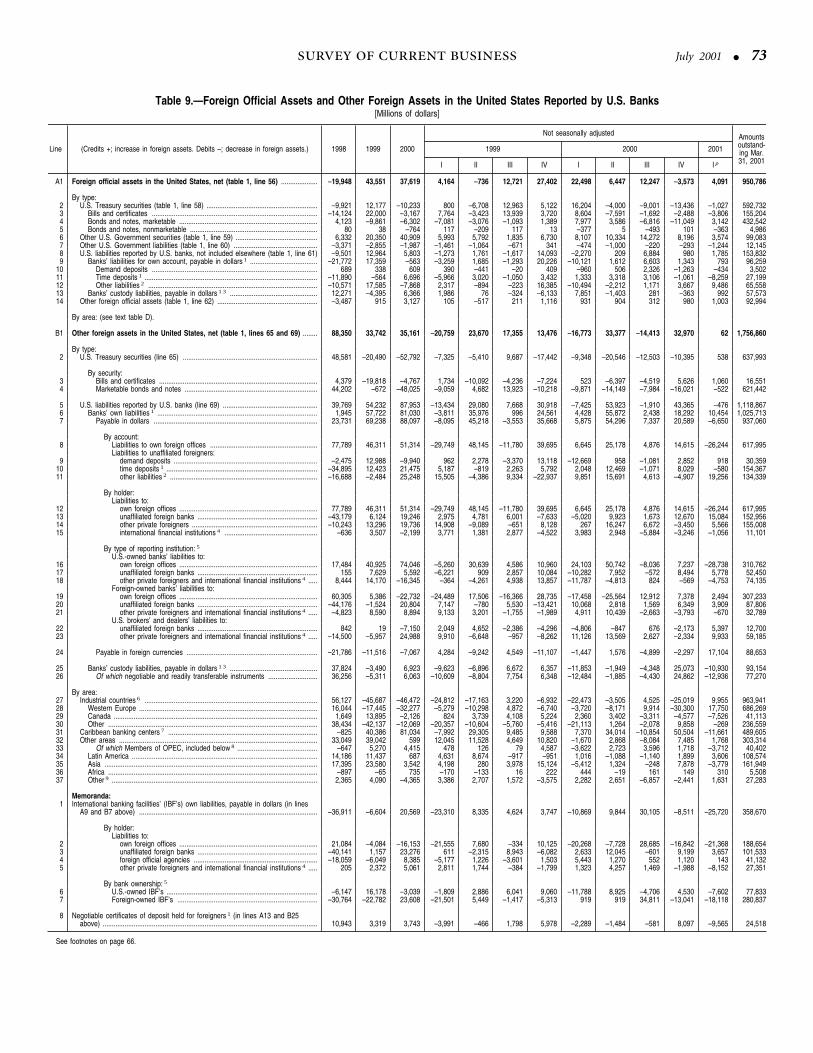
July 2001 ● 73
Table 9.—Foreign Official Assets and Other Foreign Assets in the United States Reported by U.S. Banks[Millions of dollars]
Line (Credits +; increase in foreign assets. Debits –; decrease in foreign assets.) 1998 1999 2000
Not seasonally adjusted Amountsoutstand-ing Mar.31, 2001
1999 2000 2001
I II III IV I II III IV I p
A1 Foreign official assets in the United States, net (table 1, line 56) .................... –19,948 43,551 37,619 4,164 –736 12,721 27,402 22,498 6,447 12,247 –3,573 4,091 950,786
By type:2 U.S. Treasury securities (table 1, line 58) ............................................................. –9,921 12,177 –10,233 800 –6,708 12,963 5,122 16,204 –4,000 –9,001 –13,436 –1,027 592,7323 Bills and certificates ........................................................................................... –14,124 22,000 –3,167 7,764 –3,423 13,939 3,720 8,604 –7,591 –1,692 –2,488 –3,806 155,2044 Bonds and notes, marketable ............................................................................ 4,123 –9,861 –6,302 –7,081 –3,076 –1,093 1,389 7,977 3,586 –6,816 –11,049 3,142 432,5425 Bonds and notes, nonmarketable ...................................................................... 80 38 –764 117 –209 117 13 –377 5 –493 101 –363 4,9866 Other U.S. Government securities (table 1, line 59) ............................................. 6,332 20,350 40,909 5,993 5,792 1,835 6,730 8,107 10,334 14,272 8,196 3,574 99,0837 Other U.S. Government liabilities (table 1, line 60) .............................................. –3,371 –2,855 –1,987 –1,461 –1,064 –671 341 –474 –1,000 –220 –293 –1,244 12,1458 U.S. liabilities reported by U.S. banks, not included elsewhere (table 1, line 61) –9,501 12,964 5,803 –1,273 1,761 –1,617 14,093 –2,270 209 6,884 980 1,785 153,8329 Banks’ liabilities for own account, payable in dollars 1 ..................................... –21,772 17,359 –563 –3,259 1,685 –1,293 20,226 –10,121 1,612 6,603 1,343 793 96,259
10 Demand deposits ........................................................................................... 689 338 609 390 –441 –20 409 –960 506 2,326 –1,263 –434 3,50211 Time deposits 1 ............................................................................................... –11,890 –564 6,696 –5,966 3,020 –1,050 3,432 1,333 3,318 3,106 –1,061 –8,259 27,19912 Other liabilities 2 ............................................................................................. –10,571 17,585 –7,868 2,317 –894 –223 16,385 –10,494 –2,212 1,171 3,667 9,486 65,55813 Banks’ custody liabilities, payable in dollars 1 3 ................................................ 12,271 –4,395 6,366 1,986 76 –324 –6,133 7,851 –1,403 281 –363 992 57,57314 Other foreign official assets (table 1, line 62) ....................................................... –3,487 915 3,127 105 –517 211 1,116 931 904 312 980 1,003 92,994
By area: (see text table D).
B1 Other foreign assets in the United States, net (table 1, lines 65 and 69) ........ 88,350 33,742 35,161 –20,759 23,670 17,355 13,476 –16,773 33,377 –14,413 32,970 62 1,756,860
By type:2 U.S. Treasury securities (line 65) .......................................................................... 48,581 –20,490 –52,792 –7,325 –5,410 9,687 –17,442 –9,348 –20,546 –12,503 –10,395 538 637,993
By security:3 Bills and certificates ....................................................................................... 4,379 –19,818 –4,767 1,734 –10,092 –4,236 –7,224 523 –6,397 –4,519 5,626 1,060 16,5514 Marketable bonds and notes ......................................................................... 44,202 –672 –48,025 –9,059 4,682 13,923 –10,218 –9,871 –14,149 –7,984 –16,021 –522 621,442
5 U.S. liabilities reported by U.S. banks (line 69) .................................................... 39,769 54,232 87,953 –13,434 29,080 7,668 30,918 –7,425 53,923 –1,910 43,365 –476 1,118,8676 Banks’ own liabilities 1 ........................................................................................ 1,945 57,722 81,030 –3,811 35,976 996 24,561 4,428 55,872 2,438 18,292 10,454 1,025,7137 Payable in dollars .......................................................................................... 23,731 69,238 88,097 –8,095 45,218 –3,553 35,668 5,875 54,296 7,337 20,589 –6,650 937,060
By account:8 Liabilities to own foreign offices ........................................................... 77,789 46,311 51,314 –29,749 48,145 –11,780 39,695 6,645 25,178 4,876 14,615 –26,244 617,995
Liabilities to unaffiliated foreigners:9 demand deposits ............................................................................... –2,475 12,988 –9,940 962 2,278 –3,370 13,118 –12,669 958 –1,081 2,852 918 30,359
10 time deposits 1 ................................................................................... –34,895 12,423 21,475 5,187 –819 2,263 5,792 2,048 12,469 –1,071 8,029 –580 154,36711 other liabilities 2 ................................................................................. –16,688 –2,484 25,248 15,505 –4,386 9,334 –22,937 9,851 15,691 4,613 –4,907 19,256 134,339
By holder:Liabilities to:
12 own foreign offices ............................................................................ 77,789 46,311 51,314 –29,749 48,145 –11,780 39,695 6,645 25,178 4,876 14,615 –26,244 617,99513 unaffiliated foreign banks .................................................................. –43,179 6,124 19,246 2,975 4,781 6,001 –7,633 –5,020 9,923 1,673 12,670 15,084 152,95614 other private foreigners ..................................................................... –10,243 13,296 19,736 14,908 –9,089 –651 8,128 267 16,247 6,672 –3,450 5,566 155,00815 international financial institutions 4 ................................................... –636 3,507 –2,199 3,771 1,381 2,877 –4,522 3,983 2,948 –5,884 –3,246 –1,056 11,101
By type of reporting institution: 5
U.S.-owned banks’ liabilities to:16 own foreign offices ............................................................................ 17,484 40,925 74,046 –5,260 30,639 4,586 10,960 24,103 50,742 –8,036 7,237 –28,738 310,76217 unaffiliated foreign banks .................................................................. 155 7,629 5,592 –6,221 909 2,857 10,084 –10,282 7,952 –572 8,494 5,778 52,45018 other private foreigners and international financial institutions 4 ..... 8,444 14,170 –16,345 –364 –4,261 4,938 13,857 –11,787 –4,813 824 –569 –4,753 74,135
Foreign-owned banks’ liabilities to:19 own foreign offices ............................................................................ 60,305 5,386 –22,732 –24,489 17,506 –16,366 28,735 –17,458 –25,564 12,912 7,378 2,494 307,23320 unaffiliated foreign banks .................................................................. –44,176 –1,524 20,804 7,147 –780 5,530 –13,421 10,068 2,818 1,569 6,349 3,909 87,80621 other private foreigners and international financial institutions 4 ..... –4,823 8,590 8,894 9,133 3,201 –1,755 –1,989 4,911 10,439 –2,663 –3,793 –670 32,789
U.S. brokers’ and dealers’ liabilities to:22 unaffiliated foreign banks .................................................................. 842 19 –7,150 2,049 4,652 –2,386 –4,296 –4,806 –847 676 –2,173 5,397 12,70023 other private foreigners and international financial institutions 4 ..... –14,500 –5,957 24,988 9,910 –6,648 –957 –8,262 11,126 13,569 2,627 –2,334 9,933 59,185
24 Payable in foreign currencies ........................................................................ –21,786 –11,516 –7,067 4,284 –9,242 4,549 –11,107 –1,447 1,576 –4,899 –2,297 17,104 88,653
25 Banks’ custody liabilities, payable in dollars 1 3 ................................................ 37,824 –3,490 6,923 –9,623 –6,896 6,672 6,357 –11,853 –1,949 –4,348 25,073 –10,930 93,15426 Of which negotiable and readily transferable instruments ........................... 36,256 –5,311 6,063 –10,609 –8,804 7,754 6,348 –12,484 –1,885 –4,430 24,862 –12,936 77,270
By area:27 Industrial countries 6 ............................................................................................... 56,127 –45,687 –46,472 –24,812 –17,163 3,220 –6,932 –22,473 –3,505 4,525 –25,019 9,955 963,94128 Western Europe .................................................................................................. 16,044 –17,445 –32,277 –5,279 –10,298 4,872 –6,740 –3,720 –8,171 9,914 –30,300 17,750 686,26929 Canada ................................................................................................................ 1,649 13,895 –2,126 824 3,739 4,108 5,224 2,360 3,402 –3,311 –4,577 –7,526 41,11330 Other ................................................................................................................... 38,434 –42,137 –12,069 –20,357 –10,604 –5,760 –5,416 –21,113 1,264 –2,078 9,858 –269 236,55931 Caribbean banking centers 7 .................................................................................. –825 40,386 81,034 –7,992 29,305 9,485 9,588 7,370 34,014 –10,854 50,504 –11,661 489,60532 Other areas ............................................................................................................. 33,049 39,042 599 12,045 11,528 4,649 10,820 –1,670 2,868 –8,084 7,485 1,768 303,31433 Of which Members of OPEC, included below 8 ............................................ –647 5,270 4,415 478 126 79 4,587 –3,622 2,723 3,596 1,718 –3,712 40,40234 Latin America ...................................................................................................... 14,186 11,437 687 4,631 8,674 –917 –951 1,016 –1,088 –1,140 1,899 3,606 108,57435 Asia ..................................................................................................................... 17,395 23,580 3,542 4,198 280 3,978 15,124 –5,412 1,324 –248 7,878 –3,779 161,94936 Africa ................................................................................................................... –897 –65 735 –170 –133 16 222 444 –19 161 149 310 5,50837 Other 9 ................................................................................................................. 2,365 4,090 –4,365 3,386 2,707 1,572 –3,575 2,282 2,651 –6,857 –2,441 1,631 27,283
Memoranda:1 International banking facilities’ (IBF’s) own liabilities, payable in dollars (in lines
A9 and B7 above) .................................................................................................. –36,911 –6,604 20,569 –23,310 8,335 4,624 3,747 –10,869 9,844 30,105 –8,511 –25,720 358,670
By holder:Liabilities to:
2 own foreign offices ............................................................................ 21,084 –4,084 –16,153 –21,555 7,680 –334 10,125 –20,268 –7,728 28,685 –16,842 –21,368 188,6543 unaffiliated foreign banks .................................................................. –40,141 1,157 23,276 611 –2,315 8,943 –6,082 2,633 12,045 –601 9,199 3,657 101,5334 foreign official agencies .................................................................... –18,059 –6,049 8,385 –5,177 1,226 –3,601 1,503 5,443 1,270 552 1,120 143 41,1325 other private foreigners and international financial institutions 4 ..... 205 2,372 5,061 2,811 1,744 –384 –1,799 1,323 4,257 1,469 –1,988 –8,152 27,351
By bank ownership: 5
6 U.S.-owned IBF’s ................................................................................... –6,147 16,178 –3,039 –1,809 2,886 6,041 9,060 –11,788 8,925 –4,706 4,530 –7,602 77,8337 Foreign-owned IBF’s ............................................................................. –30,764 –22,782 23,608 –21,501 5,449 –1,417 –5,313 919 919 34,811 –13,041 –18,118 280,837
8 Negotiable certificates of deposit held for foreigners 1 (in lines A13 and B25above) ...................................................................................................................... 10,943 3,319 3,743 –3,991 –466 1,798 5,978 –2,289 –1,484 –581 8,097 –9,565 24,518
See footnotes on page 66.

74 ● July 2001
Table 10.—U.S. International[Millions
Line (Credits +; debits –) 1
Western Europe European Union 14
1998 1999 20002000 2001
1998 1999 20002000
I II III IV I p I II
Current account1 Exports of goods and services and income receipts ........................ 367,706 385,481 437,170 105,668 110,191 108,286 113,025 110,817 332,414 347,067 391,637 93,945 98,807
2 Exports of goods and services ............................................................. 254,473 261,106 281,812 68,046 70,775 69,489 73,502 72,455 231,554 237,380 255,258 60,594 64,431
3 Goods, balance of payments basis 2 ............................................... 159,320 162,770 178,793 44,135 44,846 42,620 47,192 47,894 146,297 149,083 162,583 39,240 40,872
4 Services 3 .......................................................................................... 95,153 98,336 103,019 23,911 25,929 26,869 26,310 24,561 85,257 88,297 92,675 21,354 23,5595 Transfers under U.S. military agency sales contracts 4 ............. 4,780 4,265 3,143 768 918 719 738 904 3,263 2,616 2,506 621 752
6 Travel ............................................................................................ 22,855 24,787 26,498 5,475 7,062 7,633 6,328 5,407 20,963 22,369 24,136 4,927 6,4797 Passenger fares ........................................................................... 6,865 7,014 6,897 1,382 1,826 2,009 1,680 1,375 6,646 6,700 6,656 1,329 1,7558 Other transportation ...................................................................... 8,556 8,065 9,340 2,207 2,336 2,501 2,296 2,197 7,405 7,053 8,055 1,891 2,005
9 Royalties and license fees 5 ........................................................ 18,644 18,605 18,201 4,462 4,461 4,359 4,919 4,586 17,522 17,493 16,584 4,164 4,08310 Other private services 5 ................................................................ 33,292 35,424 38,768 9,577 9,284 9,603 10,304 10,046 29,320 31,916 34,582 8,386 8,44711 U.S. Government miscellaneous services ................................... 161 176 172 40 42 45 45 46 138 150 156 36 38
12 Income receipts ..................................................................................... 113,233 124,375 155,358 37,622 39,416 38,797 39,523 38,362 100,860 109,687 136,379 33,351 34,37613 Income receipts on U.S.-owned assets abroad .............................. 113,089 124,220 155,207 37,584 39,378 38,760 39,485 38,323 100,728 109,544 136,240 33,316 34,34114 Direct investment receipts ............................................................ 50,513 55,243 65,503 16,776 16,738 15,891 16,098 16,605 43,199 47,179 56,215 14,573 14,24515 Other private receipts ................................................................... 61,605 68,186 88,868 20,555 22,493 22,626 23,194 21,432 56,684 61,717 79,305 18,532 19,96316 U.S. Government receipts ............................................................ 971 791 836 253 147 243 193 286 845 648 720 211 13317 Compensation of employees ............................................................ 144 155 151 38 38 37 38 39 132 143 139 35 35
18 Imports of goods and services and income payments ..................... –400,205 –445,167 –521,433 –121,607 –132,489 –133,263 –134,074 –131,168 –363,602 –401,564 –467,900 –108,888 –119,075
19 Imports of goods and services ............................................................. –269,756 –292,660 –336,818 –77,668 –84,736 –86,669 –87,745 –84,867 –243,153 –263,798 –301,888 –69,179 –76,428
20 Goods, balance of payments basis 2 ............................................... –194,178 –214,871 –243,426 –58,384 –59,856 –60,335 –64,851 –63,104 –176,212 –194,635 –219,946 –52,118 –54,548
21 Services 3 .......................................................................................... –75,578 –77,789 –93,392 –19,284 –24,880 –26,334 –22,894 –21,763 –66,941 –69,163 –81,942 –17,061 –21,88022 Direct defense expenditures ........................................................ –6,405 –7,593 –7,971 –1,952 –1,956 –2,047 –2,016 –2,165 –5,449 –6,259 –6,252 –1,556 –1,490
23 Travel ............................................................................................ –19,155 –19,909 –22,674 –3,981 –7,285 –7,293 –4,115 –3,892 –17,261 –18,219 –20,585 –3,647 –6,56424 Passenger fares ........................................................................... –10,102 –10,658 –13,238 –2,655 –3,903 –4,010 –2,670 –2,758 –9,135 –9,557 –11,981 –2,403 –3,54525 Other transportation ...................................................................... –11,104 –11,181 –13,633 –3,028 –3,345 –3,660 –3,600 –3,404 –8,969 –9,284 –11,126 –2,474 –2,757
26 Royalties and license fees 5 ........................................................ –6,828 –7,121 –8,501 –1,786 –1,804 –2,160 –2,751 –2,228 –5,940 –5,859 –6,807 –1,530 –1,45827 Other private services 5 ................................................................ –20,890 –20,199 –26,219 –5,599 –6,300 –6,872 –7,448 –7,020 –19,248 –19,023 –24,194 –5,207 –5,81928 U.S. Government miscellaneous services ................................... –1,094 –1,128 –1,156 –283 –287 –292 –294 –296 –939 –962 –997 –244 –247
29 Income payments .................................................................................. –130,449 –152,507 –184,615 –43,939 –47,753 –46,594 –46,329 –46,301 –120,449 –137,766 –166,012 –39,709 –42,64730 Income payments on foreign-owned assets in the United States –130,215 –152,275 –184,388 –43,876 –47,702 –46,546 –46,264 –46,237 –120,259 –137,577 –165,826 –39,659 –42,60431 Direct investment payments ......................................................... –25,486 –39,672 –45,781 –11,488 –13,304 –10,830 –10,159 –11,588 –24,472 –35,501 –41,477 –10,401 –11,71032 Other private payments ................................................................ –65,456 –71,894 –95,871 –21,551 –23,633 –25,067 –25,620 –24,291 –59,369 –64,497 –84,703 –19,258 –20,89433 U.S. Government payments ......................................................... –39,273 –40,709 –42,736 –10,837 –10,765 –10,649 –10,485 –10,358 –36,418 –37,579 –39,646 –10,000 –10,00034 Compensation of employees ............................................................ –234 –232 –227 –63 –51 –48 –65 –64 –190 –189 –186 –50 –43
35 Unilateral current transfers, net ............................................................ –872 –1,295 –1,293 –277 –203 –344 –469 –384 299 50 –168 50 4836 U.S. Government grants 4 ..................................................................... –563 –676 –505 –166 –134 –127 –78 –173 –54 –10 –2 –1 ......................37 U.S. Government pensions and other transfers .................................. –1,399 –1,382 –1,442 –351 –341 –352 –398 –375 –1,206 –1,188 –1,234 –304 –30838 Private remittances and other transfers 6 ............................................. 1,090 763 654 240 272 135 7 164 1,559 1,248 1,068 355 356
Capital and financial accountCapital account
39 Capital account transactions, net ......................................................... 148 97 156 38 38 40 40 35 132 135 140 35 34
Financial account40 U.S.-owned assets abroad, net (increase/financial outflow (–)) ....... –262,645 –291,055 –367,391 –159,373 –38,750 –93,346 –75,922 –108,807 –219,883 –246,568 –340,816 –105,424 –76,045
41 U.S. official reserve assets, net ........................................................... –2,735 5,477 –6,013 –379 –310 –4,124 –1,200 250 4,598 –2,257 –1,187 –100 –7942 Gold 7 ................................................................................................ ................ ................ ................ ................ ................ ................ ................ ................ ................ .................. .................. .................. ......................43 Special drawing rights ...................................................................... ................ ................ ................ ................ ................ ................ ................ ................ ................ .................. .................. .................. ......................44 Reserve position in the International Monetary Fund ..................... ................ ................ ................ ................ ................ ................ ................ ................ ................ .................. .................. .................. ......................45 Foreign currencies ............................................................................ –2,735 5,477 –6,013 –379 –310 –4,124 –1,200 250 4,598 –2,257 –1,187 –100 –79
46 U.S. Government assets, other than official reserve assets, net ....... 655 504 545 256 29 14 246 196 441 244 452 193 1647 U.S. credits and other long-term assets .......................................... –278 –335 –451 –73 –39 –308 –31 –13 –174 –275 –219 –29 –1148 Repayments on U.S. credits and other long-term assets 8 ............ 915 928 939 295 86 311 247 237 602 590 621 189 3349 U.S. foreign currency holdings and U.S. short-term assets, net .... 18 –89 57 34 –18 11 30 –28 13 –71 50 33 –6
50 U.S. private assets, net ........................................................................ –260,565 –297,036 –361,923 –159,250 –38,469 –89,236 –74,968 –109,253 –224,922 –244,555 –340,081 –105,517 –75,98251 Direct investment .............................................................................. –84,331 –80,201 –77,213 –24,658 –18,119 –19,766 –14,670 –13,679 –75,770 –68,404 –67,874 –19,217 –17,06352 Foreign securities .............................................................................. –95,788 –53,290 –99,354 –9,650 –33,739 –34,253 –21,712 –23,064 –97,778 –57,502 –86,985 –10,471 –32,81653 U.S. claims on unaffiliated foreigners reported by U.S.
nonbanking concerns ................................................................... –30,108 –63,633 –78,060 –40,758 –10,165 –26,764 –373 ................ –16,539 –55,353 –83,244 –29,429 –20,28554 U.S. claims reported by U.S. banks, not included elsewhere ........ –50,338 –99,912 –107,296 –84,184 23,554 –8,453 –38,213 –72,510 –34,835 –63,296 –101,978 –46,400 –5,818
55 Foreign-owned assets in the United States, net (increase/financialinflow (+)) ............................................................................................. 381,680 523,279 655,195 213,749 134,180 174,383 132,883 145,562 366,422 468,789 610,679 167,713 144,764
56 Foreign official assets in the United States, net ................................. 5,975 –15,029 –5,105 2,088 2,701 –402 –9,492 –1,709 (18) (18) (18) (18) (18)57 U.S. Government securities .............................................................. (17) (17) (17) (17) (17) (17) (17) (17) (18) (18) (18) (18) (18)58 U.S. Treasury securities 9 ............................................................ (17) (17) (17) (17) (17) (17) (17) (17) (18) (18) (18) (18) (18)59 Other 10 ......................................................................................... (17) (17) (17) (17) (17) (17) (17) (17) (18) (18) (18) (18) (18)60 Other U.S. Government liabilities 11 ................................................ –708 –1,287 –293 –249 –132 69 19 –339 –173 –395 –347 –274 –15161 U.S. liabilities reported by U.S. banks, not included elsewhere ..... (17) (17) (17) (17) (17) (17) (17) (17) (18) (18) (18) (18) (18)62 Other foreign official assets 12 ......................................................... (17) (17) (17) (17) (17) (17) (17) (17) (18) (18) (18) (18) (18)
63 Other foreign assets in the United States, net .................................... 375,705 538,308 660,300 211,661 131,479 174,785 142,375 147,271 (18) (18) (18) (18) (18)64 Direct investment .............................................................................. 153,196 238,200 222,934 26,112 70,380 63,282 63,160 34,500 147,912 235,066 201,778 24,892 63,98965 U.S. Treasury securities ................................................................... (17) (17) (17) (17) (17) (17) (17) (17) (18) (18) (18) (18) (18)66 U.S. securities other than U.S. Treasury securities ........................ 187,739 227,021 348,638 106,852 73,896 86,802 81,088 95,143 179,070 216,781 333,830 97,609 72,44267 U.S. currency .................................................................................... ................ ................ ................ ................ ................ ................ ................ ................ ................ .................. .................. .................. ......................68 U.S. liabilities to unaffiliated foreigners reported by U.S.
nonbanking concerns ................................................................... 18,286 90,635 121,178 82,428 –4,624 15,273 28,101 ................ 30,439 64,225 131,474 69,891 –1,57169 U.S. liabilities reported by U.S. banks, not included elsewhere ..... (17) (17) (17) (17) (17) (17) (17) (17) 9,174 –46,888 –56,056 –24,405 10,055
70 Statistical discrepancy (sum of above items with sign reversed) ... –85,812 –171,340 –202,404 –38,198 –72,967 –55,756 –35,483 –16,055 –115,782 –167,909 –193,572 –47,431 –48,533
Memoranda:71 Balance on goods (lines 3 and 20) .......................................................... –34,858 –52,101 –64,633 –14,249 –15,010 –17,715 –17,659 –15,210 –29,915 –45,552 –57,363 –12,878 –13,67672 Balance on services (lines 4 and 21) ...................................................... 19,575 20,547 9,627 4,627 1,049 535 3,416 2,798 18,316 19,134 10,733 4,293 1,67973 Balance on goods and services (lines 2 and 19) .................................... –15,283 –31,554 –55,006 –9,622 –13,961 –17,180 –14,243 –12,412 –11,599 –26,418 –46,630 –8,585 –11,99774 Balance on income (lines 12 and 29) ...................................................... –17,216 –28,132 –29,257 –6,317 –8,337 –7,797 –6,806 –7,939 –19,589 –28,079 –29,633 –6,358 –8,27175 Unilateral current transfers, net (line 35) ................................................. –872 –1,295 –1,293 –277 –203 –344 –469 –384 299 50 –168 50 4876 Balance on current account (lines 1, 18, and 35 or lines 73, 74, and
75) 13 ..................................................................................................... –33,371 –60,981 –85,556 –16,216 –22,501 –25,321 –21,518 –20,735 –30,889 –54,447 –76,431 –14,893 –20,220
See footnotes on page 66.

July 2001 ● 75
Transactions, by Areaof dollars]
European Union 14 United Kingdom European Union (6) 15
Line2000 20011998 1999 2000
2000 20011998 1999 2000
2000 2001
III IV I p I II III IV I p I II III IV I p
97,640 101,245 98,474 104,931 110,225 130,371 31,510 33,261 32,163 33,437 31,283 171,569 178,105 196,817 46,876 49,214 49,641 51,086 50,513 1
63,474 66,759 64,787 65,262 65,938 71,218 17,123 17,699 17,349 19,047 17,384 126,820 129,326 139,066 32,860 34,739 35,231 36,236 35,778 2
39,245 43,226 43,062 38,385 37,659 40,727 10,074 10,086 9,529 11,038 10,358 85,891 87,402 96,057 23,096 23,743 23,673 25,545 25,768 3
24,229 23,533 21,725 26,877 28,279 30,491 7,049 7,613 7,820 8,009 7,026 40,929 41,924 43,009 9,764 10,996 11,558 10,691 10,010 4557 576 561 386 398 369 81 96 96 96 85 1,236 925 842 130 238 237 237 198 5
6,978 5,752 4,865 7,600 8,398 9,957 1,982 2,606 2,777 2,592 1,956 9,819 10,197 10,056 2,072 2,726 3,103 2,155 2,046 61,940 1,632 1,322 2,258 2,535 2,751 538 680 768 765 534 3,464 3,390 3,183 644 869 971 699 641 72,168 1,991 1,862 1,742 1,781 1,914 433 484 511 486 446 3,925 3,567 4,166 981 1,017 1,141 1,027 945 8
3,942 4,395 4,196 3,593 3,448 3,271 881 739 742 909 860 8,853 8,547 8,010 1,953 1,990 1,922 2,145 1,977 98,603 9,146 8,877 11,247 11,681 12,199 3,127 3,001 2,918 3,153 3,137 13,576 15,230 16,646 3,960 4,130 4,156 4,400 4,174 10
41 41 42 51 38 30 7 7 8 8 8 56 68 106 24 26 28 28 29 11
34,166 34,486 33,687 39,669 44,287 59,153 14,387 15,562 14,814 14,390 13,899 44,749 48,779 57,751 14,016 14,475 14,410 14,850 14,735 1234,132 34,451 33,651 39,605 44,219 59,083 14,370 15,544 14,797 14,372 13,881 44,689 48,720 57,698 14,002 14,462 14,397 14,837 14,721 1313,708 13,689 14,154 11,851 14,604 21,833 5,705 6,217 5,137 4,774 4,952 22,757 24,432 25,855 6,492 6,388 6,438 6,537 6,792 1420,220 20,590 19,243 27,731 29,594 37,232 8,665 9,327 9,660 9,580 8,929 21,319 23,850 31,320 7,375 7,957 7,827 8,161 7,676 15
204 172 254 23 21 18 ................. ................. ................. 18 ................. 613 438 523 135 117 132 139 253 1634 35 36 64 68 70 17 18 17 18 18 60 59 53 14 13 13 13 14 17
–119,372 –120,565 –117,411 –129,104 –143,372 –171,126 –40,120 –42,915 –44,760 –43,331 –42,991 –182,245 –203,122 –228,178 –53,974 –58,510 –56,763 –58,931 –57,815 18
–77,641 –78,640 –75,847 –58,436 –63,172 –70,989 –16,727 –18,000 –18,048 –18,214 –17,456 –143,850 –155,340 –173,715 –40,250 –43,812 –44,814 –44,839 –44,253 19
–54,589 –58,691 –56,885 –34,490 –38,789 –43,388 –10,564 –10,827 –10,579 –11,418 –10,964 –111,005 –121,149 –133,187 –31,914 –32,919 –33,413 –34,941 –34,681 20
–23,052 –19,949 –18,962 –23,946 –24,383 –27,601 –6,163 –7,173 –7,469 –6,796 –6,492 –32,845 –34,191 –40,528 –8,336 –10,893 –11,401 –9,898 –9,572 21–1,628 –1,578 –1,715 –574 –623 –609 –148 –142 –158 –161 –180 –4,500 –5,168 –5,170 –1,279 –1,255 –1,362 –1,274 –1,395 22
–6,557 –3,817 –3,566 –5,142 –5,502 –6,368 –1,301 –1,775 –1,784 –1,508 –1,270 –8,647 –9,364 –10,314 –1,833 –3,447 –3,280 –1,754 –1,791 23–3,633 –2,400 –2,492 –3,896 –3,832 –4,746 –975 –1,402 –1,409 –960 –1,033 –3,773 –4,000 –5,109 –1,017 –1,557 –1,511 –1,024 –1,078 24–2,979 –2,916 –2,699 –2,397 –2,507 –2,647 –585 –676 –702 –684 –614 –4,488 –4,445 –5,442 –1,221 –1,330 –1,462 –1,429 –1,316 25
–1,645 –2,174 –1,803 –2,165 –1,662 –1,420 –361 –293 –372 –394 –375 –3,092 –3,225 –3,997 –867 –828 –1,026 –1,276 –1,103 26–6,358 –6,810 –6,432 –9,680 –10,160 –11,730 –2,774 –2,865 –3,023 –3,068 –2,999 –7,637 –7,279 –9,693 –1,922 –2,277 –2,557 –2,937 –2,684 27
–252 –254 –255 –92 –97 –81 –19 –20 –21 –21 –21 –708 –710 –803 –197 –199 –203 –204 –205 28
–41,731 –41,925 –41,564 –70,668 –80,200 –100,137 –23,393 –24,915 –26,712 –25,117 –25,535 –38,395 –47,782 –54,463 –13,724 –14,698 –11,949 –14,092 –13,562 29–41,690 –41,873 –41,513 –70,615 –80,146 –100,081 –23,378 –24,902 –26,699 –25,102 –25,520 –38,278 –47,667 –54,352 –13,695 –14,672 –11,924 –14,061 –13,532 30
–9,713 –9,653 –10,480 –7,268 –12,649 –16,172 –3,730 –3,997 –5,037 –3,408 –4,635 –13,967 –20,400 –22,754 –6,106 –6,839 –3,916 –5,893 –5,590 31–22,084 –22,467 –21,396 –42,620 –46,264 –61,530 –13,934 –15,221 –16,118 –16,257 –15,441 –13,459 –15,017 –18,799 –4,331 –4,604 –4,837 –5,027 –4,870 32
–9,893 –9,753 –9,637 –20,727 –21,233 –22,379 –5,714 –5,684 –5,544 –5,437 –5,444 –10,852 –12,250 –12,799 –3,258 –3,229 –3,171 –3,141 –3,072 33–41 –52 –51 –53 –54 –56 –15 –13 –13 –15 –15 –117 –115 –111 –29 –26 –25 –31 –30 34
–65 –201 –40 1,271 1,393 1,278 377 377 349 175 377 122 –239 –328 –49 –64 –121 –94 –123 35................. –1 –1 ................. ................. ................. ................. ................. ................. ................. ................. ................. ................. ................. ................. ................. ................. ................. ................. 36
–311 –311 –326 –195 –206 –215 –53 –54 –54 –54 –53 –690 –651 –676 –167 –169 –169 –171 –185 37246 111 287 1,466 1,599 1,493 430 431 403 229 430 812 412 348 118 105 48 77 62 38
35 36 28 44 48 49 13 12 12 12 10 63 63 67 16 16 17 18 13 39
–70,330 –89,017 –82,062 –113,392 –152,302 –212,057 –58,255 –61,051 –45,765 –46,986 –44,042 –80,937 –85,458 –82,366 –29,053 –11,678 –16,969 –24,666 –34,650 40
–619 –389 –124 ................. ................. ................. ................. ................. ................. ................. ................. 4,598 ................. ................. ................. ................. ................. ................. ................. 41................. ................. ................. ................. ................. ................. ................. ................. ................. ................. ................. ................. ................. ................. ................. ................. ................. ................. ................. 42................. ................. ................. ................. ................. ................. ................. ................. ................. ................. ................. ................. ................. ................. ................. ................. ................. ................. ................. 43................. ................. ................. ................. ................. ................. ................. ................. ................. ................. ................. ................. ................. ................. ................. ................. ................. ................. ................. 44
–619 –389 –124 ................. ................. ................. ................. ................. ................. ................. ................. 4,598 ................. ................. ................. ................. ................. ................. ................. 45
55 188 121 130 121 141 11 –6 ................. 136 –13 10 –47 40 19 –1 2 20 ................. 46–171 –8 –12 ................. ................. ................. ................. ................. ................. ................. ................. ................. ................. ................. ................. ................. ................. ................. ................. 47
225 174 161 130 136 135 ................. ................. ................. 135 ................. ................. ................. ................. ................. ................. ................. ................. ................. 481 22 –28 ................. –15 6 11 –6 ................. 1 –13 10 –47 40 19 –1 2 20 ................. 49
–69,766 –88,816 –82,059 –113,522 –152,423 –212,198 –58,266 –61,045 –45,765 –47,122 –44,029 –85,545 –85,411 –82,406 –29,072 –11,677 –16,971 –24,686 –34,650 50–18,356 –13,238 –11,394 –29,093 –35,019 –28,976 –5,173 –9,416 –9,491 –4,896 –5,332 –33,692 –21,230 –24,839 –10,005 –4,236 –5,043 –5,555 –3,980 51–30,625 –13,073 –21,316 –65,243 –51,852 –79,049 –13,033 –27,578 –22,450 –15,988 –23,071 –27,700 –9,871 –11,811 2,940 –8,275 –10,000 3,524 –521 52
–26,170 –7,360 ................. –4,202 –36,966 –48,312 –27,929 –11,399 –6,866 –2,118 ................. –9,565 –18,226 –24,398 1,571 –10,636 –14,253 –1,080 ................. 535,385 –55,145 –49,349 –14,984 –28,586 –55,861 –12,131 –12,652 –6,958 –24,120 –15,626 –14,588 –36,084 –21,358 –23,578 11,470 12,325 –21,575 –30,149 54
148,637 149,565 153,290 211,283 278,272 336,597 102,940 85,549 75,823 72,285 97,031 136,234 193,714 220,099 51,642 50,031 52,924 65,502 48,120 55
(18) (18) (18) (18) (18) (18) (18) (18) (18) (18) (18) (18) (18) (18) (18) (18) (18) (18) (18) 56(18) (18) (18) (18) (18) (18) (18) (18) (18) (18) (18) (18) (18) (18) (18) (18) (18) (18) (18) 57(18) (18) (18) (18) (18) (18) (18) (18) (18) (18) (18) (18) (18) (18) (18) (18) (18) (18) (18) 58(18) (18) (18) (18) (18) (18) (18) (18) (18) (18) (18) (18) (18) (18) (18) (18) (18) (18) (18) 59–10 88 –58 23 –389 –257 –79 –94 –93 9 18 –191 81 24 39 –37 –3 25 25 60(18) (18) (18) (18) (18) (18) (18) (18) (18) (18) (18) (18) (18) (18) (18) (18) (18) (18) (18) 61(18) (18) (18) (18) (18) (18) (18) (18) (18) (18) (18) (18) (18) (18) (18) (18) (18) (18) (18) 62
(18) (18) (18) (18) (18) (18) (18) (18) (18) (18) (18) (18) (18) (18) (18) (18) (18) (18) (18) 6362,984 49,913 28,594 60,335 108,614 73,667 5,768 35,268 17,757 14,874 6,137 79,179 118,229 108,373 18,285 25,840 38,715 25,533 21,516 64
(18) (18) (18) (18) (18) (18) (18) (18) (18) (18) (18) (18) (18) (18) (18) (18) (18) (18) (18) 6582,373 81,406 89,368 120,871 147,641 213,139 53,568 42,748 60,280 56,543 59,713 49,885 55,503 93,491 35,872 24,807 13,486 19,326 23,699 66
................. ................. ................. ................. ................. ................. ................. ................. ................. ................. ................. ................. ................. ................. ................. ................. ................. ................. ................. 67
23,349 39,805 ................. 22,816 53,869 86,314 55,278 –4,785 11,797 24,024 ................. 3,374 11,918 43,487 13,986 3,461 11,116 14,924 ................. 68–20,059 –21,647 35,386 7,238 –31,463 –36,266 –11,595 12,412 –13,918 –23,165 31,163 3,987 7,983 –25,276 –16,540 –4,040 –10,390 5,694 2,880 69
–56,545 –41,063 –52,279 –75,033 –94,264 –85,112 –36,465 –15,233 –17,822 –15,592 –41,668 –44,806 –83,063 –106,111 –15,458 –29,009 –28,729 –32,915 –6,058 70
–15,344 –15,465 –13,823 3,895 –1,130 –2,661 –490 –741 –1,050 –380 –606 –25,114 –33,747 –37,130 –8,818 –9,176 –9,740 –9,396 –8,913 711,177 3,584 2,763 2,931 3,896 2,890 886 440 351 1,213 534 8,084 7,733 2,481 1,428 103 157 793 438 72
–14,167 –11,881 –11,060 6,826 2,766 229 396 –301 –699 833 –72 –17,030 –26,014 –34,649 –7,390 –9,073 –9,583 –8,603 –8,475 73–7,565 –7,439 –7,877 –30,999 –35,913 –40,984 –9,006 –9,353 –11,898 –10,727 –11,636 6,354 997 3,288 292 –223 2,461 758 1,173 74
–65 –201 –40 1,271 1,393 1,278 377 377 349 175 377 122 –239 –328 –49 –64 –121 –94 –123 75
–21,797 –19,521 –18,977 –22,902 –31,754 –39,477 –8,233 –9,277 –12,248 –9,719 –11,331 –10,554 –25,256 –31,689 –7,147 –9,360 –7,243 –7,939 –7,425 76

76 ● July 2001
Table 10.—U.S. International[Millions
Line (Credits +; debits –) 1
Eastern Europe Canada
1998 1999 20002000 2001
1998 1999 20002000
I II III IV I p I II
Current account1 Exports of goods and services and income receipts .................................. 13,643 12,936 14,544 3,452 3,648 3,712 3,732 3,956 195,118 211,259 229,634 58,217 59,765
2 Exports of goods and services ....................................................................... 11,538 9,897 10,180 2,481 2,404 2,665 2,630 2,837 176,038 188,144 202,409 51,789 52,611
3 Goods, balance of payments basis 2 ......................................................... 7,441 5,891 5,925 1,441 1,329 1,514 1,641 1,694 156,735 166,727 178,987 45,665 46,698
4 Services 3 .................................................................................................... 4,097 4,006 4,255 1,040 1,075 1,151 989 1,143 19,303 21,417 23,422 6,124 5,9135 Transfers under U.S. military agency sales contracts 4 ....................... 346 344 397 101 83 150 63 131 105 109 143 21 40
6 Travel ...................................................................................................... 1,257 1,184 1,336 288 368 367 313 285 6,206 6,670 7,055 1,983 1,9567 Passenger fares ..................................................................................... 159 78 89 20 29 19 21 20 1,478 1,540 1,713 505 4258 Other transportation ................................................................................ 270 340 342 55 134 75 78 63 2,317 2,484 2,703 658 689
9 Royalties and license fees 5 .................................................................. 291 274 247 61 59 58 69 67 1,655 1,687 2,101 479 51710 Other private services 5 .......................................................................... 1,728 1,745 1,793 502 390 469 432 564 7,465 8,836 9,633 2,463 2,26811 U.S. Government miscellaneous services ............................................. 46 41 51 13 12 13 13 13 77 91 74 15 18
12 Income receipts ............................................................................................... 2,105 3,039 4,364 971 1,244 1,047 1,102 1,119 19,080 23,115 27,225 6,428 7,15413 Income receipts on U.S.-owned assets abroad ........................................ 2,097 3,019 4,344 966 1,239 1,042 1,097 1,114 19,005 23,039 27,147 6,408 7,13514 Direct investment receipts ...................................................................... 179 739 1,650 350 351 436 513 542 7,602 11,986 14,518 3,388 3,89115 Other private receipts ............................................................................. 1,680 2,136 2,200 571 550 536 543 517 11,403 11,053 12,629 3,020 3,24416 U.S. Government receipts ...................................................................... 238 144 494 45 338 70 41 55 ................ ................ ................ ................ ....................17 Compensation of employees ...................................................................... 8 20 20 5 5 5 5 5 75 76 78 20 19
18 Imports of goods and services and income payments ............................... –15,426 –16,212 –21,273 –5,100 –5,197 –5,829 –5,147 –5,646 –198,359 –225,292 –259,612 –63,730 –66,515
19 Imports of goods and services ....................................................................... –13,707 –14,427 –18,669 –4,548 –4,572 –5,145 –4,404 –4,955 –191,518 –217,059 –250,268 –60,655 –63,764
20 Goods, balance of payments basis 2 ......................................................... –10,902 –11,818 –16,101 –4,022 –3,686 –4,446 –3,947 –4,438 –175,844 –201,288 –233,678 –57,142 –59,582
21 Services 3 .................................................................................................... –2,805 –2,609 –2,568 –526 –886 –699 –457 –517 –15,674 –15,771 –16,590 –3,513 –4,18222 Direct defense expenditures .................................................................. –167 –169 –119 –41 –20 –29 –29 –30 –70 –72 –70 –18 –16
23 Travel ...................................................................................................... –1,326 –1,157 –1,270 –252 –525 –322 –171 –246 –5,718 –6,135 –6,367 –1,004 –1,59024 Passenger fares ..................................................................................... –452 –365 –365 –49 –117 –137 –62 –51 –587 –712 –827 –169 –23225 Other transportation ................................................................................ –219 –229 –249 –49 –76 –65 –59 –54 –2,910 –3,226 –3,578 –873 –918
26 Royalties and license fees 5 .................................................................. –11 –20 –83 –15 –28 –21 –19 –26 –420 –536 –987 –235 –23627 Other private services 5 .......................................................................... –545 –594 –426 –106 –106 –111 –103 –96 –5,762 –4,855 –4,555 –1,163 –1,13928 U.S. Government miscellaneous services ............................................. –85 –75 –56 –14 –14 –14 –14 –14 –207 –235 –206 –51 –51
29 Income payments ............................................................................................ –1,719 –1,785 –2,604 –552 –625 –684 –743 –691 –6,841 –8,233 –9,344 –3,075 –2,75130 Income payments on foreign-owned assets in the United States ............ –1,673 –1,738 –2,558 –538 –615 –676 –729 –677 –6,593 –7,984 –9,088 –3,007 –2,68931 Direct investment payments ................................................................... –10 –35 –123 –20 –32 –46 –25 –22 –1,382 –1,999 –911 –1,188 –39332 Other private payments .......................................................................... –557 –490 –1,018 –202 –250 –259 –307 –258 –4,336 –4,841 –6,214 –1,427 –1,80533 U.S. Government payments ................................................................... –1,106 –1,213 –1,417 –316 –333 –371 –397 –397 –875 –1,144 –1,963 –392 –49134 Compensation of employees ...................................................................... –46 –47 –46 –14 –10 –8 –14 –14 –248 –249 –256 –68 –62
35 Unilateral current transfers, net ...................................................................... –3,410 –4,073 –3,667 –946 –948 –1,031 –742 –1,011 –606 –638 –724 –201 –16636 U.S. Government grants 4 ............................................................................... –1,903 –2,393 –1,789 –465 –501 –547 –276 –515 ................ ................ ................ ................ ....................37 U.S. Government pensions and other transfers ............................................ –40 –47 –48 –12 –12 –12 –12 –11 –477 –482 –499 –124 –12438 Private remittances and other transfers 6 ....................................................... –1,467 –1,633 –1,830 –469 –435 –472 –454 –485 –129 –156 –225 –77 –42
Capital and financial accountCapital account
39 Capital account transactions, net ................................................................... 20 25 26 7 6 6 7 4 82 90 109 25 21
Financial account40 U.S.-owned assets abroad, net (increase/financial outflow (–)) ................. –2,066 –2,279 337 365 –1,327 1,497 –198 –929 –26,742 –7,436 –39,363 –11,097 –11,629
41 U.S. official reserve assets, net ..................................................................... ................ .............. ................ ................ ................ ................ ................ ................ ................ ................ ................ ................ ....................42 Gold 7 .......................................................................................................... ................ .............. ................ ................ ................ ................ ................ ................ ................ ................ ................ ................ ....................43 Special drawing rights ................................................................................ ................ .............. ................ ................ ................ ................ ................ ................ ................ ................ ................ ................ ....................44 Reserve position in the International Monetary Fund ............................... ................ .............. ................ ................ ................ ................ ................ ................ ................ ................ ................ ................ ....................45 Foreign currencies ...................................................................................... ................ .............. ................ ................ ................ ................ ................ ................ ................ ................ ................ ................ ....................
46 U.S. Government assets, other than official reserve assets, net ................. 70 –301 –432 –73 –417 10 48 19 ................ ................ ................ ................ ....................47 U.S. credits and other long-term assets .................................................... –470 –1,550 –852 –95 –587 –17 –153 –2 ................ ................ ................ ................ ....................48 Repayments on U.S. credits and other long-term assets 8 ...................... 446 1,276 418 22 165 30 201 21 ................ ................ ................ ................ ....................49 U.S. foreign currency holdings and U.S. short-term assets, net .............. 94 –27 2 ................ 5 –3 ................ ................ ................ ................ ................ ................ ....................
50 U.S. private assets, net .................................................................................. –2,136 –1,978 769 438 –910 1,487 –246 –948 –26,742 –7,436 –39,363 –11,097 –11,62951 Direct investment ........................................................................................ –1,796 –1,814 277 –259 –609 1,529 –384 –784 –7,831 –15,947 –18,301 –2,064 –5,48052 Foreign securities ........................................................................................ –2,121 –230 –176 –146 –263 –226 459 886 –1,924 –5,570 –14,720 –3,775 –4,17653 U.S. claims on unaffiliated foreigners reported by U.S. nonbanking
concerns ................................................................................................. 230 45 –111 –90 –41 69 –49 ................ 5,081 –5,025 –3,188 945 4654 U.S. claims reported by U.S. banks, not included elsewhere .................. 1,551 21 779 933 3 115 –272 –1,050 –22,068 19,106 –3,154 –6,203 –2,019
55 Foreign-owned assets in the United States, net (increase/financialinflow (+)) ....................................................................................................... –2,486 5,273 16,421 5,275 178 5,150 5,818 662 17,858 53,654 51,336 19,583 15,078
56 Foreign official assets in the United States, net ........................................... (18) (18) (18) (18) (18) (18) (18) (18) 513 1,958 –172 1,167 –15257 U.S. Government securities ........................................................................ (18) (18) (18) (18) (18) (18) (18) (18) (17) (17) (17) (17) (17)58 U.S. Treasury securities 9 ...................................................................... (18) (18) (18) (18) (18) (18) (18) (18) (17) (17) (17) (17) (17)59 Other 10 ................................................................................................... (18) (18) (18) (18) (18) (18) (18) (18) (17) (17) (17) (17) (17)60 Other U.S. Government liabilities 11 .......................................................... 185 438 335 100 124 110 1 9 –25 7 –63 –13 –1161 U.S. liabilities reported by U.S. banks, not included elsewhere ............... (18) (18) (18) (18) (18) (18) (18) (18) (17) (17) (17) (17) (17)62 Other foreign official assets 12 ................................................................... (18) (18) (18) (18) (18) (18) (18) (18) (17) (17) (17) (17) (17)
63 Other foreign assets in the United States, net .............................................. (18) (18) (18) (18) (18) (18) (18) (18) 17,345 51,696 51,508 18,416 15,23064 Direct investment ........................................................................................ –87 888 1,326 1,058 120 215 –67 519 15,958 21,241 27,975 8,984 6,87465 U.S. Treasury securities ............................................................................. (18) (18) (18) (18) (18) (18) (18) (18) (17) (17) (17) (17) (17)66 U.S. securities other than U.S. Treasury securities .................................. 483 –175 1,275 86 150 –43 1,082 265 277 16,153 18,579 5,098 3,29367 U.S. currency .............................................................................................. ................ .............. ................ ................ ................ ................ ................ ................ ................ ................ ................ ................ ....................68 U.S. liabilities to unaffiliated foreigners reported by U.S. nonbanking
concerns ................................................................................................. –103 167 –132 45 –86 –125 34 ................ –539 407 7,080 1,974 1,66169 U.S. liabilities reported by U.S. banks, not included elsewhere ............... –2,964 3,955 13,617 3,986 –130 4,993 4,768 –131 (17) (17) (17) (17) (17)
70 Statistical discrepancy (sum of above items with sign reversed) ............. 9,725 4,330 –6,388 –3,053 3,640 –3,505 –3,470 2,964 12,649 –31,637 18,620 –2,797 3,446
Memoranda:71 Balance on goods (lines 3 and 20) .................................................................... –3,461 –5,927 –10,176 –2,581 –2,357 –2,932 –2,306 –2,744 –19,109 –34,561 –54,691 –11,477 –12,88472 Balance on services (lines 4 and 21) ................................................................ 1,292 1,397 1,687 514 189 452 532 626 3,629 5,646 6,832 2,611 1,73173 Balance on goods and services (lines 2 and 19) .............................................. –2,169 –4,530 –8,489 –2,067 –2,168 –2,480 –1,774 –2,118 –15,480 –28,915 –47,859 –8,866 –11,15374 Balance on income (lines 12 and 29) ................................................................ 386 1,254 1,760 419 619 363 359 428 12,239 14,882 17,881 3,353 4,40375 Unilateral current transfers, net (line 35) ........................................................... –3,410 –4,073 –3,667 –946 –948 –1,031 –742 –1,011 –606 –638 –724 –201 –16676 Balance on current account (lines 1, 18, and 35 or lines 73, 74, and 75) 13 –5,193 –7,349 –10,396 –2,594 –2,497 –3,148 –2,157 –2,701 –3,847 –14,671 –30,702 –5,714 –6,916
See footnotes on page 66.

July 2001 ● 77
Transactions, by Area—Continuedof dollars]
Canada Latin America and Other Western Hemisphere Japan
Line2000 20011998 1999 2000
2000 20011998 1999 2000
2000 2001
III IV I p I II III IV I p I II III IV I p
54,801 56,851 56,047 252,156 255,056 304,094 69,901 75,526 79,568 79,099 74,334 95,765 98,193 112,278 26,420 27,150 28,750 29,958 28,709 1
48,111 49,898 49,247 189,514 191,228 225,375 52,275 55,513 59,592 57,995 54,530 87,296 87,922 98,470 23,858 23,795 25,317 25,500 24,762 2
42,343 44,281 42,649 142,195 141,650 170,262 39,563 42,146 44,480 44,073 41,410 56,477 56,074 63,576 15,369 15,499 15,965 16,743 16,062 3
5,768 5,617 6,598 47,319 49,578 55,113 12,712 13,367 15,112 13,922 13,120 30,819 31,848 34,894 8,489 8,296 9,352 8,757 8,700 442 40 25 469 617 838 204 196 248 190 158 957 1,099 590 182 134 140 134 228 5
1,678 1,438 2,006 19,498 19,801 21,909 4,785 5,272 6,271 5,581 4,783 9,424 9,711 10,238 2,441 2,392 2,922 2,483 2,413 6419 364 375 5,600 5,466 5,958 1,340 1,471 1,688 1,459 1,364 3,616 3,585 3,773 906 903 1,062 902 912 7687 669 628 3,282 3,411 3,456 780 854 945 877 806 2,819 3,082 3,508 823 877 931 877 807 8
534 571 531 2,551 2,694 2,995 688 716 750 841 793 5,774 5,992 6,993 1,625 1,703 1,782 1,883 1,756 92,388 2,514 3,012 15,775 17,393 19,792 4,874 4,817 5,169 4,932 5,173 8,187 8,346 9,730 2,498 2,272 2,499 2,461 2,567 10
20 21 21 144 196 165 41 41 41 42 43 42 33 62 14 15 16 17 17 11
6,690 6,953 6,800 62,642 63,828 78,719 17,626 20,013 19,976 21,104 19,804 8,469 10,271 13,808 2,562 3,355 3,433 4,458 3,947 126,670 6,934 6,780 62,502 63,701 78,589 17,593 19,980 19,944 21,072 19,770 8,456 10,263 13,800 2,560 3,353 3,431 4,456 3,945 133,490 3,749 3,897 17,019 18,909 19,115 4,248 5,104 4,640 5,123 5,418 2,010 4,130 7,266 1,213 1,859 1,847 2,347 2,198 143,180 3,185 2,883 45,101 44,377 59,081 13,252 14,773 15,193 15,863 14,255 6,360 6,118 6,512 1,345 1,482 1,583 2,102 1,735 15
.................... ................ ................ 382 415 393 93 103 111 86 97 86 15 22 2 12 1 7 12 1620 19 20 140 127 130 33 33 32 32 34 13 8 8 2 2 2 2 2 17
–64,031 –65,336 –62,076 –233,969 –257,810 –322,905 –74,692 –80,196 –84,316 –83,701 –80,103 –170,263 –185,884 –209,517 –50,467 –52,725 –52,756 –53,569 –50,188 18
–62,060 –63,789 –61,532 –178,797 –201,868 –248,364 –57,988 –61,664 –64,893 –63,819 –61,560 –136,621 –147,975 –165,202 –39,253 –41,367 –41,390 –43,192 –39,508 19
–56,800 –60,154 –57,875 –145,461 –169,030 –210,179 –49,331 –52,210 –54,674 –53,964 –51,560 –121,853 –130,878 –146,497 –34,742 –36,574 –36,581 –38,600 –34,630 20
–5,260 –3,635 –3,657 –33,336 –32,838 –38,185 –8,657 –9,454 –10,219 –9,855 –10,000 –14,768 –17,097 –18,705 –4,511 –4,793 –4,809 –4,592 –4,878 21–18 –18 –20 –373 –300 –279 –27 –63 –99 –90 –90 –1,284 –1,332 –1,320 –308 –323 –369 –320 –320 22
–2,692 –1,081 –981 –15,725 –16,650 –17,977 –4,543 –4,632 –4,695 –4,107 –4,592 –2,719 –2,845 –2,872 –685 –796 –739 –652 –669 23–256 –170 –116 –2,894 –3,038 –3,046 –728 –743 –820 –755 –743 –784 –860 –938 –205 –247 –233 –253 –219 24–906 –881 –837 –2,351 –2,607 –3,232 –770 –785 –825 –852 –811 –4,219 –4,986 –5,738 –1,311 –1,392 –1,569 –1,466 –1,377 25
–251 –265 –252 –774 –973 –1,114 –255 –268 –291 –300 –273 –2,245 –3,125 –3,974 –1,027 –1,099 –910 –938 –1,391 26–1,085 –1,168 –1,398 –10,725 –8,774 –12,013 –2,203 –2,832 –3,358 –3,620 –3,358 –3,391 –3,856 –3,725 –939 –903 –955 –928 –867 27
–52 –52 –53 –494 –496 –524 –131 –131 –131 –131 –133 –126 –93 –138 –36 –33 –34 –35 –35 28
–1,971 –1,547 –544 –55,172 –55,942 –74,541 –16,704 –18,532 –19,423 –19,882 –18,543 –33,642 –37,909 –44,315 –11,214 –11,358 –11,366 –10,377 –10,680 29–1,910 –1,482 –477 –49,285 –49,658 –68,134 –15,279 –16,983 –17,714 –18,158 –17,031 –33,582 –37,850 –44,260 –11,197 –11,347 –11,357 –10,359 –10,663 30
134 536 1,304 –1,286 –1,120 –2,928 –762 –757 –696 –713 –596 –4,299 –6,165 –7,337 –2,195 –2,178 –1,834 –1,130 –1,562 31–1,518 –1,464 –1,257 –36,595 –38,017 –52,280 –11,479 –13,035 –13,669 –14,097 –12,940 –9,325 –10,077 –10,915 –2,908 –2,663 –2,876 –2,468 –2,406 32
–526 –554 –524 –11,404 –10,521 –12,926 –3,038 –3,191 –3,349 –3,348 –3,495 –19,958 –21,608 –26,008 –6,094 –6,506 –6,647 –6,761 –6,695 33–61 –65 –67 –5,887 –6,284 –6,407 –1,425 –1,549 –1,709 –1,724 –1,512 –60 –59 –55 –17 –11 –9 –18 –17 34
–187 –170 –222 –13,073 –14,762 –15,634 –3,814 –3,820 –4,014 –3,986 –3,998 –227 –235 –252 –102 –41 –66 –43 –105 35.................... ................ ................ –1,342 –1,797 –1,972 –427 –501 –539 –505 –364 ................ ................ ................ ................... ................ ................ ................ ................ 36
–126 –125 –139 –687 –697 –756 –181 –169 –178 –228 –183 –102 –106 –114 –28 –28 –29 –29 –24 37–61 –45 –83 –11,044 –12,268 –12,906 –3,206 –3,150 –3,297 –3,253 –3,451 –125 –129 –138 –74 –13 –37 –14 –81 38
36 27 32 285 –3,855 256 65 66 57 68 58 24 24 24 6 6 6 6 8 39
–1,793 –14,844 –9,279 –70,374 –83,728 –152,154 –19,510 –30,713 –14,361 –87,570 –176 30,007 –34,991 8,952 1,099 32 4,050 3,771 –16,429 40
.................... ................ ................ ................ ................ ................ ................ ................ ................ ................ ................ 1,218 –2,224 4,137 242 182 2,660 1,053 –445 41
.................... ................ ................ ................ ................ ................ ................ ................ ................ ................ ................ ................ ................ ................ ................... ................ ................ ................ ................ 42
.................... ................ ................ ................ ................ ................ ................ ................ ................ ................ ................ ................ ................ ................ ................... ................ ................ ................ ................ 43
.................... ................ ................ ................ ................ ................ ................ ................ ................ ................ ................ ................ ................ ................ ................... ................ ................ ................ ................ 44
.................... ................ ................ ................ ................ ................ ................ ................ ................ ................ ................ 1,218 –2,224 4,137 242 182 2,660 1,053 –445 45
.................... ................ ................ 158 4,390 135 7 65 125 –62 –40 –10 2 39 37 ................ –1 3 –1 46
.................... ................ ................ –1,313 –1,571 –676 –207 –129 –182 –158 –247 ................ ................ ................ ................... ................ ................ ................ ................ 47
.................... ................ ................ 1,474 5,991 899 226 206 361 106 215 ................ ................ ................ ................... ................ ................ ................ ................ 48
.................... ................ ................ –3 –30 –88 –12 –12 –54 –10 –8 –10 2 39 37 ................ –1 3 –1 49
–1,793 –14,844 –9,279 –70,532 –88,118 –152,289 –19,517 –30,778 –14,486 –87,508 –136 28,799 –32,769 4,776 820 –150 1,391 2,715 –15,983 50–6,243 –4,514 –4,084 –16,697 –20,600 –19,948 –4,669 –2,219 –9,601 –3,459 –6,008 –6,428 –5,178 –8,060 –1,955 –2,087 –2,034 –1,984 –2,609 51
32 –6,801 656 –26,963 –29,730 –33,282 –10,904 –10,098 –8,905 –3,375 –1,987 –1,793 –43,565 21,966 –1,605 13,244 7,673 2,654 –5,640 52
–3,260 –919 ................ –14,460 –8,844 –77,996 –37,201 –15,826 20,342 –45,311 7,956 472 –5,139 –2,795 3,494 –6,183 –1,043 937 ................ 537,678 –2,610 –5,851 –12,412 –28,944 –21,063 33,257 –2,635 –16,322 –35,363 –97 36,548 21,113 –6,335 886 –5,124 –3,205 1,108 –7,734 54
1,807 14,868 –2,825 29,603 103,067 167,878 27,880 50,230 13,618 76,150 42,369 38,190 34,223 61,758 –14,121 23,529 16,583 35,767 7,743 55
–738 –449 –2,100 (18) (18) (18) (18) (18) (18) (18) (18) (18) (18) (18) (18) (18) (18) (18) (18) 56(17) (17) (17) (18) (18) (18) (18) (18) (18) (18) (18) (18) (18) (18) (18) (18) (18) (18) (18) 57(17) (17) (17) (18) (18) (18) (18) (18) (18) (18) (18) (18) (18) (18) (18) (18) (18) (18) (18) 58(17) (17) (17) (18) (18) (18) (18) (18) (18) (18) (18) (18) (18) (18) (18) (18) (18) (18) (18) 59–17 –22 –2 –37 –38 7 ................ –27 –27 61 68 –101 –773 –239 –178 –78 137 –120 –235 60(17) (17) (17) (18) (18) (18) (18) (18) (18) (18) (18) (18) (18) (18) (18) (18) (18) (18) (18) 61(17) (17) (17) (18) (18) (18) (18) (18) (18) (18) (18) (18) (18) (18) (18) (18) (18) (18) (18) 62
2,545 15,317 –725 (18) (18) (18) (18) (18) (18) (18) (18) (18) (18) (18) (18) (18) (18) (18) (18) 632,160 9,957 1,526 –2,569 16,410 4,326 –709 2,769 615 1,651 1,081 8,024 15,489 10,043 –1,850 522 7,872 3,499 1,733 64
(17) (17) (17) (18) (18) (18) (18) (18) (18) (18) (18) (18) (18) (18) (18) (18) (18) (18) (18) 653,698 6,490 5,275 23,512 60,889 37,416 17,323 –417 15,505 5,005 15,171 6,696 22,690 40,914 –1,127 6,959 16,123 18,959 8,228 66
.................... ................ ................ ................ ................ ................ ................ ................ ................ ................ ................ ................ ................ ................ ................... ................ ................ ................ ................ 67
–2 3,447 ................ 12,316 –21,097 41,447 –1,085 21,369 3,262 17,901 32,651 –5,375 –1,784 5,446 –59 2,981 –1,422 3,946 ................ 68(17) (17) (17) –3,619 46,903 84,682 12,351 26,536 –5,737 51,532 –6,602 28,946 –1,399 5,594 –10,907 13,145 –6,127 9,483 –1,983 69
9,367 8,604 18,323 35,372 2,032 18,465 170 –11,093 9,448 19,940 –32,484 6,504 88,670 26,757 37,165 2,049 3,433 –15,890 30,262 70
–14,457 –15,873 –15,226 –3,266 –27,380 –39,917 –9,768 –10,064 –10,194 –9,891 –10,150 –65,376 –74,804 –82,921 –19,373 –21,075 –20,616 –21,857 –18,568 71508 1,982 2,941 13,983 16,740 16,928 4,055 3,913 4,893 4,067 3,120 16,051 14,751 16,189 3,978 3,503 4,543 4,165 3,822 72
–13,949 –13,891 –12,285 10,717 –10,640 –22,989 –5,713 –6,151 –5,301 –5,824 –7,030 –49,325 –60,053 –66,732 –15,395 –17,572 –16,073 –17,692 –14,746 734,719 5,406 6,256 7,470 7,886 4,178 922 1,481 553 1,222 1,261 –25,173 –27,638 –30,507 –8,652 –8,003 –7,933 –5,919 –6,733 74–187 –170 –222 –13,073 –14,762 –15,634 –3,814 –3,820 –4,014 –3,986 –3,998 –227 –235 –252 –102 –41 –66 –43 –105 75
–9,417 –8,655 –6,251 5,114 –17,516 –34,445 –8,605 –8,490 –8,762 –8,588 –9,767 –74,725 –87,926 –97,491 –24,149 –25,616 –24,072 –23,654 –21,584 76

78 ● July 2001
Table 10.—U.S. International[Millions
Line (Credits +; debits –) 1
Australia
1998 1999 20002000 2001
I II III IV I p
Current account1 Exports of goods and services and income receipts ...................................................................................................................... 21,902 22,932 25,441 6,075 6,512 6,468 6,386 5,661
2 Exports of goods and services ........................................................................................................................................................... 16,555 16,881 17,944 4,474 4,704 4,493 4,273 4,054
3 Goods, balance of payments basis 2 ............................................................................................................................................. 11,604 11,540 12,189 2,971 3,268 3,010 2,940 2,704
4 Services 3 ........................................................................................................................................................................................ 4,951 5,341 5,755 1,503 1,436 1,483 1,333 1,3505 Transfers under U.S. military agency sales contracts 4 ........................................................................................................... 152 294 335 233 34 34 34 62
6 Travel .......................................................................................................................................................................................... 1,562 1,735 1,856 408 510 532 406 4037 Passenger fares ......................................................................................................................................................................... 548 520 528 121 140 142 125 1228 Other transportation ................................................................................................................................................................... 282 351 334 73 81 102 78 72
9 Royalties and license fees 5 ...................................................................................................................................................... 728 730 719 170 182 181 186 17310 Other private services 5 ............................................................................................................................................................. 1,674 1,704 1,975 496 487 490 502 51611 U.S. Government miscellaneous services ................................................................................................................................. 5 7 8 2 2 2 2 2
12 Income receipts ................................................................................................................................................................................... 5,347 6,051 7,497 1,601 1,808 1,975 2,113 1,60713 Income receipts on U.S.-owned assets abroad ............................................................................................................................ 5,339 6,047 7,493 1,600 1,807 1,974 2,112 1,60614 Direct investment receipts .......................................................................................................................................................... 1,908 2,465 3,625 658 827 1,011 1,129 67615 Other private receipts ................................................................................................................................................................. 3,431 3,582 3,868 942 980 963 983 93016 U.S. Government receipts .......................................................................................................................................................... ................ ................ ................ ................ ................ ................ ................ ....................17 Compensation of employees .......................................................................................................................................................... 8 4 4 1 1 1 1 1
18 Imports of goods and services and income payments ................................................................................................................... –10,161 –9,963 –11,928 –2,765 –3,240 –2,979 –2,944 –2,695
19 Imports of goods and services ........................................................................................................................................................... –8,793 –8,512 –9,802 –2,208 –2,535 –2,533 –2,526 –2,366
20 Goods, balance of payments basis 2 ............................................................................................................................................. –5,390 –5,281 –6,422 –1,345 –1,676 –1,732 –1,669 –1,457
21 Services 3 ........................................................................................................................................................................................ –3,403 –3,231 –3,380 –863 –859 –801 –857 –90922 Direct defense expenditures ...................................................................................................................................................... –43 –62 –81 –18 –31 –16 –16 –23
23 Travel .......................................................................................................................................................................................... –1,201 –1,294 –1,465 –411 –401 –311 –342 –40224 Passenger fares ......................................................................................................................................................................... –587 –633 –619 –157 –140 –146 –176 –16625 Other transportation ................................................................................................................................................................... –214 –197 –244 –61 –57 –67 –59 –57
26 Royalties and license fees 5 ...................................................................................................................................................... –59 –78 –73 –15 –15 –27 –16 –1827 Other private services 5 ............................................................................................................................................................. –1,250 –925 –862 –192 –206 –225 –239 –23328 U.S. Government miscellaneous services ................................................................................................................................. –49 –42 –36 –9 –9 –9 –9 –10
29 Income payments ................................................................................................................................................................................ –1,368 –1,451 –2,126 –557 –705 –446 –418 –32930 Income payments on foreign-owned assets in the United States ................................................................................................ –1,361 –1,444 –2,119 –555 –703 –445 –416 –32731 Direct investment payments ....................................................................................................................................................... –302 –326 –487 –195 –284 –25 17 6432 Other private payments .............................................................................................................................................................. –701 –785 –1,144 –258 –305 –290 –291 –25433 U.S. Government payments ....................................................................................................................................................... –358 –333 –488 –102 –114 –130 –142 –13734 Compensation of employees .......................................................................................................................................................... –7 –7 –7 –2 –2 –1 –2 –2
35 Unilateral current transfers, net .......................................................................................................................................................... –346 –330 –305 –75 –74 –81 –75 –7836 U.S. Government grants 4 .................................................................................................................................................................. ................ ................ ................ ................ ................ ................ ................ ....................37 U.S. Government pensions and other transfers ................................................................................................................................ –39 –40 –43 –10 –11 –11 –11 –1138 Private remittances and other transfers 6 .......................................................................................................................................... –307 –290 –262 –65 –63 –70 –64 –67
Capital and financial accountCapital account
39 Capital account transactions, net ....................................................................................................................................................... 4 8 8 2 2 2 2 1
Financial account40 U.S.-owned assets abroad, net (increase/financial outflow (–)) ..................................................................................................... –10,837 –4,225 –3,357 –1,419 –295 –2,164 521 –1,776
41 U.S. official reserve assets, net ......................................................................................................................................................... ................ ................ ................ ................ ................ ................ ................ ....................42 Gold 7 .............................................................................................................................................................................................. ................ ................ ................ ................ ................ ................ ................ ....................43 Special drawing rights .................................................................................................................................................................... ................ ................ ................ ................ ................ ................ ................ ....................44 Reserve position in the International Monetary Fund ................................................................................................................... ................ ................ ................ ................ ................ ................ ................ ....................45 Foreign currencies .......................................................................................................................................................................... ................ ................ ................ ................ ................ ................ ................ ....................
46 U.S. Government assets, other than official reserve assets, net ..................................................................................................... –2 –1 1 1 ................ ................ ................ ....................47 U.S. credits and other long-term assets ........................................................................................................................................ ................ ................ ................ ................ ................ ................ ................ ....................48 Repayments on U.S. credits and other long-term assets 8 .......................................................................................................... ................ ................ ................ ................ ................ ................ ................ ....................49 U.S. foreign currency holdings and U.S. short-term assets, net .................................................................................................. –2 –1 1 1 ................ ................ ................ ....................
50 U.S. private assets, net ...................................................................................................................................................................... –10,835 –4,224 –3,358 –1,420 –295 –2,164 521 –1,77651 Direct investment ............................................................................................................................................................................ –6,284 –4,099 –1,464 37 –172 –93 –1,236 76152 Foreign securities ........................................................................................................................................................................... –1,126 –1,698 968 861 –349 525 –69 ....................53 U.S. claims on unaffiliated foreigners reported by U.S. nonbanking concerns ........................................................................... –1,221 –611 1,484 –250 2,419 –2,460 1,775 ....................54 U.S. claims reported by U.S. banks, not included elsewhere ...................................................................................................... –2,204 2,184 –4,346 –2,068 –2,193 –136 51 –2,537
55 Foreign-owned assets in the United States, net (increase/financial inflow (+)) .......................................................................... 820 8,991 6,460 1,475 61 2,400 2,524 –978
56 Foreign official assets in the United States, net ............................................................................................................................... (18) (18) (18) (18) (18) (18) (18) (18)57 U.S. Government securities ........................................................................................................................................................... (18) (18) (18) (18) (18) (18) (18) (18)58 U.S. Treasury securities 9 .......................................................................................................................................................... (18) (18) (18) (18) (18) (18) (18) (18)59 Other 10 ....................................................................................................................................................................................... (18) (18) (18) (18) (18) (18) (18) (18)60 Other U.S. Government liabilities 11 .............................................................................................................................................. 21 –48 –97 –178 3 43 35 361 U.S. liabilities reported by U.S. banks, not included elsewhere .................................................................................................. (18) (18) (18) (18) (18) (18) (18) (18)62 Other foreign official assets 12 ....................................................................................................................................................... (18) (18) (18) (18) (18) (18) (18) (18)
63 Other foreign assets in the United States, net .................................................................................................................................. (18) (18) (18) (18) (18) (18) (18) (18)64 Direct investment ............................................................................................................................................................................ 1,505 2,363 2,430 902 388 58 1,082 2865 U.S. Treasury securities ................................................................................................................................................................. (18) (18) (18) (18) (18) (18) (18) (18)66 U.S. securities other than U.S. Treasury securities ...................................................................................................................... 1,047 1,958 1,923 547 309 496 571 –12967 U.S. currency .................................................................................................................................................................................. ................ ................ ................ ................ ................ ................ ................ ....................68 U.S. liabilities to unaffiliated foreigners reported by U.S. nonbanking concerns ......................................................................... 1,364 248 –1,099 –321 –978 225 –25 ....................69 U.S. liabilities reported by U.S. banks, not included elsewhere .................................................................................................. –3,117 4,470 3,303 525 339 1,578 861 –880
70 Statistical discrepancy (sum of above items with sign reversed) ................................................................................................. –1,382 –17,413 –16,319 –3,293 –2,966 –3,646 –6,414 –135
Memoranda:71 Balance on goods (lines 3 and 20) ........................................................................................................................................................ 6,214 6,259 5,767 1,626 1,592 1,278 1,271 1,24772 Balance on services (lines 4 and 21) .................................................................................................................................................... 1,548 2,110 2,375 640 577 682 476 44173 Balance on goods and services (lines 2 and 19) ................................................................................................................................. 7,762 8,369 8,142 2,266 2,169 1,960 1,747 1,68874 Balance on income (lines 12 and 29) .................................................................................................................................................... 3,979 4,600 5,371 1,044 1,103 1,529 1,695 1,27875 Unilateral current transfers, net (line 35) ............................................................................................................................................... –346 –330 –305 –75 –74 –81 –75 –7876 Balance on current account (lines 1, 18, and 35 or lines 73, 74, and 75) 13 ..................................................................................... 11,395 12,639 13,208 3,235 3,198 3,408 3,367 2,888
See footnotes on page 66.

July 2001 ● 79
Transactions, by Area—Continuedof dollars]
Other countries in Asia and Africa International organizations and unallocated 16
Line1998 1999 2000
2000 20011998 1999 2000
2000 2001
I II III IV I p I II III IV I p
214,050 222,713 259,942 59,449 64,170 69,073 67,250 65,598 31,592 34,085 35,465 8,739 8,880 8,745 9,101 8,001 1
191,049 196,196 223,371 50,435 55,051 59,672 58,213 56,403 6,231 5,979 6,141 1,518 1,494 1,519 1,610 1,543 2
136,568 139,901 162,477 35,862 39,911 43,556 43,148 41,288 76 ................. 1 ................... 1 ................... ................... ................... 3
54,481 56,295 60,894 14,573 15,140 16,116 15,065 15,115 6,155 5,979 6,140 1,518 1,493 1,519 1,610 1,543 410,641 9,192 8,614 1,892 2,505 1,996 2,221 1,880 ................. ................. ................. ................... ................... ................... ................... ................... 5
10,484 10,843 13,150 2,512 3,676 4,024 2,938 2,483 ................. ................. ................. ................... ................... ................... ................... ................... 61,832 1,582 1,787 353 443 535 456 356 ................. ................. ................. ................... ................... ................... ................... ................... 77,510 8,617 9,946 2,305 2,503 2,581 2,557 2,315 568 566 556 134 141 142 139 136 8
4,141 4,507 4,791 1,135 1,148 1,210 1,298 1,210 1,842 1,931 1,983 479 484 487 533 499 919,422 21,213 22,276 6,297 4,782 5,687 5,510 6,785 3,745 3,482 3,601 905 868 890 938 908 10
451 341 330 79 83 83 85 86 ................. ................. ................. ................... ................... ................... ................... ................... 11
23,001 26,517 36,571 9,014 9,119 9,401 9,037 9,195 25,361 28,106 29,324 7,221 7,386 7,226 7,491 6,458 1222,936 26,442 36,491 8,994 9,099 9,381 9,017 8,682 23,880 26,361 27,454 6,765 6,921 6,755 7,013 6,458 1310,883 15,543 23,082 5,151 5,598 6,198 6,135 5,771 13,721 14,703 14,481 3,525 3,587 3,533 3,836 3,848 1410,944 9,848 12,033 3,270 3,266 2,850 2,647 2,578 9,344 10,877 12,249 3,059 3,153 3,040 2,997 2,422 15
1,109 1,051 1,376 573 235 333 235 333 815 781 724 181 181 182 180 188 1665 75 80 20 20 20 20 513 1,481 1,745 1,870 456 465 471 478 ................... 17
–326,228 –365,966 –447,880 –98,366 –108,446 –123,858 –117,210 –103,773 –10,351 –11,812 –14,551 –3,271 –3,461 –4,030 –3,789 –3,794 18
–297,971 –334,911 –409,452 –89,611 –98,456 –113,469 –107,916 –94,750 –2,359 –1,779 –2,866 –496 –549 –1,123 –698 –728 19
–263,484 –296,821 –368,114 –79,535 –88,143 –103,153 –97,283 –84,524 ................. ................. ................. ................... ................... ................... ................... ................... 20
–34,487 –38,090 –41,338 –10,076 –10,313 –10,316 –10,633 –10,226 –2,359 –1,779 –2,866 –496 –549 –1,123 –698 –728 21–3,843 –3,806 –3,720 –898 –973 –963 –886 –902 ................. ................. ................. ................... ................... ................... ................... ................... 22
–10,665 –10,875 –11,912 –2,998 –3,091 –2,696 –3,127 –2,929 ................. ................. ................. ................... ................... ................... ................... ................... 23–4,565 –5,049 –5,164 –1,333 –1,263 –1,321 –1,247 –1,427 ................. ................. ................. ................... ................... ................... ................... ................... 24–7,962 –10,566 –12,865 –2,901 –3,098 –3,433 –3,433 –3,112 –1,384 –1,147 –1,519 –312 –363 –407 –437 –461 25
–164 –314 –300 –66 –68 –75 –91 –84 –734 –446 –1,074 –121 –126 –646 –181 –151 26–6,496 –6,728 –6,614 –1,690 –1,631 –1,636 –1,657 –1,578 –239 –186 –273 –63 –60 –70 –80 –116 27
–792 –752 –763 –190 –189 –192 –192 –194 –2 ................. ................. ................... ................... ................... ................... ................... 28
–28,257 –31,055 –38,428 –8,755 –9,990 –10,389 –9,294 –9,023 –7,992 –10,033 –11,685 –2,775 –2,912 –2,907 –3,091 –3,066 29–27,814 –30,621 –37,914 –8,601 –9,885 –10,299 –9,129 –8,859 –7,992 –10,033 –11,685 –2,775 –2,912 –2,907 –3,091 –3,066 30
362 –462 –2,591 –282 –1,193 –1,127 11 –148 –5,179 –6,895 –7,851 –1,873 –1,910 –1,945 –2,123 –2,151 31–10,051 –10,580 –13,209 –3,030 –3,195 –3,481 –3,503 –3,332 –2,793 –3,114 –3,814 –896 –998 –956 –964 –909 32–18,125 –19,579 –22,114 –5,289 –5,497 –5,691 –5,637 –5,379 –20 –24 –20 –6 –4 –6 –4 –6 33
–443 –434 –514 –154 –105 –90 –165 –164 ................. ................. ................. ................... ................... ................... ................... ................... 34
–17,290 –17,101 –22,250 –4,290 –4,103 –5,005 –8,852 –4,045 –8,603 –10,479 –10,011 –2,496 –2,623 –2,162 –2,730 –1,925 35–8,394 –7,388 –11,382 –1,497 –1,645 –2,224 –6,016 –1,013 –1,068 –1,520 –1,173 –357 –451 –197 –168 –234 36
–414 –487 –497 –122 –127 –125 –123 –155 –1,147 –1,165 –1,306 –259 –100 –191 –756 –267 37–8,482 –9,226 –10,371 –2,671 –2,331 –2,656 –2,713 –2,877 –6,388 –7,794 –7,532 –1,880 –2,072 –1,774 –1,806 –1,424 38
115 120 126 30 34 28 34 36 ................. ................. ................. ................... ................... ................... ................... ................... 39
3,029 –2,993 –14,576 –7,161 –11,366 –989 4,940 –8,290 –20,004 –10,360 –13,400 –3,536 –1,805 –2,563 –5,496 –14,214 40
................... ................... ................... ................... ................... ................... ................... ................... –5,266 5,494 1,586 –417 2,148 1,118 –1,263 385 41
................... ................... ................... ................... ................... ................... ................... ................... ................. ................. ................. ................... ................... ................... ................... ................... 42
................... ................... ................... ................... ................... ................... ................... ................... –147 10 –722 –180 –180 –182 –180 –189 43
................... ................... ................... ................... ................... ................... ................... ................... –5,119 5,484 2,308 –237 2,328 1,300 –1,083 574 44
................... ................... ................... ................... ................... ................... ................... ................... ................. ................. ................. ................... ................... ................... ................... ................... 45
–132 –791 –54 –107 16 273 –236 247 –1,161 –1,052 –1,178 –248 –265 –307 –358 –353 46–1,456 –1,667 –2,020 –1,127 –348 –236 –309 –446 –1,161 –1,052 –1,178 –248 –265 –307 –358 –353 47
1,276 1,365 2,001 786 398 563 254 556 ................. ................. ................. ................... ................... ................... ................... ................... 4848 –489 –35 234 –34 –54 –181 137 ................. ................. ................. ................... ................... ................... ................... ................... 49
3,161 –2,202 –14,522 –7,054 –11,382 –1,262 5,176 –8,537 –13,577 –14,802 –13,808 –2,871 –3,688 –3,374 –3,875 –14,246 50–7,175 –13,938 –14,495 –4,078 –3,563 –4,089 –2,765 –6,248 –11,974 –13,608 –13,233 –3,269 –3,377 –3,279 –3,308 –3,327 51–6,080 3,017 117 –2,502 –4,314 2,278 4,655 –444 –340 –151 –454 175 56 –253 –432 1,058 52
1,799 –2,506 –3,102 –1,388 249 –1,469 –494 ................... 3 13 –78 –8 10 ................... –80 –13,574 5314,617 11,225 2,958 914 –3,754 2,018 3,780 –1,845 –1,266 –1,056 –43 231 –377 158 –55 1,597 54
17,595 53,067 59,442 4,990 21,209 13,007 20,236 31,001 21,204 32,190 5,728 –1,646 5,713 –3,631 5,292 14,403 55
(18) (18) (18) (18) (18) (18) (18) (18) 2 ................. 5 1 1 3 ................... ................... 56(18) (18) (18) (18) (18) (18) (18) (18) ................. ................. ................. ................... ................... ................... ................... ................... 57(18) (18) (18) (18) (18) (18) (18) (18) ................. ................. ................. ................... ................... ................... ................... ................... 58(18) (18) (18) (18) (18) (18) (18) (18) ................. ................. ................. ................... ................... ................... ................... ................... 59
–2,708 –1,154 –1,642 43 –880 –538 –267 –748 2 ................. 5 1 1 3 ................... ................... 60(18) (18) (18) (18) (18) (18) (18) (18) ................. ................. ................. ................... ................... ................... ................... ................... 61(18) (18) (18) (18) (18) (18) (18) (18) ................. ................. ................. ................... ................... ................... ................... ................... 62
(18) (18) (18) (18) (18) (18) (18) (18) 21,202 32,190 5,723 –1,647 5,712 –3,634 5,292 14,403 63–1,593 384 12,082 867 7,917 1,394 1,904 852 3,775 6,031 6,539 1,547 1,595 1,659 1,738 1,833 64
(18) (18) (18) (18) (18) (18) (18) (18) (18) (18) (18) (18) (18) (18) (18) (18) 65–1,714 15,134 36,996 7,550 10,203 5,647 13,596 22,889 51 293 –97 –121 7 165 –148 290 66
................... ................... ................... ................... ................... ................... ................... ................... 16,622 22,407 1,129 –6,847 989 757 6,230 2,311 67–3,009 339 2,908 2,177 4,013 1,847 –5,129 ................... 200 160 182 29 64 20 69 9,618 6826,619 38,364 9,098 –5,647 –44 4,657 10,132 8,008 554 3,299 –2,030 3,745 3,057 –6,235 –2,597 351 69
108,729 110,160 165,196 45,348 38,502 47,744 33,602 19,473 –13,838 –33,624 –3,231 2,210 –6,704 3,641 –2,378 –2,471 70
–126,916 –156,920 –205,637 –43,673 –48,232 –59,597 –54,135 –43,236 76 ................. 1 ................... 1 ................... ................... ................... 7119,994 18,205 19,556 4,497 4,827 5,800 4,432 4,889 3,796 4,200 3,274 1,022 944 396 912 815 72
–106,922 –138,715 –186,081 –39,176 –43,405 –53,797 –49,703 –38,347 3,872 4,200 3,275 1,022 945 396 912 815 73–5,256 –4,538 –1,857 259 –871 –988 –257 172 17,369 18,073 17,639 4,446 4,474 4,319 4,400 3,392 74
–17,290 –17,101 –22,250 –4,290 –4,103 –5,005 –8,852 –4,045 –8,603 –10,479 –10,011 –2,496 –2,623 –2,162 –2,730 –1,925 75–129,468 –160,354 –210,188 –43,207 –48,379 –59,790 –58,812 –42,220 12,638 11,794 10,903 2,972 2,796 2,553 2,582 2,282 76

80 ● July 2001
Table 10a.—U.S. International Transactions,[Millions
Line (Credits +; debits –) 1Belgium–Luxembourg France Germany
1998 1999 2000 p 1998 1999 2000 p 1998 1999 2000 p
Current account1 Exports of goods and services and income receipts ............................................................................... 23,024 22,953 25,021 34,580 35,990 40,959 55,004 57,227 62,379
2 Exports of goods and services .................................................................................................................... 17,712 16,769 17,931 27,229 28,476 30,563 41,302 42,610 45,228
3 Goods, balance of payments basis 2 ...................................................................................................... 14,410 13,265 14,266 17,510 18,584 20,200 26,171 26,364 28,923
4 Services 3 ................................................................................................................................................. 3,302 3,504 3,665 9,719 9,892 10,363 15,131 16,246 16,3055 Transfers under U.S. military agency sales contracts 4 .................................................................... 318 84 143 133 161 33 208 265 250
6 Travel ................................................................................................................................................... 487 562 506 2,348 2,330 2,637 4,155 4,398 4,0357 Passenger fares .................................................................................................................................. 262 232 188 993 1,002 1,016 1,341 1,287 1,0908 Other transportation ............................................................................................................................. 423 470 504 893 582 637 1,153 1,484 1,906
9 Royalties and license fees 5 ............................................................................................................... 684 754 719 2,193 2,073 1,996 3,218 3,077 2,95110 Other private services 5 ....................................................................................................................... 1,127 1,400 1,602 3,145 3,724 4,013 5,022 5,695 6,01111 U.S. Government miscellaneous services .......................................................................................... 1 2 3 14 20 31 34 40 62
12 Income receipts ............................................................................................................................................ 5,312 6,184 7,090 7,351 7,514 10,396 13,702 14,617 17,15113 Income receipts on U.S.-owned assets abroad ..................................................................................... 5,310 6,180 7,087 7,343 7,508 10,387 13,658 14,574 17,11614 Direct investment receipts ................................................................................................................... 3,407 4,162 4,661 2,164 1,722 2,406 5,081 5,100 4,35015 Other private receipts .......................................................................................................................... 1,903 2,018 2,426 5,179 5,786 7,981 7,965 9,036 12,24316 U.S. Government receipts ................................................................................................................... (*) .................. .................. (*) .................. .................. 612 438 52317 Compensation of employees ................................................................................................................... 2 4 3 8 6 9 44 43 35
18 Imports of goods and services and income payments ............................................................................ –17,895 –21,220 –25,468 –38,083 –42,310 –51,299 –77,768 –86,091 –89,560
19 Imports of goods and services .................................................................................................................... –10,905 –11,892 –12,795 –31,815 –33,924 –40,550 –63,440 –69,207 –74,353
20 Goods, balance of payments basis 2 ...................................................................................................... –8,773 –9,503 –10,258 –24,006 –25,705 –29,773 –49,749 –55,167 –58,501
21 Services 3 ................................................................................................................................................. –2,132 –2,389 –2,537 –7,809 –8,219 –10,777 –13,691 –14,040 –15,85222 Direct defense expenditures ............................................................................................................... –139 –226 –186 –49 –49 –49 –3,604 –3,951 –4,103
23 Travel ................................................................................................................................................... –385 –409 –350 –2,997 –3,121 –3,634 –2,063 –2,224 –2,67824 Passenger fares .................................................................................................................................. –297 –272 –349 –723 –791 –1,183 –1,454 –1,688 –1,92425 Other transportation ............................................................................................................................. –513 –522 –631 –758 –765 –938 –1,873 –1,786 –2,198
26 Royalties and license fees 5 ............................................................................................................... –160 –226 –212 –802 –890 –1,022 –1,281 –1,259 –1,65127 Other private services 5 ....................................................................................................................... –573 –669 –735 –2,254 –2,377 –3,695 –3,111 –2,826 –2,95228 U.S. Government miscellaneous services .......................................................................................... –65 –65 –74 –226 –226 –256 –305 –306 –346
29 Income payments ......................................................................................................................................... –6,990 –9,328 –12,673 –6,268 –8,386 –10,749 –14,328 –16,884 –15,20730 Income payments on foreign–owned assets in the United States ........................................................ –6,981 –9,319 –12,664 –6,223 –8,343 –10,708 –14,289 –16,846 –15,17131 Direct investment payments ................................................................................................................ –1,570 –3,082 –5,237 –1,691 –3,119 –5,562 –4,348 –6,341 –2,60332 Other private payments ....................................................................................................................... –3,492 –3,823 –5,040 –3,282 –3,499 –3,575 –3,769 –4,434 –6,22833 U.S. Government payments ................................................................................................................ –1,919 –2,414 –2,387 –1,250 –1,725 –1,571 –6,172 –6,071 –6,34034 Compensation of employees ................................................................................................................... –9 –9 –9 –45 –43 –41 –39 –38 –36
35 Unilateral current transfers, net ................................................................................................................... –69 –74 –81 –203 –249 –308 764 772 49036 U.S. Government grants 4 ............................................................................................................................ .................. .................. .................. .................. .................. .................. .................. .................. ......................37 U.S. Government pensions and other transfers ......................................................................................... –19 –19 –20 –72 –71 –73 –351 –313 –33038 Private remittances and other transfers 6 .................................................................................................... –50 –55 –61 –131 –178 –235 1,115 1,085 820
Capital and financial accountCapital account
39 Capital account transactions, net ................................................................................................................ 2 2 2 10 11 11 36 34 38
Financial account40 U.S.-owned assets abroad, net (increase/financial outflow (–)) .............................................................. –7,267 –7,086 5,118 –5,358 –11,443 –36,293 –48,595 –31,658 –23,969
41 U.S. official reserve assets, net .................................................................................................................. .................. .................. .................. .................. .................. .................. 4,598 .................. ......................42 Gold 7 ....................................................................................................................................................... .................. .................. .................. .................. .................. .................. .................. .................. ......................43 Special drawing rights ............................................................................................................................. .................. .................. .................. .................. .................. .................. .................. .................. ......................44 Reserve position in the International Monetary Fund ............................................................................ .................. .................. .................. .................. .................. .................. .................. .................. ......................45 Foreign currencies ................................................................................................................................... .................. .................. .................. .................. .................. .................. 4,598 .................. ......................
46 U.S. Government assets, other than official reserve assets, net .............................................................. 4 –2 1 4 –14 (*) 22 –20 447 U.S. credits and other long-term assets ................................................................................................. .................. .................. .................. .................. .................. .................. .................. .................. ......................48 Repayments on U.S. credits and other long-term assets 8 ................................................................... .................. .................. .................. .................. .................. .................. .................. .................. ......................49 U.S. foreign currency holdings and U.S. short-term assets, net ........................................................... 4 –2 1 4 –14 (*) 22 –20 4
50 U.S. private assets, net ............................................................................................................................... –7,271 –7,084 5,117 –5,362 –11,429 –36,293 –53,215 –31,638 –23,97351 Direct investment ..................................................................................................................................... –5,015 –1,819 –2,520 –4,323 –1,585 –1,220 –3,051 –5,796 –2,17352 Foreign securities ..................................................................................................................................... 1,783 3,696 4,502 –4,255 –978 –10,731 –28,735 –2,243 52353 U.S. claims on unaffiliated foreigners reported by U.S. nonbanking concerns .................................... –2,333 –1,271 –2,443 –159 –730 –5,068 –9,541 –11,474 –16,52454 U.S. claims reported by U.S. banks, not included elsewhere ............................................................... –1,706 –7,690 5,578 3,375 –8,136 –19,274 –11,888 –12,125 –5,799
55 Foreign-owned assets in the United States, net (increase/financial inflow (+)) .................................... 32,987 44,765 51,521 17,299 36,988 38,939 59,514 49,620 69,614
56 Foreign official assets in the United States, net ........................................................................................ (14) (14) (14) (14) (14) (14) (14) (14) (14)57 U.S. Government securities .................................................................................................................... (14) (14) (14) (14) (14) (14) (14) (14) (14)58 U.S. Treasury securities 9 ................................................................................................................... (14) (14) (14) (14) (14) (14) (14) (14) (14)59 Other 10 ................................................................................................................................................ (14) (14) (14) (14) (14) (14) (14) (14) (14)60 Other U.S. Government liabilities 11 ....................................................................................................... –191 –2 –58 44 –28 76 7 38 2061 U.S. liabilities reported by U.S. banks, not included elsewhere ............................................................ (14) (14) (14) (14) (14) (14) (14) (14) (14)62 Other foreign official assets 12 ................................................................................................................ (14) (14) (14) (14) (14) (14) (14) (14) (14)
63 Other foreign assets in the United States, net ........................................................................................... (14) (14) (14) (14) (14) (14) (14) (14) (14)64 Direct investment ..................................................................................................................................... 17,269 28,266 30,737 11,368 25,406 41,965 42,986 23,144 11,35165 U.S. Treasury securities .......................................................................................................................... (14) (14) (14) (14) (14) (14) (14) (14) (14)66 U.S. securities other than U.S. Treasury securities ............................................................................... 11,467 13,064 28,015 8,126 4,827 7,671 13,320 19,603 34,69967 U.S. currency ........................................................................................................................................... .................. .................. .................. .................. .................. .................. .................. .................. ......................68 U.S. liabilities to unaffiliated foreigners reported by U.S. nonbanking concerns .................................. 1,170 2,824 3,599 –5,400 1,603 10,123 6,694 7,330 17,46869 U.S. liabilities reported by U.S. banks, not included elsewhere ............................................................ 143,272 14613 14–10,772 143,161 145,180 14–20,896 14–3,493 14–495 146,076
70 Statistical discrepancy (sum of above items with sign reversed) .......................................................... –30,782 –39,340 –56,113 –8,245 –18,987 7,991 11,045 10,096 –18,992
Memoranda:71 Balance on goods (lines 3 and 20) ................................................................................................................. 5,637 3,762 4,008 –6,496 –7,121 –9,573 –23,578 –28,803 –29,57872 Balance on services (lines 4 and 21) ............................................................................................................. 1,170 1,115 1,128 1,910 1,673 –414 1,440 2,206 45373 Balance on goods and services (lines 2 and 19) ........................................................................................... 6,807 4,877 5,136 –4,586 –5,448 –9,987 –22,138 –26,597 –29,12574 Balance on income (lines 12 and 29) ............................................................................................................. –1,678 –3,144 –5,583 1,083 –872 –353 –626 –2,267 1,94475 Unilateral current transfers, net (line 35) ........................................................................................................ –69 –74 –81 –203 –249 –308 764 772 49076 Balance on current account (lines 1, 18, and 35 or lines 73, 74, and 75) 13 .............................................. 5,060 1,659 –528 –3,706 –6,569 –10,648 –22,000 –28,092 –26,691
See footnotes on page 66.

July 2001 ● 81
by Selected Countries (published annually)of dollars]
Italy Netherlands Mexico Venezuela South AfricaLine
1998 1999 2000 p 1998 1999 2000 p 1998 1999 2000 p 1998 1999 2000 p 1998 1999 2000 p
19,262 19,722 21,590 39,701 42,213 46,869 98,355 108,224 134,497 10,631 9,936 10,766 5,638 4,846 5,377 1
14,566 15,143 16,411 26,013 26,329 28,933 90,276 99,253 125,209 9,586 8,559 9,022 4,690 3,879 4,435 2
8,922 9,878 10,951 18,878 19,311 21,717 78,623 86,761 111,171 6,483 5,314 5,508 3,618 2,580 3,081 3
5,644 5,265 5,460 7,135 7,018 7,216 11,653 12,492 14,038 3,103 3,245 3,514 1,072 1,299 1,354 443 115 59 534 300 358 3 9 3 35 27 14 1 1 .................... 5
1,907 1,691 1,590 922 1,216 1,288 3,818 4,114 4,937 1,592 1,697 1,891 386 386 429 6651 517 485 217 352 404 958 961 1,027 323 275 317 .................... 9 11 7411 337 354 1,046 694 764 549 690 701 192 159 164 77 98 129 8
1,059 929 909 1,700 1,714 1,434 770 789 949 147 149 180 187 265 217 91,568 1,671 2,055 2,714 2,741 2,966 5,533 5,907 6,399 809 933 943 419 535 561 10
5 5 8 2 1 2 22 22 22 5 5 5 2 5 7 11
4,696 4,579 5,179 13,688 15,884 17,936 8,079 8,971 9,288 1,045 1,377 1,744 948 967 942 124,693 4,576 5,176 13,685 15,881 17,933 8,054 8,948 9,263 1,039 1,372 1,739 946 965 940 132,028 2,133 2,549 10,078 11,314 11,890 3,760 4,507 4,258 407 646 887 334 278 191 142,665 2,443 2,627 3,607 4,567 6,043 4,270 4,425 4,999 631 725 833 612 687 749 15
(*) .................... .................... (*) .................... .................... 24 16 6 1 1 19 (*) (*) (*) 163 3 3 3 3 3 25 23 25 6 5 5 2 2 2 17
–27,689 –30,350 –33,522 –20,807 –23,151 –28,328 –114,282 –129,576 –158,399 –11,033 –13,361 –21,142 –4,093 –4,115 –5,154 18
–25,688 –27,878 –31,045 –12,000 –12,439 –14,972 –105,419 –120,168 –147,998 –9,702 –12,018 –19,241 –3,946 –4,061 –5,053 19
–20,940 –22,350 –25,031 –7,537 –8,424 –9,624 –95,401 –110,550 –136,811 –8,964 –11,334 –18,623 –3,045 –3,185 –4,209 20
–4,748 –5,528 –6,014 –4,463 –4,015 –5,348 –10,018 –9,618 –11,187 –738 –684 –618 –901 –876 –844 21–615 –829 –760 –94 –112 –71 –8 –17 –7 –3 –2 –3 –6 –2 –5 22
–2,446 –2,819 –2,907 –756 –791 –745 –6,396 –5,805 –6,646 –358 –270 –249 –362 –250 –269 23–389 –496 –685 –910 –753 –968 –809 –957 –920 –122 –106 –70 –273 –305 –255 24–547 –535 –663 –797 –837 –1,012 –957 –1,070 –1,371 –82 –105 –126 –36 –64 –63 25
–80 –84 –84 –767 –767 –1,028 –67 (D) –66 –7 –7 –9 –1 –4 –1 26–596 –690 –830 –1,102 –718 –1,482 –1,587 –1,501 –1,983 –141 –169 –136 –184 –209 –211 27
–75 –75 –85 –37 –37 –42 –194 (D) –194 –25 –25 –25 –39 –42 –40 28
–2,001 –2,472 –2,477 –8,807 –10,712 –13,356 –8,863 –9,408 –10,401 –1,331 –1,343 –1,901 –147 –54 –101 29–1,986 –2,456 –2,462 –8,798 –10,703 –13,347 –3,075 –3,239 –4,128 –1,323 –1,335 –1,893 –139 –46 –94 30
–218 –428 –131 –6,139 –7,430 –9,221 –216 –175 –87 47 24 –23 8 46 14 31–974 –893 –1,054 –1,942 –2,368 –2,902 –1,537 –1,645 –2,213 –904 –938 –1,206 –78 –66 –94 32–794 –1,135 –1,277 –717 –905 –1,224 –1,322 –1,419 –1,828 –466 –421 –664 –69 –26 –14 33
–15 –16 –15 –9 –9 –9 –5,788 –6,169 –6,273 –8 –8 –8 –8 –8 –7 34
–313 –636 –346 –56 –49 –79 –4,824 –5,311 –6,036 –98 –110 –133 –295 –309 –230 35........................ .................... .................... .................... .................... .................... –10 –14 –19 –2 –1 –1 –99 –117 –83 36
–224 –223 –226 –23 –22 –23 –229 –231 –234 –4 –4 –4 –4 –4 –4 37–89 –413 –120 –33 –27 –56 –4,585 –5,066 –5,783 –92 –105 –128 –192 –188 –143 38
11 12 12 4 4 4 190 179 184 2 2 2 .................... .................... .................... 39
–880 2,336 –6,171 –18,835 –37,610 –21,045 –9,352 –4,779 –321 –1,626 –2,301 –574 –483 –85 137 40
........................ .................... .................... .................... .................... .................... .................... .................... .................... .................... .................... .................... .................... .................... .................... 41
........................ .................... .................... .................... .................... .................... .................... .................... .................... .................... .................... .................... .................... .................... .................... 42
........................ .................... .................... .................... .................... .................... .................... .................... .................... .................... .................... .................... .................... .................... .................... 43
........................ .................... .................... .................... .................... .................... .................... .................... .................... .................... .................... .................... .................... .................... .................... 44
........................ .................... .................... .................... .................... .................... .................... .................... .................... .................... .................... .................... .................... .................... .................... 45
–23 –14 41 5 1 (*) 135 132 143 –3 –5 –131 6 1 1 46........................ .................... .................... .................... .................... .................... .................... .................... .................... –5 –4 –132 .................... .................... .................... 47........................ .................... .................... .................... .................... .................... 137 132 143 2 1 1 (*) 1 1 48
–23 –14 41 5 1 (*) –2 (*) (*) (*) –2 (*) 6 (*) .................... 49
–857 2,350 –6,212 –18,840 –37,611 –21,045 –9,487 –4,911 –464 –1,623 –2,296 –443 –489 –86 136 50910 –3,695 –7,999 –22,213 –8,336 –10,927 –4,593 –5,084 –3,542 –622 –1,557 –1,256 83 –876 –74 51907 5,964 2,469 2,600 –16,310 –8,574 –1,426 –3,780 1,164 –655 –205 639 –913 797 –128 52171 –379 –359 2,297 –4,372 –4 –1,036 –511 –481 156 –31 74 149 –61 59 53
–2,845 460 –323 –1,524 –8,593 –1,540 –2,432 4,464 2,395 –502 –503 100 192 54 279 54
9,532 12,794 21,081 16,904 49,547 38,945 7,361 786 8,186 –1,095 1,867 9,037 126 213 31 55
(14) (14) (14) (14) (14) (14) (14) (14) (14) (14) (14) (14) (14) (14) (14) 56(14) (14) (14) (14) (14) (14) (14) (14) (14) (14) (14) (14) (14) (14) (14) 57(14) (14) (14) (14) (14) (14) (14) (14) (14) (14) (14) (14) (14) (14) (14) 58(14) (14) (14) (14) (14) (14) (14) (14) (14) (14) (14) (14) (14) (14) (14) 5920 –54 44 –71 126 –57 4 –1 6 –9 –16 –3 2 3 (*) 60
(14) (14) (14) (14) (14) (14) (14) (14) (14) (14) (14) (14) (14) (14) (14) 61(14) (14) (14) (14) (14) (14) (14) (14) (14) (14) (14) (14) (14) (14) (14) 62
(14) (14) (14) (14) (14) (14) (14) (14) (14) (14) (14) (14) (14) (14) (14) 631,024 1,001 1,858 6,533 40,412 22,462 871 1,269 902 –77 418 679 148 106 399 64
(14) (14) (14) (14) (14) (14) (14) (14) (14) (14) (14) (14) (14) (14) (14) 656,495 8,400 17,366 10,477 9,610 5,740 2,374 1,903 2,660 735 1,027 1,332 672 76 177 66
........................ .................... .................... .................... .................... .................... .................... .................... .................... .................... .................... .................... .................... .................... .................... 67275 753 2,608 635 –592 9,689 –88 387 –112 –60 102 –21 –80 29 –25 68
141,718 142,694 14–795 14–670 14–9 141,111 144,200 14–2,772 144,730 14–1,684 14336 147,050 14–616 14–1 14–520 69
77 –3,878 –2,644 –16,911 –30,954 –36,366 22,552 30,477 21,889 3,219 3,967 2,044 –893 –550 –161 70
–12,018 –12,472 –14,080 11,341 10,887 12,093 –16,778 –23,789 –25,640 –2,481 –6,020 –13,115 573 –605 –1,128 71896 –263 –554 2,672 3,003 1,868 1,635 2,874 2,851 2,365 2,561 2,896 171 423 510 72
–11,122 –12,735 –14,634 14,013 13,890 13,961 –15,143 –20,915 –22,789 –116 –3,459 –10,219 744 –182 –618 732,695 2,107 2,702 4,881 5,172 4,580 –784 –437 –1,113 –286 34 –157 801 913 841 74–313 –636 –346 –56 –49 –79 –4,824 –5,311 –6,036 –98 –110 –133 –295 –309 –230 75
–8,740 –11,264 –12,278 18,838 19,013 18,462 –20,751 –26,663 –29,938 –500 –3,535 –10,509 1,250 422 –7 76


![68 U.S. International Transactions October 2012 October/1012... · 3 8 15 68 U.S. International Transactions October 2012 . Table 1. U.S. International Transactions [Millions of dollars]](https://img.dokumen.tips/doc/110x75/5fb4721f0ac96a68f22c9161/68-us-international-transactions-october-2012-october1012-3-8-15-68-us.jpg)