Embed Size (px)
Citation preview

International Transactions in U.S. Residential Real Estate

About the Report
Highlights
Economic Conditions
International BuyersForeign Buyer Purchases of Existing-HomesOrigin of International BuyersDestinations of International BuyersPricesFinancingIntended Use of the PropertyType of Residential PropertyType of Area Where Property is LocatedReasons International Clients Did Not Purchase U.S. PropertyInternational Sellers
Client TransactionsTransactions with International BuyersLease Transactions, Sources of Leads and ReferralsClients Searching for Property Outside the United States
AppendicesComputation of the Dollar Volume of Foreign Buyer PurchasesNAR’s Global Partnerships
2
3
4
6
1011121518202122232425
26272829
303132
Profile of International Transactions in U.S. Residential Real Estate 2021
NATIONAL ASSOCIATION of REALTORS®
Page
Contents

As the largest economy in the world and a land of immigrants, the United States (U.S.) attracts people from across the globe who want to live, work, and study here. International clients are an important market niche served by REALTORS®.
Since 2009, the National Association of REALTORS® (NAR) has conducted an annual survey of its members to measure the size of U.S. residential real estate transactions with international clients; gather information on the origin, destination, and buying preferences of international clients; and identify the challenges and opportunities faced by REALTORS® in serving foreign clients.
The 2021 Profile of International Transactions in U.S. Residential Real Estate presents information regarding REALTOR® transactions with international clients who purchased and sold U.S. residential property during the 12-month period of April 2020–March 2021. The report also provides information on U.S. clients seeking to purchase property abroad.
This report is based on an online survey that was conducted from April 7–May 21, 2021. The survey was sent to 150,000 randomly selected REALTORS®, an additional set of 10,600 REALTORS® who participated in the 2019 and 2020 surveys, and to members of local associations which also conducted surveys of foreign buyers.1 To correct for over/under-sampling at the state level, NAR weighted the distribution of responses to the distribution of NAR members by state as of May 2021. A total of 10,827 REALTORS® responded to the national and local market surveys, of which 1,097 reported an international residential foreign buyer. Information about the characteristics of international clients is based on the most recent closed transactions of the respondents during the 12-month period.
The term international or foreign client refers to two types of clients:
• Non-resident foreigners (Type A): Non-U.S. citizens with permanentresidences outside the U.S.
• Resident foreigners (Type B): Non-U.S. citizens who are recent immigrants(less than two years at the time of the transaction) or non-immigrant visaholders who reside for more than six months in the U.S. for professional,educational, or other reasons.
1 The responses from surveys of the Raleigh Regional Association of REALTORS®, Mainstreet Organization of REALTORS®, Kansas City Regional Association of REALTORS®, and the Long Island Board of REALTORS® were added to the national random sample. The total set of responses were weighted by the distribution across states of NAR members with a primary specialization in residential real estate. NAR also conducted surveys for the Austin Board of REALTORS® and the South Carolina REALTORS®.
3
Profile of International Transactions in U.S. Residential Real Estate 2021
NATIONAL ASSOCIATION of REALTORS®
About the Report

4
Profile of International Transactions in U.S. Residential Real Estate 2021
NATIONAL ASSOCIATION of REALTORS®
$54.4 Billion Dollar volume of foreign buyer residential purchases during April 2020–March 2021 (2.8% of $1.96 trillion of the dollar volume of existing-home sales)
107,000Number of foreign buyer existing-home purchases during April 2020–March 2021 (1.8% of 5.79 million of existing-home sales)
58%Foreign buyers who reside in the United States (recent immigrants (less than two years at the time of the transaction) or non-immigrant visa holders (Type B)
Top 5 Foreign BuyersCanada (8% of foreign buyers, $4.2 B)Mexico (7% of foreign buyers, $2.9 B)China (6% of foreign buyers, $4.5 B)India (4% of foreign buyers, $3.1 B)United Kingdom (4% of foreign buyers, $2.3 B)
Top DestinationsFlorida (22%)California (16%)Texas (9%)Arizona (5%)New York (4%)New Jersey (4%)
$351,800Foreign buyer median purchase price (compared to $305,500 for all U.S. existing-homes sold)
2021 Highlights
5
Profile of International Transactions in U.S. Residential Real Estate 2021
NATIONAL ASSOCIATION of REALTORS®
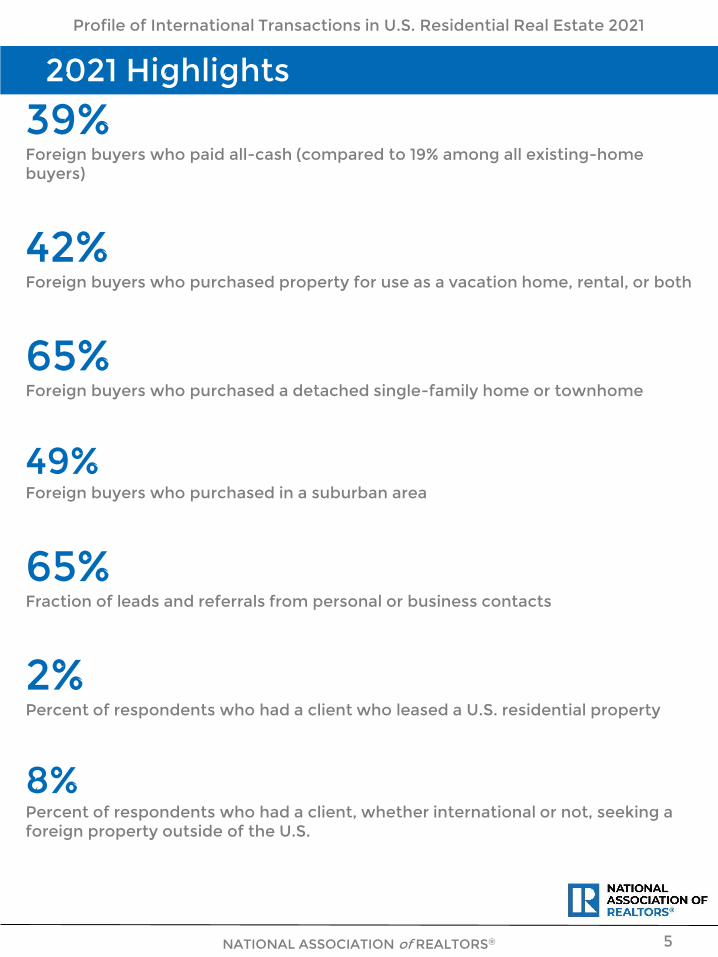
39%Foreign buyers who paid all-cash (compared to 19% among all existing-home buyers)
42%Foreign buyers who purchased property for use as a vacation home, rental, or both
65%Foreign buyers who purchased a detached single-family home or townhome
49%Foreign buyers who purchased in a suburban area
65%Fraction of leads and referrals from personal or business contacts
2%Percent of respondents who had a client who leased a U.S. residential property
8%Percent of respondents who had a client, whether international or not, seeking a foreign property outside of the U.S.
2021 Highlights

6
Economic Conditions1

7
COVID-19 Pandemic Causes a Deep but Short Economic Contraction
Profile of International Transactions in U.S. Residential Real Estate 2021
NATIONAL ASSOCIATION of REALTORS®
-3.5
-5.4
2.3
-8.0
-8.2
-9.9 -6
.6
-7.0
-1.9
-3.3
6.4
5
8.4
12
.5
5 5.3
4.4 4.6
3.4
6
-15.0
-10.0
-5.0
0.0
5.0
10.0
15.0
GDP Growth Rates
2019 2020 2021 Projection
Source: International Monetary Fund
The COVID-19 pandemic has cost nearly 4 million lives and dragged the global economy into the deepest economic contraction since the 1960s. Global economic output contracted by 3.3% in 2020 as a result of a reduction in businesses operations, travel, and leisure.
The U.S. economy contracted by 3.5%, with steeper declines in Canada (-5.4%), India (-8%), the Euro Area (-6.6%), the United Kingdom (-9.9%), and Latin America and the Caribbean economies (-7%). China, one of the few economies that managed to grow, rose at a slower rate (2.3%), about a third of its pre-pandemic growth.
However, the swift and massive fiscal and monetary stimulus undertaken by governments and central banks to prevent a global depression led to a quick economic turnaround. Global output is now expected to expand 6% in 2021, according to the April 2021 outlook of the International Monetary Fund. The U.S. is expected to expand 6.4% in 2021. India is poised to grow nearly 13% while China is expected to grow 8%. The economies of Canada, the United Kingdom, and the Latin America/Caribbean economies are expected to grow at least 4% in 2021.

8
Profile of International Transactions in U.S. Residential Real Estate 2021
NATIONAL ASSOCIATION of REALTORS®
Many countries, including the U.S., issued travel restrictions and advisories to control the spread of COVID-19. The U.S. government restricted the entry of immigrants and non-immigrants from China (excluding the Special Administrative Regions of Macau and Hong Kong), Iran, the European Schengen area, the United Kingdom, the Republic of Ireland, Brazil, South Africa, and India. However, the proclamations allow for exceptions for foreign diplomats traveling to the U.S. on A or G visas, certain family members of U.S. citizens or lawful permanent residents, and air and sea crew traveling to the U.S. on C, D, or C1/D visas.2
Arrivals to the U.S. plummeted from about 5.8 million a month prior to the pandemic to 250,000 in April 2020. Since then, arrivals to the U.S. have slowly recovered, to 1.4 million in April 2021. Arrivals from Latin America have recovered the most, with arrivals now at about 45% of the pre-pandemic level. However, arrivals from Canada, Asia, Western Europe, and Oceania are still just about 5% of the pre-pandemic level.
Among 3,905 REALTORS® who reported they work with international clients, 55% reported the pandemic affected their international business, with 22% reporting that travel restrictions affected international transactions.
2 Travelers Prohibited from Entry to the United States, https://www.cdc.gov/coronavirus/2019-ncov/travelers/from-other-countries.htmlPresidential Proclamations on Novel Coronavirus, https://travel.state.gov/content/travel/en/News/visas-news/presidential-proclamation-coronavirus.html
Travel and Tourism Is Recovering But Remains Limited
45%
21%
5%
5%
5%
4%
2%
2%
None
Client could not travel
No showing on the property
Client lost job
Lender delay
Client got sick
Property was delisted
Other impact
REALTORS® Who Work With International Clients Who Reported How the Pandemic
Impacted International Client Business
Source: NAR 2021 International Survey
-
200,000
400,000
600,000
800,000
1,000,000
1,200,000
1,400,000
1,600,000
Jan
/20
20
Feb
/20
20
Mar
/20
20
Ap
r/20
20
May
/20
20
Jun
/20
20
Jul/
2020
Au
g/2
020
Se
p/2
020
Oct
/20
20
No
v/20
20
De
c/20
20
Jan
/20
21
Feb
/20
21
Mar
/20
21
Ap
r/20
21
Monthly Tourist Arrivals
Canada Asia Middle East Africa Oceania Latin America/Caribbean Western Europe
Source: National Travel and Tourism Office
4.01
6.73
5.80
0.001.002.003.004.005.006.007.008.00
2012
/Jan
2012
/Ju
l20
13/J
an20
13/J
ul
2014
/Jan
2014
/Ju
l20
15/J
an20
15/J
ul
2016
/Jan
2016
/Ju
l20
17/J
an20
17/J
ul
2018
/Jan
2018
/Ju
l20
19/J
an20
19/J
ul
2020
/Jan
2020
/Ju
l20
21/J
an
Existing-Home SalesSeasonally Adjusted Annual Rate
(In Millions)
$350,300
2.5
0.0
1.0
2.0
3.0
4.0
5.0
6.0
7.0
$0$50,000
$100,000$150,000
$200,000$250,000$300,000$350,000$400,000
2012
/Jan
2012
/Au
g20
13/M
ar20
13/O
ct20
14/M
ay20
14/D
ec
2015
/Ju
l20
16/F
eb
2016
/Se
p20
17/A
pr
2017
/No
v20
18/J
un
2019
/Jan
2019
/Au
g20
20/M
ar20
20/O
ct20
21/M
ay
Median Existing-Home Sales Price and Month's Supply of Unsold Homes
9
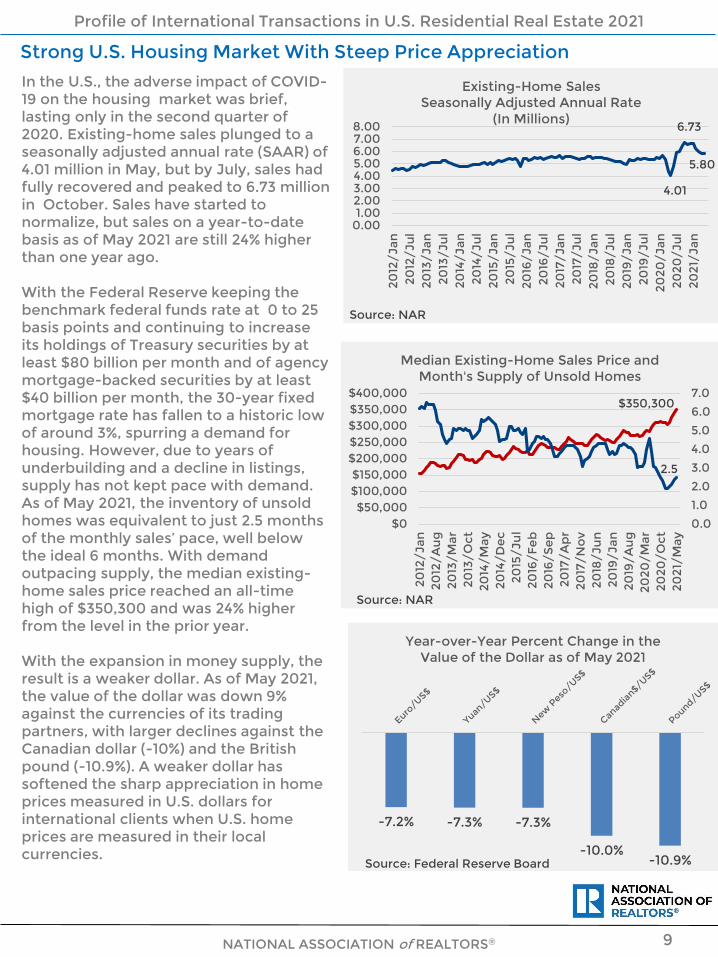
In the U.S., the adverse impact of COVID-19 on the housing market was brief, lasting only in the second quarter of 2020. Existing-home sales plunged to a seasonally adjusted annual rate (SAAR) of 4.01 million in May, but by July, sales had fully recovered and peaked to 6.73 million in October. Sales have started to normalize, but sales on a year-to-date basis as of May 2021 are still 24% higher than one year ago.
With the Federal Reserve keeping the benchmark federal funds rate at 0 to 25 basis points and continuing to increase its holdings of Treasury securities by at least $80 billion per month and of agency mortgage-backed securities by at least $40 billion per month, the 30-year fixed mortgage rate has fallen to a historic low of around 3%, spurring a demand for housing. However, due to years of underbuilding and a decline in listings, supply has not kept pace with demand. As of May 2021, the inventory of unsold homes was equivalent to just 2.5 months of the monthly sales’ pace, well below the ideal 6 months. With demand outpacing supply, the median existing-home sales price reached an all-time high of $350,300 and was 24% higher from the level in the prior year.
With the expansion in money supply, the result is a weaker dollar. As of May 2021, the value of the dollar was down 9% against the currencies of its trading partners, with larger declines against the Canadian dollar (-10%) and the British pound (-10.9%). A weaker dollar has softened the sharp appreciation in home prices measured in U.S. dollars for international clients when U.S. home prices are measured in their local currencies.
Profile of International Transactions in U.S. Residential Real Estate 2021
NATIONAL ASSOCIATION of REALTORS®
Source: NAR
Strong U.S. Housing Market With Steep Price Appreciation
-7.2% -7.3% -7.3%
-10.0%-10.9%
Year-over-Year Percent Change in the Value of the Dollar as of May 2021
Source: Federal Reserve Board
Source: NAR

10
International Buyers2
paulbr75

11
As the global economy and foreign travel shrank in 2020, the dollar volume of U.S. existing-home purchases by foreign buyers during April 2020–March 2021 decreased by 27% to $54.4 billion. The dollar volume of foreign buyer purchases amounts to 2.8% of the $5.8 trillion of existing-home sales during this period, a decrease from the 4.4% share in the prior period.
Purchases declined more heavily among foreign buyers who live abroad. The dollar volume of existing-home purchases by foreign buyers who reside abroad fell 33% to $22 billion, while the dollar volume of existing-home purchases by foreign buyers who live in the U.S. fell 21% to $32.4 billion. Foreign buyers who reside abroad accounted for 40% of the dollar volume of purchases, down from the prior year’s share of 45%.
The number of homes purchased by foreign buyers3
decreased 31% to 107,000 units. The number of homes purchased by foreign buyers accounted for 1.8% of the 5.8 million existing-homes sold during the 12-month period, a decrease from the 2.8% share in the prior period. Foreign buyers who reside abroad accounted for 42% of home purchase, up from 39% in the prior period. This indicates that the pandemic had a greater impact on the
3 The number of foreign buyers and the number of properties purchased are used interchangeably under the assumption that one foreign buyer purchased one property.
Profile of International Transactions in U.S. Residential Real Estate 2021
NATIONAL ASSOCIATION of REALTORS®
$33.2 $41.2 $34.8 $46.7 $54.5 $43.5$74.9
$53.0$33.2 $33.0 $22.0
$33.2$41.2
$33.4
$45.5$49.4 $59.1
$78.1
$67.9
$44.7 $41.0$32.4
$66.4$82.5
$68.2
$92.2
$103.9$102.6
$153.0
$121.0
$77.9 $74.0
$54.4
2011 2012 2013 2014 2015 2016 2017 2018 2019 2020 2021
Dollar Volume of Existing-Home Purchases by Foreign Buyers (Billion Dollars)
Non-resident (Type A) Resident (Type B)
Note: Based on transactions in the 12 months ending March of each year.
105 103 98 118 99 89 120 105
73 60 45
105 103 94
115 110 126
165 162
111 94
62
210.8 206.2192.5
232.6208.9 214.9
284.5266.8
183.1
154.0
107.0
2011 2012 2013 2014 2015 2016 2017 2018 2019 2020 2021
Number of Existing-Home Purchases by Foreign Buyers (Thousand Units)
Non-resident (Type A) Resident (Type B)
Note: Based on transactions in the 12 months ending March of each year.
Foreign Buyer Purchases of Existing-Homes
purchases of foreign buyers who live, or would have lived, in the U.S. on business, employment, or student visas.

12
Origin of International Buyers
Measured by the number of homes purchased, Canada emerged as the top country of origin among foreign buyers during April 2020-March 2021, accounting for 8% of foreign buyer purchases. Mexico came in second, with a 7% share. China, which had been the top country of origin of foreign buyers since 2015, fell to third place, with a 6% share. India and the United Kingdom tied at fourth place, each with a 4% share.
4 Mexico is included in Latin America/Caribbean, although it is geographically part of North America.
Profile of International Transactions in U.S. Residential Real Estate 2021
NATIONAL ASSOCIATION of REALTORS®
Argentina, Israel, Italy, Japan, and Colombia rounded out the top 10 countries of origin of foreign buyers.
By region of origin, Asia and Oceania accounted for the largest group of buyers at 22%, followed by Latin America and the Caribbean4 at 19%, then Europe with an 11% share. North America (Canada) accounted for 8% while Africa accounted for 4%. A larger fraction of foreign buyers, at 35%, were from a country that the respondent did not identify.
Asia/Oceania
Latin America/ Caribbean Europe
North America (Canada) Africa
Country not
reported Total
2016 34% 21% 18% 13% 3% 12% 100%
2017 35% 24% 16% 12% 4% 9% 100%
2018 32% 20% 15% 10% 2% 20% 100%
2019 27% 22% 14% 11% 3% 23% 100%
2020 29% 23% 13% 12% 3% 20% 100%
2021 22% 19% 11% 8% 4% 35% 100%
Percent Distribution of the Region of Origin of Foreign Buyers
Canada Mexico China* IndiaUnited
Kingdom Argentina Israel Italy Japan Colombia
2007 10% 13% 9% 6% 12% 1% 0% 1% 1% 3%
2008 23% 9% 8% 6% 12% 1% 0% 1% 1% 1%
2009 18% 10% 7% 9% 11% 1% 0% 1% 1% 1%
2010 23% 10% 9% 5% 9% 1% 2% 1% 1% 1%
2011 23% 7% 9% 7% 7% 2% 1% 1% 2% 1%
2012 24% 8% 12% 6% 6% 1% 1% 2% 1% 1%
2013 23% 8% 12% 5% 5% 3% 2% 1% 1% 1%
2014 19% 9% 16% 5% 5% 1% 2% 1% 2% 1%
2015 14% 9% 16% 8% 4% 2% 1% 1% 1% 1%
2016 12% 8% 14% 7% 4% 1% 1% 1% 1% 2%
2017 12% 10% 14% 5% 5% 1% 1% 1% 2% 1%
2018 10% 8% 15% 5% 3% 1% 2% 1% 2% 2%
2019 11% 9% 11% 5% 3% 1% 1% 1% 1% 1%
2020 12% 9% 12% 6% 2% 1% 1% 2% 2% 4%
2021 8% 7% 6% 4% 4% 3% 2% 2% 2% 2%
China includes buyers from the People's Republic of China, Hong Kong, and Taiwan.
Top 10 list is based on the most recent year.
Percent Share of Top 10 Countries of Origin to Foreign Buyer Purchases
13
Profile of International Transactions in U.S. Residential Real Estate 2021
NATIONAL ASSOCIATION of REALTORS®
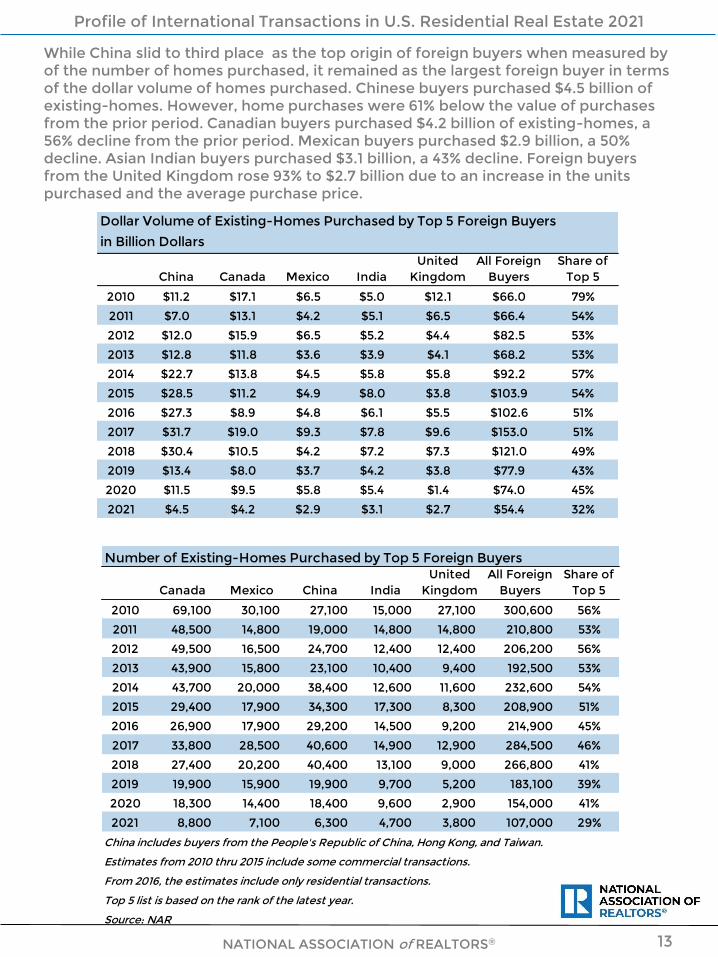
While China slid to third place as the top origin of foreign buyers when measured by of the number of homes purchased, it remained as the largest foreign buyer in terms of the dollar volume of homes purchased. Chinese buyers purchased $4.5 billion of existing-homes. However, home purchases were 61% below the value of purchases from the prior period. Canadian buyers purchased $4.2 billion of existing-homes, a 56% decline from the prior period. Mexican buyers purchased $2.9 billion, a 50% decline. Asian Indian buyers purchased $3.1 billion, a 43% decline. Foreign buyers from the United Kingdom rose 93% to $2.7 billion due to an increase in the units purchased and the average purchase price.
China Canada Mexico IndiaUnited
KingdomAll Foreign
BuyersShare of
Top 5
2010 $11.2 $17.1 $6.5 $5.0 $12.1 $66.0 79%
2011 $7.0 $13.1 $4.2 $5.1 $6.5 $66.4 54%
2012 $12.0 $15.9 $6.5 $5.2 $4.4 $82.5 53%
2013 $12.8 $11.8 $3.6 $3.9 $4.1 $68.2 53%
2014 $22.7 $13.8 $4.5 $5.8 $5.8 $92.2 57%
2015 $28.5 $11.2 $4.9 $8.0 $3.8 $103.9 54%
2016 $27.3 $8.9 $4.8 $6.1 $5.5 $102.6 51%
2017 $31.7 $19.0 $9.3 $7.8 $9.6 $153.0 51%
2018 $30.4 $10.5 $4.2 $7.2 $7.3 $121.0 49%
2019 $13.4 $8.0 $3.7 $4.2 $3.8 $77.9 43%
2020 $11.5 $9.5 $5.8 $5.4 $1.4 $74.0 45%
2021 $4.5 $4.2 $2.9 $3.1 $2.7 $54.4 32%
in Billion Dollars
Dollar Volume of Existing-Homes Purchased by Top 5 Foreign Buyers
Number of Existing-Homes Purchased by Top 5 Foreign Buyers
Canada Mexico China IndiaUnited
KingdomAll Foreign
BuyersShare of
Top 5
2010 69,100 30,100 27,100 15,000 27,100 300,600 56%
2011 48,500 14,800 19,000 14,800 14,800 210,800 53%
2012 49,500 16,500 24,700 12,400 12,400 206,200 56%
2013 43,900 15,800 23,100 10,400 9,400 192,500 53%
2014 43,700 20,000 38,400 12,600 11,600 232,600 54%
2015 29,400 17,900 34,300 17,300 8,300 208,900 51%
2016 26,900 17,900 29,200 14,500 9,200 214,900 45%
2017 33,800 28,500 40,600 14,900 12,900 284,500 46%
2018 27,400 20,200 40,400 13,100 9,000 266,800 41%
2019 19,900 15,900 19,900 9,700 5,200 183,100 39%
2020 18,300 14,400 18,400 9,600 2,900 154,000 41%
2021 8,800 7,100 6,300 4,700 3,800 107,000 29%
China includes buyers from the People's Republic of China, Hong Kong, and Taiwan.
Estimates from 2010 thru 2015 include some commercial transactions.
From 2016, the estimates include only residential transactions.
Top 5 list is based on the rank of the latest year.
Source: NAR

14
Profile of International Transactions in U.S. Residential Real Estate 2021
NATIONAL ASSOCIATION of REALTORS®
Median Purchase Price of Top Five Foreign Buyers
China Canada Mexico IndiaUnited
KingdomAll Foreign
Buyers
2010 $320,800 $200,000 $134,400 $283,300 $315,000 $219,400
2011 $282,100 $177,300 $168,800 $305,600 $325,000 $228,300
2012 $333,300 $171,900 $200,000 $308,300 $266,700 $274,200
2013 $412,500 $183,000 $156,300 $300,000 $250,000 $225,900
2014 $516,400 $212,500 $141,100 $321,400 $325,000 $268,300
2015 $486,100 $196,300 $171,200 $380,000 $200,000 $284,900
2016 $542,100 $222,300 $176,500 $333,400 $427,300 $277,400
2017 $529,900 $288,600 $180,900 $340,600 $329,400 $302,300
2018 $439,100 $292,000 $189,100 $412,800 $396,200 $292,400
2019 $454,900 $268,200 $170,100 $358,600 $510,700 $280,600
2020 $449,500 $292,300 $249,900 $448,300 $361,200 $314,600
2021 $476,500 $400,900 $341,400 $538,900 $366,600 $351,800
China Canada Mexico IndiaUnited
KingdomAll Foreign
Buyers
2010 $412,200 $247,300 $214,700 $333,300 $447,100 $311,400
2011 $370,900 $269,100 $283,000 $346,400 $438,900 $315,000
2012 $484,000 $321,700 $396,200 $419,000 $355,900 $400,000
2013 $555,900 $269,100 $225,500 $372,700 $440,800 $354,200
2014 $590,800 $314,700 $224,100 $459,000 $499,200 $396,200
2015 $831,800 $380,300 $274,800 $460,200 $455,600 $499,600
2016 $936,600 $332,100 $266,200 $420,400 $598,200 $477,500
2017 $781,800 $560,800 $326,800 $522,440 $741,900 $536,900
2018 $752,600 $383,900 $208,800 $547,700 $806,300 $454,400
2019 $674,900 $400,000 $233,700 $431,500 $738,700 $426,100
2020 $622,300 $517,200 $403,500 $561,800 $495,200 $480,870
2021 $710,400 $473,600 $407,500 $662,600 $718,800 $508,400
China includes buyers from the People's Republic of China, Hong Kong, and Taiwan.
Estimates from 2010 thru 2015 include some commercial transactions.
From 2016, the estimates include only residential transactions.
Top 5 list is based on the rank of the latest year.
Source: NAR
Average Purchase Price of Top 5 Foreign Buyers
15
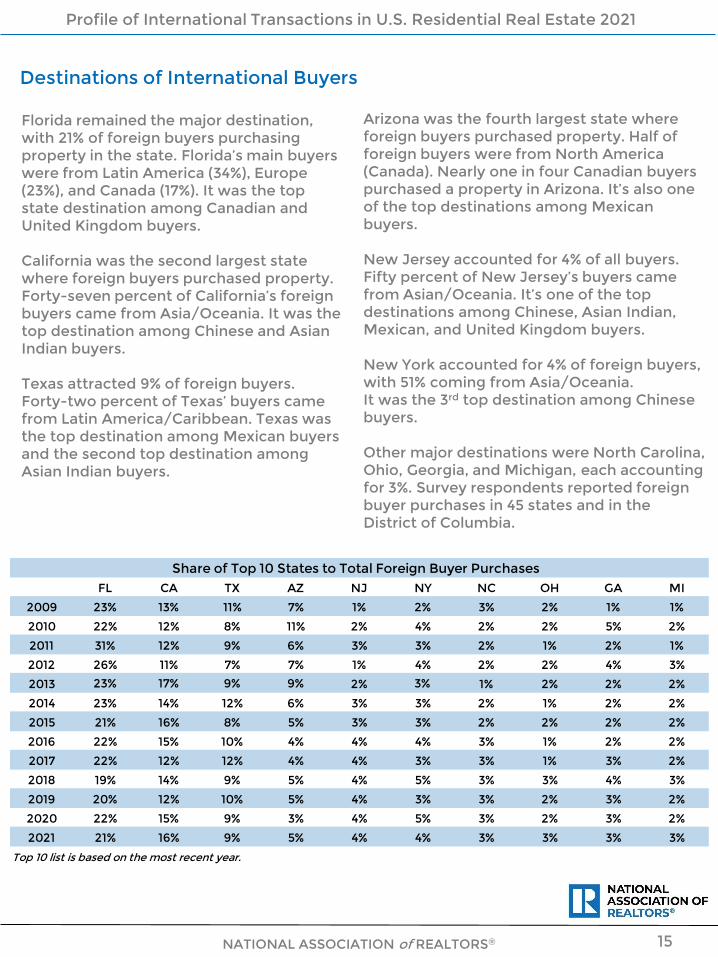
Florida remained the major destination, with 21% of foreign buyers purchasing property in the state. Florida’s main buyers were from Latin America (34%), Europe (23%), and Canada (17%). It was the top state destination among Canadian and United Kingdom buyers.
California was the second largest state where foreign buyers purchased property. Forty-seven percent of California’s foreign buyers came from Asia/Oceania. It was the top destination among Chinese and Asian Indian buyers.
Texas attracted 9% of foreign buyers. Forty-two percent of Texas’ buyers came from Latin America/Caribbean. Texas was the top destination among Mexican buyers and the second top destination among Asian Indian buyers.
Profile of International Transactions in U.S. Residential Real Estate 2021
NATIONAL ASSOCIATION of REALTORS®
Arizona was the fourth largest state where foreign buyers purchased property. Half of foreign buyers were from North America (Canada). Nearly one in four Canadian buyers purchased a property in Arizona. It’s also one of the top destinations among Mexican buyers.
New Jersey accounted for 4% of all buyers. Fifty percent of New Jersey’s buyers came from Asian/Oceania. It’s one of the top destinations among Chinese, Asian Indian, Mexican, and United Kingdom buyers.
New York accounted for 4% of foreign buyers, with 51% coming from Asia/Oceania.It was the 3rd top destination among Chinese buyers.
Other major destinations were North Carolina, Ohio, Georgia, and Michigan, each accounting for 3%. Survey respondents reported foreign buyer purchases in 45 states and in the District of Columbia.
Destinations of International Buyers
FL CA TX AZ NJ NY NC OH GA MI
2009 23% 13% 11% 7% 1% 2% 3% 2% 1% 1%
2010 22% 12% 8% 11% 2% 4% 2% 2% 5% 2%
2011 31% 12% 9% 6% 3% 3% 2% 1% 2% 1%
2012 26% 11% 7% 7% 1% 4% 2% 2% 4% 3%
2013 23% 17% 9% 9% 2% 3% 1% 2% 2% 2%
2014 23% 14% 12% 6% 3% 3% 2% 1% 2% 2%
2015 21% 16% 8% 5% 3% 3% 2% 2% 2% 2%
2016 22% 15% 10% 4% 4% 4% 3% 1% 2% 2%
2017 22% 12% 12% 4% 4% 3% 3% 1% 3% 2%
2018 19% 14% 9% 5% 4% 5% 3% 3% 4% 3%
2019 20% 12% 10% 5% 4% 3% 3% 2% 3% 2%
2020 22% 15% 9% 3% 4% 5% 3% 2% 3% 2%
2021 21% 16% 9% 5% 4% 4% 3% 3% 3% 3%
Top 10 list is based on the most recent year.
Share of Top 10 States to Total Foreign Buyer Purchases

16
Profile of International Transactions in U.S. Residential Real Estate 2021
NATIONAL ASSOCIATION of REALTORS®
Where Top 5 Foreign Buyers Purchased U.S. Residential Property
38%
24%
7%
4%
3%
3%
3%
3%
Florida
Arizona
California
Ohio
New York
Texas
Minnesota
Georgia
Major Destinations of Foreign Buyers from Canada
34%10%
8%8%
5%4%4%
4%3%3%3%3%3%3%3%
CaliforniaGeorgia
New YorkMichigan
TennesseeOklahoma
New HampshireTexas
ConnecticutNew Jersey
NevadaMassachusetts
IllinoisIndianaOregon
Major Destinations of Foreign Buyers from China
29%21%
15%7%
5%3%3%3%3%3%3%3%
TexasCaliforniaColorado
ArizonaNorth Carolina
IllinoisGeorgia
New JerseyLouisianaMichigan
OregonSouth Carolina
Major Destinations of Foreign Buyers from Mexico
40%11%
6%6%6%5%5%4%4%4%3%3%
CaliforniaTexas
FloridaMissouri
MarylandWisconsin
New JerseyMichigan
IllinoisOhioIowa
North…
Major Destinations of Foreign Buyers from India
44%
21%
12%
7%
6%
5%
3%
Florida
Virginia
New Jersey
Texas
Georgia
Pennsylvania
North Carolina
Major Destinations of Foreign Buyers from the United Kingdom

17
Profile of International Transactions in U.S. Residential Real Estate 2021
NATIONAL ASSOCIATION of REALTORS®
Top Foreign Buyers of the Top 6 State Destinations
34%
23%
17%
8%
4%
14%
Latin America/Caribbean
Europe
North America
Asia/Oceania
Africa
Region not identified
Region of Origin of Florida's Foreign Buyers
47%
11%
2%
2%
34%
Asia/Oceania
Latin America/Caribbean
Africa
Europe
Region not identified
Region of Origin of California's Foreign Buyers
42%
30%
9%
4%
3%
12%
Latin America/Caribbean
Asia/Oceania
Europe
North America
Africa
Region not identified
Region of Origin of Texas' Foreign Buyers
50%
11%
11%
6%
22%
North America
Africa
Latin America/Caribbean
Asia/Oceania
Region not identified
Region of Origin of Arizona's Foreign Buyers
50%
21%
14%
14%
Asia/Oceania
Europe
Latin America/Caribbean
Region not identified
Region of Origin of New Jersey's Foreign Buyers
51%
18%
9%
1%
20%
Asia/Oceania
Latin America/Caribbean
Europe
Africa
Region not identified
Region of Origin of New York's Foreign Buyers
18
Prices
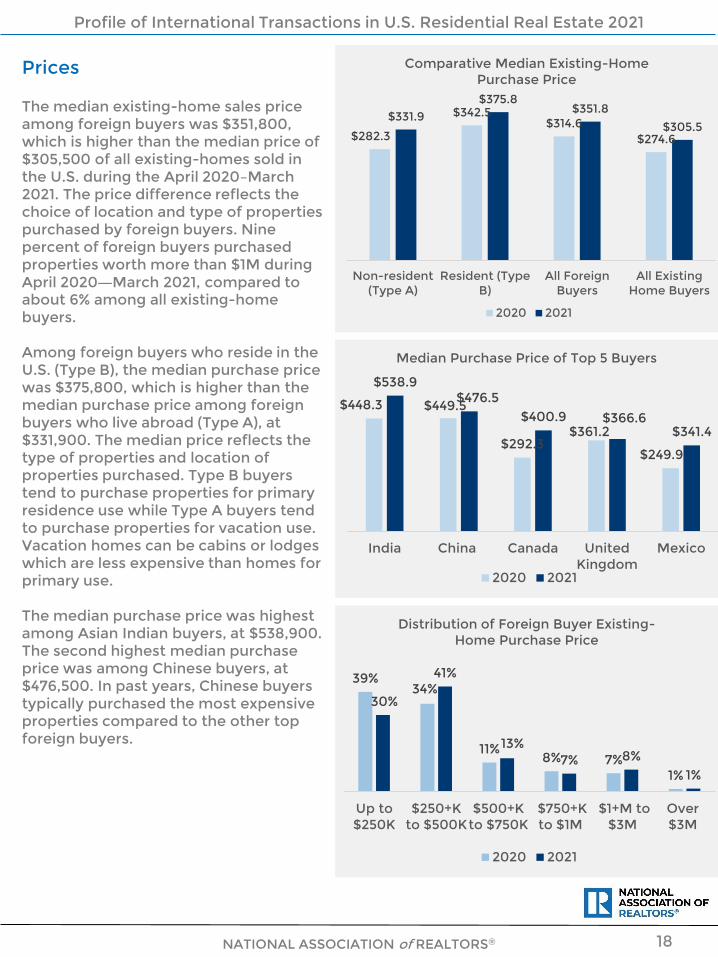
The median existing-home sales price among foreign buyers was $351,800, which is higher than the median price of $305,500 of all existing-homes sold in the U.S. during the April 2020–March 2021. The price difference reflects the choice of location and type of properties purchased by foreign buyers. Nine percent of foreign buyers purchased properties worth more than $1M during April 2020―March 2021, compared to about 6% among all existing-home buyers.
Among foreign buyers who reside in the U.S. (Type B), the median purchase price was $375,800, which is higher than the median purchase price among foreign buyers who live abroad (Type A), at $331,900. The median price reflects the type of properties and location of properties purchased. Type B buyers tend to purchase properties for primary residence use while Type A buyers tend to purchase properties for vacation use. Vacation homes can be cabins or lodges which are less expensive than homes for primary use.
The median purchase price was highest among Asian Indian buyers, at $538,900. The second highest median purchase price was among Chinese buyers, at $476,500. In past years, Chinese buyers typically purchased the most expensive properties compared to the other top foreign buyers.
Profile of International Transactions in U.S. Residential Real Estate 2021
NATIONAL ASSOCIATION of REALTORS®
$282.3
$342.5$314.6
$274.6
$331.9$375.8
$351.8
$305.5
Non-resident(Type A)
Resident (TypeB)
All ForeignBuyers
All ExistingHome Buyers
Comparative Median Existing-Home Purchase Price
2020 2021
39%34%
11%8% 7%
1%
30%
41%
13%7% 8%
1%
Up to$250K
$250+Kto $500K
$500+Kto $750K
$750+Kto $1M
$1+M to$3M
Over$3M
Distribution of Foreign Buyer Existing-Home Purchase Price
2020 2021
$448.3 $449.5
$292.3$361.2
$249.9
$538.9$476.5
$400.9 $366.6$341.4
India China Canada UnitedKingdom
Mexico
Median Purchase Price of Top 5 Buyers
2020 2021
19NATIONAL ASSOCIATION of REALTORS®
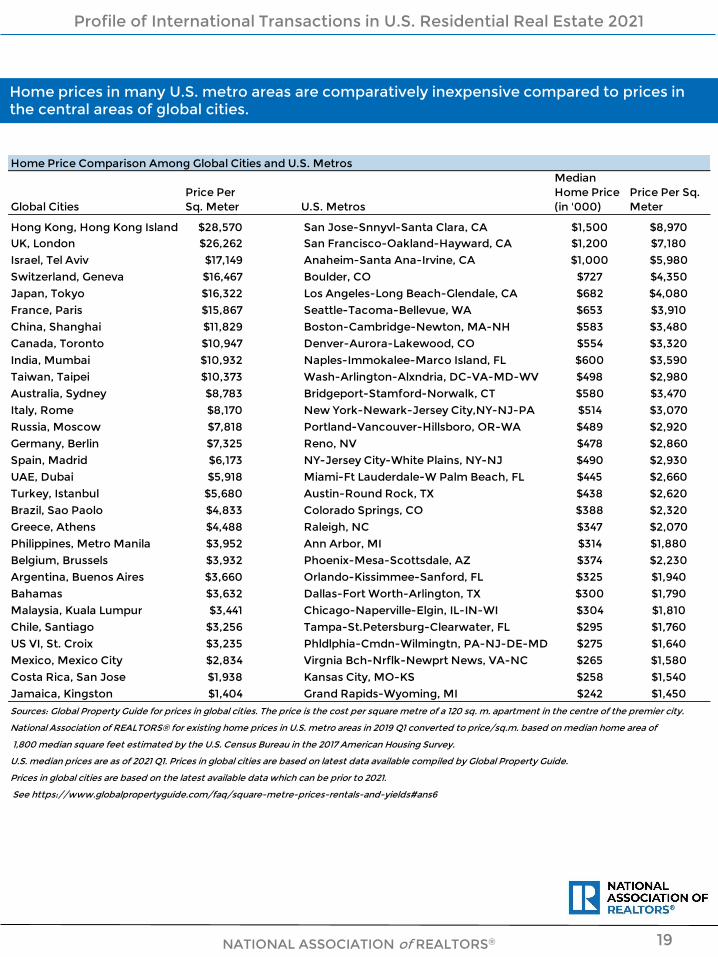
Home prices in many U.S. metro areas are comparatively inexpensive compared to prices in the central areas of global cities.
Profile of International Transactions in U.S. Residential Real Estate 2021
Home Price Comparison Among Global Cities and U.S. Metros
Global CitiesPrice Per Sq. Meter U.S. Metros
Median Home Price (in '000)
Price Per Sq. Meter
Hong Kong, Hong Kong Island $28,570 San Jose-Snnyvl-Santa Clara, CA $1,500 $8,970UK, London $26,262 San Francisco-Oakland-Hayward, CA $1,200 $7,180Israel, Tel Aviv $17,149 Anaheim-Santa Ana-Irvine, CA $1,000 $5,980Switzerland, Geneva $16,467 Boulder, CO $727 $4,350Japan, Tokyo $16,322 Los Angeles-Long Beach-Glendale, CA $682 $4,080France, Paris $15,867 Seattle-Tacoma-Bellevue, WA $653 $3,910China, Shanghai $11,829 Boston-Cambridge-Newton, MA-NH $583 $3,480Canada, Toronto $10,947 Denver-Aurora-Lakewood, CO $554 $3,320India, Mumbai $10,932 Naples-Immokalee-Marco Island, FL $600 $3,590Taiwan, Taipei $10,373 Wash-Arlington-Alxndria, DC-VA-MD-WV $498 $2,980Australia, Sydney $8,783 Bridgeport-Stamford-Norwalk, CT $580 $3,470Italy, Rome $8,170 New York-Newark-Jersey City,NY-NJ-PA $514 $3,070Russia, Moscow $7,818 Portland-Vancouver-Hillsboro, OR-WA $489 $2,920Germany, Berlin $7,325 Reno, NV $478 $2,860Spain, Madrid $6,173 NY-Jersey City-White Plains, NY-NJ $490 $2,930UAE, Dubai $5,918 Miami-Ft Lauderdale-W Palm Beach, FL $445 $2,660Turkey, Istanbul $5,680 Austin-Round Rock, TX $438 $2,620Brazil, Sao Paolo $4,833 Colorado Springs, CO $388 $2,320Greece, Athens $4,488 Raleigh, NC $347 $2,070Philippines, Metro Manila $3,952 Ann Arbor, MI $314 $1,880Belgium, Brussels $3,932 Phoenix-Mesa-Scottsdale, AZ $374 $2,230Argentina, Buenos Aires $3,660 Orlando-Kissimmee-Sanford, FL $325 $1,940Bahamas $3,632 Dallas-Fort Worth-Arlington, TX $300 $1,790Malaysia, Kuala Lumpur $3,441 Chicago-Naperville-Elgin, IL-IN-WI $304 $1,810Chile, Santiago $3,256 Tampa-St.Petersburg-Clearwater, FL $295 $1,760US VI, St. Croix $3,235 Phldlphia-Cmdn-Wilmingtn, PA-NJ-DE-MD $275 $1,640Mexico, Mexico City $2,834 Virgnia Bch-Nrflk-Newprt News, VA-NC $265 $1,580Costa Rica, San Jose $1,938 Kansas City, MO-KS $258 $1,540Jamaica, Kingston $1,404 Grand Rapids-Wyoming, MI $242 $1,450Sources: Global Property Guide for prices in global cities. The price is the cost per square metre of a 120 sq. m. apartment in the centre of the premier city.
National Association of REALTORS® for existing home prices in U.S. metro areas in 2019 Q1 converted to price/sq.m. based on median home area of
1,800 median square feet estimated by the U.S. Census Bureau in the 2017 American Housing Survey.
U.S. median prices are as of 2021 Q1. Prices in global cities are based on latest data available compiled by Global Property Guide.
Prices in global cities are based on the latest available data which can be prior to 2021.
See https://www.globalpropertyguide.com/faq/square-metre-prices-rentals-and-yields#ans6

20
Financing
Thirty-nine percent of foreign buyer transactions were all-cash sales, unchanged from the past year. The share of cash sales has gone down from a peak of 63% in 2013 given the decline in the share of foreign buyers who live abroad who tend to pay all-cash. Cash sales accounted for 19% of existing-home sales during April 2020–March 2021.
Foreign buyers who live abroad are more likely to make an all-cash purchase compared to foreign buyers who reside in the U.S. Sixty-one percent of non-resident foreign buyers made an all-cash purchase compared to 24% among foreign buyers who live in the U.S.
Buyers from the United Kingdom were the most likely to pay all-cash, at 82%, followed by Canadian buyers, at 66%. Less than half of foreign buyers from China, Mexico, and India made an all-cash purchase, with the lowest share among Asian Indian buyers, at 8%. Most Asian Indian buyers reside in the U.S. and can obtain mortgage financing.
Profile of International Transactions in U.S. Residential Real Estate 2021
NATIONAL ASSOCIATION of REALTORS®
55%62% 62% 63%60%
55%50%50%
47%41% 39% 39%
21%29%30%30%32%
27% 24% 22% 21% 22% 19% 19%
2010
2011
2012
2013
2014
2015
2016
2017
2018
2019
2020
2021
All-Cash Buyers
Foreign Buyers
All U.S. Existing-Home Buyers
73% 72% 72%63%
59% 61%
33% 35%30%
25% 27% 24%
2016 2017 2018 2019 2020 2021
All-Cash Purchases by Type of Foreign Buyer
Non-resident (Type A)
Resident (Type B)
82%
66%
40%33%
8%
UnitedKingdom
Canada China Mexico India
All-Cash Purchases Among Top 5 Foreign Buyers

21
Forty-two percent of foreign buyers purchased the property for use as a vacation home, rental property, or both, up from 40% in the prior period. The higher fraction of vacation home purchases among foreign buyers tracks the increase in vacation home sales nationally. During April 2020-March 2021, vacation home sales accounted for 6% of existing-home sales, up from 5% during the prior 12-month period. The increase in demand for vacation homes during the pandemic is most likely associated with people seeking safety and recreation in vacation homes and the opportunity to work from home.
Canadian buyers were the most likely to purchase a home for vacation use, rental, or both, at 84%. Slightly more than half of United Kingdom buyers also purchased a property for use as a vacation home, a rental, or for both uses.
Asian Indian buyers were the most likely to purchase a home for primary residence use, at 79%, followed by Mexican buyers, at 42%.
Chinese buyers were the most likely to purchase a home for the use of a student, accounting for 13% of home purchases.
Profile of International Transactions in U.S. Residential Real Estate 2021
NATIONAL ASSOCIATION of REALTORS®
47%
8% 14%22%
13%
16%
13%
26%25%
24%
9%
5%5%
12%
40%79%
42%38%
1%
13%
7% 9%6% 10%
Canada China India Mexico UnitedKingdom
Intended Use Among Top 5 Foreign Buyers
Vacation Home Residential Rental
Vacation and Rental Primary Residence
Student Use Don't Know
48%
57% 54% 52% 51%46%
42%39% 37% 39% 40% 42%
2010
2011
2012
2013
2014
2015
2016
2017
2018
2019
2020
2021
Foreign Buyers Who Purchased a Property for Use as a Vacation Home, Rental Property,
or Both Uses
Intended Use of the Property
22
Type of Residential Property
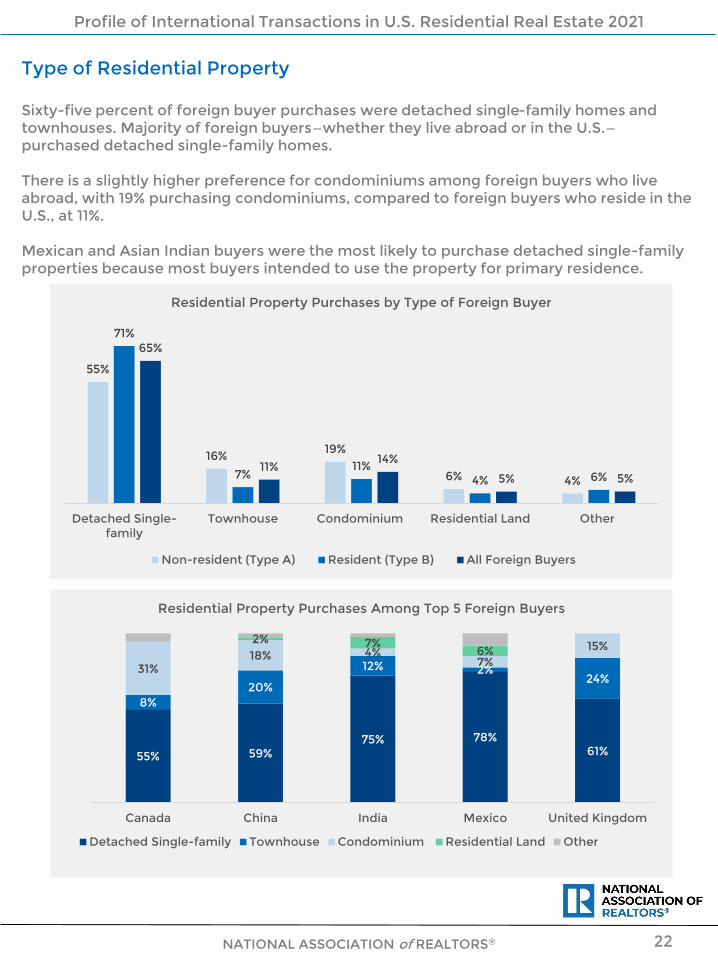
Sixty-five percent of foreign buyer purchases were detached single-family homes and townhouses. Majority of foreign buyers—whether they live abroad or in the U.S.—purchased detached single-family homes.
There is a slightly higher preference for condominiums among foreign buyers who live abroad, with 19% purchasing condominiums, compared to foreign buyers who reside in the U.S., at 11%.
Mexican and Asian Indian buyers were the most likely to purchase detached single-family properties because most buyers intended to use the property for primary residence.
Profile of International Transactions in U.S. Residential Real Estate 2021
NATIONAL ASSOCIATION of REALTORS®
55% 59%75% 78%
61%
8%20%
12% 2%24%
31%18% 4%
7%15%2% 7%
6%
Canada China India Mexico United Kingdom
Residential Property Purchases Among Top 5 Foreign Buyers
Detached Single-family Townhouse Condominium Residential Land Other
55%
16% 19%
6% 4%
71%
7%11%
4% 6%
65%
11%14%
5% 5%
Detached Single-family
Townhouse Condominium Residential Land Other
Residential Property Purchases by Type of Foreign Buyer
Non-resident (Type A) Resident (Type B) All Foreign Buyers
23
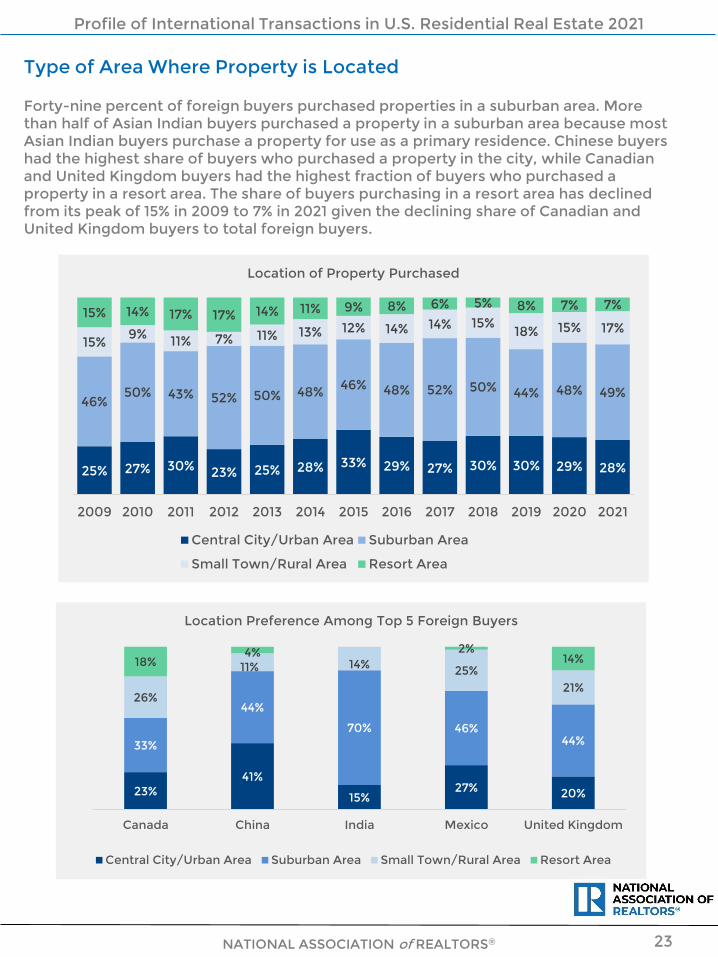
Type of Area Where Property is Located
Forty-nine percent of foreign buyers purchased properties in a suburban area. More than half of Asian Indian buyers purchased a property in a suburban area because most Asian Indian buyers purchase a property for use as a primary residence. Chinese buyers had the highest share of buyers who purchased a property in the city, while Canadian and United Kingdom buyers had the highest fraction of buyers who purchased a property in a resort area. The share of buyers purchasing in a resort area has declined from its peak of 15% in 2009 to 7% in 2021 given the declining share of Canadian and United Kingdom buyers to total foreign buyers.
Profile of International Transactions in U.S. Residential Real Estate 2021
NATIONAL ASSOCIATION of REALTORS®
25% 27% 30% 23% 25% 28% 33% 29% 27% 30% 30% 29% 28%
46%50% 43% 52% 50% 48% 46% 48% 52% 50% 44% 48% 49%
15%9% 11% 7% 11% 13% 12% 14% 14% 15%
18% 15% 17%15% 14% 17% 17% 14% 11% 9% 8% 6% 5% 8% 7% 7%
2009 2010 2011 2012 2013 2014 2015 2016 2017 2018 2019 2020 2021
Location of Property Purchased
Central City/Urban Area Suburban Area
Small Town/Rural Area Resort Area
23%41%
15%27% 20%
33%
44%
70% 46%44%
26%
11% 14% 25%21%
18%4% 2%
14%
Canada China India Mexico United Kingdom
Location Preference Among Top 5 Foreign Buyers
Central City/Urban Area Suburban Area Small Town/Rural Area Resort Area

24
Forty percent of REALTORS® reported they had a client who decided not to purchase U.S. residential property, an increase from 36% share in the prior period.
Forty-six percent of respondents reported the client “could not find property to purchase” and 38% reported “cost of property.” Thirty-five percent of respondents reported that international clients viewed U.S. home prices as “more expensive than prices in the home country,” up from 26% in the prior period.
A larger fraction of respondents reported “other” reasons why the client decided not to purchase property, and these “other” reasons pertain to the effect of COVID-19, such as travel restrictions.
Profile of International Transactions in U.S. Residential Real Estate 2021
NATIONAL ASSOCIATION of REALTORS®
43%
49%
57%
50%55%
47%47%45%43%38%38%
42%40%36%
40%
200
7
200
8
200
9
2010
2011
2012
2013
2014
2015
2016
2017
2018
2019
2020
2021
REALTORS® With International Clients Who Had A Client Who Decided Not to
Purchase U.S. Property
42%
3%
15%
10%
3%
14%
24%
15%
20%
34%
39%
50%
19%
4%
6%
6%
7%
8%
13%
14%
21%
22%
38%
46%
Other
Loss of home countrybenefits
Exchange rate
Exposure to U.S. tax laws
Insurance costs
Condo/maintenance fees
Can not move money
Property taxes
Immigration laws
Could not obtain financing
Cost of property
Could not find a property topurchase
Percent of Respondents Who Reported Reasons Why Their International
Clients Decided Not to Purchase U.S. Property
2021 2020
Reasons International Clients Did Not Purchase U.S. Property
26%
12%
26%
36%
21%
11%
35%33%
0%
5%
10%
15%20%
25%
30%
35%
40%
Lessexpensive
About thesame
Moreexpensive
Don’t know
How International Residential Clients View U.S. Prices Compared to Home Country
2016 2017 2018 2019 2020 2021

25NATIONAL ASSOCIATION of REALTORS®
International SellersRespondents reported working with international clients who sold U.S. residential property. The profile of international sellers mirrors foreign buyer trends. Canadians comprised the largest group of international clients who sold U.S. residential property during April 2020-March 2021, accounting for 21% of sellers. Chinese homeowners made up 8% of sellers, followed by Mexican homeowners, at 6%. German and U.K. homeowners each accounted for 5% of international clients who sold U.S. property . Other major sellers of U.S. residential property were India, Nigeria, Venezuela, France, and Colombia.
Similar to foreign buyer trends, Florida was the top location for properties sold by foreign clients, accounting for 30% of properties sold by international clients. California accounted for 13%, followed by Texas at 10%. New York and Georgia each accounted for 4% of the properties sold by international clients. Arizona, Ohio, Virginia, Illinois, and Washington made up the remaining top 10 states.
Profile of International Transactions in U.S. Residential Real Estate 2021
FL CA TX NY GA AZ OH VA IL WA
2016 27% 14% 8% 3% 2% 10% 3% 1% 3% 1%
2017 26% 9% 10% 3% 4% 8% 2% 1% 3% 1%
2018 27% 14% 10% 4% 2% 6% 2% 2% 3% 1%
2019 31% 12% 8% 4% 2% 6% 3% 1% 2% 0%
2020 31% 10% 8% 4% 2% 6% 2% 2% 2% 0%
2021 30% 13% 10% 4% 4% 3% 3% 2% 2% 2%
Share of Top States to Total International Clients Who Sold U.S. Residential Property
Canada China Mexico GermanyUnited
Kingdom India Nigeria Venezuela France Colombia2016 23% 15% 6% 5% 6% 4% * 2% 1% 2%2017 22% 7% 12% 2% 7% 4% 1% 0% 3% 2%2018 20% 12% 8% 3% 4% 5% * 3% 2% 2%2019 16% 10% 9% 2% 6% 4% 1% 2% 2% 2%2020 19% 11% 6% 2% 6% 4% * 1% 4% 1%2021 21% 8% 6% 5% 5% 4% 2% 2% 2% 2%
* less than 1%
Share of Top 10 International Clients Who Sold U.S. Residential Property

Client Transactions
26
3
27
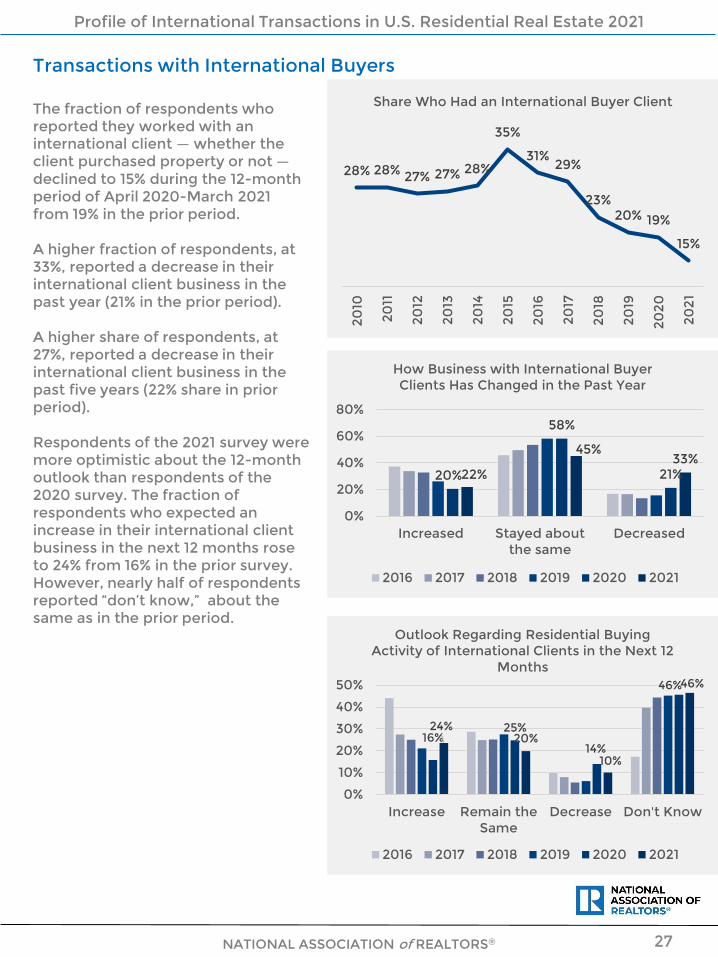
The fraction of respondents who reported they worked with an international client ― whether the client purchased property or not ―declined to 15% during the 12-month period of April 2020-March 2021 from 19% in the prior period.
A higher fraction of respondents, at 33%, reported a decrease in their international client business in the past year (21% in the prior period).
A higher share of respondents, at 27%, reported a decrease in their international client business in the past five years (22% share in prior period).
Respondents of the 2021 survey were more optimistic about the 12-month outlook than respondents of the 2020 survey. The fraction of respondents who expected an increase in their international client business in the next 12 months rose to 24% from 16% in the prior survey. However, nearly half of respondents reported “don’t know,” about the same as in the prior period.
Profile of International Transactions in U.S. Residential Real Estate 2021
NATIONAL ASSOCIATION of REALTORS®
28% 28% 27% 27% 28%
35%
31%29%
23%20% 19%
15%
2010
2011
2012
2013
2014
2015
2016
2017
2018
2019
2020
2021
Share Who Had an International Buyer Client
Transactions with International Buyers
20%
58%
21%22%
45%33%
0%
20%
40%
60%
80%
Increased Stayed aboutthe same
Decreased
How Business with International Buyer Clients Has Changed in the Past Year
2016 2017 2018 2019 2020 2021
16%25%
14%
46%
24%20%
10%
46%
0%
10%
20%
30%
40%
50%
Increase Remain theSame
Decrease Don't Know
Outlook Regarding Residential Buying Activity of International Clients in the Next 12
Months
2016 2017 2018 2019 2020 2021

28NATIONAL ASSOCIATION of REALTORS®
23%
22%
14%
11%
6%
5%
4%
4%
*
11%
Referred by Previous Client
Personal Contacts
Was a Former Client
Website/Internet Organic Search
Website/Internet (Paid Ad)
From a Business contact in the U.S.
Sings/Ads on Boards or Yard
Walk-in/Open House/Phone Call
From a Business Contact Outside the U.S.
Other
Source of Referrals/Leads on Foreign Residential Buyers
*Less than 1 percent
Lease Transactions
Two percent of respondents reported they worked with international clients who leased residential property, a decline from the 4% share in past years. Lease transactions declined across buyers from all regions.
Leads/Referrals
Personal contacts, former clients, and referrals from former clients and business contacts accounted for 65% of leads and referrals among agents who worked with foreign clients who purchased residential property. Website and online listings accounted for 17% compared to 12% during the prior period.
Profile of International Transactions in U.S. Residential Real Estate 2021
4%4%
2%
2% 2%
1%1%
0%
1%
2%
3%
4%
5%
North and LatinAmerica
Asia/Oceania Europe Africa
Share Who Reported International Clients Who Leased Residential Property
2018 2019 2020 2021

29NATIONAL ASSOCIATION of REALTORS®
International real estate is multi-faceted. Not only do international clients choose to purchase U.S. real estate, U.S. clients (whether U.S. citizens or non-U.S. citizens) are also interested in purchasing property abroad.
A lower fraction of respondents, at 8%, reported they had a client who was seeking to purchase property in another country.
Fifty-five percent of U.S. clients who were interested in purchasing property abroad wanted to use the property as a vacation home, to rent out, or both.
During April 2020-March 2021, the top countries of interest among U.S. clients who are interested in purchasing property abroad are Mexico (7%), Canada (5%i), China (4%), Costa Rica (3%), the Dominican Republic (2%), Spain (2%), and Argentina (2%).
14%
9%
7% 7%
11%
8%
2016 2017 2018 2019 2020 2021
Share Who Reported a U.S. Client Seeking a Residential Property Abroad
7%
5%
4%
3%2%
2% 2%
Mexico Canada China Costa Rica DominicanRepublic
Spain Argentina
Top Countries of Interest to U.S. Clients Searching to Purchase Property Abroad During April 2020-March 2021
*China includes the Mainland, Taiwan, and Hong Kong
Clients Searching for Property Abroad
Profile of International Transactions in U.S. Residential Real Estate 2021

Appendices4
31
Foreign buyers as a share of existing-home sales: The foreign buyer share to U.S. existing-home sales is based on survey data from the monthly REALTORS® Confidence Index Survey.
Share of non-resident (Type A) and resident (Type B) foreign buyers: The split between Type A and Type B foreign buyers is computed from the NAR International Survey based on the most recent foreign buyer transactions of the respondents.
U.S. Existing-Home Sales: Sales for the 12 months are obtained by summing the monthly non-seasonally adjusted sales.
Average Price, Existing-Home Sales: Since total market value is being computed, the average rather than median price is used. The average is computed as the average of the monthly average price of U.S. existing-home sales.
Average Prices, International Sales: The average prices for residential property purchased by non-resident (Type A) and resident (Type B) foreign buyers are estimated from the NAR International Survey based on the most recent foreign buyer transactions of the respondents.
NATIONAL ASSOCIATION of REALTORS®
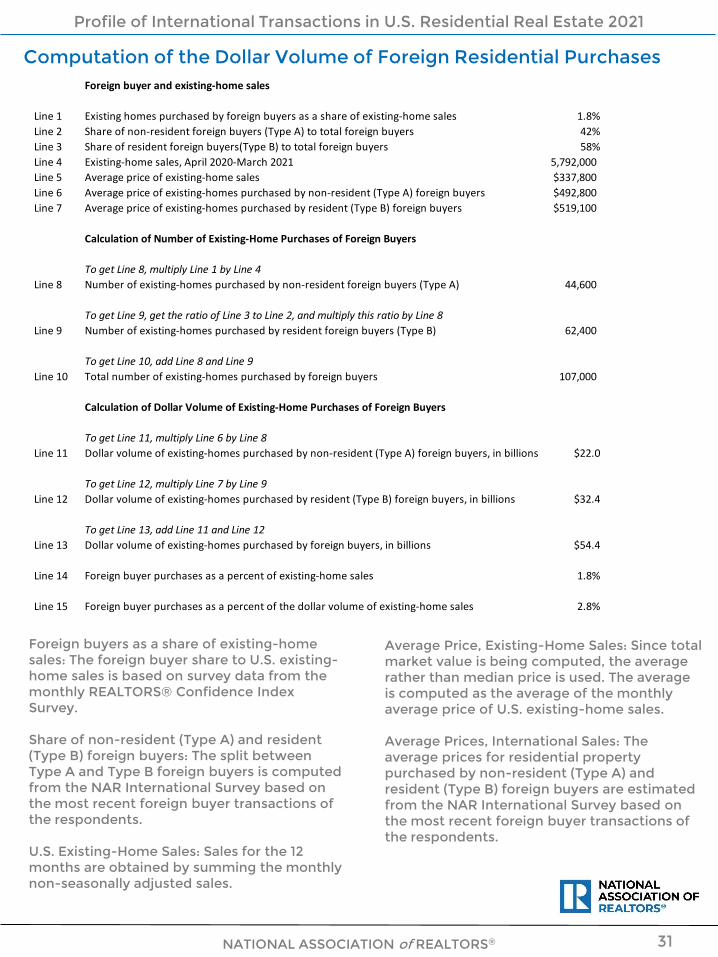
Computation of the Dollar Volume of Foreign Residential Purchases
Profile of International Transactions in U.S. Residential Real Estate 2021
Foreign buyer and existing-home sales
Line 1 Existing homes purchased by foreign buyers as a share of existing-home sales 1.8%
Line 2 Share of non-resident foreign buyers (Type A) to total foreign buyers 42%
Line 3 Share of resident foreign buyers(Type B) to total foreign buyers 58%
Line 4 Existing-home sales, April 2020-March 2021 5,792,000
Line 5 Average price of existing-home sales $337,800
Line 6 Average price of existing-homes purchased by non-resident (Type A) foreign buyers $492,800
Line 7 Average price of existing-homes purchased by resident (Type B) foreign buyers $519,100
Calculation of Number of Existing-Home Purchases of Foreign Buyers
To get Line 8, multiply Line 1 by Line 4
Line 8 Number of existing-homes purchased by non-resident foreign buyers (Type A) 44,600
To get Line 9, get the ratio of Line 3 to Line 2, and multiply this ratio by Line 8
Line 9 Number of existing-homes purchased by resident foreign buyers (Type B) 62,400
To get Line 10, add Line 8 and Line 9
Line 10 Total number of existing-homes purchased by foreign buyers 107,000
Calculation of Dollar Volume of Existing-Home Purchases of Foreign Buyers
To get Line 11, multiply Line 6 by Line 8
Line 11 Dollar volume of existing-homes purchased by non-resident (Type A) foreign buyers, in billions $22.0
To get Line 12, multiply Line 7 by Line 9
Line 12 Dollar volume of existing-homes purchased by resident (Type B) foreign buyers, in billions $32.4
To get Line 13, add Line 11 and Line 12
Line 13 Dollar volume of existing-homes purchased by foreign buyers, in billions $54.4
Line 14 Foreign buyer purchases as a percent of existing-home sales 1.8%
Line 15 Foreign buyer purchases as a percent of the dollar volume of existing-home sales 2.8%
32
NAR’s Global Partnerships
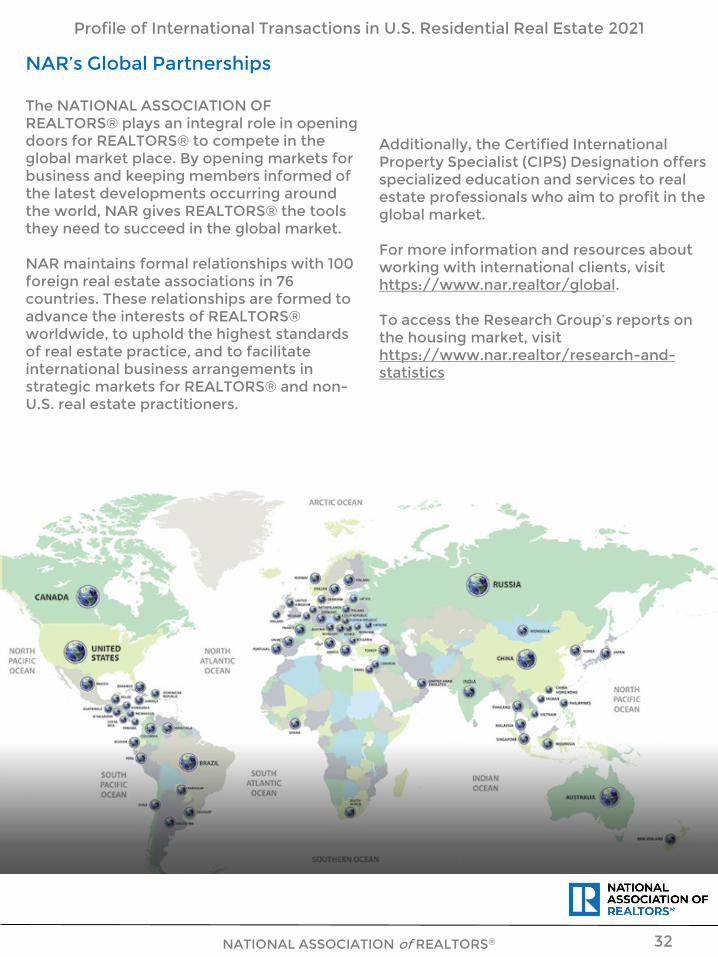
The NATIONAL ASSOCIATION OF REALTORS® plays an integral role in opening doors for REALTORS® to compete in the global market place. By opening markets for business and keeping members informed of the latest developments occurring around the world, NAR gives REALTORS® the tools they need to succeed in the global market.
NAR maintains formal relationships with 100 foreign real estate associations in 76 countries. These relationships are formed to advance the interests of REALTORS® worldwide, to uphold the highest standards of real estate practice, and to facilitate international business arrangements in strategic markets for REALTORS® and non-U.S. real estate practitioners.
Additionally, the Certified International Property Specialist (CIPS) Designation offers specialized education and services to real estate professionals who aim to profit in the global market.
For more information and resources about working with international clients, visit https://www.nar.realtor/global.
To access the Research Group’s reports on the housing market, visit https://www.nar.realtor/research-and-statistics
Profile of International Transactions in U.S. Residential Real Estate 2021
NATIONAL ASSOCIATION of REALTORS®

33
NATIONAL ASSOCIATION OF REALTORS® RESEARCH GROUP
Lawrence Yun, PhDChief Economist & Senior Vice President
Jessica Lautz, Doctor of Real EstateVice President, Demographics and Business Insights
Gay CororatonSenior Economist and Director of Housing and Commercial Research
Anna SchnerreResearch Associate, Business Insights
Meredith DunnResearch Manager
The NAR Research Group acknowledges the NAR Global Team for reviewing this report.
For questions about this report, email the National Association of REALTORS® Research Group at [email protected].
To cite information in this report, refer to the Citation Guidelines for NAR Research and Statistics at https://www.nar.realtor/research-and-statistics/citation-guidelines-for-nar-research-statistics
©2021 National Association of REALTORS®All Rights Reserved. July 2021
Cover photo: Brandon Mowinkel

The National Association of REALTORS® is America’s largest trade association, representing more than 1.4 million members, including NAR’s institutes, societies and councils, involved in all aspects of the real estate industry. NAR membership includes brokers, salespeople, property managers, appraisers, counselors and others engaged in both residential and commercial real estate. The term REALTOR® is a registered collective membership mark that identifies a real estate professional who is a member of the National Association of REALTORS® and subscribes to its strict Code of Ethics. Working for America's property owners, the National Association provides a facility for professional development, research and exchange of information among its members and to the public and government for the purpose of preserving the free enterprise system and the right to own real property.
NATIONAL ASSOCIATION OF REALTORS® RESEARCH GROUP
The Mission of the NATIONAL ASSOCIATION OF REALTORS® Research Group is to produce timely, data driven market analysis and authoritative business intelligence to serve members, and inform consumers, policymakers and the media in a professional and accessible manner.
To find out about other products from NAR’s Research Group, visit www.nar.realtor/research-and-statistics.
NATIONAL ASSOCIATION OF REALTORS® RESEARCH GROUP500 New Jersey Avenue, NWWashington, DC 20001202.383.1000
34