Embed Size (px)
Citation preview
U.S. DEPARTMENT OF COMMERCE ECONOMICS AND STATISTICS
ADMINISTRATION / BUREAU OF ECONOMIC ANALYSIS
Economic and Statistical Analysis Budget
Budget Estimates
Fiscal Year 2018
As Presented to Congress
5/23/2017


Exhibit 1
Economic and Statistical Analysis BudgetEconomics and Statistics Administration / Bureau of Economic Analysis
Budget Estimates, Fiscal Year 2018OMB Submission
Table of Contents
Exhibit PageNumber Exhibit Number
1 Table of Contents ESA- 12 Organization Chart ESA- 33 Executive Summary ESA- 5
4a Program Increases/Decreases/Terminations ESA- 75 Summary of Resource Requirements ESA- 96 Summary of Reimbursable Obligations ESA-107 Summary of Financing ESA-119 Justification of Inflation Adjustments ESA-13
10 Program and Performance: Direct Obligations ESA-1512-15 Justification of Program and Performance (by subactivity) ESA-19
Policy Support ESA-19Bureau of Economic Analysis ESA-22
16 Summary of Requirements by Object Class ESA-2734 Advisory & Assistance Services ESA-2835 Periodical, Pamphlets, & Audiovisual Services ESA-2936 Average Grade & Salaries ESA-30
APP/ APR Summary of Goals, Objectives and Performance Measures ESA-31
ESA - 1

This page intentionally left blank.
ESA - 2

EXHIBIT 2
DEPARTMENT OF COMMERCE Economic and Statistical Analysis Budget
Bureau of Economic Analysis
Organization Chart
In FY 2018, the Economic and Statistical Analysis Budget supports the Bureau of Economic Analysis (BEA) and proposes the consolidation of the Economics and Statistics Administration (ESA). ESA functions, which include the Under Secretary for Economic Affairs and policy guidance in support of department-wide economic and statistical programs and initiatives, will be consolidated within the Office of the Secretary, BEA, and the Census Bureau.
The Under Secretary for Economic Affairs, will reside within the Office of the Secretary and provide direct support to the Secretary and DOC’s economic and statistical community, which include BEA and the Census Bureau. While the Under Secretary has historically performed as the Administrator of the Economics and Statistics Administration (ESA), this function will cease in FY 2018. Instead, to realize greater efficiencies the Under Secretary will continue to serve as the Chief Economist of DOC from the Office of the Secretary. The Under Secretary will assist the Secretary and the entire Department in economic policy matters by monitoring and interpreting economic developments, domestic fiscal and monetary policies, and analyzing economic conditions and policy initiatives of major trading partners, for example. The Bureau of Economic Analysis (BEA), one of the 13 principal Federal statistical agencies, promotes a better understanding of the U.S. economy by providing timely, relevant, and accurate economic accounts data in an objective and cost-effective manner. BEA’s national, industry, regional, and international economic accounts present valuable information on critical issues such as U.S. economic growth, regional economic development, inter-industry relationships, and the Nation's position in the world economy. Some of the widely used statistical measures produced by BEA include gross domestic product (GDP), personal income and outlays, corporate profits, GDP by state and county, GDP by metropolitan area, balance of payments, and GDP by industry. These statistics are used by Federal, state, and local governments for budget development and projections; by the Federal Reserve for monetary policy; by the business sector for planning and investment; and by the American public to follow and understand the performance of the Nation’s economy. BEA’s strategic vision is to remain the world’s most respected producer of economic accounts.
Office of the Secretary
Bureau of Economic Analysis
ESA - 3

Director
Deputy Director
Chief Administrative
Officer
Chief Innovation
Officer Chief
Economist
Chief Information
Officer
Associate Director for
Industry Accounts
Associate Director for
Regional Economics
Associate Director for
International Economics
Associate Director for
National Economic Accounts
National Income and
Wealth Division
Government Division
Balance of Payments Division
Direct Investment
Division
Regional Product Division
Regional Income Division
Industry Sector Division
Industry Analysis Division
Communications Division
Administrative Services Division
PROPOSED BUREAU OF ECONOMIC ANALYSIS Green = New or Changed since FY 2017
Chief Financial Officer
Exhibit 2
ESA - 4

Exhibit 3
DEPARTMENT OF COMMERCE Economic and Statistical Analysis Budget
Bureau of Economic Analysis
Executive Summary
The United States is widely recognized as the world’s economic information leader. This is due in large part to the timely and accurate data produced by the Bureau of Economic Analysis (BEA). Although a relatively small agency, BEA produces some of the most closely watched and influential economic indicators, such as GDP and the trade balance, that directly affect decisions made by policy makers, business leaders, and the American public.
FY 2017 Annualized CR 108,793 Inflationary Adjustments 1,980 FY 2018 Base 110,773 Consolidation of ESA (3,867) BEA Program Reductions (9,906) FY 2018 Request 97,000
The budget request for FY 2018 incorporates necessary reductions while preserving the timeliness, relevance, and accuracy of some of the nation’s most critical economic statistics. Major changes in this request include: • Inflationary adjustments of $2.0 million to fund the estimated 2018 Federal pay raise of 1.9
percent and provide for inflationary increases for non-labor activities, including service contracts, utilities, and rent.
• Consolidation of the Economics and Statistics Administration (ESA), in an effort to reduce duplication, streamline operations, and realize budget efficiency, ESA will cease operations as a bureau within DOC. The Under Secretary for Economic Affairs will reside in the Office of the Secretary and will continue to be a key advisor to the Secretary in providing analysis and guidance on matters related to economic policy.
• BEA programmatic reductions which include efforts to separately measure the impact of small businesses on the U.S. economy, the incorporation of enhanced healthcare measures into the core GDP accounts, and trade in services data for dynamic industries of the U.S. economy, including R&D; intellectual property; and financial, health, and IT services. Careful consideration was given to those initiatives that could be reduced with minimal impact on BEA’s core programs.
A full-year 2017 appropriation was not enacted at the time the FY 2018 Budget was prepared; therefore, the Budget assumes the Department is operating under the Further Continuing Appropriations Act, 2017 (P.L. 114–254). The amounts included for 2017 reflect the annualized level provided by the continuing resolution.
ESA - 5

Exhibit 3
BEA’s Current Programs & Core Products
10,000 time series produced each month and nearly 2 million data points produced quarterly and annually
National Economic Accounts
Gross Domestic Product (GDP): The broadest measure of the U.S. economy. Components of GDP show how specific sectors of the economy are performing. GDP and the other components of the National Income and Product Accounts are key ingredients into Federal budget planning, monetary policy, and business planning. Personal Income and Outlays: Comprehensive and timely monthly statistics on all income received by persons in the United States, the money they spend on goods and services, and the income they save. Corporate Profits: The only comprehensive, timely, and consistent statistics on corporate earnings. These statistics are an important baseline for businesses and individuals in judging corporate earnings. Fixed Assets: Comprehensive statistics on U.S. wealth, including capital stocks, consumer durable goods, and depreciation. These statistics are crucial in the analysis of the effect of wealth on consumer spending, investment, and economic growth. Integrated Macroeconomic Accounts for the United States: Integrated accounts that link production and income to changes in net worth for the U.S. economy. These accounts detail the sources and uses of funds made available for capital formation or net lending as well as track assets and liabilities for all major sectors of the U.S. economy.
International Economic Accounts
U.S. International Transactions (Balance of Payments): These accounts summarize transactions between U.S. and foreign residents, including, for example, transactions in goods and services, debt forgiveness, and transactions in U.S.-owned assets abroad and foreign-owned assets in the United States. Trade in Goods and Services: Monthly and annual statistics of U.S. imports and exports of goods and services. International Investment Position: The only comprehensive comparison of the value of U.S.-owned assets abroad and the value of foreign-owned assets in the United States. These statistics facilitate analysis of the economic effects of international lending and investment on the U.S. economy. Activities of Multinational Enterprises: These data sets cover the financial structure and operations of U.S. multinational enterprises (MNEs) and of U.S. affiliates of foreign MNEs. The data are used to analyze the characteristics and performance of MNEs and to assess their impact on the U.S. and foreign host economies. New Foreign Direct Investment: These statistics provide information on the acquisition, establishment, and expansion of U.S. business enterprises by foreign direct investors.
Industry Economic Accounts
GDP by Industry Accounts: These quarterly and annual accounts provide an industry-by-industry breakout of GDP. They are ideally suited for analysis of an industry’s returns to labor and capital and its contribution to U.S. economic growth and inflation. Input-Output Accounts: These accounts provide detailed information on the flows of goods and services to industries for use in their production processes and to final users in the economy. The annual statistics detail these interactions for 71 industries, while the benchmark accounts provide the most comprehensive statistics for approximately 400 industries across the U.S. economy. U.S. Travel and Tourism Accounts: This satellite account provides the most comprehensive and timely picture of direct and indirect sales made in tourism-related industries and their role in the U.S. economy. Arts and Cultural Production Account: This satellite account provides national statistics on select arts and cultural commodities and industries, including industry output, employment, compensation of employees, and “value added” by industry. Integrated BEA/BLS Industry-Level Production Account: This account integrates statistics on GDP by industry produced by the BEA with statistics on capital and labor input from the BLS in order to trace the sources of U.S. economic growth.
Regional Economic Accounts
GDP by State and Metropolitan Area: These statistics are the regional counterparts to the Nation’s GDP and show the distribution of the Nation’s output produced in each state and the portion of each industry’s output by state and metropolitan area. State and Local Personal Income: These measures report income for states, counties, and metropolitan areas and are used along with GDP by state to allocate approximately $400 billion in Medicaid and other grants to states. States use these measures to project tax receipts and set spending caps. Regional Input-Output Multipliers: These statistics measure the impacts of government regulations, policies, and programs as well as private-sector economic development plans. Multipliers have been used to study the effects of military base closings, firm relocations, sports facility construction, natural disasters, and terrorist attacks. Regional Price Parities (RPPs) and Real Personal Income: RPPs measure geographic price level differences across the United States for one time period. These price indexes are used to produce BEA’ estimates of real personal income. PCE by State: These statistics are the state counterparts to national consumer spending and measure the goods and services purchased by or on behalf of households and the net expenditures of nonprofit institutions serving households by state of residence.
ESA - 6

Exhibit 4a
Page No. Budgetin CJ Appropriation Budget Program Activity/Subactivity FTE Authority
N/A N/A N/A 0 0
Subtotal, Increases 0 0
Page No. Budgetin CJ Appropriation Budget Program Activity/Subactivity FTE Authority
ESA-26 Salaries and Expenses Bureau of Economic Analysis Economic Measures Subactivity 0 -9,906
Subtotal, Decreases 0 -9,906
Page No. Budgetin CJ Appropriation Budget Program Activity/Subactivity FTE Authority
ESA-19 Salaries and Expenses Policy Support Economics and Statistics Administration -15 -3,867
Subtotal, Terminations -15 -3,867
Total, Increases, Decreases and Terminations -15 -13,773
Terminations
Increases
Decreases
Department of CommerceEconomic and Statistical Analysis Budget
FY 2018 PROGRAM INCREASES / DECREASES / TERMINATIONS(Dollar amounts in thousands)
(Largest to Smallest)
ESA - 7

This page intentionally left blank.
ESA - 8

Exhibit 5
Department of CommerceEconomic and Statistical Analysis Budget
Economics and Statistics Administration / Bureau of Economic AnalysisSalaries and Expenses
SUMMARY OF RESOURCE REQUIREMENTS(Dollar amounts in thousands)
Budget DirectPositions FTE Authority Obligations
FY 2017 522 501 108,793 109,279less: Unobligated Balance, start of year (486)plus: Inflationary Adjustments 0 0 1,980 1,980
FY 2018 Base 522 501 110,773 110,773less: Consolidation of ESA (16) (15) (3,867) (3,867)less: BEA Program reductions (12) 0 (9,906) (9,906)
FY 2018 Estimate 494 486 97,000 97,0002016 2017 2018 2018 2018
Comparison by activity/subactivity Increase / (Decrease)Personnel Amount Personnel Amount Personnel Amount Personnel Amount Personnel Amount
Bureau of Economic Analysis Pos/BA 494 105,126 506 104,926 506 106,906 494 97,000 (12) (9,906)FTE/Obl. 486 109,980 486 105,211 486 486 0
Policy support Pos/BA 14 3,874 16 3,867 16 3,867 0 0 (16) (3,867)FTE/Obl. 13 4,034 15 4,068 15 0 (15)
TOTALS Pos/BA 508 109,000 522 108,793 522 110,773 494 97,000 (28) (13,773)FTE/Obl. 499 114,014 501 109,279 501 0 486 (15)
Adjustments to Obligations
Recoveries and Refunds (455) Unobligated Balance, start of year (5,045) (486) Unobligated Balance, end of year 486
Appropriation 499 109,000 501 108,793 501 110,773 486 97,000 (15) (13,773)
Actual BaseAnnualized CR Estimate
ESA - 9

Department of Commerce Exhibit 6Economic and Statistical Analysis Budget
Economics and Statistics Administration / Bureau of Economic AnalysisSalaries and Expenses
SUMMARY OF REIMBURSABLE OBLIGATIONS(Dollar amounts in thousands)
2016 2017 2018 2018 2018Comparison by activity Increase / (Decrease)
Personnel Amount Personnel Amount Personnel Amount Personnel Amount Personnel Amount
Reimbursable projectsBureau of Economic Analysis Pos/BA 10 2,950 10 4,083 19 3,381 19 3,381 0 0
FTE/Obl. 10 10 19 19 0
Policy support Pos/BA 23 4,738 31 7,202 0 0 0 0 0 0FTE/Obl. 23 31 0 0 0
Total, Reimbursable projects.......................... Pos/BA 33 7,688 41 11,285 19 3,381 19 3,381 0 0FTE/Obl. 33 41 19 19 0
Subscription and fee sales
Bureau of Economic Analysis Pos/BA 1 404 1 411 1 411 1 411 0 0FTE/Obl. 1 1 1 1 0
Policy support Pos/BA 0 0 0 0 0 0 0 0 0 0FTE/Obl. 0 0 0 0 0
Total, Subscription and fee sales................... Pos/BA 1 404 1 411 1 411 1 411 0 0FTE/Obl. 1 1 1 1 0
Total, Reimbursable Obligations.................... Pos/BA 34 8,092 42 11,696 20 3,792 20 3,792 0 0FTE/Obl. 34 42 20 20 0
Actual BaseAnnualized CR Estimate
ESA - 10
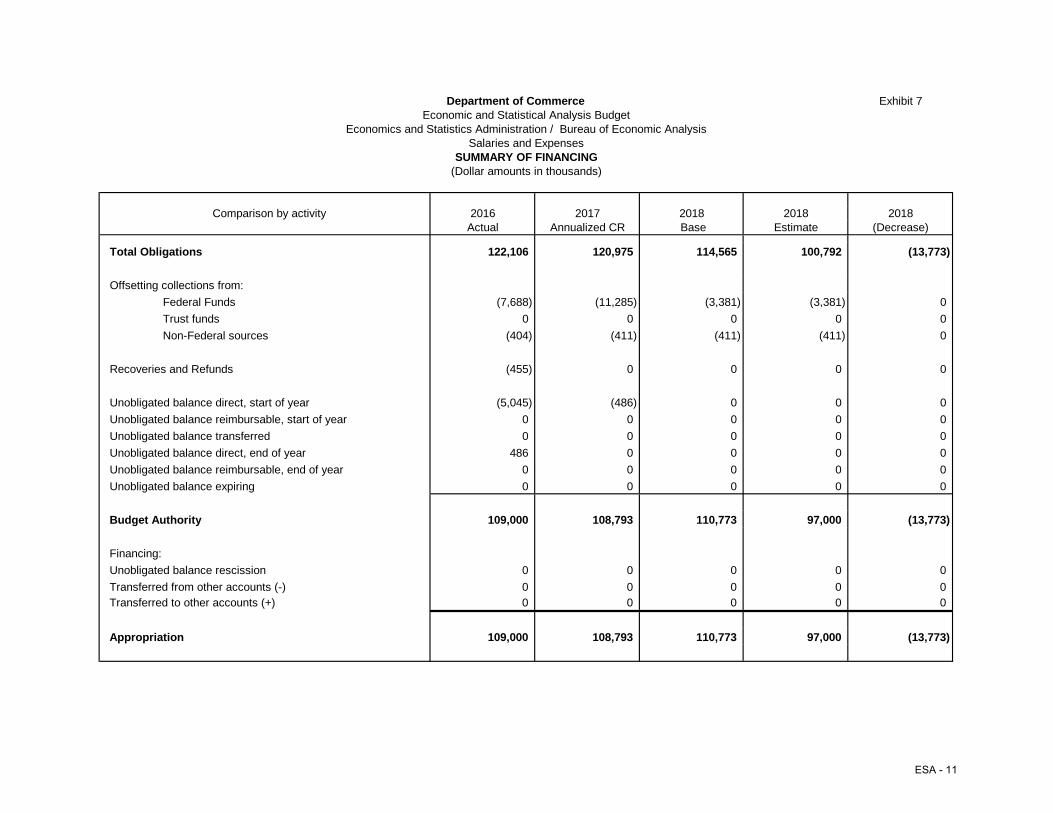
Department of Commerce Exhibit 7Economic and Statistical Analysis Budget
Economics and Statistics Administration / Bureau of Economic AnalysisSalaries and Expenses
SUMMARY OF FINANCING(Dollar amounts in thousands)
Comparison by activity 2016 2017 2018 2018 2018Actual Annualized CR Base Estimate (Decrease)
Total Obligations 122,106 120,975 114,565 100,792 (13,773)
Offsetting collections from:Federal Funds (7,688) (11,285) (3,381) (3,381) 0Trust funds 0 0 0 0 0Non-Federal sources (404) (411) (411) (411) 0
Recoveries and Refunds (455) 0 0 0 0
Unobligated balance direct, start of year (5,045) (486) 0 0 0Unobligated balance reimbursable, start of year 0 0 0 0 0Unobligated balance transferred 0 0 0 0 0Unobligated balance direct, end of year 486 0 0 0 0Unobligated balance reimbursable, end of year 0 0 0 0 0Unobligated balance expiring 0 0 0 0 0
Budget Authority 109,000 108,793 110,773 97,000 (13,773)
Financing:Unobligated balance rescission 0 0 0 0 0Transferred from other accounts (-) 0 0 0 0 0Transferred to other accounts (+) 0 0 0 0 0
Appropriation 109,000 108,793 110,773 97,000 (13,773)
ESA - 11

This page intentionally left blank.
ESA - 12

Exhibit 9
Department of CommerceEconomic and Statistical Analysis Budget
Economics and Statistics Administration / Bureau of Economic Analysis
JUSTIFICATION OF ADJUSTMENTS TO BASE
FTE Amount
Annualization of FY 2017 pay raise 400Full-year cost of the 2017 pay increase and related costs. A pay raise of 2.1% is effective for FY 2018January 1, 2017.
Total cost of FY 2017 pay increase 1,203,939Less amount requested in FY 2016 (803,702)Amount requested in FY 2017 for FY 2016 pay increase 400,237
FY 2018 pay raise and related costs 817A general pay raise of 1.9% is assumed to be effective January 1, 2018.
Total cost in FY 2018 of pay increase 1,089,277Less 1/4 of the year not covered by pay raise (272,319)Amount requested in FY 2018 for 2018 pay increase (3/4 of year) 816,958
Full-year cost in FY 2018 of positions financed for part-year in FY 2017 0An increase of $0,000 is required to fund the full-year cost in FY 2018 of positionsfinanced for part-year in FY 2017, The computation follows:
Annual salary of new positions in FY 2017 0 0Plus FY 2017 pay raise of 2.1% 0Less 5% lapse 0 0Full-year cost of personnel compensation 0 0Less compensation included in the FY 2017 budget 0 0Subtotal Personnel Compensation 0 0Adjustment for FY 2017 pay raise (2.1% x .75) 0Amount required for personnel compensation 0 0Benefits 0Total Adjustments to Base 0 0
Changes in compensable days 0The increased cost of 0 compensable days in FY 2018 compared to FY 2017 is calculated bydividing the FY 2017 estimates personnel compensation ($57,330) and applicable benefits ($18,134)by 260 compensable days and multiplying by 0 fewer compensable days. The cost increase is $0,000.
Civil Service Retirement System (CSRS) (112)The estimated percentage of payroll for employees covered by CSRS will remain at 7.0% in FY 2017.The contribution rate will remain 7.0%.
FY 2018 ($57,330,364 x 0.010 x 0.07) 40,131FY 2017 ($57,330,364 x 0.038 x 0.07) 152,499Total adjustment to base (112,368)
Federal Employees Retirement System (FERS) 155The number of employees covered by FERS continues to rise as employees covered by CSRS leave and arereplaced by employees covered by FERS. The estimated percentage of payroll for employees covered by FERSis expected to increase from 79.40% in FY 2017 to 80.50% in FY 2018. The contribution rate will remain the same at 13.70%
FERS employees are subdivided between Non-Revised Annuity Employee (hired prior to January 1, 2013);and the combination of Revised Annuity Employee (hired from January 1, 2013 and December 31, 2013),plus Further Revised Annuity Employee (hired from January 1, 2014 forward)
Non-Revised Annuity Employee"The estimated percentage of payroll for employees covered by Non-Revised Annuity Employee (Non-RAE) "is expected to increase from 79.4% in FY 2017 to 80.5% in FY 2018. The contribution rate will remain the same at 13.70%
FY 2018 ($57,330,364 x 0.805 x 0.137) 6,322,679FY 2017 ($57,330,364 x 0.794 x 0.137) 6,236,282 86,397
Revised Annuity Employee, and Further Revised Annuity Employee"The estimated percentage of payroll for employees covered by Revised Annuity Employee (RAE), and Further Revised"Annuity Employee (FRAE) is expected to increase from 16.3% in FY 2017 to 17.3% in FY 2018. The contribution rate will remain the same at 11.90%
FY 2018 ($57,330,364 x 0.173 x 0.119) 1,180,260FY 2017 ($57,330,364 x 0.163 x 0.119) 1,112,037
Salaries and Expenses
ADJUSTMENTS TO BASE(Dollar Amounts in Thousands)
ESA - 13
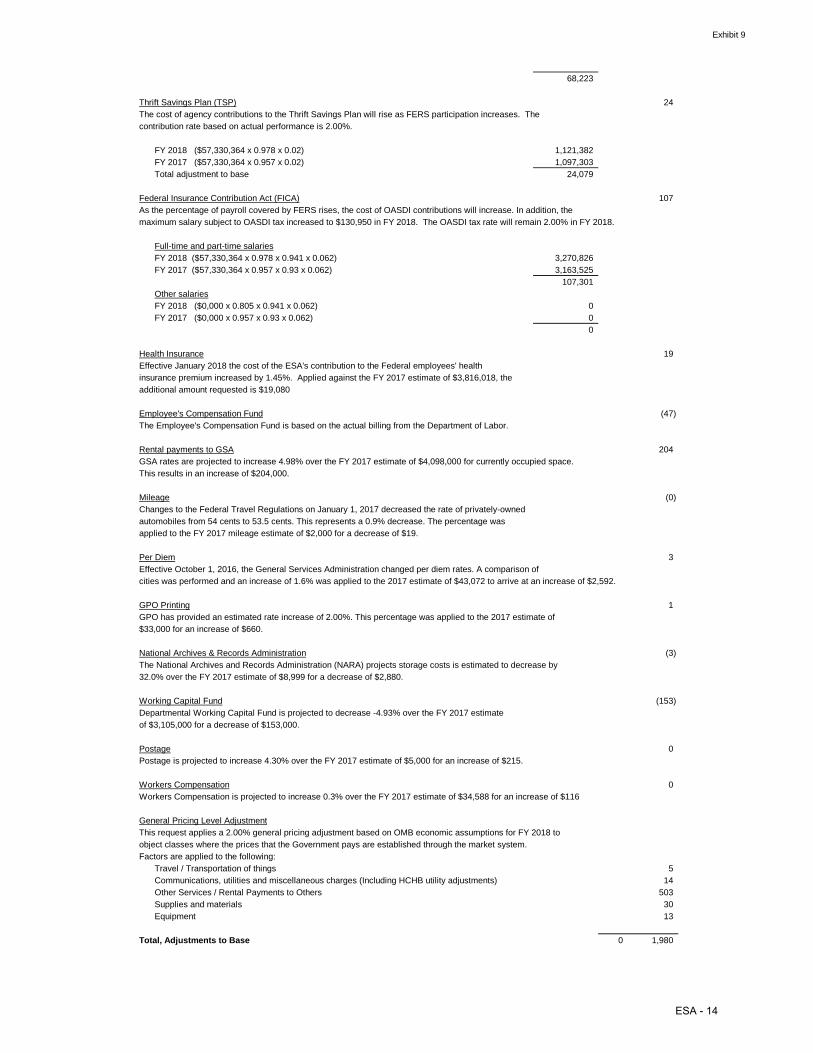
Exhibit 9
68,223
Thrift Savings Plan (TSP) 24The cost of agency contributions to the Thrift Savings Plan will rise as FERS participation increases. The contribution rate based on actual performance is 2.00%.
FY 2018 ($57,330,364 x 0.978 x 0.02) 1,121,382FY 2017 ($57,330,364 x 0.957 x 0.02) 1,097,303Total adjustment to base 24,079
Federal Insurance Contribution Act (FICA) 107As the percentage of payroll covered by FERS rises, the cost of OASDI contributions will increase. In addition, themaximum salary subject to OASDI tax increased to $130,950 in FY 2018. The OASDI tax rate will remain 2.00% in FY 2018.
Full-time and part-time salariesFY 2018 ($57,330,364 x 0.978 x 0.941 x 0.062) 3,270,826FY 2017 ($57,330,364 x 0.957 x 0.93 x 0.062) 3,163,525
107,301Other salariesFY 2018 ($0,000 x 0.805 x 0.941 x 0.062) 0FY 2017 ($0,000 x 0.957 x 0.93 x 0.062) 0
0
Health Insurance 19Effective January 2018 the cost of the ESA's contribution to the Federal employees' health insurance premium increased by 1.45%. Applied against the FY 2017 estimate of $3,816,018, the additional amount requested is $19,080
Employee's Compensation Fund (47)The Employee's Compensation Fund is based on the actual billing from the Department of Labor.
Rental payments to GSA 204GSA rates are projected to increase 4.98% over the FY 2017 estimate of $4,098,000 for currently occupied space.This results in an increase of $204,000.
Mileage (0)Changes to the Federal Travel Regulations on January 1, 2017 decreased the rate of privately-ownedautomobiles from 54 cents to 53.5 cents. This represents a 0.9% decrease. The percentage wasapplied to the FY 2017 mileage estimate of $2,000 for a decrease of $19.
Per Diem 3Effective October 1, 2016, the General Services Administration changed per diem rates. A comparison of cities was performed and an increase of 1.6% was applied to the 2017 estimate of $43,072 to arrive at an increase of $2,592.
GPO Printing 1GPO has provided an estimated rate increase of 2.00%. This percentage was applied to the 2017 estimate of $33,000 for an increase of $660.
National Archives & Records Administration (3)The National Archives and Records Administration (NARA) projects storage costs is estimated to decrease by 32.0% over the FY 2017 estimate of $8,999 for a decrease of $2,880.
Working Capital Fund (153)Departmental Working Capital Fund is projected to decrease -4.93% over the FY 2017 estimate of $3,105,000 for a decrease of $153,000.
Postage 0Postage is projected to increase 4.30% over the FY 2017 estimate of $5,000 for an increase of $215.
Workers Compensation 0Workers Compensation is projected to increase 0.3% over the FY 2017 estimate of $34,588 for an increase of $116
General Pricing Level AdjustmentThis request applies a 2.00% general pricing adjustment based on OMB economic assumptions for FY 2018 to object classes where the prices that the Government pays are established through the market system. Factors are applied to the following:
Travel / Transportation of things 5Communications, utilities and miscellaneous charges (Including HCHB utility adjustments) 14Other Services / Rental Payments to Others 503Supplies and materials 30Equipment 13
Total, Adjustments to Base 0 1,980
ESA - 14

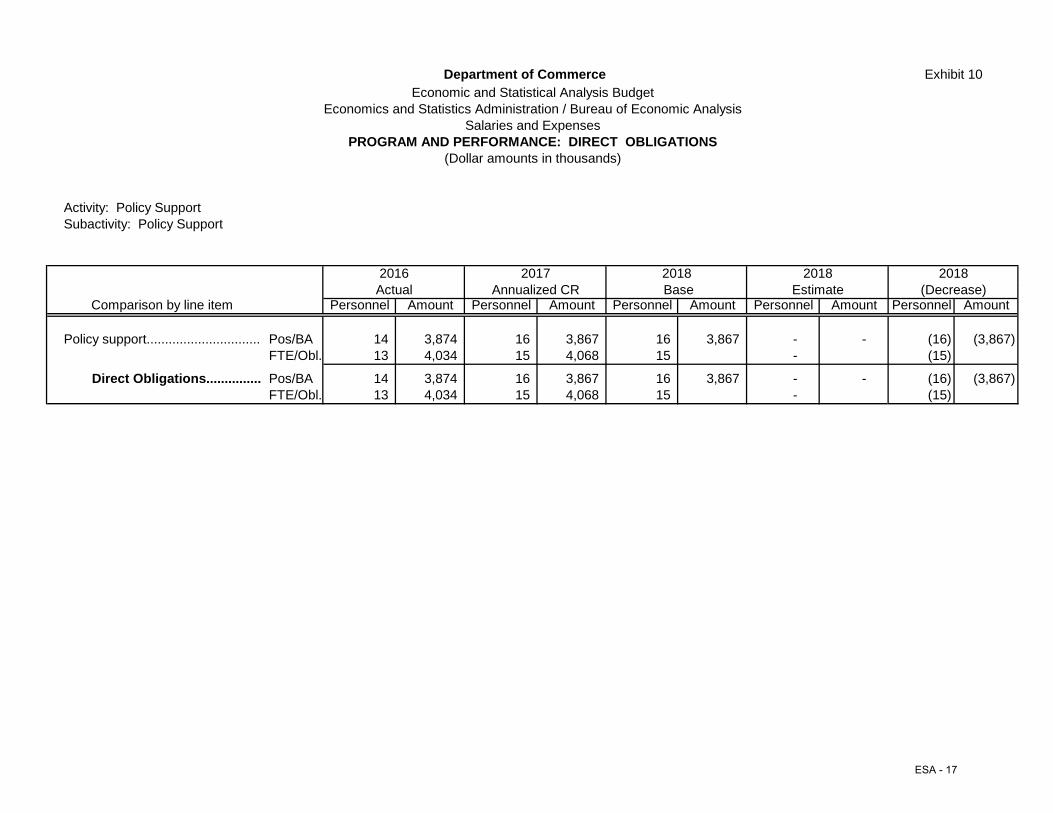
Department of Commerce Exhibit 10Economic and Statistical Analysis Budget
Economics and Statistics Administration / Bureau of Economic AnalysisSalaries and Expenses
PROGRAM AND PERFORMANCE: DIRECT OBLIGATIONS(Dollar amounts in thousands)
Activity: Bureau of Economic AnalysisSubactivity: National Economic Accounts
2016 2018Actual Estimate (Decrease)
Comparison by line item Personnel Amount Personnel Amount Personnel Amount Personnel Amount Personnel Amount
National Economic Accounts........ Pos/BA 160 34,924 166 33,262 166 33,889 162 30,749 (4) (3,140) FTE/Obl. 157 34,864 160 33,352 160 160 -
Direct Obligations............... Pos/BA 160 34,924 166 33,262 166 33,889 162 30,749 (4) (3,140) FTE/Obl. 157 34,864 160 33,352 160 160 -
Activity: Bureau of Economic AnalysisSubactivity: International Economic Accounts
2016 2018Actual Estimate (Decrease)
Comparison by line item Personnel Amount Personnel Amount Personnel Amount Personnel Amount Personnel Amount
International Economic Accounts. Pos/BA 185 38,197 178 38,298 178 39,021 174 35,405 (4) (3,616) FTE/Obl. 181 40,143 171 38,402 171 171 -
Direct Obligations............... Pos/BA 185 38,197 178 38,298 178 39,021 174 35,405 (4) (3,616) FTE/Obl. 181 40,143 171 38,402 171 171 -
2018
2018
2017 Base2018
2018 Base
Annualized CR
2017Annualized CR
ESA - 15

Department of Commerce Exhibit 10Economic and Statistical Analysis Budget
Economics and Statistics Administration / Bureau of Economic AnalysisSalaries and Expenses
PROGRAM AND PERFORMANCE: DIRECT OBLIGATIONS(Dollar amounts in thousands)
Activity: Bureau of Economic AnalysisSubactivity: Industry Economic Accounts
2016Actual Estimate (Decrease)
Comparison by line item Personnel Amount Personnel Amount Personnel Amount Personnel Amount Personnel Amount
Industry Economic Accounts Pos/BA 58 13,002 73 13,116 73 13,363 70 12,125 (3) (1,238) FTE/Obl. 59 13,748 68 13,151 68 68 -
Direct Obligations............... Pos/BA 58 13,002 73 13,116 73 13,363 70 12,125 (3) (1,238) FTE/Obl. 59 13,748 68 13,151 68 68 -
Activity: Bureau of Economic AnalysisSubactivity: Regional Economic Accounts
2016Actual Estimate (Decrease)
Comparison by line item Personnel Amount Personnel Amount Personnel Amount Personnel Amount Personnel Amount
Regional Economic Accounts....... Pos/BA 90 19,003 89 20,251 89 20,633 87 18,721 (1) (1,912) FTE/Obl. 89 21,226 87 20,306 87 87 -
Direct Obligations............... Pos/BA 90 19,003 89 20,251 89 20,633 87 18,721 (1) (1,912) FTE/Obl. 89 21,226 87 20,306 87 87 -
BaseAnnualized CR20182017 2018
2018 20182018 Base
2017Annualized CR
2018
ESA - 16
Department of Commerce Exhibit 10Economic and Statistical Analysis Budget
Economics and Statistics Administration / Bureau of Economic AnalysisSalaries and Expenses
PROGRAM AND PERFORMANCE: DIRECT OBLIGATIONS(Dollar amounts in thousands)
Activity: Policy SupportSubactivity: Policy Support
2016Actual Estimate (Decrease)
Comparison by line item Personnel Amount Personnel Amount Personnel Amount Personnel Amount Personnel Amount
Policy support............................... Pos/BA 14 3,874 16 3,867 16 3,867 - - (16) (3,867) FTE/Obl. 13 4,034 15 4,068 15 - (15)
Direct Obligations............... Pos/BA 14 3,874 16 3,867 16 3,867 - - (16) (3,867) FTE/Obl. 13 4,034 15 4,068 15 - (15)
2018Annualized CR
20182018 Base
2017
ESA - 17

This page intentionally left blank.
ESA - 18

EXHIBIT 12 – 15
APPROPRIATION ACCOUNT: Salaries and Expenses, Economic and Statistical Analysis Economic and Statistical Analysis of the Department of Commerce (DOC) provides timely economic analysis and disseminates national economic indicators as part of the Department’s premier statistical programs. The Under Secretary for Economic Affairs coordinates with both BEA and the Census Bureau on high priority management, budget, employment, and risk management issues, integrating such work with the priorities and requirements of the Department and other government entities. BEA produces national economic indicators that are a necessary component of the analysis produced by the Under Secretary of Commerce for Economic Affairs on socio-economic trends affecting policymakers, businesses, and the American Public.
In FY 2018, BEA supports base programs, and proposes no new initiatives. PROGRAM BUDGET AND JUSTIFICATION: Economic Policy Support
In an effort to reduce duplication, streamline operations, and realize budget efficiency, the Budget proposes the elimination of the Economics and Statistics Administration (ESA). ESA functions will be consolidated within the Office of the Secretary, BEA, and the Census Bureau. Due to this consolidation, $0 is requested for Economic Policy Support in FY 2018.
PROGRAM BUDGET PROFILE
(Dollars in thousands)
Funding Requirements by Sub-Program: FY 2016 FY 2017 FY 2018
Economic Policy Support 3,874 3,867 0 Total Dollars: 3,874 3,867 0
Total FTEs: 13 15 0 Additionally, the Budget proposes that the Under Secretary for Economic Affairs will reside within the Office of the Secretary to directly support the Secretary, and will no longer lead the ESA. This change will not impact BEA or Census Bureau functions or programs. From this position, the Under Secretary for Economic Affairs will continue to ensure that DOC economic and statistical analysis programs align with Departmental goals and will provide program support, policy guidance, and research on policy needs. Such support includes advising the Secretary, Deputy Secretary, and other Government officials on matters related to economic developments, and the development of positions relating to economic policy and participation in White House policy councils and the Secretary’s role on the Board of the Pension Benefit Guaranty Corporation. The resources devoted to these efforts by BEA are shown in the functional table below under direct obligations.
ESA - 19

EXHIBIT 12 – 15
The Under Secretary for Economic Affairs ensures that BEA and other DOC economic and statistical analysis programs align with Departmental goals, and provides mission critical services that include program support, policy guidance, and research on policy needs. The resources devoted to these efforts are shown in the functional table below under reimbursable obligations.
Personnel/Non-Personnel FTE AmountDirect Obligations (per Exhibit 5, and Exhibit 10) 0 -$
Economist, Business and Industry Specialist, Social Science … -$ Administration, Information Technology, Management and Program … -$ Budget, Financial Administration and Program … -$ Public Affairs … -$ Contractual Services … -$ Rent, Communications and Utilities … -$ Other services … -$
Reimbursable Obligations (per Exhibit 6) 3 737$ Economist, Business and Industry Specialist, Social Science … 2 440$ Administration, Management and Program … 1 226$ Budget, Financial Administration and Program … -$ Public Affairs … -$ Contractual Services … 5$ Rent, Communications and Utilities … 65$ Other services … 1$
Total 3 737$
Functional Summary Table for the Under Secretary for Economic Affairs - FY 18 Direct Obligations
Dollars in thousands
ESA - 20
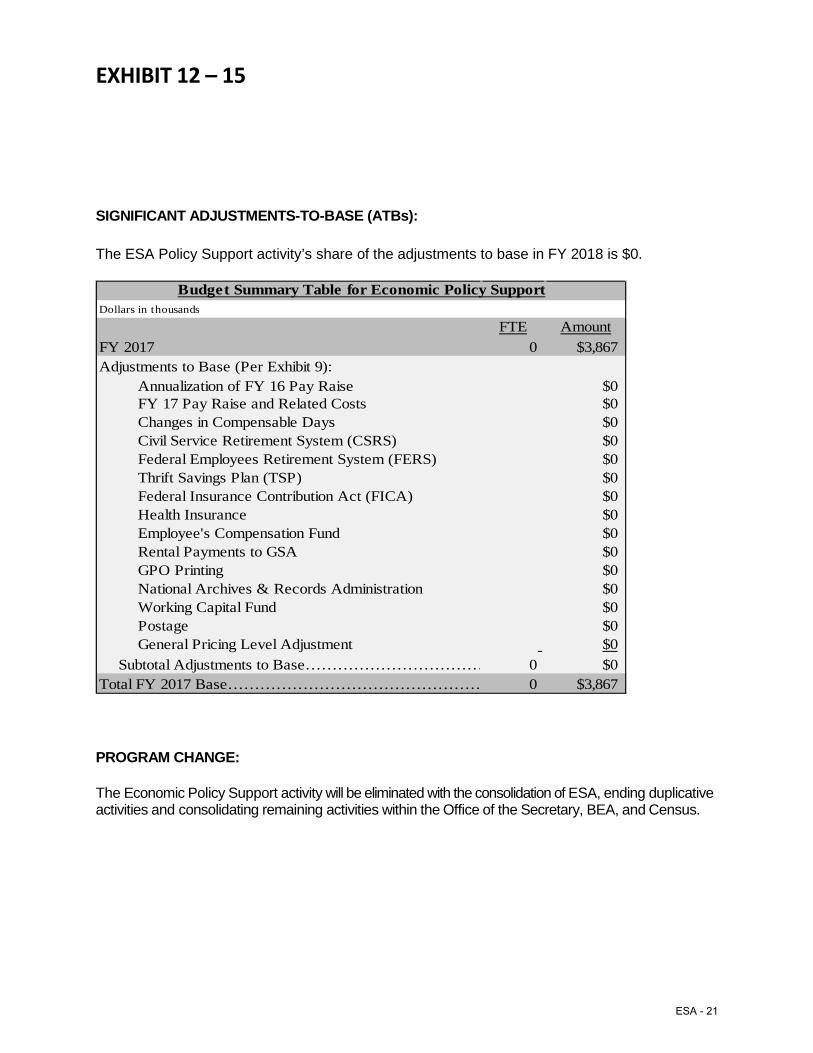
EXHIBIT 12 – 15
SIGNIFICANT ADJUSTMENTS-TO-BASE (ATBs):
The ESA Policy Support activity’s share of the adjustments to base in FY 2018 is $0.
FTE AmountFY 2017 0 $3,867Adjustments to Base (Per Exhibit 9):
Annualization of FY 16 Pay Raise $0FY 17 Pay Raise and Related Costs $0Changes in Compensable Days $0Civil Service Retirement System (CSRS) $0Federal Employees Retirement System (FERS) $0Thrift Savings Plan (TSP) $0Federal Insurance Contribution Act (FICA) $0Health Insurance $0Employee's Compensation Fund $0Rental Payments to GSA $0GPO Printing $0National Archives & Records Administration $0Working Capital Fund $0Postage $0General Pricing Level Adjustment $0
Subtotal Adjustments to Base…………………………… 0 $0Total FY 2017 Base………………………………………… 0 $3,867
Budget Summary Table for Economic Policy SupportDollars in thousands
PROGRAM CHANGE:
The Economic Policy Support activity will be eliminated with the consolidation of ESA, ending duplicative activities and consolidating remaining activities within the Office of the Secretary, BEA, and Census.
ESA - 21

EXHIBIT 12 – 15
PROGRAM BUDGET AND JUSTIFICATION: Bureau of Economic Analysis (BEA)
For FY 2018, at a request of $97,000, BEA will make necessary reductions to preserve the timeliness, relevance, and accuracy of some of the Nation’s most critical economic statistics. This level will fund core activities of four economic account sub-activities.
Funding Requirements by Sub-Program: FY 2016 FY 2017 FY 2018
13,116 12,125
National Economic Accounts 34,924 33,262 30,749
PROGRAM BUDGET PROFILE(Dollars in thousands)
International Economic Accounts 38,197
Total Dollars: 105,126
19,003Regional Economic Accounts
Industry Economic Accounts 13,002
38,298 35,405
20,251
104,926 97,000
18,721
Total FTEs: 486 486 486
The Bureau of Economic Analysis is a principal Federal statistical agency promoting a better understanding of the U.S. economy by providing timely, relevant, and accurate economic accounts data in an objective and cost-effective manner. BEA’s national, industry, regional, and international economic accounts present valuable information on key issues such as U.S. economic growth, regional economic development, inter-industry relationships, and the Nation's position in the world economy. Some of the widely used statistical measures produced by BEA include gross domestic product (GDP), personal income and outlays, corporate profits, GDP by state and by metropolitan area, balance of payments, and GDP by industry. These statistics are used by Federal, state, and local governments for budget development and projections; by the Federal Reserve for monetary policy; by the business sector for planning and investment; and by the American public to follow and understand the performance of the Nation’s economy. BEA’s strategic vision is to remain the world’s most respected producer of economic accounts.
ESA - 22

EXHIBIT 12 – 15
The following list describes BEA’s four economic account areas and their products. BEA regularly reviews its programs to ensure their relevance to BEA’s mission and to increase production efficiency.
• National Economic Accounts: BEA's national accounts provide a quantitative view of U.S. domestic production, consumption, and investment; exports and imports; and national and domestic income, including measures of corporate profits and saving. They feature GDP and related measures that are the basis for Federal budget projections and are the foundation of macroeconomic analysis.
• International Economic Accounts: The international accounts provide a detailed picture of economic activity between the United States and the rest of the world. They include balance of payment statistics and trade-in-services data that are critical to monetary, trade, investment, exchange rate, and financial policies. BEA’s direct investment programs, required by law, are critical to understanding the impact of U.S. and foreign multinational companies on the U.S. and world economies.
• Regional Economic Accounts: The regional accounts provide measures of economic activity by state, metropolitan area, and county. GDP by state, metropolitan area, and county statistics are the regional counterpart to BEA’s national GDP statistics. These statistics show the geographic distribution of the nation’s output and income and are critical to gauging the economic health of local economies. Regional data are also used to allocate close to $400 billion in Federal funds and are the basis for virtually all states’ spending and revenue forecasts.
• Industry Economic Accounts: BEA produces the input-output accounts that contain detailed information on the flow of goods and services to industries for use in the production process and to final users in the U.S. economy. These data form the foundation of the National Income and Product Accounts and many other key government statistics, such as the Bureau of Labor Statistics’ producer price indexes. They are also critical to industry and macroeconomic analyses.
Additional information on BEA and its products can be found at www.bea.gov/about/index.htm.
ESA - 23

EXHIBIT 12 – 15
Position/Other Cost FTE AmountNational Economic Accounts 160 30,749$
Economist, Social Science 98 13,880$ Information Technology Specialist 20 3,199$ Financial Administration, Accounting, Budget 19 2,474$ General, Administrative, Clerical, and Office Services 16 2,184$ Mathematical Sciences 5 575$ Public Affairs, Writing, Information and Arts 2 271$ Contractual Services 5,114$ Rent, Communications, and Utilities 1,876$ Other services 1,175$
International Economic Accounts 171 35,405$ Economist, Social Science 105 15,981$ Information Technology Specialist 21 3,683$ Financial Administration, Accounting, Budget 20 2,849$ General, Administrative, Clerical, and Office Services 17 2,515$ Mathematical Sciences 5 662$ Public Affairs, Writing, Information and Arts 2 312$ Contractual Services 5,889$ Rent, Communications, and Utilities 2,160$ Other services 1,353$
Industry Economic Accounts 68 12,125$ Economist, Social Science 42 5,474$ Information Technology Specialist 8 1,262$ Financial Administration, Accounting, Budget 8 975$ General, Administrative, Clerical, and Office Services 7 861$ Mathematical Sciences 2 227$ Public Affairs, Writing, Information and Arts 1 107$ Contractual Services 2,017$ Rent, Communications, and Utilities 740$ Other services 464$
Regional Economic Accounts 87 18,721$ Economist, Social Science 53 8,451$ Information Technology Specialist 11 1,947$ Financial Administration, Accounting, Budget 10 1,506$ General, Administrative, Clerical, and Office Services 9 1,330$ Mathematical Sciences 3 350$ Public Affairs, Writing, Information and Arts 1 164$ Contractual Services 3,114$ Rent, Communications, and Utilities 1,142$ Other services 716$
Total 486 $97,000
Functional Summary Table for BEA - FY 2018Dollars in thousands
ESA - 24

EXHIBIT 12 – 15
SIGNIFICANT ADJUSTMENTS-TO-BASE (ATBs):
BEA’s share of the adjustments to base in FY 2018 is $1,979,568. The increase will fund the estimated 2018 Federal pay raise of 1.9 percent as well as inflationary increases for non-labor activities, including service contracts, utilities, and rent.
FTE AmountFY 2017 Annualized CR……………………………………………. 486 $104,926Adjustments to Base (Per Exhibit 9):
Annualization of FY 17 Pay Raise $400FY 18 Pay Raise and Related Costs $817Full-Year Cost in FY 18 of Positions Financed for Part-Year in FY 17 0 $0Changes in Compensable Days $0Civil Service Retirement System (CSRS) ($112)Federal Employees Retirement System (FERS) $155Thrift Savings Plan (TSP) $24Federal Insurance Contribution Act (FICA) $107Health Insurance $19Employee's Compensation Fund ($47)Rental Payments to GSA $204GPO Printing $1National Archives & Records Administration ($3)Working Capital Fund ($153)Postage $0General Pricing Level Adjustment $568
Subtotal Adjustments to Base………………………………………… 0 $1,980Total FY 2018 Base……………………………………………. 486 $106,906Program Changes:
Program Reductions……………………………………………. 0 ($9,906)Total FY 2018 OMB Request …………..……………………………… 486 $97,000
Budget Summary Table for Bureau of Economic AnalysisDollars in thousands
ESA - 25

EXHIBIT 12 – 15
PROGRAM CHANGE:
BEA Program Reductions (-$9.9 million/ 0 FTE)
BEA’s highest priority is to maintain the integrity of its flagship data products, including gross domestic product (GDP). Careful consideration was given to which statistical programs could be reduced while maintaining the timeliness and accuracy of its core statistics. Statistics that are central to BEA’s mission are defined by three criteria: (1) statistics that feed into the estimation of GDP and related statistics, (2) statistics required by law, or (3) statistics required for the administration of Federal programs. To preserve core statistical programs, BEA will cease work on the following, former program expansions: International Trade in Services initiative Services exports have become increasingly important to U.S. economic growth. Exports of services represented 35 percent of total exports in 2016 and led to a surplus in services trade of $270 billion. Trade in research and development; intellectual property; and financial, health, and information technology services is associated with high-wage jobs and growth opportunities. This initiative was designed to yield higher frequency statistics (quarterly in addition to annual) and finer detail on high-value services trade. Without these new data, U.S. businesses, trade negotiators, state and local planners, and other policy-makers will lack critical data to guide future economic decisions. Separately measuring the impact of small businesses on the U.S. economy Small businesses comprise a large portion of the U.S. business sector and are often at the leading edge of economic growth or contraction, yet no current Federal statistical program provides a comprehensive picture of the small business sector. The Small Business Satellite Account was one of several new data programs designed to fill gaps in economic knowledge brought to light in the wake of the financial crisis. This program was structured to provide a new suite of data on small business activity, including “small business GDP” and related regional statistics, to track the overall growth and health of this dynamic sector. These specialized indicators would have supported better fiscal policy and enhanced small business decision making. Research to incorporate improved measures of health care into GDP The health care sector represents a significant share of the U.S. economy—18 percent of GDP as of 2016. To more accurately measure this sector, BEA pioneered new techniques based on differences in the costs of treating diseases. This work, released in the Health Care Satellite Account (HCSA), provides additional insight into a sector of the U.S. economy that affects all Americans. Results of the most recent update to the HCSA suggest that current measures of health care inflation may be overstated, and, as a result, growth rates for GDP and productivity may be understated. BEA is pausing research to incorporate the enhanced measures of health care spending into the core GDP accounts, leaving these key statistics at risk for bias and potentially distorting the overall picture of the U.S. economy.
ESA - 26
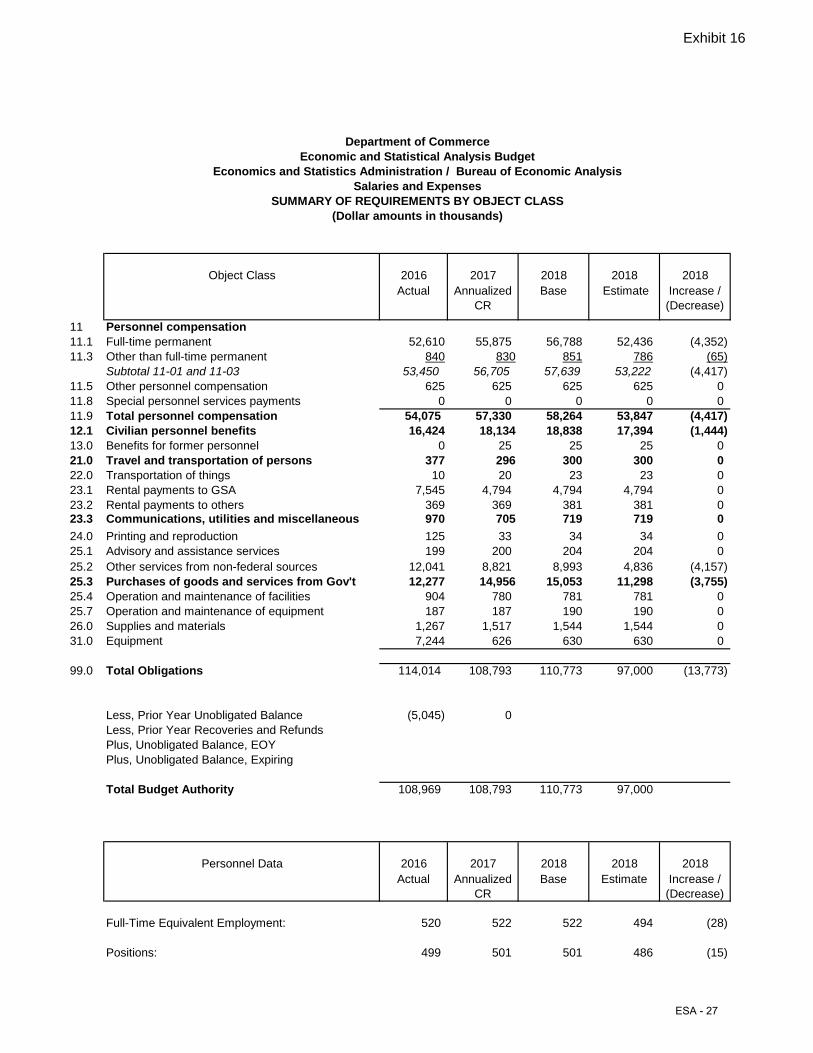
Exhibit 16
Object Class 2016 2017 2018 2018 2018Actual Annualized
CRBase Estimate Increase /
(Decrease)
11 Personnel compensation11.1 Full-time permanent 52,610 55,875 56,788 52,436 (4,352)11.3 Other than full-time permanent 840 830 851 786 (65)
Subtotal 11-01 and 11-03 53,450 56,705 57,639 53,222 (4,417)11.5 Other personnel compensation 625 625 625 625 011.8 Special personnel services payments 0 0 0 0 011.9 Total personnel compensation 54,075 57,330 58,264 53,847 (4,417)12.1 Civilian personnel benefits 16,424 18,134 18,838 17,394 (1,444)13.0 Benefits for former personnel 0 25 25 25 021.0 Travel and transportation of persons 377 296 300 300 022.0 Transportation of things 10 20 23 23 023.1 Rental payments to GSA 7,545 4,794 4,794 4,794 023.2 Rental payments to others 369 369 381 381 023.3 Communications, utilities and miscellaneous 970 705 719 719 024.0 Printing and reproduction 125 33 34 34 025.1 Advisory and assistance services 199 200 204 204 025.2 Other services from non-federal sources 12,041 8,821 8,993 4,836 (4,157)25.3 Purchases of goods and services from Gov't 12,277 14,956 15,053 11,298 (3,755)25.4 Operation and maintenance of facilities 904 780 781 781 025.7 Operation and maintenance of equipment 187 187 190 190 026.0 Supplies and materials 1,267 1,517 1,544 1,544 031.0 Equipment 7,244 626 630 630 0
99.0 Total Obligations 114,014 108,793 110,773 97,000 (13,773)
Less, Prior Year Unobligated Balance (5,045) 0Less, Prior Year Recoveries and RefundsPlus, Unobligated Balance, EOYPlus, Unobligated Balance, Expiring
Total Budget Authority 108,969 108,793 110,773 97,000
Personnel Data 2016 2017 2018 2018 2018Actual Annualized
CRBase Estimate Increase /
(Decrease)
Full-Time Equivalent Employment: 520 522 522 494 (28)
Positions: 499 501 501 486 (15)
(Dollar amounts in thousands)
Department of CommerceEconomic and Statistical Analysis Budget
Economics and Statistics Administration / Bureau of Economic AnalysisSalaries and Expenses
SUMMARY OF REQUIREMENTS BY OBJECT CLASS
ESA - 27

Exhibit 34
FY 2016 FY 2017 FY 2018Object Class 25.1 Actual Annualized CR Estimate
Management and Professional Services 199 200 204
Special Studies and Analyses 0 0 0
Engineering and Technical Services 0 0 0
TOTALS 199 200 204
Management and professional services, and special studies are utilized to the extent that they provide a cost-effective source for services.
(dollars in thousands)
Department of CommerceEconomic and Statistical Analysis Budget
Economics and Statistics Administration / Bureau of Economic AnalysisSalaries and Expenses
ADVISORY AND ASSISTANCE SERVICES
ESA - 28
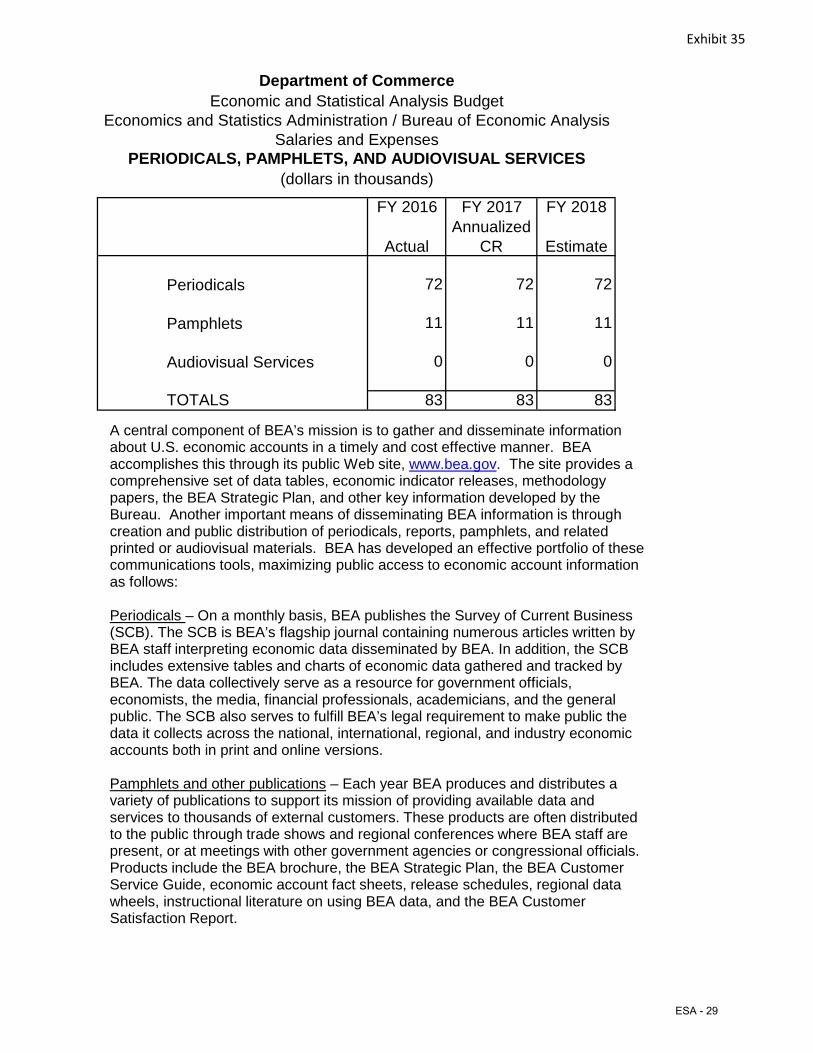
Exhibit 35
Department of CommerceEconomic and Statistical Analysis Budget
Economics and Statistics Administration / Bureau of Economic AnalysisSalaries and Expenses
PERIODICALS, PAMPHLETS, AND AUDIOVISUAL SERVICES(dollars in thousands)
FY 2016 FY 2017 FY 2018
ActualAnnualized
CR Estimate
Periodicals 72 72 72
Pamphlets 11 11 11
Audiovisual Services 0 0 0
TOTALS 83 83 83
A central component of BEA’s mission is to gather and disseminate information about U.S. economic accounts in a timely and cost effective manner. BEA accomplishes this through its public Web site, www.bea.gov. The site provides a comprehensive set of data tables, economic indicator releases, methodology papers, the BEA Strategic Plan, and other key information developed by the Bureau. Another important means of disseminating BEA information is through creation and public distribution of periodicals, reports, pamphlets, and related printed or audiovisual materials. BEA has developed an effective portfolio of these communications tools, maximizing public access to economic account informationas follows:
Periodicals – On a monthly basis, BEA publishes the Survey of Current Business (SCB). The SCB is BEA’s flagship journal containing numerous articles written by BEA staff interpreting economic data disseminated by BEA. In addition, the SCB includes extensive tables and charts of economic data gathered and tracked by BEA. The data collectively serve as a resource for government officials, economists, the media, financial professionals, academicians, and the general public. The SCB also serves to fulfill BEA’s legal requirement to make public the data it collects across the national, international, regional, and industry economic accounts both in print and online versions.
Pamphlets and other publications – Each year BEA produces and distributes a variety of publications to support its mission of providing available data and services to thousands of external customers. These products are often distributed to the public through trade shows and regional conferences where BEA staff are present, or at meetings with other government agencies or congressional officials. Products include the BEA brochure, the BEA Strategic Plan, the BEA Customer Service Guide, economic account fact sheets, release schedules, regional data wheels, instructional literature on using BEA data, and the BEA Customer Satisfaction Report.
ESA - 29

Exhibit 36
FY 2016 FY 2017 FY 2018Actual Annualized CR Estimate
Average ES Salary $177,568 $183,961 $188,744
Average GS/GM Grade 13 13 13
Average GS/GM Salary $106,639 $110,478 $113,351
Economic and Statistical Analysis BudgetEconomics and Statistics Administration / Bureau of Economic Analysis
Salaries and ExpensesAVERAGE GRADE AND SALARIES
Department of Commerce
ESA - 30

FY 2018 APP / FY 2016 APR
FY 2018 Performance Planning and FY 2016 Reporting Backup – OMB Submission Economics and Statistics Administration / Bureau of Economic Analysis
Detailed Indicator Plans and Performance For the OMB submission bureaus include the indicators they had in the FY 2017 Congressional submission for which they had targets in FY 2016 or later. Any indicators that were discontinued beginning in FY 2015 must not appear. Bureaus should provide all the required details of each individual performance indicators in the following table. Of these indicators, bureaus should note whether they are key or supporting indicators as shown in the most recent Strategic Plan, or “Other” indicators that either appeared in last year’s APPR and are being continued beyond FY 2016, or are being added in either FY 2017 or FY 2018. Note that the Department is planning on consolidating Validation and Verification Information for performance indicators. Therefore, the bureaus are not required to show it in this table. Recurring Indicators
Strategic Goal 4 Maximize the positive impacts of Commerce data on society. Objective 4.1 Deliver increasing amounts of data to governments, business, and the public in formats that are easier to access and use. Indicator Timeliness – Reliability of delivery of economic data statistics (the number of scheduled releases issued on time). Category Key Type Contextual, Customer Service, Efficiency, Input, Intermediate Outcome, Process, Outcome, or Output – See A-11, 200-15, 16 for definitions
Description
The importance of data as an ingredient for sound economic decision-making requires BEA to deliver data to decision-makers and other data users not only quickly but also reliably—that is, on schedule. Each fall, BEA publishes a schedule for the release of its economic data the following year; this measure is evaluated as the number of scheduled releases issued on time. BEA has an outstanding record of releasing its economic data on schedule and on time. In FY 2016, BEA exceeded the target of planned releases and has no indication that this target will not be met in 2017.
FY 2011 FY 2012 FY 2013 FY 2014 FY 2015 FY 2016 FY 2017 FY 2018 Target 62 62 62 62 65 65 74 74 Actual 62 of 62 62 of 62 62 of 62 65 of 62 65 of 65 74 of 64 TBD TBD Status Met Met Met Exceeded Met Exceeded TBD TBD Trend The trend for this indicator is rising, and the expectation is that BEA will raise the target for FY17 and FY18 (see below). Explanation (if not met in FY 2016)
Actions to be taken / Future Plans
BEA has no plans to change this indicator.
Adjustments to targets
Adjustment to FY2017. The target will be raised to 74 releases in FY2017 reflecting a number of new data releases in FY2016 that will be a part of BEA’s regular production schedule in FY2017.
Notes N/A Information Gaps There are no information gaps for this indicator.
ESA - 31
FY 2018 APP / FY 2016 APR
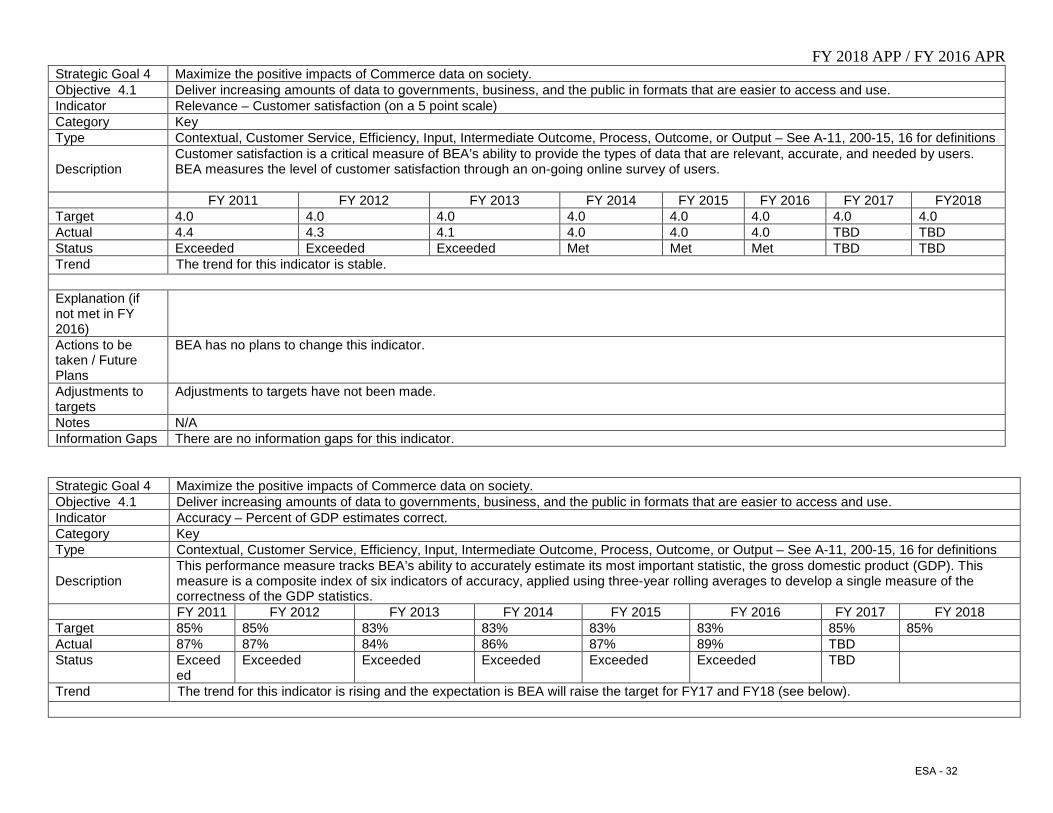
Strategic Goal 4 Maximize the positive impacts of Commerce data on society. Objective 4.1 Deliver increasing amounts of data to governments, business, and the public in formats that are easier to access and use. Indicator Relevance – Customer satisfaction (on a 5 point scale) Category Key Type Contextual, Customer Service, Efficiency, Input, Intermediate Outcome, Process, Outcome, or Output – See A-11, 200-15, 16 for definitions
Description Customer satisfaction is a critical measure of BEA’s ability to provide the types of data that are relevant, accurate, and needed by users. BEA measures the level of customer satisfaction through an on-going online survey of users.
FY 2011 FY 2012 FY 2013 FY 2014 FY 2015 FY 2016 FY 2017 FY2018 Target 4.0 4.0 4.0 4.0 4.0 4.0 4.0 4.0 Actual 4.4 4.3 4.1 4.0 4.0 4.0 TBD TBD Status Exceeded Exceeded Exceeded Met Met Met TBD TBD Trend The trend for this indicator is stable. Explanation (if not met in FY 2016)
Actions to be taken / Future Plans
BEA has no plans to change this indicator.
Adjustments to targets
Adjustments to targets have not been made.
Notes N/A Information Gaps There are no information gaps for this indicator.
Strategic Goal 4 Maximize the positive impacts of Commerce data on society. Objective 4.1 Deliver increasing amounts of data to governments, business, and the public in formats that are easier to access and use. Indicator Accuracy – Percent of GDP estimates correct. Category Key Type Contextual, Customer Service, Efficiency, Input, Intermediate Outcome, Process, Outcome, or Output – See A-11, 200-15, 16 for definitions
Description This performance measure tracks BEA’s ability to accurately estimate its most important statistic, the gross domestic product (GDP). This measure is a composite index of six indicators of accuracy, applied using three-year rolling averages to develop a single measure of the correctness of the GDP statistics.
FY 2011 FY 2012 FY 2013 FY 2014 FY 2015 FY 2016 FY 2017 FY 2018 Target 85% 85% 83% 83% 83% 83% 85% 85% Actual 87% 87% 84% 86% 87% 89% TBD Status Exceed
ed Exceeded Exceeded Exceeded Exceeded Exceeded TBD
Trend The trend for this indicator is rising and the expectation is BEA will raise the target for FY17 and FY18 (see below).
ESA - 32

FY 2018 APP / FY 2016 APR
Explanation (if not met in FY 2016) Not Applicable for the OMB submission.
Actions to be taken / Future Plans
BEA has no plans to change this indicator.
Adjustments to targets
Adjustment to FY2017. The increase in target reflects the successful outcome of a data improvement initiative to accelerate key Census Bureau data inputs into GDP. Revisions have been reduced and as a result BEA’s accuracy index is trending higher than average.
Notes Data available back to FY2007. Availability of the accuracy index will always lag fiscal year reporting since it is tied to GDP release timing (currently only available through CY 2016Q2).
Information Gaps There are no information gaps.
Strategic Goal 4 Maximize the positive impacts of Commerce data on society. Objective 4.1 Deliver increasing amounts of data to governments, business, and the public in formats that are easier to access and use. Indicator Complete all major strategic milestones related to improving economic accounts. Category Key Type Contextual, Customer Service, Efficiency, Input, Intermediate Outcome, Process, Outcome, or Output – See A-11, 200-15, 16 for definitions
Description
BEA must continually update its economic accounts to keep pace with the ever-changing U.S. and global economies. The BEA Five-Year Strategic Plan tracks BEA’s progress toward achieving the milestones related to this measure. In FY 2016, BEA completed all of its major milestones related to improving GDP and the economic accounts and expects to meet this target in current and future years.
FY 2011 FY 2012 FY 2013 FY 2014 FY 2015 FY 2016 FY 2017 FY 2018 Target Complete
Milestones Complete Milestones
Complete Milestones
Complete Milestones
Complete Milestones
Complete Milestones
Complete Milestones
Complete Milestones
Actual Completed Successfully
Completed Successfully
Completed Successfully
Completed Successfully
Completed Successfully
Completed Successfully
TBD TBD
Status Met Met Met Met Met Met TBD TBD Trend The trend for this indicator is stable. Explanation (if not met in FY 2016)
Actions to be taken / Future Plans
BEA has no plans to change this indicator.
Adjustments to targets
Adjustments to targets have not been made.
Notes N/A Information Gaps
There are no information gaps for this indicator.
Indicator Milestones met to explore and examine future economic data sources
ESA - 33

FY 2018 APP / FY 2016 APR
Category Other
Type Efficiency
Description
ESA collects much of its information to produce its economic datasets through extensive surveys, which are expensive and time consuming. The collection of data through surveys is becoming increasingly more difficult as the fewer people respond to surveys. In order to meet the needs of its customers, ESA will explore alternative ways to collect the information needed for current and future economic needs.
FY 2011 FY 2012 FY 2013 FY 2014 FY 2015 FY 2016 FY 2017 FY 2018
Target Meet with producers of economic data and discuss possible use by DOC
Explore agreements with
one or more producers of
economic data
Execute and monitor
agreements
Evaluate effectiveness of agreements and extend/modify/
cancel as appropriate
None
Actual Meetings occurred
Two agreements
under negotiation
Five agreements
under negotiation
TBD N/A
Status Met Met Met TBD N/A Trend Not enough data to produce a trend Actions to be taken/ Future Plans This indicator will be eliminated with the consolidation of ESA.
Adjustments to targets Adjustments to targets have not been made.
Notes Includes data from FY 2014 Information Gaps There are no information gaps for this indicator.
Indicator Milestones met to explore and examine future economic products and datasets Category Other
Type Efficiency
ESA - 34

FY 2018 APP / FY 2016 APR
Description
ESA collects much of its information to produce its economic datasets through extensive surveys, which are expensive and time consuming. Raw economic information is available from a host of sources. Private sector data providers use a number of techniques and sources of information for their products. ESA will explore these techniques and sources to determine which might be appropriate for obtaining raw economic information.
FY 2011 FY 2012 FY 2013 FY 2014 FY 2015 FY 2016 FY 2017 FY 2018 Target Identify staff
from BEA and Census to participate in the exploration and examination of future economic products and datasets
Develop a POA&M
Execute POA&M Execute POA&M None
Actual Staff identified
POA&M developed
POA&M executed
TBD N/A
Status Met Met Met TBD N/A Trend Not enough data to produce a trend Actions to be taken/ Future Plans This indicator will be eliminated with the consolidation of ESA.
Adjustments to targets Adjustments to targets have not been made.
Notes Includes data from FY 2014 Information Gaps There are no information gaps for this indicator.
Non-Recurring Indicators None. Other Indicators None.
ESA - 35

FY 2018 APP / FY 2016 APR
Resource Requirements Table
FY 2011
Actual FY 2012 Actual
FY 2013 Actual
FY 2014 Actual
FY 2015 Actual
FY 2016 Actual
FY 2017 CR Annualization
FY 2018 Base
Increase / Decrease
FY 2018 Request
Goal 4: Data: Maximize the positive impacts of Commerce data on society Total Funding 97.1 96 93.3 99.0 100.0 109.0 108.8 110.7 -14.0 97.0 Total FTE 513 483 450 450 470 499 501 501 -15 486
ESA - 36

Last Page
ESA - 37


![1728EX+ : Programming Guide - safe-tech · 02 ... Streamline section Streamline Streamline section Streamline section ... 1728EX+ : Programming Guide Keywords [English] Created Date:](https://img.dokumen.tips/doc/110x75/5b84d6a77f8b9aec488d14a4/1728ex-programming-guide-safe-02-streamline-section-streamline-streamline.jpg)