Embed Size (px)
Citation preview

U.S. CONSUMER CRASH TEST RESULTS AND INJURY RISK IN POLICE-REPORTED CRASHES
By
Stuart V. Newstead Charles M. Farmer
Sanjeev Narayan Maxwell H. Cameron
June 2002
Report No. 191
ACCIDENT RESEARCH CENTRE

ii MONASH UNIVERSITY ACCIDENT RESEARCH CENTRE

U.S. CONSUMER CRASH TEST RESULTS AND INJURY RISK IN POLICE-REPORTED CRASHES iii
MONASH UNIVERSITY ACCIDENT RESEARCH CENTRE REPORT DOCUMENTATION PAGE
Report No. Date ISBN Pages
191 June 2002 0 7326 1490 2 33 Title and sub-title: U.S. Consumer Crash Test Results And Injury Risk In Police-Reported Crashes Author(s): Stuart V. Newstead, Charles M. Farmer*, Sanjeev Narayan and Maxwell H. Cameron * Insurance Institute for Highway Safety, Arlington, Virginia U.S.A. Sponsoring Organisation(s): This project was funded through research contracts with: NRMA Ltd VicRoads Royal Automobile Club of Victoria Ltd Roads and Traffic Authority NSW Royal Automobile Club of Western Australia Ltd through a grant from Australian Transport Safety Bureau and through in kind support from Insurance Institute for Highway Safety Abstract: This paper considers relationships between recent U.S. frontal crash test results from the Insurance Institute for Highway Safety (IIHS) and USNCAP, and real-world crash injury risk estimates computed from police-reported crash data from three U.S. states. The frontal crash test results include dummy injury measures by body region from both IIHS offset tests and USNCAP full-width barrier tests plus measures of structural performance from the IIHS offset tests. Individually, results from the full-width and offset tests were not significantly correlated with the real-world injury risk estimates. Stronger relationships were found when a combination of overall ratings from the full frontal and offset tests was used. The current results find only weak correlations between both full-front and offset frontal crash test performance and the real-world injury risk estimates. These weak relationships likely reflect the lack of detail and fundamental difference in injury information in police crash reports compared to that used in deriving crashworthiness ratings from the crash tests.
Key Words: Disclaimer Vehicle safety, crashworthiness, crash test, data analysis, statistical analysis, vehicle occupant
This report is disseminated in the interest of information exchange. The opinions, findings, and conclusions expressed in this publication are those of the author(s) and do not necessarily reflect the views of the Insurance Institute for Highway Safety, Monash University or the project sponsors.
Reproduction of this page is authorised Monash University Accident Research Centre,
Wellington Road, Clayton, Victoria, 3800, Australia. Telephone: +61 3 9905 4371, Fax: +61 3 9905 4363

iv MONASH UNIVERSITY ACCIDENT RESEARCH CENTRE

U.S. CONSUMER CRASH TEST RESULTS AND INJURY RISK IN POLICE-REPORTED CRASHES v
Preface
Project Manager / Team Leader:
Stuart Newstead
Research Team:
• Charles M. Farmer (Insurance Institute for Highway Safety)
• Sanjeev Narayan
• Max Cameron

vi MONASH UNIVERSITY ACCIDENT RESEARCH CENTRE
Contents
EXECUTIVE SUMMARY......................................................................................................... IX
1 INTRODUCTION................................................................................................................. 1
2 METHODS .......................................................................................................................... 4
3 RESULTS.......................................................................................................................... 11
3.1 REAL-WORLD RISK ESTIMATES ..............................................................................11
3.2 EFFECTS OF RESTRAINT USE VARIABLE ON LOGISTIC MODELS........................14
3.3 MASS EFFECTS AND REAL-WORLD RISK ESTIMATES ..........................................14
3.4 CORRELATION OF BARRIER TEST MEASURES WITH REAL-WORLD RISK ESTIMATES.................................................................................................................16
3.5 LOGISTIC MODELLING OF USNCAP AND IIHS MEASURES ...................................23
4 DISCUSSION.................................................................................................................... 28
5 ACKNOWLEDGMENT ..................................................................................................... 31
6 REFERENCES.................................................................................................................. 32

U.S. CONSUMER CRASH TEST RESULTS AND INJURY RISK IN POLICE-REPORTED CRASHES vii
Figures
FIGURE 1 OBSERVED FRONTAL IMPACT CRASH REAL-WORLD RISK ESTIMATES VS. PREDICTED VALUES FROM
LOGISTIC REGRESSION MODEL ................................................................................................................25 FIGURE 2 OBSERVED ALL CRASH TYPE REAL-WORLD RISK ESTIMATES VS. PREDICTED VALUES FROM
LOGISTIC REGRESSION MODEL ................................................................................................................27
Tables
TABLE 1 STUDY VARIABLES COMMON TO FILES FROM ALL THREE U.S. STATES.......................................................... 5 TABLE 2 VEHICLE MODELS WITH IIHS AND USNCAP CRASH TEST RATINGS AND MORE THAN 100 CRASH-
INVOLVED AND 30 INJURED DRIVERS IN 1995-97 FLORIDA, OHIO, AND PENNSYLVANIA DATA.................. 7 TABLE 3 VEHICLE MODELS WITH IIHS AND USNCAP CRASH TEST RATINGS AND MORE THAN 100 CRASH-
INVOLVED AND 30 INJURED DRIVERS IN 1995-97 FLORIDA, OHIO, AND PENNSYLVANIA DATA – COMPLETE RECORDS ONLY ......................................................................................................................... 8
TABLE 4 REAL-WORLD RISK ESTIMATES BASED ON ALL CRASHES IN 1995-97FLORIDA, OHIO, AND
PENNSYLVANIA DATA – COMPLETE RECORDS ONLY..................................................................................12 TABLE 5 REAL-WORLD RISK ESTIMATES BASED ON FRONTAL IMPACTS IN 1995-97 FLORIDA AND PENNSYLVANIA
DATA – COMPLETE RECORDS ONLY ............................................................................................................13 TABLE 6 MASS ADJUSTED REAL-WORLD INJURY RISK ESTIMATES BASED ON CRASHES IN 1995-97 FLORIDA,
OHIO, AND PENNSYLVANIA DATA – RELIABLE ESTIMATES ONLY ...............................................................15 TABLE 7 USNCAP CRASH BARRIER TEST INJURY MEASURES OF VEHICLES WITH RELIABLE REAL-WORLD RISK
ESTIMATES .................................................................................................................................................17 TABLE 8 IIHS CRASH BARRIER TEST INJURY MEASURES OF VEHICLES WITH RELIABLE REAL-WORLD RISK
ESTIMATES .................................................................................................................................................18 TABLE 9 IIHS CRASH BARRIER TEST INTRUSION MEASURES OF VEHICLES WITH RELIABLE REAL-WORLD RISK
ESTIMATES .................................................................................................................................................19 TABLE 10 CORRELATION OF MASS ADJUSTED REAL-WORLD RISK ESTIMATES WITH US CRASH BARRIER TEST
RESULTS.....................................................................................................................................................21 TABLE 11 CORRELATION OF REAL-WORLD RISK ESTIMATES WITH AUSTRALIAN CRASH BARRIER TEST RESULTS
(ANCAP)...................................................................................................................................................21 TABLE 12 USNCAP AND IIHS CRASH BARRIER RATINGS OF VEHICLES WITH RELIABLE REAL-WORLD RISK
ESTIMATES .................................................................................................................................................22 TABLE 13 DISTRIBUTION OF MASS ADJUSTED REAL-WORLD RISK ESTIMATES BY BARRIER TEST RATING
CATEGORY .................................................................................................................................................23

viii MONASH UNIVERSITY ACCIDENT RESEARCH CENTRE

U.S. CONSUMER CRASH TEST RESULTS AND INJURY RISK IN POLICE-REPORTED CRASHES ix
EXECUTIVE SUMMARY
Consumer crash test programs provide comparative information on the crashworthiness of new vehicles, which, in turn should predict the performance of the same vehicles in real-world crashes. However, the detail and quality of available information from tests and real-world crashes differ widely, so identifying meaningful relationships between crash test results and real-world crashworthiness can be difficult. Despite these data limitations, studies in the late 1980s and mid-1990s reported positive correlations between dummy injury measures from the U.S. New Car Assessment Program (USNCAP) and real-world fatality rates. More recent analyses of results from Australian crash tests and real-world crashes also have found positive correlations.
The current paper considers relationships between recent U.S. frontal crash test results from the Insurance Institute for Highway Safety (IIHS) and USNCAP, and real-world crash injury risk estimates computed from police-reported crash data from three U.S. states. The frontal crash test results include dummy injury measures by body region from both IIHS offset tests and USNCAP full-width barrier tests plus measures of structural performance from the IIHS offset tests. Individually, results from the full-width and offset tests were not significantly correlated with the real-world injury risk estimates. Stronger relationships were found when a combination of overall ratings from the full frontal and offset tests was used. The current results find only weak correlations between both full-front and offset frontal crash test performance and the real-world injury risk estimates.
These weak relationships likely reflect the lack of detail and fundamental difference in injury information in police crash reports compared to that used in deriving crashworthiness ratings from the crash tests. Police-reported crash data have limited detail on injuries. For example, injuries coded as “serious” by police include significant numbers of injuries that would be classified as minor using the widely accepted Abbreviated Injury Scale (AIS). Also, injury severity is not coded by body region in police data. On the other hand, crash test ratings are based both on dummy measures, which indicate the likelihood of serious and life-threatening injuries to key specific body regions, and on vehicle deformation measures, which also are likely to be related to more serious injuries. Thus it is not necessarily surprising that these various crash test measures are only weakly correlated with real-world injury risk estimates, which are dominated by less serious injuries and cover all body regions. These findings highlight a need for better quality injury information in large-scale real-world crash databases.


U.S. CONSUMER CRASH TEST RESULTS AND INJURY RISK IN POLICE-REPORTED CRASHES 1
1 INTRODUCTION
The use of results from crash testing to provide consumers with comparative information on car crashworthiness began in 1979 with the U.S. New Car Assessment Program (USNCAP) conducted by the National Highway Traffic Safety Administration (NHTSA). The goals of the USNCAP are to enable consumers to shop for safer vehicles and, in turn, use this marketplace pressure to induce manufacturers to improve the designs of their vehicles. USNCAP frontal impact tests are conducted at 56.3 km/h (35 mph), with the full width of the front of the vehicle hitting a rigid crash barrier. Such a test simulates a head-on crash of two identical vehicles, each traveling at the same speed.
Instrumented dummies in the driver and front right passenger seating positions, restrained by the vehicle’s seat belts, record injury measures on the head, chest, and legs. The two key injury measures used to rate cars in USNCAP are the head injury criterion (HIC, a measure of the risk of head injury which is a function of the deceleration experienced by the dummy’s head during impact) and the chest acceleration measured on the dummy’s rigid spine. Other injury measures such as chest deflection and forces on the upper leg also are recorded but not used in the consumer ratings.
The expectation is that vehicles performing well in USNCAP will offer better protection to their occupants in serious real-world frontal crashes than vehicles with poor results. There have been a number of studies over the past 20 years attempting to relate USNCAP results to the subsequent real-world crash experience of the vehicles tested. Campbell (1982) and later Stewart and Rodgman (1985) compared early USNCAP results with police-reported serious and fatal injury rates in crashes in North Carolina, reporting no statistically significant relationships. Grush et al. (1983) attempted to correlate nationwide driver fatality rates with the HIC and chest acceleration measures from USNCAP, but they also failed to find statistically significant results. Zador et al. (1984) restricted attention to fatal head-on collisions between two cars of similar weight, i.e., the USNCAP paradigm. After accounting for the speed limits at the crash sites and the ages of the involved drivers, this study found a significant relationship between fatality risk and a combination of HIC and chest acceleration. Jones and Whitfield (1988) restricted attention to frontal impacts of cars into fixed objects in Texas. After accounting for crash severity, vehicle mass, and driver age, they reported a significant relationship between police reported serious injury risk and chest acceleration measured in crash tests.
Kahane et al. (1994), responding to a request from the U.S. Senate, studied 15 years of data on fatal two-car head-on collisions in which both drivers were restrained. In real-world crashes between a car with good USNCAP performance and one with poor performance, the driver of the good car was significantly less likely to die. The relationship was strongest when measures of HIC, chest acceleration, and femur loading were combined to classify good or poor performance. The U.S. General Accounting Office (GAO, 1995) studied a national sample of towaway crashes occurring over 4 years and all fatal crashes occurring over 10 years. Among the towaway crashes, GAO could find no convincing relationship between real-world injury risk and USNCAP injury measures, but the sample size was small. Among fatal crashes there was a significant relationship between fatality risk and USNCAP results.
In 1995, the Insurance Institute for Highway Safety (IIHS) began a second crash test-based consumer information program for U.S. vehicles. The IIHS test is an offset frontal crash into a deformable barrier, conducted at 64 km/h (40 mph). The impact is offset such that 40 percent of the front of the car on the driver’s side overlaps the barrier, and the barrier has a crushable aluminium element to simulate the effect of crashing into another vehicle. The impact severity is comparable to a car-to-car offset impact at about 60 km/h (37.5 mph).
2 MONASH UNIVERSITY ACCIDENT RESEARCH CENTRE
Estimates of injury risk in the IIHS offset test program are obtained from a restrained dummy in the driver seating position. Injury measures derived from the dummy readings include those in the USNCAP program plus several lower leg injury measures. The IIHS program also records a number of measures of deformation on the test vehicle after impact, including steering column displacement, brake pedal displacement, and measurements of instrument panel and footwell intrusion (IIHS 2000).
The IIHS and USNCAP tests are intended to be complementary. Rigid barrier crashes are especially demanding tests of occupant restraint systems, while offset impacts are more demanding tests of vehicle structures. Thus, full-front and offset crashes should complement each other to provide a more complete evaluation of frontal crashworthiness than either test alone.
From 1994 to November 1999, the Australian New Car Assessment Program (ANCAP) consisted of two components: a full-front test similar to USNCAP and an offset test similar to IIHS’s. Using motor vehicle crash data from the states of Victoria and New South Wales, Newstead and Cameron (1997, 1999), reported a number of relationships between the ANCAP test results and reported outcomes from real-world crashes. Chest, femur, and lower leg loadings on the ANCAP dummies were positively correlated with real-world risk estimates. While the results from full-front ANCAP tests showed some association with real-world crash outcomes, the associations between results from ANCAP offset tests and real-world crashes were much stronger. These differences, however, were much less pronounced when real-world crashes were restricted to two-car head-on collisions.
Consumer crash test programs such as USNCAP, IIHS offset testing, and Australian NCAP are prompting manufacturers to design their newer vehicles to obtain better results, and therefore better consumer ratings, in these programs. The oldest consumer information program, USNCAP, clearly has resulted in restraint system designs in today’s cars that produce much better consumer ratings than when the program began. Similarly, the IIHS offset testing program has prompted substantial improvements in the structural designs of newer vehicles.
A clear expectation from these programs is that vehicles with improved ratings will reduce occupant injury risk in serious real-world crashes. However, as noted earlier, efforts to correlate USNCAP ratings with results from real-world crashes have been mixed, with some studies reporting correlations and others not. Analyses of ANCAP results with real-world crash information did find positive correlations, and these were stronger for the results from offset tests than from flat-barrier tests. It could be tempting from this study to conclude that frontal offset testing -- and by implication vehicle structural designs -- are more important to occupant protection than flat-barrier testing and restraint systems. However, failures to find correlations between test results and real-world crash results may be due to inherent weaknesses in available real-world crash data rather than the irrelevance of test results to real-world crash injury risk. Alternately, it is also possible that a narrow range of performance in the full frontal test configuration across studied vehicles, such as occurred in the study of ANCAP tested vehicles, limited statistical power in the analyses attempted.
Ideal real-world crash data for studying correlations with test results would include, amongst other important predictors of injury outcome, accurate identification of the vehicles involved, good measures of both crash and injury severity, plus reliable information on belt use by crash-involved occupants. In the United States the real-world crash databases with samples large enough to study injury outcome differences among vehicle makes and models do not meet these ideal criteria. Large sample crash databases are derived from police crash reports,

U.S. CONSUMER CRASH TEST RESULTS AND INJURY RISK IN POLICE-REPORTED CRASHES 3
which do not have good injury or crash severity information. Nor do police crash reports include reliable belt use information.
Recognizing these limitations, the present study aimed to investigate relationships between real-world crash data and results from both the USNCAP and IIHS frontal crash test programs. To some extent, the analyses mimic the methods of Newstead and Cameron (1997, 1999).

4 MONASH UNIVERSITY ACCIDENT RESEARCH CENTRE
2 METHODS
In the United States, data available from police crash reports vary from state to state. So a necessary first step was to identify state crash files that met minimum criteria for data content. Reliable information on the specific makes and models and their model years is a necessary minimum requirement for any analysis of this type, so a key requirement was that the crash files include the vehicle identification numbers (VINs) of the involved vehicles. VINs can be decoded using special computer software to identify a vehicle’s make, model, and model year. Police crash files generally record an approximate measure of occupant injury severity, but measures of crash severity are not widely available. Some crash files do include information on the posted speed limit at the crash scene, and these can be used as rough surrogates for crash severity. For these analyses, information on driver age and gender, plus the number of vehicles involved in each crash also were needed.
Three states were identified as having the required data in their crash files: Florida, Ohio, and Pennsylvania. In each state, there were valid VINs for more than 70 percent of the crash-involved passenger vehicles plus information on driver age, gender, and injury severity for both injured and uninjured drivers. Crash data from each of the three states were available for the years 1995-97, the first three years of the IIHS offset barrier test program.
Information on drivers of passenger vehicles involved in police-reported crashes in Florida, Ohio, and Pennsylvania during 1995-97 was extracted from the State Data System maintained by the National Highway Traffic Safety Administration. This system contains police-reported crash data submitted annually by 17 U.S. states and modified to a common file structure (NHTSA, 1997).
Both the USNCAP and IIHS offset barrier test programs are designed to compare occupant protection in serious frontal impacts. This raises the question of whether attempts to correlate crash test results with real-world crash outcomes should be restricted to certain crash types such as two-vehicle head-on crashes or frontal crashes into fixed objects. Or should the correlations address all crash types? The present study examined vehicles in real-world crashes of all types as well as only in frontal impacts. The crash files of Florida and Pennsylvania contain information on direction of impact, but not those of Ohio. Therefore, the real-world risk estimates for frontal impacts were based on only Florida and Pennsylvania.
Before the crash data files from the three states were combined for analysis, variables common to each file were identified. In addition to speed limit, number of vehicles involved, and driver information (age, gender, and police-reported injury severity), four other variables were judged to be potentially useful covariates of injury risk: collision type, indicators of whether the crash occurred in an urban location or at an intersection, and level of damage to the vehicle. The nine study variables common to all three states are listed in Table 1, along with the recoded levels used within each variable. The police-reported levels of injury severity as given in Table 1 were further collapsed to three levels of injury severity; levels 1 (fatal injury) and 2 (incapacitating injury) corresponded to the fatal/serious injury category, level 3 (minor injury) corresponded to the minor injury group, and levels 4 (pain/no visible injury) and 5 (no injury) corresponded to the no injury group.

U.S. CONSUMER CRASH TEST RESULTS AND INJURY RISK IN POLICE-REPORTED CRASHES 5
Table 1 Study Variables Common to Files From All Three U.S. States
Variable Description Variable Study Name Final Coding
Age of driver Age 1-≤25years 2-26-59years 3-≥60years 9-Unknown
Gender of driver Gender 1-Male 2-Female 9-Unknown
Collision type Col_type 1-Rear-end 2-Head-on 3-Angle 4-Other 9-Unknown
Speed limit at crash location Spd_lim 1-<50mph 2-≥50mph 9-Unknown
Number of vehicles involved Num_veh 1-Single Vehicle, 2-Multiple Vehicle 9-Unknown
Urbanization of crash location Rur_urb 1-Rural 2-Urban 9-Unknown
Intersection crash indicator Int_type 1-Intersection 2-Non-intersection 3-Other 9-Unknown
Level of damage to vehicle Veh_dam 1-Disabling 2-Functional 3-No damage 9-Unknown
Police-recorded severity of injury to driver Inj_sev 1-Fatal 2-Incapacitating 3-Minor 4-Pain/no visible injury 5-No injury 9-Unknown
It is important to recognize that, except for fatal injuries, a number of studies examining specific jurisdictions have found that police-reported measures of injury severity do not correlate well with generally accepted measures of injury severity such as the Abbreviated Injury Scale (AIS). In fact, studies have repeatedly shown that many injuries recorded by police as serious would not be rated as such according to AIS, (Sherman et al., 1976; Rosman and Knuiman, 1994; Austin, 1995; Greenberg, 1996). This is perhaps not surprising given serious injury in police reported crash data is usually defined as injury requiring a certain

6 MONASH UNIVERSITY ACCIDENT RESEARCH CENTRE
level of assistance in contrast to the AIS scale that essentially measures the likelihood of death from the injury. In the United States, for example, a police-reported incapacitating injury is typically defined as one that “prevents the injured person from walking, driving, or normally continuing the activities the person was capable of performing before the injury occurred” (ANSI, 1996). Despite the noted differences between the two injury scales, many of the studies comparing AIS with police reported injury severity have found a significant correlation between the two scales. In other words, injuries coded serious by police have higher AIS scores on average than injuries coded minor. The difficulty for studies such as this one, however, is that for any particular level of police reported injury severity there is a high variance in the corresponding AIS levels, plus police-reported injuries do not identify injured body regions. This latter limitation is important because crash test rating systems rate serious head injuries much higher than a fractured ankle, for example, but police reports likely would code both injuries as “incapacitating.”
The real-world risk estimates used in this analysis to correlate with crash test ratings are measures of the risk of serious injury to a driver and defined to be the product of two probabilities (Cameron et al., 1992): (i) the probability that a driver involved in a crash is injured (injury frequency, where injury means levels 1-3) and (ii) the probability that an injured driver has a serious or fatal injury (injury severity). Measuring crashworthiness injury risk in this way was first developed by researchers at Folksam Insurance (Gustafsson et al., 1989). Each of the two probabilities was estimated by logistic regression modelling techniques. Such techniques are able to simultaneously adjust for the effect of a number of factors (such as driver age and gender, number of vehicles involved, etc.) on the probability estimated of injury frequency and injury severity.
Test data from both the IIHS offset crash test program and the NHTSA full-front program were available for 66 vehicle models. To ensure convergence of the statistical procedures used in estimating real-world injury risk, analyses were restricted to those vehicles with more than 100 real-world crashes with driver involvement and more than 30 cases of driver injury appearing in the data. The 39 vehicle models that met these criteria are listed in Table 2.
All nine variables listed in Table 1 were used in the statistical models estimating real-world injury risk, so records with missing values on any of these variables were necessarily excluded. Table 3 gives the number of involved and injured drivers of IIHS crash-barrier-tested vehicles for which there were sufficient and complete real-world crash data to be included in the analyses. The number of cases for all crash types and frontal impact crashes are shown separately. There were 39 and 33 vehicle models crash-barrier-tested under the IIHS and USNCAP programs with sufficient real crash data from all crash types and frontal impact crashes, respectively, to be included in the analyses. The 1997-98 Mitsubishi Mirage, 1997-98 Nissan Maxima, 1995-97 Volkswagen Passat, 1995-98 Honda Odyssey/Isuzu Oasis, 1996-97 Isuzu Rodeo/Honda Passport, and 1996-97 Toyota 4Runner had insufficient numbers of injured drivers to be included in frontal impact crash analyses.

U.S. CONSUMER CRASH TEST RESULTS AND INJURY RISK IN POLICE-REPORTED CRASHES 7
Table 2 Vehicle Models with IIHS and USNCAP Crash Test Ratings and More Than 100 Crash-Involved and 30 Injured Drivers in 1995-97 Florida, Ohio, and Pennsylvania Data
All Crashes Frontal Impact
Crash Type and Make/Model Model Years
Involved Drivers
Injured Drivers
Involved Drivers
Injured Drivers
Small Cars
Dodge/Plymouth Neon four-door 1995-98 11,472 1,532 4,462 840 Ford Escort/Mercury Tracer four-door 1997-98 3,017 370 1,150 186 Honda Civic four-door 1996-98 2,841 254 878 118 Hyundai Elantra four-door 1996-98 546 68 240 40 Kia Sephia four-door 1996-97 853 120 470 73 Mazda Protege four-door 1995-98 2,490 280 1,170 179 Mitsubishi Mirage four-door 1997-98 356 40 168 24 Saturn SL four-door 1995-98 8,355 856 2,814 419 Volkswagen Jetta/Golf four-door 1994-98 3,830 492 1,812 308
Midsize Four-Door Cars
Chevrolet Cavalier/Pontiac Sunfire 1995-98 6,151 697 2,180 328 Chrysler Cirrus/Dodge Stratus/Plymouth Breeze 1995-98 5,354 486 1,759 225 Ford Contour/Mercury Mystique 1995-98 8,808 966 2,417 442 Honda Accord 1994-97 15,953 1,207 5,467 579 Hyundai Sonata 1995-98 860 78 343 40 Mazda Millenia 1995-98 1,063 83 416 40 Mitsubishi Galant 1994-98 4,362 441 2,080 251 Nissan Maxima 1995-96 4,090 348 1,719 199 Nissan Maxima 1997-98 538 43 256 27 Toyota Avalon 1995-97 1,557 125 523 68 Toyota Camry 1994-96 13,740 1,448 5,570 780 Toyota Camry 1997-98 1,962 147 718 69 Volkswagen Passat 1995-97 348 42 150 30 Volvo 850/S70 1995-98 721 65 296 36
Large Family Cars
Chevrolet Lumina four-door 1995-98 8,063 615 2,360 266 Ford Taurus/Mercury Sable four-door 1992-95 26,675 2,627 8,064 1,307 Ford Taurus/Mercury Sable four-door 1996-98 6,970 574 2,193 265
Large Luxury Cars
Cadillac Seville four-door 1993-97 1,976 132 617 56 Lincoln Continental four-door 1995-98 723 71 225 40
Passenger Vans
Chevrolet Astro/GMC Safari 1996-98 1,072 86 384 39 Dodge Grand Caravan/Plymouth Grand Voyager/
Chrysler Town & Country 1996-98 8,039 519 2,421 254
Ford Aerostar 1992-97 3,535 285 1,053 115 Ford Windstar 1995-98 7,719 749 2,208 382 Honda Odyssey/Isuzu Oasis 1995-98 632 33 197 14 Nissan Quest/Mercury Villager 1996-98 1,148 79 331 39
Midsize Utility Vehicles
Chevrolet Blazer/GMC Jimmy/Oldsmobile Bravada 1995-98 7,225 495 1,655 185 Ford Explorer/Mercury Mountaineer 1995-98 4,628 404 1,183 162 Isuzu Rodeo/Honda Passport 1996-97 501 36 92 13 Jeep Grand Cherokee 1996-98 2,605 158 660 70 Toyota 4-Runner 1996-97 525 45 197 20
All 1990-98 passenger vehicles with airbags 798,360 76,612 277,485 37,986

8 MONASH UNIVERSITY ACCIDENT RESEARCH CENTRE
Table 3 Vehicle Models with IIHS and USNCAP Crash Test Ratings and More Than 100 Crash-Involved and 30 Injured Drivers in 1995-97 Florida, Ohio, and Pennsylvania Data – Complete Records Only
All Crashes Frontal Impact
Crash Type and Make/Model Model Years
Involved Drivers
Injured Drivers
Involved Drivers
Injured Drivers
Small Cars
Dodge/Plymouth Neon four-door 1995-98 9,895 1,420 3,912 793 Ford Escort/Mercury Tracer four-door 1997-98 2,518 340 961 169 Honda Civic four-door 1996-98 2,407 239 750 107 Hyundai Elantra four-door 1996-98 454 59 197 35 Kia Sephia four-door 1996-97 713 113 399 69 Mazda Protege four-door 1995-98 2,062 263 990 169 Mitsubishi Mirage four-door 1997-98 289 37 137 23 Saturn SL four-door 1995-98 7,294 800 2,500 397 Volkswagen Jetta/Golf four-door 1994-98 3,384 463 1,635 289
Midsize Four-Door Cars
Chevrolet Cavalier/Pontiac Sunfire 1995-98 5,163 652 1,864 313 Chrysler Cirrus/Dodge Stratus/Plymouth Breeze 1995-98 4,588 448 1,531 208 Ford Contour/Mercury Mystique 1995-98 7,536 914 2,081 419 Honda Accord 1994-97 13,406 1,115 4,602 536 Hyundai Sonata 1995-98 702 73 286 39 Mazda Millenia 1995-98 879 76 349 37 Mitsubishi Galant 1994-98 3,634 409 1,755 233 Nissan Maxima 1995-96 3,503 317 1,483 182 Nissan Maxima 1997-98 456 42 218 26 Toyota Avalon 1995-97 1,308 119 451 65 Toyota Camry 1994-96 11,615 1,333 4,738 715 Toyota Camry 1997-98 1,572 136 579 61 Volkswagen Passat 1995-97 307 41 127 29 Volvo 850/S70 1995-98 629 64 268 36
Large Family Cars
Chevrolet Lumina four-door 1995-98 6,901 584 2,046 252 Ford Taurus/Mercury Sable four-door 1992-95 23,303 2,463 7,148 1,231 Ford Taurus/Mercury Sable four-door 1996-98 5,923 528 1,896 245
Large Luxury Cars
Cadillac Seville four-door 1993-97 1,707 126 542 55 Lincoln Continental four-door 1995-98 613 64 197 37
Passenger Vans
Chevrolet Astro/GMC Safari 1996-98 857 79 326 34 Dodge Grand Caravan/Plymouth Grand Voyager/
Chrysler Town & Country 1996-98 6,980 485 2,145 235
Ford Aerostar 1992-97 3,052 262 922 104 Ford Windstar 1995-98 6,722 710 1,938 360 Honda Odyssey/Isuzu Oasis 1995-98 547 33 171 14 Nissan Quest/Mercury Villager 1996-98 970 73 283 37
Midsize Utility Vehicles
Chevrolet Blazer/GMC Jimmy/Oldsmobile Bravada 1995-98 6,452 466 1,525 179 Ford Explorer/Mercury Mountaineer 1995-98 4,140 382 1,101 157 Isuzu Rodeo/Honda Passport 1996-97 436 31 81 12 Jeep Grand Cherokee 1996-98 2,298 150 604 69 Toyota 4-Runner 1996-97 463 42 178 18 All 1990-98 passenger vehicles with airbags 680,810 71,457 239,923 35,540

U.S. CONSUMER CRASH TEST RESULTS AND INJURY RISK IN POLICE-REPORTED CRASHES 9
Vehicle mass has been identified as an important factor affecting crashworthiness. While vehicle mass was available in the crash data files, its effect has not been controlled in the logistic regression analyses. This was because experience with the data available for analysis here showed that including vehicle mass as a covariate in the logistic regression analyses proved difficult, creating convergence problems in the model fitting process. An alternative method of considering the effects of mass was developed by Craggs and Wilding (1995).
In short, this method involves fitting a linear regression model of vehicle mass against the real-world risk estimates, with the estimated regression line at a given mass representing the average real-world risk for all vehicles of that mass. Vehicle models with real-world risk lying below the mass regression line represent those that exhibit greater driver protection than average for their given mass while those lying above are vehicles that offer worse than average driver protection for their mass. Mass adjusted real-world risk estimates are calculated by subtracting the average risk for a given vehicle mass, estimated from the regression equation, from the original risk, then adding this to the average risk for all vehicles. Unlike Craggs and Wilding (1995), who used linear regression for their mass adjustment curve, here a logistic regression curve was used.
Combining the results of crash barrier testing into a single rating has been used by a number of authors as a means of summarizing multiple readings on a single crash dummy (Kahane et al., 1994; Zador et al., 1984). One particular single index of crash barrier test results stems from the work of Viano and Arepally (1990), who derived injury risk functions from relating crash dummy responses to biomechanical data for assessing safety performance of vehicles in crash tests. This summary is used in the USNCAP program for presentation of test results.
The equations derived by Viano and Arepally (1990) relating the probability of an AIS 4 or greater injury (serious, life threatening injury or worse, (see AAAM, 1985) for a description of AIS) to HIC and chest acceleration (Chest Gs) respectively are;
Phead = [1 + exp(5.02 – 0.00351 × HIC)]-1,
and
Pchest = [1 + exp(5.55 – 0.0693 × Chest Gs)]-1.
Similarly, the equation relating the probability of an AIS 3 or greater injury (severe, but not life threatening, injury or worse) to maximum femur loading is
Pfemur = [1 + exp(7.59 – 0.00294 × Femur Loading)]-1,
where Femur Loading is the greater of the measurements from both legs and is expressed in pounds.
The probabilities Phead and Pchest can been used together to calculate a combined probability of AIS 4 or greater injury to the head or chest. Phead,chest is calculated by applying the law of additive probability for independent but non-mutually exclusive events (Mendenhall et al. 1986). This gives
Phead,chest = Phead + Pchest – (Phead × Pchest).
This combined probability is the basis for NHTSA star ratings. For example, a vehicle receives five stars in the USNCAP evaluation if Phead,chest does not exceed 0.10. Combining the probabilities of severe head and chest injuries in this way reflects the fact that an individual suffering injuries to at least one body region has a higher risk of death or disability

10 MONASH UNIVERSITY ACCIDENT RESEARCH CENTRE
than if injury to only one body region was sustained. It should be noted, however, that this combination method assumes injury to the head and chest are independent events.
Extending this logic, and again assuming independence of the injury events for each body region, the combined probability of sustaining one or more of an AIS 4 or greater head or chest injury or an AIS 3 or greater leg injury, Phead,chest,femur, would be
Phead,chest,femur = Phead + Pchest + Pfemur– (Phead × Pchest) – (Phead × Pfemur) – (Pchest × Pfemur)
+ (Phead × Pchest × Pfemur).
In order to assess the relationship between crash barrier test results and real crashes outcomes, the mass-adjusted real-world risk estimates were correlated (using Pearson’s correlation coefficient) with individual measurements from the USNCAP and IIHS barrier tests, as well as the combined probabilities of severe head, chest, or leg injuries. A more complex modeling procedure similar to that used by Jones and Whitfield (1988) was also explored. These multivariate models included combinations of USNCAP and IIHS scores as potential predictors of real-world risk.

U.S. CONSUMER CRASH TEST RESULTS AND INJURY RISK IN POLICE-REPORTED CRASHES 11
3 RESULTS
3.1 REAL-WORLD RISK ESTIMATES
Four logistic regression analyses were completed in order to compute real-world risk estimates. Injury frequency in all crashes and frontal impacts was estimated from analyses of the 680,810 drivers of vehicles in police-reported crashes of all types and the 239,923 drivers of vehicles involved in frontal impact crashes. Injury severity in all crashes and frontal impacts was estimated from analyses of the 71,457 drivers injured in crashes of all types and the 35,540 drivers injured in frontal impact crashes. In all four analyses the effects of driver age and gender, speed limit, rural/urban, intersection indicator, and vehicle damage severity were statistically significant, as well as certain first order interactions. Number of vehicles in the crash was significantly related to injury frequency, but not injury severity.
Tables 4 and 5 show the real-world risk estimates resulting from multiplication of the injury frequency and injury severity estimates for all crashes and frontal impacts, respectively. Injury severity estimates were typically about twice as big as injury frequency estimates, so the vehicles with high injury severity estimates also had high real-world risk. For example, the 1995-98 Hyundai Sonata had injury frequency and severity estimates for all crashes of 0.100 and 0.258, respectively. The average injury frequency and severity estimates for all vehicles were 0.106 and 0.208, respectively. The real-world risk estimate for the Sonata was therefore relatively high: 2.58 percent of crash-involved Sonata drivers had serious or fatal injuries compared to 2.20 percent of all crash-involved drivers.
A more straightforward procedure for computing real-world risk would have been to estimate the probability of police-reported serious injury to a crash-involved driver directly using a single logistic regression. Such single-stage estimates were computed and compared to the two-stage estimates of Tables 4-5. There were slight differences, but in general the relative risks of vehicles were preserved. For example, the single-stage risk estimate of the Hyundai Sonata was 2.65 percent, still relatively high. Despite the similarities in results, the two-stage procedure was judged to be more reliable than the single-stage procedure because it allowed for the driver and crash environment variables (Table 1) to relate in different ways to injury frequency and injury severity. In addition, the studies of the relationship between ANCAP and real outcomes found different associations between each of the real world risk components and the barrier test measures, with real crash injury severity found to have a much stronger association. As noted, the injury severity measure largely determined the real world risk in this study, hence it was decided to use the real world risk estimate as the primary measure of real crash outcome for comparison with the barrier test measures.
Upper and lower 95 percent confidence limits for each risk estimate are also given in Tables 4-5. A few vehicle models, even though they had sufficient crash exposure to be included in the study, had unusually wide confidence intervals around their real-world injury risk estimates. The purpose of this study was not just to estimate risk, but to investigate the relationship between the real-world risk estimates and barrier crash test results. Therefore, it was necessary to have precise estimates of real-world risk. It was decided that any risk estimate with a confidence interval more than twice as wide as either the estimate itself or the average estimate of all vehicles would be considered imprecise, and would be excluded from further analyses. Thus the Nissan Quest/Mercury Villager and Isuzu Rodeo/Honda Passport were excluded from all further analyses. For the same reason, the frontal impact risk estimate for the Lincoln Continental was excluded from analysis.

12 MONASH UNIVERSITY ACCIDENT RESEARCH CENTRE
Table 4 Real-World Risk Estimates Based on All Crashes In 1995-97Florida, Ohio, And Pennsylvania Data – Complete Records Only
Make/Model Model Years
Real-World Risk Estimate
95 Percent Confidence Limits
Small Cars
Dodge/Plymouth Neon 4D 1995-98 2.7 2.4 3.0 Ford Escort/Mercury Tracer 4D 1997-98 2.5 1.9 3.2 Honda Civic 4D 1996-98 1.9 1.4 2.5 Hyundai Elantra 4D 1996-98 2.5 1.4 4.5 Kia Sephia 4D 1996-97 4.5 3.3 6.3 Mazda Protege 4D 1995-98 2.9 2.3 3.8 Mitsubishi Mirage 4D 1997-98 2.5 1.3 4.9 Saturn SL 4D 1995-98 2.4 2.1 2.8 Volkswagen Jetta/Golf 4D 1994-98 2.4 1.9 3.0
Midsize 4-Door Cars
Chevrolet Cavalier/Pontiac Sunfire 1995-98 2.5 2.1 3.0 Chrysler Cirrus/Dodge Stratus/Plymouth Breeze 1995-98 2.1 1.7 2.6 Ford Contour/Mercury Mystique 1995-98 2.6 2.2 3.0 Honda Accord 1994-97 1.8 1.6 2.1 Hyundai Sonata 1995-98 2.6 1.6 4.1 Mazda Millenia 1995-98 1.9 1.2 3.1 Mitsubishi Galant 1994-98 2.7 2.2 3.3 Nissan Maxima 1995-96 2.2 1.7 2.7 Nissan Maxima 1997-98 2.2 1.1 4.1 Toyota Avalon 1995-97 2.0 1.4 3.0 Toyota Camry 1994-96 2.2 1.9 2.5 Toyota Camry 1997-98 2.3 1.6 3.2 Volkswagen Passat 1995-97 2.5 1.2 5.2 Volvo 850/S70 1995-98 2.3 1.4 4.0
Large Family Cars
Chevrolet Lumina 4D 1995-98 1.8 1.5 2.2 Ford Taurus/Mercury Sable 4D 1992-95 2.1 1.9 2.3 Ford Taurus/Mercury Sable 4D 1996-98 2.0 1.6 2.4
Large Luxury Cars
Cadillac Seville 4D 1993-97 1.1 0.7 1.7 Lincoln Continental 4D 1995-98 2.6 1.6 4.4
Passenger Vans
Chevrolet Astro/GMC Safari 1996-98 2.4 1.6 3.8 Dodge Grand Caravan/Plymouth Grand Voyager/
Chrysler Town & Country 1996-98 1.5 1.2 1.8
Ford Aerostar 1992-97 2.0 1.5 2.6 Ford Windstar 1995-98 2.0 1.6 2.4 Honda Odyssey/Isuzu Oasis 1995-98 1.4 0.7 3.0 Nissan Quest/Mercury Villager 1996-98 0.3* 0.1 1.1
Midsize Utility Vehicles
Chevrolet Blazer/GMC Jimmy/Oldsmobile Bravada 1995-98 1.7 1.3 2.1 Ford Explorer/Mercury Mountaineer 1995-98 1.2 0.9 1.7 Isuzu Rodeo/Honda Passport 1996-97 0.6* 0.1 2.3 Jeep Grand Cherokee 1996-98 1.5 1.0 2.2 Toyota 4-Runner 1996-97 1.4 0.6 2.9
*Width of confidence interval more than twice the risk estimate

U.S. CONSUMER CRASH TEST RESULTS AND INJURY RISK IN POLICE-REPORTED CRASHES 13
Table 5 Real-World Risk Estimates Based on Frontal Impacts in 1995-97 Florida and Pennsylvania data – Complete records only
Make/Model Model Years
Real-World Risk Estimate
95 Percent Confidence Limits
Small Cars
Dodge/Plymouth Neon 4D 1995-98 3.9 3.3 4.6 Ford Escort/Mercury Tracer 4D 1997-98 3.5 2.5 4.9 Honda Civic 4D 1996-98 2.6 1.7 4.0 Hyundai Elantra 4D 1996-98 4.2 2.1 8.3 Kia Sephia 4D 1996-97 5.5 3.6 8.4 Mazda Protege 4D 1995-98 3.9 2.9 5.3 Mitsubishi Mirage 4D 1997-98 n/a n/a n/a Saturn SL 4D 1995-98 3.8 3.1 4.7 Volkswagen Jetta/Golf 4D 1994-98 3.7 2.8 4.9
Midsize 4-Door Cars
Chevrolet Cavalier/Pontiac Sunfire 1995-98 4.1 3.3 5.2 Chrysler Cirrus/Dodge Stratus/Plymouth Breeze 1995-98 3.7 2.8 4.8 Ford Contour/Mercury Mystique 1995-98 4.3 3.5 5.4 Honda Accord 1994-97 2.6 2.2 3.2 Hyundai Sonata 1995-98 2.7 1.4 5.5 Mazda Millenia 1995-98 1.6 0.7 3.7 Mitsubishi Galant 1994-98 3.6 2.8 4.7 Nissan Maxima 1995-96 3.4 2.6 4.6 Nissan Maxima 1997-98 n/a n/a n/a Toyota Avalon 1995-97 3.3 2.0 5.5 Toyota Camry 1994-96 3.0 2.5 3.6 Toyota Camry 1997-98 2.9 1.8 4.6 Volkswagen Passat 1995-97 n/a n/a n/a Volvo 850/S70 1995-98 3.3 1.7 6.6
Large Family Cars
Chevrolet Lumina 4D 1995-98 3.1 2.4 4.0 Ford Taurus/Mercury Sable 4D 1992-95 3.8 3.3 4.3 Ford Taurus/Mercury Sable 4D 1996-98 2.4 1.7 3.2
Large Luxury Cars
Cadillac Seville 4D 1993-97 2.1 1.2 3.7 Lincoln Continental 4D 1995-98 6.2** 3.5 11.2
Passenger Vans
Chevrolet Astro/GMC Safari 1996-98 3.4 1.9 6.2 Dodge Grand Caravan/Plymouth Grand Voyager/
Chrysler Town & Country 1996-98 3.0 2.3 3.8
Ford Aerostar 1992-97 3.0 2.1 4.3 Ford Windstar 1995-98 3.3 2.5 4.3 Honda Odyssey/Isuzu Oasis 1995-98 n/a n/a n/a Nissan Quest/Mercury Villager 1996-98 0.6* 0.2 2.5
Midsize Utility Vehicles
Chevrolet Blazer/GMC Jimmy/Oldsmobile Bravada 1995-98 3.1 2.3 4.3 Ford Explorer/Mercury Mountaineer 1995-98 2.1 1.3 3.2 Isuzu Rodeo/Honda Passport 1996-97 n/a n/a n/a Jeep Grand Cherokee 1996-98 3.0 1.8 4.9 Toyota 4-Runner 1996-97 n/a n/a n/a *Width of confidence interval more than twice the risk estimate
**Width of confidence interval more than twice the average risk estimate for all vehicles (3.4)

14 MONASH UNIVERSITY ACCIDENT RESEARCH CENTRE
3.2 EFFECTS OF RESTRAINT USE VARIABLE ON LOGISTIC MODELS
Usage of seat belts is related to both injury frequency and injury severity. However, the coding of seat belt use in real-world crash reports is suspect. Restraint use is often self-reported, even in many serious crashes, and drivers frequently claim to have been belted when they were not. In the United States belt use rates are much lower than in Australia so the resultant miscoding of belt use is a greater problem with the U.S. crash data. Of the 637,612 drivers in this study for whom restraint use was coded, 94 percent were coded as belted. This result clearly indicates this miscoding problem. The 1998 National Occupant Protection Use Survey (NOPUS) reported only 72 percent belt use among drivers of passenger cars in the U.S., and state surveys indicate that use in Florida and Ohio is below the national average. Plus, studies have repeatedly documented that belt use by occupants involved in crashes is lower than observed in traffic. Despite the limitations of these data injury frequency, injury severity, and real-world risk were recomputed including restraint use as a factor in the logistic regression models. Due to missing values for restraint use, the Honda Odyssey/Isuzu Oasis and Isuzu Rodeo/Honda Passport no longer met the model inclusion criteria. Restraint use was significantly associated with both injury frequency and injury severity, and injury frequency was higher for unrestrained drivers. Real-world risk estimates based on models including reported restraint use were slightly higher than the real-world risk of Table 4 for 17 of the 37 vehicles, slightly lower than Table 4 for 16 vehicles, and identical to Table 4 for the other 4 vehicles. The Pearson correlation between the risk estimates based on models including restraint use and those of Table 4 was 0.97, indicating that the restraint use variable would have little effect on the estimates.
In order to take advantage of as much data as possible, all further results in this paper used the risk estimates based on models not including restraint use (Table 4-5).
3.3 MASS EFFECTS AND REAL-WORLD RISK ESTIMATES
Mass adjustment of real-world risk estimates was accomplished by approximating the relationship between the real-world risk estimates in Tables 4-5 and the respective vehicle masses. The approximate relationship for all crashes was
Risk = 100 × exp(-3.215 – 0.00018 × Mass) / (1 + exp(-3.215 – 0.00018 × Mass)).
Therefore, the expected risk for vehicles weighing 2,438 pounds (such as the Dodge Neon four-door car) was 2.524. The actual risk estimate for the Neon was 2.687, so the Neon had a risk estimate 0.163 points higher than expected based on its mass. In order to make it comparable to vehicles of different masses, the Neon was assigned a mass-adjusted risk equal to this difference between actual and expected risk added to the average expected risk for all vehicles. The average expected risk (based on the above equation) for all vehicles in the study was 2.221. Thus the mass-adjusted risk estimate for the Dodge Neon was 2.384.
The approximate relationship between risk estimates and mass for frontal impacts was
Risk = 100 × exp(-2.7645 – 0.00018 × Mass) / (1 + exp(-2.7645 – 0.00018 × Mass)).
The expected risk for vehicles weighing 2,438 pounds was 3.904. The actual risk estimate for the Dodge Neon was 3.933, so the Neon had a risk estimate 0.029 points higher than expected based on its mass. The average expected risk for all front-impacted vehicles in the study was 3.474. Thus the mass-adjusted risk estimate for the Dodge Neon was 3.503.

U.S. CONSUMER CRASH TEST RESULTS AND INJURY RISK IN POLICE-REPORTED CRASHES 15
The same procedure was used to adjust the real-world risk estimates of all other vehicles in the study with sufficiently narrow confidence intervals. Table 6 lists the mass-adjusted real-world risk estimates. As would be expected in general the mass adjustment lowered risk estimates for small vehicles and raised risk estimates for larger vehicles.
Table 6 Mass Adjusted Real-World Injury Risk Estimates Based on Crashes in 1995-97 Florida, Ohio, and Pennsylvania Data – Reliable Estimates Only
Model Mass Adjusted Injury Risk Estimate
Make/Model Years All Crashes Frontal Impact
Small Cars
Dodge/Plymouth Neon 4D 1995-98 2.4 3.5 Ford Escort/Mercury Tracer 4D 1997-98 2.2 3.1 Honda Civic 4D 1996-98 1.5 2.1 Hyundai Elantra 4D 1996-98 2.2 3.7 Kia Sephia 4D 1996-97 4.2 5.1 Mazda Protege 4D 1995-98 2.6 3.4 Mitsubishi Mirage 4D 1997-98 2.1 n/a Saturn SL 4D 1995-98 2.1 3.3 Volkswagen Jetta/Golf 4D 1994-98 2.1 3.4
Midsize 4-Door Cars
Chevrolet Cavalier/Pontiac Sunfire 1995-98 2.3 3.9 Chrysler Cirrus/Dodge Stratus/Plymouth Breeze 1995-98 2.1 3.6 Ford Contour/Mercury Mystique 1995-98 2.4 4.1 Honda Accord 1994-97 1.7 2.5 Hyundai Sonata 1995-98 2.5 2.6 Mazda Millenia 1995-98 1.9 1.7 Mitsubishi Galant 1994-98 2.5 3.4 Nissan Maxima 1995-96 2.1 3.4 Nissan Maxima 1997-98 2.1 n/a Toyota Avalon 1995-97 2.1 3.4 Toyota Camry 1994-96 2.1 2.9 Toyota Camry 1997-98 2.2 2.8 Volkswagen Passat 1995-97 2.4 n/a Volvo 850/S70 1995-98 2.3 3.3
Large Family Cars
Chevrolet Lumina 4D 1995-98 1.9 3.2 Ford Taurus/Mercury Sable 4D 1992-95 2.0 3.8 Ford Taurus/Mercury Sable 4D 1996-98 2.0 2.5
Large Luxury Cars
Cadillac Seville 4D 1993-97 1.3 2.5 Lincoln Continental 4D 1995-98 2.9 n/a
Passenger Vans
Chevrolet Astro/GMC Safari 1996-98 2.8 4.0 Dodge Grand Caravan/Plymouth Grand Voyager/
Chrysler Town & Country 1996-98 1.7 3.3
Ford Aerostar 1992-97 2.2 3.3 Ford Windstar 1995-98 2.2 3.6
Midsize Utility Vehicles
Chevrolet Blazer/GMC Jimmy/Oldsmobile Bravada 1995-98 2.0 3.7 Ford Explorer/Mercury Mountaineer 1995-98 1.6 2.6 Jeep Grand Cherokee 1996-98 1.7 3.3 Toyota 4-Runner 1996-97 1.6 n/a

16 MONASH UNIVERSITY ACCIDENT RESEARCH CENTRE
3.4 CORRELATION OF BARRIER TEST MEASURES WITH REAL-WORLD RISK ESTIMATES
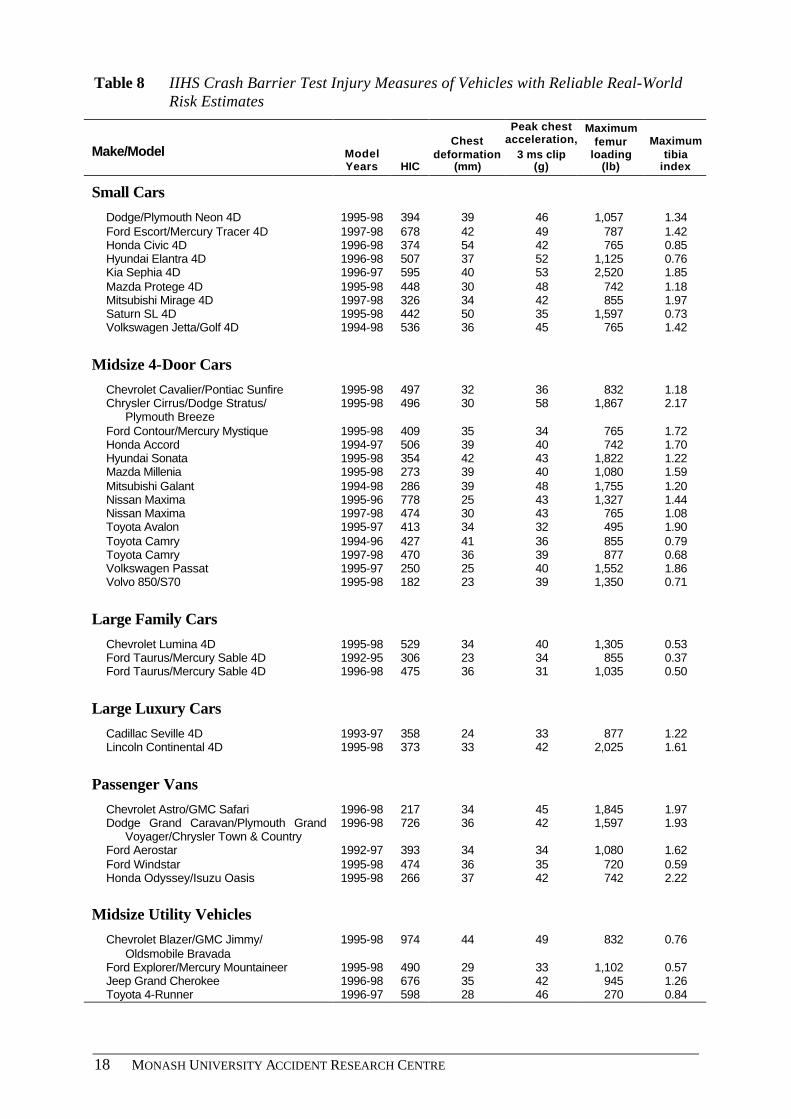
Results from the USNCAP full frontal barrier test for each of the study vehicles are listed in Table 7. Corresponding results from the IIHS tests are listed in Tables 8-9. The Kia Sephia had much higher real-world risk estimates than any other vehicle in the study for both all crashes and frontal impacts (Table 6). Also, the Sephia had femur loadings in both full frontal and offset tests much higher than those of any other vehicle in the study (Tables 7-8). This single result led to correlations that were possibly artificially high. For example, the correlation between estimated risk in all real-world crashes and probability of femur injury based on offset barrier tests was 0.80. When the analysis was repeated using all vehicles except the Sephia the correlation dropped to 0.52. To avoid having a single vehicle model with such high statistical leverage in the analyses, the Kia Sephia was excluded from all subsequent correlation analyses.

U.S. CONSUMER CRASH TEST RESULTS AND INJURY RISK IN POLICE-REPORTED CRASHES 17
Table 7 USNCAP Crash Barrier Test Injury Measures of Vehicles with Reliable Real-World Risk Estimates
Make/Model Model Years HIC
Chest deformation
(mm)
Peak chest acceleration, 3 ms clip (g)
Maximum femur
loading (lb)
Small Cars
Dodge/Plymouth Neon 4D 1995-98 610 40 54 1,543 Ford Escort/Mercury Tracer 4D 1997-98 959 42 58 1,572 Honda Civic 4D 1996-98 480 35 46 980 Hyundai Elantra 4D 1996-98 528 35 58 1,247 Kia Sephia 4D 1996-97 872 33 45 1,738 Mazda Protege 4D 1995-98 846 41 60 747 Mitsubishi Mirage 4D 1997-98 516 n/a 58 1,032 Saturn SL 4D 1995-98 633 39 45 718 Volkswagen Jetta/Golf 4D 1994-98 725 36 55 1,401
Midsize 4-Door Cars
Chevrolet Cavalier/Pontiac Sunfire 1995-98 814 32 52 1,524 Chrysler Cirrus/Dodge Stratus/Plymouth Breeze 1995-98 858 34 61 1,194 Ford Contour/Mercury Mystique 1995-98 471 42 43 1,104 Honda Accord 1994-97 618 45 53 1,287 Hyundai Sonata 1995-98 793 36 57 1,518 Mazda Millenia 1995-98 433 36 46 1,339 Mitsubishi Galant 1994-98 526 30 54 1,558 Nissan Maxima 1995-96 747 30 50 773 Nissan Maxima 1997-98 565 n/a 49 1,157 Toyota Avalon 1995-97 517 24 47 545 Toyota Camry 1994-96 607 53 51 553 Toyota Camry 1997-98 625 20 51 1,276 Volkswagen Passat 1995-97 568 7 55 513 Volvo 850/S70 1995-98 434 n/a 43 1,404
Large Family Cars
Chevrolet Lumina 4D 1995-98 394 32 42 1,055 Ford Taurus/Mercury Sable 4D 1992-95 647 n/a 54 1,602 Ford Taurus/Mercury Sable 4D 1996-98 541 31 44 1,084
Large Luxury Cars
Cadillac Seville 4D 1993-97 598 n/a 46 1,059 Lincoln Continental 4D 1995-98 863 n/a 48 1,327
Passenger Vans
Chevrolet Astro/GMC Safari 1996-98 613 37 61 1,963 Dodge Grand Caravan/Plymouth Grand Voyager/ Chrysler Town & Country
1996-98 879 42 54 1,137
Ford Aerostar 1992-97 485 n/a 51 1,591 Ford Windstar 1995-98 518 31 42 1,125 Honda Odyssey/Isuzu Oasis 1995-98 637 34 51 1,356
Midsize Utility Vehicles
Chevrolet Blazer/GMC Jimmy/Oldsmobile Bravada 1995-98 595 27 57 1,576 Ford Explorer/Mercury Mountaineer 1995-98 525 32 49 1,127 Jeep Grand Cherokee 1996-98 952 41 59 1,377 Toyota 4-Runner 1996-97 920 42 56 1,155
18 MONASH UNIVERSITY ACCIDENT RESEARCH CENTRE
Table 8 IIHS Crash Barrier Test Injury Measures of Vehicles with Reliable Real-World Risk Estimates
Make/Model Model Years HIC
Chest deformation
(mm)
Peak chest acceleration,
3 ms clip (g)
Maximum femur
loading (lb)
Maximum tibia
index
Small Cars
Dodge/Plymouth Neon 4D 1995-98 394 39 46 1,057 1.34 Ford Escort/Mercury Tracer 4D 1997-98 678 42 49 787 1.42 Honda Civic 4D 1996-98 374 54 42 765 0.85 Hyundai Elantra 4D 1996-98 507 37 52 1,125 0.76 Kia Sephia 4D 1996-97 595 40 53 2,520 1.85 Mazda Protege 4D 1995-98 448 30 48 742 1.18 Mitsubishi Mirage 4D 1997-98 326 34 42 855 1.97 Saturn SL 4D 1995-98 442 50 35 1,597 0.73 Volkswagen Jetta/Golf 4D 1994-98 536 36 45 765 1.42
Midsize 4-Door Cars
Chevrolet Cavalier/Pontiac Sunfire 1995-98 497 32 36 832 1.18 Chrysler Cirrus/Dodge Stratus/
Plymouth Breeze 1995-98 496 30 58 1,867 2.17
Ford Contour/Mercury Mystique 1995-98 409 35 34 765 1.72 Honda Accord 1994-97 506 39 40 742 1.70 Hyundai Sonata 1995-98 354 42 43 1,822 1.22 Mazda Millenia 1995-98 273 39 40 1,080 1.59 Mitsubishi Galant 1994-98 286 39 48 1,755 1.20 Nissan Maxima 1995-96 778 25 43 1,327 1.44 Nissan Maxima 1997-98 474 30 43 765 1.08 Toyota Avalon 1995-97 413 34 32 495 1.90 Toyota Camry 1994-96 427 41 36 855 0.79 Toyota Camry 1997-98 470 36 39 877 0.68 Volkswagen Passat 1995-97 250 25 40 1,552 1.86 Volvo 850/S70 1995-98 182 23 39 1,350 0.71
Large Family Cars
Chevrolet Lumina 4D 1995-98 529 34 40 1,305 0.53 Ford Taurus/Mercury Sable 4D 1992-95 306 23 34 855 0.37 Ford Taurus/Mercury Sable 4D 1996-98 475 36 31 1,035 0.50
Large Luxury Cars
Cadillac Seville 4D 1993-97 358 24 33 877 1.22 Lincoln Continental 4D 1995-98 373 33 42 2,025 1.61
Passenger Vans
Chevrolet Astro/GMC Safari 1996-98 217 34 45 1,845 1.97 Dodge Grand Caravan/Plymouth Grand
Voyager/Chrysler Town & Country 1996-98 726 36 42 1,597 1.93
Ford Aerostar 1992-97 393 34 34 1,080 1.62 Ford Windstar 1995-98 474 36 35 720 0.59 Honda Odyssey/Isuzu Oasis 1995-98 266 37 42 742 2.22
Midsize Utility Vehicles
Chevrolet Blazer/GMC Jimmy/ Oldsmobile Bravada
1995-98 974 44 49 832 0.76
Ford Explorer/Mercury Mountaineer 1995-98 490 29 33 1,102 0.57 Jeep Grand Cherokee 1996-98 676 35 42 945 1.26 Toyota 4-Runner 1996-97 598 28 46 270 0.84

U.S. CONSUMER CRASH TEST RESULTS AND INJURY RISK IN POLICE-REPORTED CRASHES 19
Table 9 IIHS Crash Barrier Test Intrusion Measures of Vehicles with Reliable Real-World Risk Estimates
Make/model
Model Years
Steering column
movement (cm)
Brake pedal
movement (cm)
Left lower instrument
panel intrusion
(cm)
Left toepan
intrusion (cm)
Left footrest intrusion
(cm)
Small Cars
Dodge/Plymouth Neon 4D 1995-98 13.5 25.5 14.5 29.5 24.5 Ford Escort/Mercury Tracer 4D 1997-98 2.0 16.0 8.0 26.0 22.0 Honda Civic 4D 1996-98 6.0 17.0 7.0 24.0 19.0 Hyundai Elantra 4D 1996-98 5.0 10.0 8.0 22.0 13.0 Kia Sephia 4D 1996-97 5.0 25.0 12.0 35.0 29.0 Mazda Protege 4D 1995-98 -1.0 20.0 6.0 28.0 21.0 Mitsubishi Mirage 4D 1997-98 8.0 22.0 11.0 31.0 20.0 Saturn SL 4D 1995-98 11.0 12.0 13.0 21.0 12.0 Volkswagen Jetta/Golf 4D 1994-98 7.0 24.0 9.0 34.0 26.0
Midsize 4-Door Cars
Chevrolet Cavalier/Pontiac Sunfire 1995-98 11.0 26.0 16.0 35.0 23.0 Chrysler Cirrus/Dodge Stratus/
Plymouth Breeze 1995-98
16.0
36.0
21.0
39.0
34.0 Ford Contour/Mercury Mystique 1995-98 4.0 23.0 7.0 29.0 18.0 Honda Accord 1994-97 9.0 22.0 7.0 25.0 16.0 Hyundai Sonata 1995-98 16.0 24.0 16.0 30.0 18.0 Mazda Millenia 1995-98 7.0 25.0 8.0 24.0 16.0 Mitsubishi Galant 1994-98 17.0 35.0 16.0 32.0 25.0 Nissan Maxima 1995-96 6.0 20.0 7.0 28.0 19.0 Nissan Maxima 1997-98 7.0 20.0 10.0 30.0 22.0 Toyota Avalon 1995-97 8.0 22.0 11.0 26.0 17.0 Toyota Camry 1994-96 8.0 14.0 7.0 25.0 14.0 Toyota Camry 1997-98 2.0 7.0 3.0 11.0 4.0 Volkswagen Passat 1995-97 9.0 23.0 8.0 36.0 25.0 Volvo 850/S70 1995-98 10.0 16.0 8.0 20.0 18.0
Large Family Cars
Chevrolet Lumina 4D 1995-98 4.0 8.0 5.0 10.0 8.0 Ford Taurus/Mercury Sable 4D 1992-95 1.0 13.0 4.0 13.0 10.0 Ford Taurus/Mercury Sable 4D 1996-98 3.0 19.0 5.0 15.0 8.0
Large Luxury Cars
Cadillac Seville 4D 1993-97 11.0 31.0 16.0 31.0 21.0 Lincoln Continental 4D 1995-98 8.0 23.0 13.0 23.0 17.0
Passenger Vans
Chevrolet Astro/GMC Safari 1996-98 4.0 28.0 13.0 37.0 27.0 Dodge Grand Caravan/Plymouth
Grand Voyager/Chrysler Town & Country 1996-98
4.0
30.0
9.0
28.0 17.0 Ford Aerostar 1992-97 6.0 36.0 13.0 31.0 30.0 Ford Windstar 1995-98 7.0 18.0 7.0 14.0 18.0 Honda Odyssey/Isuzu Oasis 1995-98 5.0 32.0 13.0 38.0 32.0
Midsize Utility Vehicles
Chevrolet Blazer/GMC Jimmy/ Oldsmobile Bravada 1995-98
9.0
25.0
20.0
30.0
33.0
Ford Explorer/Mercury Mountaineer 1995-98
6.0 8.0 10.0 22.0 16.0
Jeep Grand Cherokee 1996-98 4.0 19.0 5.0 18.0 20.0 Toyota 4-Runner 1996-97 -1.0 14.0 3.0 16.0 17.0
20 MONASH UNIVERSITY ACCIDENT RESEARCH CENTRE
Pearson correlations between mass-adjusted real-world risk estimates and outcomes of the barrier tests are detailed in Table 10. The real-world risk estimates for frontal impacts were not significantly correlated with any of the barrier test measures, although chest and femur injury probabilities in the full frontal test and intrusion measured near the left foot of the driver dummy were somewhat correlated with real-world risk estimates. There was, however, a significant positive correlation between real-world risk estimates in all crashes and the probability of femur injury for both full frontal and offset tests.
For comparison, Table 11 lists correlations of real-world risk estimates and barrier test results in Australia (Newstead and Cameron, 1999). As with the data from the United States, the Australian real-world outcomes from all crashes were significantly correlated with femur loadings from the offset test. However, the Australian risk estimates exhibited even stronger correlations with dummy chest loadings.
A four-category scale is used by the IIHS to classify vehicle performance in the offset barrier test. Separate ratings are assigned based on structural performance, dummy movement, and injury measures recorded on the dummy head, chest, and legs. The IIHS injury measures from the head, chest, and legs can also be combined into a single injury rating, and all ratings can be combined into an overall rating of the vehicle. The USNCAP uses a rating scale of five categories, although only three are represented by the vehicles in this study. Ratings for the vehicles in this study are listed in Table 12. Not surprisingly, since the two tests measure different aspects of performance vehicles performing well in one test did not necessarily perform well in the other. For example, the Ford Contour received 5 of 5 possible rating in the full frontal test, but was given the lowest possible overall rating in the offset test. In both tests the head and chest loads indicated low probability of injury. The reasons for the poor overall rating in the offset test were high loads on the lower legs and significant intrusion into the occupant compartment.
The USNCAP and IIHS ratings can be combined into a single overall rating in a number of ways. One logical method is to rate a vehicle as: poor if it performed poorly in either test (1-2 stars in USNCAP or poor in IIHS test), acceptable if it was at least acceptable in both tests (4-5 stars in USNCAP and acceptable/good in IIHS test), and marginal otherwise. For the 37 vehicles in this study such a classification scheme yields nearly equal class sizes (14 poor, 10 marginal, 13 acceptable).
Average values of the mass-adjusted real-world risk estimates for vehicles in each rating category are listed in Table 13. The USNCAP star rating seems to have no relationship at all with real-world risk estimates. Vehicles with 5-star ratings (i.e., the best performing vehicles) have a higher estimated likelihood of reported serious injury in real-world cashes than vehicles with 3-star ratings. Whether the rating is for injury, structure, or overall, vehicles rated good by IIHS have lower average estimates of real-world risk than vehicles rated poor. Vehicles rates acceptable or marginal, however, do not always fall in the middle ranges of real-world risk estimates. The combined rating for full and offset tests has the strongest relationship with real-world risk estimates. In both frontal impacts and all crashes, vehicles with a combined rating of poor have on average the highest estimated risk, followed by vehicles rated marginal and vehicles rated acceptable.

U.S. CONSUMER CRASH TEST RESULTS AND INJURY RISK IN POLICE-REPORTED CRASHES 21
Table 10 Correlation of Mass Adjusted Real-World Risk Estimates with US Crash Barrier Test Results
Frontal Impacts All Crashes
Barrier test variable USNCAP IIHS USNCAP IIHS
HIC 0.18 0.15 0.06 -0.27 Chest deformation (mm) -0.04 -0.28 -0.14 -0.05 Peak chest gs 0.29 0.22 0.19 0.20 Maximum femur loading (lbs) 0.21 0.10 0.20 0.47*** Pr(Serious head injury) 0.16 0.18 0.03 -0.20 Pr(Serious chest injury) 0.33* 0.25 0.22 0.17 Pr(Serious femur injury) 0.32* 0.16 0.38** 0.52*** Pr(Serious head or chest injury) 0.28 0.27 0.16 -0.01 Pr(Serious head, chest, or femur injury) 0.34* 0.29 0.25 0.31* Maximum tibia index 0.14 0.12 Steering column movement (cm) -0.04 0.18 Brake pedal movement (cm) 0.13 0.11 Right lower instrument panel intrusion (cm) 0.13 0.03 Left lower instrument panel intrusion (cm) 0.20 0.17 Right toepan intrusion (cm) 0.09 -0.09 Center toepan intrusion (cm) 0.19 0.13 Left toepan intrusion (cm) 0.23 0.19 Left footrest intrusion (cm) 0.33* 0.08
Note1: The Kia Sephia was excluded from correlation analyses due to extreme risk estimates * Statistically significant at the 0.10 level of significance ** Statistically significant at the 0.05 level of significance *** Statistically significant at the 0.01 level of significance
Table 11 Correlation of Real-World Risk Estimates with Australian Crash Barrier Test Results (ANCAP)
Head-on All Crashes
Barrier test variable Full Frontal
Offset Full Frontal
Offset
HIC 0.14 0.29 -0.01 0.31* Peak chest gs 0.48** 0.39* 0.13 0.48** Maximum femur loading (lbs) 0.19 0.16 -0.05 0.40** Pr(Serious head injury) 0.12 0.24 -0.02 0.36* Pr(Serious chest injury) 0.45** 0.32 0.09 0.41** Pr(Serious femur injury) 0.17 -0.03 0.01 0.16 Pr(Serious head or chest injury) 0.30 0.28 0.03 0.47** Pr(Serious head, chest, or femur injury) 0.29 0.29 0.02 0.52** Maximum tibia index 0.30 0.44**
Note: From Table 3 of Newstead and Cameron (1999) * Statistically significant at the 0.10 level of significance ** Statistically significant at the 0.05 level of significance

22 MONASH UNIVERSITY ACCIDENT RESEARCH CENTRE
Table 12 USNCAP and IIHS Crash Barrier Ratings of Vehicles with Reliable Real-World Risk Estimates
Make/model
Model Years
USNCAP star
rating
IIHS injury rating
IIHS structure
rating
IIHS overall rating
Small Cars
Dodge/Plymouth Neon 4D 1995-98 4 Acceptable Marginal Poor Ford Escort/Mercury Tracer 4D 1997-98 3 Acceptable Acceptable Acceptable Honda Civic 4D 1996-98 4 Acceptable Acceptable Acceptable Hyundai Elantra 4D 1996-98 3 Acceptable Acceptable Acceptable Kia Sephia 4D 1996-97 4 Marginal Poor Poor Mazda Protege 4D 1995-98 3 Acceptable Acceptable Acceptable Mitsubishi Mirage 4D 1997-98 3 Acceptable Marginal Poor Saturn SL 4D 1995-98 4 Acceptable Acceptable Acceptable Volkswagen Jetta/Golf 4D 1994-98 3 Marginal Marginal Marginal
Midsize 4-Door Cars
Chevrolet Cavalier/Pontiac Sunfire 1995-98 3 Acceptable Poor Poor Chrysler Cirrus/Dodge Stratus/
Plymouth Breeze 1995-98 3
Marginal Poor
Poor
Ford Contour/Mercury Mystique 1995-98 5 Marginal Marginal Poor Honda Accord 1994-97 4 Acceptable Acceptable Acceptable Hyundai Sonata 1995-98 3 Acceptable Poor Poor Mazda Millenia 1995-98 4 Acceptable Marginal Acceptable Mitsubishi Galant 1994-98 4 Acceptable Poor Poor Nissan Maxima 1995-96 4 Poor Acceptable Poor Nissan Maxima 1997-98 4 Acceptable Acceptable Acceptable Toyota Avalon 1995-97 4 Acceptable Marginal Marginal Toyota Camry 1994-96 4 Acceptable Acceptable Acceptable Toyota Camry 1997-98 4 Acceptable Good Good Volkswagen Passat 1995-97 4 Acceptable Marginal Poor Volvo 850/S70 1995-98 5 Good Acceptable Good
Large Family Cars
Chevrolet Lumina 4D 1995-98 5 Good Good Good Ford Taurus/Mercury Sable 4D 1992-95 4 Acceptable Good Good Ford Taurus/Mercury Sable 4D 1996-98 4 Good Good Good
Large Luxury Cars
Cadillac Seville 4D 1993-97 4 Acceptable Poor Poor Lincoln Continental 4D 1995-98 3 Marginal Acceptable Acceptable
Passenger Vans
Chevrolet Astro/GMC Safari 1996-98 3 Acceptable Poor Poor Dodge Grand Caravan/Plymouth Grand
Voyager/Chrysler Town & Country 1996-98
3
Marginal Acceptable
Marginal Ford Aerostar 1992-97 4 Acceptable Poor Poor Ford Windstar 1995-98 5 Good Good Good Honda Odyssey/Isuzu Oasis 1995-98 4 Acceptable Poor Marginal
Midsize Utility Vehicles
Chevrolet Blazer/GMC Jimmy/ Oldsmobile Bravada 1995-98
3
Poor Poor
Poor
Ford Explorer/Mercury Mountaineer 1995-98 4 Acceptable Acceptable Acceptable Jeep Grand Cherokee 1996-98 3 Marginal Acceptable Marginal Toyota 4-Runner 1996-97 3 Good Good Acceptable

U.S. CONSUMER CRASH TEST RESULTS AND INJURY RISK IN POLICE-REPORTED CRASHES 23
Table 13 Distribution of Mass Adjusted Real-World Risk Estimates by Barrier Test Rating Category
Frontal Impacts All Crashes
Barrier test rating Mean* Minimum Maximum Mean* Minimum Maximum
USNCAP star rating
3 3.5 2.6 4.0 2.1 1.6 2.9
4 3.1 1.7 3.8 2.0 1.3 2.5
5 3.7 3.2 4.1 2.2 1.9 2.4
IIHS injury rating
Poor 3.5 3.4 3.7 2.0 2.0 2.1
Marginal 3.6 3.3 4.1 2.1 1.7 2.9
Acceptable 3.2 1.7 4.0 2.1 1.3 2.8
Good 3.1 2.5 3.6 2.0 1.6 2.3
IIHS structure rating
Poor 3.5 2.5 4.0 2.2 1.3 2.8
Marginal 3.6 1.7 4.1 2.3 1.9 2.4
Acceptable 2.9 2.1 3.8 1.9 1.5 2.9
Good 3.4 2.5 3.8 2.0 1.6 2.2
IIHS overall rating
Poor 3.6 2.5 4.1 2.3 1.3 2.8
Marginal 3.3 3.3 3.4 1.8 1.5 2.1
Acceptable 2.8 1.7 3.8 1.9 1.5 2.9
Good 3.4 2.5 3.8 2.0 1.9 2.3
Combined USNCAP/IIHS rating
Poor1 3.6 2.5 4.1 2.3 1.3 2.8
Marginal 3.3 3.1 3.8 2.0 1.5 2.9
Acceptable2 3.1 1.7 3.8 2.0 1.5 2.3
Note: The Kia Sephia was excluded due to extreme risk estimates * Each real-world risk estimate is weighted by the number of crash involvements used to derive it 1 A combined rating of Poor is equivalent to 1-2 stars in USNCAP or a Poor overall IIHS rating 2 A combined rating of Acceptable is equivalent to 4-5 stars in USNCAP and at least Acceptable overall IIHS rating
3.5 LOGISTIC MODELLING OF USNCAP AND IIHS MEASURES
A likelihood ratio based stepwise regression approach was used to fit the multivariate regression models of mass-adjusted real-world risk estimates against crash barrier test measures. Using this approach it was hoped to build the best possible models describing real-world risk estimates as a function of crash barrier test measures.
There were too many crash barrier test measures to include in a multivariate regression based on only 30 vehicles, so only the overall ratings and those measures most highly correlated with real-world risk estimates were considered. Barrier test measures included in the stepwise procedure were the overall evaluations of NHTSA and IIHS and those measures that produced correlations greater than or equal to 0.2 in Table 10: chest loading and femur loading from the full frontal test; HIC, chest deformation, chest loading, femur loading, left lower instrument panel intrusion, left toepan intrusion, and footrest intrusion from the offset test. Linear first order interactions between these main effect terms were also included. Linear interaction terms were obtained by simply multiplying the terms of the interaction being considered (e.g., the linear interaction between chest deformation and footrest intrusion = chest deformation × footrest intrusion). Two sets of best fit models for the real-world risk estimates were obtained; one for risk estimates from frontal crashes and one for risk estimates from all crash types. Again the Kia Sephia was excluded.

24 MONASH UNIVERSITY ACCIDENT RESEARCH CENTRE
Execution of the stepwise logistic regression routine produced the following best fitting model of real-world risk estimates in frontal impacts;
logit(Risk) = -2.4066 (If 3 star rating in FullFrontal)
- 2.5034 (If 4 star rating in FullFrontal)
- 2.2789 (If 5 star rating in FullFrontal)
- 0.0309 × (Offset Chest Deformation)
- 0.0662 × (Offset Left Instrument Panel Intrusion)
+ 0.00226 × (Offset Chest Deformation) × (Offset Left Instrument Panel
Intrusion).
Predicted risk estimates from the logistic model are calculated by substituting the crash barrier measures into the above formula and applying the reverse logistic transform, defined as:
Risk = exp(�) / (1 + exp(�)),
where � = logit(Risk).
The logistic model of risk estimates from frontal impacts was found to be an acceptable fit to the data with a Hosmer-Lemeshow chi-square statistic of 4.25 (p=0.7507). Visual assessment of the fit of the logistic model can be made from Figure 1 where frontal impact risk estimates are plotted against the predicted values from the best fitting logistic model. For completeness the Kia Sephia is plotted on Figure 1 (indicated by arrow) even though it was not used in formulating the prediction equation. The dashed line denotes the line of perfect fit for the model. The correlation between actual and predicted values is 0.62.
The logistic model for frontal impacts predicts risk to be lowest for vehicles receiving 4 stars in USNCAP and highest for those receiving 5 stars (this was also indicated in Table 13). Higher values of chest deformation in the offset test are associated with higher predicted risk when left instrument panel intrusion is large (>13 cm), but lower predicted risk when left instrument panel intrusion is small. Higher values of left instrument panel intrusion are associated with higher predicted risk when chest deformation is large (>29 mm), but lower predicted risk when chest deformation is small. So, for example, vehicles such as the 1995-98 Chrysler Cirrus and Chevrolet Blazer, which had high values for both chest deformation and instrument panel intrusion, have relatively high predicted risk. On the other hand, the 1996-98 Honda Civic, which had high chest deformation but low instrument panel intrusion, has a very low predicted risk.

U.S. CONSUMER CRASH TEST RESULTS AND INJURY RISK IN POLICE-REPORTED CRASHES 25
Figure 1 Observed Frontal Impact Crash Real-World Risk Estimates
vs. Predicted Values from Logistic Regression Model
1.60
2.10
2.60
3.10
3.60
4.10
4.60
5.10
1.60 2.10 2.60 3.10 3.60 4.10 4.60 5.10
Predicted Risk
Act
ual M
ass
Adj
uste
d R
isk
Kia Sephia

26 MONASH UNIVERSITY ACCIDENT RESEARCH CENTRE
A second stepwise logistic regression routine was executed to produce the following best fitting model of risk in all crash types as a function of the variables selected from the full frontal and offset crash barrier test measures and their interactions;
logit(Risk) =-2.2292 - 0.000003 × (Offset Femur) (If 3 star rating in FullFrontal)
- 2.5328 + 0.000156 × (Offset Femur) (If 4 star rating in FullFrontal)
- 1.9566 - 0.00035 × (Offset Femur) (If 5 star rating in FullFrontal)
- 0.00067 × (Offset HIC)
- 0.0154 × (Offset Chest Deformation)
- 0.00057 × (Full Frontal Femur)
- 0.1201 × (Offset Left Instrument Panel Intrusion)
+ 0.00143 × (Offset Chest Deformation) × (Offset Left Instrument Panel Intrusion)
+ 0.000056 × (Full Frontal Femur) × (Offset Left Instrument Panel Intrusion).
The estimated logistic model of risk from all crash types was found to be an acceptable fit to the data with a Hosmer-Lemeshow chi-square statistic of 2.07 (p=0.9560). Visual assessment of the fit of the logistic model can again be made from Figure 2 where the all crash type risk estimates are plotted against the predicted values from the best fitting logistic model. The correlation between actual and predicted values is 0.68.
The logistic model for all crashes is much harder to interpret than that for frontal impacts. Higher femur loadings in the offset test are associated with higher predicted risk for vehicles receiving 4 stars in USNCAP, but lower predicted risk for those receiving 3 or 5 stars. Higher values of HIC in the offset test are associated with lower predicted risk. Higher values of chest deformation in the offset test or femur loadings in the full frontal test are associated with higher predicted risk when left instrument panel intrusion is large (>10 cm), but lower predicted risk when left instrument panel intrusion is small. Finally, higher values of left instrument panel intrusion are associated with higher predicted risk when offset chest deformation and full frontal femur loadings are both large.

U.S. CONSUMER CRASH TEST RESULTS AND INJURY RISK IN POLICE-REPORTED CRASHES 27
Figure 2 Observed All Crash Type Real-World Risk Estimates vs. Predicted Values from Logistic Regression Model
1.30
1.80
2.30
2.80
3.30
3.80
4.30
1.30 1.80 2.30 2.80 3.30 3.80 4.30
Predicted Risk
Act
ual M
ass
Adj
uste
d R
isk
Est
imat
e
Kia Sephia

28 MONASH UNIVERSITY ACCIDENT RESEARCH CENTRE
4 DISCUSSION
Most of the individual dummy injury measures recorded in the crash tests of the 30 or so vehicle models considered in this study had positive but not statistically significant (at the 0.05 level), correlations with real-world crash risk estimates obtained from police crash data files. Drivers in real-world crashes of vehicles which had high dummy head, chest, or leg injury measures or large amounts of intrusion in crash tests, were somewhat more likely to be recorded as sustaining serious injuries in real-world frontal impacts. However, the relationships between individual crash test results and real-world risk estimates were not consistent across vehicles.
It should be noted that all of the vehicles in this study had driver airbags, which rarely produce high head or chest loads in barrier tests. None of the vehicles in this study had HICs exceeding 1,000 or chest loads exceeding 60 gs (the thresholds taken to indicate serious injury risk) in the offset barrier test (Table 8). In the full-front tests, none of the vehicles had HICs exceeding 1,000, and the maximum chest load was 61 gs (Table 7). Prior studies that reported relationships between real-world risk estimates and barrier test head/chest loads (Jones and Whitfield, 1988, Kahane, 1994; Newstead and Cameron, 1997, 1999; Zador et al., 1984) were based primarily on vehicles without driver airbags for which the head and chest injury measures in crash tests are higher on average but also more variable giving greater statistical analysis power.
In the current study, some combinations of crash test results were correlated with real-world injury risk estimates. In particular, the combination of the overall crash test ratings from full-width and offset tests separated vehicles with high and low real-world risk estimates (Table 13). The three vehicles with the highest real-world frontal risk estimates (Ford Contour, Chevrolet Astro, Chevrolet Cavalier) were all classified as poor, and the three vehicles with the lowest frontal risk estimates (Mazda Millenia, Honda Civic, Honda Accord) were all classified as acceptable. However, there still were some vehicles for which the crash test ratings were inconsistent with the real-world risk estimates. The Cadillac Seville and Hyundai Sonata, both rated poor in the IIHS barrier test, had relatively low real-world frontal risk estimates. The Ford Windstar and 1992-95 Ford Taurus, with the highest ratings in both barrier tests, had relatively high frontal real-world crash risk estimates.
The barrier test measures that in combination best matched real-world risk estimates for the vehicles in this study were the USNCAP star rating, chest deformation from the offset test, and instrument panel intrusion from the offset test.
This study indicates that measures from both full-front and offset barrier tests were related to estimated real-world crash risks. However, the relationships were not very strong. These weak relationships should not be surprising, given that the data sets available for such research are limited. The present study was limited to crash test results from only about 30 vehicle models. Even more important is that the real-world driver injury risk estimates are derived from police reported crash information that is deficient in some key variables and uses an injury classification scale that is not the same as that used in barrier testing.
There is no question that for crash test results to have validity they should correlate with real-world crash outcomes for the same vehicle model. However, such relationships can be definitively established (or refuted) only with real-world crash data that is sufficient in quantity and detail to reliably measure both crash and injury severity as well as occupant belt use. It was known going into this study that in the United States police crash data files do not have good information on crash and injury severity and belt use. However, it was thought that despite the known deficiencies in the real-world data and given the loose association
U.S. CONSUMER CRASH TEST RESULTS AND INJURY RISK IN POLICE-REPORTED CRASHES 29
between police reported injury severity and AIS injury levels, relationships between test ratings and real-world crash risks derived from police crash reports might be identified. Some relationships had been identified with Australian data. While there are some similarities between the results from the U.S. and Australian analyses, there are also differences. The univariate analysis from each country shows the barrier test results (particularly offset) are more strongly associated with real-world crash risk estimates for all crashes than for frontal impacts only. Femur loads in both U.S. and Australian offset tests were significantly correlated with real-world injury risk estimates for all crashes, but not for frontal impacts. This result clearly is counterintuitive and may reflect variations in quality or insufficient quantity of the real-world crash data to draw reliable and reproducible conclusions. It may also reflect that vehicle models included in each study were not chosen randomly but were self-selecting based on available real crash data.
The major difference between the Australian and U.S. correlation results is the much stronger association found between real-world risk estimates and chest loadings from crash tests in Australia. This may be due to greater variability in the Australian crash test data. Chest loadings in the Australian offset tests ranged from 37 to 84 gs, but in the IIHS data they ranged only from 31 to 58 gs (Table 8), reflecting the fact that all of the vehicles tested by IIHS had driver airbags, but many of the ANCAP vehicles did not.
Results from multivariate logistic regression analysis of real-world risk estimates as a function of vehicle crash barrier test dummy readings in the United States were very different from those of the Australian analysis. There could be a number of reasons for these differences. The non-random selection of vehicle models included in each study could be an important influence. Another likely reason for the difference is the nature of the stepwise model selection process used in both this study and the Australian study to select the best explanatory model. When using stepwise procedures to select the best explanatory subset from a set of correlated variables, as is the case with the barrier test measures, there are likely to be a number of different subsets of predictor variables that have similar explanatory power in the regression model. The particular subset chosen by the step-wise procedure will be largely a function of the particular realization of data that is being analyzed. It is possible that the best explanatory model chosen in this study would also explain the Australian real crash ratings well, and vice versa, although this possibility has not been explored in this study. One difficulty in assessing the explanatory power of the models derived here on the Australian ratings is that the structural deformation measures from the offset barrier test in the USA, found to be an important predictor in the regression model, are not available in Australian offset crash test results. The main point made by the logistic regression analyses is that functions of the barrier test measures exist that have a better relationship with the real crash measures than summary functions currently being used. Clearly, the optimum form of the functional relationship and whether such functions will be useful in harmonizing vehicle safety ratings derived from both real crash data and barrier tests to provide consistent consumer information remain to be established.
There are undoubtedly two major limitations in the present analysis, and likely almost every other study that has attempted to correlate crash tests results with real-world injury risk. They are the absence of key variables in most real-world crash data and the incompatibility between injury severity scales used in real world data and crash barrier test measures. As noted earlier, the ideal real-world crash data set for studies such as this would include crash severity objectively measured by delta V or some other accepted parameter, injury severity by body region and measured on the AIS scale, together with reliable information on belt use. Data with sufficient detail are available in the National Automotive Sampling System (NASS) database maintained by NHTSA, but the sample sizes are far too small to conduct analyses based on results for individual vehicle makes and models. No crash database in the world of

30 MONASH UNIVERSITY ACCIDENT RESEARCH CENTRE
sufficiently large size currently has the high quality of data that ideally are needed for these kinds of correlational studies. As a result analyses can only be conducted using available data with the noted limitations. Sometimes these analyses do indicate positive and meaningful correlations between the real-world risk estimates, and such findings are encouraging. But when they do not indicate correlations, or when they provide confusing findings like those of the present study, more than anything they reinforce the need for better quality real-world crash data.

U.S. CONSUMER CRASH TEST RESULTS AND INJURY RISK IN POLICE-REPORTED CRASHES 31
5 ACKNOWLEDGMENT
This work was supported by the Insurance Institute for Highway Safety along with the sponsors from the Australian Used Car Safety Ratings Project (Australian Transport Safety Bureau, NRMA Ltd, RACV Ltd, RACWA Ltd, Roads and Traffic Authority New South Wales, VicRoads). The opinions, findings, and conclusions expressed in this publication are those of the author(s) and do not necessarily reflect the views of the Insurance Institute for Highway Safety, Monash University or the sponsors of the Australian Used Car Safety Ratings Project.

32 MONASH UNIVERSITY ACCIDENT RESEARCH CENTRE
6 REFERENCES
AAAM. 1985. The Abbreviated Injury Scale: 1985 Revision. American Association for Automotive Medicine.
ANSI. 1996. American National Standard – Manual on Classification of Motor Vehicle Traffic Accidents, Sixth Edition. American National Standards Institute, Inc.
Austin, K. 1995. The identification of mistakes in road accident records: part 2, casualty variables. Accident Analysis and Prevention 27: 277-282.
Cameron, M., Mach, T., Neiger, D., Graham, A., Ramsay, R., Pappas, M. & Haley, J. 1992. Vehicle crashworthiness ratings from Victoria and New South Wales crash data. Road and Transport Research, Vol 1, No 3, September 1992.
Campbell, B.J. 1982. A comparison of NHTSA car safety ratings with injuries in highway crashes. University of North Carolina Highway Safety Research Centre, Highway Safety Highlights, Vol 15, No. 3.
Craggs, A. and Wilding, P. 1995. Cars: Make and Model: The risk of driver injury and car accident rates in Great Britain: 1993. Department of Transport, Transport Statistics Report, , HMSO, London.
GAO. 1995. Highway safety: reliability and validity of DOT crash tests (GAO/PEMD-95-5). Washington, DC: United States General Acoounting Office.
Greenberg, L. 1996. Police Accident Report (PAR) Quality Assessment Project (DOT-HS-808-487). Washington, DC: National Highway Traffic Safety Administration.
Grush, E.S., Marsh, J.C. IV, and South, N.E. 1983. Comparison of high speed crash test results with fatality rates. In Proceedings of the 27th Annual Conference of AAAM:189-209.
Gustafsson, H., Hagg, A., Krafft, M., Kullgren, A., Malmstedt, B., Nygren, A., and Tingvall, C. 1989. Folksam Car Model Safety Rating 1989-90. Stockholm, Sweden: Folksam.
Insurance Institute for Highway Safety. 2000. Crashworthiness evaluation offset barrier crash test protocol (version VIII). Arlington, VA.
Insurance Institute for Highway Safety. 2001. Arlington, VA. Available: http://www.highwaysafety.org/vehicle_ratings/ratings.htm. Last accessed: January 18, 2001.
Jones, I.S., Whitfield, R.A. 1988. Predicting injury risk with “New Car Assessment Program” crashworthiness ratings. Accident Analysis and Prevention 20:411-419.
Kahane, C.J., Hackney, J.R, and Berkowitz, A.M. 1994. Correlation of vehicle performance in the New Car Assessment Program with fatality risk in actual head-on collisions (94-S8-O-11). In Proceedings of the 14th ESV Conference:1388-1404.
Mendenhall, W., Schaeffer, R.L., and Wackerly, D.D. 1986. Mathematical statistics with applications, 3rd Edition. Boston: PWS-Kent.
National Highway Traffic Safety Administration. 1997. National Automotive Sampling System 1997 Crashworthiness Data System: Data collection, coding, and editing manual. Washington, DC: U.S. Department of Transportation.

U.S. CONSUMER CRASH TEST RESULTS AND INJURY RISK IN POLICE-REPORTED CRASHES 33
Newstead, S.V. and Cameron, M.H. 1997. Correlation of results from the New Car Assessment Program with real crash data. Report No 115, Monash University Accident Research Centre.
Newstead, S.V. and Cameron, M.H. 1999. Updated correlation of results from the Australian New Car Assessment Program with real crash data from 1987 to 1996. Report No 152, Monash University Accident Research Centre.
Rosman, D.L. and Knuiman, M.W. 1994. A comparison of hospital and police road injury data. Accident Analysis and Prevention 26: 215-222.
Sherman, H.W., Murphy, M.J., and Huelke, D.F. 1976. A reappraisal of the use of police injury codes in accident data analysis. In Proceedings of the 20th Annual Conference of the American Association for Automotive Medicine:128-138.
Stewart, J.R. and Rodgman, E.A. 1985. Comparisons of NCAP test results wiht driver injury rates in highway crashes. In Proceedings of the 29th Annual Conference of the American Association for Automotive Medicine:181-197.
Viano, D.C., Arepally, S. 1990. Assessing the safety performance of occupant restraints systems (SAE-902328). In Proceedings of the 38th Stapp Car Crash Conference.
Zador, P.L., Jones, I.S., Ginsburg, M. 1984. Fatal front-to-front car collisions and the results of 35 mph frontal barrier impacts. Presented at the 28th Annual Conference of the American Association for Automotive Medicine.


![INVESTIGATING POTENTIAL CHANGES TO THE IIHS SIDE … · The coded case information was used to reconstruct the crash using the PC-Crash software [5]. This resulted in calculated impact](https://img.dokumen.tips/doc/110x75/5e77929595677d46966f2525/investigating-potential-changes-to-the-iihs-side-the-coded-case-information-was.jpg)