Embed Size (px)
Citation preview
1
U.S. Coal Supply and Demand: 2010 Year in Review by
William Watson, Nicholas Paduano, Tejasvi Raghuveer and Sundar Thapa
U.S. Energy Information Administration
Overview
Coal production in the United States in 2010 increased to a level of 1,085.3 million short tons according to preliminary data from the U.S. Energy Information Administration (EIA), an increase of 1.0 percent, or 10.4 million short tons above the 2009 level of 1,074.9 million short tons (Table 1). In 2010 U.S. coal consumption increased in all sectors except commercial and institutional while total coal stocks fell slightly for the year. Coal consumption in the electric power sector in 2010 was higher by 4.5 percent, while coking coal consumption increased by 37.9 percent and the other industrial sector increased by 7.1 percent. The commercial and institutional sector, which prior to 2008 had been called the “residential and commercial” sector and is the smallest of all the coal-consuming sectors, declined by 3.1 percent in 2010. (Note: All percentage change calculations are done at the short-tons level.) U.S. coal exports increased from the 2009 levels due mostly to higher demand for metallurgical coal, while coal imports decreased for a third year in a row. The increase in coal consumption for electric generation during the year was the consequence of improving domestic economic conditions further bolstered by a cold winter and warm summer in important coal-consuming regions. Preliminary data show that total generation in the electric power sector (electric utilities and independent power producers, including useful thermal output) in the U.S. increased in 2010 by 4.2 percent. Coal-based generation also increased, resulting in a 42.0 million short ton increase in coal consumed in the electric power sector. Coal use in all the sectors other than the electric power sector increased by 13.9 percent to a level of 72.7 million short tons. The international coal trade markets for most of 2010 were reflective of a worldwide economic rebound. U.S. coal exports rose sharply for the year. U.S. coal exports totaled 81.7 million short tons, an increase of 22.6 million short tons over 2009 levels. Exports of
metallurgical coal rose by 18.8 million short tons and accounted for most of the increase in total exports. U.S. imports of coal fell to 19.4 million short tons or 3.3 million short tons below 2009 levels, in part due to recent increases in the price of imported steam coal to almost parity with domestic levels. In 2010, coal prices (per short ton) for the electric utility sector rose modestly by 1.4 percent and by 3.9 percent for independent power producers. Domestic-origin coking coal prices had the greatest increase, climbing by 7.4 percent, while the price for the other industrial sector fell by 1.0 percent and by 9.1 percent for the commercial and industrial sector. Weather-related production cutbacks by Australia kept upward pressure on international metallurgical coal prices, and average U.S. export prices for metallurgical coal rose by 23.5 percent in 2010, while export prices for U.S. steam coal exports decreased 11 percent. The average price of coal imported into the U.S. rose by 12.3 percent.
Coal Production
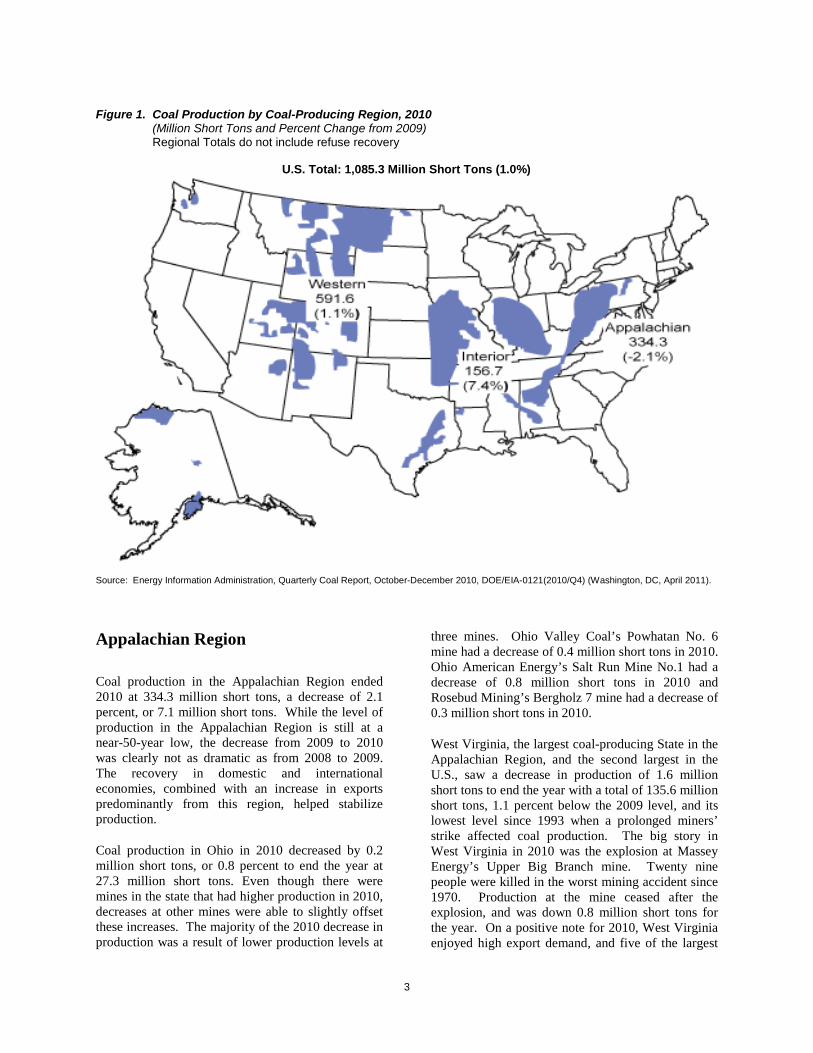
U.S. coal production increased slightly in 2010 by 1.0 percent to a level of 1,085.3 million short tons (Figure 1 and Table 1), 10.4 million short tons more than the 2009 production total. Exclusive of refuse production, the Interior and Western Regions had increases in their production levels in 2010 of 7.4 percent and 1.1 percent respectively, while the Appalachian Region had a decrease of 2.1 percent (Figure 2 and Table 2). The increase in Interior production was anchored by a 6.5 million short ton increase in Texas production. The decrease in the Appalachian Region production was 7.1 million short tons, while the increases in Interior Region and Western Region production in 2010 was 10.8 million short tons and 6.6 million short tons, respectively.
2
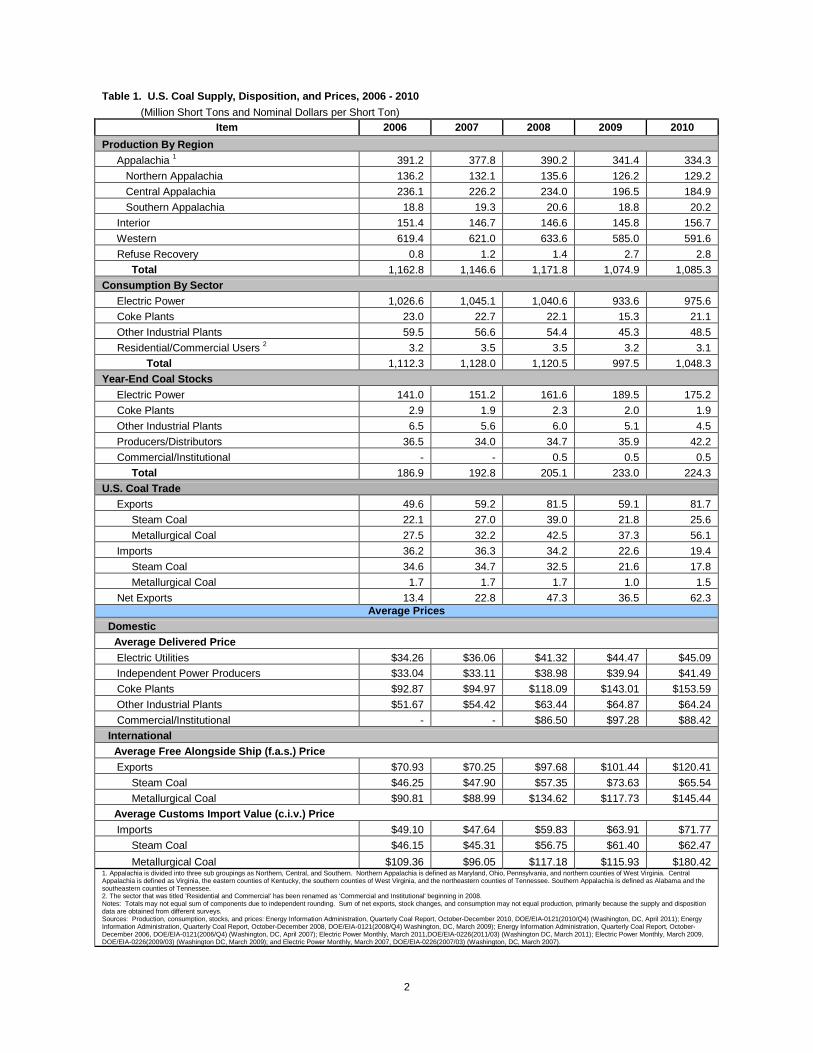
Table 1. U.S. Coal Supply, Disposition, and Prices, 2006 - 2010 (Million Short Tons and Nominal Dollars per Short Ton)
Item 2006 2007 2008 2009 2010 Production By Region Appalachia 1 391.2 377.8 390.2 341.4 334.3 Northern Appalachia 136.2 132.1 135.6 126.2 129.2 Central Appalachia 236.1 226.2 234.0 196.5 184.9 Southern Appalachia 18.8 19.3 20.6 18.8 20.2 Interior 151.4 146.7 146.6 145.8 156.7 Western 619.4 621.0 633.6 585.0 591.6 Refuse Recovery 0.8 1.2 1.4 2.7 2.8 Total 1,162.8 1,146.6 1,171.8 1,074.9 1,085.3 Consumption By Sector Electric Power 1,026.6 1,045.1 1,040.6 933.6 975.6 Coke Plants 23.0 22.7 22.1 15.3 21.1 Other Industrial Plants 59.5 56.6 54.4 45.3 48.5 Residential/Commercial Users 2 3.2 3.5 3.5 3.2 3.1 Total 1,112.3 1,128.0 1,120.5 997.5 1,048.3 Year-End Coal Stocks Electric Power 141.0 151.2 161.6 189.5 175.2 Coke Plants 2.9 1.9 2.3 2.0 1.9 Other Industrial Plants 6.5 5.6 6.0 5.1 4.5 Producers/Distributors 36.5 34.0 34.7 35.9 42.2 Commercial/Institutional - - 0.5 0.5 0.5 Total 186.9 192.8 205.1 233.0 224.3 U.S. Coal Trade Exports 49.6 59.2 81.5 59.1 81.7 Steam Coal 22.1 27.0 39.0 21.8 25.6 Metallurgical Coal 27.5 32.2 42.5 37.3 56.1 Imports 36.2 36.3 34.2 22.6 19.4 Steam Coal 34.6 34.7 32.5 21.6 17.8 Metallurgical Coal 1.7 1.7 1.7 1.0 1.5 Net Exports 13.4 22.8 47.3 36.5 62.3
Average Prices Domestic Average Delivered Price Electric Utilities $34.26 $36.06 $41.32 $44.47 $45.09 Independent Power Producers $33.04 $33.11 $38.98 $39.94 $41.49 Coke Plants $92.87 $94.97 $118.09 $143.01 $153.59 Other Industrial Plants $51.67 $54.42 $63.44 $64.87 $64.24 Commercial/Institutional - - $86.50 $97.28 $88.42 International Average Free Alongside Ship (f.a.s.) Price Exports $70.93 $70.25 $97.68 $101.44 $120.41 Steam Coal $46.25 $47.90 $57.35 $73.63 $65.54 Metallurgical Coal $90.81 $88.99 $134.62 $117.73 $145.44 Average Customs Import Value (c.i.v.) Price Imports $49.10 $47.64 $59.83 $63.91 $71.77 Steam Coal $46.15 $45.31 $56.75 $61.40 $62.47 Metallurgical Coal $109.36 $96.05 $117.18 $115.93 $180.42 1. Appalachia is divided into three sub groupings as Northern, Central, and Southern. Northern Appalachia is defined as Maryland, Ohio, Pennsylvania, and northern counties of West Virginia. Central Appalachia is defined as Virginia, the eastern counties of Kentucky, the southern counties of West Virginia, and the northeastern counties of Tennessee. Southern Appalachia is defined as Alabama and the southeastern counties of Tennessee. 2. The sector that was titled 'Residential and Commercial' has been renamed as 'Commercial and Institutional' beginning in 2008. Notes: Totals may not equal sum of components due to independent rounding. Sum of net exports, stock changes, and consumption may not equal production, primarily because the supply and disposition data are obtained from different surveys. Sources: Production, consumption, stocks, and prices: Energy Information Administration, Quarterly Coal Report, October-December 2010, DOE/EIA-0121(2010/Q4) (Washington, DC, April 2011); Energy Information Administration, Quarterly Coal Report, October-December 2008, DOE/EIA-0121(2008/Q4) Washington, DC, March 2009); Energy Information Administration, Quarterly Coal Report, October-December 2006, DOE/EIA-0121(2006/Q4) (Washington, DC, April 2007); Electric Power Monthly, March 2011,DOE/EIA-0226(2011/03) (Washington DC, March 2011); Electric Power Monthly, March 2009, DOE/EIA-0226(2009/03) (Washington DC, March 2009); and Electric Power Monthly, March 2007, DOE/EIA-0226(2007/03) (Washington, DC, March 2007).
3
Appalachian Region Coal production in the Appalachian Region ended 2010 at 334.3 million short tons, a decrease of 2.1 percent, or 7.1 million short tons. While the level of production in the Appalachian Region is still at a near-50-year low, the decrease from 2009 to 2010 was clearly not as dramatic as from 2008 to 2009. The recovery in domestic and international economies, combined with an increase in exports predominantly from this region, helped stabilize production.
Coal production in Ohio in 2010 decreased by 0.2 million short tons, or 0.8 percent to end the year at 27.3 million short tons. Even though there were mines in the state that had higher production in 2010, decreases at other mines were able to slightly offset these increases. The majority of the 2010 decrease in production was a result of lower production levels at
three mines. Ohio Valley Coal’s Powhatan No. 6 mine had a decrease of 0.4 million short tons in 2010. Ohio American Energy’s Salt Run Mine No.1 had a decrease of 0.8 million short tons in 2010 and Rosebud Mining’s Bergholz 7 mine had a decrease of 0.3 million short tons in 2010.
West Virginia, the largest coal-producing State in the Appalachian Region, and the second largest in the U.S., saw a decrease in production of 1.6 million short tons to end the year with a total of 135.6 million short tons, 1.1 percent below the 2009 level, and its lowest level since 1993 when a prolonged miners’ strike affected coal production. The big story in West Virginia in 2010 was the explosion at Massey Energy’s Upper Big Branch mine. Twenty nine people were killed in the worst mining accident since 1970. Production at the mine ceased after the explosion, and was down 0.8 million short tons for the year. On a positive note for 2010, West Virginia enjoyed high export demand, and five of the largest
Figure 1. Coal Production by Coal-Producing Region, 2010 (Million Short Tons and Percent Change from 2009) Regional Totals do not include refuse recovery
U.S. Total: 1,085.3 Million Short Tons (1.0%)
Source: Energy Information Administration, Quarterly Coal Report, October-December 2010, DOE/EIA-0121(2010/Q4) (Washington, DC, April 2011).

4
mines had increases in production by more than 0.5 million short tons. Consolidation Coal’s Shoemaker mine in particular had a large increase in production in 2010 of 3.6 million short tons.
Figure 2. Coal Production by Region, 2000-2010 (Million Short Tons) Regional Totals do not include Refuse Recovery
Sources: Energy Information Administration, Quarterly Coal Report, October-December 2010, DOE/EIA-0121(2010/Q4) (Washington, DC, April 2011); Coal Industry Annual, DOE/EIA-0584, various issues; Annual Coal Report, DOE/EIA-0584, various issues.
Eastern Kentucky, which is identified as part of Central Appalachia, produced 67.4 million short tons of coal in 2010, a decrease of 9.7 percent or 7.3 million short tons below the 2009 level, and its lowest production level since the early 1970’s. While there were no very large drops in production in 2010, many of the biggest mines had declines of 0.2 million short tons or more, including Frasure Creek Mining’s Frasure Creek Mine No. 6 with a decline of 0.6 million short tons. However, in 2010 there was one mine in Eastern Kentucky that had an increase in its coal production level of 0.5 million short tons. Revelation Energy’s S-1 Hunts Br. Mine had an increase in production of 0.6 million short tons.
In 2010, Pennsylvania produced 58.0 million short tons, a very slight increase of 0.1 percent from 2009, and still at its lowest level in over 100 years. The two largest mines in the State, Consol Energy’s Enlow Fork mine and Bailey mine (also the two largest underground mines in the U.S.) went in different directions in 2010. The Enlow Fork mine decreased production by 1.2 million short tons, while the Bailey mine increased production by 0.4 million short tons. Coming off a decrease in production of
1.8 million short tons, and a period of idling in 2009, 2010 saw an increase of 0.7 million short tons at Consol Energy’s Blacksville No.2 mine. (This mine is classified by the Mine Safety and Health Administration as a West Virginia mine which is where the mine first produced coal. EIA classifies it as a Pennsylvania mine because the mine has progressed north from its opening portal and the coal that is currently being mined is under the State of Pennsylvania.) There was also a decrease in production of 0.5 million short tons at Consol Energy’s Mine 84 as it was placed into nonproducing status during the latter part of 2009, and did not produce in 2010. Decreases in coal production of 0.7 million short tons and 1.1 million short tons for the year at Alpha Natural Resources’ Emerald No. 1 and Cumberland mines respectively, also contributed to the decline in coal production experienced in Pennsylvania in 2010. An increase of 0.5 million short tons at PBS Coals’ Mine No.1 helped to minimize the decrease in Pennsylvania production.
Coal production in Virginia increased in 2010 by 0.6 million short tons to a total of 21.6 million short tons, an increase of 2.9 percent, but still near its lowest level since the mid-1950’s. After the largest decline in the state in 2009, Consol Energy’s Buchannan mine rebounded with the largest increase in the state in 2010, with a 1.8 million short ton increase in production. Drops in production at Dickenson-Russell Coal’s Roaring Fork No. 4 mine, Osaka Mining’s Mine No.1, and A & G Coal’s Preacher Creek Strip mine were able to keep Virginia’s increase modest.
In 2010, coal production in Alabama totaled 20.2 million short tons, 7.6 percent higher than the 2009 level. Increases at Chevron Mining’s North River #1 mine, Jim Walter Resources’ No.7 mine, and Shannon’s No.2 and No.3 mine of 0.3 million short tons, 0.5 million short tons, and 0.6 million short tons, respectively, accounted for a majority of Alabama’s increase. Maryland increased production in 2010 to 2.5 million short tons, while Tennessee experienced a decline to 1.7 million short tons.
Interior Region
Coal production in the Interior Region in 2010 was 156.7 million short tons, 10.8 million short tons more than in 2009. This increase was led by Texas, with a 6.5 million short ton increase in production over 2009. Texas was able to regain its position as the number one coal-producing state in the Interior Region.
5
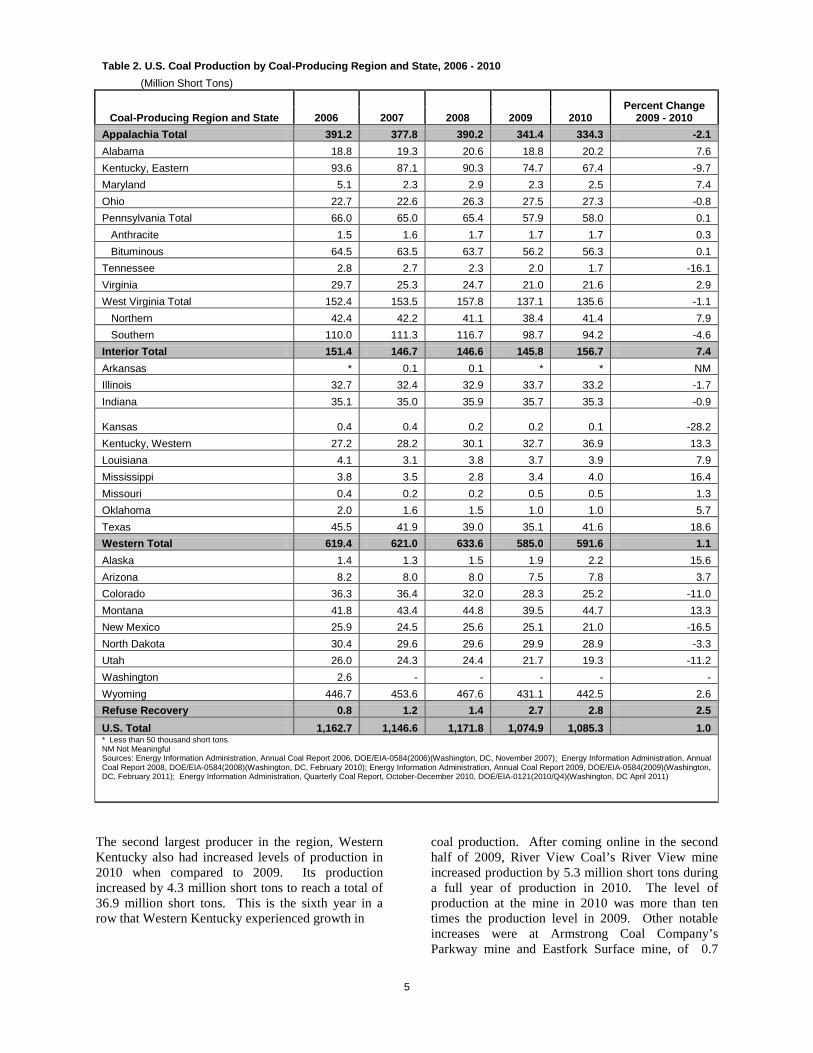
Table 2. U.S. Coal Production by Coal-Producing Region and State, 2006 - 2010 (Million Short Tons)
Coal-Producing Region and State Percent Change
2009 - 2010 2006 2007 2008 2009 2010 Appalachia Total 391.2 377.8 390.2 341.4 334.3 -2.1 Alabama 18.8 19.3 20.6 18.8 20.2 7.6 Kentucky, Eastern 93.6 87.1 90.3 74.7 67.4 -9.7 Maryland 5.1 2.3 2.9 2.3 2.5 7.4 Ohio 22.7 22.6 26.3 27.5 27.3 -0.8 Pennsylvania Total 66.0 65.0 65.4 57.9 58.0 0.1 Anthracite 1.5 1.6 1.7 1.7 1.7 0.3 Bituminous 64.5 63.5 63.7 56.2 56.3 0.1 Tennessee 2.8 2.7 2.3 2.0 1.7 -16.1 Virginia 29.7 25.3 24.7 21.0 21.6 2.9 West Virginia Total 152.4 153.5 157.8 137.1 135.6 -1.1 Northern 42.4 42.2 41.1 38.4 41.4 7.9 Southern 110.0 111.3 116.7 98.7 94.2 -4.6 Interior Total 151.4 146.7 146.6 145.8 156.7 7.4 Arkansas * 0.1 0.1 * * NM Illinois 32.7 32.4 32.9 33.7 33.2 -1.7 Indiana 35.1 35.0 35.9 35.7 35.3 -0.9
Kansas 0.4 0.4 0.2 0.2
0.1 -28.2 Kentucky, Western 27.2 28.2 30.1 32.7 36.9 13.3 Louisiana 4.1 3.1 3.8 3.7 3.9 7.9 Mississippi 3.8 3.5 2.8 3.4 4.0 16.4 Missouri 0.4 0.2 0.2 0.5 0.5 1.3 Oklahoma 2.0 1.6 1.5 1.0 1.0 5.7 Texas 45.5 41.9 39.0 35.1 41.6 18.6 Western Total 619.4 621.0 633.6 585.0 591.6 1.1 Alaska 1.4 1.3 1.5 1.9 2.2 15.6 Arizona 8.2 8.0 8.0 7.5 7.8 3.7 Colorado 36.3 36.4 32.0 28.3 25.2 -11.0 Montana 41.8 43.4 44.8 39.5 44.7 13.3 New Mexico 25.9 24.5 25.6 25.1 21.0 -16.5 North Dakota 30.4 29.6 29.6 29.9 28.9 -3.3 Utah 26.0 24.3 24.4 21.7 19.3 -11.2 Washington 2.6 - - - - - Wyoming 446.7 453.6 467.6 431.1 442.5 2.6 Refuse Recovery 0.8 1.2 1.4 2.7 2.8 2.5 U.S. Total 1,162.7 1,146.6 1,171.8 1,074.9 1,085.3 1.0 * Less than 50 thousand short tons. NM Not Meaningful Sources: Energy Information Administration, Annual Coal Report 2006, DOE/EIA-0584(2006)(Washington, DC, November 2007); Energy Information Administration, Annual Coal Report 2008, DOE/EIA-0584(2008)(Washington, DC, February 2010); Energy Information Administration, Annual Coal Report 2009, DOE/EIA-0584(2009)(Washington, DC, February 2011); Energy Information Administration, Quarterly Coal Report, October-December 2010, DOE/EIA-0121(2010/Q4)(Washington, DC April 2011)
The second largest producer in the region, Western Kentucky also had increased levels of production in 2010 when compared to 2009. Its production increased by 4.3 million short tons to reach a total of 36.9 million short tons. This is the sixth year in a row that Western Kentucky experienced growth in
coal production. After coming online in the second half of 2009, River View Coal’s River View mine increased production by 5.3 million short tons during a full year of production in 2010. The level of production at the mine in 2010 was more than ten times the production level in 2009. Other notable increases were at Armstrong Coal Company’s Parkway mine and Eastfork Surface mine, of 0.7

6
million short tons, and 0.9 million short tons, respectively. Both of these mines had their first full year of production in 2010.
Coal production in 2010 in Illinois decreased by 1.7 percent to end the year at a total of 33.2 million short tons. Although there were large increases from some mines, there were enough decreases to offset any gains. An increase in coal production in 2010 of 0.9 million short tons by Maryan Mining’s Shay #1 mine, combined with a full year operating of Knight Hawk Coal’s Prairie Eagle South mine was not enough to overcome large decreases. Peabody Energy’s Willow Lake mine saw a production drop of 0.5 million short tons in 2010, and White County Coal’s Pattiki mine saw a decrease of 0.8 million short tons.
Indiana produced a total of 35.3 million short tons in 2010, a decrease of 0.9 percent or 0.3 million short tons. A new mine in 2010, Peabody Energy’s Bear Run mine had production of 3.0 million short tons. This mine is the largest surface mine in the eastern U.S. Black Panther Mining’s Oaktown Fuels No.1 mine increased production by nearly 1.0 million short tons after a full year of mining in 2010. However, these increases could not offset large decreases in Solar Sources’ Craney mine, and Peabody Energy’s Viking mine, Francisco mine, and Farmersburg mine of 0.4 million short tons, 0.3 million short tons, 1.4 million short tons, and 2.0 million short tons, respectively.
Texas coal is lignite, the lowest rank of coal with the lowest amount of energy (or Btus) and the vast majority of the coal is used in the electric power sector, primarily at mine-mouth facilities. The amount of Texas-produced lignite consumed by the electric power sector in the State in 2010 increased by 9.6 percent, while the total amount of all types of coal consumed in the electric power sector in Texas increased by 5.1 percent. The discrepancy is due to the fact that the amount of subbituminous coal consumed for power production increased by only 2.7 percent. Total coal production in Texas for 2010 was 41.6 million short tons, an increase of 18.6 percent. Seven of the twelve mines in Texas had increases in coal production in 2010, with one mine accounting for the majority of the increase; Luminant Mining’s Kosse Strip mine increased by 5.4 million short tons.
The other States in the Interior Region (Arkansas, Kansas, Louisiana, Mississippi, Missouri, and Oklahoma), which together produced 9.6 million short tons of coal, accounted for a total of 6.1 percent of the entire region’s production in 2010. Of these
States, only Kansas had a decrease in its coal production from the prior year level.
Western Region
The Western Region is the largest coal-producing region in the U.S. In 2010 coal production increased by 1.1 percent to a total of 591.6. Even with the increase in production, the production level was still well below the 2008 level of 633.6 million short tons.
Of all the coal-producing States in the Western Region, Alaska, with one mine, has the smallest level of production. However, in 2010, it had the largest percentage increase in production, increasing 0.3 million short tons, or 15.6 percent and ended the year with a total of 2.2 million short tons. North Dakota produced 28.9 million short tons of coal in 2010, a decrease of 1.0 million short tons or 3.3 percent. There are four mines in North Dakota, and in 2010 three of the mines, BNI Coal’s Center mine, Falkirk Mining’s Falkirk mine and Coteau Property’s Freedom mine, had decreased production levels.
Wyoming, the largest coal-producing State in the nation, a position it has held for two decades, continues to dominate the U.S. coal production picture. In 2010, coal production rose in Wyoming after falling for the first time in 17 years in 2009. Total coal production in Wyoming in 2010 was 442.5 million short tons, an increase of 11.4 million short tons, or 2.6 percent. As an illustration of how much Wyoming dominated the U.S. coal supply in 2010, it accounted for 74.8 percent of the Western Region production total; was 108.2 million short tons more than the entire Appalachian Region; was almost three times the Interior Region; and was more than 40 percent of the total U.S. coal production for the year. Thunder Basin Coal Company’s Black Thunder mine overtook Peabody Energy’s North Antelope Rochelle mine as the largest coal mine in Wyoming and the U.S. in 2010, producing a total of 116.2 million short tons. This one mine produced more coal than any one State in the nation except West Virginia. Peabody Energy’s North Antelope Rochelle mine also had a large increase, at 7.5 million short tons. Wyoming mines that had large decreases in 2010 coal production were: Alpha Coal’s Belle Ayr mine down 2.6 million short tons; Peabody Energy’s Rawhide mine down 4.6 million short tons; and Peabody Energy’s Caballo mine down 5.5 million short tons.
In 2010, Montana, the second largest coal-producing State in the Western Region, produced a total of 44.7 million short tons, an increase of 13.3 percent or 5.2
7
million short tons. Three mines had large increases in coal production in 2010, which were more than enough to offset the decrease of 1.5 million short tons at Decker Coal Company’s Decker mine. Spring Creek Coal’s Spring Creek mine had an increase of 1.7 million short tons, Western Energy’s Rosebud mine had an increase of 1.9 million short tons, and Signal Peak Energy’s Bull Mountain No.1 mine had an increase of 3.6 million short tons. Colorado had a decrease in coal production for the fourth year in a row in 2010. Production declined 3.1 million short tons from 2009 levels, or 11.0 percent to end 2010 at 25.2 million short tons. Although four of the ten mines in the State had increases in coal production in 2010, the decrease in Colorado’s total production was accounted for primarily by two mines. Colowyo Coal’s Colowyo mine had a decrease of 1.0 million short tons and Oxbow Mining’s Elk Creek mine had a decrease of 1.9 million short tons.
Utah production declined for the third year in a row in 2010. Production declined by 11.2 percent to end the year at a total of 19.3 million short tons. The majority of the decrease in coal production in 2010 in Utah was the result of the declines at two mines: Energy West Mining’s Deer Creek mine and Canyon Fuel’s Dugout Canyon mine, which had decreases of 0.9 and 0.8 million short tons, respectively. Total coal production in Arizona increased in 2010 by 0.3 million short tons, and total coal production in New Mexico declined in 2010 by 4.1million short tons.
Coal Consumption
Preliminary data shows that total coal consumption rebounded in 2010, increasing by 5.1 percent from the 2009 level. Total U.S. coal consumption was 1,048.3 million short tons, an increase of 50.8 million short tons, with all coal-consuming sectors, except commercial and institutional users, having higher consumption for the year. The 2010 increase in consumption, over 2009, restored about 40 percent of the previous drop in consumption in 2009 from 2008 levels. The electric power sector (electric utilities and independent power producers), which consumes about 93 percent of all coal in the U.S., is the overriding force for total domestic coal consumption. In 2010, the turnaround in the economy led to a large increase in coal consumption for the sector. Coal consumption in the electric power sector increased by 4.5 percent or 42.0 million short tons to end 2010 at 975.6 million short tons (Figure 3), while coal-based electricity generation in kilowatt hours increased at a slightly higher rate of 5.2 percent. The higher rate of production growth occurred because power plants
consumed more high-Btu bituminous coal purchased from the Interior production region and out of stocks in areas predominantly burning bituminous coal to generate electricity (Figure 4.) (Note: Graph shows both tons of coal consumed in the electric power sector and the amount of coal-generated kilowatt hours indexed to 1990, i.e., values for the data were set to 1 for 1990. 1990 was the year that the Clean Air Act Amendments were passed.) Nationally, total generation in the electric power sector increased in 2010 by 4.2 percent. Preliminary data shows that nuclear power generation increased in 2010 by 1 percent. Coal, natural gas, and petroleum and other sources1
The economy and the weather (as measured by heating and cooling degree-days) are among the main factors that drive changes in total electricity demand in the U.S. In 2010, the economy expanded as the real Gross Domestic Product (GDP) of the U.S. increased by 2.7 percent from 2009. The weather was also a factor in the increase of total electricity generation in 2010. Some regions with high reliance on coal for electricity generation--South Atlantic, East South Central, West South Central and Mountain--had colder winters in 2010 than in 2009, and higher heating demands. In contrast, New England, with low electricity generation by coal, had a warmer winter as did the Middle Atlantic, East North Central, and West North Central regions. On balance, accounting for the relative amounts of coal generation and the pattern of weather, the net effect was relatively more generation by coal in 2010 compared to 2009.
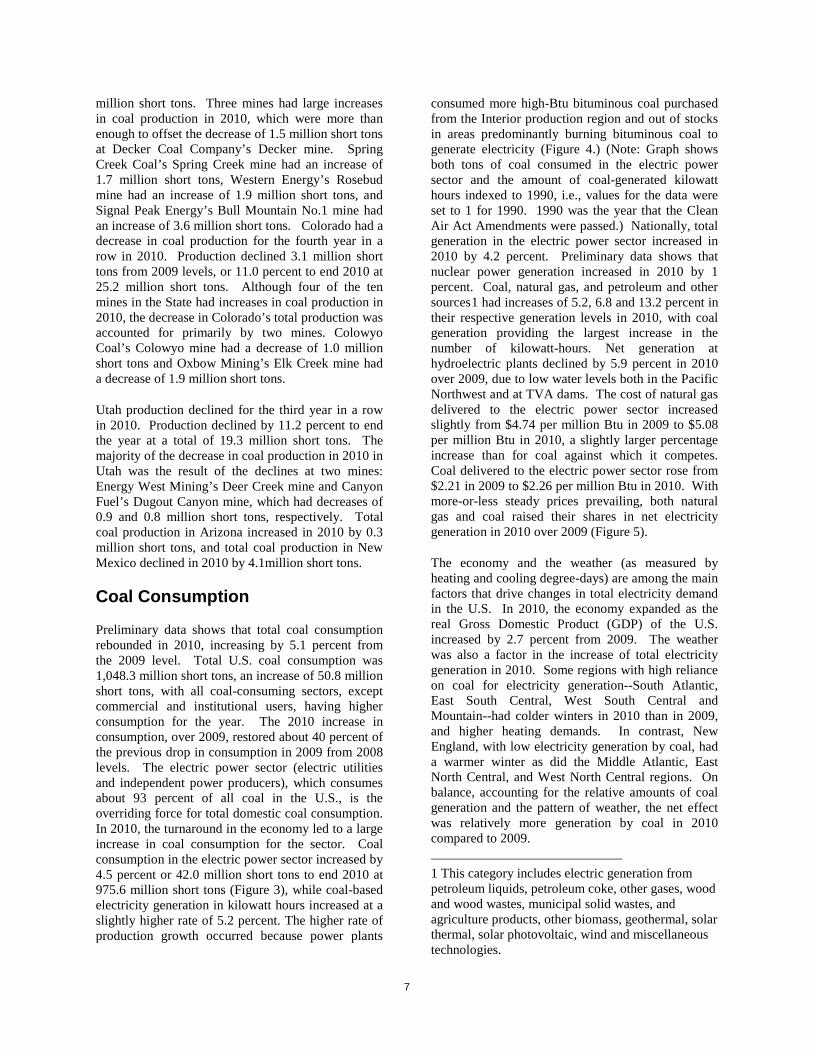
had increases of 5.2, 6.8 and 13.2 percent in their respective generation levels in 2010, with coal generation providing the largest increase in the number of kilowatt-hours. Net generation at hydroelectric plants declined by 5.9 percent in 2010 over 2009, due to low water levels both in the Pacific Northwest and at TVA dams. The cost of natural gas delivered to the electric power sector increased slightly from $4.74 per million Btu in 2009 to $5.08 per million Btu in 2010, a slightly larger percentage increase than for coal against which it competes. Coal delivered to the electric power sector rose from $2.21 in 2009 to $2.26 per million Btu in 2010. With more-or-less steady prices prevailing, both natural gas and coal raised their shares in net electricity generation in 2010 over 2009 (Figure 5).
1 This category includes electric generation from petroleum liquids, petroleum coke, other gases, wood and wood wastes, municipal solid wastes, and agriculture products, other biomass, geothermal, solar thermal, solar photovoltaic, wind and miscellaneous technologies.

8
The summer weather in 2010 was warmer than in 2009 in every region of the U.S. except the Mountain and Pacific regions, which resulted in higher summer generation to run air-conditioners.
Of the nine Census Divisions (Table 3.), coal is a minor component (less than 20 percent) in the fuel mix for electricity generation in two divisions, New England and Pacific, and a major component (more than 50 percent) in four divisions, East North Central, West North Central, East South Central, and Mountain. In two other divisions, coal is one of two main fuel sources for the electric power sector. In the Middle Atlantic, coal competes with nuclear power for dominance, while in the West South Central coal competes with natural gas. In the South Atlantic Division fuel use for electricity generation has coal dominating (accounting for about 47 percent of net generation) but with a large combined share for natural gas and nuclear (49 percent) about evenly split between those two fuels. In 2010, all Census Divisions, except the Mountain and Pacific, had an increase in total net electricity generation. Except for New England, coal consumption for the electric power sector grew in 2010. Total coal consumption in the electric power sector rose by 42 million short
Figure 3. Electric Power Sector Consumption of Coal by Census Region, 2010 (Million Short Tons and Percent Change from 2009)
U.S. Total: 975.6 Million Short Tons (4.5%)
Source: Energy Information Administration, Form EIA-923, "Power Plant Operations Report."
Figure 4. Comparison of Coal Consumption to Coal Generation for Electric Power Sector (indexed, 1990=1.00)
Sources: • 1990-1997—EIA, Form EIA-759, "Monthly Power Plant Report," and Form EIA-867, Annual Nonutility Power Producer Report. • 1998-2000—EIA, Form EIA-759, "Monthly Power Plant Report," and Form EIA-860B, "Annual Electric Generator Report—Nonutility." • 2001-2003—EIA, Form EIA-906, "Power Plant Report." • 2004-2007—EIA, Form EIA-906, "Power Plant Report," and Form-920, "Combined Heat and Power Plant Report" • 2008-2010 — EIA, Form 923, "Power Plant Operations Report."
9
tons in 2010, with two of the Census Divisions, the South Atlantic and the East South Central, accounting for about half of the gain.
The South Atlantic Census Division typically accounts for about 20 percent of total U.S. electricity generation. Coal is the primary fuel for electricity generation. In 2010 total generation in the South Atlantic Census Division increased by 6.4 percent (Table 3) while coal-based generation increased by 8.7 percent. The increase in coal-based electricity generation in 2010 in the Division resulted in an increase in coal consumption of 11.9 million short tons, up 8.1 percent to end the year at 159.9 million short tons. As a consequence of the increase in coal consumption in the Division, coal stocks at power plants decreased in 2010 by 19.7 percent to end the year at 32.3 million short tons. This decrease of 7.9 million short tons in the Division accounted for more than half of the total decrease in coal stocks in the electric power sector at the national level. Natural gas generation increased in the Division in 2010 by 14.5 percent. The South Atlantic’s other large generation sector, nuclear, declined by 3 percent, due largely to refueling outages. The shares of both coal and natural gas generation increased to fill declining generation by hydroelectric and nuclear plants. In 2009, low natural gas prices led to switching out of coal. Those low natural gas prices continued into 2010 but stayed close in relative value to coal prices. The 2010 rebound in generation propelled by economic recovery, without further price advantage to natural gas, gave back increased generation in both coal and natural gas.
In 2010, total generation in the East North Central Census Division grew by 6.3 percent as all fuels, except hydroelectric, showed gains over 2009. The two largest generating fuels—coal and nuclear—provided 92 percent of the Division’s total generation. The three remaining fuels—hydroelectric, natural gas, and petroleum and other—had a net change in generation that was about one-half the size of the coal and nuclear gain. Coal generally accounts for about 70 percent of generation in the Division, and this makes it the single largest coal consuming Census Division for the electric power sector, usually accounting for just under one-quarter of total U.S. coal consumption in the electric power sector. The increase in coal-based generation in the Division in 2010 resulted in an increase in coal consumption of 8 million short tons or an increase of 3.7 percent.
In 2010, additions by coal- and natural-gas-based generation in the East South Central Division represented almost all of the gains in 2010 over 2009. The share of coal in the Division’s generation was about 55 percent and that of natural gas about 20 percent. Lower generation at hydroelectric dams, down by 22 percent due to low water levels, was more than offset by the generation gains for coal and natural gas as total generation for the Division grew by 7.3 percent. Coal consumption to generate electricity increased by 7.3 million short tons, 2010 over 2009, making the East South Central Division the third largest gainer after the South Atlantic Division in 2010.
Total generation in the Middle Atlantic Census Division in 2010 increased by 4.4 percent, with hydroelectric- and nuclear-based generation showing declines for the year. These losses in generation were more than offset by coal- and natural-gas-based generation gains. Due to faster growth in natural gas, its share in the Division’s total generation edged up from 22 to 24 percent, while coal’s share remained at about 30 percent.
In the West South Central Census Division coal competes with natural gas as the primary source for electric power generation, with each accounting for about 40 percent of the Division’s generation. Total generation in 2010 in the Division’s electric power sector increased by 3 percent. Increases in coal generation accounted for about 53 percent of this growth while petroleum and other accounted for an additional 45 percent of the overall gain. Generation by natural gas remained steady near its 2009 level. Total coal consumption in 2010 for the Division’s electric power sector increased by 5.1 million short
Figure 5. Share of Electric Power Sector Net Generation by Energy Source, 2009 vs. 2010
Source: Energy Information Administration, Form EIA-923, "Power Plant Operations Report."
10
tons, or 3.5 percent, ending the year at a total of 152.2 million short tons.
Over half of the electricity generated in the Mountain Census Division is derived from coal. In 2010 total generation in the Division declined by 0.7 percent, but coal-based generation rose by 2.7 percent and petroleum and other sources, increased by 24.3 percent. The decline in generation by hydroelectric (-5.4 percent) and natural gas generation (-10.6 percent) more than offset increases by other fuels. Total coal consumption in the electric power sector in the Division increased in 2010, ending the year at 113 million short tons, an increase of 3 million short tons.
In the West North Central Census Division coal is the dominant source for electric power generation accounting for about 70 percent of the Division’s generation. Total generation in 2010 in the electric power sector in the Division grew by 5.4 percent. Generation by every fuel type increased. Total coal consumption in 2010 for the electric power sector in the Division increased by 2.4 million short tons, or 1.6 percent, ending the year at a total of 146.7 million short tons.
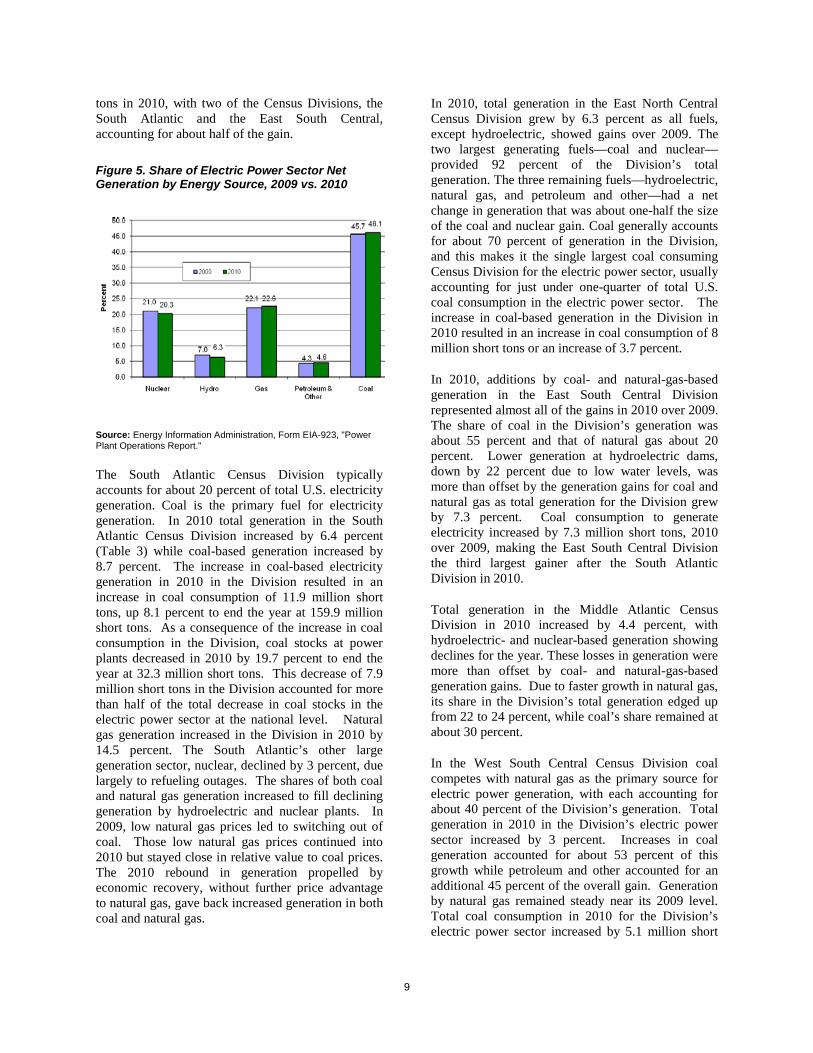
Table 3. Electric Power Sector Net Generation, 2009- 2010 (Million Kilowatthours)
Census Division and Fuel 2009 2010
Percent Change
New England Coal 14,378 14,244 -0.9 Hydroelectric 7,759 6,861 -11.6 Natural Gas 48,007 54,680 13.9 Nuclear 36,231 38,361 5.9 Other (1) 9,186 9,063 -1.3 Total 115,559 123,210 6.6 Middle Atlantic Coal 121,873 129,935 6.6 Hydroelectric 28,793 26,463 -8.1 Natural Gas 89,808 104,341 16.2 Nuclear 155,140 152,469 -1.7 Other (1) 13,011 13,600 4.5 Total 408,625 426,808 4.4 East North Central Coal 412,245 426,390 3.4 Hydroelectric 2,939 2,480 -15.6 Natural Gas 25,139 35,733 42.1 Nuclear 145,214 154,900 6.7 Other (1) 11,684 15,628 33.8 Total 597,221 635,130 6.3 West North Central Coal 224,237 229,301 2.3 Hydroelectric 10,384 12,143 16.9 Natural Gas 10,256 13,771 34.3 Nuclear 45,523 47,535 4.4 Other (1) 21,796 26,165 20.0 Total 312,197 328,916 5.4
South Atlantic Coal 340,900 370,524 8.7 Hydroelectric 13,335 12,388 -7.1 Natural Gas 167,055 191,307 14.5 Nuclear 196,560 190,741 -3.0 Other (1) 19,267 19,645 2.0 Total 737,117 784,605 6.4 East South Central Coal 192,613 209,696 8.9 Hydroelectric 25,415 19,735 -22.3 Natural Gas 54,788 71,176 29.9 Nuclear 77,677 75,323 -3.0 Other (1) 2,748 3,127 13.8 Total 353,240 379,058 7.3 West South Central Coal 220,819 229,598 4.0 Hydroelectric 9,994 8,643 -13.5 Natural Gas 224,695 224,963 0.1 Nuclear 73,450 74,997 2.1 Other (1) 28,251 35,883 27.0 Total 557,209 574,085 3.0 Mountain Coal 199,822 205,221 2.7 Hydroelectric 32,847 31,060 -5.4 Natural Gas 90,788 81,123 -10.6 Nuclear 30,662 31,200 1.8 Other (1) 11,680 14,524 24.3 Total 365,799 363,128 -0.7 Pacific Coal 14,235 16,315 14.6 Hydroelectric 135,413 131,463 -2.9 Natural Gas 130,365 121,279 -7.0 Nuclear 38,398 41,442 7.9 Other (1) 44,358 45,794 3.2 Total 362,769 356,294 -1.8 Total U.S. Coal 1,741,123 1,831,226 5.2 Hydroelectric 266,879 251,237 -5.9 Natural Gas 840,900 898,373 6.8 Nuclear 798,855 806,968 1.0 Other (1) 161,980 183,429 13.2 Total 3,809,737 3,971,233 4.2 (1) Other fuel: Includes petroleum, other gases, and renewables. Notes: Totals may not equal sum of components due to independent rounding. Electric power sector data for 2010 is preliminary. Source: Energy Information Administration, Form EIA-923, "Power Plant Operations Report."
Total electric power sector generation in the New England Census Division increased in 2010 by 6.6 percent, while coal-based generation declined by 0.9 percent. New England was the only census division that used less coal in 2010 than in 2009 for generating electric power. The growth in natural gas and nuclear generation propelled the Division to its gain in total generation. Coal accounts for less than one-eighth of total generation in the Division and in 2010 total coal consumption for electricity generation decreased by 100 thousand short tons, ending the year at a total of 6.3 million short tons.
Total generation in the Pacific Census Division in 2010 decreased by 1.8 percent, while coal-based generation increased by 14.6 percent. The Pacific and

11
Mountain Census Divisions were the only divisions with lower levels of electricity generated in 2010 than in 2009. Coal accounts for less than five percent of total generation in the Division and in 2010 total coal consumption for electricity generation grew by 15.7 percent to end the year at 10.3 million short tons.
Coal consumption in the non-electric power sector (comprised of other industrial, coking coal, and the commercial and institutional sectors) increased in 2010 (Figure 6) as the economy rebounded. Coal consumed by Other Industrial went up by 3.2 million tons or 7.1 percent, reaching 48.5 million short tons. Coal consumption at coke plants increased by 5.8 million short tons, an increase of 37.6 percent. Coal consumed by commercial and institutional users declined slightly from 3.2 to 3.1 million short tons, 2010 over 2009. In 2010, except for one small coal consuming sector-- transportation equipment manufacturing--all manufacturing sectors (as defined by EIA at the 3-digit level of the North American Industry Classification System) had higher coal consumption. However, the long-term trend for coal consumption in the manufacturing sector, starting from the late 1980’s, has been down. In 1988, coal consumption hit a peak over the preceding 20 years of 76.3 million short tons. Since then it has been declining at an average annual rate of 2 percent.
Coal Prices
In 2010, most domestic coal prices continued to increase, rising for the seventh consecutive year. Spot coal prices declined sharply at the end of 2008 and early 2009. While there has been a steady increase in North and Central Appalachian coal spot prices ever since, these prices have recovered about half their drops from peak 2008 levels, and other coal spot prices have increased only slightly from recent bottoms. As contracts expire and are renegotiated, the prevailing spot price influences the price on new and renegotiated contracts. Recent rising spot prices have maintained upward pressure on contract prices. According to preliminary data for 2010, coal prices at electric utilities (a subset of the electric power sector) increased for a tenth consecutive year, to $45.09 per short ton, an increase of 1.4 percent over the 2009 price, as compared to the previous year when these prices increased much more by 8.3 percent. Coal prices at independent power producers for 2010 increased to $41.49 per short ton, an increase of 3.9 percent. The average delivered price of coal to the other industrial sector decreased by 1.0 percent to an average price of $64.24 per short ton in 2010. In 2010 the delivered price of coal to U.S. coke plants increased by 7.4 percent to reach an average price of $153.59 per short ton (Figure 7). The average delivered price of coal to the commercial and institutional sector fell in 2010 by 9.1 percent to $88.42 per short ton.
Figure 6. Coal Consumption by Sector, 2000-2010 (Million Short Tons)
Source: Energy Information Administration, Quarterly Coal Report, October-December, DOE/EIA-0121, various issues.
Figure 7. Delivered Coal Prices, 2000-2010 (Nominal Dollars per Short Ton)
Sources: Energy Information Administration, Quarterly Coal Report, October-December, DOE/EIA-0121, various issues, and Electric Power Monthly, March, DOE/EIA-0226, various issues.

12
Coal Exports and Imports
Exports. Total U.S. coal exports for 2010 increased by 38.3 percent to 81.7 million short tons (Figure 8). This increase was largely due to two factors. First, heavy rains and flooding in Australia, Indonesia, and Colombia reduced world coal supply and forced many coal importing nations to look elsewhere, primarily to the United States, to fulfill their coal needs. In addition, the shortage of their own domestic coal in relation to growing needs, namely for China and India, provided ample opportunities for U.S. coal producers to export to these markets.
U.S. coke exports increased in 2010 by 11.9 percent to a total of 1.5 million short tons. Mexico received 510 thousand short tons or 34.8 percent of total U.S. coke exports, while Canada received 400 thousand short tons in 2010. Last year, Brazil and India increased their share of total U.S. coke exports by 4.9 and 2.0 percentage points, respectively. The average price of coke exports in 2010 was $167.25 per short ton, an increase of 61.7 percent from 2009.
In 2010, the average price of U.S. coal exports increased by 18.7 percent to $120.41 per short ton. Metallurgical coal exports, which accounted for 68.7 percent of total coal exports, increased by 50.6 percent to 56.1 million short tons in 2010. The average price of U.S. metallurgical coal exports grew by 23.5 percent to a level of $145.44 per short ton, an increase of $27.71 per short ton from the 2009 level. Steam coal exports increased in 2010. With a percentage change of 17.2 percent, total steam coal exports hit 25.6 million short tons. However, unlike the average price of metallurgical exports, the average price of steam coal exports dropped by 11.0 percent to $65.54 per short ton.
Nearly half of all U.S. coal exports were destined for European markets. In 2010, metallurgical coal exports to Europe increased by 49.5 percent to 29.5 million short tons. Metallurgical exports to the Netherlands, 9.7 percent of total U.S. metallurgical exports in 2010, grew to 5.4 million short tons. (Note: Most ports in the Netherlands serve as transshipment points for coal. Hence, exports to the Netherlands may be bound for other countries in the region.) In 2010, the United Kingdom and Italy were other key European destinations for U.S. metallurgical coal exports. U.S. metallurgical coal exports to the United Kingdom totaled 3.0 million short tons, an increase of 52.2 percent since the previous year. In addition, the average price per ton increased from $106.19 to $131.66. Italy received a
total of 2.6 million short tons in 2010, 25.2 percent greater than total metallurgical exported to Italy in 2009. Similar to the average price of metallurgical coal exports to the United Kingdom, average price of metallurgical coal exports to Italy grew; from $116.13 per short ton to $145.39 per short ton in 2010. Furthermore, U.S. metallurgical coal exports to Ukraine, Turkey, and Poland increased by over 144 percent in 2010.
Europe is the second largest market for U.S. steam coal exports. U.S. steam coal exports to Europe have thrived because many European nations have reduced production of coal. Moreover, South Africa, a coal exporting nation, has increased exports to India and China leaving less coal to be exported to the European markets. Proximity to major European ports has contributed to export increases to Europe. However, in 2010, total steam coal exports to Europe declined by 15.6 percent to 8.8 million short tons. Last year, European nations utilized existing stockpiles of coal. Moreover, exports of steam coal to the United Kingdom, which decreased by 47.9 percent to 1.3 million short tons, were affected by subsidies provided to utilities by the British government to diversify to biomass and other renewable energy sources. France and Germany are key destinations for U.S. steam coal exports, accounting for 4.6 percent and 4.0 percent, respectively, of total U.S. steam coal exports. While
Figure 8. U.S. Coal Export and Imports, 2000-2010 (Million Short Tons)
Sources: U.S. Department of Commerce, Bureau of the Census, "Monthly Report EM 545" and "Monthly Report IM 145."
13
exports to France declined by 2.8 percent, exports to Germany remained strong, growing at 28.5 percent.
Asian markets received 17.9 million short tons or 21.9 percent of total coal exports in 2010. This increase of 176.0 percent from 2009 exports was due primarily to a surge in sales of metallurgical coal to China, Japan, and South Korea, and sales of steam coal to China and South Korea. Total metallurgical coal exports to Asia totaled an estimated 13 million short tons in 2010, an increase of 133.0 percent from 2009, China received 4.2 million short tons or 32.4 percent of all metallurgical coal exports to Asia. South Korea remained the second largest Asian destination of U.S. metallurgical coal exports in 2010, securing 3.0 million short tons, 73.7 percent greater exports than in 2009. The average price of metallurgical coal exports to South Korea increased by 32.1 percent to $141.62. Japan and India acquired roughly 3.0 million short tons and 2.5 million short tons, respectively. The increased use of steel in Japan, the result of fiscal stimuli and export growth in 2010, is a reason for the 332.0 percent rise in metallurgical coal exports to the nation.
In 2010, steam coal exports to Asia increased dramatically by 437.6 percent from 2009 to 4.9 million short tons. As global supplies of thermal coal tightened and steam coal prices increased steadily, Asian nations, namely South Korea and China increased imports of U.S. thermal coal. South Korea remained the primary Asian destination of U.S. steam coal exports with a total of 2.8 million short tons. Additionally, steam coal exports to South Korea as a percentage of total U.S. steam coal exports increased by 8.9 percentage points. The average price of U.S. steam coal exports to South Korea was $40.54 per short ton, a decrease of 12.4 percent from the 2009 price. Exports to China increased to 1.6 million short tons from 0.2 million short tons. The average price of U.S. steam coal exports to China was $62.91 per short ton, a decrease of 13.1 percent from the 2009 price.
In 2010, total U.S. coal exports to countries in North and South America increased to 13.4 million short tons and 9.5 million short tons, respectively. Average prices per short ton increased by 10.5 percent to $77.91 per short ton and 22.4 percent to $142.09 per short ton, respectively. U.S. metallurgical coal exports to countries in North and South America increased in 2010. The greatest increase in exports was to Canada and Brazil. Canada received 3.4 million short tons, an increase of 42.6 percent from 2009, while shipments to Brazil increased by 6.1 percent to total 7.9 million short
tons. The average price of metallurgical coal exports to Canada and Brazil increased to $112.25 per short ton and $155.26 per short ton, respectively.
Canada remains the single largest market for all U.S. steam coal exports. In 2010, exports to Canada, which accounts for 31.2 percent of all U.S. steam coal exports, decreased by 2.6 percent to an estimated 8.0 million short tons. However, the average price of steam coal exports to Canada increased by 2.2 percent to $59.84 per short ton. (Note: Currently, there are no major coal-exporting facilities on the U.S. west coast. Coal producers in the west coast utilize coal-export terminals in British Columbia for shipments to Asian markets.)
Total steam coal exports to South America grew from 0.7 million short tons in 2009 to 1.3 million short tons in 2010. Similar to 2009, Chile received most of U.S. export of steam coal to South America in 2010. Further, Chile increased imports of U.S. steam coal by 70.5 percent to 1.2 million short tons. The average price of steam coal exports to South America and in particular to Chile decreased in 2010.
Total coal exports to Africa increased by 42.7 percent to 2.6 million short tons. While exports of metallurgical coal to South Africa decreased to 149 thousand short tons, exports to Egypt increased by 81.6 percent to an estimated 1.1 million short tons in 2010. Average price of metallurgical coal exports to Egypt increased by 42.2 percent from 2009 to $167.25 per short ton.
U.S. steam coal exports to the African continent gained by 78.0 percent in 2010, to a total of 1.3 million short tons. The majority of the increase in steam coal exports to Africa is attributable to one country, Morocco. Total steam coal exports to Morocco in 2010 were 1.1 million short tons, an increase of over 60 percent. The average price of steam coal exports to Morocco decreased in 2010 to $73.65 per short ton.
Imports. In 2010, coal imports represented only 1.9 percent of total U.S. coal consumption. Last year, U.S. coal imports decreased by 3.3 million short tons to 19.4 million short tons. Colombia, which has dominated the U.S. coal import market for many years, accounted for over three-fourths of all coal imports. Imports from Colombia, however, decreased by 18 percent to 14.6 million short tons in 2010. Indonesia and Venezuela imports decreased to 1.9 million short tons and 0.6 million short tons, respectively, while imports from Canada increased by a modest 0.5 million short tons. The average price of
14
imported coal increased by 12.3 percent to $71.77 per short ton in 2010.
Coke imports rose by 250.2 percent to 1.2 million short tons in 2010. Average price of coke imports increased to $331.70 per short ton after a fall in 2009 to $268.37 per short ton.
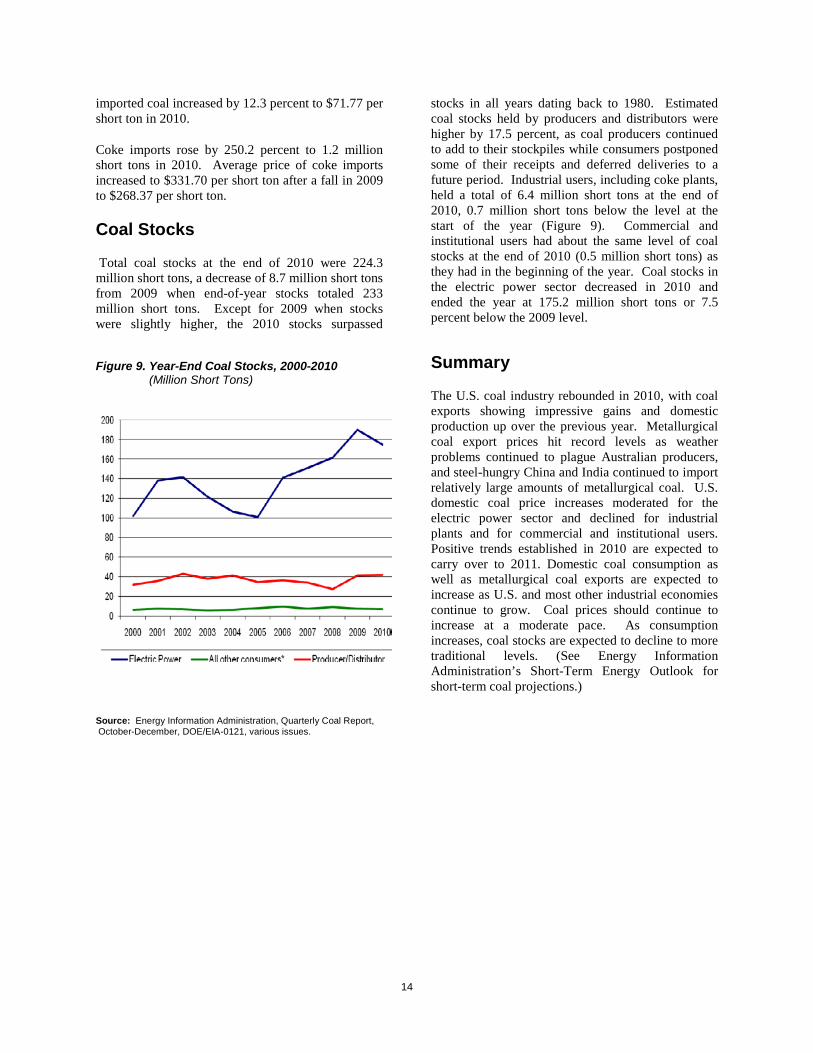
Coal Stocks
Total coal stocks at the end of 2010 were 224.3 million short tons, a decrease of 8.7 million short tons from 2009 when end-of-year stocks totaled 233 million short tons. Except for 2009 when stocks were slightly higher, the 2010 stocks surpassed
stocks in all years dating back to 1980. Estimated coal stocks held by producers and distributors were higher by 17.5 percent, as coal producers continued to add to their stockpiles while consumers postponed some of their receipts and deferred deliveries to a future period. Industrial users, including coke plants, held a total of 6.4 million short tons at the end of 2010, 0.7 million short tons below the level at the start of the year (Figure 9). Commercial and institutional users had about the same level of coal stocks at the end of 2010 (0.5 million short tons) as they had in the beginning of the year. Coal stocks in the electric power sector decreased in 2010 and ended the year at 175.2 million short tons or 7.5 percent below the 2009 level.
Summary
The U.S. coal industry rebounded in 2010, with coal exports showing impressive gains and domestic production up over the previous year. Metallurgical coal export prices hit record levels as weather problems continued to plague Australian producers, and steel-hungry China and India continued to import relatively large amounts of metallurgical coal. U.S. domestic coal price increases moderated for the electric power sector and declined for industrial plants and for commercial and institutional users. Positive trends established in 2010 are expected to carry over to 2011. Domestic coal consumption as well as metallurgical coal exports are expected to increase as U.S. and most other industrial economies continue to grow. Coal prices should continue to increase at a moderate pace. As consumption increases, coal stocks are expected to decline to more traditional levels. (See Energy Information Administration’s Short-Term Energy Outlook for short-term coal projections.)
Figure 9. Year-End Coal Stocks, 2000-2010 (Million Short Tons)
Source: Energy Information Administration, Quarterly Coal Report, October-December, DOE/EIA-0121, various issues.