Embed Size (px)
Citation preview

U.S. Census Bureau’s Budget Estimates
As Presented to Congress March 2014
Fiscal Year 2015


Exhibit 1 Department of Commerce
U.S. Census Bureau BUDGET ESTIMATES, FISCAL YEAR 2015
CONGRESSIONAL SUBMISSION
Table of Contents
Exhibit Page Number Exhibit Number
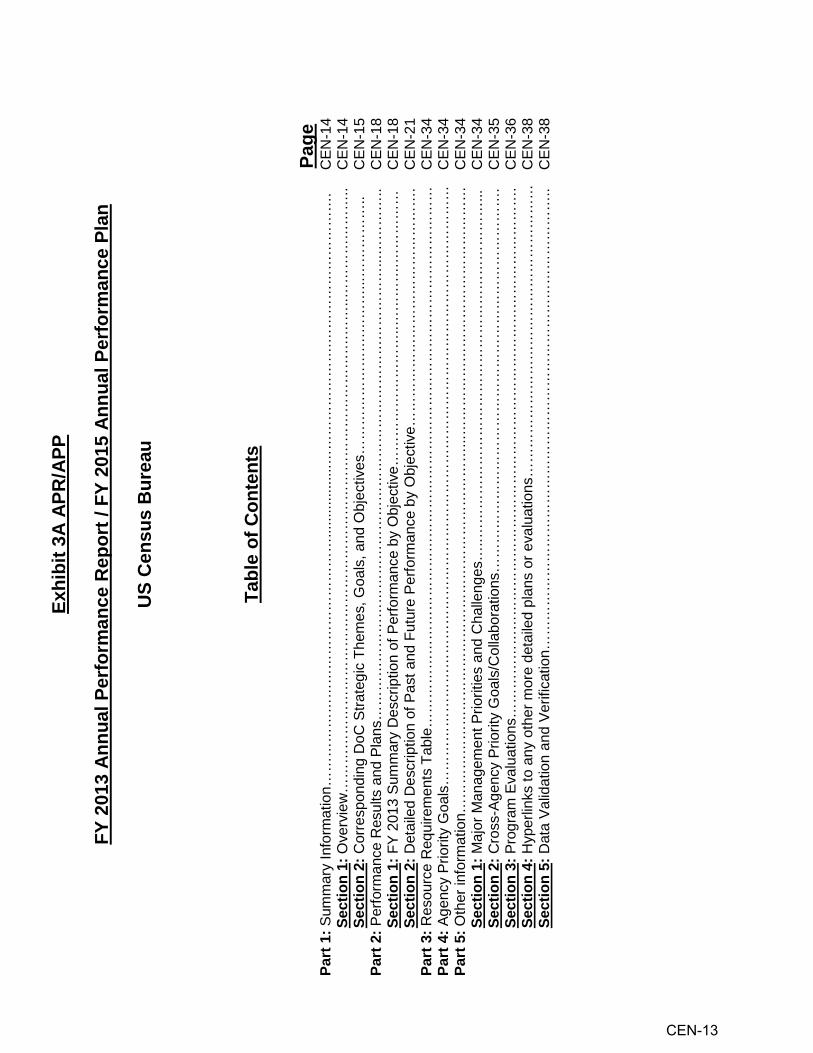
2 Organization Chart CEN-1 3 Executive Summary CEN-3 3A Annual Performance Plan & Annual Performance Report CEN-13
Salaries and Expenses: 5 Summary of resource requirements (Discretionary) CEN-39 5 Summary of resource requirements (Mandatory) CEN-40 7 Summary of financing CEN-41 9 Justification of adjustments to base CEN-42
Current surveys and statistics: 10 Program and Performance: direct obligations CEN-46 12-15 Program Justification CEN-49
Survey of program dynamics: 10 Program and Performance: direct obligations CEN-78 12-15 Program Justification CEN-79
State children’s health insurance program: 10 Program and Performance: direct obligations CEN-80 12-15 Program Justification CEN-81 16 Summary of requirements by object class (Discretionary) CEN-83 16 Summary of requirements by object class (Mandatory) CEN-85 33 Appropriations Language and Code Citations CEN-87
Periodic Censuses and Programs: 5 Summary of resource requirements CEN-89 7 Summary of financing CEN-91 9 Justification of adjustments to base CEN-92
Economic statistics programs: 10 Program and Performance: direct obligations CEN-95 12-15 Program Justification CEN-97
Demographic statistics programs: 10 Program and Performance: direct obligations CEN-117 12-15 Program Justification CEN-120
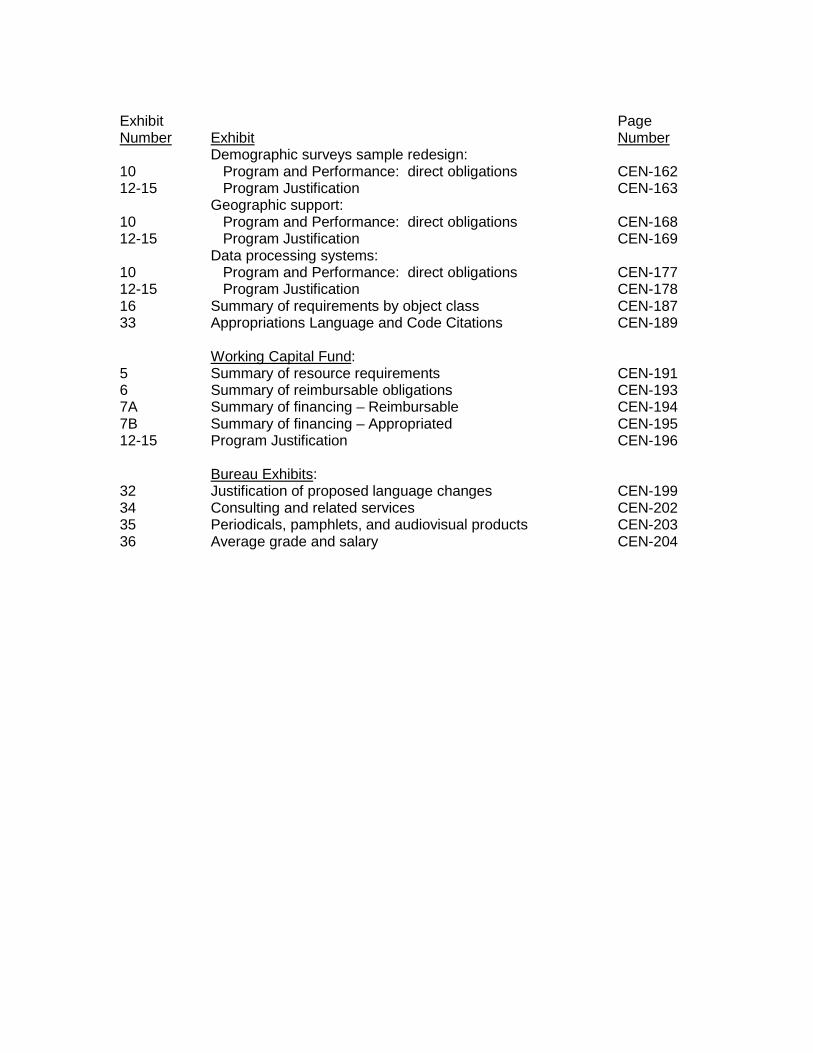
Exhibit Page Number Exhibit Number
Demographic surveys sample redesign: 10 Program and Performance: direct obligations CEN-1612-15 Program Justification CEN-16
Geographic support: 10 Program and Performance: direct obligations CEN-1612-15 Program Justification CEN-16
Data processing systems: 10 Program and Performance: direct obligations CEN-1712-15 Program Justification CEN-1716 Summary of requirements by object class CEN-1833 Appropriations Language and Code Citations CEN-18
Working Capital Fund: 5 Summary of resource requirements CEN-196 Summary of reimbursable obligations CEN-197A Summary of financing – Reimbursable CEN-197B Summary of financing – Appropriated CEN-1912-15 Program Justification CEN-19
Bureau Exhibits: 32 Justification of proposed language changes CEN-1934 Consulting and related services CEN-2035 Periodicals, pamphlets, and audiovisual products CEN-2036 Average grade and salary CEN-20
2 3
8 9
7 8 7 9
1 3 4 5 6
9 2 3 4
Dire
ctor
Dep
uty
Dire
ctor
Pol
icy
Coo
rdin
atio
n O
ffice
Offi
ce o
f Ris
k M
anag
emen
t an
d P
rogr
am E
valu
atio
n
Ass
ocia
te D
irect
or
for A
dmin
istra
tion
and
Chi
ef F
inan
cial
O
ffice
r
Ass
ocia
te D
irect
or
for C
omm
unic
atio
nsA
ssoc
iate
Dire
ctor
fo
r Fie
ld O
pera
tions
Ass
ocia
te D
irect
or
for I
nfor
mat
ion
Tech
nolo
gy a
nd
Chi
ef In
form
atio
n O
ffice
r
Ass
ocia
te D
irect
or
for D
emog
raph
ic
Pro
gram
s
Ass
ocia
te D
irect
or
for E
cono
mic
P
rogr
ams
Ass
ocia
te D
irect
or
for R
esea
rch
and
Met
hodo
logy
Ass
ocia
te D
irect
or
for D
ecen
nial
C
ensu
s P
rogr
ams
Ass
ista
nt D
irect
or
for E
cono
mic
P
rogr
ams
Eco
nom
ic P
lann
ing
and
Coo
rdin
atio
n D
ivis
ion
Ser
vice
Sec
tor
Sta
tistic
s D
ivis
ion
Com
pany
Sta
tistic
s D
ivis
ion
Eco
nom
ic
Pro
gram
min
g D
ivis
ion
Fore
ign
Trad
e D
ivis
ion
Man
ufac
turin
g an
d C
onst
ruct
ion
Div
isio
n
Gov
ernm
ents
D
ivis
ion
Cus
tom
er L
iais
on
and
Mar
ketin
g S
ervi
ces
Offi
ce
Hum
an R
esou
rces
D
ivis
ion
Info
rmat
ion
Sys
tem
s S
uppo
rt an
d R
evie
w
Offi
ce
App
licat
ion
Ser
vice
s D
ivis
ion
Chi
ef T
echn
olog
y O
ffice
Ass
ista
nt D
irect
or
for C
omm
unic
atio
ns
Offi
ce o
f C
ongr
essi
onal
and
In
terg
over
nmen
tal
Affa
irs
Cen
ter f
or N
ew
Med
ia a
nd
Pro
mot
ion
Pub
lic In
form
atio
n O
ffice
Adm
inis
trativ
e an
d C
usto
mer
Ser
vice
s D
ivis
ion
Adm
inis
trativ
e an
d M
anag
emen
t S
yste
ms
Div
isio
n
Fina
nce
Div
isio
n
Bud
get D
ivis
ion
Equ
al E
mpl
oym
ent
Opp
ortu
nity
Offi
ce
Acq
uisi
tion
Div
isio
n
Offi
ce o
f Inf
orm
atio
n S
ecur
ity
Loca
l Are
a N
etw
ork
Tech
nolo
gy S
uppo
rt O
ffice
Com
pute
r Ser
vice
s D
ivis
ion
Tele
com
mun
icat
ions
O
ffice
Fiel
d D
ivis
ion
Tech
nolo
gies
M
anag
emen
t Offi
ce
Nat
iona
l Pro
cess
ing
Cen
ter
Reg
iona
l Offi
ces
Pop
ulat
ion
Div
isio
n
Dem
ogra
phic
S
tatis
tical
Met
hods
D
ivis
ion
Soc
ial,
Eco
nom
ic,
and
Hou
sing
S
tatis
tics
Div
isio
n
Dem
ogra
phic
S
urve
ys D
ivis
ion
2020
Res
earc
h an
d P
lann
ing
Offi
ce
Am
eric
an
Com
mun
ity S
urve
y O
ffice
Ass
ocia
te D
irect
or
for 2
020
Cen
sus
Ass
ista
nt D
irect
or
for D
ecen
nial
C
ensu
s P
rogr
ams
Dec
enni
al
Man
agem
ent
Div
isio
n
Dec
enni
al
Sta
tistic
al S
tudi
es
Div
isio
n
Geo
grap
hy D
ivis
ion
Dec
enni
al S
yste
ms
and
Con
tract
s M
anag
emen
t Offi
ce
Ass
ista
nt D
irect
or
for R
esea
rch
and
Met
hodo
logy
Cen
ter f
or S
urve
y M
easu
rem
ent
Cen
ter f
or
Dis
clos
ure
Avo
idan
ce
Res
earc
h
Cen
ter f
or
Adm
inis
trativ
e R
ecor
ds R
esea
rch
and
App
licat
ions
Cen
ter f
or E
cono
mic
S
tudi
es
Cen
ter f
or S
tatis
tical
R
esea
rch
and
Met
hodo
logy
U.S
. Dep
artm
ent o
f Com
mer
ceB
urea
u of
the
Cen
sus
Exh
ibit
2
CEN-1

THIS
PAG
E IN
TEN
TIO
NA
LLY
LEFT
BLA
NK
CEN-2

Exhibit 3
U.S. Census Bureau Executive Summary
The Fiscal Year (FY) 2015 budget request reflects the resources needed for the U.S. Census Bureau to support the Department of Commerce’s Trade & Investment, Innovation, Environment, and Data goals. The U.S. Census Bureau currently supports the following Department of Commerce Strategic Objectives: Increase U.S. exports by broadening and deepening the U.S. exporter base (1.2); Accelerate the development of industry-led skills strategies that result in a productive workforce for employers and high-quality jobs for workers (2.4); Improve preparedness, response, and recovery from weather and water events by building a Weather-Ready Nation (3.2); Transform the Department’s data capacity to enhance the value, accessibility and usability of Commerce data for government, business and the public (4.1); Improve data-based services, decision-making, and data sharing within the Department and with other parts the federal government (4.2); and Foster the private sector’s development of new data-based businesses, products and services (4.3). The Census Bureau’s mission is to serve as the leading source of quality data about the nation's people and economy. The Census Bureau will honor privacy, protect confidentiality, share its expertise globally, and conduct its work openly. The Census Bureau is guided on this mission by scientific objectivity, its strong and capable workforce, its devotion to research-based innovation, and its abiding commitment to its customers. Budget and Financial Management Discretionary Domestic Spending: The Census Bureau requests appropriations for domestic discretionary spending totaling $1,209.9 million. Mandatory Domestic Spending: The Census Bureau expects to receive a total $30.0 million in mandatory domestic spending in FY 2015 for the State Children’s Health Insurance Program and the Survey of Program Dynamics. Reimbursable Program Funding: The Census Bureau anticipates that it will receive $315.0 million in reimbursable funding from other Federal and non-Federal organizations to perform work for those entities. FY 2015 Program Changes The requested funding reflects the resources needed to implement program enhancements, cross-cutting reductions, and cyclical changes in operational requirements between FY 2014 and FY 2015 for the Census Bureau’s Programs.
• Current Economic Statistics (Base Funding 1,196 FTE and $187.3 million; Program Change 18 FTE
and -$3.5 million):
• Current Economic Statistics (Base Funding 1,196 FTE and $187.3 million; Program Change 0 FTE and -$8.5 million): The objectives of the Current Economic Statistics sub-program are to provide public and private data users with relevant, accurate, and timely national statistical profiles for every sector of the U.S. economy. The program change reflects cross-cutting cost
CEN-3
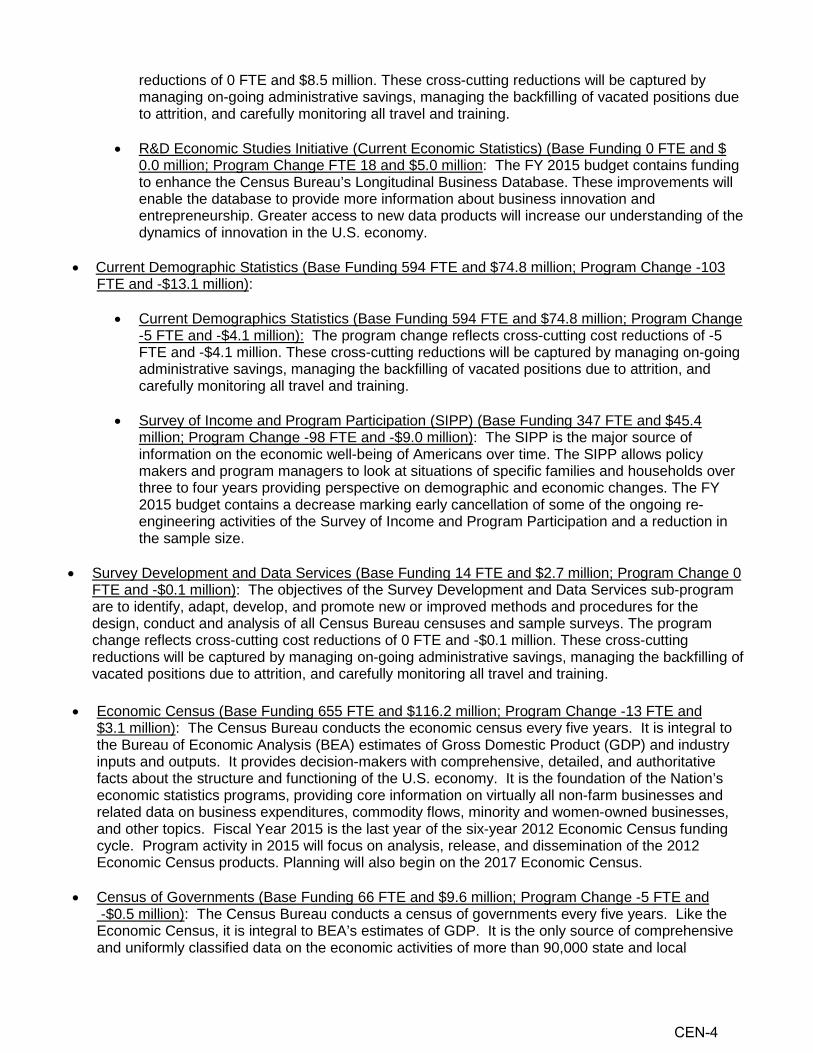
reductions of 0 FTE and $8.5 million. These cross-cutting reductions will be captured by managing on-going administrative savings, managing the backfilling of vacated positions due to attrition, and carefully monitoring all travel and training.
• R&D Economic Studies Initiative (Current Economic Statistics) (Base Funding 0 FTE and $
0.0 million; Program Change FTE 18 and $5.0 million: The FY 2015 budget contains funding to enhance the Census Bureau’s Longitudinal Business Database. These improvements will enable the database to provide more information about business innovation and entrepreneurship. Greater access to new data products will increase our understanding of the dynamics of innovation in the U.S. economy.
• Current Demographic Statistics (Base Funding 594 FTE and $74.8 million; Program Change -103
FTE and -$13.1 million):
• Current Demographics Statistics (Base Funding 594 FTE and $74.8 million; Program Change -5 FTE and -$4.1 million): The program change reflects cross-cutting cost reductions of -5 FTE and -$4.1 million. These cross-cutting reductions will be captured by managing on-going administrative savings, managing the backfilling of vacated positions due to attrition, and carefully monitoring all travel and training.
• Survey of Income and Program Participation (SIPP) (Base Funding 347 FTE and $45.4
million; Program Change -98 FTE and -$9.0 million): The SIPP is the major source of information on the economic well-being of Americans over time. The SIPP allows policy makers and program managers to look at situations of specific families and households over three to four years providing perspective on demographic and economic changes. The FY 2015 budget contains a decrease marking early cancellation of some of the ongoing re-engineering activities of the Survey of Income and Program Participation and a reduction in the sample size.
• Survey Development and Data Services (Base Funding 14 FTE and $2.7 million; Program Change 0 FTE and -$0.1 million): The objectives of the Survey Development and Data Services sub-program are to identify, adapt, develop, and promote new or improved methods and procedures for the design, conduct and analysis of all Census Bureau censuses and sample surveys. The program change reflects cross-cutting cost reductions of 0 FTE and -$0.1 million. These cross-cutting reductions will be captured by managing on-going administrative savings, managing the backfilling of vacated positions due to attrition, and carefully monitoring all travel and training.
• Economic Census (Base Funding 655 FTE and $116.2 million; Program Change -13 FTE and
$3.1 million): The Census Bureau conducts the economic census every five years. It is integral to the Bureau of Economic Analysis (BEA) estimates of Gross Domestic Product (GDP) and industry inputs and outputs. It provides decision-makers with comprehensive, detailed, and authoritative facts about the structure and functioning of the U.S. economy. It is the foundation of the Nation’s economic statistics programs, providing core information on virtually all non-farm businesses and related data on business expenditures, commodity flows, minority and women-owned businesses, and other topics. Fiscal Year 2015 is the last year of the six-year 2012 Economic Census funding cycle. Program activity in 2015 will focus on analysis, release, and dissemination of the 2012 Economic Census products. Planning will also begin on the 2017 Economic Census.
• Census of Governments (Base Funding 66 FTE and $9.6 million; Program Change -5 FTE and -$0.5 million): The Census Bureau conducts a census of governments every five years. Like the Economic Census, it is integral to BEA’s estimates of GDP. It is the only source of comprehensive and uniformly classified data on the economic activities of more than 90,000 state and local
CEN-4
governments, which account for about 12 percent of GDP and nearly 16 percent of the U.S. workforce. Fiscal Year 2015 is the first year in the five-year cycle of the 2017 Census of Governments. Program activities in 2015 include the development of a 2017 Census of Governments project plan; conducting workshops and conferences with key stakeholders to discuss improvements; and preparing and delivering data products from the finance component from information collected in the 2012 Census of Governments.
• Intercensal Demographic Estimates (Base Funding 62 FTE and $10.1 million; Program Change 0
FTE and -$0.2 million): The program change reflects cross-cutting cost reductions of 0 FTE and -$0.2 million. These cross-cutting reductions will be captured by managing on-going administrative savings, managing the backfilling of vacated positions due to attrition, and carefully monitoring all travel and training.
• 2020 Decennial Census Program (Base Funding 3,519 FTE and $465.2 million; Program Change
918 FTE and $223.8 million):
• 2020 Decennial Census (Base Funding 840 FTE and $230.8 million; Program Change 801 FTE and $212.4 million): FY 2015 is the final year of funding for the early research, planning, development and testing for the 2020 Census and the first year of funding operations and infrastructure investment. The program will focus on completing research and testing needed to make fundamental design decisions required to contain the cost of the census. The program will use information generated from the last three years of applied research to begin operational design, development, and system testing for the actual conduct of the 2020 Census. By the end of fiscal year 2015, preliminary design decisions for the 2020 Census will be made. Consequently, the completion of the early research and testing work in FY 2015 is the principal opportunity to prove in design changes that can fundamentally change the way the 2020 Census is conducted. The President’s request also provides the Census Bureau resources to strengthen program management and systems engineering and integrate best practices that are critical to the effective management of the myriad systems and operations required for the census.
• American Community Survey (Base Funding 2,679 FTE and $234.4 million; Program Change
117 FTE and $11.4 million): The funding for the American Community Survey (ACS) is part of the 2020 Decennial Program. Starting in 2005, the ACS improved upon the Decennial Census long form by providing important information to the nation on an annual basis instead of just once every ten years. The ACS is a monthly questionnaire sent to a small percentage of the population across the nation. The survey collects detailed information on the characteristics of the population and housing units on an ongoing basis in all counties throughout the U.S. and continues to be the only Census Bureau population-based survey that collects information in many of these areas. ACS data are released annually. The FY 2015 request includes funding to restore field data collection costs associated with a one-month break in data collection at the beginning of the FY 2014, as well as funds necessary to conduct research on content, quality, efficiency, and reducing respondent burden and intrusiveness.
• Demographic Surveys Sample Redesign (Base Funding 56 FTE and $9.8 million; Program Change
0 FTE and -$0.2 million): The program change reflects cross-cutting cost reductions of 0 FTE and -$0.2 million. These cross-cutting reductions will be captured by managing on-going administrative savings, managing the backfilling of vacated positions due to attrition, and carefully monitoring all travel and training.
CEN-5
• Geographic Support (Base Funding 330 FTE and $56.8 million; Program Change 42 FTE and $3.2 million): In FY 2015, the President’s Budget contains funding to restore the Boundary and Annexation Survey, which was suspended for FY 2014. The request includes an increase of 42 FTE and $3.2 million to reflect the restoration of the Boundary and Annexation Survey (BAS). The restoration the BAS will ensure accurate boundaries that are critical for the allocation of statistical data collected in censuses and surveys, including the annual ACS.
• Data Processing Systems (DPS) (Base Funding 0 FTE and $30.5 million; Program Change 65 FTE and $34.4 million):
• Data Processing Systems (CEDCaP Initiative) (Base Funding 0 FTE and $30.5 million;
Program Change 65 FTE and $27.5 million): The request includes an increase of 65 FTE and $27.5 million to support the Census Enterprise Data Collection and Processing (CEDCaP) initiative. The CEDCaP initiative will create an integrated and standardized enterprise of systems that offer share data collection and processing services across all systems. The new standardized system will lead to cost efficiencies by retiring unique, survey-specific system and redundant capabilities and bring a greater portion of the Census Bureau’s IT expenditure under a single, integrated and centrally managed program.
• Data Processing Systems (Base Funding 0 FTE and $30.5 million; Program Change 0 FTE and $6.9 million): The Census Bureau requests an increase of $6.9 million and 0 FTE to the DPS to increase the support for the Bureau’s Infrastructure contracts. Of this increase, $2.2 million will fund activities that improve responses to telephone and infrastructure support, which are critical to the day-to-day operations. This funding will also increase our ability to troubleshoot and perform maintenance of the Census Bureau-wide voice and data telecommunications network. The remaining $4.7 million is funding for the Business Application Solutions implementation project and to ensure that the Bureau's financial system is properly aligned with the Department of Commerce.
Legislative Proposal for Cooperative Agreement Authority The FY 2015 request includes a proposal to provide the Census Bureau with the ability to utilize cooperative agreements in support of its program activities. Cooperative Agreements provide the flexibility that traditional contracts and interagency agreements are unable to provide, by promoting collaboration and partnerships across governmental and non-governmental organizations.
• The Census Bureau will utilize cooperative agreements to enhance partnerships between the Federal Government and academic, state, private, or non-governmental entities to advance the Census Bureaus’ mission to serve as the leading source for statistical data about the Nation’s people and economy.
• Cooperative agreement authority will enable our subject matter experts in survey methodology and survey measurement to engage with leading experts in technical areas (e.g., satellite imagery, advanced computational programming, data analytics) or social science or econometrics. This is expertise that we can not currently access through our procurement authority will further our ability to achieve mission goals, spur innovation in lasting ways and promote more cost efficient ways of doing business.
CEN-6
Other Program Highlights
The Census Bureau programs described below provide important data about the Nation’s population and economy on an ongoing basis. Wherever possible, the Census Bureau seeks to improve the functioning of these programs within existing funds.
• Current Economic Statistics (1,214 FTE and $183.7 – includes program changes discussed above):
• Business Statistics (329 FTE and $42.6 million): The business statistics programs measure
the economic activity of the distribution and service trade sectors in the United States. The data provide principal economic performance indicators, including monthly and annual data for the retail and wholesale sectors, and quarterly and annual data for the fast growing service sector of the national economy. These sectors account for nearly 70 percent of U.S. economic activity. Together, the business statistics programs provide the primary source of up-to-date facts on the structure and functioning of the distributive trades and service sectors of the economy and provide timely updates to data collected in the economic census. The principal economic indicator series are closely followed and widely used by policymakers in the public and private sectors and move financial markets. The data, in conjunction with other economic data collected by the Census Bureau, are vital to effective economic policy decisions by business and government.
• Construction Statistics (115 FTE and $12.7 million): The construction statistics programs
provide national performance indicators for the construction sector of the economy. The programs cover activities such as residential building permit authorizations, housing starts, characteristics and prices of new housing, and value of construction put in place. The data are vital to understanding the economic and social aspects of construction activity in the U.S., are pertinent to the national economic and social needs of the U.S. population, and provide a basis for effective policy making at all levels of government and in the private sector. The programs supplement the data collected in the economic census. Since construction activities are particularly sensitive to the level of interest rates, these data are an important indicator of how changes in interest rates are affecting the economy.
• Manufacturing Statistics (157 FTE and $20.9 million): The manufacturing statistics programs
measure the overall performance of the U.S. manufacturing sector and the investment behavior of all U.S. businesses. The data provide key national performance indicators for the sector of the economy that provides 12 percent of the Nation’s employment. The manufacturing sector also supplies the export markets, which have become increasingly important to the overall health of our Nation’s economy. These programs, which supplement data collected in the economic census, provide the monthly, quarterly, and annual data that are vital to policymakers in both the public and private sectors for analysis of the business cycle and domestic production. They provide key information on major labor, capital, and manufacturing material inputs and outputs, as well as capital investment by U.S. businesses, and data on industrial research and development, manufacturing capacity utilization, pollution abatement costs and expenditures, and energy use.
• General Economic Statistics (328 FTE and $60.7 million): The general economic statistics
programs provide information that is essential to understanding the changing economic structure of the United States. In addition, the Business Register and parallel classification activities also provide the infrastructure for the current and periodic economic programs that produce national statistical profiles of all sectors of the economy.
CEN-7
• Foreign Trade Statistics (200 FTE and $34.8 million): The foreign trade statistics programs provide official monthly statistics on imports, exports, and balance of trade for all types of merchandise moving between the United States and its international trading partners. The trade statistics are a principal economic indicator for the United States and are released within 40 to 45 days after the reference month. The Census Bureau is the primary source of this comprehensive monthly data that provide national performance indicators vital to understanding our economy, as well as our economic relationship with the rest of the world.
• Government Statistics (85 FTE and $12.0 million): The government statistics programs
provide current statistical information on revenues, expenditures, debt, and financial assets for more than 90,000 state and local governments. The programs provide data in the areas of public employment and payroll, as well as Federal government programmatic expenditures on a geographic basis. The data are vital to measuring the government sector of the national economy, understanding the flow of public funds throughout the country, and for administering public programs.
• Current Demographic Statistics (491 FTE and $61.7 million – includes program changes discussed
above):
• Household Surveys (430 FTE and $52.5 million – amount includes program change for SIPP discussed above): The household surveys program includes the full array of operations and services associated with large scale data collection, including preparation of the sample and survey materials, collection of the data by field representatives, data processing and estimation, production and quality control of monthly, quarterly, and annual data products, and data dissemination of tabulations and public-use micro-data via the Internet and other media.
• Population and Housing Analyses (61 FTE and $9.1 million): The population and housing
analyses program uses a variety of approaches to create value-added information for policy makers and program managers, refining the statistical data collected in surveys into insightful and useful information. This program increases the knowledge base with varied sources of information, adds context and perspective to survey data, and maintains the statistical infrastructure through compilation of records and development and maintenance of standards.
• Survey Development and Data Services (14 FTE and $2.6 million): The survey development and
data services program funds research into survey design and estimation, time series analysis, error reduction, privacy protection, and special experimental and evaluation studies. These activities continually improve the Census Bureau’s survey and census.
• Intercensal Demographic Estimates (62 FTE and $9.9 million): The intercensal demographic
estimates program assists elected officials and government program managers in allocating hundreds of billions of dollars each year by giving them updated estimates of the United States population for the country, states, counties, cities, and townships. Through this legislatively required program, policymakers and program managers are able to better understand their population’s size, as well as its basic characteristics like age, sex, race, and Hispanic origin; and estimates of the number of housing units, in the years between the decennial censuses. Since the United States population grows and changes between decennial censuses – and governments base many of their funding decisions on the size and basic characteristics of the population – effective and efficient government requires these updated estimates.
CEN-8

• American Community Survey (2,796 FTE and $245.8 million – includes program change discussed above): The American Community Survey (ACS), sent monthly to a small percentage of the population, collects detailed information on the characteristics of population and housing on an ongoing basis. These data previously were collected only in census years in conjunction with the decennial census. After years of development and testing, the Census Bureau implemented the ACS nationwide in 2005. The ACS allows Federal agencies, state governments, tribal officials, and local customers to make decisions based on current information, rather than information collected only once a decade. The Census Bureau will continue to refine the process and ensure that it is in place to produce tract-level data (in general, areas with populations between 1,500 and 8,000) similar to the Census 2000 long-form (detailed characteristics) data, in conjunction with the 2010 Census short-form (basic characteristics) data. The Census Bureau releases the estimates from the ACS Program each year, based on the previous year’s data collection.
• Demographic Surveys Sample Redesign (56 FTE and $9.6 million): The objective of the demographic surveys sample redesign program is to, with the existence of a continually updated Master Address File (MAF) and the continued availability of ACS data, take advantage of an opportunity to reduce future survey costs by improving our approach to designing and selecting samples for the major national household surveys. The Census Bureau's plan is to implement future redesign samples based on the availability of MAF and ACS information. After the next coordinated sample redesign, the Census Bureau will allow sponsoring agencies the option to redesign survey samples at any time during the decade, not just once every ten years after the decennial census. The major goal of the Demographic Surveys Sample Redesign Program is to minimize total survey costs for the desired level of reliability.
• Geographic Support (372 FTE and $60.0 million – includes program change discussed above): The goal of the geographic support program is to determine the correct location of every residential and business establishment address in the U.S. and its Territories. Major components include the Master Address File (MAF), a geographically-assigned address list for the nation, and the Topologically Integrated Geographic Encoding and Referencing (TIGER) database, which provides maps and geographic information for data tabulation. Together, they provide essential information and products critical for conducting many of the Census Bureau's programs.
• Data Processing Systems (65 FTE and $64.9 million – includes program changes discussed above): The data processing systems activity funds information technology services supporting Census Bureau enterprise needs. Economies of scale are achieved through centralized information technology contracts and services in accordance with Department of Commerce guidelines and a comprehensive Information Technology Plan. This saves taxpayers money, while helping the Census Bureau to accomplish its mission.
Mandatory Demographic Programs The following mandatory funding for demographic programs is anticipated in FY 2015: • Survey of Program Dynamics (59 FTE and $10.0 million):
This program provides socioeconomic data and information, which can be used by Federal and state public policymakers to evaluate the effects of the Personal Responsibility and Work Opportunity Reconciliation Act of 1996 that established the Temporary Assistance for Needy Families Program.
• State Children’s Health Insurance Program (229 FTE and $20.0 million): This program provides statistically reliable annual data for each state on the number of low-income children who do not have health insurance coverage. These data are used to allocate funds to states.
CEN-9

Reimbursable Programs The Census Bureau also conducts work on a reimbursable funding basis for other Federal agencies, such as the collection of labor force and consumer expenditure data for the Bureau of Labor Statistics, data on experience of crime for the Department of Justice, education data for the Department of Education, health measures for the Department of Health and Human Services, and housing data for the Department of Housing and Urban Development.
CEN-10
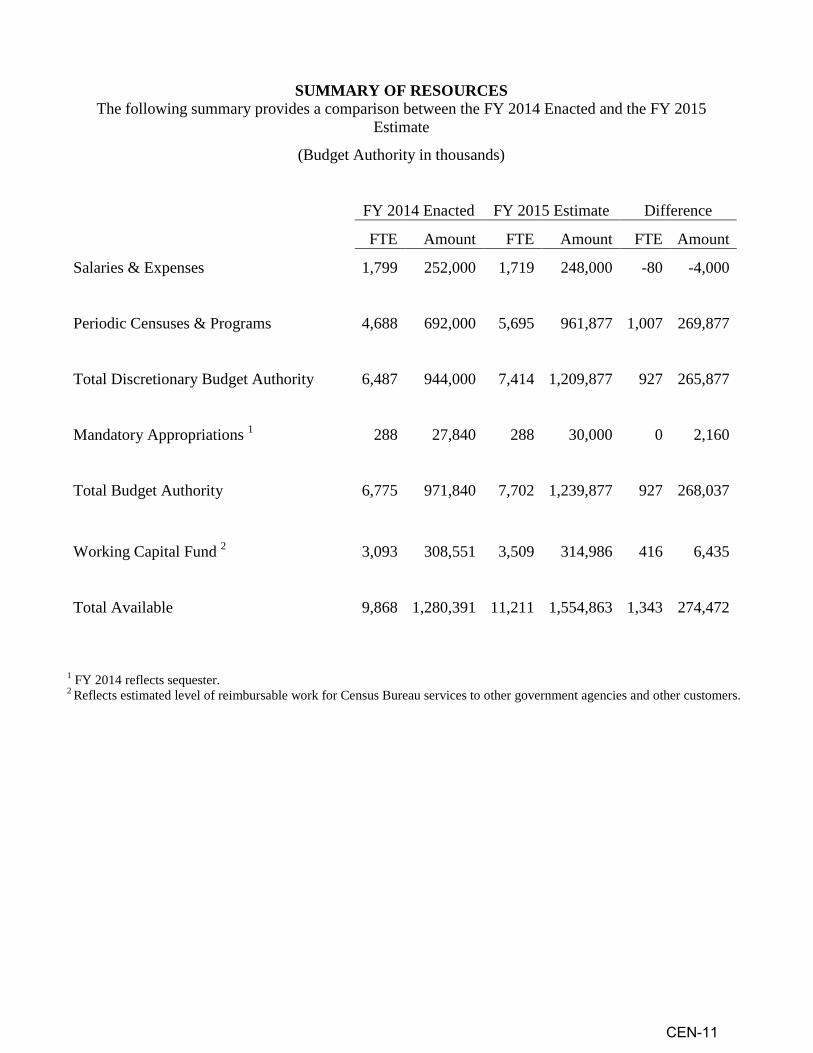
SUMMARY OF RESOURCES The following summary provides a comparison between the FY 2014 Enacted and the FY 2015
Estimate
(Budget Authority in thousands)
FY 2014 Enacted FY 2015 Estimate Difference
FTE Amount FTE Amount FTE Amount
Salaries & Expenses 1,799 252,000 1,719 248,000 -80 -4,000
Periodic Censuses & Programs 4,688 692,000 5,695 961,877 1,007 269,877
Total Discretionary Budget Authority 6,487 944,000 7,414 1,209,877 927 265,877
Mandatory Appropriations 1 288 27,840 288 30,000 0 2,160
Total Budget Authority 6,775 971,840 7,702 1,239,877 927 268,037
Working Capital Fund 2 3,093 308,551 3,509 314,986 416 6,435
Total Available 9,868 1,280,391 11,211 1,554,863 1,343 274,472
1 FY 2014 reflects sequester. 2 Reflects estimated level of reimbursable work for Census Bureau services to other government agencies and other customers.
CEN-11

THIS PAGE INTENTIONALLY LEFT BLANK
CEN-12
14 14 15 18 18 21 34 34 34 34 35 36 38 38ge - - - - - - - - - - - - - -
N N N N N N N N N N N N N NaP CE
CE
CE
CE
CE
CE
CE
CE
CE
CE
CE
CE
CE
CE
. …
.. . . .... .
……
……
..…
. ….
an ……
……
…
……
…
…… ……
… ……
……
……
.
Pl ……
……
……
……
…
……
…
e ……
….…
……
.. ……
…
nc
……
……
… ……
…
. . ……
……
……
……
……
…… .
….. …
. ……
……
……
……
…
… ……
.…
. ……
……
… ……
…
a ……
…
m … ………
……
…
……
…
… ……
……
…
or
…… …
rf ……
…
e .
……
..
……
……
…
……
……
… ……
……
……
……
……
……
……
……
P … …… ……
…
l
……
……
…
ua
……
……
……
……
…
……
……
……
……
……
……
……
……
……
……
…
nn …… ……
…
A
5 ……
……
u ……
……
……
…
……
……
……
ev ……
…
PP
1 s …… t ……
……
…..i . ……
……
……
……
……
……
……
……
aA 0 ……
nt .. … es ……
……
ec ……
……
e j …v b ……
…
PR/ 2
FY
Bur e .. i …
…
.. t vei O ……
.. ec ct ……
……
……
…
.. j e…
……
……
ions
b jb by …A ……
……
…
... / ……
……
……
e ……
…
……
…
port C
ont
.. ……
…
of .
and
O … uat
……
…
A us . y O
… al
3 ns ……
…b an
c t me …
……
……
….. ev
… ……
…
……
…
bi ……
.
Ce e …
……
……
…
es Re ,s
anc or f or
bl ……
…
hi oal
er
x eng
ce
m G ……
…
ans
Ta or e P ions
E US
……
……
……
…, …
……
l
es r ……
……
……
…
……
…… at
an
……
…… ha
lfr u ……
……
… emm
led
pl
P abor
r he f l aio Fut … …
……
…
ol t ……
o T C onf ……
……
r ……
… d
e
i on
… ……
…c … …
……
…… a
nd C
i and
e
e
……
……
……
… es/ is tg
……
… pt t…
……
……
……
…
oal
……
… or ae i
P
i as t c
at i m i
P or fi rl t scr
a
……
……
… if r Go
……
……
…S e
P y
u an
s D t
oC
iery i
……
… her
ent
ior ons
n D i ot
Pl
A g uat
mm
a pts
……
… ri abl
r T em Pc y any
n c al o es
eron
and
Vi
n on
31 ……
…n a
ndS D en v t
20 w po
ndi u s ss ent
idat
o t it ul d ea s em oal
vi es ile G…
……
…an
ag
E
201
3 gA mM ink al- a l
Y m r sr e rr ar r ui oni or s gy per
a V
F t qo ve R at to y a
nf e FY
aj o
O C De t o
e ior M r
m Cr
P H D I
anc R: : : : ir or : : : : : y
m on 1
on 2
mro on 1
on 2 e Par c fr ny
ou
ir on 1
on 2
on 3
on 4
on 5
umi i i i
enc i i i i i
ect
ect fre ect
ect hees g t ect
ect
ect
ect
ect
S S S P S S R A O S S S S S: : : : :
t 1 5 t 2 t 3 t 4 tr r r r ra a a aP P P P Pa
CEN-13

Part
1
Sum
mar
y In
form
atio
n Se
ctio
n 1
Ove
rvie
w
Intro
duct
ion
Cen
sus
Bure
au in
form
atio
n sh
apes
impo
rtant
pol
icy
and
oper
atio
nal d
ecis
ions
that
hel
p im
prov
e th
e na
tion’
s so
cial
and
eco
nom
ic c
ondi
tions
. The
Bu
reau
con
duct
s th
e co
nstit
utio
nally
man
date
d D
ecen
nial
Cen
sus
of P
opul
atio
n an
d H
ousi
ng e
very
10
year
s, w
hich
is u
sed
to a
ppor
tion
seat
s in
th
e H
ouse
of R
epre
sent
ativ
es a
nd in
form
s co
ngre
ssio
nal r
edis
trict
ing.
The
Cen
sus
Bure
au a
lso
cond
ucts
a c
ensu
s of
all
busi
ness
est
ablis
hmen
ts
and
of a
ll go
vern
men
tal u
nits
, kno
wn
resp
ectiv
ely
as th
e Ec
onom
ic C
ensu
s an
d th
e C
ensu
s of
Gov
ernm
ents
, eve
ry fi
ve y
ears
. The
Eco
nom
ic
Cen
sus
is th
e be
nchm
ark
used
for m
easu
ring
Gro
ss D
omes
tic P
rodu
ct (G
DP)
and
oth
er k
ey in
dica
tors
that
gui
de p
ublic
pol
icy
and
busi
ness
in
vest
men
t dec
isio
ns. I
n ad
ditio
n, th
e Bu
reau
con
duct
s se
vera
l ong
oing
bus
ines
s an
d ho
useh
old
surv
eys
that
pro
vide
the
info
rmat
ion
in s
ever
al o
f th
e N
atio
n’s
key
econ
omic
indi
cato
rs a
nd w
hich
are
use
d to
allo
cate
ove
r $40
0 bi
llion
in fe
dera
l fun
ding
ann
ually
. M
issi
on S
tate
men
t Th
e C
ensu
s Bu
reau
’s m
issi
on is
to s
erve
as
the
lead
ing
sour
ce o
f qua
lity
data
abo
ut th
e na
tion'
s pe
ople
and
eco
nom
y. W
e ho
nor p
rivac
y, p
rote
ct
conf
iden
tialit
y, s
hare
our
exp
ertis
e gl
obal
ly, a
nd c
ondu
ct o
ur w
ork
open
ly. W
e ar
e gu
ided
on
this
mis
sion
by
scie
ntifi
c ob
ject
ivity
, our
stro
ng a
nd
capa
ble
wor
kfor
ce, o
ur d
evot
ion
to re
sear
ch-b
ased
inno
vatio
n, a
nd o
ur a
bidi
ng c
omm
itmen
t to
our c
usto
mer
s.
Des
crip
tion
/ Sco
pe o
f Res
pons
ibilit
ies
The
Cen
sus
Bure
au m
easu
res
Amer
ica’
s ra
pidl
y ch
angi
ng e
cono
mic
and
soc
ial a
rran
gem
ents
, and
dev
elop
s ef
fect
ive
way
s to
dis
sem
inat
e in
form
atio
n us
ing
the
mos
t adv
ance
d te
chno
logi
es, t
o en
able
pol
icym
aker
s at
all
leve
ls o
f gov
ernm
ent,
busi
ness
es, n
on-p
rofit
org
aniz
atio
ns, a
nd th
e pu
blic
to m
ake
effe
ctiv
e de
cisi
ons.
Th
e C
ensu
s Bu
reau
’s h
eadq
uarte
rs is
loca
ted
in S
uitla
nd M
aryl
and,
with
six
regi
onal
offi
ces
in N
ew Y
ork,
NY;
Phi
lade
lphi
a, P
A; A
tlant
a, G
A;
Chi
cago
, IL;
Den
ver,
CO
; and
Los
Ang
eles
, CA.
Th
e N
atio
nal P
roce
ssin
g C
ente
r is
loca
ted
in J
effe
rson
ville
, IN
and
ope
rate
s th
ree
tele
phon
e ce
nter
s in
Jef
fers
onvi
lle, T
ucso
n AZ
, and
Hag
erst
own,
MD
. FY
201
3 A
ccom
plis
hmen
ts
The
Cen
sus
Bure
au c
ompl
eted
dat
a co
llect
ion
thro
ugh
wav
e 15
of t
he 2
008
Surv
ey o
f Inc
ome
and
Prog
ram
Par
ticip
atio
n (S
IPP)
pan
el, w
ith a
n ov
eral
l pan
el re
spon
se ra
te c
ontin
uing
to re
mai
n ab
ove
60 p
erce
nt in
to th
e fif
th y
ear o
f dat
a co
llect
ion
for t
he 2
008
SIPP
pan
el re
spon
dent
s. D
ata
rele
ases
for t
he 2
008
pane
l con
tinue
d to
pro
ceed
on
sche
dule
, with
cor
e da
ta re
leas
es o
ccur
ring
wel
l und
er a
yea
r afte
r col
lect
ion.
Mile
ston
es w
ere
met
in p
repa
ratio
n fo
r the
new
201
4 re
-eng
inee
red
SIPP
pan
el in
201
4, in
clud
ing
pion
eerin
g w
ork
to in
corp
orat
e ad
min
istra
tive
reco
rds
data
with
ho
useh
old
surv
ey d
ata
in th
e SI
PP p
rogr
am, a
nd re
desi
gnin
g sa
mpl
es fo
r all
hous
ehol
d su
rvey
s ba
sed
on a
con
tinua
lly u
pdat
ed M
aste
r Add
ress
Fi
le.
Also
, Cur
rent
Pop
ulat
ion
Surv
ey (C
PS) c
ontro
ls w
ere
cons
iste
ntly
rele
ased
in ti
me
for w
eigh
ting
mon
thly
est
imat
es. T
his
is im
porta
nt b
ecau
se
the
CPS
is th
e so
urce
of t
he m
onth
ly u
nem
ploy
men
t dat
a fo
r the
Uni
ted
Stat
es, w
hich
is a
lead
ing
econ
omic
indi
cato
r.
CEN-14
In M
arch
201
3, th
e C
ensu
s Bu
reau
and
the
Bure
au o
f Eco
nom
ic A
naly
sis
join
tly a
ccel
erat
ed th
e re
leas
e of
the
econ
omic
indi
cato
r rel
ated
to
inte
rnat
iona
l tra
de in
goo
ds a
nd s
ervi
ces.
Thi
s jo
int r
elea
se is
now
ava
ilabl
e to
the
publ
ic w
ithin
five
bus
ines
s da
ys o
f the
sta
rt of
the
mon
th. T
his
chan
ge p
rovi
des
vita
l int
erna
tiona
l tra
de s
tatis
tics
soon
er to
max
imiz
e U
.S. g
loba
l com
petit
iven
ess
and
enab
le e
cono
mic
gro
wth
for A
mer
ican
bu
sine
sses
, wor
kers
, and
con
sum
ers
and
mee
ts d
ata
user
s’ d
eman
d fo
r an
earli
er re
leas
e of
the
mon
thly
inte
rnat
iona
l tra
de s
tatis
tics.
In
FY 2
013,
th
e C
ensu
s Bu
reau
ach
ieve
d w
ell o
ver 1
0 pe
rcen
t res
pons
e in
crea
se (c
ompa
red
to th
e 20
07 E
cono
mic
Cen
sus)
usi
ng e
lect
roni
c re
porti
ng to
ols
such
as
dire
ct in
tern
et re
porti
ng fo
r sin
gle
units
and
Sur
veyo
r, w
hich
is a
spe
cific
repo
rting
app
licat
ion
for m
ulti-
esta
blis
hmen
t com
pani
es. T
he
elec
troni
c re
spon
se ra
te fo
r the
201
2 Ec
onom
ic C
ensu
s w
as 5
3.4
perc
ent o
f tot
al re
spon
ses,
com
pare
d to
22.
1 pe
rcen
t for
the
2007
Eco
nom
ic
Cen
sus.
Ove
rall,
the
resp
onse
rate
for t
he 2
012
Econ
omic
Cen
sus
was
84
perc
ent,
as c
ompa
red
to 8
6 pe
rcen
t for
the
2007
Eco
nom
ic C
ensu
s.
The
2020
Dec
enni
al C
ensu
s pr
ogra
m re
-sco
ped
the
prog
ram
to re
spon
d to
bud
geta
ry re
duct
ions
in F
Y 20
13 a
nd d
evel
oped
a n
ew fi
eld-
test
ing
stra
tegy
to fo
cus
on c
ost s
avin
g ac
tiviti
es a
nd o
pera
tions
in p
rovi
ding
inno
vativ
e so
lutio
ns a
nd a
fram
ewor
k to
low
er c
osts
of t
he 2
020
Cen
sus.
The
ne
w te
stin
g st
rate
gy fo
cuse
s on
the
follo
win
g ar
eas
of in
tere
st: o
ptim
izin
g se
lf-re
spon
se to
max
imiz
e In
tern
et re
spon
se, u
sing
adm
inis
trativ
e re
cord
s (in
form
atio
n al
read
y pr
ovid
ed to
the
gove
rnm
ent),
re-e
ngin
eerin
g ho
w w
e m
anag
e th
e fie
ld w
ork
(prio
ritiz
ing
field
cas
es th
roug
h ad
aptiv
e de
sign
and
re
duci
ng fi
eld
wor
k th
roug
h au
tom
atio
n), a
nd im
plem
entin
g ta
rget
ed a
ddre
ss c
anva
ssin
g (d
evel
opin
g st
atis
tical
mod
els
to p
rodu
ce e
stim
ates
for
cove
rage
err
or).
Al
l the
3-y
ear (
2009
-201
1) a
nd 5
-yea
r (20
07-2
011)
Am
eric
an C
omm
unity
Sur
vey
(AC
S) d
ata
and
the
1-ye
ar 2
012
ACS
data
pro
duct
s w
ere
rele
ased
by
the
Cen
sus
Bure
au o
n sc
hedu
le.
In D
ecem
ber 2
012,
the
ACS
bega
n of
ferin
g an
inte
rnet
sel
f-res
pons
e op
tion
to s
urve
y re
spon
dent
s in
an
effo
rt to
bec
ome
a le
ss in
trusi
ve, m
ore
tech
nolo
gica
lly a
dvan
ced
and
mor
e co
st-e
ffici
ent s
urve
y. I
n ad
ditio
n, th
e G
eogr
aphy
Div
isio
n la
unch
ed th
e G
eogr
aphi
c Su
ppor
t Sys
tem
Initi
ativ
e Pa
rtner
ship
Pro
gram
, whi
ch re
sulte
d in
the
acqu
isiti
on a
nd e
valu
atio
n of
add
ress
and
stre
et c
ente
rline
dat
a fro
m 3
75 tr
ibal
, sta
te, a
nd lo
cal g
over
nmen
t par
tner
s (4
,340
diff
eren
t gov
ernm
ents
). Se
ctio
n 2
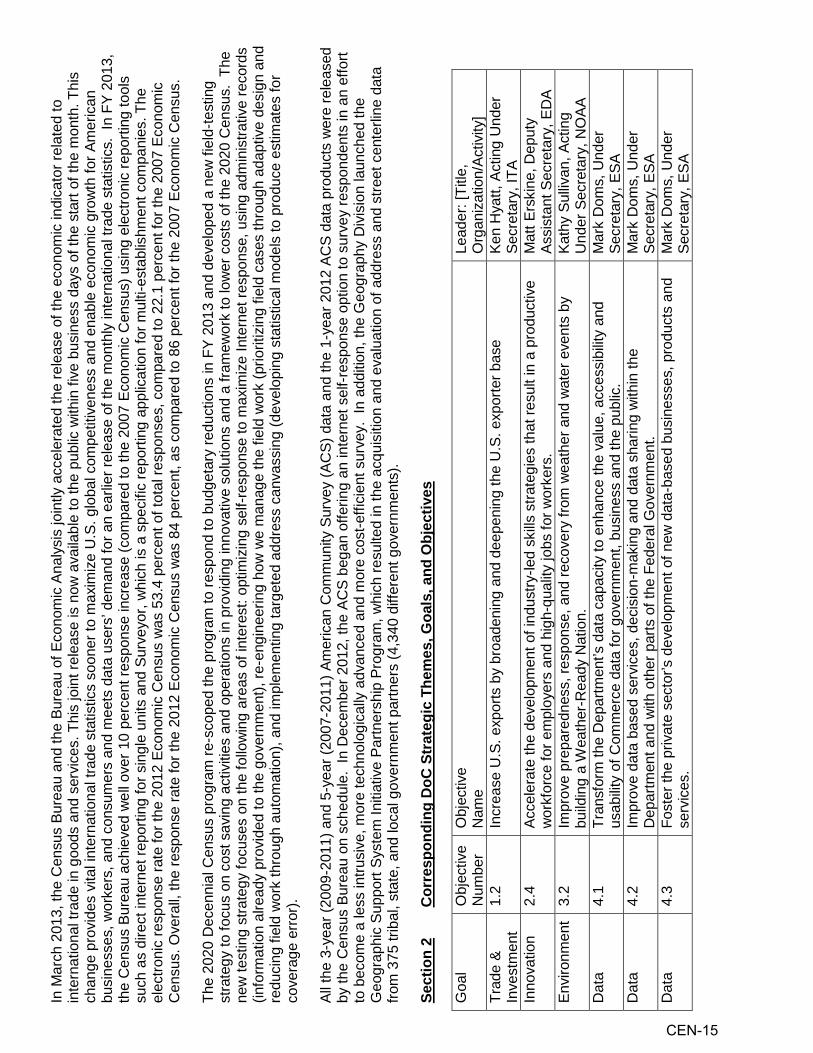
Cor
resp
ondi
ng D
oC S
trat
egic
The
mes
, Goa
ls, a
nd O
bjec
tives
G
oal
Obj
ectiv
e O
bjec
tive
Lead
er: [
Title
, N
umbe
r N
ame
Org
aniz
atio
n/Ac
tivity
] Tr
ade
& 1.
2 In
crea
se U
.S. e
xpor
ts b
y br
oade
ning
and
dee
peni
ng th
e U
.S. e
xpor
ter b
ase
Ken
Hya
tt, A
ctin
g U
nder
In
vest
men
t Se
cret
ary,
ITA
Inno
vatio
n 2.
4 Ac
cele
rate
the
deve
lopm
ent o
f ind
ustry
-led
skills
stra
tegi
es th
at re
sult
in a
pro
duct
ive
Mat
t Ers
kine
, Dep
uty
wor
kfor
ce fo
r em
ploy
ers
and
high
-qua
lity
jobs
for w
orke
rs.
Assi
stan
t Sec
reta
ry, E
DA
Envi
ronm
ent
3.2
Impr
ove
prep
ared
ness
, res
pons
e, a
nd re
cove
ry fr
om w
eath
er a
nd w
ater
eve
nts
by
Kath
y Su
llivan
, Act
ing
build
ing
a W
eath
er-R
eady
Nat
ion.
U
nder
Sec
reta
ry, N
OAA
D
ata
4.1
Tran
sfor
m th
e D
epar
tmen
t’s d
ata
capa
city
to e
nhan
ce th
e va
lue,
acc
essi
bilit
y an
d M
ark
Dom
s, U
nder
us
abilit
y of
Com
mer
ce d
ata
for g
over
nmen
t, bu
sine
ss a
nd th
e pu
blic
. Se
cret
ary,
ESA
D
ata
4.2
Impr
ove
data
bas
ed s
ervi
ces,
dec
isio
n-m
akin
g an
d da
ta s
harin
g w
ithin
the
Mar
k D
oms,
Und
er
Dep
artm
ent a
nd w
ith o
ther
par
ts o
f the
Fed
eral
Gov
ernm
ent.
Secr
etar
y, E
SA
Dat
a 4.
3 Fo
ster
the
priv
ate
sect
or’s
dev
elop
men
t of n
ew d
ata-
base
d bu
sine
sses
, pro
duct
s an
d M
ark
Dom
s, U
nder
se
rvic
es.
Secr
etar
y, E
SA
CEN-15

Stra
tegi
es
The
Cen
sus
Bure
au s
uppo
rts th
e fo
llow
ing
stra
tegi
es in
the
Dep
artm
ent o
f Com
mer
ce S
trate
gic
Plan
: Tr
ade
& In
vest
men
t (1.
2)
•
Educ
ate
U.S
. com
pani
es a
nd c
omm
uniti
es o
n th
e be
nefit
s of
exp
ortin
g to
(ITA
, ESA
, MBD
A).
• Pr
ovid
e ta
ilore
d ex
port
assi
stan
ce to
U.S
. com
pani
es a
nd c
omm
uniti
es to
con
nect
U.S
. com
pani
es to
fore
ign
mar
kets
and
qua
lifie
d bu
yers
an
d pa
rtner
s (IT
A, E
SA, M
BDA,
ED
A, B
IS).
Inno
vatio
n (2
.4)
•
Cap
ture
, coo
rdin
ate,
and
ana
lyze
U.S
. wor
kfor
ce d
ata
(ESA
, OS)
.
Env
ironm
ent (
3.2)
• En
hanc
e de
cisi
on s
uppo
rt se
rvic
es fo
r em
erge
ncy
man
ager
s (N
OAA
, ESA
).
Dat
a (4
.1)
• D
rive
the
deve
lopm
ent o
f Big
Dat
a st
anda
rds
and
mea
sure
men
t sci
ence
(NIS
T, E
SA).
• Es
tabl
ish
data
inte
rope
rabi
lity
acro
ss th
e D
epar
tmen
t and
exp
and
open
dat
a ac
cess
(NIS
T, E
SA, N
TIS)
.
• M
ake
Com
mer
ce d
ata
easi
er to
acc
ess,
use
, dow
nloa
d, a
nd c
ombi
ne th
roug
h a
“Fin
d it-
Con
nect
It” s
ervi
ce (E
SA, N
TIS)
.
Dat
a (4
.2)
•
Impr
ove
the
use
of e
xist
ing
fede
ral d
atab
ases
to h
elp
anal
yze
busi
ness
ass
ista
nce
and
econ
omic
gro
wth
pro
gram
s th
roug
hout
the
gove
rnm
ent (
ESA,
BIS
, ITA
, MBD
A).
• Ex
ecut
e hi
gh p
rofil
e st
atis
tical
dat
a pr
ogra
ms
wel
l (ES
A).
•
Incr
ease
dat
a sh
arin
g am
ong
fede
ral a
genc
ies
and
redu
ce th
e pu
blic
’s b
urde
n of
pro
vidi
ng in
form
atio
n (E
SA).
Dat
a (4
.3)
•
Expl
ore
com
bini
ng o
f Fed
eral
and
priv
ate-
sect
or d
atas
ets
to s
treng
then
dec
isio
n-m
akin
g (E
SA).
• C
ontin
ually
revi
sit a
nd re
vise
the
Dep
artm
ent’s
dat
a pr
oduc
ts to
mee
t cha
ngin
g ne
eds
(ESA
).
CEN-16
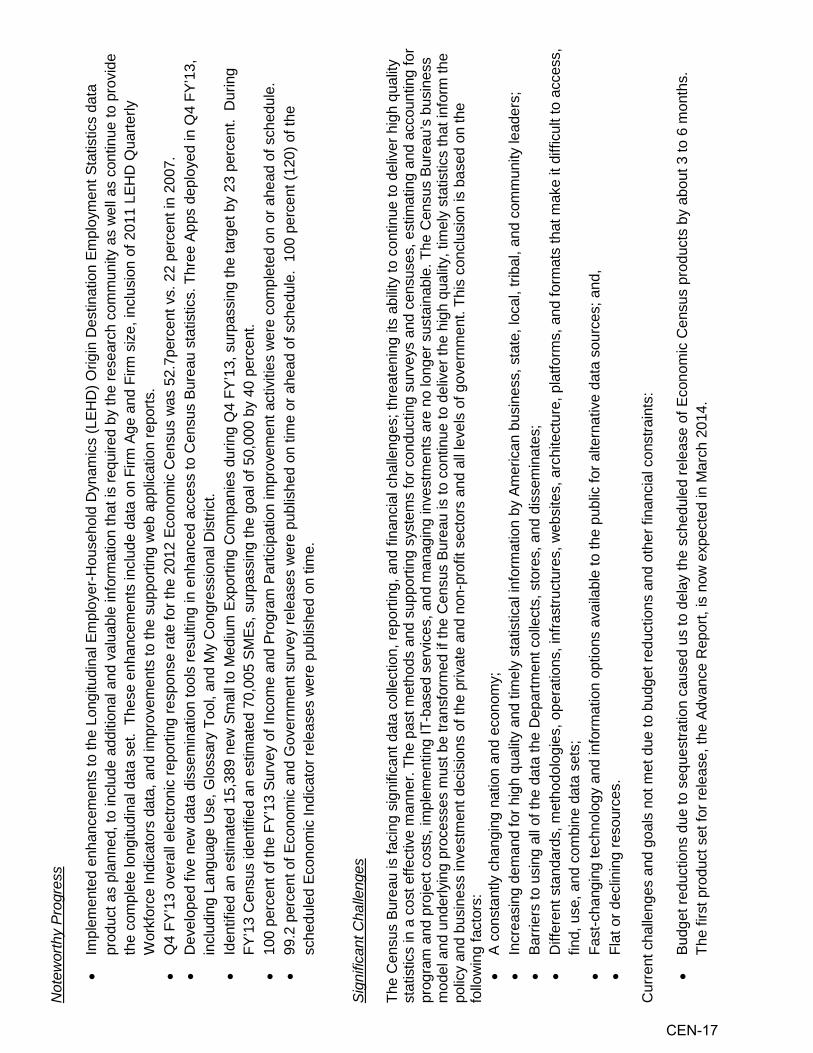
Not
ewor
thy
Pro
gres
s
• Im
plem
ente
d en
hanc
emen
ts to
the
Long
itudi
nal E
mpl
oyer
-Hou
seho
ld D
ynam
ics
(LEH
D) O
rigin
Des
tinat
ion
Empl
oym
ent S
tatis
tics
data
pr
oduc
t as
plan
ned,
to in
clud
e ad
ditio
nal a
nd v
alua
ble
info
rmat
ion
that
is re
quire
d by
the
rese
arch
com
mun
ity a
s w
ell a
s co
ntin
ue to
pro
vide
th
e co
mpl
ete
long
itudi
nal d
ata
set.
The
se e
nhan
cem
ents
incl
ude
data
on
Firm
Age
and
Firm
siz
e, in
clus
ion
of 2
011
LEH
D Q
uarte
rly
Wor
kfor
ce In
dica
tors
dat
a, a
nd im
prov
emen
ts to
the
supp
ortin
g w
eb a
pplic
atio
n re
ports
. •
Q4
FY’1
3 ov
eral
l ele
ctro
nic
repo
rting
resp
onse
rate
for t
he 2
012
Econ
omic
Cen
sus
was
52.
7per
cent
vs.
22
perc
ent i
n 20
07.
• D
evel
oped
five
new
dat
a di
ssem
inat
ion
tool
s re
sulti
ng in
enh
ance
d ac
cess
to C
ensu
s B
urea
u st
atis
tics.
Thr
ee A
pps
depl
oyed
in Q
4 FY
’13,
in
clud
ing
Lang
uage
Use
, Glo
ssar
y To
ol, a
nd M
y C
ongr
essi
onal
Dis
trict
. •
Iden
tifie
d an
est
imat
ed 1
5,38
9 ne
w S
mal
l to
Med
ium
Exp
ortin
g C
ompa
nies
dur
ing
Q4
FY’1
3, s
urpa
ssin
g th
e ta
rget
by
23 p
erce
nt.
Dur
ing
FY’1
3 C
ensu
s id
entif
ied
an e
stim
ated
70,
005
SMEs
, sur
pass
ing
the
goal
of 5
0,00
0 by
40
perc
ent.
•
100
perc
ent o
f the
FY’
13 S
urve
y of
Inco
me
and
Prog
ram
Par
ticip
atio
n im
prov
emen
t act
iviti
es w
ere
com
plet
ed o
n or
ahe
ad o
f sch
edul
e.
• 99
.2 p
erce
nt o
f Eco
nom
ic a
nd G
over
nmen
t sur
vey
rele
ases
wer
e pu
blis
hed
on ti
me
or a
head
of s
ched
ule.
100
per
cent
(120
) of t
he
sche
dule
d Ec
onom
ic In
dica
tor r
elea
ses
wer
e pu
blis
hed
on ti
me.
Sig
nific
ant C
halle
nges
Th
e C
ensu
s Bu
reau
is fa
cing
sig
nific
ant d
ata
colle
ctio
n, re
porti
ng, a
nd fi
nanc
ial c
halle
nges
; thr
eate
ning
its
abilit
y to
con
tinue
to d
eliv
er h
igh
qual
ity
stat
istic
s in
a c
ost e
ffect
ive
man
ner.
The
past
met
hods
and
sup
porti
ng s
yste
ms
for c
ondu
ctin
g su
rvey
s an
d ce
nsus
es, e
stim
atin
g an
d ac
coun
ting
for
prog
ram
and
pro
ject
cos
ts, i
mpl
emen
ting
IT-b
ased
ser
vice
s, a
nd m
anag
ing
inve
stm
ents
are
no
long
er s
usta
inab
le. T
he C
ensu
s Bu
reau
’s b
usin
ess
mod
el a
nd u
nder
lyin
g pr
oces
ses
mus
t be
trans
form
ed if
the
Cen
sus
Bure
au is
to c
ontin
ue to
del
iver
the
high
qua
lity,
tim
ely
stat
istic
s th
at in
form
the
polic
y an
d bu
sine
ss in
vest
men
t dec
isio
ns o
f the
priv
ate
and
non-
prof
it se
ctor
s an
d al
l lev
els
of g
over
nmen
t. Th
is c
oncl
usio
n is
bas
ed o
n th
e fo
llow
ing
fact
ors:
•
A co
nsta
ntly
cha
ngin
g na
tion
and
econ
omy;
•
Incr
easi
ng d
eman
d fo
r hig
h qu
ality
and
tim
ely
stat
istic
al in
form
atio
n by
Am
eric
an b
usin
ess,
sta
te, l
ocal
, trib
al, a
nd c
omm
unity
lead
ers;
•
Barr
iers
to u
sing
all
of th
e da
ta th
e D
epar
tmen
t col
lect
s, s
tore
s, a
nd d
isse
min
ates
; •
Diff
eren
t sta
ndar
ds, m
etho
dolo
gies
, ope
ratio
ns, i
nfra
stru
ctur
es, w
ebsi
tes,
arc
hite
ctur
e, p
latfo
rms,
and
form
ats
that
mak
e it
diffi
cult
to a
cces
s,
find,
use
, and
com
bine
dat
a se
ts;
• Fa
st-c
hang
ing
tech
nolo
gy a
nd in
form
atio
n op
tions
ava
ilabl
e to
the
publ
ic fo
r alte
rnat
ive
data
sou
rces
; and
, •
Flat
or d
eclin
ing
reso
urce
s.
Cur
rent
cha
lleng
es a
nd g
oals
not
met
due
to b
udge
t red
uctio
ns a
nd o
ther
fina
ncia
l con
stra
ints
:
• Bu
dget
redu
ctio
ns d
ue to
seq
uest
ratio
n ca
used
us
to d
elay
the
sche
dule
d re
leas
e of
Eco
nom
ic C
ensu
s pr
oduc
ts b
y ab
out 3
to 6
mon
ths.
Th
e fir
st p
rodu
ct s
et fo
r rel
ease
, the
Adv
ance
Rep
ort,
is n
ow e
xpec
ted
in M
arch
201
4.
CEN-17

• Al
so im
pact
ed b
y th
e sp
endi
ng c
uts
was
the
Surv
ey o
f Bus
ines
s O
wne
rs (S
BO).
The
Cen
sus
Bure
au c
ondu
cted
a re
-pla
nned
SBO
, whi
ch
invo
lved
mai
ling
lette
rs o
nly
with
the
initi
al m
ailo
ut a
nd u
sing
e-r
epor
ting
as th
e pr
imar
y m
etho
d of
col
lect
ion,
on
a de
laye
d sc
hedu
le.
• D
ata
rele
ases
ass
ocia
ted
with
the
Amer
ican
Com
mun
ity S
urve
y 3-
year
dat
a pr
oduc
ts w
ere
dela
yed
by 3
wee
ks a
nd 1
.5 w
eeks
with
the
5-ye
ar d
ata
prod
ucts
. Th
e re
leas
e of
the
2010
Cen
sus
Publ
ic U
se M
ircod
ata
Sam
ple
files
for a
ll 50
Sta
tes,
D.C
., an
d Pu
erto
Ric
o w
ere
canc
elle
d; a
nd fe
edba
ck to
Geo
grap
hic
Supp
ort S
yste
m In
itiat
ive
partn
ers
was
del
ayed
by
3 m
onth
s.
• Th
e Am
eric
an C
omm
unity
Sur
vey
Adm
inis
trativ
e R
ecor
ds R
esea
rch,
AC
S C
onte
nt T
estin
g ac
tiviti
es, a
nd im
plem
enta
tion
of fi
eld
test
s ne
eded
to in
form
crit
ical
202
0 C
ensu
s de
sign
dec
isio
ns w
ere
all d
elay
ed a
s w
ell.
Pa
rt 2
Pe
rfor
man
ce R
esul
ts a
nd P
lans
Se
ctio
n 1:
FY
201
3 Su
mm
ary
Des
crip
tion
of P
erfo
rman
ce b
y O
bjec
tive
Ben
efits
In
man
y w
ays,
the
Uni
ted
Stat
es is
a s
tatis
tics-
driv
en s
ocie
ty.
The
Nat
ion
depe
nds
on s
tatis
tics
prov
ided
by
the
Cen
sus
Bure
au to
det
erm
ine
busi
ness
dec
isio
ns, p
lan
for g
eogr
aphi
c an
d ec
onom
ic (b
oth
natio
nal a
nd in
tern
atio
nal)
expa
nsio
n, p
rovi
de fu
nds
to n
eedy
org
aniz
atio
ns, a
nd
dete
rmin
e po
litic
al e
xpan
sion
and
con
tract
ion.
Acc
urat
e bu
sine
ss in
form
atio
n re
gard
ing
the
dem
ogra
phic
s of
the
Nat
ion,
incl
udin
g m
easu
res
of th
e po
pula
tion,
eco
nom
y, a
nd g
over
nmen
ts a
ssis
ts e
ntre
pren
eurs
in id
entif
ying
mar
ket o
ppor
tuni
ties
that
can
gen
erat
e jo
bs.
Popu
latio
n es
timat
es
serv
e as
a s
tarti
ng p
oint
for a
lloca
ting
fede
ral,
stat
e, a
nd lo
cal f
unds
to v
ario
us g
roup
s w
ithin
soc
iety
. C
urre
nt a
nd b
ench
mar
k m
easu
res
of th
e U
.S. p
opul
atio
n, e
cono
my,
and
gov
ernm
ents
pla
y a
vita
l rol
e in
the
Nat
ion’
s ec
onom
ic w
ell-b
eing
. The
C
ensu
s Bu
reau
use
s th
e de
cenn
ial c
ensu
s to
pro
vide
the
offic
ial p
opul
atio
n co
unts
for d
eter
min
ing
the
allo
catio
n to
sta
tes
of s
eats
in th
e U
.S.
Hou
se o
f Rep
rese
ntat
ives
and
for d
eter
min
ing
how
the
dist
ricts
are
def
ined
for t
hose
sea
ts. T
he C
ensu
s Bu
reau
pro
vide
s to
eac
h st
ate
the
data
ne
cess
ary
to d
eter
min
e C
ongr
essi
onal
, sta
te, a
nd lo
cal l
egis
lativ
e bo
unda
ries.
The
dec
enni
al c
ensu
s pr
ovid
es c
ompr
ehen
sive
and
use
ful
dem
ogra
phic
info
rmat
ion
abou
t all
peop
le li
ving
in th
e U
nite
d St
ates
, Pue
rto R
ico,
and
the
asso
ciat
ed Is
land
Are
as. T
he p
rogr
am a
lso
prov
ides
dat
a fo
r sm
all g
eogr
aphi
c ar
eas
and
popu
latio
n gr
oups
that
fede
ral a
genc
ies
need
to im
plem
ent l
egal
ly m
anda
ted
prog
ram
s. A
ppro
xim
atel
y $4
00 b
illion
a
year
is d
istri
bute
d to
sta
te a
nd lo
cal g
over
nmen
ts u
sing
form
ulas
that
are
bas
ed o
n da
ta s
uch
as s
tate
pop
ulat
ion
and
pers
onal
inco
me.
Th
e Ec
onom
ic C
ensu
s pr
ovid
es c
ompr
ehen
sive
, det
aile
d, a
nd a
utho
ritat
ive
fact
s ab
out t
he s
truct
ure
of th
e U
.S. e
cono
my
rang
ing
from
the
natio
nal
to th
e lo
cal l
evel
. The
Eco
nom
ic C
ensu
s co
vers
nea
rly 2
9 m
illion
bus
ines
s lo
catio
ns a
nd 8
4 pe
rcen
t of t
he N
atio
n’s
econ
omic
act
ivity
. The
Cen
sus
of G
over
nmen
ts is
the
only
sou
rce
of c
ompr
ehen
sive
and
uni
form
ly c
lass
ified
dat
a on
the
econ
omic
act
iviti
es o
f sta
te a
nd lo
cal g
over
nmen
ts. T
he
Cen
sus
of G
over
nmen
ts c
over
s ab
out 9
0,00
0 lo
cal g
over
nmen
ts, 1
2 pe
rcen
t of t
he g
ross
dom
estic
pro
duct
(GD
P) a
nd n
early
14
perc
ent o
f the
U.S
. w
orkf
orce
. The
Dem
ogra
phic
Sur
veys
Sam
ple
Red
esig
n (D
SSR
) pro
gram
des
igns
and
sel
ects
sam
ples
for t
he m
ajor
nat
iona
l hou
seho
ld s
urve
ys.
The
Inte
rcen
sal D
emog
raph
ic E
stim
ates
pro
gram
pro
vide
s up
date
d es
timat
es o
f the
U.S
. pop
ulat
ion
for t
he c
ount
ry, s
tate
s, c
ount
ies,
citi
es, a
nd
tow
nshi
ps.
CEN-18

New
FY
2014
and
FY
201
5 P
erfo
rman
ce In
dica
tors
W
ith th
e re
leas
e of
the
Dep
artm
ent o
f Com
mer
ce’s
new
201
4-20
18 S
trate
gic
Plan
, the
Cen
sus
Bure
au h
as d
evel
oped
a fe
w n
ew p
erfo
rman
ce
indi
cato
rs fo
r FY
2014
and
FY
2015
that
dire
ctly
alig
n w
ith th
e Bu
reau
's g
oals
and
obj
ectiv
es a
nd w
ith th
ose
of th
e D
epar
tmen
t. As
of D
ecem
ber 3
1,
2013
, the
se in
dica
tors
will
be u
sed
to re
port
on re
sults
for F
Y 20
14, c
ontin
uing
into
FY
2015
. R
ecur
ring
Indi
cato
rs
Indi
cato
r Ta
rget
Ac
tual
St
atus
Tr
end
Indi
cato
r 1: P
erce
ntag
e of
mon
thly
exp
ort
stat
istic
s re
leas
ed o
n sc
hedu
le
100%
10
0%
Met
Po
sitiv
e
Indi
cato
r 7: P
erce
ntag
e of
key
act
iviti
es fo
r cy
clic
al c
ensu
s pr
ogra
ms
com
plet
ed o
n tim
e to
su
ppor
t effe
ctiv
e de
cisi
on-m
akin
g by
po
licym
aker
s, b
usin
esse
s, a
nd th
e pu
blic
At le
ast 9
0%
At le
ast 9
0%
Met
Po
sitiv
e
Indi
cato
r 8: P
erce
ntag
e of
key
dat
a pr
oduc
ts fo
r C
ensu
s Bu
reau
pro
gram
s re
leas
ed o
n tim
e to
su
ppor
t effe
ctiv
e de
cisi
on-m
akin
g of
pol
icym
aker
s,
busi
ness
es, a
nd th
e pu
blic
.
1) 1
00%
of E
cono
mic
Indi
cato
rs
2) A
t lea
st 9
0% o
f oth
er k
ey
surv
eys
1) 1
00%
of E
cono
mic
Indi
cato
rs
2) A
t lea
st 9
0% o
f oth
er k
ey
surv
eys
Met
Po
sitiv
e
Non
-rec
urrin
g In
dica
tors
(the
se in
dica
tors
app
ear o
nly
in F
Y 2
013
and
are
not t
ied
to th
e ne
w g
oals
and
obj
ectiv
es)
Indi
cato
r Ta
rget
Ac
tual
St
atus
Tr
end
1A. P
rodu
ce ti
mel
y, re
leva
nt, a
nd a
ccur
ate
mea
sure
s sh
owin
g th
e dy
nam
ics
of lo
cal j
ob
mar
kets
and
iden
tifyi
ng th
e ch
angi
ng s
truct
ure
of
the
U.S
. eco
nom
y an
d its
effe
ct o
n jo
bs.
For s
tate
s th
at p
rovi
de w
age
reco
rds
on s
ched
ule,
we
will
prod
uce
Qua
rterly
Wor
kfor
ce
Indi
cato
rs fo
r at l
east
90
perc
ent
of th
ose
stat
es o
n tim
e ev
ery
quar
ter.
For s
tate
s th
at p
rovi
de w
age
reco
rds
on s
ched
ule,
we
prod
uced
Qua
rterly
Wor
kfor
ce
Indi
cato
rs fo
r at l
east
90
perc
ent
of th
ose
stat
es o
n tim
e ev
ery
quar
ter.
Met
Po
sitiv
e
2A-1
. Ach
ieve
pre
-det
erm
ined
col
lect
ion
rate
s fo
r C
ensu
s Bu
reau
sur
veys
in o
rder
to p
rovi
de
stat
istic
ally
relia
ble
data
to s
uppo
rt ef
fect
ive
deci
sion
-mak
ing
of p
olic
ymak
ers,
bus
ines
ses,
and
th
e pu
blic
.
At le
ast 9
0% o
f key
cen
suse
s an
d su
rvey
s m
eet o
r exc
eed
thei
r pre
dete
rmin
ed c
olle
ctio
n ra
tes
at p
lann
ed le
vels
of
relia
bilit
y.
At le
ast 9
0% o
f key
cen
suse
s an
d su
rvey
s m
et o
r exc
eed
thei
r pr
edet
erm
ined
col
lect
ion
rate
s at
pl
anne
d le
vels
of r
elia
bilit
y.
Met
St
able
2A-3
. Im
prov
e sa
tisfa
ctio
n w
ith th
e C
ensu
s Bu
reau
’s W
ebsi
te. (
Sam
e as
Mea
sure
2B-
2)
74%
of r
espo
nden
ts in
dica
te
that
they
wou
ld re
com
men
d th
e si
te to
oth
ers.
77%
of r
espo
nden
ts in
dica
ted
that
they
wou
ld re
com
men
d th
e si
te to
oth
ers.
Met
Va
ryin
g
CEN-19
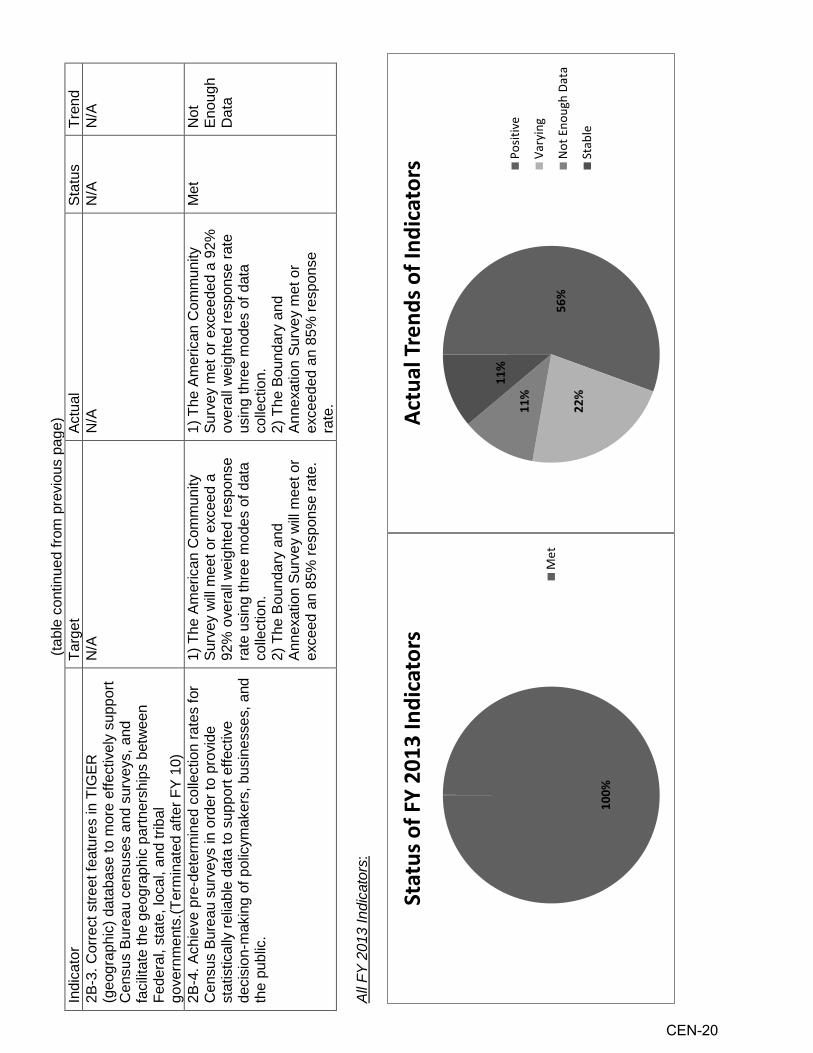
(tabl
e co
ntin
ued
from
pre
viou
s pa
ge)
Indi
cato
r Ta
rget
Ac
tual
St
atus
Tr
end
2B-3
. Cor
rect
stre
et fe
atur
es in
TIG
ER
(geo
grap
hic)
dat
abas
e to
mor
e ef
fect
ivel
y su
ppor
t C
ensu
s Bu
reau
cen
suse
s an
d su
rvey
s, a
nd
faci
litat
e th
e ge
ogra
phic
par
tner
ship
s be
twee
n Fe
dera
l, st
ate,
loca
l, an
d tri
bal
gove
rnm
ents
.(Ter
min
ated
afte
r FY
10)
N/A
N
/A
N/A
N
/A
2B-4
. Ach
ieve
pre
-det
erm
ined
col
lect
ion
rate
s fo
r C
ensu
s Bu
reau
sur
veys
in o
rder
to p
rovi
de
stat
istic
ally
relia
ble
data
to s
uppo
rt ef
fect
ive
deci
sion
-mak
ing
of p
olic
ymak
ers,
bus
ines
ses,
and
th
e pu
blic
.
1) T
he A
mer
ican
Com
mun
ity
Surv
ey w
ill m
eet o
r exc
eed
a 92
% o
vera
ll w
eigh
ted
resp
onse
ra
te u
sing
thre
e m
odes
of d
ata
colle
ctio
n.
2) T
he B
ound
ary
and
Anne
xatio
n Su
rvey
will
mee
t or
exce
ed a
n 85
% re
spon
se ra
te.
1) T
he A
mer
ican
Com
mun
ity
Surv
ey m
et o
r exc
eede
d a
92%
ov
eral
l wei
ghte
d re
spon
se ra
te
usin
g th
ree
mod
es o
f dat
a co
llect
ion.
2)
The
Bou
ndar
y an
d An
nexa
tion
Surv
ey m
et o
r ex
ceed
ed a
n 85
% re
spon
se
rate
.
Met
N
ot
Enou
gh
Dat
a
All
FY 2
013
Indi
cato
rs:
100%
Stat
us o
f FY
2013
Indi
cato
rs
Met
56%
22
%
11%
11%
Actu
al T
rend
s of I
ndic
ator
s Posit
ive
Vary
ing
Not
Eno
ugh
Data
Stab
le
CEN-20
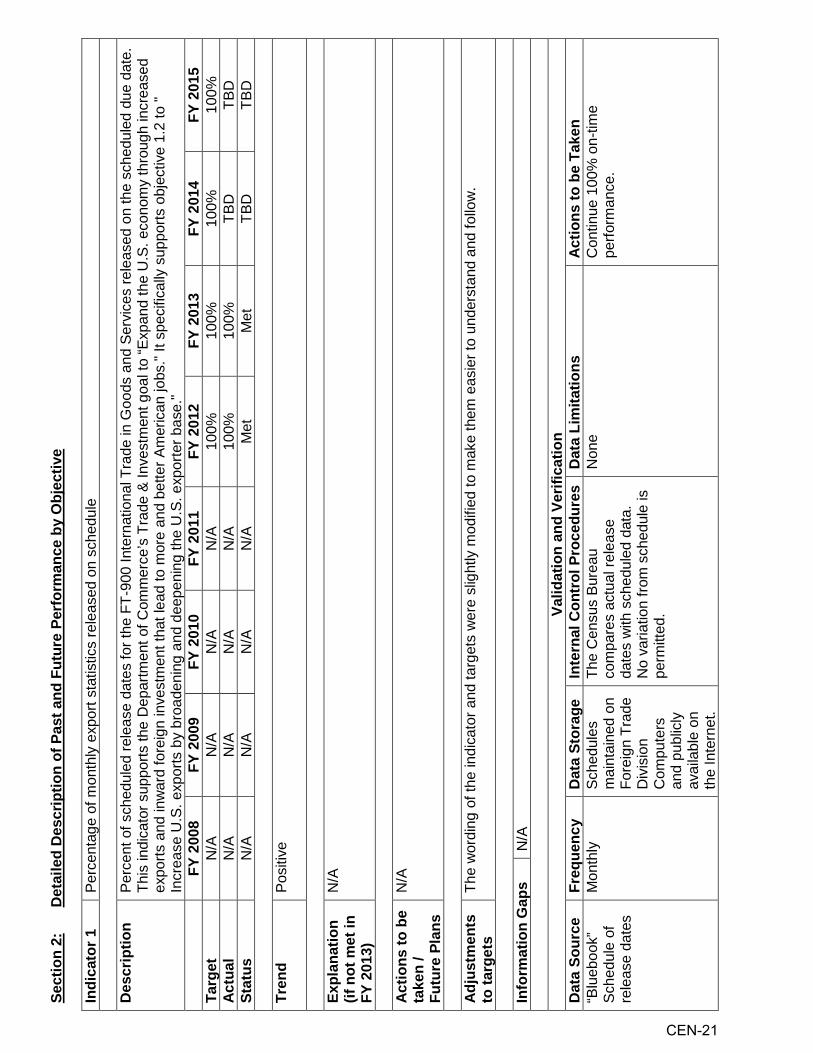
Sect
ion
2:
Det
aile
d D
escr
iptio
n of
Pas
t and
Fut
ure
Perf
orm
ance
by
Obj
ectiv
e In
dica
tor 1
Pe
rcen
tage
of m
onth
ly e
xpor
t sta
tistic
s re
leas
ed o
n sc
hedu
le
Des
crip
tion
Perc
ent o
f sch
edul
ed re
leas
e da
tes
for t
he F
T-90
0 In
tern
atio
nal T
rade
in G
oods
and
Ser
vice
s re
leas
ed o
n th
e sc
hedu
led
due
date
. Th
is in
dica
tor s
uppo
rts th
e D
epar
tmen
t of C
omm
erce
’s T
rade
& In
vest
men
t goa
l to
“Exp
and
the
U.S
. eco
nom
y th
roug
h in
crea
sed
expo
rts a
nd in
war
d fo
reig
n in
vest
men
t tha
t lea
d to
mor
e an
d be
tter A
mer
ican
jobs
." It
spec
ifica
lly s
uppo
rts o
bjec
tive
1.2
to "
Incr
ease
U.S
. exp
orts
by
broa
deni
ng a
nd d
eepe
ning
the
U.S
. exp
orte
r bas
e."
FY
200
8 FY
200
9 FY
201
0 FY
201
1 FY
201
2 FY
201
3 FY
201
4 FY
201
5 Ta
rget
N
/A
N/A
N
/A
N/A
10
0%
100%
10
0%
100%
A
ctua
l N
/A
N/A
N
/A
N/A
10
0%
100%
TB
D
TBD
St
atus
N
/A
N/A
N
/A
N/A
M
et
Met
TB
D
TBD
Tr
end
Posi
tive
Ex
plan
atio
n N
/A
(if n
ot m
et in
FY
201
3)
Act
ions
to b
e N
/A
take
n /
Futu
re P
lans
A
djus
tmen
ts
The
wor
ding
of t
he in
dica
tor a
nd ta
rget
s w
ere
slig
htly
mod
ified
to m
ake
them
eas
ier t
o un
ders
tand
and
follo
w.
to ta
rget
s In
form
atio
n G
aps
N/A
Valid
atio
n an
d Ve
rific
atio
n D
ata
Sour
ce
Freq
uenc
y D
ata
Stor
age
Inte
rnal
Con
trol
Pro
cedu
res
Dat
a Li
mita
tions
A
ctio
ns to
be
Take
n “B
lueb
ook”
M
onth
ly
Sche
dule
s Th
e C
ensu
s Bu
reau
N
one
Con
tinue
100
% o
n-tim
e Sc
hedu
le o
f m
aint
aine
d on
co
mpa
res
actu
al re
leas
e pe
rform
ance
. re
leas
e da
tes
Fore
ign
Trad
e da
tes
with
sch
edul
ed d
ata.
D
ivis
ion
No
varia
tion
from
sch
edul
e is
C
ompu
ters
pe
rmitt
ed.
and
publ
icly
av
aila
ble
on
the
Inte
rnet
.
CEN-21
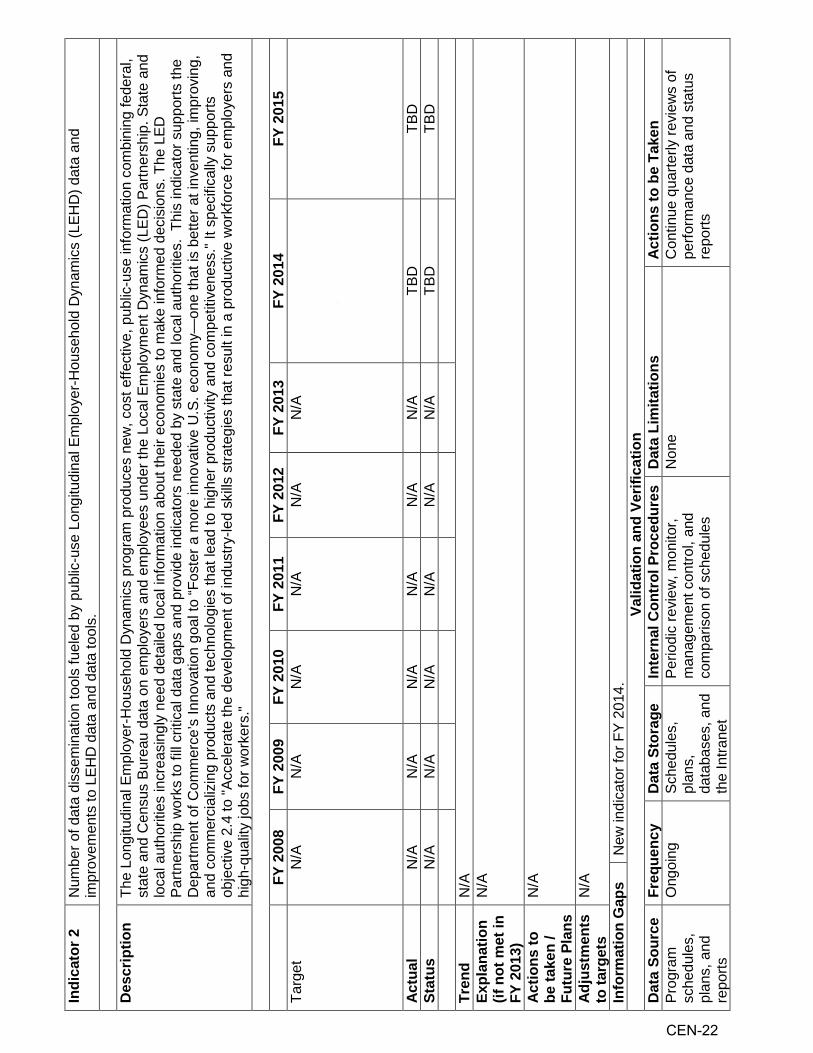
Indi
cato
r 2
Num
ber o
f dat
a di
ssem
inat
ion
tool
s fu
eled
by
publ
ic-u
se L
ongi
tudi
nal E
mpl
oyer
-Hou
seho
ld D
ynam
ics
(LEH
D) d
ata
and
impr
ovem
ents
to L
EHD
dat
a an
d da
ta to
ols.
D
escr
iptio
n Th
e Lo
ngitu
dina
l Em
ploy
er-H
ouse
hold
Dyn
amic
s pr
ogra
m p
rodu
ces
new
, cos
t effe
ctiv
e, p
ublic
-use
info
rmat
ion
com
bini
ng fe
dera
l, st
ate
and
Cen
sus
Bure
au d
ata
on e
mpl
oyer
s an
d em
ploy
ees
unde
r the
Loc
al E
mpl
oym
ent D
ynam
ics
(LED
) Par
tner
ship
. Sta
te a
nd
loca
l aut
horit
ies
incr
easi
ngly
nee
d de
taile
d lo
cal i
nfor
mat
ion
abou
t the
ir ec
onom
ies
to m
ake
info
rmed
dec
isio
ns. T
he L
ED
Partn
ersh
ip w
orks
to fi
ll cr
itica
l dat
a ga
ps a
nd p
rovi
de in
dica
tors
nee
ded
by s
tate
and
loca
l aut
horit
ies.
Thi
s in
dica
tor s
uppo
rts th
e D
epar
tmen
t of C
omm
erce
’s In
nova
tion
goal
to “F
oste
r a m
ore
inno
vativ
e U
.S. e
cono
my—
one
that
is b
ette
r at i
nven
ting,
impr
ovin
g,
and
com
mer
cial
izin
g pr
oduc
ts a
nd te
chno
logi
es th
at le
ad to
hig
her p
rodu
ctiv
ity a
nd c
ompe
titiv
enes
s." I
t spe
cific
ally
sup
ports
ob
ject
ive
2.4
to "A
ccel
erat
e th
e de
velo
pmen
t of i
ndus
try-le
d sk
ills s
trate
gies
that
resu
lt in
a p
rodu
ctiv
e w
orkf
orce
for e
mpl
oyer
s an
d hi
gh-q
ualit
y jo
bs fo
r wor
kers
."
FY
200
8 FY
200
9 FY
201
0 FY
201
1 FY
201
2 FY
201
3 FY
201
4 FY
201
5 Ta
rget
N
/A
N/A
N
/A
N/A
N
/A
N/A
1)
1
data
1)
1
data
di
ssem
inat
ion
tool
di
ssem
inat
ion
tool
2)
2
impr
ovem
ents
to
2)
3 im
prov
emen
ts to
LE
HD
dat
a an
d LE
HD
dat
a an
d da
ta to
ols
data
tool
s
Act
ual
N/A
N
/A
N/A
N
/A
N/A
N
/A
TBD
TB
D
Stat
us
N/A
N
/A
N/A
N
/A
N/A
N
/A
TBD
TB
D
Tr
end
N/A
Ex
plan
atio
n N
/A
(if n
ot m
et in
FY
201
3)
Act
ions
to
N/A
be
take
n /
Futu
re P
lans
A
djus
tmen
ts
N/A
to
targ
ets
Info
rmat
ion
Gap
s N
ew in
dica
tor f
or F
Y 20
14.
Va
lidat
ion
and
Verif
icat
ion
Dat
a So
urce
Fr
eque
ncy
Dat
a St
orag
e In
tern
al C
ontr
ol P
roce
dure
s D
ata
Lim
itatio
ns
Act
ions
to b
e Ta
ken
Prog
ram
O
ngoi
ng
Sche
dule
s,
Perio
dic
revi
ew, m
onito
r, N
one
Con
tinue
qua
rterly
revi
ews
of
sche
dule
s,
plan
s,
man
agem
ent c
ontro
l, an
d pe
rform
ance
dat
a an
d st
atus
pl
ans,
and
da
taba
ses,
and
co
mpa
rison
of s
ched
ules
re
ports
re
ports
th
e In
trane
t
CEN-22

Indi
cato
r 3
Num
ber o
f web
inar
s co
nduc
ted
and
enha
ncem
ents
to th
e C
ensu
s Bu
reau
’s O
nThe
Map
for E
mer
genc
y M
anag
emen
t web
site
. D
escr
iptio
n O
nThe
Map
for E
mer
genc
y M
anag
emen
t (O
TM-E
M) i
s a
publ
ic d
ata
tool
that
pro
vide
s un
ique
det
ail o
n th
e w
orkf
orce
, for
U.S
. are
as
affe
cted
by
hurr
ican
es, f
lood
s, a
nd w
ildfir
es, i
n re
al ti
me.
To
prov
ide
user
s w
ith th
e la
test
info
rmat
ion
avai
labl
e, O
nThe
Map
for
Emer
genc
y M
anag
emen
t aut
omat
ical
ly in
corp
orat
es re
al ti
me
data
upd
ates
from
the
Nat
iona
l Wea
ther
Ser
vice
, Dep
artm
ents
of
Inte
rior a
nd A
gric
ultu
re, a
nd o
ther
age
ncie
s fo
r hur
rican
es, f
lood
s, a
nd w
ildfir
es. T
his
indi
cato
r sup
ports
the
Dep
artm
ent o
f C
omm
erce
’s E
nviro
nmen
t goa
l to
“Ens
ure
com
mun
ities
and
bus
ines
ses
have
the
nece
ssar
y in
form
atio
n, p
rodu
cts,
and
ser
vice
s to
pr
epar
e fo
r and
pro
sper
in a
cha
ngin
g en
viro
nmen
t." I
t spe
cific
ally
sup
ports
obj
ectiv
e 3.
2 to
"Im
prov
e pr
epar
edne
ss, r
espo
nse,
and
re
cove
ry fr
om w
eath
er a
nd w
ater
eve
nts
by b
uild
ing
a W
eath
er-R
eady
Nat
ion.
"
FY 2
008
FY 2
009
FY 2
010
FY 2
011
FY 2
012
FY 2
013
FY 2
014
FY 2
015
Targ
et
N/A
N
/A
N/A
N
/A
N/A
N
/A
1)
2 w
ebin
ars
or
1)
2 w
ebin
ars
or
train
ing
show
ing
train
ing
show
ing
emer
genc
y an
d em
erge
ncy
and
city
pla
nner
s ho
w
city
pla
nner
s ho
w
to n
avig
ate
OTM
-to
nav
igat
e O
TM-
EM
E
M
2)
2 en
hanc
emen
ts
2)
2 re
view
s of
use
r to
OTM
-EM
fe
edba
ck o
n en
hanc
emen
ts to
O
TM-E
M
Act
ual
N/A
N
/A
N/A
N
/A
N/A
N
/A
TBD
TB
D
Stat
us
N/A
N
/A
N/A
N
/A
N/A
N
/A
TBD
TB
D
Tren
d N
/A
Expl
anat
ion
N/A
A
ctio
ns to
N
/A
be ta
ken
/ Fu
ture
Pla
ns
Adj
ustm
ents
N
/A
to ta
rget
s In
form
atio
n G
aps
New
indi
cato
r for
FY
2014
.
Valid
atio
n an
d Ve
rific
atio
n D
ata
Sour
ce
Freq
uenc
y D
ata
Stor
age
Inte
rnal
Con
trol
Pro
cedu
res
Dat
a Li
mita
tions
A
ctio
ns to
be
Take
n Pr
ogra
m
Ong
oing
Sc
hedu
les,
Pe
riodi
c re
view
, mon
itor,
Non
e C
ontin
ue q
uarte
rly re
view
s of
sc
hedu
les,
pl
ans,
m
anag
emen
t con
trol,
and
perfo
rman
ce d
ata
and
stat
us
plan
s, a
nd
data
base
s, a
nd
com
paris
on o
f sch
edul
es
repo
rts
repo
rts
the
Intra
net
CEN-23
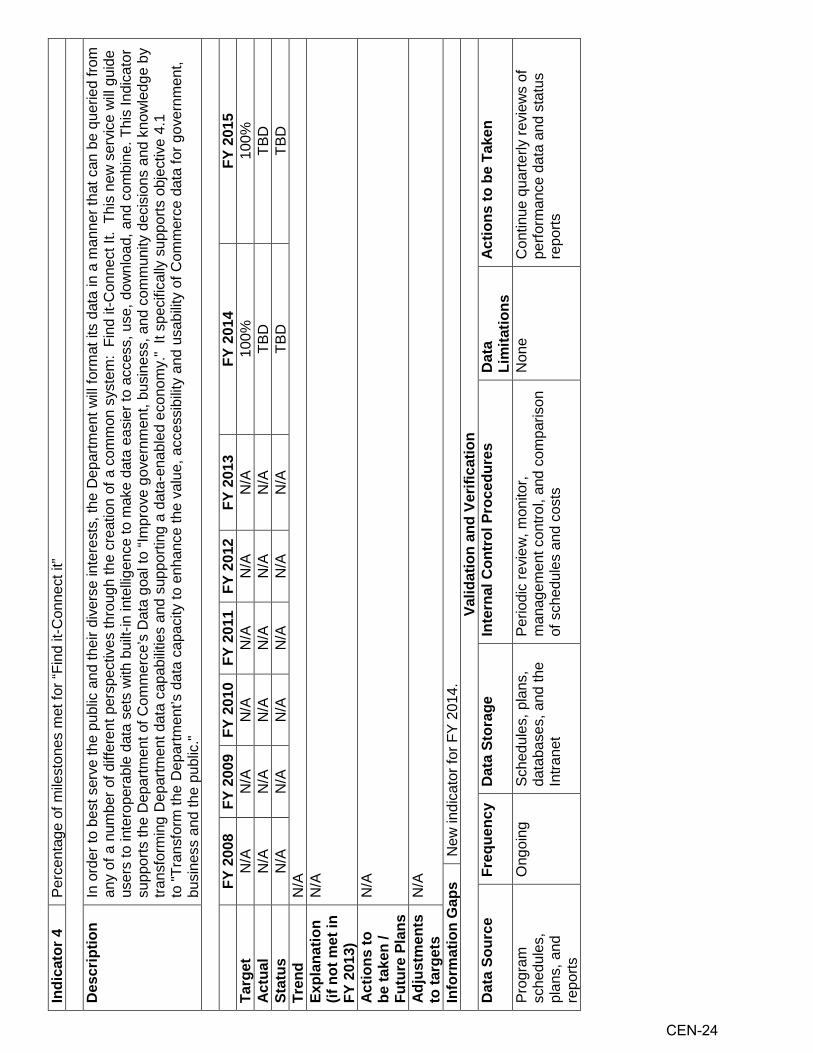
Indi
cato
r 4
Perc
enta
ge o
f mile
ston
es m
et fo
r “Fi
nd it
-Con
nect
it”
Des
crip
tion
In o
rder
to b
est s
erve
the
publ
ic a
nd th
eir d
iver
se in
tere
sts,
the
Dep
artm
ent w
ill fo
rmat
its
data
in a
man
ner t
hat c
an b
e qu
erie
d fro
m
any
of a
num
ber o
f diff
eren
t per
spec
tives
thro
ugh
the
crea
tion
of a
com
mon
sys
tem
: Fi
nd it
-Con
nect
It.
This
new
ser
vice
will
guid
e us
ers
to in
tero
pera
ble
data
set
s w
ith b
uilt-
in in
tellig
ence
to m
ake
data
eas
ier t
o ac
cess
, use
, dow
nloa
d, a
nd c
ombi
ne. T
his
Indi
cato
r su
ppor
ts th
e D
epar
tmen
t of C
omm
erce
’s D
ata
goal
to “I
mpr
ove
gove
rnm
ent,
busi
ness
, and
com
mun
ity d
ecis
ions
and
kno
wle
dge
by
trans
form
ing
Dep
artm
ent d
ata
capa
bilit
ies
and
supp
ortin
g a
data
-ena
bled
eco
nom
y."
It sp
ecifi
cally
sup
ports
obj
ectiv
e 4.
1 to
"Tra
nsfo
rm th
e D
epar
tmen
t’s d
ata
capa
city
to e
nhan
ce th
e va
lue,
acc
essi
bilit
y an
d us
abilit
y of
Com
mer
ce d
ata
for g
over
nmen
t, bu
sine
ss a
nd th
e pu
blic
."
FY
200
8 FY
200
9 FY
201
0 FY
201
1 FY
201
2 FY
201
3 FY
201
4 FY
201
5 Ta
rget
N
/A
N/A
N
/A
N/A
N
/A
N/A
10
0%
100%
A
ctua
l N
/A
N/A
N
/A
N/A
N
/A
N/A
TB
D
TBD
St
atus
N
/A
N/A
N
/A
N/A
N
/A
N/A
TB
D
TBD
Tr
end
N/A
Ex
plan
atio
n N
/A
(if n
ot m
et in
FY
201
3)
Act
ions
to
N/A
be
take
n /
Futu
re P
lans
A
djus
tmen
ts
N/A
to
targ
ets
Info
rmat
ion
Gap
s N
ew in
dica
tor f
or F
Y 20
14.
Va
lidat
ion
and
Verif
icat
ion
Dat
a So
urce
Fr
eque
ncy
Dat
a St
orag
e In
tern
al C
ontr
ol P
roce
dure
s D
ata
Act
ions
to b
e Ta
ken
Lim
itatio
ns
Prog
ram
O
ngoi
ng
Sche
dule
s, p
lans
, Pe
riodi
c re
view
, mon
itor,
Non
e C
ontin
ue q
uarte
rly re
view
s of
sc
hedu
les,
da
taba
ses,
and
the
man
agem
ent c
ontro
l, an
d co
mpa
rison
pe
rform
ance
dat
a an
d st
atus
pl
ans,
and
In
trane
t of
sch
edul
es a
nd c
osts
re
ports
re
ports
CEN-24

Indi
cato
r 5
Perc
enta
ge o
f mile
ston
es m
et fo
r bus
ines
s as
sist
ance
ana
lysi
s D
escr
iptio
n Th
e fe
dera
l gov
ernm
ent p
rovi
des
billio
ns o
f dol
lars
in b
usin
ess
assi
stan
ce p
rogr
ams
each
yea
r. T
he D
epar
tmen
t is
resp
onsi
ble
for
man
y su
ch p
rogr
ams.
Ana
lyzi
ng th
e ef
fect
iven
ess
of th
is a
ssis
tanc
e an
d id
entif
ying
key
driv
ers
of s
ucce
ss c
an b
e di
fficu
lt an
d tim
e-co
nsum
ing.
Bet
ter a
nd p
erha
ps fa
ster
ass
essm
ents
cou
ld b
e m
ade
if th
e fe
dera
l gov
ernm
ent’s
exi
stin
g ec
onom
ic, d
emog
raph
ic,
and
scie
ntifi
c da
ta a
re a
pplie
d to
the
deci
sion
-mak
ing
proc
ess
in a
mea
ning
ful w
ay.
The
aim
is to
arri
ve a
t the
bes
t way
to
inco
rpor
ate
info
rmat
ion
and
anal
yses
gle
aned
from
exi
stin
g da
tase
ts in
to b
usin
ess-
assi
stan
ce p
rogr
am d
ecis
ions
. Thi
s In
dica
tor
supp
orts
the
Dep
artm
ent o
f Com
mer
ce’s
Dat
a go
al to
“Im
prov
e go
vern
men
t, bu
sine
ss, a
nd c
omm
unity
dec
isio
ns a
nd k
now
ledg
e by
tra
nsfo
rmin
g D
epar
tmen
t dat
a ca
pabi
litie
s an
d su
ppor
ting
a da
ta-e
nabl
ed e
cono
my.
" It
spec
ifica
lly s
uppo
rts o
bjec
tive
4.2
to "I
mpr
ove
data
-bas
ed s
ervi
ces,
dec
isio
n-m
akin
g, a
nd d
ata
shar
ing
with
in th
e D
epar
tmen
t and
with
oth
er p
arts
the
fede
ral
gove
rnm
ent.”
FY
200
8 FY
200
9 FY
201
0 FY
201
1 FY
201
2 FY
201
3 FY
201
4 FY
201
5 Ta
rget
N
/A
N/A
N
/A
N/A
N
/A
N/A
10
0%
100%
A
ctua
l N
/A
N/A
N
/A
N/A
N
/A
N/A
TB
D
TBD
St
atus
N
/A
N/A
N
/A
N/A
N
/A
N/A
TB
D
TBD
Tr
end
N/A
Ex
plan
atio
n N
/A
(if n
ot m
et in
FY
201
3)
Act
ions
to
N/A
be
take
n /
Futu
re P
lans
A
djus
tmen
ts
N/A
to
targ
ets
Info
rmat
ion
Gap
s N
ew in
dica
tor f
or F
Y 20
14.
Va
lidat
ion
and
Verif
icat
ion
Dat
a So
urce
Fr
eque
ncy
Dat
a St
orag
e In
tern
al C
ontr
ol P
roce
dure
s D
ata
Act
ions
to b
e Ta
ken
Lim
itatio
ns
Prog
ram
O
ngoi
ng
Sche
dule
s, p
lans
, Pe
riodi
c re
view
, mon
itor,
Non
e C
ontin
ue q
uarte
rly re
view
s of
sc
hedu
les,
da
taba
ses,
and
the
man
agem
ent c
ontro
l, an
d co
mpa
rison
pe
rform
ance
dat
a an
d st
atus
pl
ans,
and
In
trane
t of
sch
edul
es a
nd c
osts
re
ports
re
ports
CEN-25

Indi
cato
r 6
Cos
t effi
cien
cy o
f 202
0 de
cenn
ial c
ensu
s D
escr
iptio
n D
ue to
the
natu
re o
f thi
s pr
ogra
m, i
t is
impo
rtant
to tr
ack
long
-term
qua
lity,
cos
t, an
d de
liver
y sc
hedu
le g
oals
. Th
e C
ensu
s Bu
reau
ha
s em
bark
ed o
n a
mul
ti-ye
ar re
sear
ch a
nd te
stin
g pr
ogra
m fo
cuse
d on
maj
or in
nova
tions
to th
e de
sign
of t
he c
ensu
s an
d or
ient
ed
arou
nd m
ajor
cos
t driv
ers.
Thi
s In
dica
tor s
uppo
rts th
e D
epar
tmen
t of C
omm
erce
’s D
ata
goal
to “I
mpr
ove
gove
rnm
ent,
busi
ness
, an
d co
mm
unity
dec
isio
ns a
nd k
now
ledg
e by
tran
sfor
min
g D
epar
tmen
t dat
a ca
pabi
litie
s an
d su
ppor
ting
a da
ta-e
nabl
ed e
cono
my.
" It
spec
ifica
lly s
uppo
rts o
bjec
tive
4.2
to "I
mpr
ove
data
-bas
ed s
ervi
ces,
dec
isio
n-m
akin
g, a
nd d
ata
shar
ing
with
in th
e D
epar
tmen
t and
w
ith o
ther
par
ts th
e fe
dera
l gov
ernm
ent."
FY
200
8 FY
200
9 FY
201
0 FY
201
1 FY
201
2 FY
201
3 FY
201
4 FY
201
5 Ta
rget
N
/A
N/A
N
/A
N/A
N
/A
N/A
Tw
o fie
ld te
sts
that
will
info
rm c
ost a
nd q
ualit
y go
als
for t
he 2
020
Cen
sus
Prel
imin
ary
desi
gn fo
r key
co
mpo
nent
s of
the
2020
C
ensu
s to
ach
ieve
cos
t and
qu
ality
goa
ls
Act
ual
N/A
N
/A
N/A
N
/A
N/A
N
/A
TBD
TB
D
Stat
us
N/A
N
/A
N/A
N
/A
N/A
N
/A
TBD
TB
D
Tren
d N
/A
Expl
anat
ion
(if n
ot m
et in
FY
201
3)
N/A
Act
ions
to
be ta
ken
/ Fu
ture
Pla
ns
N/A
Adj
ustm
ents
to
targ
ets
N/A
Info
rmat
ion
Gap
s N
ew in
dica
tor f
or F
Y 20
14.
Va
lidat
ion
and
Verif
icat
ion
Dat
a So
urce
Fr
eque
ncy
Dat
a St
orag
e In
tern
al C
ontr
ol P
roce
dure
s D
ata
Lim
itatio
ns
Act
ions
to b
e Ta
ken
Prog
ram
sc
hedu
les,
pl
ans,
and
re
ports
Ong
oing
Sc
hedu
les,
pla
ns,
data
base
s, a
nd th
e In
trane
t
Perio
dic
revi
ew, m
onito
r, m
anag
emen
t con
trol,
and
com
paris
on
of s
ched
ules
and
cos
ts
Non
e C
ontin
ue q
uarte
rly re
view
s of
pe
rform
ance
dat
a an
d st
atus
re
ports
CEN-26

Indi
cato
r 7
Perc
enta
ge o
f key
act
iviti
es fo
r cyc
lical
cen
sus
prog
ram
s co
mpl
eted
on
time
to s
uppo
rt ef
fect
ive
deci
sion
-mak
ing
by p
olic
ymak
ers,
bu
sine
sses
, and
the
publ
ic.
Des
crip
tion
Due
to th
e cy
clic
al n
atur
e of
thes
e pr
ogra
ms,
it is
impo
rtant
to tr
ack
annu
al k
ey a
ctiv
ities
that
sup
port
the
prog
ram
s. T
he in
tern
al
activ
ities
that
are
trac
ked
are
thos
e co
nsid
ered
to b
e th
e m
ost i
mpo
rtant
in m
eetin
g th
e lo
ng-te
rm g
oals
of t
he c
yclic
al c
ensu
s pr
ogra
ms.
Thi
s In
dica
tor s
uppo
rts th
e D
epar
tmen
t of C
omm
erce
’s D
ata
goal
to “I
mpr
ove
gove
rnm
ent,
busi
ness
, and
com
mun
ity
deci
sion
s an
d kn
owle
dge
by tr
ansf
orm
ing
Dep
artm
ent d
ata
capa
bilit
ies
and
supp
ortin
g a
data
-ena
bled
eco
nom
y."
It sp
ecifi
cally
su
ppor
ts o
bjec
tive
4.2
to "I
mpr
ove
data
-bas
ed s
ervi
ces,
dec
isio
n-m
akin
g, a
nd d
ata
shar
ing
with
in th
e D
epar
tmen
t and
with
oth
er
parts
the
fede
ral g
over
nmen
t."
FY
200
8 FY
200
9 FY
201
0 FY
201
1 FY
201
2 FY
201
3 FY
201
4 FY
201
5 Ta
rget
At
leas
t 90%
At
leas
t 90%
At
leas
t 90%
At
leas
t 90%
At
leas
t 90%
At le
ast 9
0%
90
%
90%
Act
ual
Som
e pl
anne
d D
ress
R
ehea
rsal
ac
tiviti
es
wer
e ca
ncel
led
At le
ast 9
0%
At le
ast 9
0%
At le
ast 9
0%
At
leas
t 90%
At le
ast 9
0%
TB
D
TBD
Stat
us
Not
Met
M
et
Met
M
et
Met
M
et
TBD
TB
D
Tren
d
Posi
tive
Expl
anat
ion
N/A
A
ctio
ns to
be
take
n /
Futu
re P
lans
N/A
Adj
ustm
ents
to
targ
ets
The
wor
ding
of t
he in
dica
tor a
nd ta
rget
s w
ere
slig
htly
mod
ified
to m
ake
them
eas
ier t
o un
ders
tand
and
follo
w.
Info
rmat
ion
Gap
s N
/A
Va
lidat
ion
and
Verif
icat
ion
Dat
a So
urce
Fr
eque
ncy
Dat
a St
orag
e In
tern
al C
ontr
ol P
roce
dure
s D
ata
Lim
itatio
ns
Act
ions
to b
e Ta
ken
Activ
ity
sche
dule
s ke
pt b
y ea
ch
of th
e cy
clic
al
cens
us
prog
ram
s.
Ong
oing
, ba
sed
on
activ
ity
sche
dule
s.
The
Cen
sus
Bure
au p
rogr
am
offic
es m
aint
ain
activ
ity
sche
dule
s an
d pe
rform
ance
da
ta.
The
Cen
sus
Bure
au
com
pare
s ac
tual
com
plet
ion
date
s w
ith s
ched
uled
dat
es.
Perfo
rman
ce d
ata
are
revi
ewed
qua
rterly
.
Non
e
Con
tinue
qua
rterly
revi
ews
of
perfo
rman
ce d
ata.
CEN-27
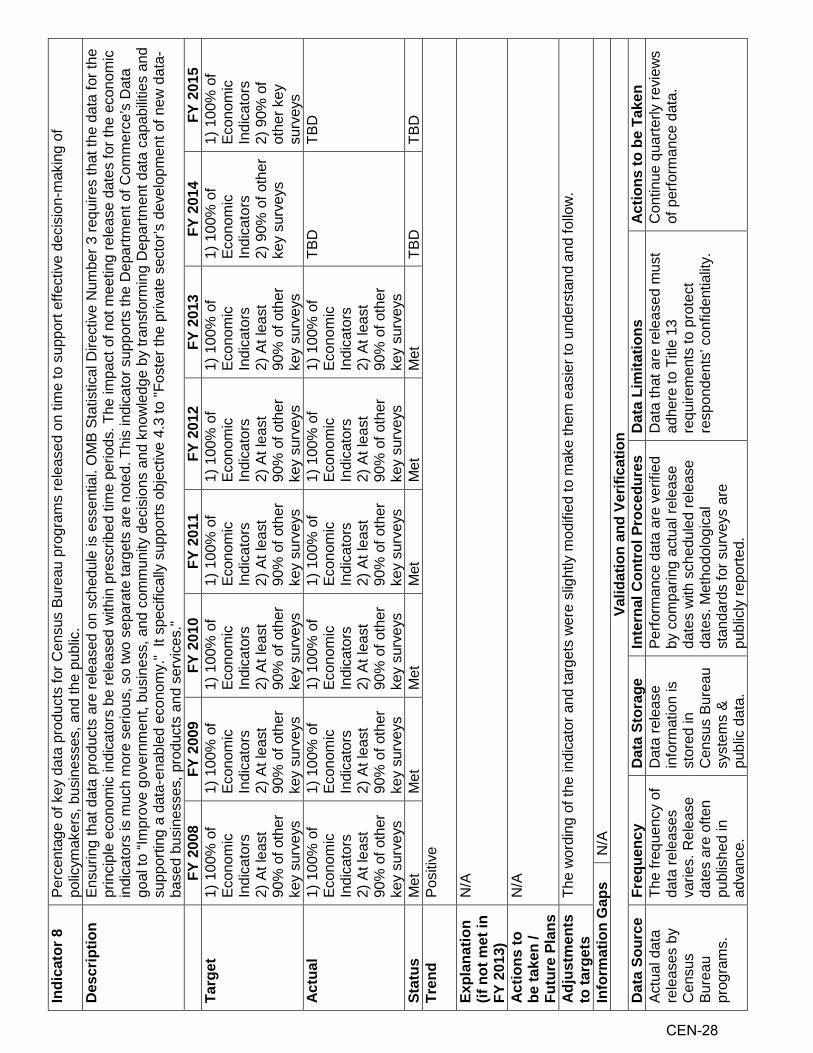
Indi
cato
r 8
Perc
enta
ge o
f key
dat
a pr
oduc
ts fo
r Cen
sus
Bure
au p
rogr
ams
rele
ased
on
time
to s
uppo
rt ef
fect
ive
deci
sion
-mak
ing
of
polic
ymak
ers,
bus
ines
ses,
and
the
publ
ic.
Des
crip
tion
Ensu
ring
that
dat
a pr
oduc
ts a
re re
leas
ed o
n sc
hedu
le is
ess
entia
l. O
MB
Stat
istic
al D
irect
ive
Num
ber 3
requ
ires
that
the
data
for t
he
prin
cipl
e ec
onom
ic in
dica
tors
be
rele
ased
with
in p
resc
ribed
tim
e pe
riods
. The
impa
ct o
f not
mee
ting
rele
ase
date
s fo
r the
eco
nom
ic
indi
cato
rs is
muc
h m
ore
serio
us, s
o tw
o se
para
te ta
rget
s ar
e no
ted.
Thi
s in
dica
tor s
uppo
rts th
e D
epar
tmen
t of C
omm
erce
’s D
ata
goal
to “I
mpr
ove
gove
rnm
ent,
busi
ness
, and
com
mun
ity d
ecis
ions
and
kno
wle
dge
by tr
ansf
orm
ing
Dep
artm
ent d
ata
capa
bilit
ies
and
supp
ortin
g a
data
-ena
bled
eco
nom
y."
It sp
ecifi
cally
sup
ports
obj
ectiv
e 4.
3 to
"Fos
ter t
he p
rivat
e se
ctor
’s d
evel
opm
ent o
f new
dat
a-ba
sed
busi
ness
es, p
rodu
cts
and
serv
ices
."
FY 2
008
FY 2
009
FY 2
010
FY 2
011
FY 2
012
FY 2
013
FY 2
014
FY 2
015
Targ
et
1) 1
00%
of
Econ
omic
In
dica
tors
2)
At l
east
90
% o
f oth
er
key
surv
eys
1) 1
00%
of
Econ
omic
In
dica
tors
2)
At l
east
90
% o
f oth
er
key
surv
eys
1) 1
00%
of
Econ
omic
In
dica
tors
2)
At l
east
90
% o
f oth
er
key
surv
eys
1) 1
00%
of
Econ
omic
In
dica
tors
2)
At l
east
90
% o
f oth
er
key
surv
eys
1) 1
00%
of
Econ
omic
In
dica
tors
2)
At l
east
90
% o
f oth
er
key
surv
eys
1) 1
00%
of
Econ
omic
In
dica
tors
2)
At l
east
90
% o
f oth
er
key
surv
eys
1) 1
00%
of
Econ
omic
In
dica
tors
2)
90%
of o
ther
ke
y su
rvey
s
1) 1
00%
of
Econ
omic
In
dica
tors
2)
90%
of
othe
r key
su
rvey
s A
ctua
l 1)
100
% o
f Ec
onom
ic
Indi
cato
rs
2) A
t lea
st
90%
of o
ther
ke
y su
rvey
s
1) 1
00%
of
Econ
omic
In
dica
tors
2)
At l
east
90
% o
f oth
er
key
surv
eys
1) 1
00%
of
Econ
omic
In
dica
tors
2)
At l
east
90
% o
f oth
er
key
surv
eys
1) 1
00%
of
Econ
omic
In
dica
tors
2)
At l
east
90
% o
f oth
er
key
surv
eys
1) 1
00%
of
Econ
omic
In
dica
tors
2)
At l
east
90
% o
f oth
er
key
surv
eys
1) 1
00%
of
Econ
omic
In
dica
tors
2)
At l
east
90
% o
f oth
er
key
surv
eys
TBD
TB
D
Stat
us
Met
M
et
Met
M
et
Met
M
et
TBD
TB
D
Tren
d
Posi
tive
Expl
anat
ion
(if n
ot m
et in
FY
201
3)
N/A
Act
ions
to
be ta
ken
/ Fu
ture
Pla
ns
N/A
Adj
ustm
ents
to
targ
ets
The
wor
ding
of t
he in
dica
tor a
nd ta
rget
s w
ere
slig
htly
mod
ified
to m
ake
them
eas
ier t
o un
ders
tand
and
follo
w.
Info
rmat
ion
Gap
s N
/A
Valid
atio
n an
d Ve
rific
atio
n D
ata
Sour
ce
Freq
uenc
y D
ata
Stor
age
Inte
rnal
Con
trol
Pro
cedu
res
Dat
a Li
mita
tions
A
ctio
ns to
be
Take
n Ac
tual
dat
a re
leas
es b
y C
ensu
s Bu
reau
pr
ogra
ms.
The
frequ
ency
of
data
rele
ases
va
ries.
Rel
ease
da
tes
are
ofte
n pu
blis
hed
in
adva
nce.
Dat
a re
leas
e in
form
atio
n is
st
ored
in
Cen
sus
Bure
au
syst
ems
& pu
blic
dat
a.
Perfo
rman
ce d
ata
are
verif
ied
by c
ompa
ring
actu
al re
leas
e da
tes
with
sch
edul
ed re
leas
e da
tes.
Met
hodo
logi
cal
stan
dard
s fo
r sur
veys
are
pu
blic
ly re
porte
d.
Dat
a th
at a
re re
leas
ed m
ust
adhe
re to
Titl
e 13
re
quire
men
ts to
pro
tect
re
spon
dent
s’ c
onfid
entia
lity.
Con
tinue
qua
rterly
revi
ews
of p
erfo
rman
ce d
ata.
CEN-28

Non
-Rec
urrin
g In
dica
tors
In
dica
tor 1
A Pr
oduc
e tim
ely,
rele
vant
, and
acc
urat
e m
easu
res
show
ing
the
dyna
mic
s of
loca
l job
mar
kets
and
iden
tifyi
ng th
e ch
angi
ng s
truct
ure
of
the
U.S
. eco
nom
y an
d its
effe
ct o
n jo
bs.
Des
crip
tion
Und
er th
e Lo
cal E
mpl
oym
ent D
ynam
ics
(LED
) par
tner
ship
, sta
tes
supp
ly q
uarte
rly w
orke
r and
bus
ines
s w
age
reco
rds
to th
e C
ensu
s Bu
reau
for d
ata
inte
grat
ion
to b
uild
a lo
ngitu
dina
l nat
iona
l fra
me
of jo
bs a
nd th
e pr
oduc
tion
of Q
uarte
rly W
orkf
orce
Indi
cato
rs (Q
WI)
that
mea
sure
the
dyna
mic
s of
the
U.S
. lab
or fo
rce
and
econ
omy.
Tim
ely
prod
uctio
n of
qua
lity
QW
I dat
a is
a k
ey p
erfo
rman
ce
mea
sure
for t
he C
ensu
s Bu
reau
.
FY 2
008
FY 2
009
FY 2
010
FY 2
011
FY 2
012
FY 2
013
Targ
et
N/A
N
/A
N/A
N
/A
For s
tate
s th
at p
rovi
de
wag
e re
cord
s on
sc
hedu
le, w
e w
ill pr
oduc
e Q
uarte
rly
Wor
kfor
ce In
dica
tors
fo
r at l
east
90
perc
ent
of th
ose
stat
es o
n tim
e ev
ery
quar
ter.
For s
tate
s th
at p
rovi
de
wag
e re
cord
s on
sc
hedu
le, w
e w
ill pr
oduc
e Q
uarte
rly
Wor
kfor
ce In
dica
tors
fo
r at l
east
90
perc
ent
of th
ose
stat
es o
n tim
e ev
ery
quar
ter.
Actu
al
N/A
N
/A
N/A
N
/A
For s
tate
s th
at p
rovi
de
wag
e re
cord
s on
sc
hedu
le, w
e pr
oduc
ed Q
uarte
rly
Wor
kfor
ce In
dica
tors
fo
r at l
east
90
perc
ent
of th
ose
stat
es o
n tim
e ev
ery
quar
ter.
For s
tate
s th
at p
rovi
de
wag
e re
cord
s on
sc
hedu
le, w
e pr
oduc
ed Q
uarte
rly
Wor
kfor
ce In
dica
tors
fo
r at l
east
90
perc
ent
of th
ose
stat
es o
n tim
e ev
ery
quar
ter.
Stat
us
N/A
N
/A
N/A
N
/A
Met
M
et
Tren
d PO
SIT
IVE
Expl
anat
ion
(if n
ot m
et in
FY
201
3)
N/A
CEN-29
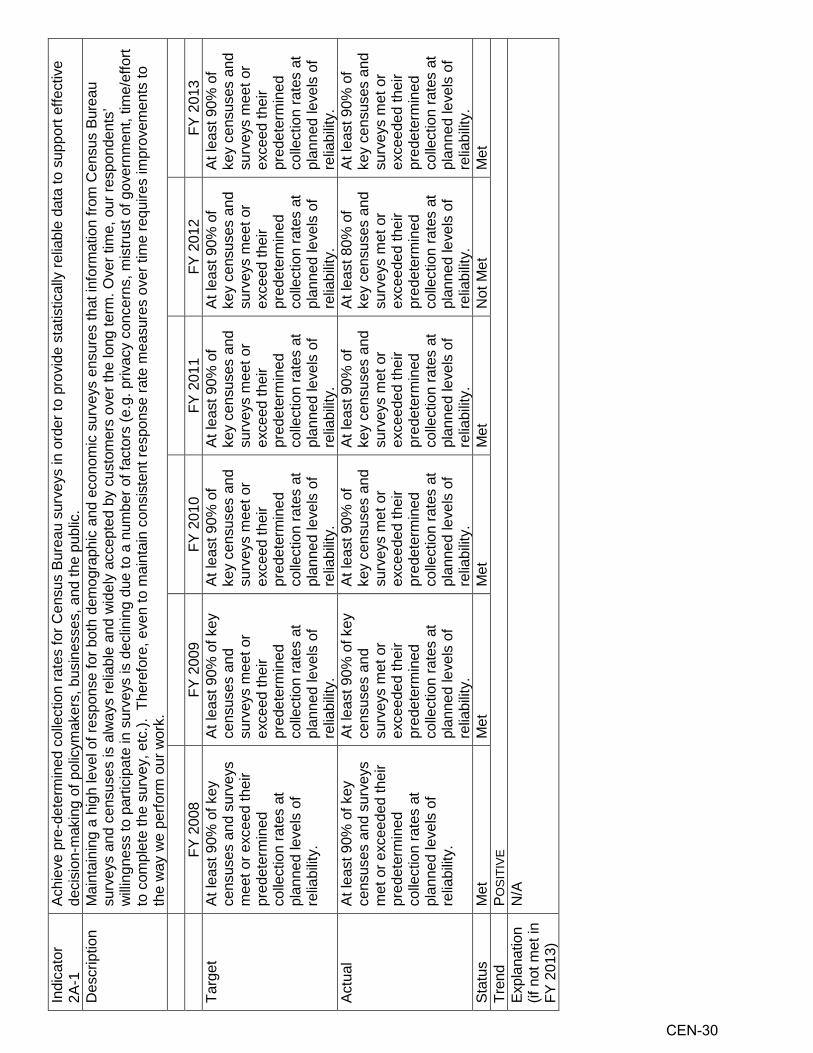
Indi
cato
r 2A
-1
Achi
eve
pre-
dete
rmin
ed c
olle
ctio
n ra
tes
for C
ensu
s Bu
reau
sur
veys
in o
rder
to p
rovi
de s
tatis
tical
ly re
liabl
e da
ta to
sup
port
effe
ctiv
e de
cisi
on-m
akin
g of
pol
icym
aker
s, b
usin
esse
s, a
nd th
e pu
blic
. D
escr
iptio
n M
aint
aini
ng a
hig
h le
vel o
f res
pons
e fo
r bot
h de
mog
raph
ic a
nd e
cono
mic
sur
veys
ens
ures
that
info
rmat
ion
from
Cen
sus
Bure
au
surv
eys
and
cens
uses
is a
lway
s re
liabl
e an
d w
idel
y ac
cept
ed b
y cu
stom
ers
over
the
long
term
. Ove
r tim
e, o
ur re
spon
dent
s’
willi
ngne
ss to
par
ticip
ate
in s
urve
ys is
dec
linin
g du
e to
a n
umbe
r of f
acto
rs (e
.g. p
rivac
y co
ncer
ns, m
istru
st o
f gov
ernm
ent,
time/
effo
rt to
com
plet
e th
e su
rvey
, etc
.). T
here
fore
, eve
n to
mai
ntai
n co
nsis
tent
resp
onse
rate
mea
sure
s ov
er ti
me
requ
ires
impr
ovem
ents
to
the
way
we
perfo
rm o
ur w
ork.
FY
200
8 FY
200
9 FY
201
0 FY
201
1 FY
201
2 FY
201
3 Ta
rget
At
leas
t 90%
of k
ey
cens
uses
and
sur
veys
m
eet o
r exc
eed
thei
r pr
edet
erm
ined
co
llect
ion
rate
s at
pl
anne
d le
vels
of
relia
bilit
y.
At le
ast 9
0% o
f key
ce
nsus
es a
nd
surv
eys
mee
t or
exce
ed th
eir
pred
eter
min
ed
colle
ctio
n ra
tes
at
plan
ned
leve
ls o
f re
liabi
lity.
At le
ast 9
0% o
f ke
y ce
nsus
es a
nd
surv
eys
mee
t or
exce
ed th
eir
pred
eter
min
ed
colle
ctio
n ra
tes
at
plan
ned
leve
ls o
f re
liabi
lity.
At le
ast 9
0% o
f ke
y ce
nsus
es a
nd
surv
eys
mee
t or
exce
ed th
eir
pred
eter
min
ed
colle
ctio
n ra
tes
at
plan
ned
leve
ls o
f re
liabi
lity.
At le
ast 9
0% o
f ke
y ce
nsus
es a
nd
surv
eys
mee
t or
exce
ed th
eir
pred
eter
min
ed
colle
ctio
n ra
tes
at
plan
ned
leve
ls o
f re
liabi
lity.
At le
ast 9
0% o
f ke
y ce
nsus
es a
nd
surv
eys
mee
t or
exce
ed th
eir
pred
eter
min
ed
colle
ctio
n ra
tes
at
plan
ned
leve
ls o
f re
liabi
lity.
Ac
tual
At
leas
t 90%
of k
ey
cens
uses
and
sur
veys
m
et o
r exc
eede
d th
eir
pred
eter
min
ed
colle
ctio
n ra
tes
at
plan
ned
leve
ls o
f re
liabi
lity.
At le
ast 9
0% o
f key
ce
nsus
es a
nd
surv
eys
met
or
exce
eded
thei
r pr
edet
erm
ined
co
llect
ion
rate
s at
pl
anne
d le
vels
of
relia
bilit
y.
At le
ast 9
0% o
f ke
y ce
nsus
es a
nd
surv
eys
met
or
exce
eded
thei
r pr
edet
erm
ined
co
llect
ion
rate
s at
pl
anne
d le
vels
of
relia
bilit
y.
At le
ast 9
0% o
f ke
y ce
nsus
es a
nd
surv
eys
met
or
exce
eded
thei
r pr
edet
erm
ined
co
llect
ion
rate
s at
pl
anne
d le
vels
of
relia
bilit
y.
At le
ast 8
0% o
f ke
y ce
nsus
es a
nd
surv
eys
met
or
exce
eded
thei
r pr
edet
erm
ined
co
llect
ion
rate
s at
pl
anne
d le
vels
of
relia
bilit
y.
At le
ast 9
0% o
f ke
y ce
nsus
es a
nd
surv
eys
met
or
exce
eded
thei
r pr
edet
erm
ined
co
llect
ion
rate
s at
pl
anne
d le
vels
of
relia
bilit
y.
Stat
us
Met
M
et
Met
M
et
Not
Met
M
et
Tren
d PO
SIT
IVE
Expl
anat
ion
(if n
ot m
et in
FY
201
3)
N/A
CEN-30

Indi
cato
r 2A
-3
Impr
ove
satis
fact
ion
with
the
Cen
sus
Bure
au’s
Web
site
. (Sa
me
as M
easu
re 2
B-2)
Des
crip
tion
The
Cen
sus
Bure
au w
ill m
easu
re s
atis
fact
ion
with
its
web
site
by
aski
ng th
e qu
estio
n “H
ow li
kely
are
you
to re
com
men
d th
is s
ite to
so
meo
ne e
lse?
” to
rand
omly
sel
ecte
d vi
sito
rs to
ww
w.c
ensu
s.go
v w
ho v
iew
the
web
site
.
FY
200
8 FY
200
9 FY
201
0 FY
201
1 FY
201
2 FY
201
3 Ta
rget
M
eet o
r exc
eed
over
all
fede
ral s
core
of 7
3.9%
M
eet o
r exc
eed
over
all f
eder
al s
core
of
75.
2%
Mee
t or e
xcee
d ov
eral
l fed
eral
sc
ore
of 7
4%
Mee
t or e
xcee
d ov
eral
l fed
eral
sc
ore
of 7
4%
Mee
t or e
xcee
d ov
eral
l fed
eral
sc
ore
of 7
4%
74%
of
resp
onde
nts
indi
cate
that
they
w
ould
reco
mm
end
the
site
to o
ther
s.
Actu
al
66%
68
%
69%
60
%
62%
77
%
Stat
us
Not
Met
N
ot M
et
Not
Met
N
ot M
et
Not
Met
M
et
Tren
d VA
RYI
NG
Ex
plan
atio
n (if
not
met
in
FY 2
013)
N/A
Indi
cato
r 2B
-3
Cor
rect
stre
et fe
atur
es in
TIG
ER (g
eogr
aphi
c) d
atab
ase
to m
ore
effe
ctiv
ely
supp
ort C
ensu
s Bu
reau
cen
suse
s an
d su
rvey
s, a
nd
faci
litat
e th
e ge
ogra
phic
par
tner
ship
s be
twee
n Fe
dera
l, st
ate,
loca
l, an
d tri
bal g
over
nmen
ts. (
Term
inat
ed a
fter F
Y 10
) D
escr
iptio
n C
orre
ctly
loca
ting
ever
y st
reet
in th
e M
aste
r Add
ress
File
and
geo
grap
hic
data
base
(MAF
/TIG
ER) i
s in
tegr
al to
pro
vidi
ng g
eogr
aphi
c pr
oduc
ts a
nd s
ervi
ces
that
mee
t the
acc
urac
y ex
pect
atio
ns o
f the
201
0 C
ensu
s fie
ld d
ata
colle
ctio
n st
aff,
the
Cen
sus
Bure
au’s
dat
a pr
oduc
t cus
tom
ers,
and
the
need
s of
the
U.S
. Geo
logi
cal S
urve
y/Th
e N
atio
nal M
ap. M
any
loca
l and
trib
al g
over
nmen
ts th
at
parti
cipa
ted
in th
e C
ensu
s 20
00 g
eogr
aphi
c pa
rtner
ship
pro
gram
s an
d m
any
pote
ntia
l cus
tom
ers
for M
AF/T
IGER
geo
grap
hic
prod
ucts
hav
e in
dica
ted
that
they
wou
ld n
ot c
onsi
der f
utur
e ge
ogra
phic
par
tner
ship
s or
use
with
out s
ubst
antia
l im
prov
emen
ts in
lo
catio
n ac
cura
cy.
FY 2
008
FY 2
009
FY 2
010
FY 2
011
FY 2
012
FY 2
013
Targ
et
320
coun
ties
to b
e co
mpl
eted
C
ompl
ete
upda
tes
to e
ligib
le
coun
ties
in th
e U
.S.,
Puer
to
Ric
o, a
nd Is
land
Are
as
Incr
ease
TIG
ER
upda
te s
ubm
issi
ons
elec
troni
cally
by
10
perc
ent.
N/A
N
/A
N/A
Actu
al
320
coun
ties
wer
e co
mpl
eted
C
ompl
eted
upd
ates
to e
ligib
le
coun
ties
in th
e U
.S.,
Puer
to
Ric
o, a
nd Is
land
Are
as
Incr
ease
d TI
GER
up
date
sub
mis
sion
s by
51
perc
ent.
N/A
N
/A
N/A
Stat
us
Met
M
et
Exce
eded
N
/A
N/A
N
/A
Tren
d N
/A
Expl
anat
ion
(if n
ot m
et in
FY
201
3)
N/A
CEN-31

Indi
cato
r 2B
-3
Cor
rect
stre
et fe
atur
es in
TIG
ER (g
eogr
aphi
c) d
atab
ase
to m
ore
effe
ctiv
ely
supp
ort C
ensu
s Bu
reau
cen
suse
s an
d su
rvey
s, a
nd
faci
litat
e th
e ge
ogra
phic
par
tner
ship
s be
twee
n Fe
dera
l, st
ate,
loca
l, an
d tri
bal g
over
nmen
ts. (
Term
inat
ed a
fter F
Y 10
) D
escr
iptio
n C
orre
ctly
loca
ting
ever
y st
reet
in th
e M
aste
r Add
ress
File
and
geo
grap
hic
data
base
(MAF
/TIG
ER) i
s in
tegr
al to
pro
vidi
ng g
eogr
aphi
c pr
oduc
ts a
nd s
ervi
ces
that
mee
t the
acc
urac
y ex
pect
atio
ns o
f the
201
0 C
ensu
s fie
ld d
ata
colle
ctio
n st
aff,
the
Cen
sus
Bure
au’s
dat
a pr
oduc
t cus
tom
ers,
and
the
need
s of
the
U.S
. Geo
logi
cal S
urve
y/Th
e N
atio
nal M
ap. M
any
loca
l and
trib
al g
over
nmen
ts th
at
parti
cipa
ted
in th
e C
ensu
s 20
00 g
eogr
aphi
c pa
rtner
ship
pro
gram
s an
d m
any
pote
ntia
l cus
tom
ers
for M
AF/T
IGER
geo
grap
hic
prod
ucts
hav
e in
dica
ted
that
they
wou
ld n
ot c
onsi
der f
utur
e ge
ogra
phic
par
tner
ship
s or
use
with
out s
ubst
antia
l im
prov
emen
ts in
lo
catio
n ac
cura
cy.
FY 2
008
FY 2
009
FY 2
010
FY 2
011
FY 2
012
FY 2
013
Targ
et
320
coun
ties
to b
e co
mpl
eted
C
ompl
ete
upda
tes
to
elig
ible
cou
ntie
s in
th
e U
.S.,
Puer
to
Ric
o, a
nd Is
land
Ar
eas
Incr
ease
TIG
ER
upda
te
subm
issi
ons
elec
troni
cally
by
10
perc
ent.
N/A
N
/A
N/A
Actu
al
320
coun
ties
wer
e co
mpl
eted
C
ompl
eted
upd
ates
to
elig
ible
cou
ntie
s in
th
e U
.S.,
Puer
to
Ric
o, a
nd Is
land
Ar
eas
Incr
ease
d TI
GER
up
date
su
bmis
sion
s by
51
perc
ent.
N/A
N
/A
N/A
Stat
us
Met
M
et
Exce
eded
N
/A
N/A
N
/A
Tren
d N
/A
Expl
anat
ion
(if n
ot m
et in
FY
201
3)
N/A
CEN-32

Indi
cato
r 2B
-4
Achi
eve
pre-
dete
rmin
ed c
olle
ctio
n ra
tes
for C
ensu
s Bu
reau
sur
veys
in o
rder
to p
rovi
de s
tatis
tical
ly re
liabl
e da
ta to
sup
port
effe
ctiv
e de
cisi
on-m
akin
g of
pol
icym
aker
s, b
usin
esse
s, a
nd th
e pu
blic
. D
escr
iptio
n M
aint
aini
ng a
hig
h le
vel o
f res
pons
e fo
r bot
h de
mog
raph
ic a
nd e
cono
mic
sur
veys
ens
ures
that
info
rmat
ion
from
Cen
sus
Bure
au
surv
eys
and
cens
uses
is a
lway
s re
liabl
e an
d w
idel
y ac
cept
ed b
y cu
stom
ers
over
the
long
term
. Ove
r tim
e, o
ur re
spon
dent
s’
willi
ngne
ss to
par
ticip
ate
in s
urve
ys is
dec
linin
g du
e to
a n
umbe
r of f
acto
rs (e
.g. p
rivac
y co
ncer
ns, m
istru
st o
f gov
ernm
ent,
time/
effo
rt to
com
plet
e th
e su
rvey
, etc
.). T
here
fore
, eve
n to
mai
ntai
n co
nsis
tent
resp
onse
rate
mea
sure
s ov
er ti
me
requ
ires
impr
ovem
ents
to
the
way
we
perfo
rm o
ur w
ork.
FY
200
8 FY
200
9 FY
201
0 FY
201
1 FY
201
2 FY
201
3 Ta
rget
N
/A
N/A
N
/A
N/A
N
/A
1) T
he A
mer
ican
C
omm
unity
Sur
vey
will
mee
t or
exce
ed a
92%
ov
eral
l wei
ghte
d re
spon
se ra
te
usin
g th
ree
mod
es
of d
ata
colle
ctio
n.
2) T
he B
ound
ary
and
Anne
xatio
n Su
rvey
will
mee
t or
exce
ed a
n 85
%
resp
onse
rate
. Ac
tual
N
/A
N/A
N
/A
N/A
N
/A
1) T
he A
mer
ican
C
omm
unity
Sur
vey
met
or e
xcee
ded
a 92
% o
vera
ll w
eigh
ted
resp
onse
ra
te u
sing
thre
e m
odes
of d
ata
colle
ctio
n.
2) T
he B
ound
ary
and
Anne
xatio
n Su
rvey
met
or
exce
eded
an
85%
re
spon
se ra
te.
Stat
us
N/A
N
/A
N/A
N
/A
N/A
M
et
Tren
d N
OT
EN
OU
GH
DA
TA.
Expl
anat
ion
(if n
ot m
et in
FY
201
3)
N/A
CEN-33
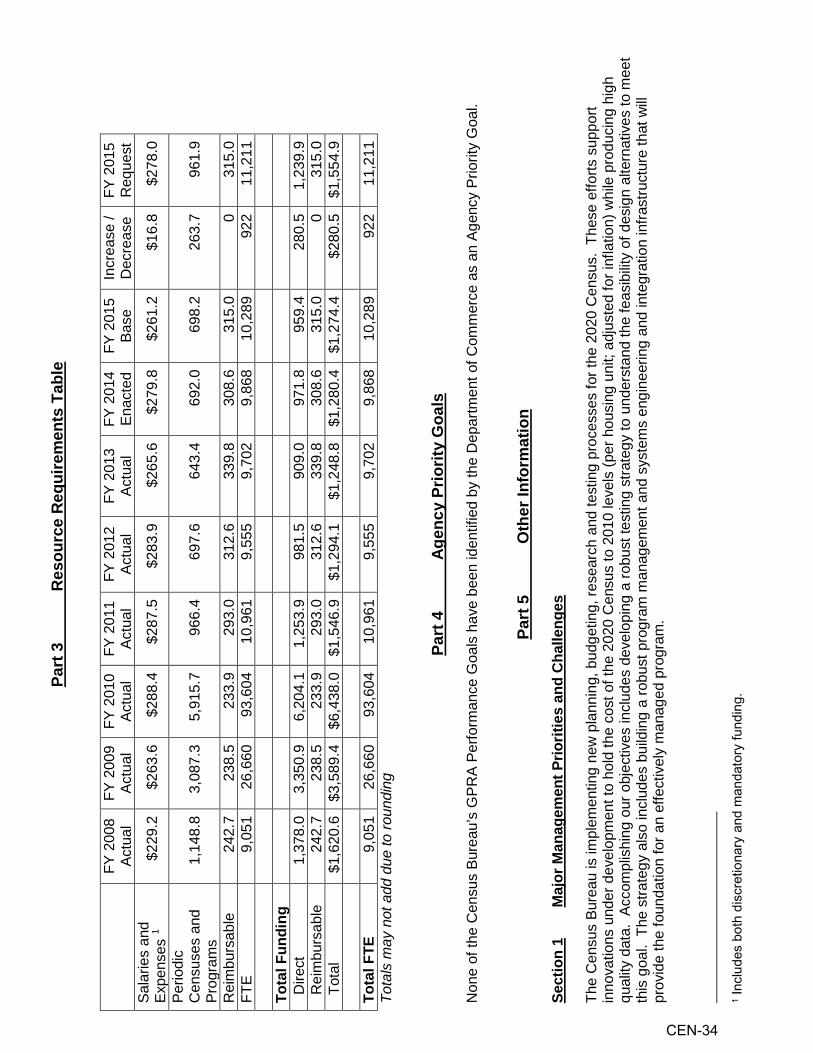
Part
3
Res
ourc
e R
equi
rem
ents
Tab
le
FY 2
008
Actu
al
FY 2
009
Actu
al
FY 2
010
Ac
tual
FY
201
1 Ac
tual
FY
201
2 Ac
tual
FY
201
3 Ac
tual
FY
201
4 En
acte
d FY
201
5 Ba
se
Incr
ease
/ D
ecre
ase
FY 2
015
Req
uest
Sa
larie
s an
d Ex
pens
es 1
$229
.2
$263
.6
$288
.4
$287
.5
$283
.9
$265
.6
$279
.8
$261
.2
$16.
8 $2
78.0
Perio
dic
Cen
suse
s an
d Pr
ogra
ms
1,14
8.8
3,08
7.3
5,91
5.7
966.
4 69
7.6
643.
4 69
2.0
698.
2 26
3.7
961.
9
Rei
mbu
rsab
le
242.
7 23
8.5
233.
9 29
3.0
312.
6 33
9.8
308.
6 31
5.0
0 31
5.0
FTE
9,05
1 26
,660
93
,604
10
,961
9,
555
9,70
2 9,
868
10,2
89
922
11,2
11
To
tal F
undi
ng
Dire
ct
1,37
8.0
3,35
0.9
6,20
4.1
1,25
3.9
981.
5 90
9.0
971.
8 95
9.4
280.
5 1,
239.
9 R
eim
burs
able
24
2.7
238.
5 23
3.9
293.
0 31
2.6
339.
8 30
8.6
315.
0 0
315.
0 T
otal
$1
,620
.6
$3,5
89.4
$6
,438
.0
$1,5
46.9
$1
,294
.1
$1,2
48.8
$1
,280
.4
$1,2
74.4
$2
80.5
$1
,554
.9
To
tal F
TE
9,05
1 26
,660
93
,604
10
,961
9,
555
9,70
2 9,
868
10,2
89
922
11,2
11
Tota
ls m
ay n
ot a
dd d
ue to
roun
ding
Part
4
Age
ncy
Prio
rity
Goa
ls
Non
e of
the
Cen
sus
Bure
au’s
GPR
A Pe
rform
ance
Goa
ls h
ave
been
iden
tifie
d by
the
Dep
artm
ent o
f Com
mer
ce a
s an
Age
ncy
Prio
rity
Goa
l.
Part
5
Oth
er In
form
atio
n Se
ctio
n 1
Maj
or M
anag
emen
t Prio
ritie
s an
d C
halle
nges
Th
e C
ensu
s Bu
reau
is im
plem
entin
g ne
w p
lann
ing,
bud
getin
g, re
sear
ch a
nd te
stin
g pr
oces
ses
for t
he 2
020
Cen
sus.
The
se e
fforts
sup
port
inno
vatio
ns u
nder
dev
elop
men
t to
hold
the
cost
of t
he 2
020
Cen
sus
to 2
010
leve
ls (p
er h
ousi
ng u
nit;
adju
sted
for i
nfla
tion)
whi
le p
rodu
cing
hig
h qu
ality
dat
a. A
ccom
plis
hing
our
obj
ectiv
es in
clud
es d
evel
opin
g a
robu
st te
stin
g st
rate
gy to
und
erst
and
the
feas
ibilit
y of
des
ign
alte
rnat
ives
to m
eet
this
goa
l. T
he s
trate
gy a
lso
incl
udes
bui
ldin
g a
robu
st p
rogr
am m
anag
emen
t and
sys
tem
s en
gine
erin
g an
d in
tegr
atio
n in
frast
ruct
ure
that
will
prov
ide
the
foun
datio
n fo
r an
effe
ctiv
ely
man
aged
pro
gram
. 1 I
nclu
des
both
dis
cret
iona
ry a
nd m
anda
tory
fund
ing.
CEN-34

The
curre
nt b
udge
t clim
ate
and
expe
ctat
ions
of c
ontin
uing
unc
erta
inty
hav
e ne
cess
itate
d th
at th
e C
ensu
s Bu
reau
app
ly e
ven
mor
e di
ligen
ce to
how
pr
ogra
m fu
nds
are
used
. W
ith m
ajor
inno
vatio
ns n
eede
d to
mee
t our
cos
t and
qua
lity
goal
s, d
evot
ing
avai
labl
e fu
nds
to th
e m
ost i
mpo
rtant
wor
k is
es
sent
ial.
To
und
erst
and
whe
n de
cisi
ons
are
need
ed, w
hat w
ork
is n
eede
d in
ord
er to
reac
h th
ose
deci
sion
s, a
nd w
hat f
undi
ng s
uppo
rts th
e w
ork,
the
Cen
sus
Bure
au h
as:
• Es
tabl
ishe
d a
gove
rnan
ce s
trate
gy th
at la
ys o
ut ro
les
and
resp
onsi
bilit
ies,
dec
isio
n m
akin
g pr
oces
ses,
and
alig
ning
pro
gram
con
trols
; •
Con
tinua
lly a
sses
sed
the
prio
ritie
s of
the
prog
ram
aga
inst
ava
ilabl
e bu
dget
; •
Ree
stab
lishe
d sc
hedu
le d
evel
opm
ent a
nd u
pdat
es (d
elay
ed d
ue to
the
reas
sess
men
t des
crib
ed a
bove
), an
d in
crea
sed
effo
rts to
dev
elop
an
d re
fine
a ro
adm
ap o
f key
dec
isio
n po
ints
and
mile
ston
es;
• Es
tabl
ishe
d a
Test
ing
and
Res
earc
h St
rate
gies
Tea
m th
at re
view
s th
e m
etho
dolo
gies
, res
earc
h pl
ans,
and
test
des
igns
to e
nsur
e th
at
appr
oach
es ta
ken
are
soun
d an
d w
ill pr
ovid
e th
e ev
iden
ce n
eede
d to
reac
h cr
itica
l des
ign
deci
sion
s;
• Ta
ken
incr
ease
d st
eps
tow
ard
ente
rpris
e so
lutio
ns th
at w
ill cr
eate
an
inte
grat
ed a
nd s
tand
ardi
zed
syst
em o
f sys
tem
s th
at o
ffers
sha
red
data
co
llect
ion
and
proc
essi
ng s
ervi
ces
for o
pera
tions
acr
oss
the
Cen
sus
Bure
au; a
nd,
• C
ontin
ued
impl
emen
tatio
n of
stro
ng p
rogr
am m
anag
emen
t and
sys
tem
s en
gine
erin
g di
scip
lines
aro
und
risk
man
agem
ent,
perfo
rman
ce
man
agem
ent,
know
ledg
e m
anag
emen
t, re
quire
men
ts m
anag
emen
t, an
d sy
stem
arc
hite
ctur
e an
d in
frast
ruct
ure
plan
ning
and
dev
elop
men
t.
• In
sup
port
of th
e D
epar
tmen
t’s o
bjec
tive
to “s
treng
then
org
aniz
atio
nal c
apab
ilitie
s to
driv
e cu
stom
er-fo
cuse
d, o
utco
mes
-driv
en m
issi
on
perfo
rman
ce”,
the
Bure
au is
iden
tifyi
ng m
issi
on-c
ritic
al c
ompe
tenc
ies,
ass
essi
ng c
ompe
tenc
y di
strib
utio
ns, a
naly
zing
gap
s be
twee
n cu
rren
t an
d de
sire
d st
ates
, and
wor
king
to c
lose
cor
e an
d em
ergi
ng c
ompe
tenc
y ga
ps.
Wor
k co
ntin
ues
to d
evel
op a
nd re
fine
effo
rts to
use
the
Amer
ican
Com
mun
ity S
urve
y (A
CS)
to fu
rther
the
rese
arch
goa
ls o
f the
202
0 Pr
ogra
m.
Dat
a fro
m d
eplo
ymen
t of t
he In
tern
et fo
r AC
S is
pro
vidi
ng a
wea
lth o
f inf
orm
atio
n to
pre
pare
the
2020
pro
gram
for a
n In
tern
et re
spon
se o
ptio
n. I
n ad
ditio
n, k
ey e
nter
pris
e sy
stem
s de
velo
pmen
t act
iviti
es w
ill be
bui
lt an
d de
ploy
ed fo
r the
AC
S w
here
they
will
be p
rove
n in
for t
he 2
020
Cen
sus.
La
ngua
ge s
uppo
rt ac
tiviti
es a
re b
eing
pur
sued
to b
enef
it bo
th p
rogr
ams.
As
to th
e AC
S C
onte
nt T
est p
revi
ousl
y pl
anne
d fo
r FY
201
5, th
is te
st h
ad
to b
e de
laye
d un
til F
Y201
6 du
e to
the
budg
etar
y im
pact
s of
the
FY 2
013
sequ
estra
tion.
Se
ctio
n 2
Cro
ss-A
genc
y Pr
iorit
y G
oals
/ C
olla
bora
tions
Th
e C
ensu
s Bu
reau
has
a lo
ng h
isto
ry o
f col
labo
ratin
g w
ith o
ther
Fed
eral
age
ncie
s to
ach
ieve
obj
ectiv
es, p
riorit
y go
als,
and
per
form
ance
goa
ls.
A fe
w e
xam
ples
incl
ude:
•
Mor
e th
an $
400
billio
n in
Fed
eral
fund
s di
strib
uted
to s
tate
, loc
al, a
nd tr
ibal
gov
ernm
ents
eac
h ye
ar is
bas
ed, a
t lea
st in
par
t, on
Cen
sus
Bure
au d
ata.
•
One
of o
ur fl
agsh
ip p
rogr
ams,
the
Cur
rent
Pop
ulat
ion
Surv
ey, i
s a
join
t pro
gram
with
the
Bure
au o
f Lab
or S
tatis
tics
and
is th
e so
urce
un
empl
oym
ent e
stim
ates
.
CEN-35
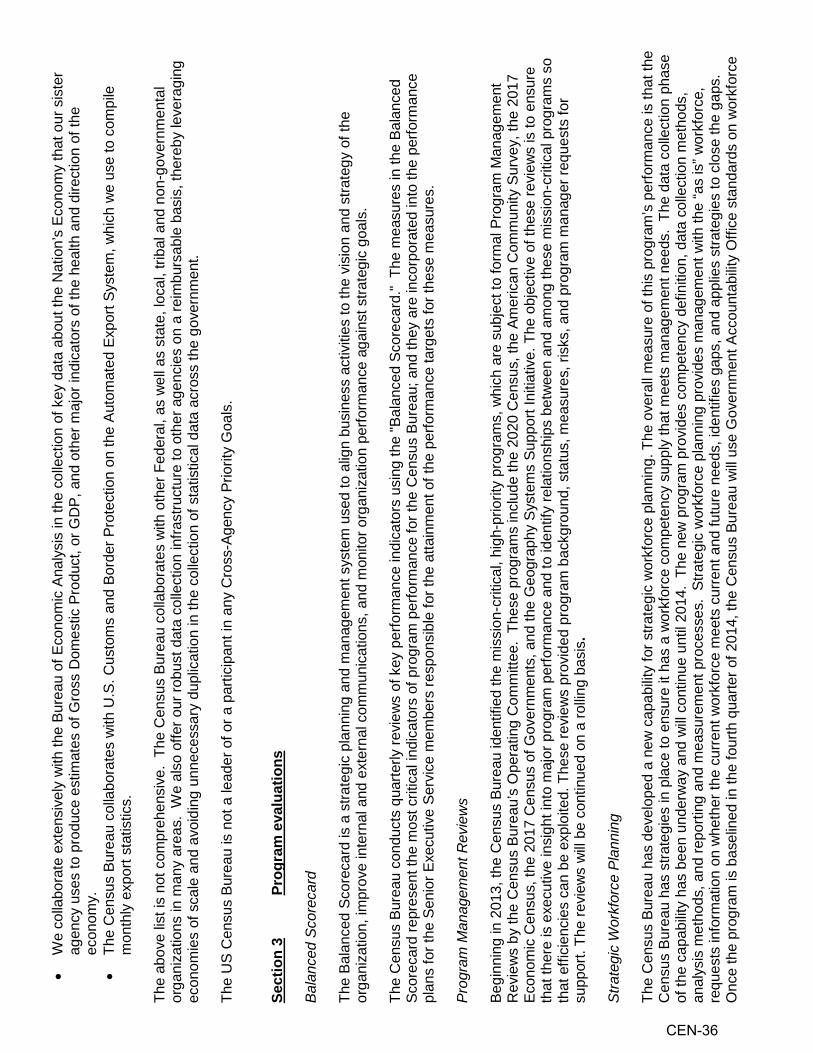
• W
e co
llabo
rate
ext
ensi
vely
with
the
Bure
au o
f Eco
nom
ic A
naly
sis
in th
e co
llect
ion
of k
ey d
ata
abou
t the
Nat
ion’
s Ec
onom
y th
at o
ur s
iste
r ag
ency
use
s to
pro
duce
est
imat
es o
f Gro
ss D
omes
tic P
rodu
ct, o
r GD
P, a
nd o
ther
maj
or in
dica
tors
of t
he h
ealth
and
dire
ctio
n of
the
econ
omy.
•
The
Cen
sus
Bure
au c
olla
bora
tes
with
U.S
. Cus
tom
s an
d Bo
rder
Pro
tect
ion
on th
e Au
tom
ated
Exp
ort S
yste
m, w
hich
we
use
to c
ompi
le
mon
thly
exp
ort s
tatis
tics.
The
abov
e lis
t is
not c
ompr
ehen
sive
. Th
e C
ensu
s Bu
reau
col
labo
rate
s w
ith o
ther
Fed
eral
, as
wel
l as
stat
e, lo
cal,
triba
l and
non
-gov
ernm
enta
l or
gani
zatio
ns in
man
y ar
eas.
We
also
offe
r our
robu
st d
ata
colle
ctio
n in
frast
ruct
ure
to o
ther
age
ncie
s on
a re
imbu
rsab
le b
asis
, the
reby
leve
ragi
ng
econ
omie
s of
sca
le a
nd a
void
ing
unne
cess
ary
dupl
icat
ion
in th
e co
llect
ion
of s
tatis
tical
dat
a ac
ross
the
gove
rnm
ent.
The
US
Cen
sus
Bure
au is
not
a le
ader
of o
r a p
artic
ipan
t in
any
Cro
ss-A
genc
y Pr
iorit
y G
oals
. Se
ctio
n 3
Prog
ram
eva
luat
ions
B
alan
ced
Sco
reca
rd
The
Bala
nced
Sco
reca
rd is
a s
trate
gic
plan
ning
and
man
agem
ent s
yste
m u
sed
to a
lign
busi
ness
act
iviti
es to
the
visi
on a
nd s
trate
gy o
f the
or
gani
zatio
n, im
prov
e in
tern
al a
nd e
xter
nal c
omm
unic
atio
ns, a
nd m
onito
r org
aniz
atio
n pe
rform
ance
aga
inst
stra
tegi
c go
als.
Th
e C
ensu
s Bu
reau
con
duct
s qu
arte
rly re
view
s of
key
per
form
ance
indi
cato
rs u
sing
the
"Bal
ance
d Sc
orec
ard.
" Th
e m
easu
res
in th
e Ba
lanc
ed
Scor
ecar
d re
pres
ent t
he m
ost c
ritic
al in
dica
tors
of p
rogr
am p
erfo
rman
ce fo
r the
Cen
sus
Bure
au; a
nd th
ey a
re in
corp
orat
ed in
to th
e pe
rform
ance
pl
ans
for t
he S
enio
r Exe
cutiv
e Se
rvic
e m
embe
rs re
spon
sibl
e fo
r the
atta
inm
ent o
f the
per
form
ance
targ
ets
for t
hese
mea
sure
s.
Pro
gram
Man
agem
ent R
evie
ws
Begi
nnin
g in
201
3, th
e C
ensu
s Bu
reau
iden
tifie
d th
e m
issi
on-c
ritic
al, h
igh-
prio
rity
prog
ram
s, w
hich
are
sub
ject
to fo
rmal
Pro
gram
Man
agem
ent
Rev
iew
s by
the
Cen
sus
Bure
au’s
Ope
ratin
g C
omm
ittee
. Th
ese
prog
ram
s in
clud
e th
e 20
20 C
ensu
s, th
e Am
eric
an C
omm
unity
Sur
vey,
the
2017
Ec
onom
ic C
ensu
s, th
e 20
17 C
ensu
s of
Gov
ernm
ents
, and
the
Geo
grap
hy S
yste
ms
Supp
ort I
nitia
tive.
The
obj
ectiv
e of
thes
e re
view
s is
to e
nsur
e th
at th
ere
is e
xecu
tive
insi
ght i
nto
maj
or p
rogr
am p
erfo
rman
ce a
nd to
iden
tify
rela
tions
hips
bet
wee
n an
d am
ong
thes
e m
issi
on-c
ritic
al p
rogr
ams
so
that
effi
cien
cies
can
be
expl
oite
d. T
hese
revi
ews
prov
ided
pro
gram
bac
kgro
und,
sta
tus,
mea
sure
s, ri
sks,
and
pro
gram
man
ager
requ
ests
for
supp
ort.
The
revi
ews
will
be
cont
inue
d on
a ro
lling
basi
s.
Stra
tegi
c W
orkf
orce
Pla
nnin
g Th
e C
ensu
s Bu
reau
has
dev
elop
ed a
new
cap
abilit
y fo
r stra
tegi
c w
orkf
orce
pla
nnin
g. T
he o
vera
ll m
easu
re o
f thi
s pr
ogra
m’s
per
form
ance
is th
at th
e C
ensu
s Bu
reau
has
stra
tegi
es in
pla
ce to
ens
ure
it ha
s a
wor
kfor
ce c
ompe
tenc
y su
pply
that
mee
ts m
anag
emen
t nee
ds.
The
data
col
lect
ion
phas
e of
the
capa
bilit
y ha
s be
en u
nder
way
and
will
cont
inue
unt
il 20
14.
The
new
pro
gram
pro
vide
s co
mpe
tenc
y de
finiti
on, d
ata
colle
ctio
n m
etho
ds,
anal
ysis
met
hods
, and
repo
rting
and
mea
sure
men
t pro
cess
es.
Stra
tegi
c w
orkf
orce
pla
nnin
g pr
ovid
es m
anag
emen
t with
the
“as
is” w
orkf
orce
, re
ques
ts in
form
atio
n on
whe
ther
the
curre
nt w
orkf
orce
mee
ts c
urre
nt a
nd fu
ture
nee
ds, i
dent
ifies
gap
s, a
nd a
pplie
s st
rate
gies
to c
lose
the
gaps
. O
nce
the
prog
ram
is b
asel
ined
in th
e fo
urth
qua
rter o
f 201
4, th
e C
ensu
s Bu
reau
will
use
Gov
ernm
ent A
ccou
ntab
ility
Offi
ce s
tand
ards
on
wor
kfor
ce
CEN-36
plan
ning
and
less
ons
lear
ned
as to
det
erm
ine
the
effic
acy
and
effe
ctiv
enes
s of
the
proc
ess.
The
act
ual s
trate
gic
wor
kfor
ce p
lann
ing
actio
n pl
ans
deve
lope
d in
the
first
qua
rter o
f 201
4 fo
r Hea
dqua
rters
em
ploy
ees
in p
rofe
ssio
nal s
erie
s an
d in
the
four
th q
uarte
r of 2
014
for a
ll ot
her e
mpl
oyee
s co
ntai
n ta
rget
s fo
r clo
sing
wor
kfor
ce g
aps
and
will
be u
sed
to m
easu
re th
e ef
fect
iven
ess
of th
e ac
tual
stra
tegi
es to
clo
se th
e ga
ps.
Fina
lly, t
he
seco
nd ro
und
of th
e as
-is s
kills
ass
essm
ent w
ill pr
ovid
e m
easu
res
of w
hich
gap
s ha
ve b
een
clos
ed o
r red
uced
. 20
20 C
ensu
s Th
e N
atio
nal A
cade
my
of S
cien
ces
(NAS
) pro
vide
s sc
ient
ific
and
rese
arch
exp
ertis
e to
the
2020
Cen
sus
Prog
ram
. Sp
ecifi
cally
, NAS
has
as
sem
bled
a p
anel
of e
xper
ts to
con
duct
a fi
ve-y
ear r
evie
w o
f the
201
0 C
ensu
s op
erat
ions
and
a c
ompr
ehen
sive
eva
luat
ion
of th
e st
atis
tical
m
etho
ds a
nd o
pera
tiona
l pro
cedu
res
test
ed d
urin
g th
e 20
20 R
esea
rch
and
Test
ing
Prog
ram
. As
par
t of t
his
eval
uatio
n, s
mal
ler w
orki
ng g
roup
s ha
ve b
een
esta
blis
hed
to p
rovi
de e
xper
t adv
ice
abou
t ong
oing
rese
arch
in fo
ur o
f the
202
0 C
ensu
s re
sear
ch th
emes
(geo
grap
hic
reso
urce
s, s
elf-
resp
onse
opt
ions
, fie
ld re
-eng
inee
ring,
and
use
of a
dmin
istra
tive
reco
rds)
. Be
caus
e of
thes
e co
llabo
rativ
e ex
chan
ges,
the
wor
k gr
oups
hav
e he
lped
to
iden
tify
prio
rity
dire
ctio
ns fo
r im
plem
entin
g a
test
ing
prog
ram
that
will
lead
to a
suc
cess
ful a
nd m
ore
cost
-effe
ctiv
e 20
20 c
ensu
s. A
t the
co
nclu
sion
of t
his
ongo
ing
prog
ram
eva
luat
ion
in 2
014,
NAS
will
prod
uce
a w
ritte
n re
view
of o
ur re
sear
ch e
fforts
alo
ng w
ith re
com
men
datio
ns to
im
prov
e ce
rtain
ope
ratio
ns fo
r the
202
0 C
ensu
s.
Am
eric
an C
omm
unity
Sur
vey
The
Cen
sus
Bure
au h
as a
sked
the
Cen
sus
Scie
ntifi
c Ad
viso
ry C
omm
ittee
to re
view
the
ACS
grou
p qu
arte
rs p
rogr
am a
nd m
ake
reco
mm
enda
tions
on
impr
ovin
g sa
mpl
ing
effo
rts a
nd d
ata
colle
ctio
n is
sues
with
cer
tain
gro
up q
uarte
r typ
es. A
dditi
onal
ly, t
he C
ensu
s Bu
reau
has
ask
ed th
e N
atio
nal
Advi
sory
Com
mitt
ee (N
AC) W
orki
ng G
roup
on
ACS
to re
view
, ass
ess,
and
pro
vide
reco
mm
enda
tions
on
rese
arch
that
can
impr
ove
ACS
est
imat
es
of s
mal
l pop
ulat
ions
. Th
e gr
oup
was
cha
rted
in e
arly
Spr
ing
of 2
013.
The
y ha
ve tw
o fo
rmal
mee
tings
with
the
Cen
sus
Bure
au a
yea
r, in
the
Sprin
g an
d Fa
ll. T
he N
AC W
orki
ng G
roup
con
duct
s co
nfer
ence
cal
ls b
etw
een
thes
e fo
rmal
mee
tings
to a
chie
ve th
eir o
bjec
tives
. The
gro
up p
lans
to s
ubm
it th
eir r
ecom
men
datio
ns d
urin
g th
eir 2
014
Sprin
g m
eetin
g.
Am
eric
an C
omm
unity
Sur
vey
Con
tent
Rev
iew
C
ongr
ess
has
rais
ed c
once
rns
with
resp
ect t
o th
e AC
S, in
par
ticul
ar th
e qu
estio
ns o
n th
e su
rvey
and
the
man
ner i
n w
hich
this
and
oth
er s
urve
ys a
re
cond
ucte
d by
the
Cen
sus
Bure
au. I
n FY
201
3, th
e C
omm
ittee
on
Appr
opria
tions
requ
este
d th
at th
e C
ensu
s Bu
reau
pro
vide
a re
port,
on
effo
rts a
nd
step
s be
ing
take
n to
ens
ure
that
the
ACS
is c
ondu
cted
as
effic
ient
ly a
nd u
nobt
rusi
vely
as
poss
ible
. Thi
s re
port
is c
ompl
ete
and
is c
urre
ntly
und
er
revi
ew.
In re
spon
se to
thes
e co
ncer
ns, t
he C
ensu
s Bu
reau
has
est
ablis
hed
an o
mbu
dsm
an p
ositi
on to
add
ress
resp
onde
nt c
once
rns,
and
in c
onju
nctio
n w
ith th
e O
ffice
of M
anag
emen
t and
Bud
get (
OM
B), i
s co
ordi
natin
g an
d im
plem
entin
g an
eva
luat
ion
of th
e qu
estio
ns in
clud
ed in
the
ACS.
Addi
tiona
lly, t
he A
CS
is e
mba
rkin
g on
a C
onte
nt R
evie
w p
roce
ss.
The
ACS
Con
tent
Rev
iew
pro
cess
bui
lds
on th
e re
sults
of t
he m
emor
andu
m
Cas
s Su
nste
in, f
orm
er A
dmin
istra
tor o
f the
Offi
ce o
f Inf
orm
atio
n an
d R
egul
ator
y Af
fairs
at O
MB,
sen
t to
the
head
s of
sel
ecte
d ex
ecut
ive
depa
rtmen
ts a
nd a
genc
ies
in 2
012,
ask
ing
them
to p
rovi
de u
pdat
ed in
form
atio
n on
the
stat
utor
y an
d re
gula
tory
aut
horit
y fo
r the
que
stio
ns a
sked
on
the
ACS.
The
mem
o st
ated
that
“In
the
abse
nce
for u
pdat
ed in
form
atio
n, [O
MB]
will
be u
nabl
e to
cite
you
r age
ncy’
s co
ntin
ued
need
for a
nd u
se o
f th
ese
data
as
a ju
stifi
catio
n fo
r ret
aini
ng th
e qu
estio
ns, w
hich
cou
ld le
ad to
thei
r rem
oval
from
the
ACS.
” In
Aug
ust a
nd S
epte
mbe
r 201
2, a
genc
ies
CEN-37

prov
ided
thei
r res
pons
es. H
owev
er, a
fter a
naly
zing
the
info
rmat
ion
subm
itted
in re
spon
se to
the
mem
oran
dum
, it b
ecam
e cl
ear t
hat s
ome
resp
onse
s di
d no
t pro
vide
suf
ficie
nt in
form
atio
n.
To
add
ress
this
sho
rtcom
ing,
the
Cen
sus
Bure
au h
as d
evel
oped
a C
onte
nt R
evie
w A
ctio
n Pl
an.
This
pla
n, d
escr
ibes
how
we
will
obta
in a
co
mpr
ehen
sive
und
erst
andi
ng o
f the
usa
ges,
just
ifica
tions
, and
mer
its o
f eac
h qu
estio
n on
the
ACS,
with
the
goal
of m
inim
izin
g th
e re
porti
ng
burd
en im
pose
d on
sam
pled
hou
seho
lds.
The
Cen
sus
Bure
au, w
orki
ng c
lose
ly w
ith th
e In
tera
genc
y C
ounc
il of
Sta
tistic
al P
olic
y (IC
SP)
subc
omm
ittee
2 , exp
ects
to c
ompl
ete
this
com
preh
ensi
ve re
view
in th
e Su
mm
er o
f 201
4. T
o en
gage
key
AC
S st
akeh
olde
rs in
the
revi
ew p
roce
ss,
the
Cen
sus
Bure
au is
dev
elop
ing
a co
mm
unic
atio
n pl
an d
esig
ned
to p
rovi
de th
e de
tails
of t
he re
view
and
the
pote
ntia
l im
pact
of t
he re
view
pro
cess
on
AC
S co
nten
t.
Sect
ion
4 H
yper
links
Fo
r inf
orm
atio
n ab
out t
he C
NST
AT e
valu
atio
n an
d N
AS p
anel
mem
bers
, ple
ase
see
http
://si
tes.
natio
nala
cade
mie
s.or
g/D
BASS
E/C
NST
AT/C
urre
ntPr
ojec
ts/D
BASS
E_07
1203
Se
ctio
n 5
Dat
a Va
lidat
ion
and
Verif
icat
ion
The
FY 2
013
Sum
mar
y of
Per
form
ance
incl
udes
in th
e Se
cret
ary’
s St
atem
ent,
an a
sses
smen
t of t
he re
liabi
lity
and
com
plet
enes
s of
the
Dep
artm
ent’s
per
form
ance
dat
a.
2 In
Augu
st 2
012,
the
Inte
rage
ncy
Cou
ncil
of S
tatis
tical
Pol
icy
(ICSP
) Sub
com
mitt
ee fo
r the
AC
S w
as fo
rmed
with
the
purp
ose
of a
dvis
ing
the
Chi
ef S
tatis
ticia
n of
O
MB
and
the
Cen
sus
Bure
au D
irect
or a
bout
the
role
of t
he A
CS
in m
eetin
g th
e ne
eds
of th
e Fe
dera
l sta
tistic
al c
omm
unity
. Th
e Su
bcom
mitt
ee fo
cuse
s on
the
cont
ent a
nd re
spon
dent
bur
den
of th
e AC
S.
CEN-38

Dep
artm
ent o
f Com
mer
ceU
.S. C
ensu
s Bu
reau
Exh
ibit
5
Sal
arie
s an
d E
xpen
ses
- Dis
cret
iona
ry B
AS
UM
MA
RY
OF
RE
SO
UR
CE
RE
QU
IRE
ME
NTS
(Dol
lar a
mou
nts
in th
ousa
nds)
Page
No.
Budg
et
Posi
tions
Auth
ority
Dire
ct
FTE
Obl
igat
ions
2014
Ena
cted
1,
680
$2
52,0
00
1
,799
$252
,000
CEN
-42
plus
: 20
15 A
djus
tmen
ts to
bas
ele
ss:
Prio
r yea
r rec
over
ies
012
,794
512
,794
2015
Bas
e R
eque
st
1,68
0
2
64,7
94
1
,804
264,
794
less
: Inf
latio
nary
Adj
ustm
ent
plus
(or l
ess)
: 201
5 Pr
ogra
m C
hang
es0
(12,
794)
(5
6)(4
,000
)
(5
)
(12,
794)
(8
0)(4
,000
)
2015
Est
imat
e
1,62
4
2
48,0
00
1
,719
248,
000
CEN
-46
Com
paris
on b
y ac
tivity
/sub
activ
ity20
1320
14Ac
tual
Ena
cted
2015
Base
2015
Estim
ate
Incr
ease
/ (D
ecre
ase)
ov
er B
ase
Cur
rent
Sur
veys
and
Sta
tistic
sPe
rson
nel
Amou
ntPe
rson
nel
Amou
ntPe
rson
nel
Amou
ntPe
rson
nel
Amou
ntPe
rson
nel
Amou
nt
Cur
rent
eco
nom
ic s
tatis
tics
Pos.
/BA
FTE/
Obl
.1,
120
$166
,440
1,26
2$1
78,7
271,
151
166,
286
1,19
617
8,72
71,
262
$187
,273
1,19
618
7,27
31,
285
$183
,727
1,21
418
3,72
723
($3,
546)
18(3
,546
)
CEN
-47
Cur
rent
dem
ogra
phic
sta
tistic
sPo
s./B
AFT
E/O
bl.
292
69,3
4340
870
,673
558
69,1
3058
970
,673
408
74,7
9459
474
,794
329
61,6
7349
161
,673
(79)
(13,
121)
(103
)(1
3,12
1)
CEN
-48
Surv
ey d
evel
opm
ent a
nd d
ata
serv
ices
TOTA
LS
Pos.
/BA
FTE/
Obl
.11
2,41
510
2,60
012
2,37
514
2,60
010
2,72
714
2,72
710
2,60
014
2,60
00
(127
)0
(127
)
Pos.
/BA
FTE/
Obl
.1,
423
238,
198
1,68
025
2,00
01,
721
237,
791
1,79
925
2,00
01,
680
264,
794
1,80
426
4,79
41,
624
248,
000
1,71
924
8,00
0(5
6)(1
6,79
4)(8
5)(1
6,79
4)
Adju
stm
ents
to O
blig
atio
ns:
R
ecov
erie
s0
00
00
U
nobl
igat
ed b
alan
ce, s
tart
of y
ear
U
nobl
igat
ed b
alan
ce, e
xpiri
ng
Uno
blig
ated
bal
ance
, end
of y
ear
R
efun
d
00
407
00
00
0
0 0 0 0
0 0 0 0
0 0 0 0
Adju
stm
ents
to B
udge
t Aut
horit
y:
Res
ciss
ion
S
eque
stra
tion
5,31
30
12,7
440
0 00 0
0 0
Fina
ncin
g fro
m tr
ansf
ers:
T
rans
fer f
rom
oth
er a
ccou
nts
00
00
0
Tra
nsfe
r to
othe
r acc
ount
s
Subt
otal
, App
ropr
iatio
n
00
00
0
Pos.
1,42
325
6,25
51,
680
252,
000
1,68
026
4,79
41,
624
248,
000
(56)
(16,
794)
CEN-39

Dep
artm
ent o
f Com
mer
ceU
.S. C
ensu
s Bu
reau
Sal
arie
s an
d E
xpen
ses
- Man
dato
ry B
AS
UM
MA
RY
OF
RE
SO
UR
CE
RE
QU
IRE
ME
NTS
(Dol
lar a
mou
nts
in th
ousa
nds)
Exh
ibit
5
Page
No.
Posi
tions
Budg
et
Auth
ority
FTE
Dire
ct
Obl
igat
ions
2014
Ena
cted
163
$27,
840
288
$29,
637
FTE
/ pos
ition
s re
alig
nmen
tle
ss:
Uno
blig
ated
bal
ance
, sta
rt of
yea
r(1
,797
)
plus
: 20
15 A
djus
tmen
ts to
bas
e0
2,16
00
2,16
0
2015
Bas
e R
eque
st16
3
30
,000
288
30,0
00
plus
(or l
ess)
: 201
5 Pr
ogra
m C
hang
es0
00
0
2015
Ena
cted
163
30,0
00
28
8
30
,000
Com
paris
on b
y ac
tivity
/sub
activ
ity
Pers
onne
lAm
ount
Pers
onne
lAm
ount
Pers
onne
lAm
ount
Pers
onne
lAm
ount
Pers
onne
lAm
ount
CEN
-78
Surv
ey o
f pro
gram
dyn
amic
sPo
s./B
A36
$9,4
9057
$9,2
8057
$10,
000
57$1
0,00
00
$0FT
E/O
bl.
358,
901
599,
280
5910
,000
5910
,000
00
CEN
-80
Stat
e ch
ildre
n's
heal
th in
sura
nce
prog
ram
Pos.
/BA
4518
,980
106
18,5
6010
620
,000
106
20,0
000
0FT
E/O
bl.
203
18,9
5422
920
,357
229
20,0
0022
920
,000
00
TOTA
LSPo
s./B
A81
28,4
7016
327
,840
163
30,0
0016
330
,000
00
FTE/
Obl
.23
827
,855
288
29,6
3728
830
,000
288
30,0
000
0
Adju
stm
ents
to O
blig
atio
ns:
R
ecov
erie
s0
00
00
U
nobl
igat
ed b
alan
ce, s
tart
of y
ear
(1,7
97)
(1,7
97)
00
0
Uno
blig
ated
bal
ance
, exp
iring
615
00
00
U
nobl
igat
ed b
alan
ce, e
nd o
f yea
r1,
797
00
00
R
efun
d0
00
00
Adju
stm
ents
to B
udge
t Aut
horit
y:
Res
ciss
ion
00
00
0
Seq
uest
ratio
n1,
530
2,16
00
00
Fina
ncin
g fro
m tr
ansf
ers:
T
rans
fers
from
oth
er a
ccou
nts
00
00
0
Tra
nsfe
rs to
oth
er a
ccou
nts
00
00
0
Subt
otal
, App
ropr
iatio
nPo
s.81
30,0
0016
330
,000
163
30,0
0016
330
,000
00
1 FY
2014
refle
cts
sequ
este
r
Incr
ease
/ (D
ecre
ase)
ov
er B
ase
2013
Actu
al20
14En
acte
d 1
2015
Base
2015
Enac
ted
CEN-40
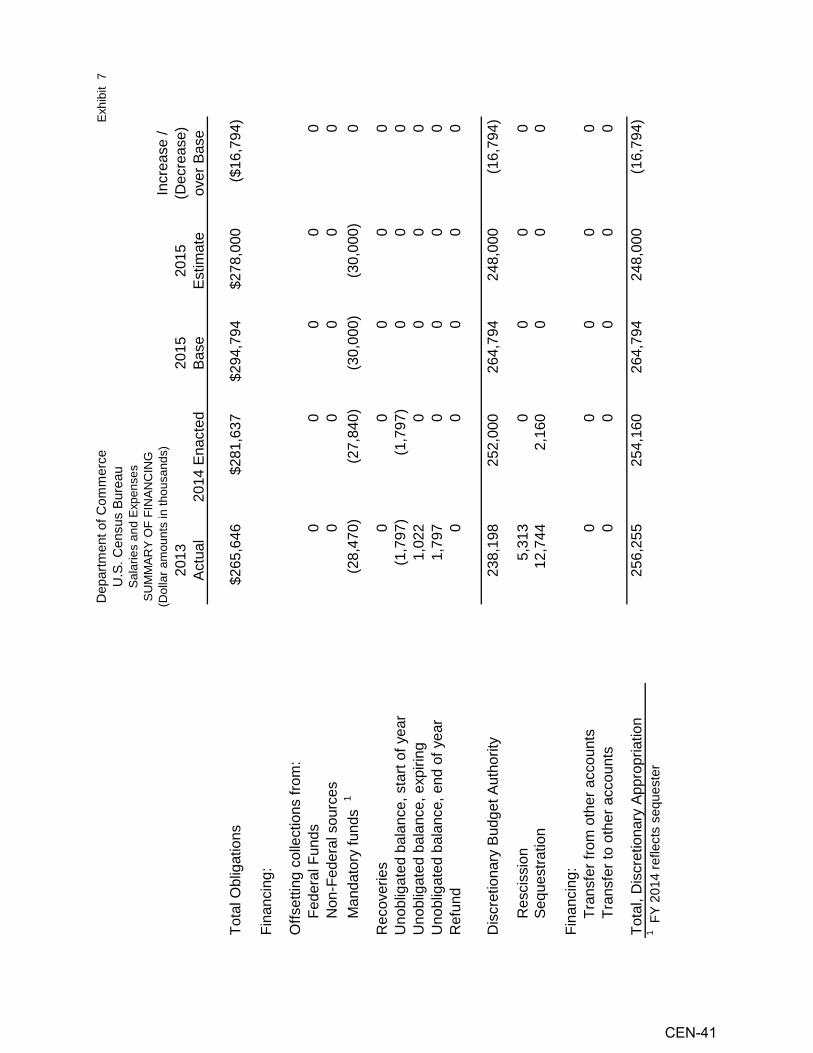
Dep
artm
ent o
f Com
mer
ceE
xhib
it 7
U.S
. Cen
sus
Bure
auS
alar
ies
and
Exp
ense
s S
UM
MA
RY
OF
FIN
AN
CIN
G(D
olla
r am
ount
s in
thou
sand
s)In
crea
se /
2013
2015
2015
(Dec
reas
e)
Actu
al20
14 E
nact
edBa
seEs
timat
eov
er B
ase
Tota
l Obl
igat
ions
$265
,646
$281
,637
$294
,794
$278
,000
($16
,794
)
Fina
ncin
g: O
ffset
ting
colle
ctio
ns fr
om:
F
eder
al F
unds
00
00
0
Non
-Fed
eral
sou
rces
00
00
0
Man
dato
ry fu
nds
1(2
8,47
0)(2
7,84
0)(3
0,00
0)(3
0,00
0)0
Rec
over
ies
00
00
0U
nobl
igat
ed b
alan
ce, s
tart
of y
ear
(1,7
97)
(1,7
97)
00
0U
nobl
igat
ed b
alan
ce, e
xpiri
ng1,
022
00
00
Uno
blig
ated
bal
ance
, end
of y
ear
1,79
70
00
0R
efun
d0
00
00
Dis
cret
iona
ry B
udge
t Aut
horit
y23
8,19
825
2,00
026
4,79
424
8,00
0(1
6,79
4)
R
esci
ssio
n5,
313
00
00
S
eque
stra
tion
12,7
442,
160
00
0
Fina
ncin
g:
Tra
nsfe
r fro
m o
ther
acc
ount
s0
00
00
T
rans
fer t
o ot
her a
ccou
nts
00
00
0
Tota
l, D
iscr
etio
nary
App
ropr
iatio
n25
6,25
525
4,16
026
4,79
424
8,00
0(1
6,79
4)1 F
Y 20
14 re
flect
s se
ques
ter
CEN-41

Exh
ibit
9
Adj
ustm
ents
:FT
EA
mou
nt
0$0
Oth
er C
hang
es:
0
1,75
6
Full-
year
cos
t of F
Y 2
014
pay
rais
e an
d re
late
d co
sts:
1.0%
1,59
2,00
0
(1
,194
,000
)
398,
000
FY 2
015
pay
rais
e an
d re
late
d co
sts:
1.0%
1,24
5,00
0
113,
000
1,35
8,00
0
5
511
24
1,98
5,10
3
Plu
s: F
Y 2
014
pay
rais
e of
1.0
%19
,851
(1)
(1
00,2
48)
23
1,
904,
706
(1
8)
(1,5
11,2
34)
5
39
3,47
2
3,
096
39
6,56
8
114,
013
5
51
0,58
1
Am
ount
requ
ired
for p
erso
nnel
com
pens
atio
n……
..……
……
.…...
...…
……
…..…
……
..……
……
…B
enef
its…
……
…...
……
...…
……
……
……
……
….…
……
……
…...
….…
……
……
.……
..……
The
com
puta
tion
is a
s fo
llow
s:
Ann
ual s
alar
y of
new
pos
ition
s in
FY
201
4……
……
...…
..…..…
……
……
….…
……
…..…
……
……
Less
Lap
se…
……
……
……
...…
.....…
……
……
…..…
……
……
….…
……
……
..……
……
……
Sub
tota
l, pe
rson
nel c
ompe
nsat
ion…
……
……
……
…..…
……
..……
…...
…..…
……
……
……
……
…
(Dol
lar a
mou
nts
in th
ousa
nds)
Ass
umed
pay
rais
e, to
be
effe
ctiv
e Ja
nuar
y 1,
201
4……
...…
……
……
……
……
……
...…
……
……
Tota
l cos
t in
FY 2
015
of th
e FY
201
4 pa
y ra
ise…
.….…
……
……
…...
……
……
..……
……
……
……
Less
am
ount
fund
ed in
FY
201
4……
……
…..…
….…
……
……
……
.……
...…
……
……
……
.
Pay
rais
e……
……
……
……
……
..……
.……
……
……
……
……
……
……
…...
……
……
……
……
……
……
……
……
……
……
……
...…
……
……
……
..
In F
Y 2
014,
bas
e re
sour
ces
wer
e re
-alig
ned
amon
g lin
e ite
ms
with
in th
e pr
ogra
m, t
o re
flect
a re
vise
d m
etho
d of
bud
getin
g fo
r cer
tain
pro
gram
m
anag
emen
t cos
ts. T
hese
cos
ts h
ad b
een
prev
ious
ly d
istri
bute
d to
eac
h lin
e ite
m a
nd p
roje
ct w
ithin
the
prog
ram
, but
now
may
onl
y be
pla
nned
w
ithin
one
or m
ore
line
item
s. T
here
is n
o ne
t im
pact
to th
e pr
ogra
m's
bud
get
requ
est.…
……
……
……
……
…..…
….…
……
……
……
……
……
……
……
...…
……
.……
……
……
……
……
......
......
......
......
......
.……
……
……
…..
Dep
artm
ent o
f Com
mer
ceU
.S. C
ensu
s B
urea
uS
alar
ies
and
Exp
ense
sJU
STI
FIC
ATI
ON
OF
AD
JUS
TME
NTS
TO
BA
SE
Tota
l, ad
just
men
t for
FY
201
4 pa
y ra
ise…
……
….…
……
…..…
……
..……
….…
…...
……
……
….
Tota
l, ad
just
men
t for
FY
201
5 pa
y ra
ise…
……
……
.……
...…
…...
……
……
……
……
……
……
……
Ass
umed
pay
rais
e, to
be
effe
ctiv
e Ja
nuar
y 1,
201
5……
...…
…..…
……
...…
.….…
……
……
……
…
Tota
l cos
t in
FY 2
015
of th
e FY
201
5 pa
y ra
ise
……
……
……
….…
……
...…
.……
……
……
……
…P
aym
ent t
o W
orki
ng C
apita
l Fun
d……
…...
……
……
……
...…
...…
…..…
……
……
…..…
……
……
Full-
year
cos
t in
2015
of p
ositi
ons
finan
ced
for p
art-y
ear i
n 20
14…
……
...…
……
……
……
.…..…
……
…...
……
.……
……
……
...…
……
……
..
An
incr
ease
of $
505,
426
is re
quire
d to
fund
the
full-
year
cos
ts in
201
5 of
pos
ition
s fin
ance
d fo
r par
t-yea
r in
2014
.
Tota
l, A
djus
tmen
ts to
bas
e…...
……
……
……
…..…
……
.……
…...
..……
……
……
…..…
……
……
…
Less
per
sonn
el c
ompe
nsat
ion
in F
Y 2
014…
..……
.……
……
..……
...…
…...
……
……
……
……
……
……
...…
……
……
……
……
……
……
……
……
……
……
…
Full-
year
cos
t of p
erso
nnel
com
pens
atio
n……
……
..……
…...
..…..…
…...
.……
……
……
……
……
Adj
ustm
ent f
or F
Y 2
015
pay
rais
e fo
r 3/4
of y
ear…
…..…
…...
……
……
……
…..…
…..…
……
……
CEN-42

Oth
er C
hang
es:
FTE
Am
ount
0($
286)
(285
,872
)
355,
174
64
1,04
6
(285
,872
)
02,
029
2,02
8,82
3
15,6
65,7
71
13
,636
,948
2,02
8,82
3
0(7
0)
($69
,921
)
4,62
8,52
3
4,
698,
444
(6
9,92
1)
The
estim
ated
per
cent
age
of p
ayro
ll fo
r em
ploy
ees
cove
red
by C
SR
S w
ill de
crea
se fr
om 7
.4%
in F
Y 2
014
to 4
.1%
in F
Y 2
015.
The
ag
ency
con
tribu
tion
rate
will
rem
ain
7.0%
in F
Y 2
015.
Fede
ral E
mpl
oyee
s' R
etire
men
t Sys
tem
(FE
RS
)……
……
….…
……
……
……
……
……
.…...
……
……
……
.……
……
……
…...
……
.……
……
……
..
2015
$1
23,7
54,0
00 x
4.1
% x
7.0
%…
……
…..…
……
……
……
……
..……
……
……
……
……
……
2014
$1
23,7
54,0
00 x
7.4
% x
7.0
%…
……
....…
……
……
……
……
..……
……
……
……
……
……
…
Civ
il S
ervi
ce R
etire
men
t Sys
tem
(CS
RS
)……
……
……
……
……
……
……
……
……
..……
……
…...
……
.……
……
……
……
……
……
……
……
……
This
will
resu
lt in
a d
ecre
ase
of:
Reg
ular
em
ploy
ees:
Reg
ular
em
ploy
ees:
Tota
l, A
djus
tmen
ts to
bas
e……
……
……
….…
..……
……
...…
……
……
……
……
……
……
……
……
2015
$1
23,7
54,0
00 x
95.
9% x
13.
2%…
……
….…
.……
..……
……
……
……
…..…
……
……
……
…20
14
$123
,754
,000
x 9
2.6%
x 1
1.9%
……
.....…
……
……
……
……
..……
……
……
……
……
……
Tota
l, A
djus
tmen
ts to
bas
e…...
……
……
……
.....…
…..…
……
……
……
……
……
……
……
……
…
Thrif
t Sav
ings
Pla
n (T
SP
)……
……
……
……
……
……
……
..……
……
……
…..…
…...
……
……
……
..……
……
……
……
……
……
……
……
……
….
The
estim
ated
per
cent
age
of p
ayro
ll fo
r em
ploy
ees
cove
red
by F
ER
S w
ill in
crea
se to
95.
9% in
FY
201
5. T
he a
genc
y co
ntrib
utio
n ra
te w
ill re
mai
n th
e sa
me
at 1
1.9%
in F
Y 2
015.
Th
is w
ill re
sult
in a
n in
crea
se o
f:
The
estim
ated
age
ncy
cont
ribut
ion
rate
for t
he T
hrift
Sav
ings
Pla
n w
ill de
crea
se fr
om 4
.1%
in F
Y 2
014
to 3
.9%
in F
Y 2
015.
FE
RS
pa
rtici
patio
n ra
tes
will
incr
ease
from
92.
6% in
FY
201
4 to
95.
9% in
FY
201
5.Th
is w
ill re
sult
in a
dec
reas
e of
:
Reg
ular
em
ploy
ees:
2015
$
123,
754,
000
x 95
.9%
x 3
.9%
……
……
.…...
……
……
……
…..…
……
……
……
……
……
…20
14
$12
3,75
4,00
0 x
92.6
% x
4.1
%…
……
….…
.……
…..…
……
…..…
……
……
……
……
……
…To
tal,
Adj
ustm
ents
to b
ase…
……
……
..……
……
....…
.……
…..…
……
……
……
……
……
….
CEN-43

Oth
er C
hang
es:
FTE
Am
ount
0$2
66
$266
,406
7,25
5,15
1
6,
998,
390
25
6,76
1
272,
550
26
2,90
5
9,
645
266,
406
042
6
0(1
72)
016
1
The
dec
reas
e of
$17
2,00
0 w
ill m
eet t
he C
ensu
s B
urea
u's
oblig
atio
ns to
the
Em
ploy
ee C
ompe
nsat
ion
Fund
for F
Y 2
015.
The
C
ensu
s B
urea
u w
ill re
imbu
rse
the
Dep
artm
ent o
f Lab
or p
ursu
ant t
o 5
U.S
.C. §
814
7.
GS
A ra
tes
are
proj
ecte
d to
incr
ease
1.6
% o
ver t
he F
Y 2
014
estim
ate
of $
10,0
58,0
00 fo
r cur
rent
ly o
ccup
ied
spac
e. T
his
resu
lts in
an
incr
ease
of $
160,
928.
Ren
tal P
aym
ents
to G
SA
…..…
…...
……
……
……
…..…
……
……
……
…..…
…..…
……
……
……
….…
……
……
……
……
…...
……
.……
……
……
…
Fede
ral I
nsur
ance
Con
tribu
tions
Act
(FIC
A)…
……
……
……
……
……
……
……
……
……
……
…...
…...
……
……
…...
……
...…
….…
……
……
……
This
will
resu
lt in
an
incr
ease
of:
Reg
ular
em
ploy
ees:
2015
$
123,
754,
000
x 95
.9%
x 9
8.6%
x 6
.2%
……
….…
……
.….…
.……
……
……
……
……
……
The
perc
enta
ge o
f pay
roll
cove
red
by F
ER
S in
crea
sed
from
92.
6% in
FY
201
4 to
95.
9% in
FY
201
5. T
he o
vera
ll pe
rcen
tage
of s
alar
ies
cove
red
by
OA
SD
I will
incr
ease
to 9
8.6%
in F
Y 2
015
from
98.
5% in
FY
201
4. T
he O
AS
DI t
ax ra
te w
ill re
mai
n 6.
2% in
FY
201
5.
2014
$
123,
754,
000
x 92
.6%
x 9
8.5%
x 6
.2%
……
…..…
……
……
.……
……
……
……
……
……
…
Sub
tota
l……
……
……
……
……
……
….…
…..…
……
……
..……
……
……
……
……
……
…..
Oth
er s
alar
ies:
2015
$4
,649
,000
x 9
5.9%
x 9
8.6%
x 6
.2%
….…
.……
……
……
….…
……
……
……
……
……
……
2014
$4
,649
,000
x 9
2.6%
x 9
8.5%
x 6
.2%
……
..……
……
……
….…
……
……
……
……
……
……
S
ubto
tal…
……
……
……
……
….…
……
……
...…
..……
……
……
.……
……
……
……
……
…To
tal,
Adj
ustm
ents
to b
ase…
……
.……
……
……
...…
…..…
……
……
……
……
……
……
……
.
Effe
ctiv
e Ja
nuar
y 20
15, t
he C
ensu
s B
urea
u's
cont
ribut
ion
to F
eder
al e
mpl
oyee
's h
ealth
insu
ranc
e pr
emiu
ms
will
incr
ease
by
3.8%
. A
pplie
d ag
ains
t th
e FY
201
4 es
timat
e of
$11
,215
,000
the
incr
ease
will
be $
426,
170.
Hea
lth In
sura
nce…
……
……
……
…..…
...…
……
……
….…
……
……
……
……
……
……
……
……
……
……
……
……
……
……
……
……
……
……
…..
Em
ploy
ees
Com
pens
atio
n Fu
nd…
……
……
……
…..…
……
……
……
……
……
……
……
….…
……
……
……
……
……
……
……
……
……
……
……
..
CEN-44

Oth
er C
hang
es:
FTE
Am
ount
0$0
07
07,
300
015
6
071
0
6,24
4
Ren
tal p
aym
ents
to o
ther
s…..…
……
……
……
……
……
……
……
……
……
……
……
……
…11
221
,056
639,
366
23,3
10
21
,154
512
,794
512
,794
512
,794
Sup
plie
s an
d m
ater
ials
……
……
……
……
...…
….…
...…
…..…
……
….…
……
……
……
……
…E
quip
men
t……
..….…
…..…
..……
……
……
……
……
……
……
……
……
……
……
……
……
…
Sub
tota
l, ot
her c
hang
es…
……
……
.……
……
……
……
……
……
….…
……
……
……
……
……
……
……
……
……
……
……
……
……
……
……
……
…
Sub
tota
l, A
djus
tmen
ts to
bas
e……
……
……
……
……
……
……
……
……
……
.……
……
……
……
……
……
……
……
……
……
……
……
……
……
…..
Oth
er S
ervi
ces…
……
……
……
….…
……
…..…
……
...…
……
……
……
……
..……
……
……
…
Pos
tage
Rat
e In
crea
se…
…..…
.…...
...…
……
.……
……
……
……
……
……
……
….…
……
……
……
……
…...
……
.……
……
……
……
……
……
……
..
GP
O P
rintin
g……
……
......
..….…
……
……
……
……
….…
……
……
……
……
..……
……
.……
……
……
……
……
...…
….…
……
……
……
……
……
..
Com
mer
ce B
usin
ess
Sys
tem
….…
……
……
……
……
……
……
……
……
……
……
……
……
...…
……
……
……
……
……
……
……
……
……
……
……
.
Tota
l, A
djus
tmen
ts to
bas
e……
……
……
……
……
……
……
……
……
.……
……
……
……
……
……
……
……
……
……
……
……
……
……
……
……
…
Gen
eral
Pric
ing
Leve
l Adj
ustm
ent…
……
……
……
……
…...
……
……
……
.……
……
......
….…
……
……
..……
……
……
……
...…
….…
……
……
….
This
requ
est a
pplie
s O
MB
eco
nom
ic a
ssum
ptio
ns o
f 1.4
% fo
r FY
201
5 w
here
the
pric
es th
at th
e G
over
nmen
t pay
s ar
e es
tabl
ishe
d th
roug
h th
e m
arke
t sys
tem
. Fa
ctor
s ar
e ap
plie
d to
sub
-obj
ect c
lass
es th
at re
sult
in th
e fo
llow
ing
adju
stm
ents
to b
ase:
Tran
spor
atio
n of
thin
gs…
……
……
...…
.……
……
.……
….…
……
……
.……
……
……
……
..
The
Gov
erno
rs o
f the
Pos
tal S
ervi
ce h
ave
mad
e no
cha
nge
to th
e ra
te o
f pos
tage
for F
Y 2
015.
GP
O h
as p
rovi
ded
an e
stim
ated
rate
incr
ease
of 1
.4%
. Th
is p
erce
ntag
e w
as a
pplie
d to
the
FY 2
014
estim
ate
of $
517,
000
to a
rriv
e at
an
incr
ease
of
$7,2
38.
The
cost
of C
ensu
s B
urea
u pa
rtici
patio
n in
the
Dep
artm
ent-w
ide
Com
mer
ce B
usin
ess
Sys
tem
(CB
S) w
as in
crea
sed
by $
156,
000.
Com
mun
icat
ions
, util
ities
, and
mis
cella
neou
s ch
arge
s (e
xclu
ding
pos
tage
)……
.……
……
……
…
Wor
king
Cap
ital F
und…
……
……
……
……
……
...…
……
……
……
……
……
……
……
……
……
......
…..…
……
……
..……
……
……
……
...…
….…
……
……
An
incr
ease
of $
7,30
0,00
0 is
requ
ired
to m
eet t
he c
ost i
ncre
ase
in th
e D
epar
tmen
t of C
omm
erce
's W
orki
ng C
apita
l Fun
d.
CEN-45

Dep
artm
ent o
f Com
mer
ceEx
hibi
t 10
U.S
. Cen
sus
Bur
eau
Sala
ries
and
Expe
nses
- D
iscr
etio
nary
BA
PRO
GR
AM A
ND
PER
FOR
MAN
CE:
DIR
ECT
OBL
IGAT
ION
SA
ctiv
ity:
Cur
rent
sur
veys
and
sta
tistic
s(D
olla
r am
ount
s in
thou
sand
s)S
ubac
tivity
: Cur
rent
eco
nom
ic s
tatis
tics
2013
2014
2015
2015
Incr
ease
/ (D
ecre
ase)
A
ctua
l E
nact
edB
ase
Est
imat
eov
er B
ase
Line
Item
Per
sonn
elA
mou
ntP
erso
nnel
Am
ount
Per
sonn
elA
mou
ntP
erso
nnel
Am
ount
Per
sonn
elA
mou
nt
Bus
ines
s st
atis
tics
Pos
./BA
281
$39,
614
368
$42,
588
368
$44,
679
368
$42,
588
0($
2,09
1)FT
E/O
bl.
289
38,2
1832
942
,588
329
44,6
7932
942
,588
0(2
,091
)
Con
stru
ctio
n st
atis
tics
Pos
./BA
8112
,455
9112
,735
9113
,331
9112
,735
0(5
96)
FTE
/Obl
.11
411
,789
115
12,7
3511
513
,331
115
12,7
350
(596
)
Man
ufac
turin
g st
atis
tics
Pos
./BA
150
19,4
0620
220
,919
202
21,9
6920
220
,919
0(1
,050
)FT
E/O
bl.
149
19,5
8215
720
,919
157
21,9
6915
720
,919
0(1
,050
)
Gen
eral
eco
nom
ic s
tatis
tics
Pos
./BA
331
51,9
2129
955
,678
299
58,3
2132
260
,678
232,
357
FTE
/Obl
.32
854
,732
310
55,6
7831
058
,321
328
60,6
7818
2,35
7
Fore
ign
trade
sta
tistic
sP
os./B
A19
431
,619
201
34,8
0220
136
,378
201
34,8
020
(1,5
76)
FTE
/Obl
.19
030
,927
200
34,8
0220
036
,378
200
34,8
020
(1,5
76)
Gov
ernm
ent s
tatis
tics
Pos
./BA
8311
,425
101
12,0
0510
112
,595
101
12,0
050
(590
)FT
E/O
bl.
8111
,038
8512
,005
8512
,595
8512
,005
0(5
90)
Tota
lP
os./B
A1,
120
166,
440
1,26
217
8,72
71,
262
187,
273
1,28
518
3,72
723
(3,5
46)
FTE
/Obl
.1,
151
166,
286
1,19
617
8,72
71,
196
187,
273
1,21
418
3,72
718
(3,5
46)
Adj
ustm
ents
to O
blig
atio
ns:
R
ecov
erie
s
Uno
blig
ated
bal
ance
, sta
rt of
yea
r
Uno
blig
ated
bal
ance
, exp
iring
154
U
nobl
igat
ed b
alan
ce, e
nd o
f yea
r
Ref
und
Adj
ustm
ents
to B
udge
t Aut
horit
y:
Res
ciss
ion
3,71
4
Seq
uest
ratio
n8,
907
Fina
ncin
g fro
m tr
ansf
ers:
Tra
nsfe
r fro
m o
ther
acc
ount
s
Tra
nsfe
r to
othe
r acc
ount
s
App
ropr
iatio
nP
os.
1,12
017
9,06
11,
262
178,
727
1,26
218
7,27
31,
285
183,
727
23(3
,546
)
CEN-46

Dep
artm
ent o
f Com
mer
ceEx
hibi
t 10
U.S
. Cen
sus
Bur
eau
Sala
ries
and
Expe
nses
- D
iscr
etio
nary
BA
PRO
GR
AM A
ND
PER
FOR
MAN
CE:
DIR
ECT
OBL
IGAT
ION
S(D
olla
r am
ount
s in
thou
sand
s)
Act
ivity
: C
urre
nt s
urve
ys a
nd s
tatis
tics
Sub
activ
ity: C
urre
nt d
emog
raph
ic s
tatis
tics
2013
2014
20
1520
15In
crea
se /
(Dec
reas
e)
A
ctua
lE
nact
edB
ase
Est
imat
eov
er B
ase
Line
Item
Per
sonn
elA
mou
ntP
erso
nnel
Am
ount
Per
sonn
elA
mou
ntP
erso
nnel
Am
ount
Per
sonn
elA
mou
nt
Hou
seho
ld s
urve
ysP
os./B
A24
6$6
0,61
534
1$6
1,52
934
1$6
5,20
326
2$5
2,52
9(7
9)($
12,6
74)
FTE
/Obl
.50
960
,945
528
61,5
2953
365
,203
430
52,5
29(1
03)
(12,
674)
Pop
ulat
ion
and
hous
ing
anal
yses
Pos
./BA
468,
728
679,
144
679,
591
679,
144
0(4
47)
FTE
/Obl
.49
8,18
561
9,14
461
9,59
161
9,14
40
(447
)
Tota
lP
os./B
A29
269
,343
408
70,6
7340
874
,794
329
61,6
73(7
9)(1
3,12
1)FT
E/O
bl.
558
69,1
3058
970
,673
594
74,7
9449
161
,673
(103
)(1
3,12
1)
Adj
ustm
ents
to O
blig
atio
ns:
R
ecov
erie
s
U
nobl
igat
ed b
alan
ce, s
tart
of y
ear
U
nobl
igat
ed b
alan
ce, e
xpiri
ng21
3
Uno
blig
ated
bal
ance
, end
of y
ear
R
efun
d
Adj
ustm
ents
to B
udge
t Aut
horit
y:
Res
ciss
ion
1,54
5
Seq
uest
ratio
n3,
708
Fina
ncin
g fro
m tr
ansf
ers:
T
rans
fer f
rom
oth
er a
ccou
nts
T
rans
fer t
o ot
her a
ccou
nts
App
ropr
iatio
nP
os.
292
74,5
9640
870
,673
408
74,7
9432
961
,673
(79)
(13,
121)
CEN-47

Dep
artm
ent o
f Com
mer
ceE
xhib
it 10
U.S
. Cen
sus
Bur
eau
Sal
arie
s an
d E
xpen
ses
- Dis
cret
iona
ry B
AP
RO
GR
AM
AN
D P
ER
FOR
MA
NC
E:
DIR
EC
T O
BLI
GA
TIO
NS
(Dol
lar a
mou
nts
in th
ousa
nds)
Act
ivity
: C
urre
nt s
urve
ys a
nd s
tatis
tics
Sub
activ
ity: S
urve
y de
velo
pmen
t and
dat
a se
rvic
es
2013
2014
2015
2015
Incr
ease
/ (D
ecre
ase)
Act
ual
Ena
cted
Bas
eE
stim
ate
over
Bas
eLi
ne It
emP
erso
nnel
Am
ount
Per
sonn
elA
mou
ntP
erso
nnel
Am
ount
Per
sonn
elA
mou
ntP
erso
nnel
Am
ount
Sur
vey
deve
lopm
ent a
nd d
ata
serv
ices
Pos
./BA
11$2
,415
10$2
,600
10$2
,727
10$2
,600
0($
127)
FTE
/Obl
.12
2,37
514
2,60
014
2,72
714
2,60
00
(127
)
Tota
lP
os./B
A11
2,41
510
2,60
010
2,72
710
2,60
00
(127
)FT
E/O
bl.
122,
375
142,
600
142,
727
142,
600
0(1
27)
Adj
ustm
ents
to O
blig
atio
ns:
R
ecov
erie
s
Uno
blig
ated
bal
ance
, sta
rt of
yea
r
Uno
blig
ated
bal
ance
, exp
iring
40
Uno
blig
ated
bal
ance
, end
of y
ear
R
efun
d
Adj
ustm
ents
to B
udge
t Aut
horit
y:
Res
ciss
ion
54
Seq
uest
ratio
n12
9
Fina
ncin
g fro
m tr
ansf
ers:
T
rans
fer f
rom
oth
er a
ccou
nts
T
rans
fer t
o ot
her a
ccou
nts
App
ropr
iatio
nP
os.
112,
598
102,
600
102,
727
102,
600
0(1
27)
CEN-48
Exhibit 12 – 15 APPROPRIATION ACCOUNT: Salaries and Expenses BUDGET PROGRAM: Current Surveys and Statistics For FY 2015, the Census Bureau requests a decrease of $16,794,000 and 85 FTE from the FY 2015 base for a total of $248,000,000 and 1,719 FTE for Current Surveys and Statistics. BASE JUSTIFICATION: Current Surveys and Statistics Overview The Current Surveys and Statistics ($248.0 million and 1,719 FTE) budget is organized into three subactivities under the Salaries and Expenses account,
• The Current Economic Statistics subactivity ($183.7 million and 1,214 FTE) includes economic statistics programs that provide public and private sector data users with relevant, accurate, and timely national statistical profiles of every sector of the U.S. economy.
• The Current Demographic Statistics subactivity ($61.7 million and 491 FTE) contains programs that provide social and economic information on a monthly, quarterly, and annual basis to inform effective public and private decision-making.
• The Survey Development and Data Services subactivity ($2.6 million and 14 FTE). The Current Surveys and Statistics Programs support the Department of Commerce’s Trade & Investment, Innovation, Environment, and Data goals. They specifically support objectives: Increase U.S. exports by broadening and deepening the U.S. exporter base (1.2); Accelerate the development of industry-led skills strategies that result in a productive workforce for employers and high-quality jobs for workers (2.4); Improve preparedness, response, and recovery from weather and water events by building a Weather-Ready Nation (3.2); and Improve data based services, decision-making and data sharing within the Department and with other parts of the Federal Government (4.2). Furthermore, Current Surveys and Statistics Programs data will be used to evaluate current export programs for their effectiveness. Local Dynamics program data integration and measurement methods that provide insight into innovation and entrepreneurial activity will be expanded and enhanced. Awareness of the OntheMap for Emergency Management (OTM-EM) website will be increased using webinars and in-person trainings for emergency and city planners. Enhancements to OTM-EM will take place by improving the user interface and the inclusion of selected ACS data. Lastly, administrative records will be used to create new, cost effective data products, and reduce public burden. SIGNIFICANT ADJUSTMENTS-TO-BASE: The Census Bureau requests a net increase of $12.8 million to fund adjustments to current programs for Current Surveys and Statistics activities.
CEN-49

SUB-PROGRAM: Current Economic Statistics The objectives of the Current Economic Statistics sub-program are to provide public and private data users with relevant, accurate, and timely national statistical profiles for every sector of the U.S. economy. Business Statistics The business statistics programs measure the economic activity of the distribution and service trade sectors in the United States. The data provide principal economic performance indicators, including monthly and annual data for the retail and wholesale sectors and quarterly and annual data for the fast growing service sector of the national economy. These sectors account for nearly 70 percent of U.S. economic activity. The business statistics programs provide the primary source of up-to-date facts on the structure and functioning of the distributive trades and service sectors of the economy and provide timely updates to data collected in the economic census for these sectors. The principal economic indicator series are closely followed and widely used by policymakers in the public and private sectors and move financial markets. These data, in conjunction with other economic data collected by the Census Bureau, are vital to effective economic policy decisions by business and government. Current retail trade reports This program provides monthly and annual estimates of retail, accommodation, and food services sales; e-commerce sales; selected merchandise lines data, inventories, and purchases. The current retail trade and accommodation and food services estimates cover almost approximately 3.9 million establishments. The Census Bureau publishes advance monthly retail and food services sales estimates for the United States as a whole, based on early reports from a small sub-sample of the larger monthly retail survey. This advance monthly retail publication is designated as one of the principal economic indicators. Television newscasts and the financial pages of newspapers and magazines regularly highlight the sales levels and trends from this report. From the larger monthly retail survey sample, the Census Bureau publishes monthly sales and end-of-month inventory estimates, inventory/sales ratios, and quarterly estimates of e-commerce sales. The annual retail trade program provides key measures of retail and accommodations and food services activity for intercensal years and is the basis for benchmarking monthly estimates of sales and inventories and provides measurements of purchases, e-commerce sales, accounts receivable, inventories held outside the United States, operating expenses, and selected merchandise lines. The economic outlook depends greatly on the strength of retail and accommodation and food services sales and retail inventories. These data are important inputs to the Bureau of Economic Analysis’ (BEA) estimation of GDP. Also, these timely estimates provide principal indicators to the Federal Reserve Board and Council of Economic Advisers for formulation of monetary and fiscal policies and analysis of economic policies. The Census Bureau is the only source for these data. Current wholesale trade reports This program provides monthly and annual estimates of wholesale sales, inventories, inventory/sales ratios, purchases, and e-commerce sales. The current wholesale trade estimates cover almost 412,000 establishments. The monthly wholesale trade report, a principal economic indicator, covers merchant wholesalers (except manufacturers’ sales branches and offices), which account for 66 percent of all wholesale sales and 77 percent of all wholesale inventories based on the 2011 Annual Wholesale Trade
CEN-50
Survey. The merchant wholesalers included in this report are wholesalers that sell goods on their own account, such as industrial distributors, jobbers, exporters, and importers. Each month, the Census Bureau publishes totals for sales, end-of-month inventories, and inventory/sales ratios registered by businesses engaged in wholesaling merchandise. The annual wholesale trade program covers the wholesalers included in the monthly wholesale report (described above), as well as manufacturers’ sales offices and branches, electronic markets, agents, and brokers. In addition to sales, inventories, and inventory/sales ratios, the annual program provides measurements of purchases, e-commerce sales, Electronic Data Interchange sales, inventories held outside the United States, operating expenses, and commissions received (agents and brokers only). Wholesale sales and inventories are key inputs to BEA’s estimates of GDP data. Also, these data provide important input to the Federal Reserve, the Council of Economic Advisers, and other Federal agencies for their use in determining economic policies and formulating monetary and fiscal policies. The Census Bureau is the only source for these data. Current service trade reports This program provides quarterly and annual information on service industries in the United States. The Quarterly Services Survey, the first new principal economic indicator to be introduced in over 40 years, produces dollar-volume estimates of revenue and other important measures of service industry activity. This quarterly indicator provides information on all service sectors, comprising 55 percent of GDP and including a variety of industry detail for key information, telecommunications, and technology-sensitive industries of the knowledge economy and other industries sensitive to changes in the business cycle. The Service Annual Survey (SAS) produces estimates of total revenue, purchased services, and estimates of e-commerce sales for all service sectors, comprising many of the fastest growing divisions of the economy. In addition, revenue estimates are produced for selected products and industries. Moreover, estimates of export revenue are produced for many selected industries in business, information, rental and leasing, arts and entertainment, and other services. Services dominate the U.S. economy and the current service trade data produced by the Census Bureau serve as key inputs to the measurement of economic performance. The BEA uses services data in developing the national income and product accounts and in compiling benchmark and annual input-output tables. The Bureau of Labor Statistics (BLS) uses these Census Bureau source data as input to its productivity and price measurements. The Department of Transportation uses transportation data from these surveys for general planning, policy development, program management, and evaluation. The Centers for Medicare and Medicaid Services use the health data in developing the annual estimates of National Health Expenditures. Academia and private industry use the SAS data for research and as a tool for market analysis. Statistical sample improvements This program provides research, development, and implementation of sample improvements for the current retail, wholesale, and service surveys. This includes selection of the new business sample based on the results from the most current economic census and updating samples on a quarterly and annual basis. New samples are necessary to redistribute respondent burden and minimize sampling error. Sample updates improve coverage of the business universe and ensure accurate representation of those firms selected in the samples. These activities are necessary to maintain and improve the quality of current survey estimates and provide the basis for implementing more efficient methods of survey processing with the goal of reducing respondent burden and survey costs.
CEN-51

Construction Statistics The construction statistics programs provide national performance indicators for the construction sector of the economy. The programs cover activities such as residential building permit authorizations, housing starts, characteristics and prices of new housing, and value of construction put in place. The data are vital to understanding the economic and social aspects of construction activity in the U.S., are pertinent to the national economic and social needs of the U.S. population, and provide a basis for effective policy making at all levels of government and in the private sector. The programs supplement the data collected in the economic census. Since construction activities are particularly sensitive to the interest rate levels, these data are an important indicator of how changes in interest rates are affecting the economy. We have made content and coverage improvements to the construction indicators program and have improved accessibility to the data. Building permits data This program provides monthly and annual statistics on privately-owned residential construction authorized by building permits. The monthly data include national, regional, and state estimates, as well as totals for selected metropolitan areas, counties, and individual places. The annual data cover permit-issuing places that are not in the monthly sample; the annual data in combination with the sample data are used as benchmarks to revise the monthly series. This program covers 20,000 permit-issuing offices. The national series titled “Housing Units Authorized by Building Permits” is a component of the index of leading economic indicators. Building permit data are used for direct input to the ratio estimation of housing starts and new home sales data. This program also provides data used to develop samples for the Census Bureau's Survey of Construction and numerous demographic surveys, including the Current Population Survey. In addition, building permit data are used in the development of the Census Bureau’s annual population estimates. Other data users include the Federal Reserve Board and the Department of Housing and Urban Development (HUD). Financial institutions use these data to estimate mortgage demand. Private firms use the sub-national data for market planning, material demand, and investment analysis. Housing starts data This program provides national and regional statistics on the number of housing units started and the number authorized but not yet started. In conjunction with HUD, this program also collects information on the completion and sale of new housing units, as well as characteristics of these units, such as floor area, number of stories, etc. In addition to providing the source data for new home sales and completions and the Construction Put in Place Survey, all principal economic indicators, this program provides data for the development of price indices of new single-family houses sold and under construction. The data are closely followed by the home-building industry. Housing starts data are used as direct input to estimate the value of construction put in place for single-family houses and are used to generate the sample to measure the value of construction put in place for multifamily residential projects. Construction put in place data This program provides estimates of the total dollar value of all construction work done in the nation each month, a principal economic indicator. "Construction" includes new buildings and structures as well as additions and alterations to existing buildings and structures. Residential improvements to owner-occupied housing units are derived from the CE Survey. Construction put in place data are provided to the BEA for direct input to the national income and product accounts. These data accounted for about 5 percent of total GDP in 2011. Other data users
CEN-52

include the Council of Economic Advisers, the Federal Reserve Board, construction firms, and trade associations. Manufacturing Statistics The manufacturing statistics programs measure the overall performance of the U.S. manufacturing sector and the investment behavior of all U.S. businesses. The Annual Survey of Manufactures (ASM), and the Manufacturers’ Shipments, Inventories and Orders (M3) Survey provide key national performance indicators for the sector of the economy accounting for 11 percent of the nation’s non-farm employment and 12 percent of GDP. The Annual Capital Expenditures Survey (ACES), and the Information and Communication Technology Survey (ICTS) provide key business investment indicators for all private non-farm sectors of the economy. The manufacturing sector also supplies the export markets, which have become increasingly important to the overall health of our nation’s economy. These programs, which supplement data collected in the economic census, provide the monthly, quarterly, and annual data that are vital to policymakers in both the public and private sectors for analysis of the business cycle and domestic production. They provide key information on major labor, capital, and manufacturing material inputs and outputs, as well as capital investment by U.S. businesses. Base funding also provides the Census Bureau’s contribution towards costs associated with surveys conducted under joint project agreements, collecting data on research and development and pollution abatement costs and expenditures. Surveys on manufacturing capacity utilization and energy use are conducted on a cost reimbursable basis for other Federal agencies. Annual survey of manufactures The Annual Survey of Manufactures (ASM) collects information from approximately 53,000 manufacturing establishments and measures manufacturing activity that includes employment, payroll, fringe benefits, cost of materials, capital expenditures, fuels consumed, shipments, and inventories by stage of fabrication. The Census Bureau also publishes information on e-commerce sales and basic data at the national level for 322 industry groups and for about 1,700 product classes. The Census Bureau provides selected data at the state level. This program is the only source of comprehensive data on the manufacturing sector of our economy. The BEA, the BLS, the Federal Reserve Board, the International Trade Administration and manufacturing and non-manufacturing firms are all users of the ASM data. Over the past five years this program has demonstrated improved efficiencies through the implementation of the ability for single unit establishments to report directly over the Internet and the accelerated release of its data products by an average of three months. Industrial indicators and business investment The M3 provides the indicators of monthly changes for the entire U.S. manufacturing sector. The survey provides monthly data on the dollar volume of shipments, new and unfilled orders, and total inventories for 89 North American Industry Classification System industry categories and 8 market categories. It also provides stage-of-fabrication inventory data for about 21 broad categories. The M3 Survey is the only source of detailed monthly statistics on manufacturing shipments, inventories, and orders. The M3 report is one of the principal economic indicators for the United States, as well as a component of the GDP estimates. The shipments data are important coincident indicators of the business cycle; new orders and unfilled orders are important leading indicators and inventories-to-shipments ratios are a lagging indicator. The BEA, the Federal Reserve Board, the Conference Board, and the Council of Economic Advisers use these data. The financial pages of many leading newspapers and magazines consistently highlight this information.
CEN-53

The M3 Survey collects 100 percent of its data via electronic means, thereby reducing data collection costs. This reduction in costs contributed, in part, to our ability to conduct two new benchmark surveys: the Manufacturers’ Unfilled Orders Survey and the Shipments to Federal Agencies Survey. The Annual Capital Expenditures Survey (ACES) is the sole source of detailed comprehensive annual statistics on investment in new and used buildings and other structures, machinery, and equipment by private nonfarm businesses in the United States. Program data are supplemented on a 5-year cycle, with added detail on investment by types of structures and types of equipment for companies with employees. The additional detail is available for survey years ending in “2” and “7”.
The Information and Communication Technology Survey (ICTS) provides data on capitalized and non-capitalized spending for information and communication technology (ICT) equipment and computer software. The annual ICTS collects data on two categories of non-capitalized expenses (purchases; and operating leases and rental payments), for four types of information and communication technology equipment and software (computers and peripheral equipment; ICT equipment, excluding computers and peripherals; electromedical and electrotherapeutic apparatus; and computer software, including payroll associated with software development). The survey also collects capital expenditures data on the four types of ICT equipment and software cited above.
The ACES and ICTS programs cover all private non-farm companies located in the U.S., excluding agricultural production, government operations (including the U.S. Postal Service), private households, foreign-owned operations of domestic companies, and businesses located in U.S. territories. The ACES selects a new sample of approximately 76,000 businesses (46,000 with employees, and 30,000 without employees) annually to reduce reporting burden on companies with less than 500 employees (including self-employed). The ICTS is sent to the same 46,000 businesses with employees sampled for the ACES.
Annual ACES data include national estimates of capital expenditures for new and used structures and equipment for businesses with and without employees, as well as 3-digit and selected 4-digit North American Industry Classification System (NAICS) detail for businesses with employees. Annual ICTS data include national estimates of capitalized and non-capitalized ICT equipment expenditures for all businesses with employees at the 3-digit and selected 4-digit NAICS levels.
The BEA uses the data in refining and evaluating annual estimates of investment in structures and equipment in the national income and product accounts, compiling annual input-output tables, and computing quarterly estimates of GDP by industry. The Federal Reserve Board uses the data to improve estimates of investment indicators for monetary policy. The BLS uses the data to improve estimates of capital stocks for productivity analysis. The Conference Board uses the data to prepare the monthly index of leading economic indicators. The Census Bureau uses the data to improve the quality of monthly economic indicators of investment, and the Bureau’s Value of New Construction Put in Place survey uses the ACES data to benchmark its industrial buildings data. Other public users include the Council of Economic Advisers, Department of the Treasury, and the Congressional Budget Office. The private sector uses the data for monitoring current production trends, planning future production, market analyses, economic forecasting, identifying business opportunities, product development, and business planning.
CEN-54

General Economic Statistics The general economic statistics programs provide information that is essential to understanding the changing economic structure of the United States. In addition, the Business Register (BR) and parallel classification activities also provide the infrastructure for the current and periodic economic programs that produce national statistical profiles of all sectors of the economy. Business register The BR identifies the business populations covered by economic censuses and surveys; maintains information about company affiliation and organizational structure; provides consistent industrial, geographic, and size classifications, as needed, to construct efficient, representative samples and enumeration lists; serves as a consolidated source for name, address, and other contact information needed for cost-effective data collection methods; and supports census and survey processing operations. The BR comprises more than 31 million active establishments. It includes 1.8 million establishments belonging to over 168,000 multi-establishment firms, 6.0 million single-establishment firms with paid employees, and over 23 million single-establishment firms without paid employees. A significant portion of the BR information originates from the administrative records of other Federal agencies, such as the Internal Revenue Service, the Social Security Administration and the BLS. Administrative record data offer an efficient, low-cost alternative to direct mailing to millions of small businesses. The Census Bureau supplements these administrative data with results from the economic census, the annual Company Organization Survey (COS), the ASM, and other current surveys. Census Bureau collections provide information on the composition, organizational structure, and operating characteristics of multi-establishment enterprises. Accurate information about these larger companies is important because these firms account for a disproportionate share of the nation’s production and employment. The COS uses electronic collection methods to obtain data from some firms, making it easier for the respondents to provide these data, thus reducing the reporting burden. The BR is the source of statistical frames for internal Census Bureau programs. The annual County Business Patterns (CBP) report is based on tabulations from the BR and provides basic operating statistics for establishments with paid employees in all industries except agricultural production, railroads, the United States Postal Service, private households, and government. Tabulations summarize data by the NAICS for the 50 states, the District of Columbia, Puerto Rico and Island Areas, and counties. The CBP is the only annual source of detailed industry statistics for small geographic areas. These data are used by Federal agencies, including the BEA. However, the heaviest use is by private businesses and organizations and by local governments, who obtain CBP statistics through the Internet, depository libraries, a network of State Data Centers, and other local channels. The annual Nonemployers Statistics (NES) report is based on BR tabulations and provides revenue data for sole proprietorships, partnerships and corporations without paid employees that are subject to Federal income tax. The NES series is the primary resource available to study the scope and activities of nonemployers at a detailed geographic level. Most other business statistics exclude nonemployer establishments (the primary exception being the Survey of Business Owners). Tabulations from the NES summarize data by NAICS industry for the 50 states, District of Columbia, and counties. The NES includes the majority of NAICS industries with some exceptions as follows: crop and animal production; investment funds, trusts, and other financial vehicles; management of companies and enterprises; and public administration. The data are a primary sampling source for the U.S. Small Business Administration surveys and are available to the
CEN-55

public as an annual data release. The BEA uses the data to contribute to the total GDP for all U.S. businesses. Industry and commodity classification This program assures that Census Bureau operations are complete, consistent, and comparable with the Office of Management and Budget (OMB) and other agency standards. This program is also responsible for preparing concordances between the classification systems used in other countries and the United States as official classifications requested by OMB. The NAICS was developed cooperatively with Canada and Mexico and implemented in 1997. Every five years, revisions have been incorporated into statistical programs throughout the Census Bureau. Implementation of NAICS 2012 is underway. This program coordinates and supports the continued maintenance and revision of the NAICS structure every five years. The Industry and Commodity Classification program is responsible for assigning NAICS codes to new business establishments on the business register. The Census Bureau works closely with other agencies that supply administrative records to ensure the completeness and quality of incoming NAICS codes. Further, the Census Bureau conducts a quarterly survey of business births to assign NAICS codes or verify administrative records assignments. Accurate and timely industrial classifications are essential to structuring efficient samples that provide high-quality estimates for industrial statistics. The assignment of accurate codes in the business register is the foundation of all sample work for economic programs. The Industry and Commodity Classification program is also responsible for a pre-Economic Census survey of units that do not have industrial classification codes. This effort ensures that the proper Economic Census survey forms are sent to smaller establishments and to new businesses that have not responded in the past. The pre-census refile survey is a key step when preparing for an efficient and effective Economic Census. During the Economic Census, the Industry and Commodity Classification program processes over 900,000 classification forms and provides coding assistance and guidance to other Economic Census program areas. The Industry and Commodity Classification program also works on the continued development of a new North American Product Classification System (NAPCS). The program provides staff for development subcommittees, documents results of cooperative North American product development decisions and maintains a repository of United States products. This program coordinated the initial implementation of NAPCS products for the service industries with the BEA and the BLS during the preparation of the Economic Censuses in 2002 and 2007. Work is extending into wholesale trade, retail trade, and manufacturing, with implementation of the current work taking place in the 2012 Economic Census. Economic studies Center for Economic Studies (CES) staff research important economic issues; evaluate economic, decennial, and demographic data programs; and develop new and improved economic measures. The CES also integrates, creates, maintains, and provides micro data from the Census Bureau's data collection programs to approved researchers. The CES develops and maintains the Research Data Center (RDC) network, which provides access to Census Bureau micro data to external researchers with special sworn status on approved projects. The research results from CES and the RDCs have generated substantial new insights into the quality of census and survey data, led to new public use data products, identified gaps in existing programs, and suggested areas where new programs are needed. Specifically, the program has produced research with direct relevance to numerous existing Census Bureau programs (including the ASM, ACES, Business R&D and Innovation Survey, Pollution Abatement Cost Expenditure Survey, and the Survey of Business
CEN-56
Owners), identified new economic measures (including productivity, high-tech trade, job creation and destruction, and new data on the dynamics of small and young businesses), contributed to developing measurement approaches in evolving areas of the economy (including factoryless goods producers and e-business), and supported the classification of historical economic census data to a NAICS basis. The CES is undertaking work to improve the utility of Federal data for studying business behavior. One undertaking is to extend the Longitudinal Business Database (LBD) by linking the existing files with additional data on small and young businesses, which are often the progenitors of larger, publicly traded, companies. Projects include linking microdata that describe the trading activities of firms (volume of imports and exports) as well as the innovative activities of firms and their financial position. These projects will feed into the expansion and improvement of the Business Dynamics Statistics (BDS), which is the publicly available dataset derived from the LBD. In addition, the CES is extending the features available on the Synthetic Longitudinal Business Database, which is a new public-use product that allows users to track business dynamics in detailed industries. CES has partnered with the Manufacturing Construction Division and an outside research team in the development and fielding of a new supplement to the ASM, the Management and Organizational Practices Survey. The Longitudinal Employer-Household Dynamics (LEHD) program in CES leverages existing data sources to create new information about the economy. The program has data sharing agreements with state agencies from all 50 states (through the Local Employment Dynamics data sharing partnership) and other Federal agencies. These data are linked with other Census data to create new linked employer-employee microdata data covering over 90 percent of U.S. jobs. From the linked LEHD microdata, the program produces two public-use data products, the Quarterly Workforce Indicators (QWI) and OnTheMap. The QWI provide demographic information on area workforces at very detailed industry and geography levels. OnTheMap shows workforce statistics by both workplace and residential geography. The CES continues to introduce enhancements to the LEHD microdata and products.The set of demographic characteristics available in LEHD data products has been expanded by integrating decennial census data into the LEHD data frame, and providing new QWI and OnTheMap data by race, ethnicity, and education. Information on business size and age from the LBD have also been integrated, which provide a better understanding of who works at startups, their earnings, and worker churn at new firms. The CES is also expanding the frame of jobs to include new sources of information by adding Federal worker data from the Office of Personnel Management and tax data on the self-employed. A data product tracing the flows of workers between jobs is under development. The CES also continues to introduce advanced data visualization technology to improve LEHD data dissemination, usability, and applicability. Quarterly financial report The Quarterly Financial Report (QFR) program collects and reports current information on corporate financial conditions. It is a principal economic indicator, as well as a component of other economic indicators. It includes statistics on sales, profits, assets, liabilities, stockholders' equity, and related accounts and ratios. Using a sample survey of 13,000 companies, the program provides industry and asset size data for small, medium, and large manufacturing corporations, and provides data for corporations with more than $50 million in assets in the mining, wholesale trade, retail trade, information, and professional and technical sectors (except legal services). In the fourth quarter of 2012, the QFR began collecting data in four new service sectors. This expansion includes real estate and rental and leasing (except lessors of nonfinancial intangible assets), administrative and support and waste management and remediation services, health care and social assistance, and accommodation and food services sectors. This data will be released for the first time with the fourth quarter 2013 release, in March 2014. With this expansion, the QFR will cover nearly 37 percent of the services sector, will provide detailed financial data for the largest
CEN-57
sector of GDP not currently provided by any other source, and will represent nearly 60 percent of the sectors covered by the GDP. The QFR data are used by BEA in constructing the national income accounts, and by the Federal Reserve Board in the flow of funds accounts. The data are also used in the public and private sectors to analyze corporate profits and financial conditions by industry and asset size. Measuring electronic business The extraordinary growth of the Internet has changed the way businesses communicate, seek and access information, purchase and sell goods, and interact. The successful integration of information, communication, and computer technology has provided firms with the opportunity to fundamentally change the ways they operate and conduct business. The Census Bureau has taken a leadership role in measuring and assessing the impact of electronic business on our economy. The Census Bureau e-business measurement program provides quarterly measures of retail e-commerce sales and detailed annual measures of e-commerce activity for manufacturing, wholesalers, selected service industries, and retail trade. Foreign Trade Statistics The foreign trade statistics programs provide official monthly statistics on imports, exports, and balance of trade for all types of merchandise moving between the United States and its international trading partners. The trade statistics are a principal economic indicator for the United States and are released an average 35 days after the reference month. The Census Bureau is the primary source of these comprehensive monthly data that provide national performance indicators vital to understanding our economy, as well as our economic relationships with the rest of the world. Import statistics This program compiles monthly foreign trade statistics from information filed with U.S. Customs and Border Protection. Import statistics are compiled for shipments valued over $2,000, except for selected commodities valued over $250. Data for shipments valued under these levels are developed for individual countries through a statistical estimating procedure. The monthly and cumulative statistics summarize merchandise imports using the commodity classifications of the Harmonized Tariff Schedule of the United States, Annotated (HTSUSA) by country of origin and by customs district of entry, although various other commodity classification systems and statistics are also readily available. The merchandise imports summary statistics are adjusted to a balance-of-payments basis and combined with imports of services statistics provided by the BEA, and published in a joint press release. Information is released monthly, covering major commodities and groupings for the Standard International Trade Classification (SITC), NAICS, End-Use Classification, and coverage by geographic areas. The program also produces a series of tabulations and automated media and online products covering government and private-sector imports of merchandise into the United States, Puerto Rico and the Virgin Islands, as well as selected information on foreign trade zones. In addition, data are released showing movements of imports by vessel and air with information on commodity, country of origin, value, quantity, shipping weight, U.S. port of unloading, and state of destination. All this information can be found on the following websites: www.census.gov/trade and www.usatrade.census.gov. In compliance with the Omnibus Trade and Competitiveness Act of 1988 (Trade Act of 1988), the Census Bureau releases the official import statistics for classifications based on the Harmonized Commodity Description and Coding System. In addition, pursuant to the Trade Act of 1988, the Census Bureau releases seasonally adjusted merchandise trade data on a constant dollar basis.
CEN-58
This program also provides statistical reports required by the Committee for Implementation of Textile Agreements for monitoring textile imports from all countries that have bilateral textile agreements with the United States. In addition to the statistical information on textiles, the program also provides statistical information for monitoring imports of steel products and softwood lumber products required by the Import Administration of the International Trade Administration. Trade legislation requires compilation of information on imports for special trade agreements including the Generalized System of Preferences (GSP), the Caribbean Basin Initiative, the North American Free Trade Agreement (NAFTA), and approximately 15 other trade agreements. The BEA, Council of Economic Advisers, Federal Reserve Board and Department of the Treasury use import trade statistics to develop the import components for the GDP accounts and to monitor the impact of imports on the general economy. Some of the other users of information from the import statistics program are the U.S. Trade Representative, Department of Commerce, U.S. International Trade Commission, Maritime Administration, Department of Transportation, Army Corps of Engineers, U.S. Customs and Border Protection, and many other public and private sector organizations. These groups use the information to negotiate trade agreements, and implement and monitor international trade agreements, such as NAFTA, and other special bilateral agreements on quotas, textiles, steel, automotive vehicles and parts, etc. In addition, this information is widely used by the business community in market research, trade promotional activities, and analysis of water transportation infrastructure requirements. Export statistics This program compiles monthly export statistics from electronic export information collected by the Census Bureau and U.S. Customs and Border Protection through the Automated Export System (AES). The AES provides mainframe, downloadable PC-based software, and Internet filing options for exporters, freight forwarders, and carriers. The export statistics program also includes data on U.S. exports provided by Statistics Canada under a program of import data exchange between U.S. and Canadian statistical agencies. Export statistics are compiled for all shipments individually valued over $2,500 for all countries. The Census Bureau estimates data for shipments valued under $2,500 for individual countries. The monthly and cumulative statistics summarize merchandise exports for the commodity classifications using the Schedule B, by country of destination and by customs district of exportation. Schedule B is the official schedule of export commodity classifications that can be used by shippers in reporting export shipments from the United States and in compiling the official statistics on exports of merchandise from the U.S. Schedule B is also based on the Harmonized System. The merchandise (goods) exports summary statistics are adjusted to a balance-of-payments basis, combined with exports of services statistics provided by the BEA, and published in a joint press release. Similar to the import program, the information is released monthly and shows data covering major commodities and groupings for the SITC, NAICS and End-Use Classification, and coverage by geographic areas. Data items include movement of exports by vessel and air, with information on value, quantity and shipping weight, U.S. port of export, state of origin of movement, commodity, and country of destination. In compliance with the Trade Act of 1988, the Census Bureau publishes seasonally adjusted merchandise trade data on a constant dollar basis. The export statistics include non-governmental shipments to foreign countries, including shipments from foreign trade zones. Also included are government shipments, such as Department of Defense Military Assistance Program, Grant-Aid shipments, economic assistance shipments, and shipments of agricultural commodities under Public Law 83-480.
CEN-59
The BEA, Council of Economic Advisers, Federal Reserve Board, and the Department of the Treasury use export trade statistics to develop the export component for the balance of payments and GDP accounts. Some other users of information from the export statistics program are the Department of Agriculture, Department of Commerce, the U.S. Trade Representative, Bureau of Labor Statistics, U.S. Customs and Border Protection, and many other public and private sector organizations. These groups use the export information to implement and monitor international trade agreements, such as the North American Free Trade Agreement; to promote exports through export promotion programs; to enforce export control and national security laws; to conduct trade negotiations; and to conduct market research to determine export market potential and vessel and air movement requirements. Trade monitoring This program covers the Census Bureau’s responsibilities under the Trade Act of 1974. This includes Section 608 (Uniform Statistical Data on Imports, Exports and Production), Title V (Generalized System of Preferences) and Section 282 (Trade Monitoring System). Section 608 requires data on imports, exports and domestic production on a comparable basis. The NAICS classification system is used for this purpose and a correlation between the international Harmonized System classification system and the domestic production-based NAICS classification system has been developed. The commodity classification systems are revised on a regular basis, updated to reflect changing statistical needs and to improve comparability of trade and domestic production data. They also allow comparability of data between the United States and other countries. Title V of the Act requires data to monitor imports from designated countries and to evaluate the economic effect of the GSP. The latter provides duty-free access to the U.S. market by developing countries. The compilation of GSP import data provides the means for analyzing the effectiveness of the Act to promote exports and economic development in beneficiary countries. The data also provide the basis for changes in eligibility whenever GSP imports from a beneficiary country trigger the need for competitive limitations. Section 282 of the Act requires publication of data in order to monitor the relationship between imports and U.S. employment and production by geographic region. These data assist in the identification of areas affected by imported articles. Government Statistics The government statistics programs provide current statistical information on revenues, expenditures, debt, and financial assets for over 90,000 state and local governments. The programs provide data in the areas of state and local government financial activity and public employment and payroll. The data are vital to measuring the government sector of the national economy, understanding the flow of public funds throughout the country, and administering public programs. Surveys of government finance operations These surveys provide statistics on the different aspects of state and local government financial activity. There are various components: annual surveys on the entire range of state and local government financial activity including information on public pension systems as well as general statistics on revenues, expenditures, indebtedness, and cash and securities; a quarterly survey on state and local government tax revenues; and a quarterly survey on the finances of selected public pension systems. The annual financial statistics program serves as an update of census-year benchmark statistics. The statistics include data on revenue by source, expenditure by function and object, indebtedness and debt transactions, and financial assets. The revenue data include detailed tax data by the major categories of property, sales, income, licenses, and permits; intergovernmental receipts according to
CEN-60

source of funds (Federal, state, or local governments); government charges for services; and miscellaneous revenue, such as earnings on investments. Expenditure detail includes the major purpose served, such as education, public welfare, health and hospitals, streets and highways, housing and community development, police and fire protection, sewerage and sanitation, and general support. The BEA uses the estimates to develop the state and local government component of the quarterly and annual revisions to the National Income and Product Accounts (NIPA). State and local governments account for about 12 percent of GDP and are the source for about the same share of personal income in the nation. The Federal Reserve Board uses the estimates in the flow of funds accounts as source information for several key measures of the credit markets. Congress and state officials use the tax and intergovernmental revenue database to prepare analyses of fiscal policy, tax burdens, and comparative studies on governmental finance. Local officials use the detail by types of government to understand the relative activity of counties, municipalities, townships, special districts, and school districts. Survey of government employment Federal, state, and local governments account for about 15 percent of the nation’s civilian labor force. The basic data include a range of information on employees, their pay and hours for the month of March of a given year. Survey results provide national estimates of each variable by level of government (Federal, state, and local) and government function (education, police protection, public welfare, etc.), as well as state-by-state estimates of state and local government variables by function. This program provides the annual update of government employment and payroll data by level of government and function. The survey is the only intercensal source of public employment and pay data at the sub-national level. The BEA uses the estimates for deriving price-level changes in the NIPA series. Governors use these data for comparison of governmental efficiency among states.
PROGRAM CHANGES: 1. General Economic Statistics/Economic Studies/Enhancement of the Census Bureau's
Longitudinal Business Database ($5,000,000, 18 FTE): This increase will be used for research to enhance the Census Bureau's Longitudinal Business Database (LBD) with information on innovation and entrepreneurship. As part of the enhancement, this increase will also be used to improve LBD products via the development of new application program interfaces (APIs) and synthetic data products. The increase will also be used to facilitate access to the LBD through the U.S. Census Bureau Research Data Center (RDC) network. This initiative supports the Department of Commerce’s Data goal to “Improve government, business, and community decisions and knowledge by transforming Department data capabilities and supporting a data-enabled economy.” It specifically supports objective 4.2 to “Improve data-based services, decision-making, and data sharing within the Department and with other parts of the federal government.” Statement of Need and Economic Benefits – Cost Benefit Analysis: The Federal Government’s efforts to promote entrepreneurship and small business growth draw from relatively recent research on the importance of young companies as the primary drivers of net job creation. This research relies on the Census Bureau’s Longitudinal Business Database (LBD), which integrates survey and administrative data for all 6 million employer firms. The LBD is updated
CEN-61
annually and extends back into the 1970s making it the longest time series of any data on business dynamics. The LBD includes data on business openings and closings, startups, job creation, job destruction by firm size, age, industry, and location throughout the United States. Enhancements to the LBD would provide detailed information on the interactions between business R&D, innovation, and entrepreneurship. With these enhancements, it will be possible to create measures of innovation, research the role of R&D in innovation, and measure the return on investments for the business sector. The enhancements to the LBD will come from partnerships with both the Patent Office (PTO) and the National Science Foundation. The increase would be used to scale up and routinize a joint PTO-Census pilot that links patent and trademark data to the businesses in the LBD. The increase would also be used to collaborate with the National Center for Science and Engineering Statistics (NCSES) developing pilots of other measures of innovation. This increase will also be used to enhance the LBD as described above but also to improve access to these enhanced LBD dataset and products via development of new APIs, data access tools, and new and enhanced synthetic data products. Some of these will be accessible to the public so as to maximize their impact on households and private industry. Finally, the increase will provide support for the research infrastructure and to promote new research projects at the Center for Economic Studies and the US Census Bureau. This includes expanding the types of data available in the RDC Network and to support researchers using the new data. Researcher access is made possible by hosting the resulting products in the RDC network. The RDC network is a combination of physical and technical infrastructure, business rules, and security protocols that facilitate secure access to confidential microdata to qualified researchers working on approved projects. The network has fifteen locations around the country, supporting regular access by researchers. This increase allows the Census Bureau to expand the types of data available in the RDC network with data from other Federal statistical agencies, administrative records from Federal and/or state programs, other government programs, and commercial sources related to innovation and entrepreneurship. This initiative would bring together datasets that would facilitate the production of public use datasets and products and promote rigorous research on measuring entrepreneurship, innovation, and job creation. Furthermore, by combining these data with program data, researchers could examine the effectiveness of government programs designed to promote innovation. Specifically, this funding will allow the Census Bureau to do the following:
• Develop new products describing the U.S. economy. This activity will include the development of public use Census Bureau data products and data access tools that describe and help us understand innovation efforts and their impact on job creation and productivity growth. This activity will make it possible to easily and quickly track innovation activities over time and their impact.
• Improve and integrate new data files. This activity will include identifying highest-priority data files to support development of research-ready data files; the production of consistent metadata and documentation; and the creation of linkage keys between new data and other data sources. This activity will vastly expand the analytical capabilities of the new data as well as data already housed in the RDC Network.
• Add data files to the RDC Network in support of the LBD enhancement. This activity will include identifying data to support research and development; preparing and renewing legal agreements to acquire data for use in the RDC Network; transferring and setting access controls on secure data files; and acquiring hardware to store new data files.
CEN-62

• Support researchers' use of new data files. This activity will include: the review, approval, and tracking of new research projects, in cooperation with agencies providing source data; processing and maintenance of background checks and Special Sworn Status for new researchers; coordination of disclosure review of researcher output; hardware for data processing and new research project storage; additional software licenses required by new researchers; and user support for hardware, software, and data quality issues.
Benefits Policy makers and researchers in government and academia will be able to use the most accurate and detailed data to evaluate innovative activities (as captured by innovation measures) of firms and their impact on job creation and economic growth. As innovation becomes increasingly important to our national competitive advantage, the US needs to employ cutting edge analytic methods to evaluate its determinants (including policies) and its impact. Effectively combining data from disparate sources requires understanding the underlying properties of the data. In many cases, combining data also involves a substantial investment in organizational structure to handle the necessary data protocols and protections. These investments in human capital and organizational capital will create the infrastructure needed to support research efforts, as well as public data product development. The resulting measures of innovation and entrepreneurship will allow policy makers, private industry, and the public at large to access new findings from a large community of highly skilled researchers, while at the same time protecting the confidentiality of the data. The Census Bureau maintains universe frames of people, households and businesses for the surveys and censuses that it already conducts. These frames will be leveraged, with little additional cost, to more accurately measure the impact of innovative activities on the U.S. economy. At the same time, these additional sources of data could be used by the Census Bureau to improve the frames, surveys and censuses that it currently conducts. Outcomes This project will provide the Federal Government with an increased capacity to make data driven decisions about critical programs. This outcome will be achieved at a relatively low cost in terms of additional data collection burden and research inputs, which will include both new data and new researchers. Schedule and Milestones: FY 2015
• Hire necessary staff. • Acquire hardware for storing and processing data, and additional software licenses. • Identify and acquire highest-priority datasets for developing measures of business R&D,
innovation, and entrepreneurship. • Process data, documentation, and linkage keys for highest-priority datasets, and make all
data available in the RDCs. • Publish documentation detailing procedures for accessing new restricted microdata files in
the RDC network.
CEN-63

FY 2016 - FY 2019 • Produce publicly available measures of innovation and entrepreneurship from the enhanced
LBD. • Annually acquire, process, document, and add new data files to the RDC network. • Annually update hardware and software necessary to accommodate new RDC network
research projects. • Annually update and publicize information about access and use of the new restricted
microdata files in the RDC network. Deliverables:
• Produce public-use datasets (including synthetic datasets) and data access tools on innovation and entrepreneurship in the U.S. economy.
• Produce research-ready data files, documentation, and linkage keys for the RDC Network. • Prepare technical and administrative infrastructure to support additional research projects
based on the new data files. • Coordinate with other agencies to develop and publicize procedures for approval, access,
and tracking of program evaluation projects using new data files.
2. Inflationary Adjustment: The Current Economic Statistics sub-program requests a decrease of $8.5 million and 0 FTE for a total request of $183,727,000 and 1,214 FTE to meet the cross-cutting program reductions necessary to offset increased funding requirements for adjustments-to-base (ATBs). These cross-cutting reductions will be captured by managing on-going administrative savings, managing the backfilling of vacated positions due to attrition, and carefully monitoring all travel and training.
CEN-64

PROGRAM CHANGE PERSONNEL DETAIL (Dollars in thousands)
Budget Program: Current surveys and statistics Sub-program: Current economic statistics Program Change: Enhancement of the census bureau's longitudinal business database
Number Annual TotalTitle: Location Grade of Positions Salary SalariesSurvey Statistician Suitland, MD GS-15 2 $124,995 $249,990Survey Statistician Suitland, MD GS-14 2 106,263 212,526Survey Statistician Suitland, MD GS-14 1 106,263 106,263Survey Statistician Suitland, MD GS-13 1 89,924 89,924Economist Suitland, MD GS-13 1 89,924 89,924Program Analyst Suitland, MD GS-12 2 75,621 151,242IT Specialist Suitland, MD GS-12 1 75,621 75,621Mathematical Statistician Suitland, MD GS-11 2 63,091 126,182Geographer Suitland, MD GS-11 1 63,091 63,091Survey Statistician Subtotal
Suitland, MD GS-09 2 52,146 104,29215 1,269,055
Distributed share of staff for centralized services 8 596,993 Subtotal 23 1,866,048
Less Lapse Total Full-time permanent:
25% -6 -466,51217 1,399,536
2015 Pay AdjustmentSubtotal
1.049%17
14,6811,414,217
Personnel Data NumberFull-time Equivalent Employment
Full-time permanent 17Other than full-time permanentTotal
118
Authorized Positions:Full-time permanent 23Other than full-time permanentTotal
124
CEN-65

PROGRAM CHANGE DETAIL BY OBJECT CLASS (Dollars in thousands)
Budget Program: Current surveys and statistics Sub-program: Current economic statistics Program Change: Enhancement of the census bureau's longitudinal business database
FY 2015 FY 2015Object Class Increase Total Program
11 Personnel compensation11.1 Full-time permanent $1,414 $1,414 11.3 Other than full-time permanent 40 40 11.5 Other personnel compensation 5 5 11.811.9
Special personnel services paymentsTotal personnel compensation
0 0 1,459 1,459
12 Civilian personnel benefits 390 390 13 Benefits for former personnel 15 15 21 Travel and transportation of persons 31 31 22 Transportation of things 0 0 23.1 Rental payments to GSA 59 59 23.2 Rental Payments to others 0 0 23.3 Communications, utilities and miscellaneous charges 19 19 24 Printing and reproduction 2 2 25.1 Advisory and assistance services 46 46 25.2 Other services 38 38 25.3 Purchases of goods & services from Gov't accounts 403 403 25.4 Operation and maintenance of facilities 16 16 25.5 Research and development contracts 1,277 1,277 25.6 Medical care 0 0 25.7 Operation and maintenance of equipment 385 385 25.8 Subsistence and support of persons 0 0 26 Supplies and materials 9 9 31 Equipment 851 851 32 Lands and structures 0 0 33 Investments and loans 0 0 41 Grants, subsidies and contributions 0 0 42 Insurance claims and indemnities 0 0 43 Interest and dividends 0 0 4499
RefundsTotal obligations
0 0 5,000 5,000
CEN-66

PROGRAM CHANGE DETAIL BY OBJECT CLASS (Dollars in thousands)
Budget Program: Current surveys and statistics Sub-program: Current economic statistics Program Change: Inflationary adjustment
FY 2015 FY 2015Object Class Decrease Total Program
11 Personnel compensation11.1 Full-time permanent -$997 $89,193 11.3 Other than full-time permanent -35 3,381 11.5 Other personnel compensation 0 1,562 11.811.9
Special personnel services paymentsTotal personnel compensation
0 0 -1,032 94,136
12 Civilian personnel benefits -1,809 30,251 13 Benefits for former personnel 0 828 21 Travel and transportation of persons 0 2,611 22 Transportation of things -2 129 23.1 Rental payments to GSA -105 6,672 23.2 Rental Payments to others 0 5 23.3 Communications, utilities and miscellaneous charges -16 2,956 24 Printing and reproduction -3 273 25.1 Advisory and assistance services -161 17,168 25.2 Other services -37 3,459 25.3 Purchases of goods & services from Gov't accounts -5,229 8,243 25.4 Operation and maintenance of facilities -24 2,045 25.5 Research and development contracts -11 2,164 25.6 Medical care 0 0 25.7 Operation and maintenance of equipment -80 9,196 25.8 Subsistence and support of persons 0 127 26 Supplies and materials -18 1,288 31 Equipment -19 2,176 32 Lands and structures 0 0 33 Investments and loans 0 0 41 Grants, subsidies and contributions 0 0 42 Insurance claims and indemnities 0 0 43 Interest and dividends 0 0 4499
RefundsTotal obligations
0 0 -8,546 183,727
CEN-67
SUB-PROGRAM: Current Demographic Statistics The objectives of the Current Demographic Statistics sub-program are to provide elected officials and government managers with the reliable social and economic data needed to make effective policy and program decisions. The components of this program have generated a lengthy time series of monthly, quarterly, and annual measures that provide historical perspective to many current issues. These programs include household surveys, and population and housing analyses. The monthly, quarterly, and annual surveys, and the value-added data analyses funded through the Census Bureau’s current demographic statistics program are the primary source of accurate and timely information decision makers depend on to make informed and cost-effective decisions. Data from these programs are used to create the United States’ official measures of employment, unemployment, poverty, and widely used measures of income and health insurance coverage. Additionally, these surveys and analyses are the source of significant insight for decision-makers on topics, such as immigration, families and children, and the geographic patterns of change in population and characteristics, and for participation of various individuals and households in Federal, state, and local assistance programs. Household Surveys The household surveys line item includes the full array of operations and services associated with large scale data collection, including:
preparation of the sample and survey materials, collection of the data by field representatives, data processing and estimation, production and quality control of monthly, quarterly, and annual data products, and data dissemination of tabulations and public-use micro-data via the Internet and other
media. These programs are continually assessed by monitoring survey response rates, individual and macro-level reporting of data, coverage of the population, and comparisons of projected costs and actual expenditures. The assessments are obtained on a monthly basis through survey-specific data processing and the Census Bureau’s financial management reports. The surveys and assessments efficiently leverage capabilities of the field infrastructure and workforce. The household surveys line item includes the three distinct programs described below. Current Population Survey (CPS) The CPS is a monthly survey of about 58,000 households that has been conducted by the Census Bureau for the BLS for more than 50 years, with the BLS providing about two thirds of the total funding for the program. Although the primary purpose of the CPS is to provide detailed labor force characteristics of the civilian non-institutional population and the monthly unemployment rate, a leading economic indicator, the Census Bureau’s funding supports the collection and processing as well as the oversampling of Hispanic households for the Annual Social and Economic Supplement (ASEC) in March of each year. In addition, Census Bureau funding supports the collection and processing of the CPS Fertility supplement, conducted every other June; the CPS School Enrollment supplement, conducted every October; and the Voting and Registration supplement, conducted every other November. Census Bureau funding for these CPS supplements produce annual data on work experience, income, poverty, migration, and school enrollment, and biennial data on voting.
CEN-68

The CPS program also receives separate funding from the State Children’s Health Insurance Program to supplement the sample to obtain annual estimates of health insurance coverage of children. This additional sample increases the basic monthly CPS sample by about 20 percent and the sample for the ASEC by about 25 percent. The CPS sample provides direct estimates for the nation as a whole and serves as part of a model for individual states and other geographic areas. In addition to the regular appropriations, other agencies sponsor supplements to the CPS in other months which cover such topics as child support and alimony, tobacco use, volunteers, and food security. Sample cases that are found to be vacant in the CPS are also eligible for the Housing Vacancy Survey, which produces the quarterly housing vacancy rates, another leading economic indicator. The CPS program also includes funding for the development of a Supplemental Poverty Measure (SPM) to complement the current official measure. The funding for the SPM allows us to upgrade all of our production processes to convert this measure from a research measure to a production-grade series that is released alongside the official poverty measure. This fully implemented measure will have more acceptance in the user community, and provide more transparency and understanding of the differences between the official measure and the SPM. In addition, the funding allows us to ensure that our estimation procedures are the most accurate and make improvements as needed. Survey Methods Development The Census Bureau continually investigates ways of providing more accurate survey data faster and at a lower cost. This program tests and develops alternative survey methodologies and concepts for improving demographic surveys. Improvements apply to the CPS, Survey of Income and Program Participation (SIPP), and other demographic surveys that are done on a reimbursable basis for other Federal agencies. They include surveys that provide statistical measurements of crime, housing, health, consumer income, and consumer expenditures. Enhancements resulting from this research affect Federal programs that allocate funding to state and local governments. The research strategy involves consultations with external and internal customers (for example, BLS, the OMB, and the National Center for Health Statistics), and includes research and analysis of interviewing methods, response bias, quality control procedures, questionnaire design, and documentation. The Census Bureau has evaluated telephone versus in-person interviews, response differences between household members, interviewer conditioning, and use of random digit dialing. The Census Bureau is currently standardizing the production of a Contact History Instrument which provides data to help field representatives locate respondents and identify the best times to contact respondents. Survey of Income and Program Participation The SIPP is the major source of information on the economic well-being of Americans over time. The SIPP allows policy makers and program managers to look at situations of specific families and households over three to four years providing perspective on demographic and economic changes. The SIPP collects sources and amounts of income, labor force information, program participation and eligibility data, and general demographic characteristics in order to measure the effectiveness of existing Federal, state, and local programs. The data are also used to estimate future costs and coverage for government programs, such as food stamps, and to provide improved statistics on the distribution of income in the country. The SIPP content is built around a “core” of labor force, program participation, and income questions designed to measure the economic situation of households in the United States. The survey was designed also to provide a broader context for analysis by adding questions on a variety of topics not covered in the core section such as child care, wealth, program eligibility, child support, utilization and cost of health care, disability, school enrollment, taxes, and annual income.
CEN-69

In December 2013, the SIPP Panel, which began in September of 2008, will come to it’s conclusion, and in February 2014, the new 2014 SIPP panel will begin. The 2014 SIPP design uses a new data collection instrument that integrates an Event History Calendar to facilitate our transition from thrice yearly to annual interviewing. Fiscal Year 2015 will be the first full year with only the new panel design. During FY 2015, we will process and release data from the first interview (Wave 1) of the respondents in the 2014 panel, and will collect data from the second interview (Wave 2) of the 2014 SIPP panel respondents. The data collected by the 2014 SIPP Wave 1 interview cover calendar year 2013, and overlap data collected by the end of the 2008 SIPP Panel. The evaluation of these data as well as continued evaluation of data collected from the fielding of prototypes of the new SIPP automated instruments, will be conducted during FY 2015. These evaluations will serve to inform the users and stakeholders for SIPP data of the characteristics of the change in methodology, and the effectiveness of the new Event History Calendar as a data collection tool. In addition, the reengineered data processing system, designed to process output from the new instruments, will continue to be developed, and SIPP data quality will continue to be evaluated by comparisons to administrative records data.
Population and Housing Analyses
The Population and Housing Analyses program uses a variety of approaches to create value-added information for policy makers and program managers, refining the statistical data collected in surveys into insightful and useful information. This program increases the knowledge base with varied sources of information, adds context and perspective to survey data, and maintains the statistical infrastructure through compilation of records and development and maintenance of standards.
The Population and Housing Analyses program has three major components:
Population characteristics The Population Characteristics program produces a wide variety of population analyses and reports based on data collected by the CPS and other surveys. The recurring Current Population Reports are used by Federal, state, and local agencies to design, implement, and evaluate programmatic activities and by a wide variety of organizations in the private sector as the official baseline estimates of various social, demographic, and economic phenomena and trends. These reports present both statistical tables and analytical texts. In addition, the Census Bureau produces special reports on a variety of topics as they become important to Federal interests.
The program also provides a wide variety of data and research products relating to the distribution of income, wealth, and poverty in the United States. Recurring reports from the CPS and other data sources are the official source of the United States’ poverty and income statistics.
The Population Characteristics program ensures continuous improvement and consistency of critical measures relating to Federal standards and classifications. The OMB uses Census Bureau reports as a key component of the analyses needed to monitor and improve Federal standards and classifications on race and ethnicity, metropolitan and micropolitan statistical areas, occupation, high school dropout rates, and other standard measures. Over time, the work on standards reduces duplication of effort, facilitates the integration of independent outputs of the information from these data systems, and provides a common definition structure for all users of these data, both public and private.
Population projections The Population Projections Program provides information on the future U.S. population by age, sex, race, and Hispanic origin. Policy analysis and application of statistical and
CEN-70
government programs frequently depend on accurate, detailed information on the future characteristics of the population. The Population Projections Program projects the future U.S. population by age, sex, race, and Hispanic origin. The program monitors changes in administrative and vital statistics, evaluates population trends, and then projects those trends into the future. These projections help to identify and describe major changes in the U.S. population in terms of size and also in terms of age, sex, race and Hispanic origin - information that is essential to enable policy makers, government agencies, and businesses to respond to rapid population changes. Housing statistics This program conducts the Housing Vacancy Survey, which produces basic information on the current housing market. The survey collects and provides information on vacancy rates for rental and homeowner units, and on home ownership rates. The rental vacancy rate from the survey is a component of the index of leading economic indicators used by the HUD, BEA, National Association of Home Builders, Federal Reserve Board, OMB, Department of Treasury, and the Council of Economic Advisers. The housing statistics program also produces quarterly and annual vacancy rates and home ownership rates for the country as a whole, for four major geographic regions, for metropolitan and non-metropolitan areas, and for principal cities and suburbs. Both public and private organizations use the data to evaluate housing markets and to determine the number and characteristics of available units and the level of home ownership. The White House, HUD, private businesses, nonprofit organizations, and academic researchers use these data to measure progress toward the goal of increasing home ownership among American families. PROGRAM CHANGES: 1. Current Demographic Statistics/Household Surveys/Survey of Income and Program Participation (-$9,000,000, - 98 FTE): The Census Bureau requests a decrease of $9.0 million and 98 FTE for a total of $34.0 million and 249 FTE. Of these decreases, $6.0 million and 35 FTE will reflect the early cancellation of some of the re-engineering activities for the SIPP, and a $3 million and 63 FTE reduction reflecting a reduction in sample size for waves 2 and beyond of the 2014 SIPP Panel. The reduction in FTE will be accomplished through a combination of attrition, not filling current vacancies, and fewer hours worked by field representatives on this project. The $3 million reduction reflects a 10 percent reduction to the sample size for waves 2 and beyond of the 2014 Panel, which will likely result in reducing the state reliability of estimates from the planned 20 to the 4 most populous states. The other $6 million reduction will result in the early cancellation of the following reengineering activities: • Conduct sufficient acquisition and evaluation of additional administrative records data on
government programs to evaluate the reporting of benefits in the SIPP data • Conduct interviewer performance and data quality monitoring using the Computer Assisted
Recorded Interviews implemented in the 2014 SIPP Panel data collection instrument.
CEN-71

• Develop a SIPP Research Panel instrument and sample to test potential changes to methodology and content for the SIPP program, which was recommended by the CNSTAT report on SIPP reengineering.
• Develop a framework for implementing adaptive design and multi-mode administration for the SIPP program.
• Conduct the additional necessary evaluation and data comparison activities for the data from the last waves of the 2008 panel and the first wave of the 2014 panel in support of the recommendations from stakeholders.
2. Inflationary Adjustment: The Current Demographic Statistics sub-program requests a decrease of $4.1 million and 5 FTE for a total request of $61,673,000 and 491 FTE to meet the cross-cutting program reductions necessary to offset increased funding requirements for adjustments-to-base (ATBs). These cross-cutting reductions will be captured by managing on-going administrative savings, managing the backfilling of vacated positions due to attrition, and carefully monitoring all travel and training.
CEN-72

PROGRAM CHANGE PERSONNEL DETAIL (Dollars in thousands)
Budget Program: Current surveys and statistics Sub-program: Current demographic statistics Program Change: Survey of income and program participation
Number Annual TotalTitle: Location Grade of Positions Salary SalariesStatistician Suitland, MD GS-14 -2 $106,263 -$212,526Program Manager Suitland, MD GS-14 -1 106,263 -106,263Statistician Suitland, MD GS-13 -4 89,924 -359,696Mathematical Statistician Suitland, MD GS-13 -1 89,924 -89,924Economist Suitland, MD GS-13 -2 89,924 -179,848IT Specialist Suitland, MD GS-12 -4 75,621 -302,484Statistician Suitland, MD GS-12 -3 75,621 -226,863Economist Suitland, MD GS-12 -1 75,621 -75,621Statistical Assistant Subtotal
Suitland, MD GS-07 -28 42,631 -1,193,668-46 -2,746,893
Distributed share of staff for centralized services Subtotal
-33 -1,727,250-79 -4,474,143
Less Lapse Total Full-time permanent:
0% 0 0-79 -4,474,143
2015 Pay AdjustmentSubtotal
0%-79
0-4,474,143
Personnel Data NumberFull-time Equivalent Employment
Full-time permanent -79Other than full-time permanentTotal
-19-98
Authorized Positions:Full-time permanent -79Other than full-time permanentTotal
-43-122
CEN-73
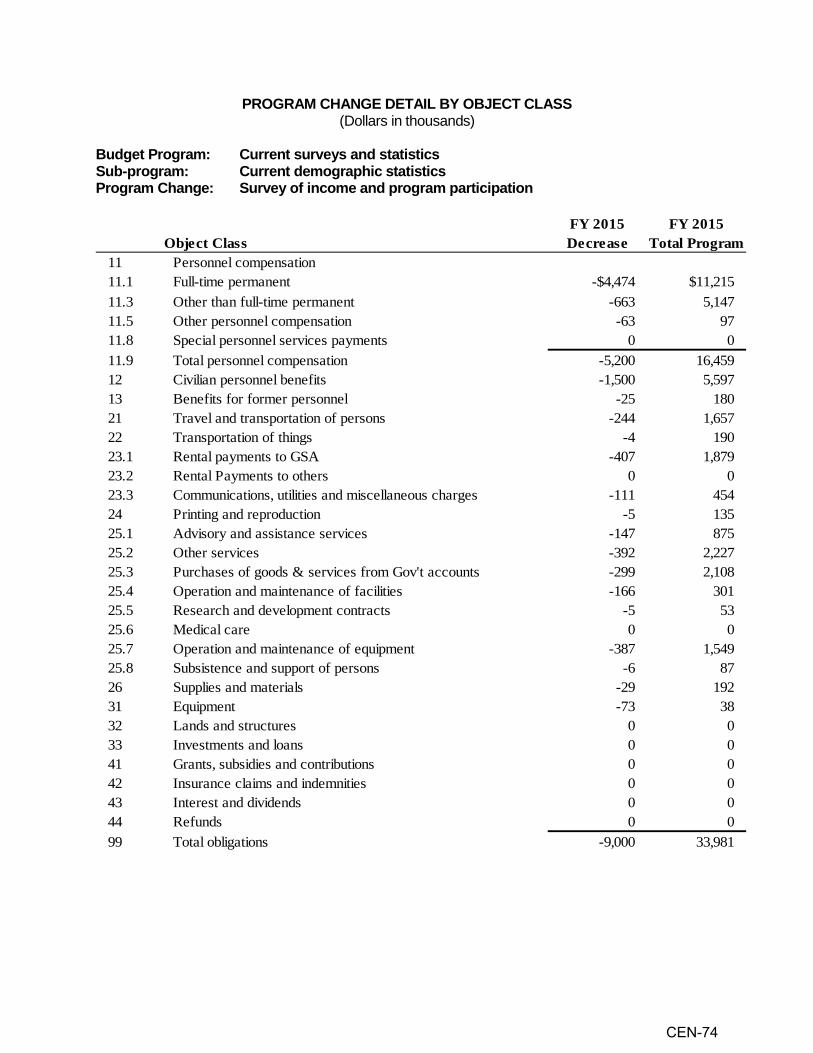
PROGRAM CHANGE DETAIL BY OBJECT CLASS (Dollars in thousands)
Budget Program: Current surveys and statistics Sub-program: Current demographic statistics Program Change: Survey of income and program participation
FY 2015 FY 2015Object Class Decrease Total Program
11 Personnel compensation11.1 Full-time permanent -$4,474 $11,215 11.3 Other than full-time permanent -663 5,147 11.5 Other personnel compensation -63 97 11.811.9
Special personnel services paymentsTotal personnel compensation
0 0 -5,200 16,459
12 Civilian personnel benefits -1,500 5,597 13 Benefits for former personnel -25 180 21 Travel and transportation of persons -244 1,657 22 Transportation of things -4 190 23.1 Rental payments to GSA -407 1,879 23.2 Rental Payments to others 0 0 23.3 Communications, utilities and miscellaneous charges -111 454 24 Printing and reproduction -5 135 25.1 Advisory and assistance services -147 875 25.2 Other services -392 2,227 25.3 Purchases of goods & services from Gov't accounts -299 2,108 25.4 Operation and maintenance of facilities -166 301 25.5 Research and development contracts -5 53 25.6 Medical care 0 0 25.7 Operation and maintenance of equipment -387 1,549 25.8 Subsistence and support of persons -6 87 26 Supplies and materials -29 192 31 Equipment -73 38 32 Lands and structures 0 0 33 Investments and loans 0 0 41 Grants, subsidies and contributions 0 0 42 Insurance claims and indemnities 0 0 43 Interest and dividends 0 0 4499
RefundsTotal obligations
0 0 -9,000 33,981
CEN-74

PROGRAM CHANGE DETAIL BY OBJECT CLASS (Dollars in thousands)
Budget Program: Current surveys and statistics Sub-program: Current demographic statistics Program Change: Inflationary adjustment
FY 2015 FY 2015Object Class FTE POS Decrease Total Program
11 Personnel compensation11.1 Full-time permanent -5 0 -$696 $21,360 11.3 Other than full-time permanent 0 0 -101 8,959 11.5 Other personnel compensation 0 242 11.811.9
Special personnel services paymentsTotal personnel compensation
0 0 -5 0 -797 30,561
12 Civilian personnel benefits -779 9,708 13 Benefits for former personnel 0 285 21 Travel and transportation of persons 0 2,714 22 Transportation of things -4 311 23.1 Rental payments to GSA -54 2,918 23.2 Rental Payments to others 0 3 23.3 Communications, utilities and miscellaneous charges -5 822 24 Printing and reproduction -4 238 25.1 Advisory and assistance services -16 1,780 25.2 Other services -26 3,432 25.3 Purchases of goods & services from Gov't accounts -2,378 3,699
25.4 Operation and maintenance of facilities -11 723 25.5 Research and development contracts -8 687 25.6 Medical care 0 0 25.7 Operation and maintenance of equipment -30 3,167 25.8 Subsistence and support of persons -2 173 26 Supplies and materials -5 342 31 Equipment -2 110 32 Lands and structures 0 0 33 Investments and loans 0 0 41 Grants, subsidies and contributions 0 0 42 Insurance claims and indemnities 0 0 43 Interest and dividends 0 0 4499
RefundsTotal obligations
0 0 -4,121 61,673
CEN-75
SUB-PROGRAM: Survey Development and Data Services
The objectives of the Survey Development and Data Services sub-program are to identify, adapt, develop, and promote new or improved methods and procedures for the design, conduct and analysis of all Census Bureau censuses and sample surveys.
General Research The program supports general research on problems related to the Census Bureau’s data collection efforts in censuses and sample surveys. These problems continually occur because we are measuring an increasingly complex population and economy. The challenges encompass maintaining adequate response rates, reducing burden of response to census and survey data collection, meeting complex data needs, and improving data quality. We look for solutions using tools from three disciplines: mathematical statistics, social and behavioral sciences, and computation sciences. Research topics include: disclosure avoidance, small area estimation, seasonal adjustment, sampling and estimation, survey design, record linkage, editing, imputation, usability testing, questionnaire pre-testing, cognitive testing, language and sociolinguistics, questionnaire design, interviewer behavior, and ethnography.
PROGRAM CHANGES:
1. Inflationary Adjustment: The Survey Development Data Services sub-program requests adecrease of $127,000 and 0 FTE for a total request of $2,600,000 and 14 FTE to meet the cross-cutting program reductions necessary to offset increased funding requirements for adjustments-to-base (ATBs). These cross-cutting reductions will be captured by managing on-going administrative savings, managing the backfilling of vacated positions due to attrition, and carefully monitoring all travel and training.
CEN-76

PROGRAM CHANGE DETAIL BY OBJECT CLASS (Dollars in thousands)
Budget Program: Current surveys and statistics Sub-program: Survey development and data services Program Change: Inflationary adjustment
FY 2015 FY 2015Object Class Decrease Total Program
11 Personnel compensation11.1 Full-time permanent -$13 $1,218 11.3 Other than full-time permanent -3 247 11.5 Other personnel compensation 0 9 11.811.9
Special personnel services paymentsTotal personnel compensation
0 0 -16 1,474
12 Civilian personnel benefits -27 470 13 Benefits for former personnel 0 13 21 Travel and transportation of persons 0 21 22 Transportation of things 0 2 23.1 Rental payments to GSA -2 120 23.2 Rental Payments to others 0 0 23.3 Communications, utilities and miscellaneous charges 0 30 24 Printing and reproduction 0 3 25.1 Advisory and assistance services -2 184 25.2 Other services 0 57 25.3 Purchases of goods & services from Gov't accounts -79 118 25.4 Operation and maintenance of facilities 0 31 25.5 Research and development contracts 0 1 25.6 Medical care 0 0 25.7 Operation and maintenance of equipment -1 56 25.8 Subsistence and support of persons 0 2 26 Supplies and materials 0 15 31 Equipment 0 3 32 Lands and structures 0 0 33 Investments and loans 0 0 41 Grants, subsidies and contributions 0 0 42 Insurance claims and indemnities 0 0 43 Interest and dividends 0 0 4499
RefundsTotal obligations
0 0 -127 2,600
CEN-77
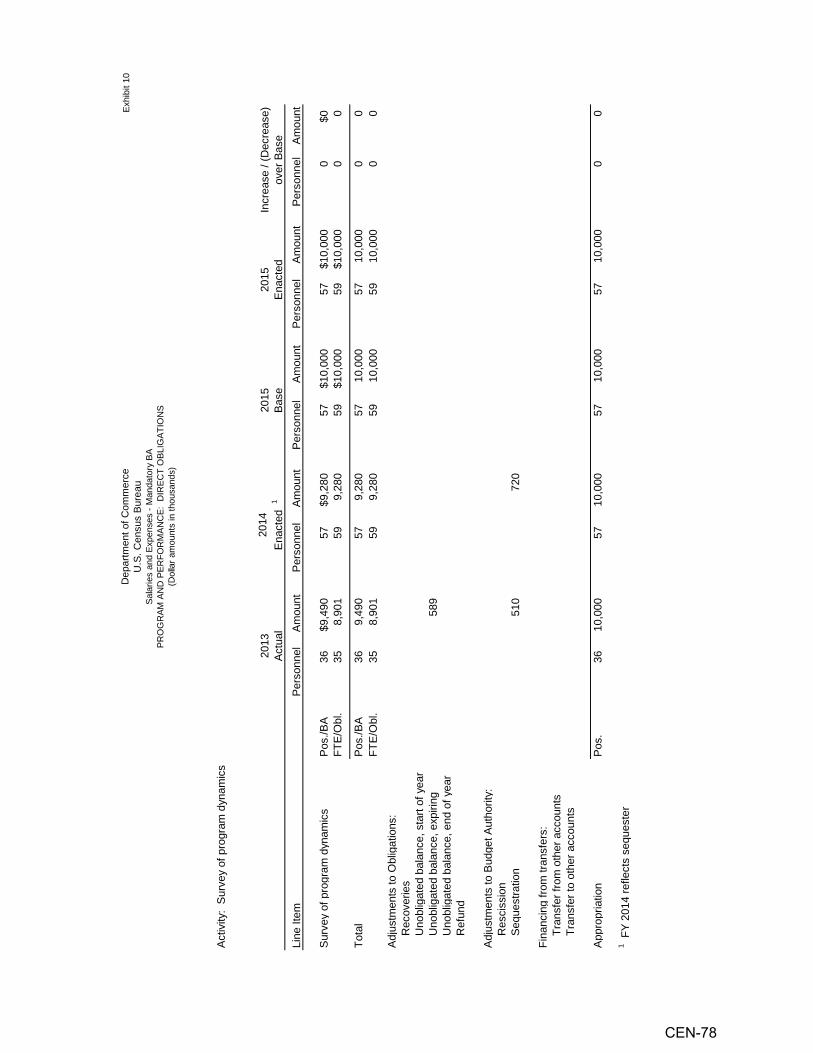
Dep
artm
ent o
f Com
mer
ceU
.S. C
ensu
s B
urea
uSa
larie
s an
d Ex
pens
es -
Man
dato
ry B
APR
OG
RAM
AN
D P
ERFO
RM
ANC
E: D
IREC
T O
BLIG
ATIO
NS
(Dol
lar a
mou
nts
in th
ousa
nds)
Exhi
bit 1
0
Act
ivity
: S
urve
y of
pro
gram
dyn
amic
s
2013
Act
ual
2014
Ena
cted
1 20
15B
ase
2015
Ena
cted
Incr
ease
/ ov
er (D
ecre
ase)
B
ase
Line
Item
Per
sonn
elA
mou
ntP
erso
nnel
Am
ount
Per
sonn
elA
mou
ntP
erso
nnel
Am
ount
Per
sonn
elA
mou
nt
Sur
vey
of p
rogr
am d
ynam
ics
Tota
l
Adj
ustm
ents
to O
blig
atio
ns:
Rec
over
ies
Uno
blig
ated
bal
ance
, sta
rt of
yea
r U
nobl
igat
ed b
alan
ce, e
xpiri
ng U
nobl
igat
ed b
alan
ce, e
nd o
f yea
r R
efun
d
Pos
./BA
FTE
/Obl
. 3
6 3
5$9
,490
8,9
0157 59
$9,2
809,
280
57 59$1
0,00
0$1
0,00
057 59
$10,
000
$10,
000
0 0$0 0
Pos
./BA
FTE
/Obl
. 3
6 3
5 9
,490
8,9
01
589
57 599,
280
9,28
057 59
10,0
0010
,000
57 5910
,000
10,0
000 0
0 0
Adj
ustm
ents
to B
udge
t Aut
horit
y: R
esci
ssio
n S
eque
stra
tion
510
720
Fina
ncin
g fro
m tr
ansf
ers:
Tra
nsfe
r fro
m o
ther
acc
ount
s T
rans
fer t
o ot
her a
ccou
nts
App
ropr
iatio
nP
os.
36
10,
000
57 1
0,00
057
10,
000
57 1
0,00
00
0
1 FY
2014
refle
cts
sequ
este
r
CEN-78
Exhibit 12 – 15
APPROPRIATION ACCOUNT: Salaries and Expenses - Mandatory
BUDGET PROGRAM: Survey of Program Dynamics
For FY 2015, the Census Bureau requests an increase of $0 and 0 FTE from the FY 2015 base for a total of $10,000,000 and 59 FTE for Survey of Program Dynamics.
BASE JUSTIFICATION:
Survey of Program Dynamics Overview
The Survey of Program Dynamics (SPD) program budget consists of one sub-program with the same name under the Mandatory Salaries and Expenses account. This sub-program contains one line item with the same name ($10.0 million and 59 FTE).
SUB-PROGRAM: Survey of Program Dynamics
The SPD program provides data necessary to determine the impact of welfare provisions of the Personal Responsibility and Work Opportunity Reconciliation Act of 1996 as revised by the 109th Congress. Baseline characteristics come from data already collected by the Survey of Income and Program Participation (SIPP). The funds for SPD were authorized until September 30, 2013 by the Consolidated and Further Continuing Appropriations Act, 2013 (P.L. 113-6).
The goal of SPD is to provide policymakers with relevant, accurate, timely, and cost-effective socio-economic data and information, which can be used by federal and state public policymakers to evaluate the effects of the Personal Responsibility and Work Opportunity Reconciliation Act of 1996 that established the Temporary Assistance for Needy Families Program, (P.L. 112-96, Extension of P.L. 108-308).
The SPD mandatory funding is used to improve the ability of the SIPP program to provide a source of detailed socioeconomic data from a national sample of households with a focus on the low-income population, which is more likely to receive benefits or assistance from welfare programs. The SPD mandatory funding contributes to the ability of the SIPP program to provide state reliable estimates for the poverty population in 20 states. In FY 2015 the Census Bureau plans to use the mandatory funds to continue to support the SIPP sample and to process and disseminate data from the initial waves of the 2014 SIPP Panel in support of measuring the impact of the welfare provisions of the Personal Responsibility and Work Opportunity Act mentioned above. The SPD program has received the same level of annual funding with each extension of the 1996 law.
PROGRAM CHANGES:
No program change requested for FY 2015.
CEN-79

Dep
artm
ent o
f Com
mer
ceU
.S. C
ensu
s B
urea
uS
alar
ies
and
Exp
ense
s - M
anda
tory
BA
PR
OG
RA
M A
ND
PE
RFO
RM
AN
CE
: D
IRE
CT
OB
LIG
ATI
ON
S(D
olla
r am
ount
s in
thou
sand
s)
Exh
ibit
10
Act
ivity
: S
tate
chi
ldre
n's
heal
th in
sura
nce
prog
ram
2013
Act
ual
2014
Ena
cted
120
15B
ase
2015
Ena
cted
Incr
ease
/ (D
ecre
ase)
over
Bas
eLi
ne It
emP
erso
nnel
Am
ount
Per
sonn
elA
mou
ntP
erso
nnel
Am
ount
Per
sonn
elA
mou
ntP
erso
nnel
Am
ount
Sta
te c
hild
ren'
s he
alth
insu
ranc
e pr
ogra
m
Tota
l
Adj
ustm
ents
to O
blig
atio
ns:
R
ecov
erie
s
Uno
blig
ated
bal
ance
, sta
rt of
yea
r
Uno
blig
ated
bal
ance
, exp
iring
U
nobl
igat
ed b
alan
ce, e
nd o
f yea
r
Ref
und
Adj
ustm
ents
to B
udge
t Aut
horit
y:
Res
ciss
ion
S
eque
stra
tion
Fina
ncin
g fro
m tr
ansf
ers:
T
rans
fer f
rom
oth
er a
ccou
nts
T
rans
fer t
o ot
her a
ccou
nts
App
ropr
iatio
n1 F
Y 2
014
refle
cts
sequ
este
r
Pos
./BA
FTE
/Obl
.45 203
$18,
980
18,9
5410
622
9$1
8,56
020
,357
106
229
$20,
000
20,0
0010
622
9$2
0,00
020
,000
0 0$0 0
Pos
./BA
FTE
/Obl
.45 203
18,9
8018
,954
(1,7
97)
261,
797
1,02
0
106
229
18,5
6020
,357
(1,7
97)
1,44
0
106
229
20,0
0020
,000
106
229
20,0
0020
,000
0 00 0
Pos
.45
20,0
0010
620
,000
106
20,0
0010
620
,000
00
CEN-80
Exhibit 12 – 15
APPROPRIATION ACCOUNT: Salaries and Expenses - Mandatory
BUDGET PROGRAM: State Children’s Health Insurance Program
For FY 2015, the Census Bureau requests an increase of $0 and 0 FTE from the FY 2015 base for a total of $20,000,000 and 229 FTE for State Children’s Health Insurance Program.
BASE JUSTIFICATION:
State Children’s Health Insurance Program Overview
The State Children’s Health Insurance Program (SCHIP) budget consists of one sub-program with the same name under the Mandatory Salaries and Expenses account. This sub-program contains one line item with the same name ($20.0 million and 229 FTE).
In FY 2014, base resources were re-aligned among line items within the program, to reflect a revised method of budgeting for certain program management costs. These costs had been previously distributed to each line item and project within the program, but now may only be planned within one or more line items. There is no net impact to the program's budget request.
SUB-PROGRAM: State Children’s Health Insurance Program
Under the SCHIP, Census Bureau survey data are used to allocate funds to states based on the number of children without health insurance living in low-income families. Allocations are based on statistics from the Annual Social and Economic Supplement to the Current Population Survey (CPS). The Census Bureau will make improvements in the reliability of the state-level data used to estimate changes from one year to the next in the number of low-income children without health insurance coverage. These improvements potentially include making a transition from the CPS to the American Community Survey (ACS) as a basis for SCHIP allocations. Health insurance questions were added to the ACS in 2008.
The goal of this mandatory program is to produce statistically reliable annual data for each state on the number of low-income children who do not have health insurance coverage.
This program was established and funded through mandatory appropriation by the Medicare, Medicaid and State Children’s Health Insurance Program Bill (P.L. 106-113). The program uses adjustments to the CPS to increase the reliability of state-level estimates of the number of uninsured low-income children. The adjustments include, where appropriate, expanding the number of households included in the survey, collecting data in additional months, and exploring alternative methods to enhance state-level estimates by incorporating data from other sources. The SCHIP program was reauthorized in 2009 (P.L.111-3) and provided an additional $10.0 million to the Census Bureau to cover rising data collection costs and to improve state estimates of children’s health insurance coverage.
The monthly CPS sample was expanded by about 10,000 eligible households. This expansion allowed the Census Bureau to meet the requirement of the SCHIP legislation to improve state estimates of children who live in low-income families and lack health insurance, which are produced from the Census Bureau’s Annual Social and Economic (ASEC) supplement to the CPS. The expansion also allowed the Census Bureau to conduct an ASEC interview in February and April of each year with about 18,000 households that had completed their eighth month in sample interview in August, September, and October. Including another 5,000 Hispanic households that are selected
CEN-81

from the prior November CPS sample in order to increase the accuracy of these estimates, these changes effectively increased the number of sample cases on which the ASEC generates annual estimates to 83,000. PROGRAM CHANGES: No program change is requested for FY 2015.
CEN-82
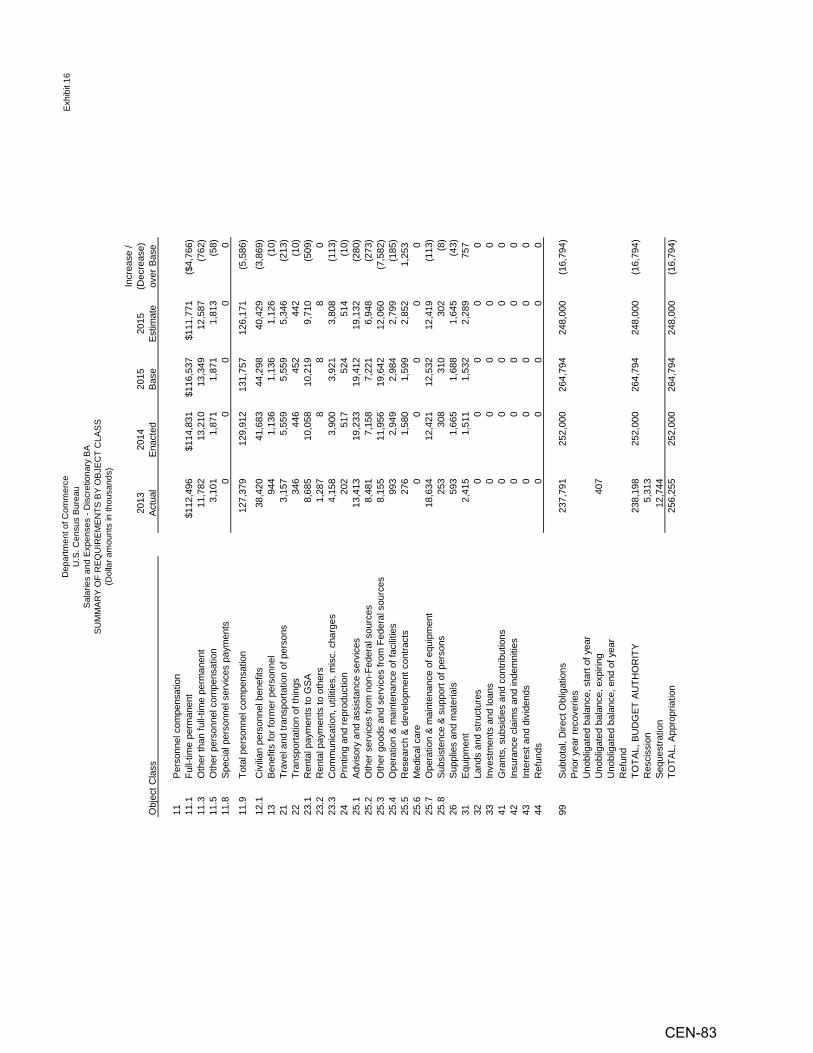
AS
SL
A C B T
onar
y EC
)
e BJ
c i Oeter ands
m eau rcs
ur S B
Y
om Di hous
B Tn
t
C -us es E
N i
of
ent
ens
m pens EM s
R ount
C Ix.tep
ar
and
EUS. am
U EQ
R lar
D olF D O (ie
sar Y
alS A
RM
MS
U
Exh
ibit
16
Incr
ease
/ 20
13
2014
20
15
2015
(D
ecre
ase)
O
bjec
t
11
Cla
ss
Per
sonn
el c
ompe
nsat
ion
Act
ual
Ena
cted
Bas
eE
stim
ate
over
Bas
e
11.1
Full-
time
perm
anen
t$1
12,4
96$1
14,8
31$1
16,5
37$1
11,7
71($
4,76
6)11
.3O
ther
than
full-
time
perm
anen
t11
,782
13,2
1013
,349
12,5
87(7
62)
11.5
Oth
er p
erso
nnel
com
pens
atio
n3,
101
1,87
11,
871
1,81
3(5
8)11
.8
11.9
Spe
cial
per
sonn
el s
ervi
ces
paym
ents
Tota
l per
sonn
el c
ompe
nsat
ion
0
127,
379
0
129,
912
0
131,
757
0
126,
171
0
(5,5
86)
12.1
Civ
ilian
pers
onne
l ben
efits
38,4
2041
,683
44,2
9840
,429
(3,8
69)
13B
enef
its fo
r for
mer
per
sonn
el94
41,
136
1,13
61,
126
(10)
21Tr
avel
and
tran
spor
tatio
n of
per
sons
3,15
75,
559
5,55
95,
346
(213
)22
Tran
spor
tatio
n of
thin
gs34
644
645
244
2(1
0)23
.1R
enta
l pay
men
ts to
GS
A8,
685
10,0
5810
,219
9,71
0(5
09)
23.2
Ren
tal p
aym
ents
to o
ther
s1,
287
88
80
23.3
Com
mun
icat
ion,
util
ities
, mis
c. c
harg
es4,
158
3,90
03,
921
3,80
8(1
13)
24P
rintin
g an
d re
prod
uctio
n20
251
752
451
4(1
0)25
.1A
dvis
ory
and
assi
stan
ce s
ervi
ces
13,4
1319
,233
19,4
1219
,132
(280
)25
.2O
ther
ser
vice
s fro
m n
on-F
eder
al s
ourc
es8,
481
7,15
87,
221
6,94
8(2
73)
25.3
Oth
er g
oods
and
ser
vice
s fro
m F
eder
al s
ourc
es8,
155
11,9
5619
,642
12,0
60(7
,582
)25
.4O
pera
tion
& m
aint
enan
ce o
f fac
ilitie
s99
32,
949
2,98
42,
799
(185
)25
.5R
esea
rch
& d
evel
opm
ent c
ontra
cts
276
1,58
01,
599
2,85
21,
253
25.6
Med
ical
car
e0
00
00
25.7
Ope
ratio
n &
mai
nten
ance
of e
quip
men
t18
,634
12,4
2112
,532
12,4
19(1
13)
25.8
Sub
sist
ence
& s
uppo
rt of
per
sons
253
308
310
302
(8)
26S
uppl
ies
and
mat
eria
ls59
31,
665
1,68
81,
645
(43)
31E
quip
men
t2,
415
1,51
11,
532
2,28
975
732
Land
s an
d st
ruct
ures
00
00
033
Inve
stm
ents
and
loan
s0
00
00
41G
rant
s, s
ubsi
dies
and
con
tribu
tions
00
00
042
Insu
ranc
e cl
aim
s an
d in
dem
nitie
s0
00
00
43In
tere
st a
nd d
ivid
ends
00
00
044
Ref
unds
0
237,
791
0
252,
000
0
264,
794
0
248,
000
0
(16,
794)
99S
ubto
tal,
Dire
ct O
blig
atio
nsP
rior y
ear r
ecov
erie
sU
nobl
igat
ed b
alan
ce, s
tart
of y
ear
Uno
blig
ated
bal
ance
, exp
iring
407
Uno
blig
ated
bal
ance
, end
of y
ear
Ref
und
TOTA
L, B
UD
GE
T A
UTH
OR
ITY
238,
198
252,
000
264,
794
248,
000
(16,
794)
Res
ciss
ion
5,31
3S
eque
stra
tion
TOTA
L, A
ppro
pria
tion
12,7
4425
6,25
525
2,00
026
4,79
424
8,00
0(1
6,79
4)
CEN-83

Dep
artm
ent o
f Com
mer
ceU
.S. C
ensu
s Bu
reau
Sala
ries
and
Expe
nses
- D
iscr
etio
nary
BA
SUM
MAR
Y O
F R
EQU
IREM
ENTS
BY
OBJ
ECT
CLA
SS
Exhi
bit 1
6
Incr
ease
/ 20
1320
14
2015
2015
(Dec
reas
e)
Pers
onne
l fin
ance
d fro
m d
irect
obl
igat
ions
Full-
Tim
e eq
uiva
lent
em
ploy
men
t:
Actu
alEn
acte
dBa
seEs
timat
eov
er B
ase
F
ull-t
ime
perm
anen
t1,
317
1,47
01,
475
1,40
8(6
7)
Oth
er th
an fu
ll-tim
e pe
rman
ent
T
otal
404
1,72
1
329
1,79
9
329
1,80
4
311
1,71
9
(18)
(85)
Auth
oriz
ed P
ositi
ons:
F
ull-t
ime
perm
anen
t1,
423
1,68
01,
680
1,62
4(5
6)
Oth
er th
an fu
ll-tim
e pe
rman
ent
Tota
l
752
2,17
5
792
2,47
2
792
2,47
2
750
2,37
4
(42)
(98)
CEN-84

Dep
artm
ent o
f Com
mer
ceU
.S. C
ensu
s B
urea
uS
alar
ies
and
Exp
ense
s - M
anda
tory
BA
SU
MM
AR
Y O
F R
EQ
UIR
EM
EN
TS B
Y O
BJE
CT
CLA
SS
(Dol
lar a
mou
nts
in th
ousa
nds)
Exh
ibit
16
Incr
ease
/ 20
13
2014
2015
2015
(Dec
reas
e)
Obj
ect C
lass
Act
ual
Ena
cted
1B
ase
Ena
cted
over
Bas
e
11P
erso
nnel
com
pens
atio
n11
.1Fu
ll-tim
e pe
rman
ent
$6,5
22$1
0,72
9$1
0,72
9$1
0,72
9$0
11.3
Oth
er th
an fu
ll-tim
e pe
rman
ent
6,64
04,
573
4,57
34,
573
011
.5O
ther
per
sonn
el c
ompe
nsat
ion
649
144
144
144
011
.8S
peci
al p
erso
nnel
ser
vice
s pa
ymen
ts0
00
00
11.9
Tota
l per
sonn
el c
ompe
nsat
ion
13,8
1115
,446
15,4
4615
,446
0
12.1
Civ
ilian
pers
onne
l ben
efits
3,90
64,
479
4,47
94,
479
013
Ben
efits
for f
orm
er p
erso
nnel
3151
5151
021
Trav
el a
nd tr
ansp
orta
tion
of p
erso
ns2,
072
3,38
21,
585
1,58
50
22Tr
ansp
orta
tion
of th
ings
118
127
127
127
023
.1R
enta
l pay
men
ts to
GS
A19
488
488
488
40
23.2
Ren
tal p
aym
ents
to o
ther
s31
225
225
225
023
.3C
omm
unic
atio
n, u
tiliti
es, m
isc.
cha
rges
683
345
345
345
024
Prin
ting
and
repr
oduc
tion
7078
7878
025
.1A
dvis
ory
and
assi
stan
ce s
ervi
ces
2,09
247
347
347
30
25.2
Oth
er s
ervi
ces
from
non
-Fed
eral
sou
rces
1,13
01,
454
3,61
43,
614
025
.3O
ther
goo
ds a
nd s
ervi
ces
from
Fed
eral
sou
rces
268
921
921
921
025
.4O
pera
tion
& m
aint
enan
ce o
f fac
ilitie
s13
115
815
815
80
25.5
Res
earc
h &
dev
elop
men
t con
tract
s2
33
30
25.6
Med
ical
car
e0
00
00
25.7
Ope
ratio
n &
mai
nten
ance
of e
quip
men
t2,
439
1,22
91,
229
1,22
90
25.8
Sub
sist
ance
& s
uppo
rt of
per
sons
8511
811
811
80
26S
uppl
ies
and
mat
eria
ls57
122
122
122
031
Equ
ipm
ent
735
142
142
142
032
Land
s an
d st
ruct
ures
00
00
033
Inve
stm
ents
and
loan
s0
00
00
41G
rant
s, s
ubsi
dies
and
con
tribu
tions
00
00
042
Insu
ranc
e cl
aim
s an
d in
dem
nitie
s0
00
00
43In
tere
st a
nd d
ivid
ends
00
00
044
Ref
unds
00
00
0
99S
ubto
tal,
Dire
ct O
blig
atio
ns27
,855
29,6
3730
,000
30,0
000
Prio
r yea
r rec
over
ies
Uno
blig
ated
bal
ance
, sta
rt of
yea
r(1
,797
)(1
,797
)U
nobl
igat
ed b
alan
ce, e
xpiri
ng61
5U
nobl
igat
ed b
alan
ce, e
nd o
f yea
r1,
797
Ref
und
TOTA
L, B
UD
GE
T A
UTH
OR
ITY
28,4
7027
,840
30,0
0030
,000
0R
esci
ssio
nS
eque
stra
tion
1,53
02,
160
TOTA
L, A
ppro
pria
tion
30,0
0030
,000
30,0
0030
,000
01 F
Y 2
014
refle
cts
sequ
este
r
CEN-85
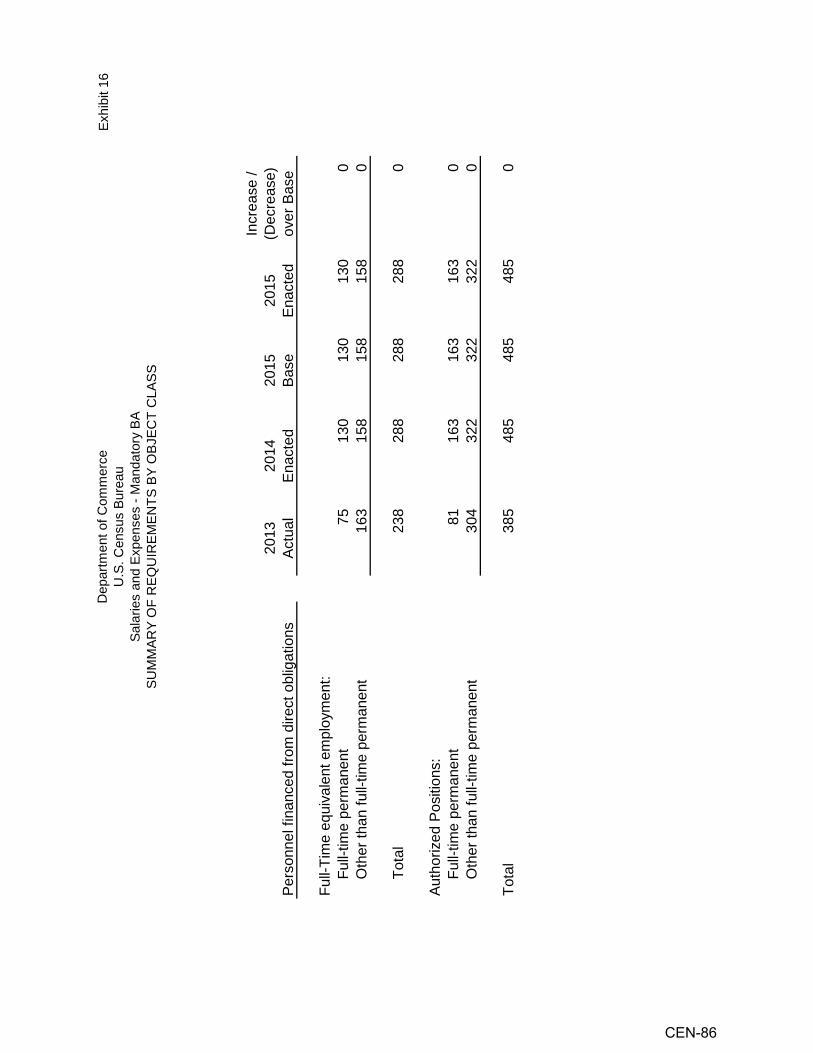
ASS
L CA T
By ECore BJ
c Oerm ea
u
S BY
om ur Man
dat
B - T
C esus EN
of
ens
pens
EMent
R
m C x I.t U
epar S.
U and
EEQ
RD es Fiar O
al YS AR
MM
SU
Exhi
bit 1
6
Pers
onne
l fin
ance
d fro
m d
irect
obl
igat
ions
2013
Actu
al20
14En
acte
d20
15Ba
se20
15En
acte
d
Incr
ease
/ (D
ecre
ase)
ov
er B
ase
Full-
Tim
e eq
uiva
lent
em
ploy
men
t:
Ful
l-tim
e pe
rman
ent
7513
013
013
00
O
ther
than
full-
time
perm
anen
t16
315
815
815
80
T
otal
238
288
288
288
0
Auth
oriz
ed P
ositi
ons:
F
ull-t
ime
perm
anen
t81
163
163
163
0
Oth
er th
an fu
ll-tim
e pe
rman
ent
304
322
322
322
0
Tota
l38
548
548
548
50
CEN-86
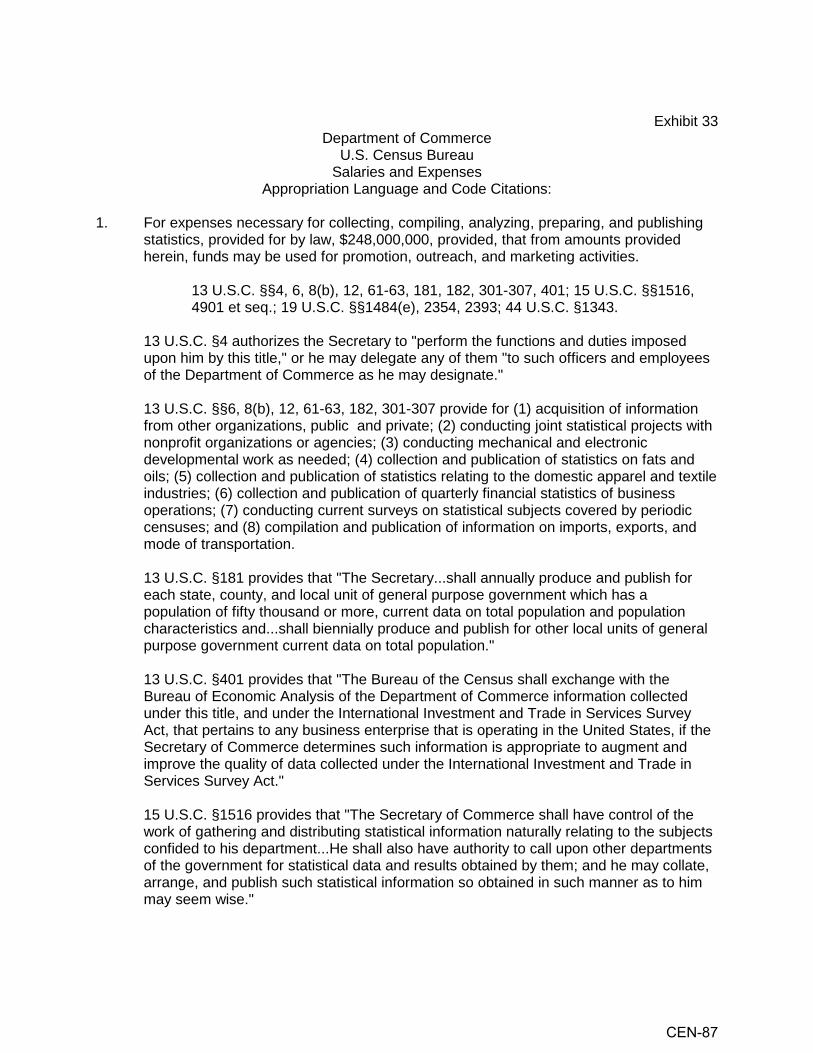
Exhibit 33
Department of Commerce U.S. Census Bureau
Salaries and Expenses Appropriation Language and Code Citations:
1. For expenses necessary for collecting, compiling, analyzing, preparing, and publishing
statistics, provided for by law, $248,000,000, provided, that from amounts provided herein, funds may be used for promotion, outreach, and marketing activities.
13 U.S.C. §§4, 6, 8(b), 12, 61-63, 181, 182, 301-307, 401; 15 U.S.C. §§1516, 4901 et seq.; 19 U.S.C. §§1484(e), 2354, 2393; 44 U.S.C. §1343.
13 U.S.C. §4 authorizes the Secretary to "perform the functions and duties imposed upon him by this title," or he may delegate any of them "to such officers and employees of the Department of Commerce as he may designate."
13 U.S.C. §§6, 8(b), 12, 61-63, 182, 301-307 provide for (1) acquisition of information from other organizations, public and private; (2) conducting joint statistical projects with nonprofit organizations or agencies; (3) conducting mechanical and electronic developmental work as needed; (4) collection and publication of statistics on fats and oils; (5) collection and publication of statistics relating to the domestic apparel and textile industries; (6) collection and publication of quarterly financial statistics of business operations; (7) conducting current surveys on statistical subjects covered by periodic censuses; and (8) compilation and publication of information on imports, exports, and mode of transportation.
13 U.S.C. §181 provides that "The Secretary...shall annually produce and publish for each state, county, and local unit of general purpose government which has a population of fifty thousand or more, current data on total population and population characteristics and...shall biennially produce and publish for other local units of general purpose government current data on total population."
13 U.S.C. §401 provides that "The Bureau of the Census shall exchange with the Bureau of Economic Analysis of the Department of Commerce information collected under this title, and under the International Investment and Trade in Services Survey Act, that pertains to any business enterprise that is operating in the United States, if the Secretary of Commerce determines such information is appropriate to augment and improve the quality of data collected under the International Investment and Trade in Services Survey Act."
15 U.S.C. §1516 provides that "The Secretary of Commerce shall have control of the work of gathering and distributing statistical information naturally relating to the subjects confided to his department...He shall also have authority to call upon other departments of the government for statistical data and results obtained by them; and he may collate, arrange, and publish such statistical information so obtained in such manner as to him may seem wise."
CEN-87

15 U.S.C. §4901 et seq. provides that "The Secretary [of Commerce] shall establish the [National Trade] Data Bank. The Secretary shall manage the Data Bank."
19 U.S.C. §1484(e) provides that "The Secretary of the Treasury, the Secretary of Commerce, and the United States International Trade Commission are authorized and directed to establish...an enumeration of articles...comprehending all merchandise imported into the United States and exported from the United States, and shall seek, in conjunction with statistical programs for domestic production and programs for achieving international harmonization of trade statistics, to establish the comparability thereof with such enumeration of articles."
19 U.S.C. §2354 provides that "Whenever the [International Trade] Commission begins an investigation...with respect to an industry, the Commission shall immediately notify the Secretary [of Commerce] of such investigation, and the Secretary shall immediately begin a study of:
(1) the number of firms in the domestic industry producing the like or directly
competitive article which have been or are likely to be certified as eligible for adjustment assistance, and
(2) the extent to which the orderly adjustment of such firms to the import
competition may be facilitated through the use of existing programs."
19 U.S.C. §2393 provides that "The Secretary of Commerce and the Secretary of Labor shall establish and maintain a program to monitor imports of articles into the United States which will reflect changes in the volume of such imports, the relation of such imports to changes in domestic production, changes in employment within domestic industries producing articles like or directly competitive with such imports, and the extent to which such changes in production and employment are concentrated in specific geographic regions of the United States." 44 U.S.C. §1343 provides that “In addition to the usual number of the Statistical Abstract of the United States, twelve thousand copies shall be printed: three thousand for the Senate, six thousand for the House of Representatives, and three thousand for distribution by the Secretary of Commerce.”
CEN-88

5 tbi 80
6)
227
227)
207
207
476
877
e) ount
090
090
490)
490)
600
600
201)
201) 0 0
808
808
607
607
hi ons
2, 6, mx ( A $3, 3, ( ( 2, 2, (i 2, (
(
E t 266,
961,
c gat
698,
eas
r 223,
223,
223,
ee $694
,
223,
ibl ec
Dir asO D( B
688
007
695
688 /0 ere
onne
l
89)
13)
12) 5) 18) 0 0 0 0
ov
(
eas ( ( ( 10
1)( 86
891
8
868
918
5,4, 4, 1, (s r er ncE I P
FT
y 000
207
207
806)
476
877
ount
323
323
093
093
416
416
926
926 0 0
000
000
926
926
tud
get i
$692
, 6,
hor
698, 2,
266, m
$119
,11
9, 9, 9,
128, 9,( 961,
A
e 128, 9,
689,
689,
698,
698,
ut taB A
0 2015 m
131
131
897
028 i
Est
641
642 68 61 709
703 66 62 0 0
731
437
797
499
ons
3, 3, 4, onne
l
i s 2, 4, 2, 4,ti er
os P
P
ount
233
233
583
583
816
816
127
127 0 0
192
192
319
319
m
$116
, 9, 9,A 116,
125,
125, 10,
10,
465,
465,
475,
475,
2015 se
Ba
62 0 0
S onne
l
730
655 80 66 810
721 66 863
519
929
581
s 1, 3, 1, 3,
NT
erE P
s Mam R
E )
ec ogr UI
r ount
577
400
926
156 0
er Q ands
000
310
400
887
513
287
306
213
975
m eau
P RE m
uran
d 9,A
B $114
,11
4, 9,
om 123,
123, 9, hous
10,
t 463,
463,
473,
473,
C us
es UR
CE n i
ens s
us O 2014
ed
of t
ount na
c
ent
ens S EC 80m 655 66 . on
nel
730
810
721 66 62 0 0
863
519
929
581
t
epar S C R
E
s 1, 3, 1, 3, am
. c er
U F ar
O P
D odi l
ol R
Y i D
er (
P AM
ount
384
230
636
462
020
692
389
226
153
870
412
421
954
517
UM
m 9, 9,S A
$131
,13
2, 10,
10,
142,
142,
274,
284, 94,
98,
377,
392,
2013 ua
l
tcA
onne
l
708
818 76 73 784
891 57 57 194
399
485
480
736
936
s 1, 2, 1, 2,
erP
. . . . . . .
BA l
BA l lb b
O BA l b
O O BA
O BA l
BA lb b b b
O O O/ BA l
/ / / / / // / / / / / /
s. E s. E s. E s. E s. E s. E s. E
Po
FT Po
FT Po
FT Po
FT Po
FT Po
FT Po
FT
sea
ry h or tii wpr
ent y
om hang
es
:t esse i at
m C ir m am amf bas vtt s: i
us am am
es ubac m ogr t
o ogr
t es ogr
dj ra
anc pr prs cs A ogr
g pr / s
ent r y sy ro us usal
onar P ti pB ap
hi
m t v ent
cit
ed t en
s
ens
usga
tdj eq
ues
2015
i yt cs
i nm
siv ci acti
i at ogr
c
st er
at us t
l : e) byt
ac
i
gov s
ed
t
A R nf at a ens
ci s dem al al
tno
bl20
15
e on
2015
I stm by
nac c
es c als enni
as
i c enni
l t s i i of s i aphi
ec ecal alE U mor E par al
: ogr
2014
B us ens
D :s us onom D
esl pl 2015
o (:s om ubt
ubt
esl pl 2015
ot otn
c ens c
us er
C s Eco em ntE C S D I 2010
2020
otub
tS 2 5 6 11
7
118
119
age
9 9 9
N-
N-
N- - - -
N N N
o. E E
P N CE
CE
CE E
C C C
CEN-89

ount 0 0 0
e) $189
)18
9) 0
248
248
404
404
670
670 0 0 0
551
221
eas m (( 3, 3,A 34,
34,
263, 1,
r 263,
265,
eec asD( B / ere 0 45 42 85 65
eas ov onne
l
0
897
007
897
s 1,r erncI Pou
nt
602
602
000
000
933
933
877
877 0 0 0 0 0 0 0 0 0
551
428
m $9, 9,A 60,
60,
64,
64,
961, 1,
e 961,
963,
t20
15 ami
Est
onne
l
63 56 374
372 85 65 028
695
028
s 4, 5, 4,
erP
ount
791
791
752
752
529
529
207
207 0 0 0 0 0 0 0 0 0 0
207
mA $9
, 9, 56,
56,
30,
30,
698,
698,
698,
2015 se
Ba
onne
l
63 56 329
330 0 0
131
688
131
s 3, 4, 3,
erP
ount
602
161
613
650
172
554
000
227 0
227) 0 0 0 0 0 0 0
000
000
mA $9
,10
,
55,
55,
30,
30,
692,
694, 2, 1,(
693,
2014
edtna
cE
onne
l
63 56 0 0 329
330
131
688
131
s 3, 4, 3,
erP
ount
148
795
434
377
172
006
728
387
071)
558) 0
255
211)
926
476
750
000)
000
954
m $9, 9, 30, 5,A 61,
68,
30,
620,
643, 8, 2, 1,( 12,
( 13,
32,
18,
( ( 649,
2013 ua
ltc
A
onne
l
54 55 313
317 0 0
887
199
887
s 2, 4, 2,
erP
. . . .
BA lb
O BA l
BA l
BA lb b b
O O O/ / / // / / /
s. E s. E s. E s. E s.
Po
FT Po
FT Po
FT Po FT Po
h ti gn
w i
y ear
t y ear
ngy
nded :i ed
es
yv ti of r s
e
itub
ac
i r of it: ar pi hor
ount spl c
ons t es
am ut css ex r :s
em
end
A s/ s i ac ount
e, e, e, e, cy s tv s gat er ti f ac oni i y he
r
t ey t it y anc
ats bl anc
anc
anc
ac v ii otv udge
t
ans
O ri t her
bal
byt ur ba
lba
l
bal
B
ac s ng
ot uppo
r
o on opr
i t omc s s es ed
ed o it
on n o at r
by es s ed
ed
iga
tga
tga
t s om
aphi
gat o f tc
ent
er ent r pp
r
ssi r ft er
und
eque
s er As
aphi oc ng
al ovi i ii s S i f f ,
par
ot ogr L mt nobl alpr
em
e ans
eogr ef
om
a nobl i
A otT nobl
nobl mt sci
ec ans
us us
ubt r rR U U U R U R Sat TO dj dj nanc
T
C D G D i ubt
s T A A F S
162
168
177
- - -
N N N
E E E
C C C
CEN-90

P s
am
)ec NG
er ands
eau rogr
m NC
I
om ur B C a
nd P
NA ho
usI n t
us F
of es iF
us O
ent
ens s
ount
RY
m C ens
.t A
epar S C. M a
m
cU
M arUod
i lol
D Seri D(
Exh
ibit
7
2013
Actu
al20
14
Enac
ted
2015
Base
2015
Estim
ate
Incr
ease
/ (D
ecre
ase)
ov
er B
ase
Tota
l Obl
igat
ions
$643
,387
$694
,227
$698
,207
$961
,877
$263
,670
Fina
ncin
g: O
ffset
ting
colle
ctio
ns fr
om:
F
eder
al F
unds
0
00
00
Tr
ust F
unds
00
00
0
Non
-fede
ral s
ourc
es0
00
00
Rec
over
ies
(8,0
71)
00
00
Uno
blig
ated
bal
ance
, sta
rt of
yea
r(1
2,55
8)(2
,227
)0
00
Uno
blig
ated
bal
ance
, exp
iring
00
00
0U
nobl
igat
ed b
alan
ce, e
nd o
f yea
r2,
255
00
00
Ref
und
(5,2
11)
00
00
Uno
blig
ated
bal
ance
, res
cind
ed92
60
00
0
Dis
cret
iona
ry B
udge
t Aut
horit
y62
0,72
869
2,00
069
8,20
796
1,87
726
3,67
0
R
esci
ssio
n13
,476
00
00
S
eque
stra
tion
32,7
500
00
0
Fina
ncin
g:
Tra
nsfe
r fro
m o
ther
acc
ount
s(1
8,00
0)0
00
0
Tra
nsfe
r to
othe
r acc
ount
s 1,
000
1,00
00
1,55
11,
551
Tota
l, D
iscr
etio
nary
App
ropr
iatio
n64
9,95
469
3,00
069
8,20
796
3,42
826
5,22
1
CEN-91
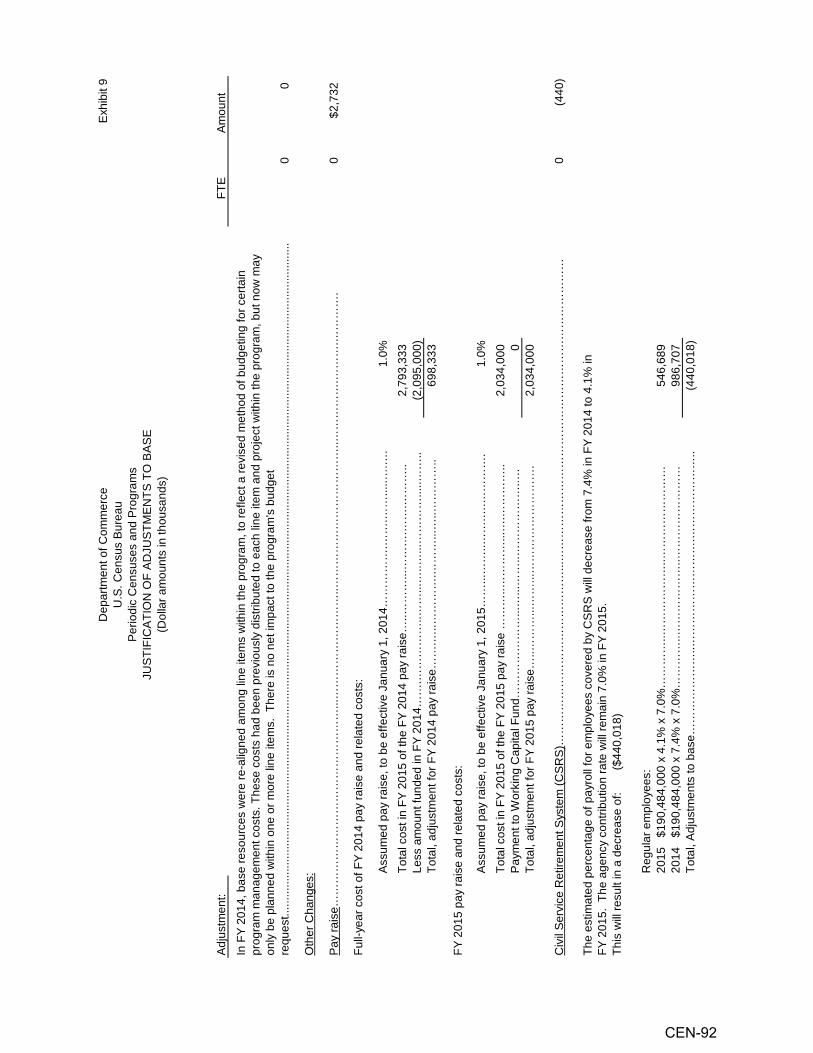
Exh
ibit
9
Adj
ustm
ent:
FTE
Am
ount
00
0$2
,732
Ful l-
year
cos
t of F
Y 20
14 p
ay ra
ise
and
rela
ted
cost
s:
1.0%
2,79
3,33
3
(2,0
95,0
00)
698,
333
FY 2
015
pay
rais
e an
d re
late
d co
sts:
1.0%
2,03
4,00
0
0
2,03
4,00
0
0(4
40)
($44
0,01
8)
546,
689
986,
707
(440
,018
)
Tota
l, A
djus
tmen
ts to
bas
e……
……
……
…..…
……
……
……
……
.……
……
……
…..
2014
$1
90,4
84,0
00 x
7.4
% x
7.0
%…
……
…..…
……
……
…..…
……
……
……
…20
15
$190
,484
,000
x 4
.1%
x 7
.0%
……
……
..……
……
……
..……
……
……
……
Reg
ular
em
ploy
ees:
The
estim
ated
per
cent
age
of p
ayro
ll fo
r em
ploy
ees
cove
red
by C
SR
S w
ill de
crea
se fr
om 7
.4%
in F
Y 20
14 to
4.1
% in
FY
201
5. T
he a
genc
y co
ntrib
utio
n ra
te w
ill re
mai
n 7.
0% in
FY
2015
. U.S
. Cen
sus
Bur
eau
Oth
er C
hang
es:
JUS
TIFI
CA
TIO
N O
F A
DJU
STM
EN
TS T
O B
AS
EP
erio
dic
Cen
suse
s an
d P
rogr
ams
Dep
artm
ent o
f Com
mer
ce
(Dol
lar a
mou
nts
in th
ousa
nds)
In F
Y 20
14, b
ase
reso
urce
s w
ere
re-a
ligne
d am
ong
line
item
s w
ithin
the
prog
ram
, to
refle
ct a
revi
sed
met
hod
of b
udge
ting
for c
erta
in
prog
ram
man
agem
ent c
osts
. The
se c
osts
had
bee
n pr
evio
usly
dis
tribu
ted
to e
ach
line
item
and
pro
ject
with
in th
e pr
ogra
m, b
ut n
ow m
ay
only
be
plan
ned
with
in o
ne o
r mor
e lin
e ite
ms.
The
re is
no
net i
mpa
ct to
the
prog
ram
's b
udge
t re
ques
t.....
......
......
......
......
......
......
......
......
......
......
......
......
......
......
......
......
......
......
......
......
......
......
......
......
......
......
......
......
......
......
......
......
......
......
..
This
will
resu
lt in
a d
ecre
ase
of:
Civ
il S
ervi
ce R
etire
men
t Sys
tem
(CS
RS
)……
……
……
……
……
……
……
…...
……
……
……
……
……
……
……
……
……
……
……
……
……
Ass
umed
pay
rais
e, to
be
effe
ctiv
e Ja
nuar
y 1,
201
5……
...…
…..…
….…
.……
……
.To
tal c
ost i
n FY
201
5 of
the
FY 2
015
pay
rais
e …
……
..……
……
...…
.……
……
..
Tota
l, ad
just
men
t for
FY
2015
pay
rais
e…..…
……
...…
…...
……
……
……
……
….
Tota
l cos
t in
FY 2
015
of th
e FY
201
4 pa
y ra
ise…
..……
…...
……
….…
….…
……
..Le
ss a
mou
nt fu
nded
in F
Y 20
14…
….…
……
……
..……
...…
..…...
……
……
.....…
…..
Tota
l, ad
just
men
t for
FY
2014
pay
rais
e……
.…..…
……
….…
……
...…
..……
……
..
Pay
rais
e……
……
……
……
……
……
……
……
…...
……
……
……
……
…..…
……
……
……
……
……
…..…
……
……
.……
….…
……
….
Pay
men
t to
Wor
king
Cap
ital F
und…
……
……
……
...…
...…
…..…
……
……
…..…
Ass
umed
pay
rais
e, to
be
effe
ctiv
e Ja
nuar
y 1,
201
4……
……
….…
….…
…...
..….…
.
CEN-92
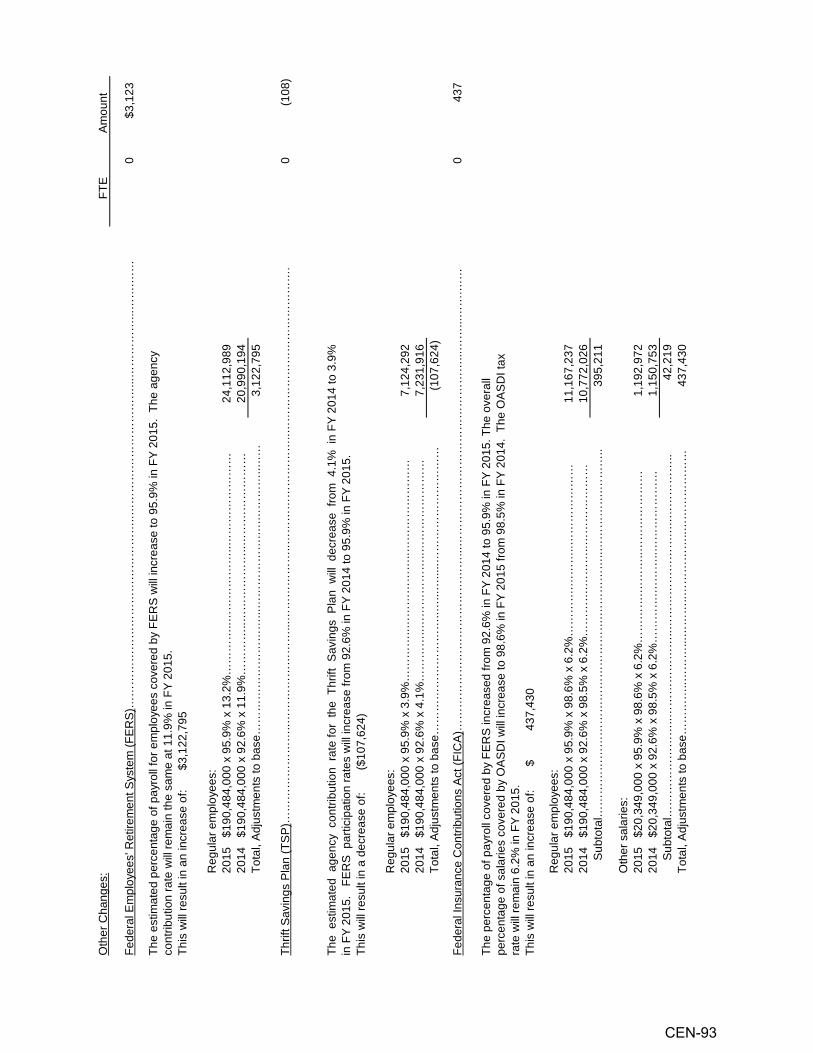
Oth
er C
hang
es:
FTE
Am
ount
0$3
,123
This
will
resu
lt in
an
incr
ease
of:
$3,1
22,7
95
24,1
12,9
89
20,9
90,1
94
3,12
2,79
5
0(1
08)
This
will
resu
lt in
a d
ecre
ase
of:
($10
7,62
4)
7,12
4,29
2
7,23
1,91
6
(1
07,6
24)
043
7
This
will
resu
lt in
an
incr
ease
of:
437,
430
$
11,1
67,2
37
10,7
72,0
26
395,
211
1,19
2,97
2
1,15
0,75
3
42
,219
43
7,43
0
Fede
ral E
mpl
oyee
s' R
etire
men
t Sys
tem
(FE
RS
)……
……
……
……
……
……
……
……
..……
……
……
……
……
…...
……
……
…...
……
.……
Thrif
t Sav
ings
Pla
n (T
SP
)……
……
……
……
..……
……
……
……
...…
……
……
…..…
……
……
……
……
..……
……
……
……
……
……
……
.
Reg
ular
em
ploy
ees:
2015
$1
90,4
84,0
00 x
95.
9% x
13.
2%…
……
…..…
……
……
…..…
……
……
……
…20
14
$190
,484
,000
x 9
2.6%
x 1
1.9%
……
……
..……
……
……
..……
……
……
……
Tota
l, A
djus
tmen
ts to
bas
e……
……
……
……
……
...…
……
……
….…
.……
……
..……
2014
$1
90,4
84,0
00 x
92.
6% x
98.
5% x
6.2
%…
……
….…
……
..……
……
……
…
Sub
tota
l……
……
……
……
……
……
……
……
….…
……
……
..……
……
….…
……
..
Oth
er s
alar
ies:
2014
$2
0,34
9,00
0 x
92.6
% x
98.
5% x
6.2
%…
……
….…
……
..……
……
……
…20
15
$20,
349,
000
x 95
.9%
x 9
8.6%
x 6
.2%
……
……
.……
…..…
……
……
……
S
ubto
tal…
……
……
……
…..…
……
……
……
..……
……
……
……
.….…
……
……
..To
tal,
Adj
ustm
ents
to b
ase…
……
…..…
……
...…
……
..……
……
…..…
……
……
……
The
estim
ated
per
cent
age
of p
ayro
ll fo
r em
ploy
ees
cove
red
by F
ER
S w
ill in
crea
se to
95.
9% in
FY
2015
. Th
e ag
ency
co
ntrib
utio
n ra
te w
ill re
mai
n th
e sa
me
at 1
1.9%
in F
Y 20
15.
The
est
imat
ed a
genc
y c
ontri
butio
n ra
te fo
r th
e T
hrift
Sav
ings
Pla
n w
ill d
ecre
ase
from
4.1
% i
n FY
201
4 to
3.9
%
in F
Y 20
15.
FE
RS
par
ticip
atio
n ra
tes
will
incr
ease
from
92.
6% in
FY
2014
to 9
5.9%
in F
Y 20
15.
The
perc
enta
ge o
f pay
roll
cove
red
by F
ER
S in
crea
sed
from
92.
6% in
FY
2014
to 9
5.9%
in F
Y 20
15. T
he o
vera
ll pe
rcen
tage
of s
alar
ies
cove
red
by O
AS
DI w
ill in
crea
se to
98.
6% in
FY
2015
from
98.
5% in
FY
2014
. Th
e O
AS
DI t
ax
rate
will
rem
ain
6.2%
in F
Y 20
15.
Fede
ral I
nsur
ance
Con
tribu
tions
Act
(FIC
A)…
……
……
……
……
……
……
……
...…
……
……
……
……
……
……
……
…...
……
...…
….…
…
2015
$1
90,4
84,0
00 x
95.
9% x
98.
6% x
6.2
%…
……
….…
……
..……
……
……
…R
egul
ar e
mpl
oyee
s:
Reg
ular
em
ploy
ees:
2015
$1
90,4
84,0
00 x
95.
9% x
3.9
%…
……
…..…
……
……
…..…
……
……
……
…20
14
$190
,484
,000
x 9
2.6%
x 4
.1%
……
……
..……
……
……
..……
……
……
……
Tota
l, A
djus
tmen
ts to
bas
e……
……
……
……
……
..…...
…...
..……
……
……
……
……
CEN-93

Oth
er C
hang
es:
FTE
Am
ount
0$6
38
Em
ploy
ees'
Com
pens
atio
n Fu
nd…
……
……
……
….…
……
……
……
……
……
……
……
……
……
……
……
……
……
…(2
,043
)
045
2
050
01,
366
9,03
0 33
,922
504
1,
172,
136
39,6
48
110,
390
Sub
tota
l, ot
her c
hang
es .…
……
……
……
……
……
……
……
……
……
……
……
……
……
……
..……
……
……
……
….…
……
…...
……
……
..0
6,20
7
Sub
tota
l, A
djus
tmen
ts to
bas
e……
……
……
……
……
……
……
……
…...
..……
……
……
……
……
……
...…
……
……
……
……
.……
……
…..
06,
207
Tota
l, A
djus
tmen
ts to
bas
e……
……
……
……
……
……
……
……
……
……
……
……
……
……
…..…
……
……
……
……
..……
..……
……
...…
.0
6,20
7
Oth
er s
ervi
ces…
……
……
……
.……
….…
……
……
….…
……
……
...…
...…
……
……
.
GP
O P
rintin
g……
……
..……
……
……
……
…..…
......
……
……
……
……
...…
……
……
……
…..…
……
….…
……
……
……
……
…...
……
.……
This
requ
est a
pplie
s O
MB
eco
nom
ic a
ssum
ptio
ns o
f 1.4
% fo
r FY
2015
whe
re th
e pr
ices
that
the
Gov
ernm
ent p
ays
are
esta
blis
hed
thro
ugh
the
mar
ket s
yste
m.
Fact
ors
are
appl
ied
to s
ub-o
bjec
t cla
sses
that
resu
lt in
the
follo
win
g ad
just
men
ts to
bas
e:
Ren
tal P
aym
ents
to G
SA
……
……
.……
……
……
……
…...
..……
…..…
……
……
…..…
……
……
……
….…
……
……
……
……
…...
……
.……
Gen
eral
Pric
ing
Leve
l Adj
ustm
ent…
……
……
……
……
…...
……
…...
……
……
……
……
.....…
.……
……
…..…
……
……
……
…...
……
.……
Tran
spor
atio
n of
thin
gs…
……
……
……
.….…
……
……
……
..……
……
……
…
Ren
tal p
aym
ent t
o ot
hers
……
……
……
..……
……
……
..……
……
......
……
……
……
Equ
ipm
ent…
……
……
……
……
……
……
.……
...…
……
……
……
…...
……
……
……
..
GS
A ra
tes
are
proj
ecte
d to
incr
ease
1.6
% o
ver t
he F
Y 20
14 e
stim
ate
of $
28,2
52,0
00 fo
r cur
rent
ly o
ccup
ied
spac
e.
This
resu
lts in
an
incr
ease
of $
452,
032.
Sup
plie
s an
d m
ater
ials
……
……
……
……
.……
……
……
..……
……
......
……
……
……
Com
mun
icat
ions
, util
ities
, and
mis
cella
neou
s ch
arge
s (e
xclu
ding
pos
tage
)..…
...…
GP
O h
as p
rovi
ded
an e
stim
ated
rate
incr
ease
of 1
.4%
. Th
is p
erce
ntag
e w
as a
pplie
d to
the
FY 2
014
estim
ate
of
$3,5
90,0
00 to
arri
ve a
t an
incr
ease
of $
50,2
60.
The
dec
reas
e of
$2,
043,
000
will
mee
t the
Cen
sus
Bur
eau'
s ob
ligat
ions
to th
e E
mpl
oyee
Com
pens
atio
n Fu
nd fo
r FY
2015
. Th
e C
ensu
s B
urea
u w
ill re
imbu
rse
the
Dep
artm
ent o
f Lab
or p
ursu
ant t
o 5
U.S
.C. §
814
7.
Effe
ctiv
e Ja
nuar
y 20
15, t
he C
ensu
s B
urea
u's
cont
ribut
ion
to F
eder
al e
mpl
oyee
's h
ealth
insu
ranc
e pr
emiu
ms
will
incr
ease
by
3.8%
. A
pplie
d ag
ains
t the
FY
2014
est
imat
e of
$16
,777
,000
the
incr
ease
will
be $
637,
526.
Hea
lth In
sura
nce…
……
……
……
……
……
……
.……
…...
……
……
……
……
……
……
……
……
……
……
……
……
……
……
……
……
……
…
CEN-94
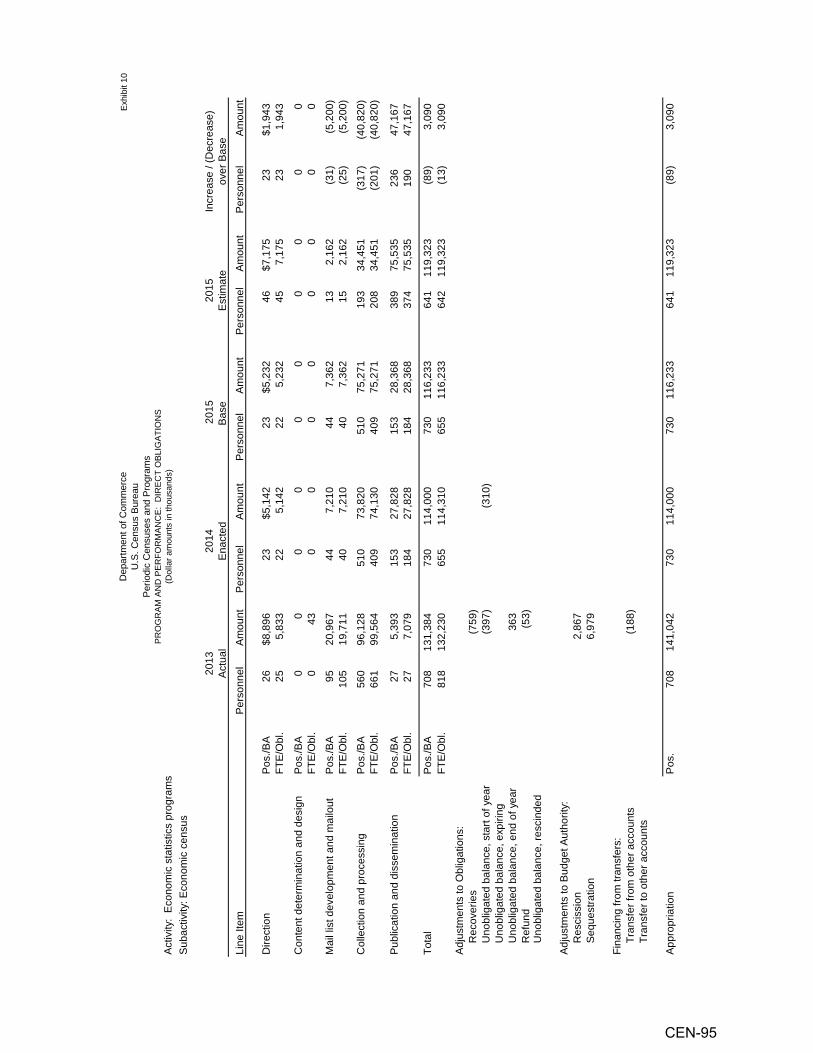
IGA
TIO
NS
same
PR
OG
RA
M A
ND
PE
RFO
RM
AN
CE
: D
IRE
CT
OB
Ls)c ogr d
er r
m eau
P san
om urBC an
d ou thn
of us
es ts i
ent
ens
us nu
Cm mo
.t ens
epar S C. r aaU c ll
D odi
i (Do
erP
Exh
ibit
10
Act
ivity
: E
cono
mic
sta
tistic
s pr
ogra
ms
Sub
activ
ity: E
cono
mic
cen
sus
Line
Item
Per
sonn
elA
mou
ntP
erso
nnel
Am
ount
Per
sonn
elA
mou
ntP
erso
nnel
Am
ount
Per
sonn
elA
mou
nt
Dire
ctio
nP
os./B
A26
$8,8
9623
$5,1
4223
$5,2
3246
$7,1
7523
$1,9
43FT
E/O
bl.
255,
833
225,
142
225,
232
457,
175
231,
943
Con
tent
det
erm
inat
ion
and
desi
gnP
os./B
A0
00
00
00
00
0FT
E/O
bl.
043
00
00
00
00
Mai
l lis
t dev
elop
men
t and
mai
lout
Pos
./BA
9520
,967
447,
210
447,
362
132,
162
(31)
(5,2
00)
FTE
/Obl
.10
519
,711
407,
210
407,
362
152,
162
(25)
(5,2
00)
Col
lect
ion
and
proc
essi
ngP
os./B
A56
096
,128
510
73,8
2051
075
,271
193
34,4
51(3
17)
(40,
820)
FTE
/Obl
.66
199
,564
409
74,1
3040
975
,271
208
34,4
51(2
01)
(40,
820)
Pub
licat
ion
and
diss
emin
atio
nP
os./B
A27
5,39
315
327
,828
153
28,3
6838
975
,535
236
47,1
67FT
E/O
bl.
277,
079
184
27,8
2818
428
,368
374
75,5
3519
047
,167
Tota
lP
os./B
A70
813
1,38
4
730
114,
000
730
116,
233
641
119,
323
(89)
3,09
0FT
E/O
bl.
818
132,
230
65
511
4,31
065
511
6,23
364
211
9,32
3(1
3)3,
090
Adj
ustm
ents
to O
blig
atio
ns:
R
ecov
erie
s(7
59)
Uno
blig
ated
bal
ance
, sta
rt of
yea
r(3
97)
(3
10)
U
nobl
igat
ed b
alan
ce, e
xpiri
ng
Uno
blig
ated
bal
ance
, end
of y
ear
363
R
efun
d(5
3)
Uno
blig
ated
bal
ance
, res
cind
ed
Adj
ustm
ents
to B
udge
t Aut
horit
y:
Res
ciss
ion
2,86
7
S
eque
stra
tion
6,97
9
Fina
ncin
g fro
m tr
ansf
ers:
T
rans
fer f
rom
oth
er a
ccou
nts
(188
)
T
rans
fer t
o ot
her a
ccou
nts
App
ropr
iatio
nP
os.
708
141,
042
73
011
4,00
0
73
011
6,23
3
641
119,
323
(8
9)3,
090
Incr
ease
/ (D
ecre
ase)
over
Bas
e20
13A
ctua
l20
14
Ena
cted
201
5B
ase
2015
Est
imat
e
CEN-95

IGA
TIO
NS
same
PR
OG
RA
M A
ND
PE
RFO
RM
AN
CE
: D
IRE
CT
OB
Ls)c ogr d
er r
m eau
P san
om urBC an
d ou thn
of us
es ts i
ent
ens
us nu
Cm mo
.t ens
epar S C. r aaU c ll
D odi
i (Do
erP
Exh
ibit
10
Act
ivity
: E
cono
mic
sta
tistic
s pr
ogra
ms
Sub
activ
ity: C
ensu
s of
gov
ernm
ents
Line
Item
Per
sonn
elA
mou
ntP
erso
nnel
Am
ount
Per
sonn
elA
mou
ntP
erso
nnel
Am
ount
Per
sonn
elA
mou
nt
Dire
ctio
nP
os./B
A8
$1,2
1410
$1,6
9910
$1,7
298
$1,0
53(2
)($
676)
FTE
/Obl
.7
1,19
89
1,69
99
1,72
95
1,05
3(4
)(6
76)
Con
tent
det
erm
inat
ion
and
desi
gnP
os./B
A1
198
00
00
283,
618
283,
618
FTE
/Obl
.1
176
00
00
273,
618
273,
618
Mai
l lis
t dev
elop
men
t and
mai
lout
Pos
./BA
342
05
339
534
419
2,47
514
2,13
1FT
E/O
bl.
346
53
339
334
417
2,47
514
2,13
1
Col
lect
ion
and
proc
essi
ngP
os./B
A51
7,49
350
5,11
550
5,22
410
1,45
5(4
0)(3
,769
)FT
E/O
bl.
507,
310
425,
292
425,
224
91,
455
(33)
(3,7
69)
Pub
licat
ion
and
diss
emin
atio
nP
os./B
A13
1,31
115
2,24
715
2,28
63
492
(12)
(1,7
94)
FTE
/Obl
.12
1,31
312
2,24
712
2,28
63
492
(9)
(1,7
94)
Tota
lP
os./B
A76
10,6
36
809,
400
809,
583
689,
093
(12)
(490
)FT
E/O
bl.
7310
,462
66
9,57
766
9,58
361
9,09
3(5
)(4
90)
Adj
ustm
ents
to O
blig
atio
ns:
R
ecov
erie
s(1
1)
U
nobl
igat
ed b
alan
ce, s
tart
of y
ear
(3)
(177
)
Uno
blig
ated
bal
ance
, exp
iring
U
nobl
igat
ed b
alan
ce, e
nd o
f yea
r18
8
R
efun
d
Uno
blig
ated
bal
ance
, res
cind
ed
Adj
ustm
ents
to B
udge
t Aut
horit
y:
Res
ciss
ion
237
Seq
uest
ratio
n57
7
Fina
ncin
g fro
m tr
ansf
ers:
Tra
nsfe
r fro
m o
ther
acc
ount
s(2
7)
T
rans
fer t
o ot
her a
ccou
nts
App
ropr
iatio
nP
os.
7611
,423
809,
400
809,
583
689,
093
(12)
(490
)
Incr
ease
/ (D
ecre
ase)
ove
r Bas
e20
13A
ctua
l20
14
Ena
cted
2015
B
ase
2015
E
stim
ate
CEN-96
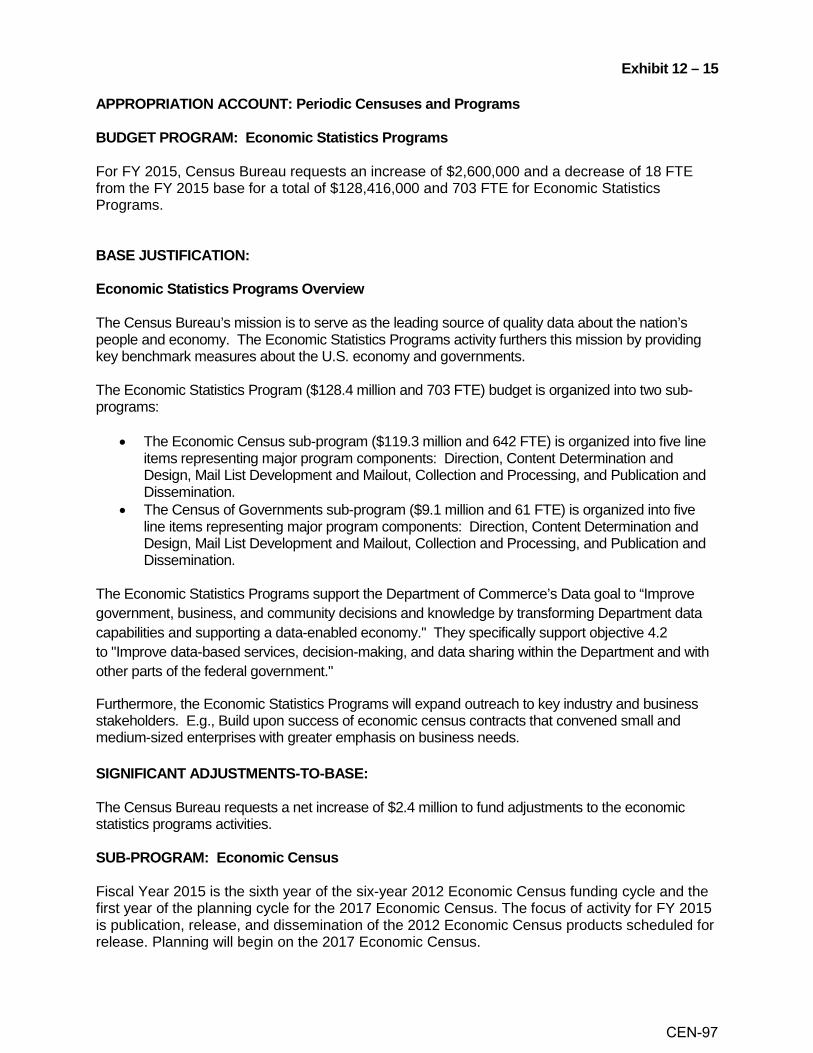
Exhibit 12 – 15
APPROPRIATION ACCOUNT: Periodic Censuses and Programs
BUDGET PROGRAM: Economic Statistics Programs
For FY 2015, Census Bureau requests an increase of $2,600,000 and a decrease of 18 FTE from the FY 2015 base for a total of $128,416,000 and 703 FTE for Economic Statistics Programs.
BASE JUSTIFICATION:
Economic Statistics Programs Overview
The Census Bureau’s mission is to serve as the leading source of quality data about the nation’s people and economy. The Economic Statistics Programs activity furthers this mission by providing key benchmark measures about the U.S. economy and governments.
The Economic Statistics Program ($128.4 million and 703 FTE) budget is organized into two sub-programs:
• The Economic Census sub-program ($119.3 million and 642 FTE) is organized into five lineitems representing major program components: Direction, Content Determination andDesign, Mail List Development and Mailout, Collection and Processing, and Publication andDissemination.
• The Census of Governments sub-program ($9.1 million and 61 FTE) is organized into fiveline items representing major program components: Direction, Content Determination andDesign, Mail List Development and Mailout, Collection and Processing, and Publication andDissemination.
The Economic Statistics Programs support the Department of Commerce’s Data goal to “Improve government, business, and community decisions and knowledge by transforming Department data capabilities and supporting a data-enabled economy." They specifically support objective 4.2 to "Improve data-based services, decision-making, and data sharing within the Department and with other parts of the federal government."
Furthermore, the Economic Statistics Programs will expand outreach to key industry and business stakeholders. E.g., Build upon success of economic census contracts that convened small and medium-sized enterprises with greater emphasis on business needs.
SIGNIFICANT ADJUSTMENTS-TO-BASE:
The Census Bureau requests a net increase of $2.4 million to fund adjustments to the economic statistics programs activities.
SUB-PROGRAM: Economic Census
Fiscal Year 2015 is the sixth year of the six-year 2012 Economic Census funding cycle and the first year of the planning cycle for the 2017 Economic Census. The focus of activity for FY 2015 is publication, release, and dissemination of the 2012 Economic Census products scheduled for release. Planning will begin on the 2017 Economic Census.
CEN-97

The economic census represents the primary source of facts about the structure and function of the U.S. economy, providing essential information to government and business to help guide sound decisions. It furnishes an important part of the framework for composite measures, such as the Gross Domestic Product (GDP), and the Bureau of Economic Analysis’ (BEA) input-output analyses and National Income and Product Accounts that provide important information about market sectors, such as manufacturing. The National Accounts and practically all major government economic statistical series are directly or indirectly dependent on the economic census. Statistics, analyses, and economic research produced by BEA, Bureau of Labor Statistics, Federal Reserve Board, Department of Energy, and the Census Bureau are all dependent on the economic census results. The economic census not only provides BEA with vital source data for the National Accounts, it also provides weights and benchmarks for indices of industrial production, productivity, and prices. Moreover, the census furnishes benchmarks and sampling lists for the Census Bureau’s current economic programs and for many data series at other federal agencies.
Business enterprises, trade associations, banks, investors, economic development agencies, research groups, educational institutions, and unions use data from the census for the purpose of planning expansion programs, selecting locations for new establishments, forecasting sales trends, determining market potential, forecasting sales and advertising performance, and performing other analyses. For example, the data are used to decide where to locate a plant, where to build a shopping center, or figure out what the market demand is for a product. In forecasting and planning, economic census results are the primary source of information about the changing structure of the U.S. economy. The census identifies industries and geographic areas that are experiencing rapid growth, as well as those that are declining. The information is also used to revise the North American Industry Classification System (NAICS) and to update the Business Register.
PROGRAM CHANGES FOR FY 2015:
1. Economic Census (+ $5,323,000, - 13 FTE):
The FY 2015 funding is critical to completing publication release and dissemination of the 2012 Economic Census products, specifically the Industry Series and the Geographic Area Series (GAS) reports. Additionally, formal planning will begin for the 2017 Economic Census. The reduction in FTE primarily represents a reduction in hours worked by National Processing Center staff on this project. Remaining FTE reductions will be accomplished through a combination of attrition, and not filling current vacancies.
Direction ($7,175,000 and 45 FTE) Direction includes planning and support activities required to conduct the census. Specific activities include providing overall direction and coordination of census planning, design, collection, processing, and dissemination operations. This includes development and monitoring of the program plan, quality plan, and risk plan. In FY 2015, the focus will be on completing plans and coordinating activities associated with data analysis, publication, and dissemination activities for the 2012 Economic Census, as well as planning for the 2017 Economic Census.
Content Determination and Design ($0 and 0 FTE) In FY 2015 no funds are allocated to this activity.
CEN-98
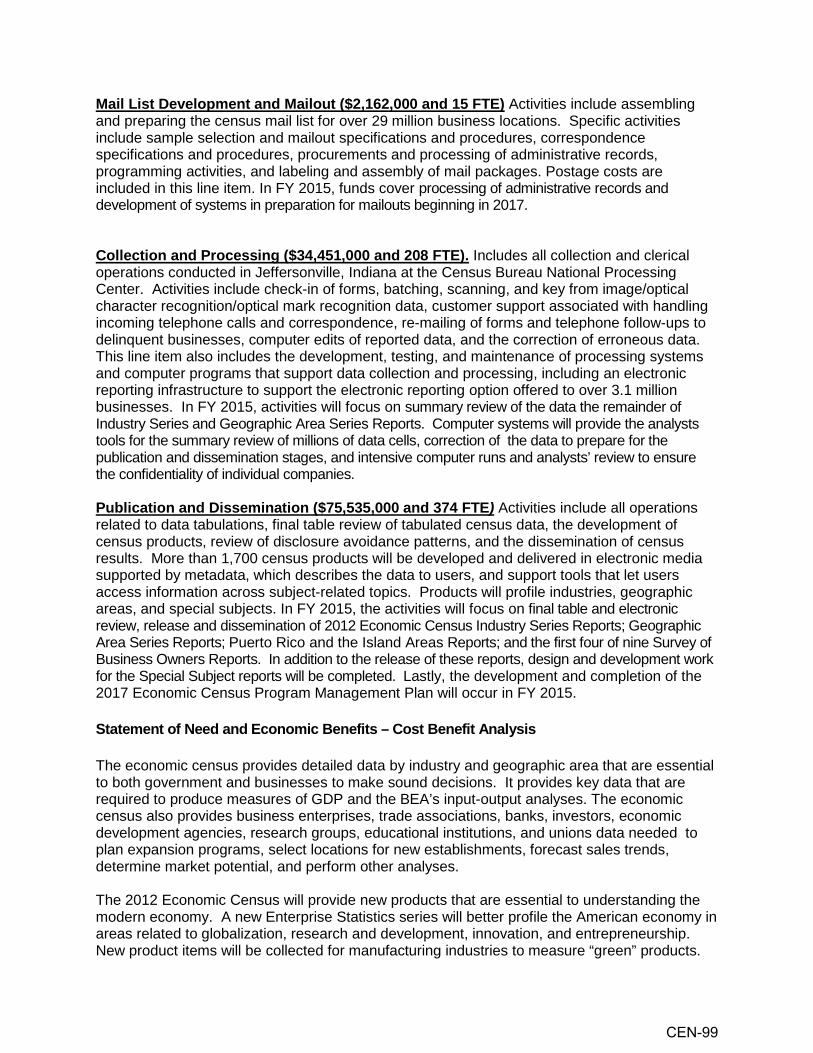
Mail List Development and Mailout ($2,162,000 and 15 FTE) Activities include assembling and preparing the census mail list for over 29 million business locations. Specific activities include sample selection and mailout specifications and procedures, correspondence specifications and procedures, procurements and processing of administrative records, programming activities, and labeling and assembly of mail packages. Postage costs are included in this line item. In FY 2015, funds cover processing of administrative records and development of systems in preparation for mailouts beginning in 2017. Collection and Processing ($34,451,000 and 208 FTE). Includes all collection and clerical operations conducted in Jeffersonville, Indiana at the Census Bureau National Processing Center. Activities include check-in of forms, batching, scanning, and key from image/optical character recognition/optical mark recognition data, customer support associated with handling incoming telephone calls and correspondence, re-mailing of forms and telephone follow-ups to delinquent businesses, computer edits of reported data, and the correction of erroneous data. This line item also includes the development, testing, and maintenance of processing systems and computer programs that support data collection and processing, including an electronic reporting infrastructure to support the electronic reporting option offered to over 3.1 million businesses. In FY 2015, activities will focus on summary review of the data the remainder of Industry Series and Geographic Area Series Reports. Computer systems will provide the analysts tools for the summary review of millions of data cells, correction of the data to prepare for the publication and dissemination stages, and intensive computer runs and analysts’ review to ensure the confidentiality of individual companies. Publication and Dissemination ($75,535,000 and 374 FTE) Activities include all operations related to data tabulations, final table review of tabulated census data, the development of census products, review of disclosure avoidance patterns, and the dissemination of census results. More than 1,700 census products will be developed and delivered in electronic media supported by metadata, which describes the data to users, and support tools that let users access information across subject-related topics. Products will profile industries, geographic areas, and special subjects. In FY 2015, the activities will focus on final table and electronic review, release and dissemination of 2012 Economic Census Industry Series Reports; Geographic Area Series Reports; Puerto Rico and the Island Areas Reports; and the first four of nine Survey of Business Owners Reports. In addition to the release of these reports, design and development work for the Special Subject reports will be completed. Lastly, the development and completion of the 2017 Economic Census Program Management Plan will occur in FY 2015. Statement of Need and Economic Benefits – Cost Benefit Analysis The economic census provides detailed data by industry and geographic area that are essential to both government and businesses to make sound decisions. It provides key data that are required to produce measures of GDP and the BEA’s input-output analyses. The economic census also provides business enterprises, trade associations, banks, investors, economic development agencies, research groups, educational institutions, and unions data needed to plan expansion programs, select locations for new establishments, forecast sales trends, determine market potential, and perform other analyses. The 2012 Economic Census will provide new products that are essential to understanding the modern economy. A new Enterprise Statistics series will better profile the American economy in areas related to globalization, research and development, innovation, and entrepreneurship. New product items will be collected for manufacturing industries to measure “green” products.
CEN-99

Expanded products in manufacturing will also provide some of the critical product detail lost due to cancellation of the Current Industrial Reports. Revisions are being made to the NAICS to primarily address changes and measurement issues associated with the manufacturing sector of the economy. Base Resources Assessment
Base Resource Amount: $116,233,000 Base FTE: 655 The economic census provides the Nation with comprehensive, detailed, and authoritative facts about the structure of the U.S. economy. Every five years, the economic census profiles the U.S. economy from the national to the local level. It provides official measures of output for industries and geographic areas. Economic policy makers in federal, state, and local governments use economic census data to project trends, guide economic development, and assess the impact of economic policy. The data help build the foundation for GDP and other indicators of economic performance. Title 13 U.S.C. §131 requires the censuses of manufactures, mineral industries, construction industries, retail and wholesale trade, service industries, transportation, and other businesses every five years, covering the years ending in “2” and “7.” The 2012 Economic Census will collect data on over 29 million establishments. The Census Bureau will minimize respondent burden by sending questionnaires to fewer than 20 percent of these establishments. Administrative records are used to obtain information for the remaining establishments, which include smaller businesses. For the 2012 Economic Census, all respondents have an opportunity to report electronically. Data will be disseminated through the American FactFinder. The economic census also includes several related programs that provide statistics on the characteristics of businesses, business expenses, and other items of national interest. The economic census includes the census of the island areas (Puerto Rico, the U.S. Virgin Islands, Guam, American Samoa, and the Commonwealth of the Northern Mariana Islands) and surveys of businesses owned by women and minorities. The results of the census will be summarized and presented for various classifications, such as kind-of-business, geographic locations at various levels of aggregation, sales size, employment size, legal form of organization, and degree of specialization. The 2012 Economic Census consists of eight core program components and several related data collections. The core components are separately tailored for each major domestic business sector, provide comprehensive and detailed information on the structure of the U.S. non-farm economy, and are the cornerstone of our nation’s economic statistics programs. The related data collections are more specialized and provide supplementary information on businesses owned by women, minorities, supplementary information on expenditures and expenses for non-goods producing businesses, transportation information on the movement of goods, and periodic census information on the economies of Puerto Rico and island areas. In addition to expanded and improved internet reporting the Census Bureau is continuing to make other infrastructure improvements that result in more efficient data collection and reduced costs. Efficiencies realized have resulted in a significant decrease in the growth of the 2012 Economic Census budget compared to prior cycles.
CEN-100
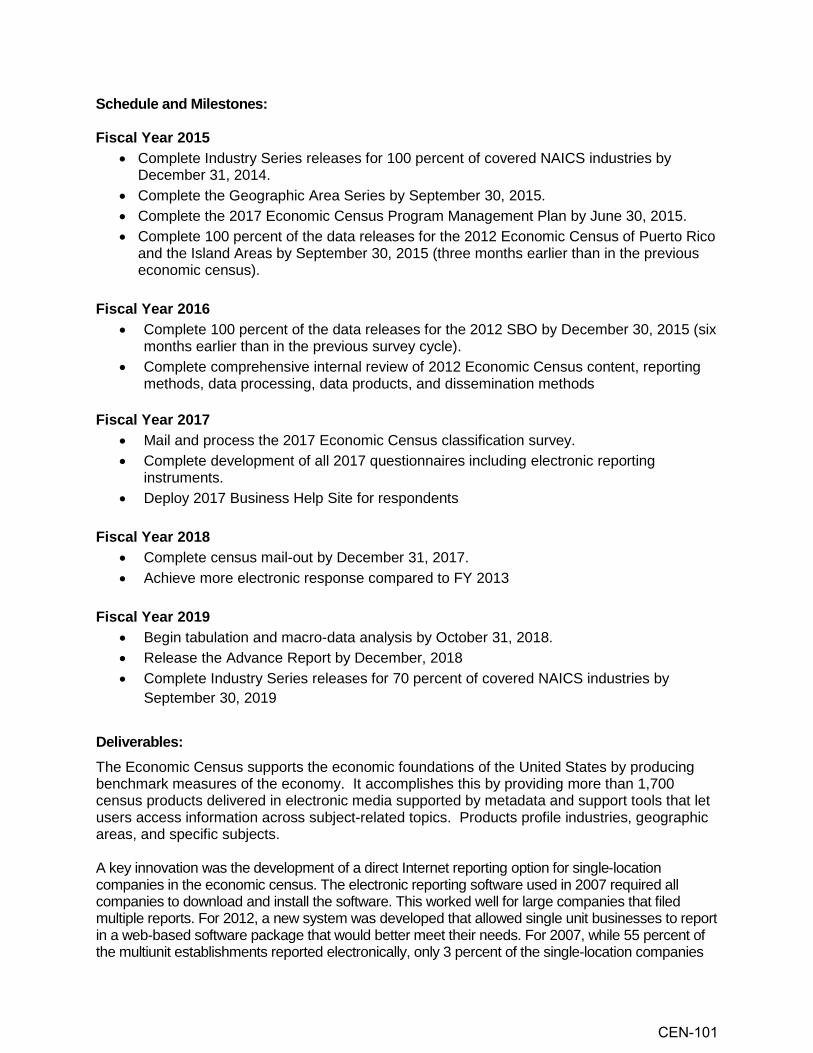
Schedule and Milestones: Fiscal Year 2015
• Complete Industry Series releases for 100 percent of covered NAICS industries by December 31, 2014.
• Complete the Geographic Area Series by September 30, 2015. • Complete the 2017 Economic Census Program Management Plan by June 30, 2015. • Complete 100 percent of the data releases for the 2012 Economic Census of Puerto Rico
and the Island Areas by September 30, 2015 (three months earlier than in the previous economic census).
Fiscal Year 2016
• Complete 100 percent of the data releases for the 2012 SBO by December 30, 2015 (six months earlier than in the previous survey cycle).
• Complete comprehensive internal review of 2012 Economic Census content, reporting methods, data processing, data products, and dissemination methods
Fiscal Year 2017
• Mail and process the 2017 Economic Census classification survey. • Complete development of all 2017 questionnaires including electronic reporting
instruments. • Deploy 2017 Business Help Site for respondents
Fiscal Year 2018
• Complete census mail-out by December 31, 2017. • Achieve more electronic response compared to FY 2013
Fiscal Year 2019
• Begin tabulation and macro-data analysis by October 31, 2018. • Release the Advance Report by December, 2018 • Complete Industry Series releases for 70 percent of covered NAICS industries by
September 30, 2019 Deliverables: The Economic Census supports the economic foundations of the United States by producing benchmark measures of the economy. It accomplishes this by providing more than 1,700 census products delivered in electronic media supported by metadata and support tools that let users access information across subject-related topics. Products profile industries, geographic areas, and specific subjects. A key innovation was the development of a direct Internet reporting option for single-location companies in the economic census. The electronic reporting software used in 2007 required all companies to download and install the software. This worked well for large companies that filed multiple reports. For 2012, a new system was developed that allowed single unit businesses to report in a web-based software package that would better meet their needs. For 2007, while 55 percent of the multiunit establishments reported electronically, only 3 percent of the single-location companies
CEN-101

used the software. In 2012, multiunit establishments reported electronically 73 percent of the time while single units achieved a rate of 39 percent. Risk Assessment:
Fiscal Year 2015 is a critical year in the life cycle of the Economic Census. Review, release and dissemination of 2012 Economic Census Industry Series Reports; Geographic Area Series Reports; and Puerto Rico and the Island Areas Reports is completed in FY 2015, and the design and development work for the Special Subject reports occurs. The economic census is the primary source of facts about the structure and functioning of the U.S. economy. It provides comprehensive, detailed, high-quality, and authoritative statistics that are critical for meeting the needs of government, businesses, and the American public. The program’s data products inform policies and programs that promote business vitality, job creation, and sustainable economic growth. If the Economic Census is not funded at the requested program level, the Census Bureau will not be able to meet its performance objective of providing critical benchmark measures of nation’s economy. Without these benchmarks, composite measures such as GDP and National Income and Product Accounts produced by the BEA would be impacted significantly. In addition, the reduction in quality of current economic statistics produced between economic census cycles would be significant. Without this critical data, Government policy makers and the private sector would not be able to target opportunities for growth that supports increasing jobs, which is a top priority of the Secretary of Commerce.
CEN-102
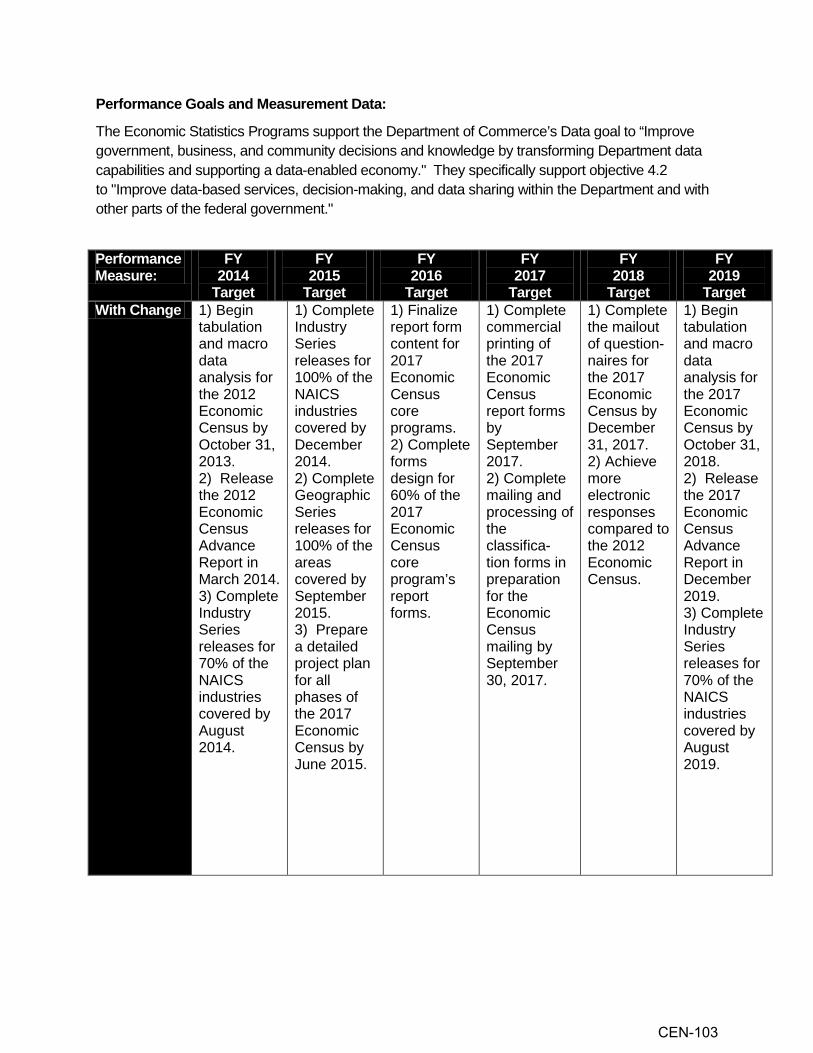
Performance Goals and Measurement Data:
The Economic Statistics Programs support the Department of Commerce’s Data goal to “Improve government, business, and community decisions and knowledge by transforming Department data capabilities and supporting a data-enabled economy." They specifically support objective 4.2 to "Improve data-based services, decision-making, and data sharing within the Department and with other parts of the federal government."
Performance Measure:
FY 2014
Target
FY 2015
Target
FY 2016
Target
FY 2017
Target
FY 2018
Target
FY 2019
Target With Change 1) Begin
tabulation and macro data analysis for the 2012 Economic Census by October 31, 2013. 2) Release the 2012 Economic Census Advance Report in March 2014. 3) Complete Industry Series releases for 70% of the NAICS industries covered by August 2014.
1) Complete Industry Series releases for 100% of the NAICS industries covered by December 2014. 2) Complete Geographic Series releases for 100% of the areas covered by September 2015. 3) Prepare a detailed project plan for all phases of the 2017 Economic Census by June 2015.
1) Finalize report form content for 2017 Economic Census core programs. 2) Complete forms design for 60% of the 2017 Economic Census core program’s report forms.
1) Complete commercial printing of the 2017 Economic Census report forms by September 2017. 2) Complete mailing and processing of the classifica-tion forms in preparation for the Economic Census mailing by September 30, 2017.
1) Complete the mailout of question-naires for the 2017 Economic Census by December 31, 2017. 2) Achieve more electronic responses compared to the 2012 Economic Census.
1) Begin tabulation and macro data analysis for the 2017 Economic Census by October 31, 2018. 2) Release the 2017 Economic Census Advance Report in December 2019. 3) Complete Industry Series releases for 70% of the NAICS industries covered by August 2019.
CEN-103

(Continued from previous page)
FY 2014
Target
FY 2015
Target
FY 2016
Target
FY 2017
Target
FY 2018
Target
FY 2019
Target
Without Change
1) Begin tabulation and macro data analysis for the 2012 Economic Census by October 31, 2013. 2) Release the 2012 Economic Census Advance Report in March 2014. 3) Complete Industry Series releases for 70% of the NAICS industries covered by August 2014 covered by August 2014.
1) Complete Industry Series releases for 100% of the NAICS industries covered by December 2014. 2) Complete Geographic Series releases for 100% of the areas covered by September 2015. 3) Prepare a detailed project plan for all phases of the 2017 Economic Census by June 2015.
1) Finalize report form content for 2017 Economic Census core programs. 2) Complete forms design for 60% of the 2017 Economic Census core program’s report forms.
1) Complete commercial printing of the 2017 Economic Census report forms by September 2017. 2) Complete mailing and processing of the classifica-tion forms in preparation for the Economic Census mailing by September 30, 2017.
1) Complete the mailout of question-naires for the 2017 Economic Census by December 31, 2017. 2) Achieve more electronic responses compared to the 2012 Economic Census.
1) Begin tabulation and macro data analysis for the 2017 Economic Census by October 31, 2018. 2) Release the 2017 Economic Census Advance Report in March 2019. 3) Complete Industry Series releases for 70% of the NAICS industries covered by September 2019.
Description: This supports the Census Bureau’s performance measure that, “Economic, Government, and Decennial Censuses, including the American Community Survey, meet targets for quality, cost, and delivery schedule.”
2. Inflationary Adjustment: The Economic Census program requests a decrease of $2.2 million and 0 FTE for a total request of $119,323,000 and 642 FTE to meet the cross-cutting program reductions necessary to offset increased funding requirements for adjustments-to-base (ATBs). These cross-cutting reductions will be captured by managing on-going administrative savings, managing the backfilling of vacated positions due to attrition, and carefully monitoring all travel and training.
CEN-104

PROGRAM CHANGE PERSONNEL DETAIL (Dollars in thousands)
Budget Program: Economic statistics programs Sub-program: Economic census Program Change: Economic census
Number Annual TotalLocation Grade of Positions Salary Salaries
IT Specialist Suitland, MD GS-14 -2 $120,429 -$240,858IT Specialist Suitland, MD GS-14 -4 113,346 -453,384IT Specialist Suitland, MD GS-12 -2 85,703 -171,406Survey Statistician Suitland, MD GS-05 -3 34,415 -103,245 Subtotal -11 -968,893
Distributed share of staff for centralized services -6 -324,215 Subtotal -17 -1,293,108
Less Lapse 0% 0 0Total Full-time permanent: -17 -1,293,108
1.049% 0Total -17 -1,293,108
Personnel Data NumberFull-time Equivalent Employment
Full-time permanent -17Other than full-time permanent 4Total -13
Authorized Positions:Full-time permanent -89Other than full-time permanent 14Total -75
Title:
2015 Pay Adjustment
CEN-105

PROGRAM CHANGE DETAIL BY OBJECT CLASS (Dollars in thousands)
Budget Program: Economic statistics programs Sub-program: Economic census Program Change: Economic census
FY 2015 FY 2015Object Class Increase Total Program
11 Personnel compensation11.1 Full-time permanent -$1,293 $50,52911.3 Other than full-time permanent 271 2,70711.5 Other personnel compensation -131 71611.8 Special personnel services payments 0 011.9 Total personnel compensation -1,153 53,95212 Civilian personnel benefits 2 18,01813 Benefits for former personnel -259 4121 Travel and transportation of persons -83 90022 Transportation of things -2 3423.1 Rental payments to GSA -1,476 6,08423.2 Rental Payments to others 44 4423.3 Communications, utilities and miscellaneous charges -1,084 1,22224 Printing and reproduction -23 10325.1 Advisory and assistance services 7,386 16,08125.2 Other services 1,127 3,75625.3 Purchases of goods & services from Gov't accounts -3,893 4,33825.4 Operation and maintenance of facilities 540 2,01425.5 Research and development contracts -913 5425.6 Medical care 0 025.7 Operation and maintenance of equipment 5,635 10,91525.8 Subsistence and support of persons -20 3126 Supplies and materials -69 95731 Equipment -436 77932 Lands and structures 0 033 Investments and loans 0 041 Grants, subsidies and contributions 0 0 42 Insurance claims and indemnities 0 0 43 Interest and dividends 0 0 44 Refunds 0 0 99 Total obligations 5,323 119,323
CEN-106

PROGRAM CHANGE DETAIL BY OBJECT CLASS (Dollars in thousands)
Budget Program: Economic statistics programs Sub-program: Economic census Program Change: Inflationary adjustment
FY 2015 FY 2015Object Class Decrease Total Program
11 Personnel compensation11.1 Full-time permanent -$568 $50,52911.3 Other than full-time permanent -35 2,70711.5 Other personnel compensation 0 71611.8 Special personnel services payments 0 011.9 Total personnel compensation -603 53,95212 Civilian personnel benefits -1,162 18,01813 Benefits for former personnel 0 4121 Travel and transportation of persons 0 90022 Transportation of things 0 3423.1 Rental payments to GSA -120 6,08423.2 Rental Payments to others 0 4423.3 Communications, utilities and miscellaneous charges -11 1,22224 Printing and reproduction -4 10325.1 Advisory and assistance services -122 16,08125.2 Other services -40 3,75625.3 Purchases of goods & services from Gov't accounts -31 4,33825.4 Operation and maintenance of facilities -21 2,01425.5 Research and development contracts -14 5425.6 Medical care 0 025.7 Operation and maintenance of equipment -74 10,91525.8 Subsistence and support of persons -1 3126 Supplies and materials -14 95731 Equipment -16 77932 Lands and structures 0 033 Investments and loans 0 041 Grants, subsidies and contributions 0 0 42 Insurance claims and indemnities 0 0 43 Interest and dividends 0 0 44 Refunds 0 0 99 Total obligations -2,233 119,323
CEN-107
SUB-PROGRAM: Census of Governments Since 1957, the census of governments has been compiled every 5 years in conjunction with the economic census. Funding for the census of governments is cyclical in nature due to the fact that Title 13, Section 161 authorizes a quinquennial census. Therefore, a decrease of funds from FY 2014 to FY 2015 reflects the startup of the 2017 Census of Governments when activities are focused less on completing data processing, developing data products, and disseminating information from the census, and more on the direction and planning of the 2017 Census of Governments. The census of governments is related to the current government statistics program. The census of governments is conducted every five years (years ending in '2' and '7'), whereas the government statistics programs are conducted in the intervening years when a sample of state and local governments is used to collect data. The census of governments is a long-standing program, and as such, various survey methods and approaches have been employed over time. Based on lessons learned, the 2012 Census of Governments utilized the best mix of survey methods and administrative record practices to conduct an accurate census. Historically, the census of governments programs have utilized field enumeration for data collection methods. Lessons learned have demonstrated that the use of administrative records and central collection methods among the states is the most cost effective way to collect the data. As such, the Census Bureau has taken strides to improve these methods and techniques, which will be employed in the 2017 Census of Governments. These methods will be used to the greatest extent possible in lieu of field data collection to reduce the reporting burden of governments as well as to reduce costs. The complex and ever-changing state and local government universe is a major economic force, totaling about 12 percent of the GDP and 15 percent of the civilian labor force population. The census of governments represents the primary source of facts about the structure and function of the public sector of the U.S. economy. It provides essential information to Congress and federal agencies, such as the Departments of Education, Justice, Housing and Urban Development, and Health and Human Services, for planning and evaluating programs involving intergovernmental relationships. The census contributes an important element for constructing composite national economic measures, such as the GDP quantifying economic output, the BEA’s input-output tables that measure market sectors, and the Federal Reserve Board’s Flow of Funds accounts that provide time-series data of financial flows in the economy. Without these state and local government economic statistics, important benchmarking and comparative analyses of state and local governments cannot be done. Many different groups of analysts—including, most prominently, the state and local governments themselves, public interest groups, the academic community, and the policy research community—make extensive use of the data. In 2007, the Committee on National Statistics (CNSTAT) issued a “clean-slate” report on the state of government statistics. The report identified Census Bureau data on state and local governments as the only comprehensive source on the fiscal welfare of state and local governments. In the report, CNSTAT charged the Census Bureau to improve, build, and enhance its programs. The report laid out 21 strategic recommendations for improving data on governments. Over the 2012 Census of Governments cycle, the Census Bureau has taken strides in addressing the recommendations and making needed improvements to its programs and will continue these critical efforts for the 2017 Census of Governments.
CEN-108

Following the CNSTAT’s recommendations, the Census Bureau engaged data users and stakeholders through workshops and conferences to discuss improvements to the census of governments and related programs. The outcome of the workshops was improvements in content, methodology, and data products for the 2012 Census of Governments. Additional workshops focused on making further improvements for the 2017 Census of Governments will be conducted. Further strides are being made to modernize and reengineer the infrastructure and processing systems used to collect and disseminate the data. The proposed FY 2015 activities allow the Census Bureau to continue these efforts. PROGRAM CHANGES FOR FY 2015: 1. Census of Governments (- $307,000, - 5 FTE): Fiscal Year 2015 is the first year in the five-year cycle of the 2017 Census of Governments. The reduction in FTE primarily represents a reduction in hours worked by National Processing Center staff on this project. Remaining FTE reductions will be accomplished through a combination of attrition, and not filling current vacancies. Direction ($1,053,000 and 5 FTE) Direction includes overall planning, design, and support activities. Activities in FY 2015 will focus on overall coordination of activities through a project management plan. Content Determination/Design ($3,618,000 and 27 FTE) Activities include evaluation of the data content for each component of the census and the coordination of these data needs with data providers and data users. For FY 2015 these activities include outreach to state and local government officials and data users regarding program content, initial work and research into survey design options, and initial design of collection instruments. Mail List Development and Mail-out ($2,475,000 and 17 FTE) The primary activity for FY 2015 will be ongoing research into state government legislation, searching for appropriate secondary sources that contain information on newly created governments and government types, and discussions with state experts. This work is vital to maintaining an updated universe to provide the framework for all intercensal surveys and to establish the universe for each component of the 2017 Census of Governments. Activities will also include continuing efforts to migrate surveys into the Governments Master Address File (GMAF). Collection and Processing ($1,455,000 and 9 FTE) This activity includes all data collection and processing operations for each of the census of governments traditional mail canvass survey operations, expanding Internet data collection options, field and office enumeration and compilation activities, and electronic data collection. In FY 2015, activities include completing data collection and processing efforts for the 2012 Census of Governments: Finance component and efforts to modernize and reengineer the infrastructure and processing systems used to collect and process the data. Processing procedures used for the 2012 Census of Governments will be evaluated to inform improvements for the 2017 Census of Governments. Publication and Dissemination ($492,000 and 3 FTE) This activity includes all operations related to the final review of data for public release, tabulation, and publication of census findings and dissemination of information to data users. As a result of current year budget cuts, the final dissemination of the 2012 Census of Governments: Finance component was pushed into FY 2015. Activities during FY 2015 will include disseminating data tables and summary publications in the finance component.
CEN-109

Statement of Need and Economic Benefits – Cost Benefit Analysis The census of governments provides economic information used to develop the state and local government portion of the GDP, which accounts for about 12 percent of the total. This Census covers approximately 90,000 state and local government units and sub-agencies and collects data on more than 19 million state and local government employees, 15 percent of the U.S. civilian workforce. Detailed information on approximately $3.0 trillion in public pension system assets, one of the largest pools of funding for market investments, is collected, disseminated, and published. The 2017 Census of Governments consists of three components: government organization, public employment, and government finances. Fiscal Year 2015 funding is requested for activities necessary in these three components. For the government organization component, funding is requested primarily to conduct ongoing research into state government legislation, searching for appropriate secondary sources that contain information on newly created governments and government types, and discussions with state experts. Additionally, outreach to state and local government officials and data users regarding program content will be conducted. In the employment component, funds will be used to conduct outreach to state and local government officials and data users regarding program content, and perform initial work and research into survey design options. In the finance component, funds will be used to complete processing and dissemination of the 2012 Census of Governments and conduct outreach to state and local government officials and data users regarding program content. The 2017 Census of Governments will demonstrate efficiencies in both data collection procedures and editing methods. The 2017 Census of Governments will have expanded use of state level electronic data collection. Additionally, improvements to macro and micro edit methods will maximize editing efficiency and lead to savings in cost and time. These operational efficiencies allow staff to devote necessary time to developing analytic reports and data dissemination interfaces. Base Resources Assessment
Base Resource Amount: $9,583,000 Base FTE: 66 The goals of the census of governments are to identify the scope and nature of the nation’s state and local government sector; provide authoritative benchmark figures in the areas of public finance and public employment; classify local government organization, powers and activities; and measure federal, state, and local fiscal relationships. The census of governments is the only source of comprehensive and uniformly classified data on the economic activities of state and local governments. The census of governments programs are divided into three components: organization, employment, and finance.
• The Organization component establishes the universe of state and local government entities and identifies the disparate nature of intergovernmental relationships within each state-area. It is within this component that the definition, structure, and number of governmental entities are determined.
• The Employment component provides data on the number of full-time and part-time employees with corresponding full-time and part-time pay by governmental function.
• The Finance component data describes government revenues and expenditures, and quantifies debt and asset characteristics. The Finance data consist of various deliverables on taxes, assets of public pension systems, and comprehensive statistics
CEN-110

on state and local government finances. These data cover revenues by type, expenditures by character and function, indebtedness by term, and cash and securities holdings.
Schedule and Milestones: FY 2015 The census of governments will:
• Complete the finance component processing and dissemination • Conduct lessons learned on the 2012 Census of Governments • Complete an evaluation of the content, processing, and dissemination of the 2012
Census of Governments • Complete the 2017 Census of Governments project plan
FY 2016 The census of governments will:
• Complete a review of program components and content with data users • Finalize report form content for the 2017 Census of Governments • Complete development of the organization component questionnaires for the 2017
Census of Governments FY 2017 The census of governments will:
• Mail and collect data for the 2016 Government Units Survey • Complete development of the employment and finance component questionnaires for
the 2017 Census of Governments • Mail the 2017 Census of Governments: Employment Component survey • Prepare for the mail-out of the 2017 Census of Governments: Finance Component
surveys FY 2018 The census of governments will:
• Evaluate the universe frame from the Governments Master Address File • Prepare and deliver data files for the BEA for the employment component • Mail the 2017 Census of Governments: Finance Component surveys
FY 2019 The census of governments will:
• Complete the employment component processing and dissemination • Complete processing of central collections, compilations, editing, and research of
secondary sources for nonrespondents for the finance component • Release data on retirement systems from the finance component • Release data on school district finances from the finance component • Prepare and deliver data files for the BEA for the finance component
CEN-111
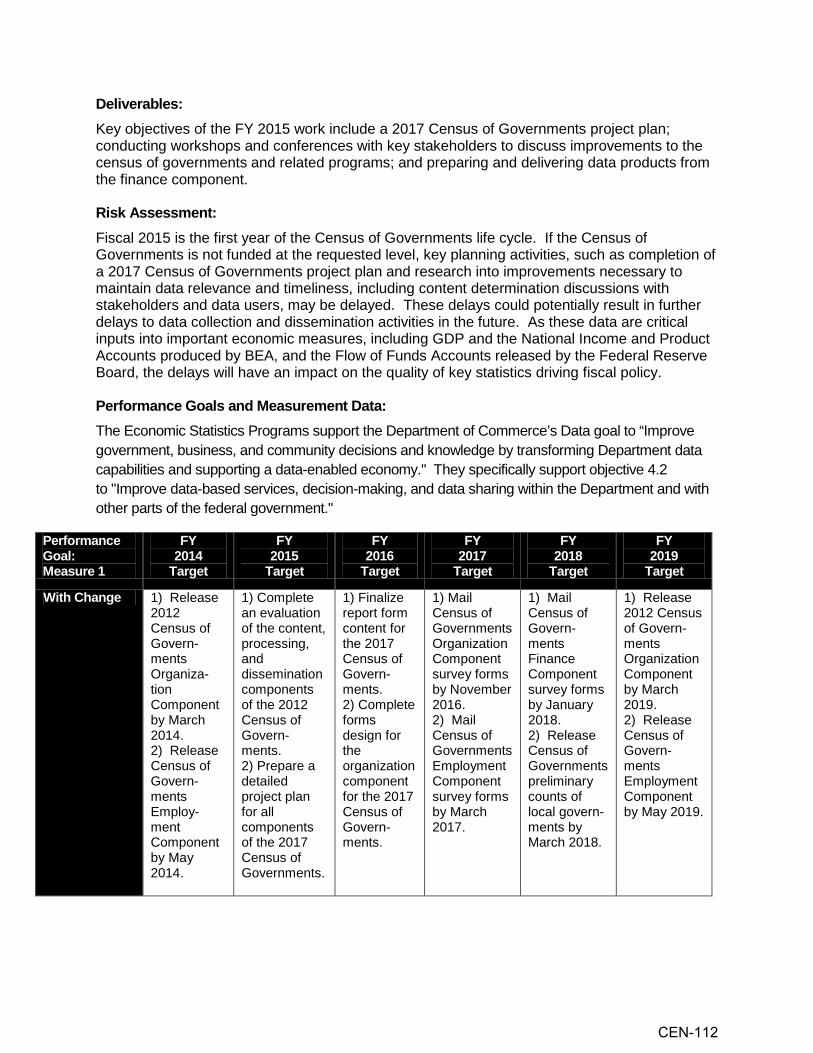
Deliverables: Key objectives of the FY 2015 work include a 2017 Census of Governments project plan; conducting workshops and conferences with key stakeholders to discuss improvements to the census of governments and related programs; and preparing and delivering data products from the finance component. Risk Assessment: Fiscal 2015 is the first year of the Census of Governments life cycle. If the Census of Governments is not funded at the requested level, key planning activities, such as completion of a 2017 Census of Governments project plan and research into improvements necessary to maintain data relevance and timeliness, including content determination discussions with stakeholders and data users, may be delayed. These delays could potentially result in further delays to data collection and dissemination activities in the future. As these data are critical inputs into important economic measures, including GDP and the National Income and Product Accounts produced by BEA, and the Flow of Funds Accounts released by the Federal Reserve Board, the delays will have an impact on the quality of key statistics driving fiscal policy. Performance Goals and Measurement Data: The Economic Statistics Programs support the Department of Commerce’s Data goal to “Improve government, business, and community decisions and knowledge by transforming Department data capabilities and supporting a data-enabled economy." They specifically support objective 4.2 to "Improve data-based services, decision-making, and data sharing within the Department and with other parts of the federal government."
Performance Goal: Measure 1
FY 2014
Target
FY 2015
Target
FY 2016
Target
FY 2017
Target
FY 2018
Target
FY 2019
Target
With Change 1) Release 2012 Census of Govern-ments Organiza-tion Component by March 2014. 2) Release Census of Govern-ments Employ-ment Component by May 2014.
1) Complete an evaluation of the content, processing, and dissemination components of the 2012 Census of Govern-ments. 2) Prepare a detailed project plan for all components of the 2017 Census of Governments.
1) Finalize report form content for the 2017 Census of Govern-ments. 2) Complete forms design for the organization component for the 2017 Census of Govern-ments.
1) Mail Census of Governments Organization Component survey forms by November 2016. 2) Mail Census of Governments Employment Component survey forms by March 2017.
1) Mail Census of Govern-ments Finance Component survey forms by January 2018. 2) Release Census of Governments preliminary counts of local govern-ments by March 2018.
1) Release 2012 Census of Govern-ments Organization Component by March 2019. 2) Release Census of Govern-ments Employment Component by May 2019.
CEN-112

FY 2014
Target
FY 2015
Target
FY 2016
Target
FY 2017
Target
FY 2018
Target
FY 2019
Target Without Change
1) Release2012 Census of Govern-ments Organiza-tion Component by March 2014. 2) ReleaseCensus of Govern-ments Employ-ment Component by May 2014.
1) Completean evaluation of the content, processing, and dissemination components of the 2012 Census of Govern-ments. 2) Prepare adetailed project plan for all components of the 2017 Census of Governments.
1) Finalizereport form content for the 2017 Census of Govern-ments. 2) Completeforms design for the organization component for the 2017 Census of Govern-ments.
1) MailCensus of Governments Organization Component survey forms by November 2016. 2) MailCensus of Governments Employment Component survey forms by March 2017.
1) MailCensus of Govern-ments Finance Component survey forms by January 2018. 2) ReleaseCensus of Governments preliminary counts of local govern-ments by March 2018.
1) Release2012 Census of Govern-ments Organization Component by March 2019. 2) ReleaseCensus of Govern-ments Employment Component by May 2019.
Description: This supports the Census Bureau’s performance measure that, “Economic, Government, and Decennial Censuses, including the American Community Survey, meet targets for quality, cost, and delivery schedule.”
2. Inflationary Adjustment: The Census of Governments program requests a decrease of$0.2 million and 0 FTE for a total request of $9,093,000 and 61 FTE to meet the cross-cutting program reductions necessary to offset increased funding requirements for adjustments-to-base (ATBs). These cross-cutting reductions will be captured by managing on-going administrative savings, managing the backfilling of vacated positions due to attrition, and carefully monitoring all travel and training.
CEN-113

PROGRAM CHANGE PERSONNEL DETAIL
(Dollars in thousands) Budget Program: Economic statistics programs Sub-program: Census of governments Program Change: Census of governments
Number Annual TotalLocation Grade of Positions Salary Salaries
IT Specialist Suitland, MD GS-12 -1 $88,224 -$88,224Survey Statistician Suitland, MD GS-11 -1 75,710 -75,710Survey Statistician Suitland, MD GS-9 -1 62,573 -62,573Survey Statistician Suitland, MD GS-9 -1 60,836 -60,836 Subtotal -4 -287,343
Distributed share of staff for centralized services -1 -66,892 Subtotal -5 -354,235
Less Lapse 0% 0 0Total Full-time permanent: -5 -354,235
1.049% 0
Subtotal -5 -354,235
Personnel Data NumberFull-time Equivalent Employment
Full-time permanent -5Other than full-time permanent 0Total -5
Authorized Positions:Full-time permanent -12Other than full-time permanent 1Total -11
Title:
2015 Payraise
CEN-114

PROGRAM CHANGE DETAIL BY OBJECT CLASS (Dollars in thousands)
Budget Program: Economic statistics programs Sub-program: Census of governments Program Change: Census of governments
FY 2015 FY 2015Object Class Decrease Total Program
11 Personnel compensation11.1 Full-time permanent -$354 $4,83911.3 Other than full-time permanent 2 7711.5 Other personnel compensation 23 10711.8 Special personnel services payments 0 011.9 Total personnel compensation -329 5,02312 Civilian personnel benefits 55 1,61813 Benefits for former personnel -25 221 Travel and transportation of persons 7 15622 Transportation of things 0 423.1 Rental payments to GSA -37 56723.2 Rental Payments to others 6 623.3 Communications, utilities and miscellaneous charges 9 11424 Printing and reproduction -17 3325.1 Advisory and assistance services 314 59425.2 Other services 41 26825.3 Purchases of goods & services from Gov't accounts -231 38925.4 Operation and maintenance of facilities -20 10025.5 Research and development contracts -69 525.6 Medical care 0 025.7 Operation and maintenance of equipment 26 12925.8 Subsistence and support of persons -1 426 Supplies and materials 12 6131 Equipment -48 2032 Lands and structures 0 033 Investments and loans 0 041 Grants, subsidies and contributions 0 0 42 Insurance claims and indemnities 0 0 43 Interest and dividends 0 0 44 Refunds 0 0 99 Total obligations -307 9,093
CEN-115
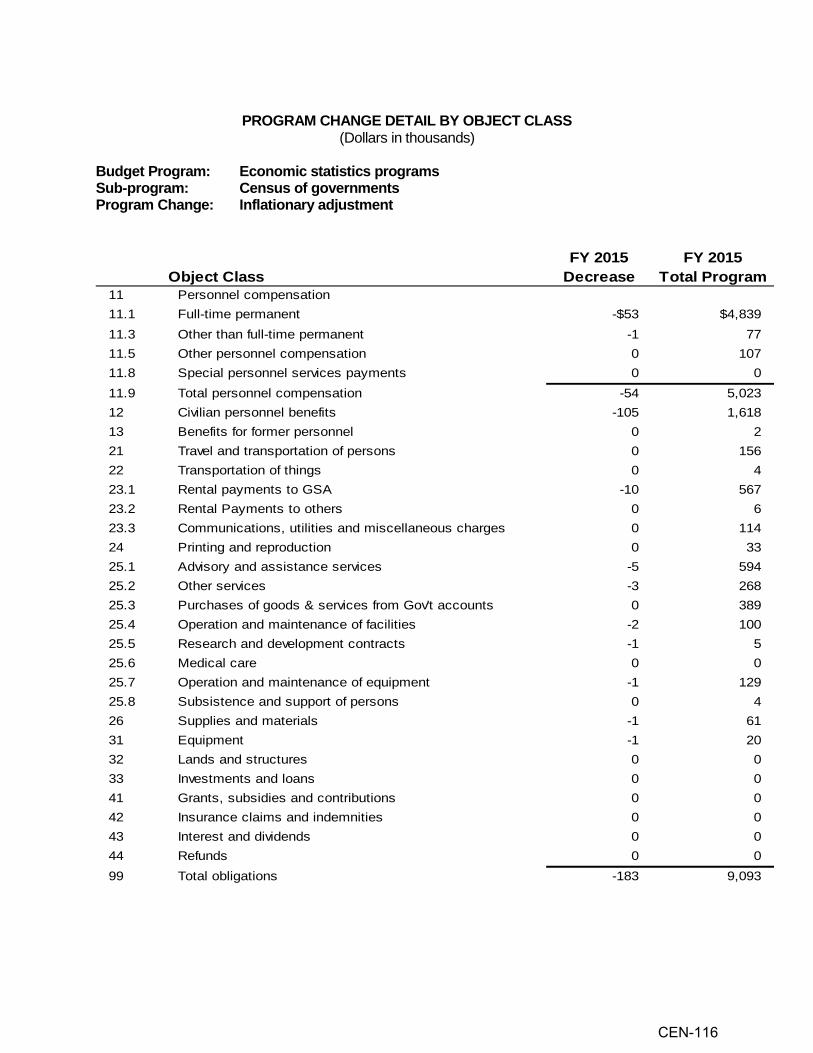
PROGRAM CHANGE DETAIL BY OBJECT CLASS
(Dollars in thousands) Budget Program: Economic statistics programs Sub-program: Census of governments Program Change: Inflationary adjustment
FY 2015 FY 2015Object Class Decrease Total Program
11 Personnel compensation11.1 Full-time permanent -$53 $4,83911.3 Other than full-time permanent -1 7711.5 Other personnel compensation 0 10711.8 Special personnel services payments 0 011.9 Total personnel compensation -54 5,02312 Civilian personnel benefits -105 1,61813 Benefits for former personnel 0 221 Travel and transportation of persons 0 15622 Transportation of things 0 423.1 Rental payments to GSA -10 56723.2 Rental Payments to others 0 623.3 Communications, utilities and miscellaneous charges 0 11424 Printing and reproduction 0 3325.1 Advisory and assistance services -5 59425.2 Other services -3 26825.3 Purchases of goods & services from Gov't accounts 0 38925.4 Operation and maintenance of facilities -2 10025.5 Research and development contracts -1 525.6 Medical care 0 025.7 Operation and maintenance of equipment -1 12925.8 Subsistence and support of persons 0 426 Supplies and materials -1 6131 Equipment -1 2032 Lands and structures 0 033 Investments and loans 0 041 Grants, subsidies and contributions 0 0 42 Insurance claims and indemnities 0 0 43 Interest and dividends 0 0 44 Refunds 0 0 99 Total obligations -183 9,093
CEN-116

NS
OITAGILs Bma Oe )r sc g dr C
Toe au r RE an
m se P
om
u
ur nd DI
oh
B
:
C a tns s
of e NC
E iu s
ns A t
nt us unee ns RM
C
o
m m. e Otr C RF aS
pa
r. aU c E l
di le o
D o Di (
er ND
PP A
MR
AG
RO
P
Exhi
bit 1
0
Act
ivity
: D
emog
raph
ic s
tatis
tics
prog
ram
sS
ubac
tivity
: Int
erce
nsal
dem
ogra
phic
est
imat
es
Line
Item
Per
sonn
elA
mou
ntP
erso
nnel
Am
ount
Per
sonn
elA
mou
ntP
erso
nnel
Am
ount
Per
sonn
elA
mou
nt
Inte
rcen
sal d
emog
raph
ic e
stim
ates
Pos
./BA
57$9
,389
66$9
,926
66$1
0,12
766
$9,9
260
($20
1)FT
E/O
bl.
579,
226
6210
,156
62$1
0,12
762
$9,9
260
(201
)
Tota
lP
os./B
A57
9,38
966
9,92
666
10,1
2766
9,92
60
(201
)FT
E/O
bl.
579,
226
6210
,156
6210
,127
629,
926
0(2
01)
Adj
ustm
ents
to O
blig
atio
ns:
R
ecov
erie
s(2
7)
Uno
blig
ated
bal
ance
, sta
rt of
yea
r(5
8)
(2
30)
U
nobl
igat
ed b
alan
ce, e
xpiri
ng
Uno
blig
ated
bal
ance
, end
of y
ear
248
Ref
und
U
nobl
igat
ed b
alan
ce, r
esci
nded
Adj
ustm
ents
to B
udge
t Aut
horit
y:
Res
ciss
ion
209
Seq
uest
ratio
n50
9
Fina
ncin
g fro
m tr
ansf
ers:
T
rans
fer f
rom
oth
er a
ccou
nts
(24)
T
rans
fer t
o ot
her a
ccou
nts
App
ropr
iatio
nP
os.
5710
,083
669,
926
6610
,127
669,
926
0(2
01)
Incr
ease
/ (D
ecre
ase)
ov
er B
ase
2013
Act
ual
2014
E
nact
ed20
15B
ase
2015
Est
imat
e
CEN-117
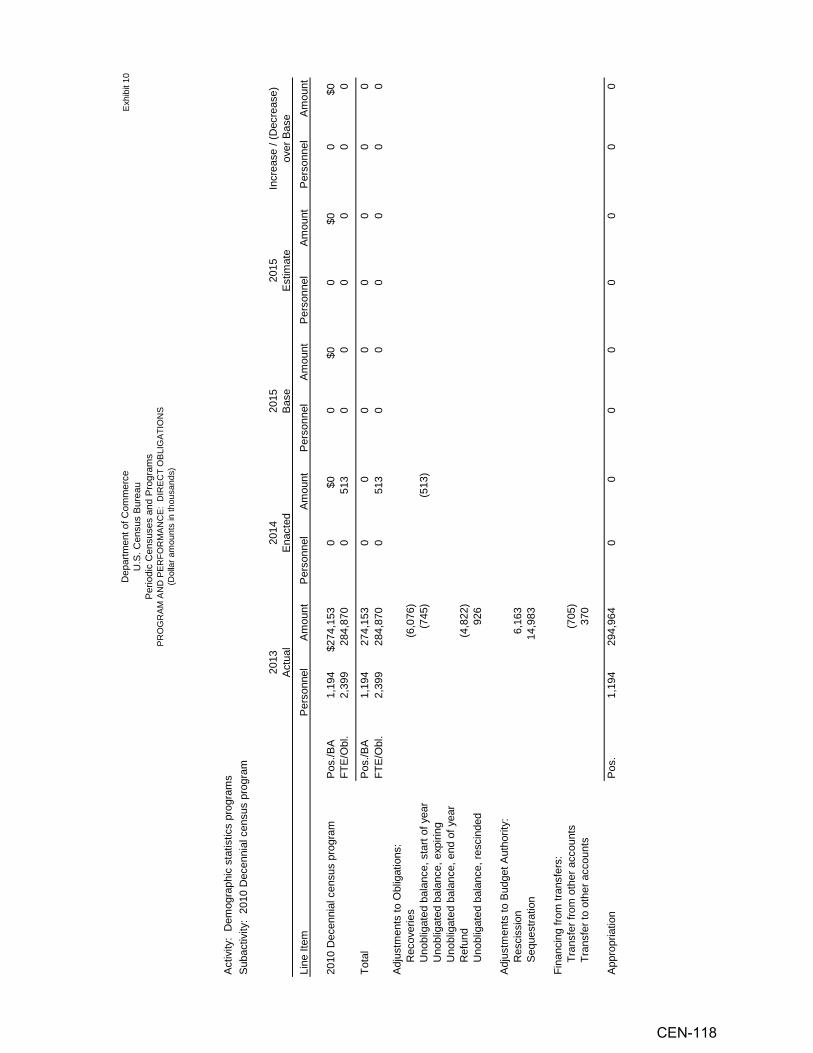
NS
OITA
GILs Bam O )ec
er ogr CT
ands
m eau r RE
om ur a
nd P
ent o
f C B
: D
Iho
usn
t
us es NC
E i
ens s
us AR
M ount
tm . C ens
O a
m
epar .S C R
Fc E la
r
Ui
ND
P ol
D odi
D
er
(
P AM
RA
GR
OP
Exh
ibit
10
Act
ivity
: D
emog
raph
ic s
tatis
tics
prog
ram
sS
ubac
tivity
: 20
10 D
ecen
nial
cen
sus
prog
ram
Line
Item
Per
sonn
elA
mou
ntP
erso
nnel
Am
ount
Per
sonn
elA
mou
ntP
erso
nnel
Am
ount
Per
sonn
elA
mou
nt
2010
Dec
enni
al c
ensu
s pr
ogra
mP
os./B
A1,
194
$274
,153
0$0
0$0
0$0
0$0
FTE
/Obl
.2,
399
284,
870
051
30
00
00
0
Tota
lP
os./B
A1,
194
274,
153
00
00
00
00
FTE
/Obl
.2,
399
284,
870
051
30
00
00
0
Adj
ustm
ents
to O
blig
atio
ns:
R
ecov
erie
s(6
,076
)
Uno
blig
ated
bal
ance
, sta
rt of
yea
r(7
45)
(513
)
Uno
blig
ated
bal
ance
, exp
iring
U
nobl
igat
ed b
alan
ce, e
nd o
f yea
r
Ref
und
(4,8
22)
U
nobl
igat
ed b
alan
ce, r
esci
nded
926
Adj
ustm
ents
to B
udge
t Aut
horit
y:
Res
ciss
ion
6,16
3
Seq
uest
ratio
n14
,983
Fina
ncin
g fro
m tr
ansf
ers:
T
rans
fer f
rom
oth
er a
ccou
nts
(705
)
Tra
nsfe
r to
othe
r acc
ount
s37
0
App
ropr
iatio
nP
os.
1,19
429
4,96
40
00
00
00
0
Incr
ease
/ (D
ecre
ase)
ov
er B
ase
2013
Act
ual
2014
E
nact
ed20
15B
ase
2015
E
stim
ate
CEN-118

IGA
TIO
NS
same
PR
OG
RA
M A
ND
PE
RFO
RM
AN
CE
: D
IRE
CT
OB
Ls)c ogr d
er r
m eau
P san
om urBC an
d ou thn
of us
es ts i
ent
ens
us nu
Cm mo
.t ens
epar S C. r aaU c ll
D odi
i (Do
erP
Exh
ibit
10
Act
ivity
: D
emog
raph
ic s
tatis
tics
prog
ram
sS
ubac
tivity
: 202
0 D
ecen
nial
cen
sus
prog
ram
Line
Item
Per
sonn
elA
mou
ntP
erso
nnel
Am
ount
Per
sonn
elA
mou
ntP
erso
nnel
Am
ount
Per
sonn
elA
mou
nt
2020
Cen
sus
Pos
./BA
485
$94,
412
840
$232
,687
840
$230
,767
1,68
0$4
43,1
8784
0$2
12,4
20FT
E/O
bl.
480
98,4
2184
023
2,70
684
023
0,76
71,
641
443,
187
801
212,
420
Am
eric
an C
omm
unity
Sur
vey
Pos
./BA
00
1,02
323
0,60
01,
023
234,
425
1,05
124
5,81
328
11,3
88FT
E/O
bl.
00
2,67
923
0,60
02,
679
234,
425
2,79
624
5,81
311
711
,388
Tota
lP
os./B
A48
594
,412
1,86
346
3,28
71,
863
465,
192
2,73
168
9,00
086
822
3,80
8FT
E/O
bl.
480
98,4
213,
519
463,
306
3,51
946
5,19
24,
437
689,
000
918
223,
808
Adj
ustm
ents
to O
blig
atio
ns:
R
ecov
erie
s(6
91)
U
nobl
igat
ed b
alan
ce, s
tart
of y
ear
(3,4
41)
(19)
U
nobl
igat
ed b
alan
ce, e
xpiri
ng
Uno
blig
ated
bal
anc e
, end
of y
ear
123
R
efun
d
Uno
blig
ated
bal
ance
, res
cind
ed
Adj
ustm
ents
to B
udge
t Aut
horit
y:
Res
ciss
ion
1,75
3
Seq
uest
ratio
n4,
236
Fina
ncin
g fro
m tr
ansf
ers:
T
rans
fer f
rom
oth
er a
ccou
nts
(16,
802)
T
rans
fer t
o ot
her a
ccou
nts
630
1,00
01,
551
App
ropr
iatio
nP
os.
485
84,2
291,
863
464,
287
1,86
346
5,19
22,
731
690,
551
868
223,
808
Incr
ease
/ (D
ecre
ase
over
Bas
e20
13A
ctua
l20
14
Ena
cted
2015
Bas
e20
15E
stim
ate
CEN-119

APPROPRIATION ACCOUNT: Periodic Censuses and Programs BUDGET PROGRAM: Demographic Statistics Programs For FY 2015, the Census Bureau requests an increase of $223,607,000 and 918 FTE from the FY 2015 base for a total of $698,926,000 and 4,499 FTE for Demographic Statistics Programs. BASE JUSTIFICATION: Demographic Statistics Programs Overview The Census Bureau’s mission is to serve as the leading source of quality data about the Nation’s people and economy. The Demographic Statistics Programs activity furthers this mission by providing key benchmark measures about the U.S. population. The Demographic Statistics Programs ($698.9 million and 4,499 FTE) budget is organized into two subactivities under the Periodic Censuses and Programs account. • The Intercensal Demographic estimates subactivity ($9.9 million and 62 FTE) consists of one
line item by the same name. • The 2020 Decennial Census Program subactivity ($689.0 million and 4,437 FTE) contains
the ACS and the 2020 Census. The Demographic Statistics Programs support the Department of Commerce’s Data goal to “Improve government, business, and community decisions and knowledge by transforming Department data capabilities and supporting a data-enabled economy." They specifically support objective 4.2 to "Improve data-based services, decision-making, and data sharing within the Department and with other parts of the Federal Government" and 4.3 to "Foster the private sector’s development of new data-based businesses, products and services." Both the Administration and the Congress have an interest in learning whether Federal policies and programs are succeeding or failing – for example, whether participants are getting and retaining jobs, and whether those who find jobs are earning good wages. Access to data on employment outcomes is critical to effectively analyzing policy and program results, and the current methods for gathering these data (surveys and separate agreements with states) are inefficient, time consuming, and increasingly cost prohibitive. The Budget proposes to narrowly expand access to the National Directory of New Hires Database to assess the effectiveness of federal policies and programs in achieving positive labor market outcomes and to provide demographic or economic statistics, including for the Census 2020 program. This proposal enables the Census Bureau access to these data in time to incorporate the data in its efforts to reduce the need to conduct in-person follow up interviews with non-responding households. This proposal would also allow several agencies a more reliable and affordable way obtain data essential for research, evaluation, and statistical purposes while maintaining necessary security, privacy, and confidentiality standards. Furthermore, the Demographic Statistics Programs will help conduct a more efficient 2020 Census by researching, testing, and developing a new design of the 2020 Census that maximizes the use of technology and other tools to reduce the cost while maintaining quality. Implications of alternate roles and uses of the ACS program infrastructure will be evaluated within the broader Federal statistical system and a comprehensive review of ACS carried out with the intent of reducing respondent burden.
CEN-120

SIGNIFICANT ADJUSTMENTS-TO-BASE (ATBs):
The Census Bureau requests a net increase of $0.2 million to fund adjustments to base for the demographic statistics programs activities.
SUB-PROGRAM: Intercensal Demographic Estimates
The Intercensal Demographic Estimates program assists elected officials and government program managers in allocating hundreds of billions of dollars each year by giving them updated estimates of the United States population for the country, states, counties, cities, and townships. Through this legislatively required program, policymakers and program managers are able to better understand their population’s size, as well as its basic characteristics such as age, sex, race, and Hispanic origin; and estimates of the number of housing units, in the years between the decennial censuses. Since the United States population grows and changes between decennial censuses – and governments base many of their funding decisions on the size and basic characteristics of the population – effective and efficient government requires these updated estimates.
Title 13, Section 181 of the U.S. Code requires the Census Bureau to produce annual data on the population size and certain population characteristics (age, race, ethnicity, and sex) for the Nation, states, counties, and local units of government with a population of 50,000 or more. This law also requires the Census Bureau to produce biennial estimates of total population for all local units of general-purpose government, regardless of their size. Further, the law specifies the use of such estimates by Federal agencies when allocating Federal benefits to states, counties, and local units of government when they are based on population size.
Among the Federal programs that use these intercensal estimates to allocate funds are the Department of Health and Human Services’ Medical Assistance Program (Medicaid), Social Service Block Grants/Entitlement Grants Program, and State Children’s Health Insurance Program; the Department of Housing and Urban Development’s Community Development Block Grant Program; and the Department of Labor’s Employment and Training Administration – Workforce Investment Act Dislocated Workers Program. Hundreds of billions of dollars in Federal funds are distributed to states and other areas based in some part on intercensal estimates. The Congressional Budget Office uses the intercensal estimates throughout their reports and analysis.
These estimates of the geographic distribution of the population are also used for making decisions about state and local government services, planning utility services, redefining metropolitan areas, and locating retail outlets and manufacturing establishments. Federal time-series that are produced on a per capita basis, such as per capita income, births per capita, and cancer incidence rates per capita, also rely on these estimates for their denominators. The intercensal population estimates are used as the controls for all household surveys conducted by the Census Bureau. These surveys have a major impact on the accuracy of the country’s key measures such as unemployment, inflation, income, poverty, and health insurance coverage. Intercensal estimates are essential to controlling variability in the surveys that provide these measures.
The Census Bureau is responsible for developing and implementing the technical methods that produce the estimates. Recent experience in the acquisition, processing, and integration of the various administrative and survey data related to international migration have led to improvements in the accuracy and reliability of the national population estimates. To produce
CEN-121
the sub-national estimates, population-modeling techniques are applied to a wide variety of administrative data, which must be processed and integrated.
The Census Bureau’s Intercensal Demographic Estimates Program has a cooperative program with the states, the Federal State Cooperative Program for Population Estimates (FSCPE). The Census Bureau established this partnership with the states in 1967 to foster cooperation in the annual production of population and housing estimates for states, counties, and subcounty areas. State members of the FSCPE provide input data for their respective state’s estimates and review the results prior to public release of the data. The state representatives also provide advice and guidance on technical issues involved in the production of estimates. This cooperative and collaborative process is essential in making the population estimates a reliable and useful indicator of how the United States changes between censuses.
The Census Bureau’s Intercensal Demographic Estimates Program also works with external researchers on evaluations of the population estimates methodology. In 2008, the program conducted a large research effort to evaluate the administrative records method, which is used to produce the population estimates at the national, state, and county level, against a series of alternative methods. This involved research internal to the Census Bureau and also external experts. The administrative records method performed well when compared to alternative methods. The Census Bureau conducted another large research project to evaluate the population estimates against the 2010 Census results. This effort involved internal and external researchers. The Census Bureau examined the administrative records method and the housing unit method. External researchers examined alternative methodologies for producing population estimates (e.g., the ratio correlation method, the housing unit method, etc.). In March 2012, the Census Bureau hosted a conference at which we shared the results of both the internal and external research on population estimates. The results of both the internal and external research documented the accuracy of the administrative records method when compared to the alternative methods. The general conclusion of the research was that the administrative records method is the best method to use for producing population estimates at the county, state, and national level. The use of administrative records is also cost efficient. It utilizes data that are collected by other government agencies (e.g., births, deaths, etc.) in the estimation process.
There are several metrics that are used to measure the effectiveness and efficiency of the program. The first of these is the yearly release of the population estimates. Under Title 26, population totals for the Nation and states must be released by December 31 of the estimates’ year. The program has met this deadline each year of this decade. Under Title 2, state estimates for the population aged 18 and over must be released to the Federal Election Committee the first week of January after the estimates’ year. This deadline has been met each year since 2006.
In addition, the Intercensal Demographic Estimates program releases on an annual basis population estimates by age, sex, race and Hispanic origin for the Nation, states, and counties. It releases population totals for sub-county areas and metro areas as well as population estimates by age and sex for Puerto Rico and the municipios. The program also provides estimates of housing units for states and counties. The goal is to release these estimates within 15 months of the estimate dates. The program has met this goal each year since 2006. For the Vintage 2012 estimates, all of the products were released by June 30, 2013.
Another metric used to measure the performance of the program is the delivery of survey controls. The population estimates are used as survey controls for all major surveys including the Current Population Survey which produces the official unemployment and poverty rates.
CEN-122
The population estimates are delivered each month to this survey for use as controls. The program has met each of these monthly deadlines since 2006. The program also delivers population and housing units to the ACS each year in May. This deadline has been met since 2006.
In addition to the above releases and deliverables, the program delivers population estimates to over 350 internal and external customers. The majority of the external customers consist of other Federal agencies, state agencies, and researchers.
PROGRAM CHANGES:
Inflationary Adjustment: The Census Bureau requests a decrease of $201,000 and 0 FTE for a total request of $9,926,000 and 62 FTE to meet the cross-cutting program reductions necessary to offset increased funding requirements for adjustments-to-base (ATBs). These cross-cutting reductions will be captured by managing on-going administrative savings, managing the backfilling of vacated positions due to attrition, and carefully monitoring all travel and training.
CEN-123

PROGRAM CHANGE DETAIL BY OBJECT CLASS (Dollars in thousands)
Budget Program: Demographic statistics program Sub-program: Intercensal demographic estimates Program Change: Inflationary adjustment
FY 2015 FY 2015Object Class Decrease Total Program
11 Personnel compensation11.1 Full-time permanent -$54 $5,267 11.3 Other than full-time permanent -3 218 11.5 Other personnel compensation 0 77 11.8 Special personnel services payments 0 0 11.9 Total personnel compensation -57 5,562 12 Civilian personnel benefits -119 1,767 13 Benefits for former personnel 0 46 21 Travel and transportation of persons 0 198 22 Transportation of things 0 9 23.1 Rental payments to GSA -13 808 23.2 Rental Payments to others 0 0 23.3 Communications, utilities and miscellaneous charges 0 126 24 Printing and reproduction 0 12 25.1 Advisory and assistance services -2 198 25.2 Other services -2 170 25.3 Purchases of goods & services from Gov't accounts 0 472 25.4 Operation and maintenance of facilities -2 166 25.5 Research and development contracts -1 49 25.6 Medical care 0 0 25.7 Operation and maintenance of equipment -4 256 25.8 Subsistence and support of persons 0 9 26 Supplies and materials -1 66 31 Equipment 0 12 32 Lands and structures 0 0 33 Investments and loans 0 0 41 Grants, subsidies and contributions 0 0 42 Insurance claims and indemnities 0 0 43 Interest and dividends 0 0 44 Refunds 0 0 99 Total obligations -201 9,926
CEN-124

SUB-PROGRAM: 2020 Decennial Census Program
The decennial census has been conducted since the birth of the Nation. It provides the official population counts for determining the allocation to states of seats in the U.S. House of Representatives and for determining how the districts are defined for those seats. The Census Bureau also provides state level data necessary for each state to determine congressional, state, and local legislative boundaries. The provision of these data is mandated in the U.S. Constitution, Title 13 of the U.S. Code, and P.L. 94-171.
The decennial census program, including ACS, provides comprehensive and useful demographic information about all people living in the United States, Puerto Rico, and the associated Island Areas. The program also provides data for small geographic areas and small population groups that Federal agencies need to implement legally mandated programs. Over $430 billion in Federal funding is allocated annually using information from the decennial census program.
PROGRAM CHANGES:
1. 2020 Census ($212,420,000, 801 FTE):
Fiscal Year 2015 is the fourth year of funding for research, early planning, development and testing for the 2020 Census. The FY 2015 budget request builds on the three years of early research and testing completed in FY 2012 – 2014. Fiscal Year 2015 is the first year of a four-year phase (FY2015 – FY 2018) focused on completing all research and testing while also beginning operational design,development, and system testing for the actual 2020 Census.
Fiscal Year 2015 is a critical year for the Census Bureau in the attempt to incorporate innovations into the 2020 Decennial Census design that will significantly contain costs while producing high quality data. Preliminary estimates of potential savings from such innovations are described on pp. CEN-127 - CEN-131, below. Due to funding constraints in FY 2013, the Census Bureau delayed or canceled field tests needed to provide the evidence necessary to evaluate the extent to which new and innovative methodologies are feasible, and to understand their potential impact on data quality. Consequently, the research and testing work in FY 2015 is the last chance to prove in design changes that can fundamentally change the way the 2020 Census is conducted.
For the 2010 Census, the Census Bureau opened and staffed over 500 management offices. The staff in these offices processed the case assignments and managed the work of over 750,000 employees who conducted address list development operations across the country and then conducted interviews with households that did not respond to the census. This field staff and infrastructure accounted for a large percentage of the 2010 Census costs. The research and development efforts for the 2020 Census are focused on addressing cost drivers so as to -potentially save billions of dollars in costs by dramatically reducing this staff and infrastructure. The Census Bureau also intends to significantly improve field staff productivity, streamline the management of staff in the field, and improve the efficiency of the myriad IT systems needed for the Census. Finally, by addressing the program management and systems engineering shortcomings experienced in the prior decade the Bureau can avoid the increased costs seen in the 2010 Census.
CEN-125
Operational research and development efforts include:
• Automating and integrating field operations on handheld devices in order to streamlinedecentralized management processes, so that we are less reliant on brick and mortar offices;
• Improving the management of staff in the field, so that we use data to maximize theirproductivity by planning their routes, determining the sequence of phone calls and interviews,and dynamically managing their case assignments;
• Exploring the best ways to leverage the internet to increase self response and decrease theamount of in person follow-up;
• Using data already provided to the government to enumerate many households that do notrespond to the census thereby reducing the number of interviews we have to conduct; and,
• Developing methods for focusing address list development activities on areas experiencingchange so that we only canvas a small portion of the country rather than walking nearly everystreet to check every address, as we have done in the past.
As discussed on pp. CEN-127 - CEN-131, below, these and other design changes we are researching have the potential to reduce the cost of the 2020 Census by over $5 billion compared to repeating the 2010 Census design and methods. Relatively small field tests in FY 2014 will provide evidence for the implementation of components of these innovations. In FY 2015, Census plans to conduct large integration testing to prove that the systems and operations in each area function in tandem with each other without diminishing data quality. The Census Bureau needs a field environment to ensure that census workers are equipped with devices (or transmit census applications to their own devices in a “bring your own device” approach), and then manage their work to increase efficiency and improve productivity. The Census Bureau also needs to test the systems and procedures for applying information already provided to the government to households that do not respond to the Census (rather than sending staff to conduct interviews with them). The Census Bureau needs to do this to prove in the feasibility of this operation and better understand potential trade-offs in data quality. The Census Bureau will begin to finalize our approaches to leveraging the Internet to increase self response through the use of e-mail, allowing for voluntary pre-registration, and other innovations that could make it easier for people to respond to the Census. The Census Bureau also will learn how to effectively apply new methods for providing telephone support, for both incoming calls from respondents and staff, and for calling households ourselves to conduct interviews. This will represent a new challenge for us because trends indicate that the capacity for a centralized telephone “call center” approach in the year 2020 may be insufficient to support the volume of telephone calls we anticipate that we will experience in the census. Therefore, the Census Bureau must develop and test a hybrid or decentralized approach. These are just a few of the key components of the 2020 Census that we must test and develop in FY 2015.
Another key focus of our work in FY 2015, will be continued research to nail down requirements for the multiple systems that will be in place for the 2020 Census. Internal systems will be leveraged for the Census, but in many cases they will have to be modified or dramatically scaled up to support a Census environment. For example, the Internet system must absorb as many as 8 million hits a day during peak Census operations. The Census Bureau will need contractor support for this, and the contracting offices must be in place in FY 2015 to meet Census deadlines. Whether the systems are internal or external, the Census Bureau knows from past experience that clearly defined
CEN-126

requirements are key to containing costs and developing successful and effective solutions. Research and development teams will be defining requirements for over 30 inter-related IT systems needed to conduct the Census.
Finally, research will continue or begin in other areas as well. These include methods for supporting people who predominately speak languages other than English (the Internet presents enormous potential for language support), linking respondents who do not have a census identification to the correct geographic location, new methods for evaluating the Census, and improving the statistical processes that ensure high quality data.
Potential Return on Investment
The Census Bureau will finalize major design decisions by the end of FY 2015, and will then publish a lifecycle cost estimate for the 2020 Census reflecting those major decisions. But to inform decision making prior these major design decisions, the Census Bureau has revised its 2020 Census lifecycle cost estimates. In 2011, the Census Bureau prepared rough order of magnitude (ROM) estimates for the 2020 Census lifecycle cost. In developing the FY 2015 budget request, the Census Bureau revised components of these lifecycle cost estimates. We are now able to provide preliminary revisions of these estimates because we have completed some research on the cost implications of certain alternative design features.
As a result, we now are able to better quantify some of the inputs to the estimates, but because we expect significantly more data to come from planned tests in FY 2014 and FY 2015, and because the research will further mature the design options along with their assumptions, the estimates are presented as ranges to reflect remaining uncertainty in the program. Once key design decisions are made at the end of FY 2015, the Census Bureau will publish overall baselined lifecycle cost estimates for the 2020 Census program that reflect those decisions. Also, we will continue to refine and narrow the ranges around these estimates beyond FY 2015 as we become more certain of the 2020 Census design and the prevailing economic and policy conditions likely to surround that census.
Fiscal Year 2015 is a critical year for conducting research about the feasibility and likely cost savings of design changes that can fundamentally change the way the 2020 Census is conducted so as to significantly contain its costs while still producing high quality data. The funding requested for FY 2015 is needed to implement this critical research leading up to key design decisions for the 2020 Census that must be made by the end of FY 2015. Estimates developed to date suggest that these innovations can reduce the lifecycle cost of the 2020 Census by up to $5.1 billion while maintaining the ability to produce high quality data. Without this funding and research, we cannot realize the potential savings for the 2020 Census program. FY 2015 also is the year we will begin development of key systems and operations to support the 2020 Census. Without sufficient FY 2015 funding for these efforts, our implementation efforts—and thus the 2020 Census itself—are at risk of operational failure.
In constructing these revised cost estimates, we used final actual data from the 2010 Census, and data from the 2020 Census research conducted to date, wherever possible to develop our input parameters. In areas where critical research results are still pending, we relied on subject matter experts at the Census Bureau. We then used sensitivity analysis to provide ranges of uncertainty around these cost estimates. The Census Bureau uses the Monte Carlo simulation method, which is considered a common and recommended practice by both the Government Accountability Office (GAO) and the International Cost Estimation and Analysis Association (ICEAA). For the chart and table below, we used a common practice of presenting Monte Carlo outputs at the 80th percentile
CEN-127

level, which translates to an 80% probability that funding at this level will be adequate to conduct the census.
The information below presents a range of estimated lifecycle cost savings for each of nine categories. Each category represents a census program area where we are researching design changes focused on cost savings for the 2020 Census. The categories are defined below, along with estimated ranges of cost savings for each based on 50% and 80% probabilities of adequate funding.
• Targeted Address Canvassing – In the 2010 Census, the Census Bureau mounted asubstantial operation late in the decade to update the Master Address File (MAF) and theassociated mapping system we call TIGER. During address canvassing, field staff walked almostevery street in the Nation to ensure that we captured every housing unit in the correct geography.This was one of the more expensive components of the census. For the 2020 Census, webelieve updating the MAF/TIGER system continually throughout the decade, and other research,will enable us to reduce overall costs by allowing us to target this updating to a subset of areasthat are experiencing change. [Estimated savings range from $990 million to $1,530 million].
• Field Reengineering Related to Address Canvassing – For the 2010 Census, we had to open150 temporary census offices, and hire over 155,000 temporary workers to conduct the addresscanvassing operation. Depending on our ability to target this work for the 2020 Census, we canconsider several models, ranging from the most expensive (with large number of local censusoffices supporting a large staff of interviewers) to the least expensive (with a relatively smallnumber of field offices supporting a limited field staff). [Estimated savings range from $50 millionto $590 million].
• Optimizing Self Response – Traditional procedures that offer the public opportunities to provideus with their data, followed by in person interviews with households that do not respond to thecensus, are inefficient, and this field work has been the most expensive component of pastcensuses. Efforts to control costs must include significant innovations in the ways we ask thepublic to respond to the census in the first place. We have to research and then implementresponse options for the census that reflect the communications environment in which people willlive in 2020. These include using mail, telephone, internet, face-to-face interviews, and otherelectronic response options that may emerge, to ensure that diverse subgroups of the population,including those that speak languages other than English, have every opportunity to submit theirinformation in any easy and cost effective way. [Estimated savings range from $550 million to$1,090 million].
• Using Administrative Records to Remove Vacants from Non-Response Follow-Up (NRFU)Workload – Using information already provided to the government to avoid making personal fieldvisits to discover vacant units for which no questionnaire was, or could be, returned. [Estimatedsavings range from $810 million to $1,090 million].
• Field Reengineering Related to NRFU Training, Supervisory Ratios – Given the number oftemporary workers hired for previous censuses, changing how we conduct nonresponse followuptraining, and changing how we organize the supervisory structure for field operations, offerpotential sources of major savings. [Estimated savings range from $550 million to $980 million].
• Field Reengineering Related to NRFU Automation/No Paper – Again, given the number oftemporary workers needed to make personal visits to non-responding addresses, significant cost
CEN-128

savings can be realized through increased efficiency of our field staff by using automation, case routing, and other techniques. [Estimated savings range from $960 million to $1,340 million].
• Field Reengineering Related to Local Census Office Space and Staff – By automating payroll, recruiting, and other HR functions so as to reduce the need for paper forms and data entry, we can reduce the number of office staff and the size of our temporary census offices. [Estimated savings range from $480 million to $850 million].
• NRFU Reengineering Related to Admin Records, Adaptive Design – Using information already provided to the government (e.g., administrative records), and making our field procedures and workload management more dynamic and real-time, we can reduced costs by increasing enumerator productivity. [Estimated savings range from $650 million to $920 million].
• Eliminating Coverage Follow-Up and Vacant Delete operations using Administrative Records – Again, through the use of field automation, and using information already provided to the government, we may be able to avoid the expensive data collection components of these operations. [Estimated savings range from $120 million to $370 million].
The savings above show the ranges of savings for each category, in successive order, building on the impact of the previous categories. Because of this interdependency, these savings ranges need to be viewed as connected efforts and not a list of options; one cannot simply segregate or eliminate a category to come to a different savings estimate.
CEN-129
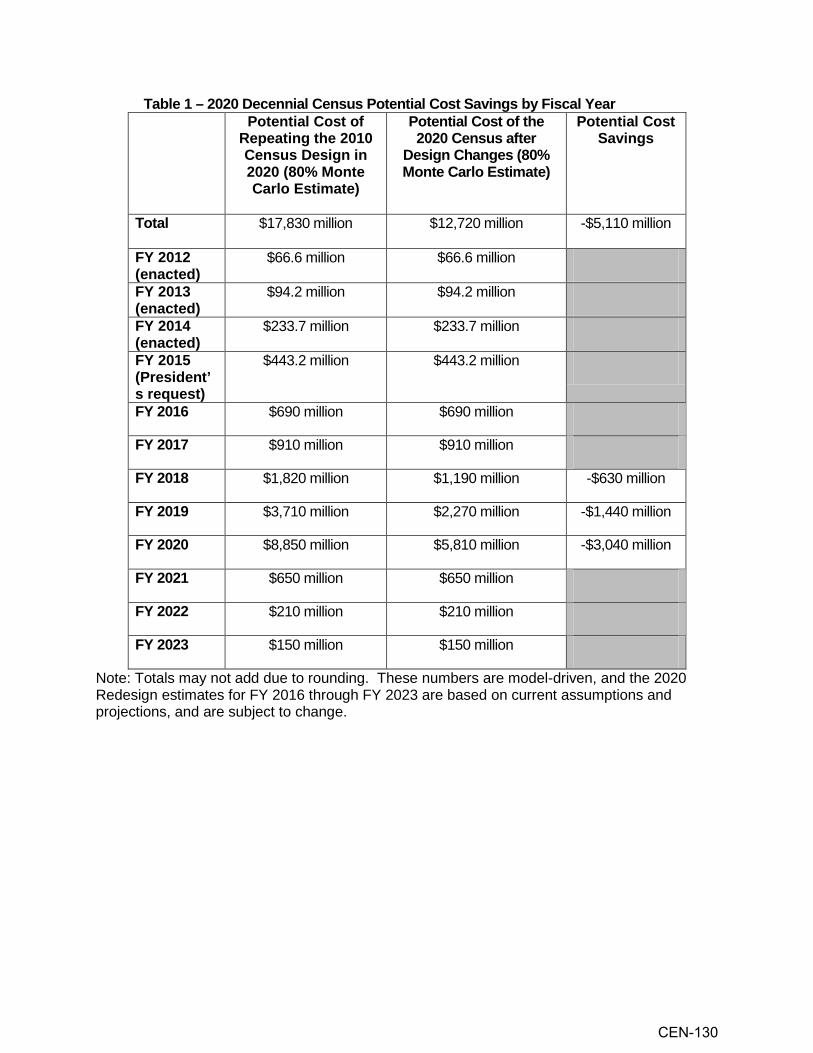
Table 1 – 2020 Decennial Census Potential Cost Savings by Fiscal Year Potential Cost of Potential Cost of the Potential Cost
Repeating the 2010 Census Design in 2020 (80% Monte Carlo Estimate)
2020 Census after Design Changes (80% Monte Carlo Estimate)
Savings
Total $17,830 million $12,720 million -$5,110 million
FY 2012 $66.6 million $66.6 million (enacted) FY 2013 $94.2 million $94.2 million (enacted) FY 2014 $233.7 million $233.7 million (enacted) FY 2015 $443.2 million $443.2 million (President’s request) FY 2016 $690 million $690 million
FY 2017 $910 million $910 million
FY 2018 $1,820 million $1,190 million -$630 million
FY 2019 $3,710 million $2,270 million -$1,440 million
FY 2020 $8,850 million $5,810 million -$3,040 million
FY 2021 $650 million $650 million
FY 2022 $210 million $210 million
FY 2023 $150 million $150 million
Note: Totals may not add due to rounding. These numbers are model-driven, and the 2020 Redesign estimates for FY 2016 through FY 2023 are based on current assumptions and projections, and are subject to change.
CEN-130

Chart 1
$67 $94 $234 $443
$690 $910
$1,820
$3,710
$8,850
$650 $210
$150 $1,190
$2,270
$5,810
$0
$1,000
$2,000
$3,000
$4,000
$5,000
$6,000
$7,000
$8,000
$9,000
$10,000FY
2012
FY20
13
FY20
14
FY20
15
FY20
16
FY20
17
FY20
18
FY20
19
FY20
20
FY20
21
FY20
22
FY20
23
Pote
ntia
l Cos
t (M
illio
ns)
Potential Cost Comparisons for 2020 Census by Fiscal Year
Repeat 2010in 2020
2020Redesign
The point estimates in the graph represent the 80th percentile level in the Monte Carlo simulations performed for this analysis (see note).
Note: Totals may not add due to rounding. These numbers are model-driven, and the 2020 Redesign estimates for FY 2016 through FY 2023 are based on current assumptions and projections, and are subject to change. For the chart above, the point estimates represent the 80th percentile level in the Monte Carlo simulations performed for this analysis. This represents the estimated value that will equal or exceed the true cost with 80 percent certainty. The differences between the two numbers reflect the savings at that 80 percent certainty level.
CEN-131

FY 2015 Key Program Activities
The FY 2015 key program activities continue building a strong foundation for managing, designing, developing, and testing new decennial census systems and methods. Consequently, the 2020 Census program management, systems engineering, research, development and testing efforts in FY 2015 center on:
• Establishing tools and processes to improve program management. In this regard, we will:o Strengthen the integration of budget, schedule and requirements by establishing the
tools and processes to implement earned value management and bolster integratedprogram control;
o Build performance measures and reporting dashboards to manage the programtransparently (internally and externally); and
o Enhance risk management processes to provide “off-ramps” and contingencies forthe Program.
• Investing in the management tools and processes to undergird the 2020 Census. A keyinitiative, building on 2010 Census lessons learned, includes a more focused effort onsystems engineering and integration. To that end, we will:
o Strengthen architectural tools and process to engineer our systems and avoidduplication,
o Establish more robust requirements processes, ando Build focused and iterative testing to mitigate risk of system failures.
• Using an iterative and agile testing approach, supporting and executing field tests intended toquickly assess critical components of the research agenda;
• Developing estimated workloads and operational timelines for data collection and capture(internet, phone, paper, etc.) to inform sizing decisions about the needed architecture andinfrastructure to support the workloads;
• Developing estimated workloads and operational timelines for field operations to informdecisions regarding the “brick and mortar” presence the 2020 Census has across the Nation;
• Designing, developing, and testing 2020 Census IT solutions, architecture, andinfrastructure that will leverage and support enterprise solutions;
• Conducting qualitative tests for evaluating the impacts of different modes on questionnairedesign, technical interfaces, and human reaction, culminating in a proposed set of 2020Census contact strategies and modes for self-response;
• Testing the coverage and quality of using administrative records for obtaining informationfrom nonresponding households, which could significantly reduce the cost of field operationsand free up resources to focus on hard-to-count populations, culminating in the proposed2020 Census strategy for administrative records usage in Nonresponse Followup ;
• Prototyping components of the integrated IT infrastructure, field automation, and workloadmanagement applications;
CEN-132

• Refining the Master Address File (MAF) error model to support assessing approaches toindependently measure error in the MAF in support of the a 2020 Address Canvassingoperation focused only on geographic areas experiencing change; and,
• Reusing existing systems to support field tests.
FY 2015 Project-Related Activities
The FY 2015 project-related activities will build on the previous years of the 2020 Census Research and Testing phase and embody the proof of concept work leading to preliminary design decisions that relate to the potential cost savings discussed on pages CEN-127 - CEN-131, above. During FY 2012, plans were developed and teams laid the groundwork for answering key research questions. In FY 2013, teams focused on refining the methodology and approaches for conducting research on various topics (e.g., use of administrative records to reduce field work; and the ability to identify geographic areas requiring address list updating). In FY 2014, we will conduct field tests to help narrow address frame, enumeration, and infrastructure options. In FY 2015, we plan to conduct large integration testing to prove that the systems and operations function in tandem with each other without diminishing data quality. The results will inform the following preliminary design decisions by the end of FY 2015:
• 2020 Census contact strategy and modes for self-response;• 2020 Census strategy for administrative records usage for nonresponse followup;• 2020 Census strategy for defining the field staffing structure and local census office
management structure;• 2020 Census strategy for managing field work more efficiently; and• 2020 Census preliminary operational design.
As a result of these preliminary design decisions, we plan to prepare for the award of acquisitions that will begin in FY 2016. In order to ensure that we have sufficient expertise, we are leveraging existing contracts, such as the Census Bureau’s existing Research and Development contract. Through this, we can reach a number of strong technical and research-oriented experts to support research and testing projects during this early planning phase. Further, the 2020 Census program will be included in an overall bureau-wide acquisition strategy for IT goods and services.
Specific areas of focus are listed below:
Census Frame Priorities (complimenting and augmenting the geographic support program)
• Refining the prototype, continuing analysis, and testing a MAF error model for use inunderstanding the ongoing quality of the MAF;
• Independently measuring MAF quality, including the identification of quality thresholdsthat will inform decisions regarding at what point Address Canvassing becomesnecessary;
• Conducting focus groups with governments to obtain insight on what changes in thestatutorily mandated Local Update of Census Addresses (LUCA) program arewarranted, especially given the potential for a geographically pinpointed addresscanvassing operation, and developing the 2020 LUCA implementation plans;
• Researching and testing new MAF extract rules and plans for standardizing MAFdefinitions across programs, and assessing the impact on data quality and coverage;and,
CEN-133

• Examining current MAF business rules and analyzing how changes to the business rulessupport improved data quality and coverage.
• Designing and planning of the geographic programs associated with the 2020 Census;• Refining and testing the use of automated applications for address list updating; and• Designing and planning the 2020 Census Address Canvassing operation in an
environment where only geographic areas identified as undergoing change will beincluded.
Enumeration Priorities
• Refining and testing electronic self-response strategies, such as a standard Internetoption and smart phone and email responses;
• Refining and testing the use of automated applications for field data collection, such asenumeration;
• Developing capabilities that leverage existing and emerging technology to increase theefficiency of field data collection activities, such as route planning;
• Refining and testing the feasibility of tailoring response modes by demographics andgeography;
• Refining the strategies around the use of administrative records to support and augmentresponse;
• Leveraging an automated environment to streamline the management of field staff;• Refining the use of adaptive design strategies, a method of managing survey and
census work to conduct data collection faster and cheaper with at least comparable dataquality;
• Refining and testing the methodology and solutions around how to link a physicaladdress to a response received without a unique identifier;
• Researching and developing methods for enumerating persons in group quarters;• Designing public use forms for decennial data collection such as paper questionnaires,
letters to respondents, and other printed and electronic materials;• Planning and early development activities for 2020 Census advertising and partnership;
and,• Researching ways to improve coverage in the 2020 Census with regard to topics such
as people with multiple residences, people missed in enumeration operations (such aschildren), and the identification and resolution of people or housing units that areduplicated in the census.
Infrastructure Priorities
• Developing and testing bureau-wide systems solutions for integrated data collection andprocessing;
• Developing and testing integrated information technology solutions;• Developing and testing the reengineering of the process timeline from notification,
through capture, processing, and response database development; and• Continuing research to enhance administrative records databases.
CEN-134

Proposed Plans and Deliverables by Investment Area
To organize the research, design, development, and testing work, we identified eight investment areas. The activities in these investment areas will be linked through a defined 2020 Census Work Breakdown Structure (WBS) so that for any given fiscal year it is clear what work is being done at what cost and where acquisitions are in their life cycles. The following is a description of the work and major deliverables in FY 2015 by investment area. Work in all these investment areas supports the key research that must be conducted in FY 2015, leading up to key design decisions for the 2020 Census that must be made by the end of FY 2015. As discussed on pp. CEN-127 - CEN-131, above, those decision will be key to our ability to realize potential savings of more than $5 billion for the 2020 Census program compared to repeating the operations and methods used for the 2010 Census.
Program management ($33,275,000 and 133 FTE) Funding supports overall management for the planning of the 2020 Census. Specifically, funding covers the significant task of refining and implementing strategic and program management processes. Program process areas include risk, change, issues, performance, schedule, sourcing, governance, communications, human capital management, and budget management. It also supports development and oversight of the program’s Research and Testing Plan and numerous program execution products, including acquisitions. Further, this funding supports interactions with oversight activities by the Government Accountability Office, the Office of the Inspector General, the Office of Management and Budget, and others and working with and supporting the Census Bureau, including the advisory committees. Key deliverables include:
• The FY 2016 Business Plan;• The FY 2015 Operating Plans;• Timely, accurate and consistent information that is targeted and relevant to each
audience/stakeholder's communication needs;• Metrics against which the program can be monitored and evaluated with regard to whether
the work is on track and the strategic 2020 program and project goals are met;• Integrated performance measurement baseline for applicable areas of the program, which
includes cost, schedule, scope, and quality objectives/requirements and the correspondingrisks (threats and opportunities) linked via the work breakdown structure;
• A human capital management plan that aligns with the strategic human capital initiatives ofthe Census Bureau and the Office of Personnel Management's guidelines for human capitalplanning;
• Support for the 2020 program in the planning, analysis, and decision making needed for in-house versus outsourced solutions;
• Development of processes to identify risks, analyze risks, develop mitigation and contingencyplans, mitigate risks, assess the effectiveness of mitigation activities, and periodicallyreassess risk exposure;
• Continuing the development of a fully integrated schedule with resource based activities thatcover the entire life cycle of the 2020 Program;
• Strengthening the development and application of trade off methodologies that allow us toexamine the impact of design alternatives on the cost of the 2020 Census and the impact ondata quality; and
• Implementing Portfolio Management, including Strategic Performance Management, to betteralign accomplishments against the 2020 program’s strategic goals and objectives andimplement on-going tracking of quantifiable performance metrics.
CEN-135

Systems engineering and integration ($31,404,000 and 78 FTE) Funding supports the implementation of a consistent systems engineering process for each development effort. It includes the implementation of a systems engineering process to integrate the components of systems, operations, and application development efforts into an enabling operational infrastructure. Key activities include: establishing and maintaining the 2020 Census program initial physical and logical architecture and design – leveraging the Census Bureau’s enterprise architecture to ensure that component systems designs are consistent with mandated standards and that they are designed to inter-operate as required. Activities also support a requirements development and management process to assure that operational requirements (and constraints) are fully understood and translated into technical requirements, and evolving operational and systems concepts of operation; conducting analyses of alternatives to identify preferred options, taking into account expected costs and benefits. Finally, activities cover leveraging a modular open system design to allow for necessary evolution of requirements and expected technology refresh opportunities; establishing a technical integration process to assure that separately developed components can and do operate cooperatively, consistent with the concept of operations; and establishing a systems engineering and integration function in support of the decennial census planning office. Key deliverables include:
• Refinement and implementation of an engineering strategy that enables individual projects todesign, develop, and implement specific solutions that are optimized at the appropriate levelto ensure efficient and effective operation of the 2020 Census within the Census BureauEnterprise. This includes ensuring that all system-to-system life-cycle processes conform toaccepted and enterprise standards according to the Chief Information Officer (CIO), and thedevelopment of processes for ensuring that the integrity/quality of data is managed acrossthe program;
• A 2020 Census Program architecture that is aligned with the bureau-wide enterprisearchitecture managed by the CIO and Chief Technology Officer (CTO). This includesdeveloping what-if scenarios to model and simulate 2020 design and development optionsbased on 2010 Census key business processes, modeling conceptual data and systemartifacts, as well as solution architectures. This includes developing the preliminaryEnterprise Architecture and requirements for the 2020 Census to ensure well-definedrequirements gathering and documenting process;
• Refined processes and management approaches to ensure that requirements and designsare fully understood, baselined, and tracked, and leading and managing the implementationof requirements engineering processes;
• Alignment of required Systems Engineering and Integration (SE&I) resources with programand project needs in order to provide a comprehensive resource plan. This includes ensuringSE&I processes are successfully integrated, tested, and verified to produce an integratedresult; the establishment of a common set of technical management standards andprocesses to ensure consistency throughout the 2020 Census life-cycle; and the provisionand implementation of a coordination strategy for the 2020 Census using Census BureauEnterprise Architecture (EA) and IT Management Services;
• Implementation of a security and privacy assurance strategy that enables individual projectsto design, develop, and implement specific Federal Information Security Management Act(FISMA) compliant solutions that are optimized at the appropriate level to ensure secureoperation of the 2020 Census within the Census Bureau enterprise; and
• Developing an acquisition planning structure to strengthen the process of standing up acontracting office and letting key contracts.
CEN-136

Census frame ($47,008,000 and 172 FTE) Funding for the 2020 Census Frame projects, together with the Geographic Support Systems Initiative, will ensure that the decennial census’ needs with regard to the MAF quality are well understood, adequately measured, and that deficiencies are addressed. Funding supports developing a comprehensive error model for the MAF to be used to measure quality needed for the decennial census; conducting independent MAF quality assessments, which are intended to ensure that quality measures are being met; and implementing a Local Update of Census Addresses (LUCA) improvement project for increasing the utility and efficiency of LUCA, especially in an address canvassing environment where only geographic areas undergoing change are included. All projects are crucial for ensuring that the 2020 Census begins with a high quality MAF, which is the single biggest predictor of a quality census. Key deliverables include:
• The provision of ongoing development and refinement of a statistical model to identifygeographic areas with coverage concerns, and efforts to support and complement the workof the Geographic Support Systems initiative, which includes decisions on the geographicareas that will/will not be canvassed as part of the 2020 Address Canvassing operation;
• The operational design and business process model for the 2020 LUCA program includingthe operational timeline, partnership participation options, partnership software, materials,training, and the LUCA Appeals process;
• A comparison and contrast of MAF data extraction rules based on the unique userrequirements for all Census Bureau programs. This includes exploring the incorporation ofnew methodology into decision criteria for address validity, and developing, testing andassessing new extract rules;
• An assessment of current MAF/TIGER business rules that considers modifications to thebusiness rules accounting for new types of address sources and the influences that modifiedbusiness rules have on coverage and data quality;
• The operational design and business process models for geographic programs including theBoundary and Annexation Survey, Participant Statistical Areas Program (PSAP), TribalStatistical Areas Program (TSAP), Count Question Resolution (CQR), Count Review, andBasic Collection Unit, and the development of operational timelines, operational inputs,operational outputs, partner communications, and other materials;
• The operational design and business process model for the implementation of the 2020Address Canvassing operation (including operational timeline, operational inputs, outputs,field procedures, and training) in alignment with 2020 design decisions;
• Support for the development of an application usable on commercially available devices thatallows the user to review and update an address list, collect Global Positioning System (GPS)coordinates, and update map features;
• The provision of data processing and field test planning, coordination, and logistical supportfor testing in support of Frame Investment Area Projects; and
• Frame activities involved with conducting a contact frame and non-ID processing test. Thistest will allow us to develop alternative methods for contacting households, and to attachaddresses to responses that do not have a census identification code ensuring they areplaced in the right geographic location or counted at all (a costly, field-based operation in priorcensuses).
CEN-137
Enumeration ($153,085,000 and 660FTE) Funding supports expanding, automating, tailoring, and increasing the efficiencies and methods of response. It includes projects that attempt to reduce paper, make it easier to be counted, and that tailor response modes to geographic or demographic groups. With multiple automated self-response options available, such as Internet response, we can engender higher self-response, resulting in decreased cost and increased quality (since self-response is typically of better quality than enumerator-completed response). This investment area also includes examining mechanisms for using data and automation to streamline field operations for enumerating households.
In this investment area, projects cluster into several areas: (1) workload management, including the development of automated systems that will bring efficiencies to management of field operations , such as a Multimode Operational Control System that provides dynamic case workload assignments to different contact and data collection modes, and implements adaptive survey design.; (2) optimizing self-response, which includes investigating new electronic modes (such as internet response), new contact modes (such as text messaging and email addresses); (3) investigating alternative approaches and methodologies to field response follow-up, including alternative contacts (such as cell phone and email),; and (4) automating the field infrastructure, in which we investigate how to design and implement efficient field automation. Key deliverables include:
• Support for activities to make field operations more efficient through enhanced use oftechnology, improvements to data quality during field operations through enhanced use oftechnology, and explorations of the feasibility of commercially-available hardware-independent solutions;
• Support for the planning, development, and implementation of an application used by fieldstaff to enumerate nonresponders;
• Strategies for reducing nonresponse contacts, including tailoring strategies bydemography/geography, utilizing alternative contact modes, and tailoring contact frequency.This includes efforts to explore candidate options for enumerating various hard-to-countpopulations;
• Support for development of systems to implement dynamic case management and routeplanning;
• Strategies that optimize self-response methods/modes and time frames for notifying,reminding, and following up with respondents. This includes extensive use of the internet,and the exploration of other contact frames that are proven to be cost-beneficial withoutreducing quality;
• Plans for an integrated and consolidated systems for response processing, universe control,cost and progress, reinterview, data capture, and the operations control systems into oneintegrated management architecture so as to optimize efficiency, consistency, tracking andreporting of workloads;
• The development and testing of the most effective way to provide the Nation's diversecommunities with the opportunity to respond to the 2020 Census in languages other thanEnglish, and manage integration and coordination of the decennial language requirementsacross program areas;
• Strategies for implementing methods to link respondent or enumerator provided addressesto an existing MAF record, and as needed, assign it to the correct physical location andderive the associated geographic codes. This includes designing and implementing amethod to consistently and accurately verify the existence and location of Non ID caseswhich do not match to a living quarters in the Census master address list;
CEN-138
• Plans for developing and testing questionnaire content, including an integrated plan forcontent development and testing covering all aspects of the 2020 Census form and relatedpublic use forms;
• Support for the preparation and award of an advertising contract and the development of amarketing and partnership strategy for the 2020 Census. This includes the development ofthe audience segmentation model, and preparation for the maintenance of an external website;
• Support for the planning, development, and implementation of a partnership program for the2020 Census. Activities include consultation with stakeholders to elicit a wide range ofoptions and strategies for ensuring an effective partnership program in support of publicparticipation in the 2020 Census;
• Definition, development, and implementation of paper data capture capabilities, interfaces,etc. to support the timeline and scale of the 2020 Census;
• Definition, development, and implementation of internet response capabilities, interfaces, etc.to support the timeline and scale of the 2020 Census;
• Definition, development, and implementation of operator assisted and automated telephonedata collection and questionnaire assistance capabilities, interfaces, etc. to support thetimeline and scale of the 2020 Census;
• Definition, development, and implementation of capabilities, interfaces, etc. to support theidentification of the universe for each census operation and maintain control of theenumeration process according to the 2020 Census timeline and scale;
• Defininition and development of the operational implementation requirements for conductingthe 2020 Census of American Samoa, the Commonwealth of the Northern Mariana Islands,Guam, and the U.S. Virgin Islands. This includes performing liaison activities with the IslandArea governments and ensure integration with planning for stateside, where appropriate;
• Definition and development of the operational implementation requirements for conductingthe 2020 Census in Puerto Rico. This includes performing liaison activities with the PuertoRican government to ensure integration with the planning for stateside;
• Planning development and testing of methods for enumerating persons in group quarters.This includes investigation of administrative records as a means of enumeration and pursuitof internet as a response option. Additionally, this will involve revisiting group quartersdefinitions/classifications, developing methodologies for updating the inventory of groupquarters, developing application and system requirements, and consulting with experts andnational/local stakeholders on issues of definitions/classifications, inventory maintenance,and enumeration;
• Support for the research and implementation of coverage improvement procedures toaddress the unduplication of the persons and housing units that are counted multiple times inthe census;
• Providing field planning, coordination, and logistical support for testing in support ofEnumeration Investment Area Projects;
• Conducting integration testing to prove that the systems and operations in each area functionin tandem with each other without diminishing data quality; and
• Field activities involved with conducting a contact frame and non-ID processing test. This testwill allow us to develop alternative methods for contacting households, and to attachaddresses to responses that do not have a census identification code ensuring they areplaced in the right geographic location or counted at all (a costly, field-based operation in priorcensuses).
CEN-139

Response processing ($15,098,000 and 42 FTE) Funding supports continued explorations to improve coding, editing, and imputation of missing count and response items. During FY 2015, we will continue to test options to improve the efficiency and integration of these three related processes and to test new options for conducting item and count imputation. Key deliverables include:
• Approaches for the implementation and testing of coding, editing, and imputation methods,timing, and data sources;
• Support for overall coordination, modification, and integration of the headquarters processingenvironment and approaches to software development/modification to reengineer systemsused for processing response information and implement "best practice" approaches; and
• Definition of requirements, development and testing of applications/systems to create acommon interface the with Mulitmode Operational Control System (MOCS)1. This includesdeveloping a combined system interface for the MOCS, as well as identifying systems, sub-systems, and components, which can be combined for ACS and 2020 without disruption toeither program.
Data products ($16,625,000 and 56 FTE) Funding supports the determination of data product needs (content, media, etc.), ongoing maintenance and support for a data access and dissemination system, and planning for production processes. Key deliverables include:
• The continued deployment, enhancement, and maintenance of a system such as theAmerican Fact Finder that disseminates Census data products; and
• Support for Census planning, consultation, and partnership with the individual stateredistricting offices, and within the National Council of State legislatures, as we plan for the2020 Census PL 94-171 data products.
Evaluative programs ($12,658,000 and 50 FTE) Funding supports the definition and design of programs, applications, and systems to assess the quality and completeness of the 2020 Census. Key deliverables include:
• Definition, development, and implementation of a Demographic Analysis (DA) program thatoptimally utilizes available and new data sources. Considers the uses of administrativerecords to enhance the DA program and incorporates new data sources once validated;
• Support for the design and development of the 2020 Census Coverage Measurement(CCM) program. Activities include assessing improvements that could be implemented,assessing the extent to which CCM operations should be automated, and assessing theimpact that a new 2020 design will have on the 2020 CCM approach; and
• Support for early efforts to look beyond 2020 towards how the 2030 Census could beimplemented. This includes supporting the design of experiments around the potentialdesign of the 2030 Census that can be conducted as we test 2020 methodology and/orimplement the 2020 Census to ensure we collect data to inform decisions about potential2030 Census designs.
Infrastructure ($134,034,000 and 450 FTE) Funding supports developing, improving, consolidating, streamlining, and integrating IT and field infrastructures. Projects supporting this include:
1 The Multimode Operational Control System (MOCS) is a component of the Census Enterprise Data Collection and Processing Initiative (CEDCaP). The MOCS is “executor” and operational brain that controls data collection. This enterprise solution will make dynamic case workload assignments to different contact and data collection modes, enabling Adaptive Survey Design capabilities.
CEN-140

• Researching and examining improved matching techniques assessing applicability forvarious decennial census applications;
• Researching and enhancing administrative records data sources looking at quality,coverage, and timeliness of data;
• Researching and testing alternative contact frames (such as email) for both self- andnonresponse;
• Testing the use of administrative records to reduce nonresponse operations as well as usingadministrative records to supplement nonresponse data;
• Studying privacy and confidentiality concerns; Researching and testing the utilization oftechnology (such as Global Positioning System coordinates) to improve quality control;
• Researching and gathering data on alternative training techniques, including computer-based training; expanding on the Integrated Logistics Management Study – investigatingprocess improvements associated with large-scale deployment of equipment, materials, andpersonnel, as is the case with a decennial census; and,
• Standing up a Local Census Office (LCO) test bed that provides an environment throughwhich we can model LCO functions and applications for process improvement and earlyprototype development and testing.
If Bureau-wide, streamlined, and integrated approaches are adopted, there will be fewer and more compatible systems, hence decreasing costs, increasing quality, and having transferable systems and methods. Further, should the field infrastructure and logistics model be streamlined, significant cost and time savings will occur. Key deliverables include:
• Support for the development, coordination, and testing of quality control activities acrossprojects; manage quality control integration; and develop reporting systems and software;
• Support for the continued assessment of existing and new administrative records sources bydemography and geography;
• Support for the ongoing assessment of current public perceptions about the decennialcensus, internet response, use of administrative records, and other such issues;
• Support for the design, development, and implementation of matching techniques (bothexisting and emerging) to identify optimal methods for address and person matching;
• Support the design and implementation of alternative contact information to connect withrespondents;
• Support the ongoing research to assess the coverage of administrative records fornonresponding units and to develop a methodology for the use of administrative records toreduce the nonresponding universe;
• Support the development and implementation of new training approaches (includingexpanded use of automated techniques) to improve the efficiency of training field staff so asto obtain quality data at lower costs;
• Support the planning and implementation of requirements for the hierarchy of field offices,staffing, space and equipment;
• Support the planning and implementation of requirements, procedures and training forRegional Census Center (RCC) and Local Census Office (LCO) management for the 2020Census;
• Support the ongoing efforts to define, develop and implement a virtual office computingenvironment and the ongoing support of the field office environment and infrastructure that
CEN-141
can be used as a test bed throughout the 2020 Census planning, development, and testing phases;
• Support the implementation and testing of a Bring Your Own Device (BYOD) approach toconducting the 2020 field operations, including the investigation of the technical and policyside of a BYOD strategy, and the monitoring of how other government and/or privateorganizations have deployed BYOD strategies;
• Support for the development of processes, methods, and systems for providing centralizedsoftware testing, release, and repository of all versions of software used in support ofresearch and field tests;
• Support for the development of requirements, development, implementation, and testing of aweb-based interface that the public can use to respond to the Census and to tell the CensusBureau how they want to be contacted and how they want to respond to the 2020 Census ,and to learn the status of their response, and/or to request assistance;
• Support for the planning, development, testing, and implementation of an innovative andcomprehensive recruiting strategy to attract sufficient numbers of applicants with the skillsneeded to conduct Census operations efficiently and effectively;
• Support for the planning, development, implementation, and testing of requirements for apersonnel and payroll system that will allow us to recruit, hire, and pay staff working on the2020 Census;
• Support for the planning and implementation of an integrated logistics management systemfor managing inventory and shipment of forms, equipment, supplies, etc. to census fieldoffices; and
• Field test planning, coordination, and logistical support for testing in support of InfrastructureInvestment Area Projects. Support includes activities such as specification and creation ofinput/output files, training materials, and field procedures to enable the conduct of the test.This includes support for activities necessary to establish local census offices, as appropriate.
Linkages with Other Initiatives/Programs
The 2020 Census program will take advantage of related work across the Census Bureau. Therefore, we have identified specific relationships and interactions, not only between and among program projects, but also with other initiatives/programs, particularly with the expansion of the Geographic Support System Initiative and the Census Enterprise Data Collection and Processing Initiative. The following is a summary of the interdependencies.
• Supplemental and complementary research is included in the Geographic Supportprogram. To ensure no duplication of effort, clear project-by-project delineation will bedecided to guide which activities belong in the Geographic Support program and whichare required for 2020 Census. Specifically, 2020 Census frame-related projects arefocused on developing independent, customer-focused methods for understanding errorin the MAF, measuring MAF quality over the decade, improving LUCA, understandingMAF/TIGER updating business rules, developing MAF extract requirements, definingand developing geographic programs, and planning the 2020 Census AddressCanvassing operation. Results will flow in both directions between the GeographicSupport program and 2020 Census research projects;
• Integration of the design and development of the 2020 Census data collection andprocessing requirements with efforts to design and develop an enterprise data collectionand processing system;
• Integration of appropriate testing into the ACS Methods Panel infrastructure;
CEN-142

• Exploration of opportunities for bureau-wide architecture and IT solutions, with the ChiefInformation Officer as the systems overseer for enterprise IT solutions; and
• Integration of key components of the field infrastructure into all planning.
Statement of Need and Economic Benefits
The multiyear integrated program for planning, testing, and developing the constitutionally mandated decennial census begins with developing and solidifying the research and testing infrastructure in FY 2012 and continues through FY 2015. The vision is an efficient and quality census supported by corporate systems, methods, and infrastructure. The expected results of the approaches for the 2020 Census are described below. And, as described on pp. CEN-127 - CEN-131, the likely savings from these new approaches could save over $5 billion compared to the approaches used for the 2010 Census. These are not exhaustive but are meant to highlight areas where approaches for the 2020 Census specifically strive to overcome some of the problems encountered in the 2010 Census. Further, we describe the potential program return on investment.
• Establishing early program integration and common vision setting, and aligningmajor program control points.
o 2020 Approach: Development of the strategic plan early in the life cycle to guidesubsequent plans and work. A full life cycle, integrated schedule, including a WBS,will link budgets, work, acquisitions, and testing.
o 2010 Approach: Program management plans were not an early priority, resulting inthe need to finalize these plans late in the cycle in response to crisis. Scheduleinformation was not always linked to the budget, resulting in the lack of an integratedview of the full life cycle with schedules and budgets out of alignment.
• Estimated costs better aligned with actual costs.o 2020 Approach: Use of a budget approach that incorporates successive
approximation techniques for reduced uncertainty, and allowing for alternative costestimates in FY 2013 and greater precision the closer we get to FY 2020.
o 2010 Approach: In 2000, the Census Bureau had to develop a full life cycle budgetfor the 2010 Census before work on the actual design for 2010 had even begun.This resulted in a misalignment between budget and schedule, causing us to repeatsome issues that occurred during Census 2000.
• Reduced contract risk and solutions to better meet actual program needs.o 2020 Approach: Adoption of an overall 2020 Census acquisition strategy for external
contractor support that is fully integrated with the Department of Commerce’sacquisition guidelines. This strategy will include sourcing process criteria to enforceand document in-house/out-source and build/buy decisions.
o 2010 Approach: Use of multiple acquisition strategies, resulting in late or incompleteacquisitions and misalignment of budgeted costs to contractor proposals, causingearly re-scoping.
CEN-143

• Fewer and less severe risk events.o 2020 Approach: Initiation of risk management at the beginning of the planning cycle
allowing early risk mitigation in the decennial census research and testing cycle.
o 2010 Approach: No formal mechanism to manage risk until the production phase ofthe program. This means during the R&D phase, risks sometimes escalated toissues.
• Better metrics for determining how the program is progressing across numerousprojects.
o 2020 Approach: Define a Performance Management Plan, which includes EarnedValue Management, for all projects in the program to illustrate how a project’sperformance measures are related to its specific problems, goals, and objectives.
o 2010 Approach: Performance Management was not systematically used, resulting inapproaches being designed on an ad hoc basis to communicate how each project inthe program was progressing. Earned Value Management was used mainly formajor contracts.
• Increased efficiency, reduced costs, higher quality, and reduced data collectiontimeline and/or lower differential undercount.
o Self-Response Options
2020 Approach: Investigation of a wide array of electronic self-responseoptions; also researching and testing of response modes that can be tailoredby demographics and geography.
2010 Approach: Initially investigated the use of an Internet option butdropped plans based on IT security concerns and cost-benefit analysis.Implemented targeted replacement mailings and a bilingual form.
o Nonresponse Options
2020 Approach: Research and testing automated data collectioninstruments, use of alternative modes of data collection, testing the use ofadministrative records in various nonresponse applications, and the use ofmore efficient strategies for traditional nonresponse follow-up, includingreduced number of contacts and alternative contact modes (e.g., email).
2010 Approach: Initially planned the use of handheld computers forNonresponse Follow-up but dropped those plans due to major contractmanagement issues. As a contingency, used a traditional paper-based,labor-intensive, and expensive nonresponse approach (involving up to sixcontacts).
CEN-144
o Headquarters and Field Automation
2020 Approach: Research and testing an integrated data collection andprocessing systems and automation of field operations, including a prototypefor a bureau-wide listing and enumeration device and a standard operationalcontrol system that can be used for other surveys (not just the short-formcensus).
2010 Approach: As contingencies to the Field Data Collection Automationcontract, the 2010 Census ended up using separate operational controlsystems, two listing devices, and no automated enumeration devices,resulting in additional expense, higher risk due to the decision to go back topaper coming late in the program, and potentially higher error rates.
o IT Infrastructure
2020 Approach: Research and test the feasibility of a common ITinfrastructure (i.e., hardware, software, telecommunications, operatingsystem) for decennial and demographic programs.
2010 Approach: One-of-a-kind systems were developed solely for the 2010Census that became somewhat obsolete at the end of the census.
o Administrative Records
2020 Approach: Conduct research to pursue various uses of administrativerecords to increase the efficiency of the 2020 Census, while maintainingquality. In addition, the Census Bureau will expand research capabilities bycreating a Record Linkage Research team. This team will investigate linkagealgorithms, data cleaning techniques, parameter setting, data processingtechniques for large files, and data quality measures for both input files andmatched output.
2010 Approach: Use of the administrative records database (including taxrecord data) in highly restricted and limited applications.
Risk Assessment
Innovations and improvements are necessary to control the cost of undertaking the 2020 Census. However, it is equally imperative that the 2020 Census produces high quality data. The 2020 research agenda enables the Census Bureau to achieve these twin goals by providing the technical evaluation of alternative census designs, including examining major aspects of completing a decennial census and performing analyses of proposed methods for improving coverage, data quality, timeliness, and cost effectiveness. Our research agenda is very aggressive with the goal of refining/deciding on key preliminary design decision(s) by the end of FY 2015. Continued investment in this initiative is critical to achieving that goal. In fact, it is unlikely we can achieve the potential savings described on pp. CEN-127 - CEN-131 unless we receive funding in FY 2015 to conduct the critical research about the design changes that could produce these savings.
Stakeholders demand a very high quality and accurate 2020 Census that is conducted at a cost that is less per housing unit than the 2010 Census adjusted for inflation. To achieve this goal, research
CEN-145

and testing for alternative 2020 census designs must be conducted now in order to select and begin to implement a 2020 Census design. If the research and testing of the 2020 Census design alternatives is not funded at the requested level, then the Census Bureau may decide on a preliminary design decision(s) that results in substantially lower coverage than the 2010 Census baseline design, resulting in our inability to meet quality goals and/or the implementation of a less cost-efficient design. This would significantly impact the Census Bureau’s ability to achieve this high priority goal and the expectations of Congress.
2020 Census Program: Outcomes of a Successfully Redesigned Decennial Census
The new design for the 2020 Census will produce the Nation’s population counts needed to meet the Constitutional mandate of producing counts once each decade for apportioning the seats in the U.S. House of Representatives among the states.
The Census Bureau’s objective is to develop a preliminary design(s) based on solid research aimed at achieving the goal of conducting the 2020 Census at a lower cost than the 2010 Census (per housing unit on an inflation-adjusted basis) while maintaining high quality results. As mentioned above (pp. CEN-127 - CEN-131), we have the potential to conduct a quality census in 2020 at a cost savings of over $5 billion compared to repeating 2010 Census methods.
In addition, data collected from the 2020 Decennial Census and the ACS will improve the Nation’s ability to:
• Determine the boundaries of congressional, state, and local legislative districts;• Allocate Federal funds for state, local, and tribal governments (estimated to be over
$430 billion annually2);• Monitor and evaluate Federal legislation;• Develop plans for roads, schools, hospitals, and community and job training centers;• Conduct business research; and• Support Federal, state, tribal, and local government responses to emergency situations.
2 See http://www.census.gov/prod/2009pubs/govsrr2009-1.pdf andhttp://www.brookings.edu/research/reports/2010/07/26-acs-reamer
CEN-146
2. American Community Survey ($11,388,000, 117 FTE):
In FY 2015, the American Community Survey’s budget increases from $234.4 million to $245.8 million. We will use the $11.4 million increase to reduce current and emerging program risk by (1) strengthening production activities with the program, (2) conducting research focused on reduced respondent burden and increased program efficiency, and (3) improving program technology.
Production Due to budget constraints, ACS production has had to operate at a suboptimal level. Therefore, we will restore our production operations back to an acceptable level.
• Restoring 12-month Interviewing: Due to the shutdown in October 2013, ACS lost onemonth of data collection. This resulted in a decrease in sample size, adversely affecting the quality of data for small areas and communities. Therefore, in Fiscal Year 2015, additional funds are needed to resume our 12 months of interviewing.
• Restoring the Failed Edit Follow-up (FEFU) Operation: FEFU is a critical data qualityimprovement operation that collects data that was left incomplete by respondents.Downscaling the FEFU operation in FY2013 and FY2014 has increased missing data ratesfor mail and Internet respondents, which has reduced data quality. Based on an analysis of15 key questions, the average missing data rate was 5.5 percent prior to the FEFU cut. Afterthe FEFU cut was implemented, the average missing data rate for the 15 key questionsincreased to 8.5 percent. In order to improve data quality, FEFU will be restored.
Research We will conduct research aimed at reducing respondent burden and increasing program efficiency. Therefore, three high priority research projects for FY15 include: ensuring the relevance and statutory strength of questionnaire content; addressing respondent burden and perceived intrusiveness by changing our data collection procedures; and testing adaptive design methods that have the potential of increasing productivity of our workforce.
• Ensuring Questionnaire Content Relevance and Statutory Strength: In FY2014, theCongress asked the Census Bureau to conduct a comprehensive review of all ACS survey questions to ensure that they contain only those necessary to support the needs of the Federal Government and the American people. Without sufficient funding to support this multi-faceted project, we will not be able to ensure minimizing respondent burden by only asking those questions that are necessary.
• Innovating Data Collection Procedures: Congress has raised concerns about the ACS’data collection procedures. In response, we began examining approaches to reducerespondent burden and perceived intrusiveness. Without funding to fully understand theimpacts of changing data collection procedures, we will not be able to guarantee maintaininghigh quality data while reducing respondent burden and perceived intrusiveness.
• Introducing Adaptive Design Methods: Adaptive design methods have a strong potentialto result in cost savings and improvements in operational efficiencies. The ACS program willplay a major role in early operationalization of these methods at the Census Bureau byimplementing aspects of Adaptive Design in early 2016. Without sufficient funding in 2015 toresearch adaptive design techniques, operational delays will occur potentially leading todelays in program efficiency and an inability to minimize respondent burden. Without early
CEN-147
implementation in the ACS, we jeopardize the implementation of robust adaptive design methods in the 2020 Census where there is the potential for major cost savings.
Technical Program Improvement In 2015, we will implement much needed systems engineering improvements to the ACS by:
• Reducing system development risk by ensuring system integration and comprehensivetesting;
• Modernizing our web-based application to meet emerging needs;• Enhancing our data product production processes and outputs to meet stakeholder
expectations; and,• Providing new data dissemination mechanisms that are focused on the needs of our data
users.
Without investing in technological advancements, we cannot ensure the continuing ability to effectively process and tabulate the 11 billion program estimates. If our data products do not stay relevant with respect to the information we provide and the dissemination methods, then the ACS will not be able to keep up with changing data trends and needs of the data user community.
Linages with other programs
The ACS Program will take advantage of and participate in related work across the Census Bureau. The following is a summary of these.
• System Integration:o The ACS is participating in, and in fact, is critical to the Census Enterprise Data
Collection and Processing (CEDCaP) initiative, as being part of the Baseline 1implementation.
o The ACS is participating in the development of the Corporate Listing andMapping Solution, focused on developing a common application for address andmap updating across all surveys and censuses.
• Research:o Integration of appropriate ACS research and testing into the 2020 Census
research and testing in relation to Internet implementation, messaging, contentand contract strategy methodology.
o Potential use of Administrative Records data for the American CommunitySurvey to help reduce respondent burden.
Statement of Need and Economic Benefits
The ACS releases over 11 billion estimates each year. This is a tremendous amount of information used by Federal and non-Federal data users. ACS results in conjunction with other Census data are used to distribute more than $400 billion of Federal dollars each year. State, Tribal and local governments use ACS estimates to inform a variety of planning decisions, including where to build new schools and hospitals, and where to focus public transportation efforts. Business and non-profit organizations use ACS estimates to determine where to locate and to predict the types of products or services that may be needed in a given geographic area. Some examples include:
CEN-148

• Federal, state, local, and tribal governments: Federal Government agencies use ACSestimates to inform public policy, distribute funds, and assess programs. For example, theU.S. Department of Veterans Affairs uses ACS estimates to evaluate the need for healthcare, education, and employment programs for those who have served in the military, andthe U.S. Department of Education uses ACS estimates to develop adult education andliteracy programs. Information from the ACS is critical for state, local, and tribal policymakersand planners as well.
• Business: Business use ACS estimates to determine where to locate and to predict thetypes of products and services needed in a given geographic area. For example, Targetuses ACS data to differentiate between urban vs. suburban stores and shoppers, so they canin turn adjust the size and types of products (e.g., furniture and clothes) in different stores.
• Nongovernmental organizations: ACS estimates are freely available to the public and areroutinely used by researchers, non-profit organizations, and community groups to designfurther business ventures, and to apply for funding in the form of grants and donations forcommunity projects.
• American Indians and Alaska Natives: ACS estimates are used by tribal planners andadministrators, as well as national organizations serving American Indians and AlaskaNatives to plan for future economic development, housing needs, and access to health andeducational services for American Indians and Alaska Natives.
• Emergency Planners: Emergency Planners use ACS estimates to find local statisticscritical to emergency planning, preparedness and recovery efforts. When severe weatherthreatens or a natural disaster has occurred, ACS estimates provide important characteristicsabout the displaced population and the characteristics of housing that may be damaged ordestroyed.
Potential Return on Investment
The ACS is a unique national asset, providing a service that no other program, public or private, provides. It is the only sources of small-area and small-population statistics on a wide range of important housing, social, economic, and demographic characteristics for all communities in the country. As such, there are two key ways having an ACS provides a return on investment.
• For the Census Bureau: Utilizing the ACS as a test bed for the 2020 Census, allowsthe Census Bureau to leverage existing infrastructure and resources at a lower cost than building these for 2020, which provides overall efficiency and optimization.
• For the American public: Having an ACS provides the nation with critical informationto make important data driven decisions for much needed programs, services, and infrastructure to enhance the lives of those living in the United States of America. At a fundamental level, the ACS provides current and consistent information for everyone.
Risk Assessment
Having an ACS Program helps reduce the risk of the 2020 Census. Not having an ACS, could put at risk one of the critical cornerstones of this country---the apportionment of the US House of Representatives and redistricting endeavor. Specifically, the following are key examples of risk reduction:
CEN-149
• Without the ACS, the 2020 Census would require a long-form questionnaire. The ACSsimplifies the 2020 Census, streamlining it to data collection and processing of the shortform questions only.
• Additionally, the cost of the 2020 Census would increase significantly every decade overand beyond the cost of implementing a steady state ACS program.
• The ACS provides important information to the planners of the 2020 Census, helping tomake the 2020 Census more efficient. This includes such things as where languageassistance will be needed and where the 2020 Census can count on high self-responsevia the internet.
• The ACS provides the American public with current, local information every year toinform economic decisions versus using out of data information in the decision-makingprocess.
Base Resources Assessment Base Resource Amount: $465,192,000 Base FTE: 3,519
Line Item: 2020 Census
The Census Bureau has initiated an aggressive and innovative research agenda for the 2020 Census program, supporting fundamental changes to program, business, operational, and technical processes to meet its vision and strategic goals, respectively:
Vision: An efficient and quality census that counts people once, only once, and in the right place.
Goals:
• A complete and accurate census• Embraced and valued results• An efficient census• A well-managed census
Without substantial and bold innovation, the costs of conducting the 2020 Census may become prohibitive. The Census Bureau must make fundamental changes to the design, implementation, and management of the decennial census if it is to meet its goals for the 2020 Census. External stakeholders and experts have provided numerous reports and recommendations over the past decade asking for stronger program management and systems engineering approaches, as well as urging us to consider more automation and considering new listing and enumeration methods. Further, we have volumes of internal research and evaluations over the decades, which also support rethinking the decennial census. The objective of the initiative is to provide sufficient information to make preliminary census decisions by the end of FY 2015. Consequently, we have accelerated into the FY 2012-FY 2015 time period research and testing necessary to develop a preliminary design for key components – rather than stretching much of it out over the FY 2012-FY 2018 period. This decision was taken in reaction to lessons learned from previous, more decentralized, decennial research and testing approaches, which resulted in the key design decisions not being made until late in the decade.
CEN-150

Without substantive changes to methods and developmental approaches, in addition to cost increases, the census may not meet the required quality goals. The cost of the 2010 Census represents a 38 percent increase in the cost per housing unit over Census 2000 costs, which in turn was a 76 percent increase over 1990 Census costs. Figure 1 shows the increasing cost per housing unit from 1970 through 2010.
Figure 1: Cost per Housing Unit by Census Year, 1970 - 2010 (2010 dollars)
ource: Bureau of the Census. Note: Includes the costs for the Master Address File/Topologically Integrated Geographic ncoding and Referencing Enhancement Program and American Community Survey.
he Census Bureau analyzed costs over the 2010 Census life cycle to determine when the greatest osts occurred. Most of the costs over the 12-year life cycle occurred in FY 2009 and FY 2010. A
major cost in FY 2009 was the field costs associated with address canvassing (address list updating and map improvements). Most of the costs contributing to the peak in FY 2010 were for data collection. This included the costs of follow-up, including costs to hire field office staff and enumerators, and supporting infrastructure. These costs resulted, in part, from labor-intensive field operations for nonresponse follow-up and paper-based data collection. Also significant was the cost of initial response, including several field operations and an IT infrastructure to support all operations, both supported in large part by major contracts and Headquarters staff.
Given the 40-year history of large cost increases coupled with an increasingly complex demographic and technological environment, we need a new approach if we are to contain costs. The 2020 Census planning approach is to (1) research new methods likely to affect costs early enough to inform timely design decisions, (2) incorporate strong risk and program management and comprehensive and centralized systems engineering, and (3) design a solution that is robust, resilient, and flexible enough to respond to as-yet-unknown further social and technological changes, to the greatest extent possible. Major components of the 2020 Census design will be developed, tested, and proven prior to execution of the 2020 Census. With early planning and the time to prove in our systems, the 2020 Census will meet the demands of the American public for more convenient participation options, innovative data collection modes, and efficient data processing.
SE
Tc
$14
$28
$39
$70
$94
$0
$20
$40
$60
$80
$100
1970 1980 1990 2000 2010
CEN-151
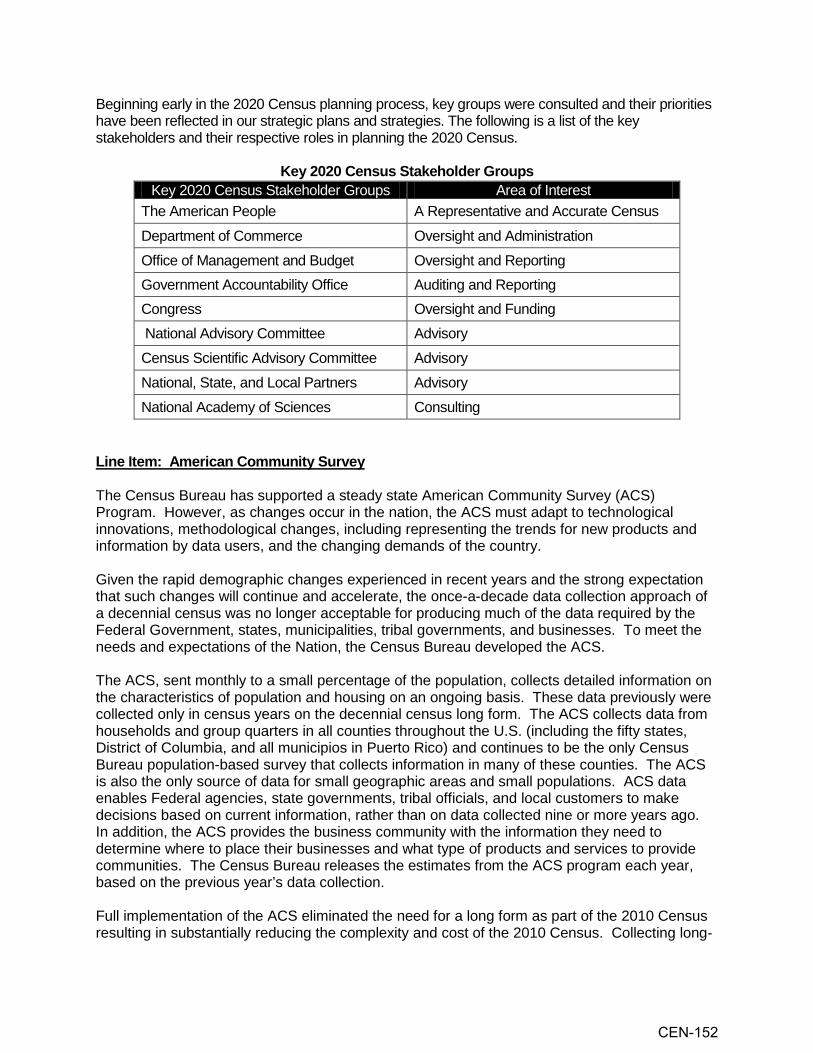
Beginning early in the 2020 Census planning process, key groups were consulted and their priorities have been reflected in our strategic plans and strategies. The following is a list of the key stakeholders and their respective roles in planning the 2020 Census.
Key 2020 Census Stakeholder Groups Key 2020 Census Stakeholder Groups Area of Interest
The American People A Representative and Accurate Census
Department of Commerce Oversight and Administration
Office of Management and Budget Oversight and Reporting Government Accountability Office Auditing and Reporting Congress Oversight and Funding National Advisory Committee Advisory
Census Scientific Advisory Committee Advisory
National, State, and Local Partners Advisory
National Academy of Sciences Consulting
Line Item: American Community Survey
The Census Bureau has supported a steady state American Community Survey (ACS) Program. However, as changes occur in the nation, the ACS must adapt to technological innovations, methodological changes, including representing the trends for new products and information by data users, and the changing demands of the country.
Given the rapid demographic changes experienced in recent years and the strong expectation that such changes will continue and accelerate, the once-a-decade data collection approach of a decennial census was no longer acceptable for producing much of the data required by the Federal Government, states, municipalities, tribal governments, and businesses. To meet the needs and expectations of the Nation, the Census Bureau developed the ACS.
The ACS, sent monthly to a small percentage of the population, collects detailed information on the characteristics of population and housing on an ongoing basis. These data previously were collected only in census years on the decennial census long form. The ACS collects data from households and group quarters in all counties throughout the U.S. (including the fifty states, District of Columbia, and all municipios in Puerto Rico) and continues to be the only Census Bureau population-based survey that collects information in many of these counties. The ACS is also the only source of data for small geographic areas and small populations. ACS data enables Federal agencies, state governments, tribal officials, and local customers to make decisions based on current information, rather than on data collected nine or more years ago. In addition, the ACS provides the business community with the information they need to determine where to place their businesses and what type of products and services to provide communities. The Census Bureau releases the estimates from the ACS program each year, based on the previous year’s data collection.
Full implementation of the ACS eliminated the need for a long form as part of the 2010 Census resulting in substantially reducing the complexity and cost of the 2010 Census. Collecting long-
CEN-152

form data during the decade through the ACS has had a profound effect on the census design plan. As demonstrated during the 2010 Census, the collection of long-form data through the ACS relieved a substantial burden and complexity to the Decennial Census operations. Implementing the ACS means that the Decennial Census can focus on its constitutional mandate to accurately count the population to apportion the House of Representatives. The ACS remains a test bed for the Decennial Census and provides support in determining appropriate approaches for the 2020 design. The ACS—supported by a complete and accurate address system—has simplified the census design, resulting in improvements in both coverage and data quality, while providing current data on detailed population, social, economic, and housing characteristics. Schedule & Milestones:
Program Area FY 14 FY 15 Strategic Planning
• •
Maintain the Strategic Plan Update Business Plan
• •
Maintain the Strategic Plan Update Business Plan
Program Management
•
•
•
Update the Program Management Plan (PMP) Baseline additional supporting plans for the PMP Update schedule and budget
• •
•
Update the PMP Baseline additional supporting plans for the PMP Update schedule and budget
Systems Engineering
•
•
Update the Systems Engineering Management Plan (SEMP) Develop logical and physical architecture
• •
Update the SEMP Select the preliminary design
IT
• Research and Testing
•
• • •
•
Implement study plans for research and test projects Continue analyses Complete qualitative tests Refine methods for research and testing projects Produce preliminary reports
•
• • •
Complete analyses for research and test projects Select methods Produce final reports Begin planning, design, and development of 2020 Census.
Field Operations
• •
Conduct tests and experiments Prepare field test plans
• •
Produce results Conduct tests and experiments and produce results
CEN-153

Deliverables: FY 2014 FY 2015
Analyze, test, and refine candidate Analyze, test, select methods, and methods document results
• New methods are tested • Methods are further tested and other newmethods are tested
• Prototypes for testing are matured and • Prototypes leading to 2020 productiontested requirements are selected
• Candidate methods are refined • Methods to test operational functionalityare selected
• Research and testing results are fully • Research and testing results are fullyintegrated and documented integrated and documented
• Candidate set of architectural design • Preliminary architectural design isalternatives are determined selected
• Program management capabilities aremature enough to move to theOperational Development and SystemsTesting phase
• Systems development and testingapproach is decided
CEN-154
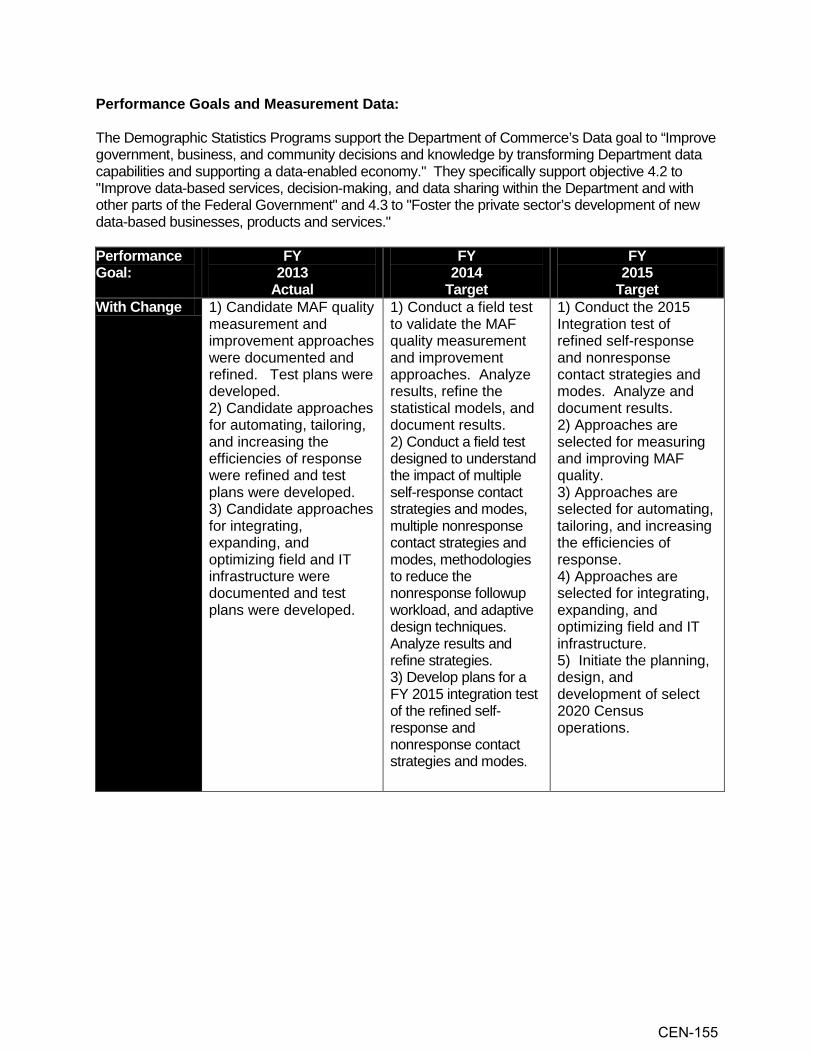
Performance Goals and Measurement Data: The Demographic Statistics Programs support the Department of Commerce’s Data goal to “Improve government, business, and community decisions and knowledge by transforming Department data capabilities and supporting a data-enabled economy." They specifically support objective 4.2 to "Improve data-based services, decision-making, and data sharing within the Department and with other parts of the Federal Government" and 4.3 to "Foster the private sector’s development of new data-based businesses, products and services."
Performance FY FY FY Goal: 2013 2014 2015 Actual Target Target With Change 1) Candidate MAF quality
measurement and improvement approaches were documented and refined. Test plans were developed. 2) Candidate approaches for automating, tailoring, and increasing the efficiencies of response were refined and test plans were developed. 3) Candidate approaches for integrating, expanding, and optimizing field and IT infrastructure were documented and test plans were developed.
1) Conduct a field test to validate the MAF quality measurement and improvement approaches. Analyze results, refine the statistical models, and document results. 2) Conduct a field test designed to understand the impact of multiple self-response contact strategies and modes, multiple nonresponse contact strategies and modes, methodologies to reduce the nonresponse followup workload, and adaptive design techniques. Analyze results and refine strategies. 3) Develop plans for a FY 2015 integration test of the refined self-response and nonresponse contact strategies and modes.
1) Conduct the 2015 Integration test of refined self-response and nonresponse contact strategies and modes. Analyze and document results. 2) Approaches are selected for measuring and improving MAF quality. 3) Approaches are selected for automating, tailoring, and increasing the efficiencies of response. 4) Approaches are selected for integrating, expanding, and optimizing field and IT infrastructure. 5) Initiate the planning, design, and development of select 2020 Census operations.
CEN-155

Performance FY
2013 Actual
FY 2014
Target
FY 2015
Target Goal: Without Change
Without the requested increase, we would not be able to continue a 2020 Census early planning effort in FY 2014.
Without the requested increase, we will not be able to continue a 2020 Census early planning effort in FY 2015.
Without the requested increase, we will not be able to complete the necessary testing to arrive at a preliminary design for the 2020 Census. Without the evidence needed to support key innovations aimed at achieving our cost and quality goals, we will resort to proven, but more expensive methods of conducting the 2020 Census. Innovative approaches to conducting the 2020 Census to achieve our cost goals may be abandoned.
Description: Make preliminary design decisions based on high-quality information derived from individual product performance measures and key decision points.
CEN-156

PROGRAM CHANGE PERSONNEL DETAIL Budget Program: Demographic statistics programs Sub-program: 2020 Decennial census program Program Change: 2020 Census
Number Annual TotalTitle: Location Grade of Positions Salary SalariesProgram Manager Suitland, MD GS-15 6 $124,995 $749,970IT Specialist Suitland, MD GS-15 6 124,995 749,970Mathematical Statistician Suitland, MD GS-15 5 124,995 624,975Survey Statistician Suitland, MD GS-15 11 124,995 1,374,945IT Specialist Suitland, MD GS-14 33 106,263 3,506,679Survey Statistician Suitland, MD GS-14 10 106,263 1,062,630Mathematical Statistician Suitland, MD GS-14 22 106,263 2,337,786Program Analyst Suitland, MD GS-14 26 106,263 2,762,838Program Specialist Suitland, MD GS-14 23 106,263 2,444,049Program Manager Suitland, MD GS-13 43 89,924 3,866,732IT Specialist Suitland, MD GS-13 20 89,924 1,798,480Mathematical Statistician Suitland, MD GS-13 27 89,924 2,427,948Survey Statistician Suitland, MD GS-13 21 89,924 1,888,404IT Specialist Suitland, MD GS-13 47 89,924 4,226,428Survey Statistician Suitland, MD GS-13 9 89,924 809,316Mathematical Statistician Suitland, MD GS-12 20 75,621 1,512,420Program Analyst Suitland, MD GS-12 35 75,621 2,646,735Program Specialist Suitland, MD GS-12 15 75,621 1,134,315IT Specialist Suitland, MD GS-12 13 75,621 983,073Program Analyst Suitland, MD GS-12 17 75,621 1,285,557Survey Statistician Suitland, MD GS-12 3 75,621 226,863Program Specialist Suitland, MD GS-11 4 63,091 252,364IT Specialist Suitland, MD GS-09 1 52,146 52,146Program Specialist Jeffersonville, IN GS-09 32 47,923 1,533,536Program Analyst Suitland, MD GS-09 2 52,146 104,292Program Analyst Suitland, MD GS-07 22 42,631 937,882Administrative Assistant Suitland, MD GS-07 28 42,631 1,193,668Statistical Assistant Suitland, MD GS-07 5 42,631 213,155Secretary Suitland, MD GS-06 10 38,363 383,630Administrative Assistant Suitland, MD GS-05 43 34,415 1,479,845Secretary Suitland, MD GS-05 6 34,415 206,490 Subtotal 565 44,777,121
Distributed share of staff for centralized services 275 20,095,000 Subtotal 840 64,872,121
Less Lapse 17% -142 -10,989,337Total Full-time permanent: 698 53,882,7842015 Pay Adjustment 1.049% 565,230TOTAL 698 54,448,014
CEN-157

PROGRAM CHANGE PERSONNEL DETAIL (continued)
Budget Program: Demographic statistics programs Sub-program: 2020 Decennial census program Program Change: 2020 Census
Personnel Data Number
Full-time Equivalent EmploymentFull-time permanent 698Other than full-time permanent 103Total 801
Authorized Positions:Full-time permanent 840Other than full-time permanent 436Total 1,276
CEN-158

PROGRAM CHANGE PERSONNEL DETAIL
Budget Program: Demographic statistics programs Sub-program: 2020 Decennial Census program Program Change: American community survey
Number Annual TotalTitle: Location Grade of Positions Salary SalariesProgram Analyst Suitland, MD GS-14 3 $106,263 $318,789IT Specialist Suitland, MD GS-13 6 89,924 539,544IT Specialist Suitland, MD GS-12 2 75,621 151,242Mathematical Statistician Suitland, MD GS-12 3 75,621 226,863IT Specialist Suitland, MD GS-11 2 63,091 126,182IT Specialist Suitland, MD GS-09 2 52,146 104,292 Subtotal 18 1,466,912
Distributed share of staff for centralized services 10 883,555 Subtotal 28 2,350,467
Less Lapse 25% -7 -587,617Total Full-time permanent: 21 1,762,8502015 Pay Adjustment 1.049% 18,492Total 21 1,781,342
Personnel Data NumberFull-time Equivalent Employment
Full-time permanent 21Other than full-time permanent 96Total 117
Authorized Positions:Full-time permanent 28Other than full-time permanent 0Total 28
CEN-159

PROGRAM CHANGE DETAIL BY OBJECT CLASS (Dollars in thousands)
Budget Program: Demographic statistics programs Sub-program: 2020 Decennial census program Program Change: 2020 Census
FY 2015 FY 2015Object Class Increase Total Program
11 Personnel compensation11.1 Full-time permanent $54,448 $124,87011.3 Other than full-time permanent 5,566 7,52511.5 Other personnel compensation 4,693 5,82911.811.9
Special personnel services paymentsTotal personnel compensation
0 064,707 138,224
12 Civilian personnel benefits 21,339 49,08013 Benefits for former personnel -38 41121 Travel and transportation of persons 3,573 5,02622 Transportation of things 75 14923.1 Rental payments to GSA 3,129 13,49323.2 Rental payments to others -1,169 17123.3 Communications, utilities and miscellaneous charges 929 6,44724 Printing and reproduction 265 83125.1 Advisory and assistance services 86,088 96,07825.2 Other services from non-Federal sources -198 47,86825.3 Purchases of goods & services from Gov't accounts 2,673 14,08825.4 Operation and maintenance of facilities 371 4,63825.5 Research and development contracts -1,331 4,31625.6 Medical care 0 025.7 Operation and maintenance of equipment 32,746 53,41025.8 Subsistence and support of persons 3 12226 Supplies and materials 1,159 1,71031 Equipment -1,901 7,12532 Lands and structures 0 033 Investments and loans 0 041 Grants, subsidies and contributions 0 042 Insurance claims and indemnities 0 043 Interest and dividends 0 04499
RefundsTotal obligations
0 0212,420 443,187
CEN-160

PROGRAM CHANGE DETAIL BY OBJECT CLASS (Dollars in thousands)
Budget Program: Demographic statistics programs Sub-program: 2020 Decennial census program Program Change: American community survey
FY 2015 FY 2015Object Class Increase Total Program
11 Personnel compensation11.1 Full-time permanent $1,781 $68,68911.3 Other than full-time permanent 4,756 50,86211.5 Other personnel compensation 8 1,43211.811.9
Special personnel services paymentsTotal personnel compensation
0 06,545 120,983
12 Civilian personnel benefits 679 33,85013 Benefits for former personnel 29 67321 Travel and transportation of persons 1,035 16,09722 Transportation of things 31 59023.1 Rental payments to GSA 79 13,98523.2 Rental payments to others 0 023.3 Communications, utilities and miscellaneous charges 656 12,06924 Printing and reproduction 102 3,40725.1 Advisory and assistance services 389 8,25325.2 Other services from non-Federal sources 658 6,73125.3 Purchases of goods & services from Gov't accounts 900 11,87725.4 Operation and maintenance of facilities 19 3,66925.5 Research and development contracts 3 76025.6 Medical care 0 025.7 Operation and maintenance of equipment 230 6,32525.8 Subsistence and support of persons 19 30726 Supplies and materials 12 68431 Equipment 2 5,55332 Lands and structures 0 033 Investments and loans 0 041 Grants, subsidies and contributions 0 042 Insurance claims and indemnities 0 043 Interest and dividends 0 04499
RefundsTotal obligations
0 011,388 245,813
CEN-161
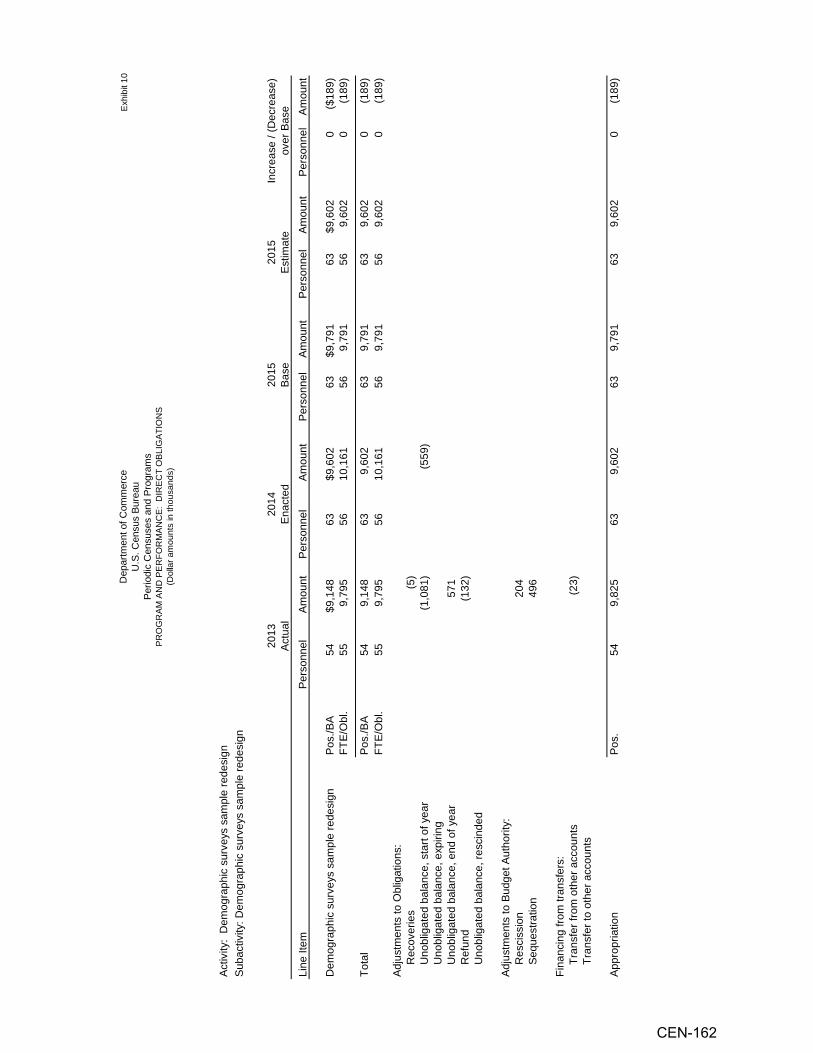
N
SOIT
AGILs B
am O )ec CT
er ogr
ands
m eau r RE
om ur hous
B
: D
I
C and
P
n t
us es of NC
E isA
ent
ens
usR
M ount
m C. Ot ens
am
epar S. C R
Fc E
odi arlU
D iN
D P ol
D(
erP AM
RA
GR
OP
Exh
ibit
10
Activ
ity:
Dem
ogra
phic
sur
veys
sam
ple
rede
sign
Suba
ctiv
ity: D
emog
raph
ic s
urve
ys s
ampl
e re
desi
gn
Line
Item
Pers
onne
lAm
ount
Pers
onne
lAm
ount
Pers
onne
lAm
ount
Pers
onne
lAm
ount
Pers
onne
lAm
ount
Dem
ogra
phic
sur
veys
sam
ple
rede
sign
Pos.
/BA
54$9
,148
63$9
,602
63$9
,791
63$9
,602
0($
189)
FTE/
Obl
.55
9,79
556
10,1
6156
9,79
156
9,60
20
(189
)
Tota
lPo
s./B
A54
9,14
863
9,60
263
9,79
163
9,60
20
(189
)FT
E/O
bl.
559,
795
5610
,161
569,
791
569,
602
0(1
89)
Adju
stm
ents
to O
blig
atio
ns:
R
ecov
erie
s(5
)
Uno
blig
ated
bal
ance
, sta
rt of
yea
r(1
,081
)(5
59)
U
nobl
igat
ed b
alan
ce, e
xpiri
ng
U
nobl
igat
ed b
alan
ce, e
nd o
f yea
r57
1
Ref
und
(132
)
Uno
blig
ated
bal
ance
, res
cind
ed
Adju
stm
ents
to B
udge
t Aut
horit
y:
Res
ciss
ion
204
S
eque
stra
tion
496
Fina
ncin
g fro
m tr
ansf
ers:
T
rans
fer f
rom
oth
er a
ccou
nts
(23)
T
rans
fer t
o ot
her a
ccou
nts
Appr
opria
tion
Pos.
549,
825
639,
602
639,
791
639,
602
0(1
89)
Incr
ease
/ (D
ecre
ase)
ov
er B
ase
2013
Ac
tual
2014
En
acte
d20
15Ba
se20
15Es
timat
e
CEN-162
Exhibit 12 – 15 APPROPRIATION ACCOUNT: Periodic Censuses and Programs BUDGET PROGRAM: Demographic Surveys Sample Redesign
For FY 2015, the Census Bureau requests a decrease of $189,000 and 0 FTE from the FY 2015 base for a total of $9,602,000 and 56 FTE for Demographic Surveys Sample Redesign. BASE JUSTIFICATION: Demographic Surveys Sample Redesign Overview The Demographic Surveys Sample Redesign (DSSR) program budget is organized into one sub-program with the same name under the Periodic Censuses and Programs account. This sub-program contains one line item with the same name ($9.6 million and 56 FTE). Program Gap Assessment: An alternative sampling frame system for the National Health Interview Survey (NHIS) and other similar surveys not conducted under Title 13 Section 9 are at risk. The NHIS and similar surveys require data, such as addresses and survey responses that the Census Bureau cannot release because of Title 13 Section 9 confidentiality restrictions. This is a high priority for the National Center for Health Statistics (NCHS), which created the NHIS in 1957 under the National Health Survey Act. The Census Bureau has conducted the NHIS by building a sampling frame through independent address listing, which was not restricted by Title 13 Section 9. However, because of research done through the DSSR program, the other DSSR surveys will use the Master Address File (MAF) as their sampling frame, which increases flexibility and simplicity and may reduce costs with no impact on quality. The NCHS cannot afford to continue the address listing system and therefore needs an alternative sampling frame for the NHIS. It is also a priority to the demographic surveys program at the Census Bureau because an alternative frame system could increase the number of reimbursable surveys conducted by the Census Bureau. There are currently almost 9,000 active Office of Management and Budget control numbers, each of which represents approval for a Federal agency to collect data from the public. Many of these are not demographic surveys. But considering that the Census Bureau demographic surveys program currently conducts about 30 surveys, there are many Federal demographic surveys that could benefit from the experience and ability of the Census Bureau if a high quality sampling frame existed that was not limited by Title 13 Section 9. Short-term benefits would allow for research and development of an alternative sampling frame system that was not limited by Title 13 Section 9. The immediate customer of such a system would be the NHIS, which requires implementation of such a system no later than FY 2018 (and possibly earlier, depending on the availability and quality of reserve sample). Specifically, an alternative frame system would consist of address coverage improvement research and operations, sample design, information technology systems, and field procedures and training unique to the alternative frame.
CEN-163
In the long-term, the alternative sampling frame system could be adapted for additional demographic surveys that have requirements not compatible with the confidentiality restrictions of Title 13 Section 9. These surveys and their data users would gain the benefits of having the Census Bureau conduct the survey, including the experience, expertise, technology, and field infrastructure. By closing the gap, the DSSR program would be able to select sample for the NHIS and develop the processes and procedures needed to collect data of high quality. This would satisfy the National Health Survey Act of 1956, the mandate that created the NHIS. In addition, an alternative frame system not restricted by Title 13 Section 9 would help to satisfy the legislative mandates for future surveys that come to the Census Bureau because of the alternative frame. SIGNIFICANT ADJUSTMENTS-TO-BASE: The Census Bureau requests a net increase of $0.2 million to fund adjustments to the demographic surveys sample redesign program. SUB-PROGRAM: Demographic Surveys Sample Redesign The Demographic Surveys Sample Redesign program is essential to maintain the relevance, accuracy, and quality of major federal surveys of families and households by providing improved sampling methodologies, sample designs, and automated data processing systems. Only by selecting new, updated samples for the major household surveys – based on the most recent information about the population – will the Congress and the public be able to maintain confidence in critical socioeconomic indicators such as the monthly unemployment rate, the monthly consumer price index and annual measures of health insurance coverage and fair market rent, which are vital to the effective management of the United States’ economy and government programs. The Demographic Surveys Sample Redesign program takes updated information on the location and characteristics of the American population and uses that up-to-date snapshot to select representative samples of the population. These new, representative samples then become the basis for major household surveys sponsored by federal agencies until the next sample redesign. Traditionally, following each decennial census, the Census Bureau works with other agencies to perform a redesign of the following major demographic surveys:
• Current Population Survey, sponsored jointly by the Census Bureau and the Bureau of Labor Statistics (BLS)
• Consumer Expenditure Survey – Quarterly and Diary, sponsored by the BLS • Survey of Income and Program Participation, sponsored by the Census Bureau • National Crime Victimization Survey, sponsored by the Bureau of Justice Statistics • American Housing Survey, sponsored by the Department of Housing and Urban
Development • State Children’s Health Insurance Program Survey, jointly sponsored by the Census Bureau
and the BLS • National Health Interview Survey, sponsored by the National Center for Health Statistics
Future sample redesigns will not be locked into a once-a-decade cycle because of the continued availability of updated MAF and American Community Survey (ACS) data. We will have the flexibility to produce up-to-date, efficient samples for the federal household surveys when needed.
CEN-164
The long history and broad application of these surveys demonstrate their value to sponsoring agencies, policy makers, academia, and other data users. The surveys produce statistically valid data and estimates that can be linked to a long historical record, which permits a unique depth of research. Yet these surveys are not entrenched and inflexible. The surveys continue to evolve based on changes in the population, subject matter, legal mandates, data uses, budgets, survey methods, technology, and other requirements. The overarching goals of the redesign are to check that survey requirements continue to be met, to incorporate new or changing requirements, and to assess and improve statistical methods and operational processes in the ongoing survey programs. These goals are met through the Demographic Surveys Sample Redesign program, a comprehensive and integrated program of evaluation, research, development, and implementation. The redesign surveys generally use similar methods and processes; therefore, significant resources are saved by integrating their redesign into one program rather than seven separate programs. Funding supports the redesign research and development activities common to all surveys. The program is funded by an annual congressional appropriation and by reimbursable agreements that are specifically for redesign work. The sponsoring agencies have separate reimbursable agreements with the Census Bureau to fund annual survey production work, such as listing, interviewing, and processing. The surveys within the scope of the Demographic Surveys Sample Redesign program play important roles in the Federal government and beyond. Their importance contrasts with their size, each survey having a sample size that is a small fraction of the annual sample size of the ACS. The survey results help to guide policy decisions, evaluate program effectiveness, and provide timely indicators of the socio-economic well-being of the population, among many other uses. There is a large community of stakeholders that depend on the Census Bureau and the Demographic Surveys Sample Redesign program to build a solid foundation for the demographic surveys. The strength of that foundation depends primarily on three key building blocks: the sampling frame, statistical methodology, and operational implementation. One of the program’s goals is to determine if the surveys could use the existing MAF as their sampling frame in place of the complicated and costly four-frame system of previous redesigns. To assess and evaluate this use of the MAF, the Demographic Surveys Sample Redesign program sponsored the Frame Assessment for Current Household Surveys (FACHS) research and evaluation program. The key to the value of the FACHS program was a $2 million field test in which a statistically valid sample of census blocks was listed. This test yielded a “gold standard” address list that enabled highly accurate and detailed measurement of MAF coverage. The field test was the largest known nationally representative listing operation conducted in non-census years, and proved highly valuable not only for the FACHS evaluations but also for decennial and ACS programs. The FACHS evaluations examined many different aspects of a MAF-based sampling frame, including address coverage overall and for many sub-universes, such as new construction and rural areas. The FACHS also assessed the impact of MAF coverage issues on key survey estimates, such as the unemployment rate and consumer expenditures. The results of the FACHS evaluations have helped to identify areas of concern by the sponsors and to guide research into potential solutions to those concerns. The research and development of solutions to sampling frame coverage issues is a key part of the foundation of the surveys in the 2010 Redesign.
CEN-165

The statistical methodology research in the Demographic Surveys Sample Redesign program involves designing and selecting the addresses to interview in each survey while meeting various survey requirements on quality or cost. For example, the Current Population Survey selects its sample to meet specific quality measures on state estimates of the unemployment rate. In general, the goals of the statistical research projects are to identify the statistical methods that would be the most effective or efficient at meeting survey requirements, and then to implement the chosen methods and select the samples for the 2010 Redesign surveys. Redesign operational implementation involves research and development of processes, systems, and procedures needed to interview the addresses selected for the surveys. The key factors in implementation are efficiency and flexibility. The focus of much operational research is on the analysis of existing processes to determine if they are cost-effective. Because redesigns occur infrequently, it is important that operations are efficient and flexible because the sponsor agencies pay for the costs of those operations every year once the redesigned surveys begin interviewing. If the sponsors perceive that the redesigned operations are not cost-effective and those operations cannot be readily changed, they may take their reimbursable work to one of the many competitors of the Census Bureau in the field of survey research and management. Fiscal Years 2010 through 2014 were the most important years in the current redesign, called the 2010 Redesign because of the heavy reliance on 2010 Census data. Earlier years were spent largely on closing out the previous redesign, planning the 2010 redesign, and conducting the FACHS field test and evaluations. Nearly all of the sample design research for the 2010 redesign was carried out in FY 2010 through FY 2012. And nearly all of the operational research, development and implementation occurred from FY 2010 to FY 2014, when the newly redesigned surveys began field interviewing. After the initial round of field interviewing for each survey, the 2010 Redesign will be generally complete and planning will begin for the next redesign. Upcoming years are also key to the transition of redesign from a program tied to the decennial cycle to an ongoing program that facilitates continuous improvement in the statistical methods or operational processes of the surveys. Because of the infrequency of past redesigns, the redesign often incorporated a large number of changes in the sample design or operations. Because there were so many changes, it was often difficult or impossible to evaluate the effectiveness of any single change on the survey. It was also difficult to make methodological or operational changes between redesigns. A continuous and flexible redesign program will enable more measured, incremental and frequent changes, which can be especially valuable when unforeseen changes occur, such as budget cuts, natural disasters, or legislative mandates.
PROGRAM CHANGES:
Inflationary Adjustment The Census Bureau requests a decrease of $189,000 and 0 FTE for a total request of $9,602,000 and 56 FTE to meet the cross-cutting program reductions necessary to offset increased funding requirements for adjustments-to-base. These cross-cutting reductions will be captured by managing on-going administrative savings, managing the backfilling of vacated positions due to attrition, and carefully monitoring all travel and training.
CEN-166
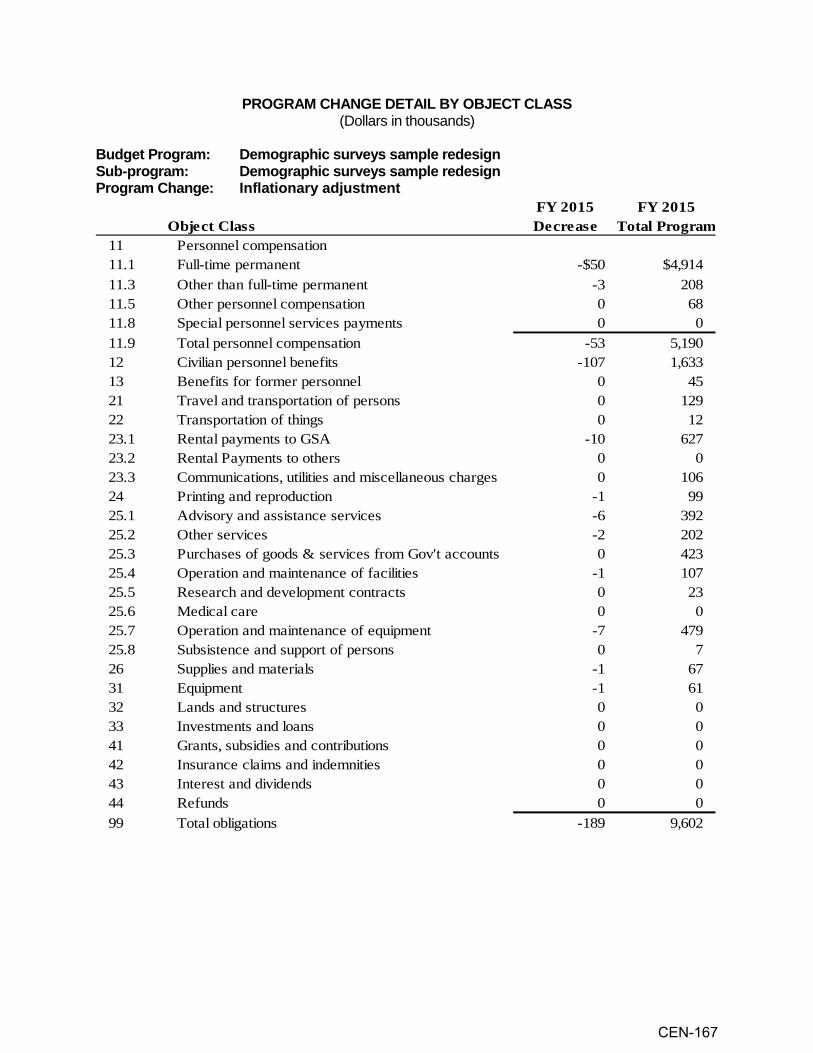
PROGRAM CHANGE DETAIL BY OBJECT CLASS (Dollars in thousands)
Budget Program: Demographic surveys sample redesign Sub-program: Demographic surveys sample redesign Program Change: Inflationary adjustment
FY 2015 FY 2015Object Class Decrease Total Program
11 Personnel compensation11.1 Full-time permanent -$50 $4,914 11.3 Other than full-time permanent -3 208 11.5 Other personnel compensation 0 68 11.8 Special personnel services payments 0 0 11.9 Total personnel compensation -53 5,190 12 Civilian personnel benefits -107 1,633 13 Benefits for former personnel 0 45 21 Travel and transportation of persons 0 129 22 Transportation of things 0 12 23.1 Rental payments to GSA -10 627 23.2 Rental Payments to others 0 0 23.3 Communications, utilities and miscellaneous charges 0 106 24 Printing and reproduction -1 99 25.1 Advisory and assistance services -6 392 25.2 Other services -2 202 25.3 Purchases of goods & services from Gov't accounts 0 423 25.4 Operation and maintenance of facilities -1 107 25.5 Research and development contracts 0 23 25.6 Medical care 0 0 25.7 Operation and maintenance of equipment -7 479 25.8 Subsistence and support of persons 0 7 26 Supplies and materials -1 67 31 Equipment -1 61 32 Lands and structures 0 0 33 Investments and loans 0 0 41 Grants, subsidies and contributions 0 0 42 Insurance claims and indemnities 0 0 43 Interest and dividends 0 0 44 Refunds 0 0 99 Total obligations -189 9,602
CEN-167
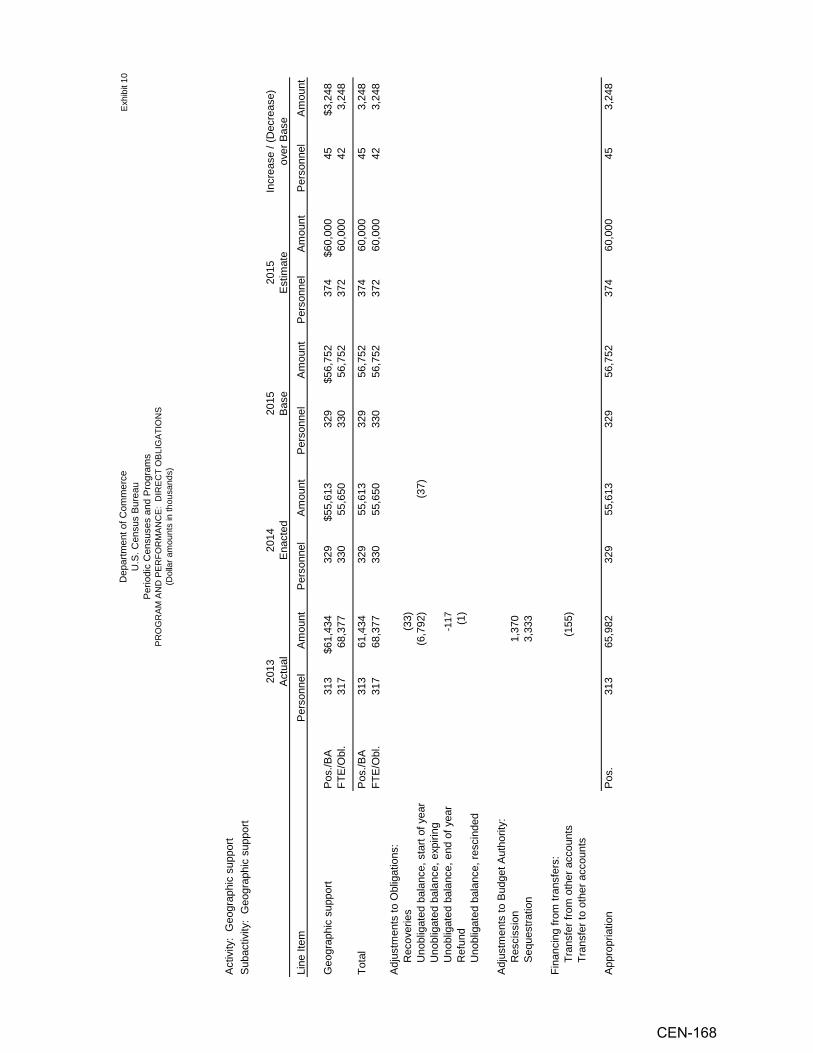
NS
OITA
GILs Bam O )ec
er ogr CT
ands
m eau r RE
om ur a
nd P
ent o
f C B
: D
Iho
usn
t
us es NC
E i
ens s
us AR
M ount
tm . C ens
O a
m
epar .S C R
Fc E la
r
Ui
ND
P ol
D odi
D
er
(
P AM
RA
GR
OP
Exh
ibit
10
Act
ivity
: G
eogr
aphi
c su
ppor
tS
ubac
tivity
: G
eogr
aphi
c su
ppor
t
Line
Item
Per
sonn
elA
mou
ntP
erso
nnel
Am
ount
Per
sonn
elA
mou
ntP
erso
nnel
Am
ount
Per
sonn
elA
mou
nt
Geo
grap
hic
supp
ort
Pos
./BA
313
$61,
434
329
$55,
613
329
$56,
752
374
$60,
000
45$3
,248
FTE
/Obl
.31
768
,377
330
55,6
50
330
56,7
5237
260
,000
423,
248
Tota
lP
os./B
A31
361
,434
329
55,6
13
329
56,7
5237
460
,000
453,
248
FTE
/Obl
.31
768
,377
330
55,6
50
330
56,7
5237
260
,000
423,
248
Adj
ustm
ents
to O
blig
atio
ns:
R
ecov
erie
s(3
3)
Uno
blig
ated
bal
ance
, sta
rt of
yea
r(6
,792
)
(37)
U
nobl
igat
ed b
alan
ce, e
xpiri
ng
Uno
blig
ated
bal
ance
, end
of y
ear
-117
R
efun
d(1
)
U
nobl
igat
ed b
alan
ce, r
esci
nded
Adj
ustm
ents
to B
udge
t Aut
horit
y:
Res
ciss
ion
1,37
0
Seq
uest
ratio
n3,
333
Fina
ncin
g fro
m tr
ansf
ers:
T
rans
fer f
rom
oth
er a
ccou
nts
(155
)
T
rans
fer t
o ot
her a
ccou
nts
App
ropr
iatio
nP
os.
313
65,9
8232
955
,613
329
56,7
5237
460
,000
453,
248
Incr
ease
/ (D
ecre
ase)
over
Bas
e20
13A
ctua
l20
14
Ena
cted
2015
Bas
e20
15E
stim
ate
CEN-168

Exhibit 12 – 15 APPROPRIATION ACCOUNT: Periodic Censuses and Programs BUDGET PROGRAM: Geographic Support For FY 2015, the Census Bureau requests an increase of $3,248,000 and 42 FTE from the FY 2015 base for a total of $60,000,000 and 372 FTE for Geographic Support. BASE JUSTIFICATION: Geographic Support Overview The Geographic Support (GSS) budget is organized into one budget program with the same name under the Periodic Censuses and Programs account. This budget program contains one sub-program with the same name ($60.0 million and 372 FTE). This program supports the Department of Commerce’s Data goal to “Improve government, business, and community decisions and knowledge by transforming Department data capabilities and supporting a data-enabled economy." It specifically supports objective 4.2 to "Improve data-based services, decision-making, and data sharing within the Department and with other parts the federal government."
Furthermore, GSS will implement the Geographic Support System Initiative to ensure that continuous updates throughout the decade allow the Census Bureau to reduce 2020 Census costs by conducting address listing only in specified areas, because the quality of addresses in the MAF is sufficient to meet the needs of the census. SIGNIFICANT ADJUSTMENTS-TO-BASE (ATBs): The Census Bureau requests an increase of $1.1 million to fund adjustments to the Geographic Support program. SUB-PROGRAM: Geographic Support The objective of the Geographic Support sub-program is to provide address lists, address and geographic reference files, geospatial products, and associated processing systems needed to meet the geographic requirements of all Census Bureau programs. To support this goal, the Census Bureau has developed an integrated GSS. One of the major components of this system is the MAF/TIGER System. The MAF/TIGER System maintains geographic coverage and improves the quality and efficiency of collecting and processing geographic data with a precise digital approach that takes advantage of state-of-the-art commercial off-the-shelf products and geographic information system (GIS) software technology products. The MAF/TIGER System is updated regularly and requires large volumes of information from many external sources, including state, local, and tribal governments and the U.S. Postal Service, to maintain a current and complete inventory of postal and location addresses, streets, address ranges, current geographic boundaries, and other map information. Further, the GSS supports improved address coverage, continual updating of positionally accurate road and other related spatial data, and enhanced quality measures of ongoing geographic programs. By focusing on activities that improve the MAF (addresses) while maintaining and
CEN-169
enhancing the spatial infrastructure that makes census and survey work possible, this GSS Initiative (GSS-I) effort represents the next phase of geographic support after the MAF/TIGER Enhancement Program of the last decade. For many years, stakeholders have urged the Census Bureau to initiate a comprehensive and ongoing program to improve and maintain address and geographic data. The Congress, OMB, the GAO, tribal, state, county, and local governments, and academia expressed their concerns with the absence of continuous updates. The GSS is also critical in enabling the Census Bureau to carry out the activities described in Section 8 of OMB Circular A-16 (Coordination of Geographic Information and Related Spatial Data Activities). This mandates that agencies provide technology and services necessary to support and maintain the National Spatial Data Infrastructure. The OMB has designated the Census Bureau as the Federal agency with the lead responsibility for cultural and demographic statistics and governmental unit boundaries. This effort allows the Census Bureau to address the challenges associated with boundaries, names, and numeric codes of geographic entities used to report Census Bureau statistical data. Technical geospatial capabilities and geographic products are essential to meeting the core needs of the 2020 Census , the ACS, the economic census, the current demographic statistics program, and the intercensal demographic estimates program. The GSS manages activities that maintain the master list of addresses and housing units, known as the MAF. Continuous updating of the MAF in conjunction with the U.S. Postal Service and data provided by state, local, and tribal partners, as required by Executive Order 12906 and P.L. 103-430, is the most cost-effective and quality-assured method for providing a spatially accurate housing unit address list for use by Census Bureau surveys and the 2020 Census. MAF/TIGER database (MTDB) update operations include new and changed addresses, boundaries, features, feature names, zip codes, and address ranges in the TIGER database. The updated geographic information is then used in the assignment of a correct census block code for each residential address through a process known as “geocoding”. In some cases, new addresses provided by the U.S. Postal Service cannot be geocoded. In these cases, additional information is required and clerical processes are used to research and resolve ungeocoded addresses to maximize the number of residential addresses with their accurate spatial location. This operation currently is the most efficient and cost-effective method of updating the MAF/TIGER database and providing geocoded residential addresses required for processing and tabulating census and household survey data. The GSS supports Geodata.gov, a web-based portal that serves as a public gateway for improving access to geospatial information and data under the Geospatial One-Stop E-Government initiative. The Geodata.gov portal is designed to facilitate communication and sharing of geographic data and resources to enhance government efficiency and improve citizen services. Geospatial One-Stop is one of 24 E-Government initiatives sponsored by OMB. Geospatial One-Stop makes it easier, faster, and less expensive for all levels of government and the public to find and access geospatial information. The GSS program establishes and distributes the geographic component for the multi-agency Geospatial One-Stop project and the government’s Data.gov website.
CEN-170

The GSS program also supports the Geographic Line of Business, which is sponsored by the Federal Geographic Data Committee. The Census Bureau chairs the Subcommittee for Cultural and Demographic Statistics and is the lead Federal agency for governmental unit boundary data. Because of the need to continually update the road network to support censuses and surveys, the Census Bureau’s TIGER data is the freely and publicly accessible de facto road transportation database for the Federal government. The program funds the maintenance of the American National Standards Institute (ANSI) geographic area codes for states, counties, metropolitan and micropolitan areas, and other geographic areas. The GSS also funds cooperative geographic code maintenance efforts with the United States Geological Survey (USGS), which is the ANSI maintenance authority for place and minor civil division geographic codes. Historically, the GSS funds the BAS which will not occur in FY2014. Reinstatement of the BAS will allow collection of boundary data and legal status information from all levels of functioning governments, including correct names, legal and boundary descriptions to determine the inventory of legally defined entities that includes counties, minor civil divisions (towns, townships, etc.), incorporated places, and federally recognized American Indian reservations, and off-reservation trust lands. The BAS has been conducted for over 40 years and is currently the only source of a nationally consistent inventory of governments, their legal status, and their boundary configuration. In accordance with OMB Circular A-16, the BAS supports the Census Bureau’s spatial data steward responsibilities for the Federal Geographic Data Committee and the Geospatial Platform by updating the inventory and boundaries of governmental units. In addition, the BAS is the source of up-to-date information on boundaries, geographic codes, and names for the USGS Geographic Names Information System and The National Map. Other programs within the Census Bureau have relied on the BAS information to provide a record for reporting the results of the decennial and economic censuses, the ACS, and to support the Population Estimates Program. Maintaining correct boundaries and boundary-to-feature relationships through the BAS helps ensure that the appropriate population is assigned to each entity. Finally, the program supports quality assurance operations for geographic support products. To assure high quality census and household survey results, the Census Bureau employs statistically sound techniques to evaluate the quality of the processes used to build, update, and enhance the MAF/TIGER database. This includes continuous development of and adherence to geographic standards and criteria for statistical areas to support data dissemination. In addition, the Census Bureau performs quality assurance processes before releasing geographic products for use by the public and the various censuses and household surveys to ensure that these products meet completeness and accuracy. The Community Address Updating System (CAUS) provides limited updates to the MTDB in areas specifically identified where existing GSS processes are insufficient. Funding will support research of an aerial selection methodology for updates along with fieldwork to maintain the MTDB for non-urban communities in the U.S. These are areas where updates from the U.S. Postal Service Delivery Sequence File (DSF) do not provide sufficient coverage and thus benefit from the use of trained field representatives to add, update, or delete non-city style addresses in the MTDB. The goal is for each housing unit in the Nation to be accurately represented by one and only one record on the MTDB.
CEN-171

Continuous updating of the MTDB throughout the decade will allow increased efficiency of the Census Bureau field staff through the availability of more accurate maps and improved address coverage. This program improves the positional accuracy, halts the degradation of attributes of geographic data, and captures new street growth to ensure data currency. The financial impact of these activities are offset by the possibility of conducting only a selective address canvassing operation in FY 2019 and avoiding a full spatial data accuracy improvement program in preparation for the next decennial census. Planned assessments of address quality will track the success of improvements to the MTDB and determine the feasibility and magnitude of a selective address canvassing operation. These tasks will adhere to defined legal requirements and support the Census Bureau’s statistical programs, Federal agency geospatial data responsibilities, and the commitment of high quality geographic products to the public.
PROGRAM CHANGES: Restoration of the Boundary and Annexation Survey ($3,248,000, 42 FTE): During FY 2015, to meet our responsibilities under OMB Circular A-16, the Census Bureau will have to double our efforts to accommodate two years of legal boundary changes as the result of the suspension of the BAS in 2014. The workload planned for FY 2015 and the approximately 1,800 governments, which did not have their boundary changes updated and correctly represented within the MTDB due to the hiatus, shall be included in the potential survey universe. Under OMB Circular A-16, the Census Bureau has the responsibility to oversee the development, implementation and maintenance of the Governmental units, and Administrative and Statistical Boundaries theme for the National Spatial Data Infrastructure. To meet this mandate the Census Bureau contacts each of the 40,000 governments annually for governments to submit boundary changes. Accurate boundaries are critical for the allocation of statistical data collected in censuses and surveys, including the annual ACS. On average, we receive updates from approximately 1,800 governments each year that include 40,000 boundary changes. Statement of Need and Economic Benefits Program Change: Restoration of the Boundary and Annexation Survey Absence of the FY 2014 annual BAS affected approximately 1,800 governments, which will not have their boundary changes updated and correctly represented within the MTDB. For this number of governments, approximately 40,000 boundary changes will not be included. To meet our responsibilities under Executive Order 12906 and OMB Circular A-16, the Census Bureau will need to accommodate two years of legal boundary changes in FY 2015. Base Resources Assessment
Base Resource Amount: $56,752 Base FTE: 330 The GSS provides address lists, address and geographic reference files, geocoding services, maps, and processing systems to meet geographic requirements of all Census Bureau programs and operations. The GSS includes the integrated MTDB - MAF inventory of addresses and the TIGER inventory of streets and other map feature information. Historically, the GSS also included the annual BAS. The base GSS supports the collection of boundaries required to support estimates in
CEN-172
demographic and economic areas (covering approximately 25 percent of functioning governments). The Decennial Census traditionally provides resources to collect the boundaries for the other 30,000 governments. Work to improve addresses includes the CAUS, which supports the GSS through fieldwork limited to targeted blocks that provide indicators of the challenges of rural addresses. Addresses collected through CAUS additionally will support the ACS Along with the ongoing efforts of the GSS- I to provide an up-to-date address list and increase the efficiency of field staff working on ongoing surveys; the Initiative will determine the feasibility for the Census Bureau to pursue a targeted address canvassing operation (as opposed to a full, or 100 percent, address canvassing operation) in support of the 2020 Census. This will lead to cost avoidance during 2019 address canvassing operations. Risk from Budget Changes: Program Change: Restoration of the Boundary and Annexation Survey The BAS is the only current source of a nationally consistent inventory of governments, their legal status, and their boundaries. In accordance with OMB Circular A-16, the BAS supports the Census Bureau’s spatial data steward responsibilities for the Federal Geographic Data Committee and the Geospatial One-Stop by updating the inventory and boundaries of governmental units. In addition, the BAS is the source of up-to-date information on boundaries, geographic codes, and names for the USGS Geographic Names Information System and The National Map. Under OMB Circular A-16, the Census Bureau has the responsibility to oversee the development, implementation and maintenance of the Governmental Units, and Administrative and Statistical Boundaries theme for the National Spatial Data Infrastructure. To meet this mandate the Census Bureau contacts each of the 40,000 governments annually for governments to submit boundary changes. Accurate boundaries are critical for the allocation of statistical data collected in censuses and surveys, including the annual ACS. Schedule and Milestones: Base Program
• Deliver a final report outlining the feasibility of a selective address canvassing by December 2014.
• Continue to receive and process partner-supplied address and spatial updates in FY 2015 through FY 2019.
• Continue to assess the quality of data in the MTDB in FY 2015 through FY 2019. • Continue to identify blocks that will require address canvassing in FY 2015 through FY
2019. • Identify available commercial address lists in FY 2015 through FY 2019. • Develop and implement methods for updating Puerto Rico address and spatial data by
FY 2016. • Develop and implement methods for updating Group Quarters data by FY 2016.
CEN-173

Program Change: Restoration of the Boundary and Annexation Survey • Restore staffing and infrastructure for the BAS to enable data collection in FY 2015
Deliverables: Base Program
• A recommendation as to the feasibility of a selective address canvassing will be documented in a formal report. The report will be based on a comprehensive assessment of the quality of the data in the MTDB.
• Continuous improvements to the MTDB through the receipt, tracking, evaluation, and integration of address and spatial data updates from tribal, state, and local governments.
• A methodology for acquiring, evaluating, and updating geospatial data from Puerto Rico will be developed and implemented.
• A methodology for identifying and updating Group Quarters data will be developed and implemented.
Program Change: Restoration of the Boundary and Annexation Survey • Successfully meet BAS response rate goal of 85 percent
Performance Goals and Measurement Data This program supports the Department of Commerce’s Data goal to “Improve government, business, and community decisions and knowledge by transforming Department data capabilities and supporting a data-enabled economy." It specifically supports objective 4.2 to "Improve data-based services, decision-making, and data sharing within the Department and with other parts the federal government."
Performance Goal: Measure 1
FY 2013 Est.
FY 2014
Target
FY 2015
Target
FY 2016
Target
FY 2017
Target
FY 2018
Target
FY 2019
Target With Change The BAS
will meet or
exceed an 85%
response rate.
N/A – BAS
cancelled for this Fiscal year
The BAS will meet
or exceed an 85%
response rate.
The BAS will meet
or exceed an 85%
response rate.
The BAS will meet
or exceed an 85%
response rate.
The BAS will meet
or exceed an 85%
response rate.
The BAS will meet
or exceed an 85%
response rate.
Without Change N/A N/A The BAS will not occur
The BAS will not occur
The BAS will not occur
The BAS will not occur
The BAS will not occur
Description: OMB Circular A-16 and the Federal Geographic Data Committee designate the Census Bureau as the federal agency responsible for the Governmental Units and Statistical, and Administrative Boundaries data theme of the National Spatial Data Infrastructure (NSDI). The implementation of the BAS is the Census Bureau's principle mechanism for fulfilling this responsibility under the NSDI.
CEN-174

PROGRAM CHANGE PERSONNEL DETAIL
(Dollars in thousands)
Budget Program: Geographic Support Sub-program: Geographic Support Program Change: Restoration of the Boundary and Annexation Survey
Number Annual TotalLocation Grade of Positions Salary Salaries
Mathematical Statistician Suitland, MD GS-13 1 $89,924 $89,924Geographer Suitland, MD GS-13 2 89,924 179,848 Geographer Suitland, MD GS-12 4 75,621 302,484 IT Specialist Suitland, MD GS-12 1 75,621 75,621 Statistical Assistant Jeffersonville, IN GS-07 26 37,179 966,654 Program Manager Suitland, MD GS-04 1 30,761 30,761 Subtotal 35 1,645,292
Distributed share of staff for centralized services 10 694,211 Subtotal 45 2,339,503
Less Lapse 9% -4 -210,555Total Full-time permanent: 41 2,128,948
1.049% 22,333 Subtotal 41 2,151,281
Personnel Data NumberFull-time Equivalent Employment
Full-time permanent 41Other than full-time permanent 1Total 42
Authorized Positions:Full-time permanent 45Other than full-time permanent 1Total 46
2015 Pay Adjustment
Title:
CEN-175

PROGRAM CHANGE DETAIL BY OBJECT CLASS (Dollars in thousands)
Budget Program: Geographic Support Sub-program: Geographic Support Program Change: Restoration of the Boundary and Annexation Survey
11.1 Full-time permanent $2,151 $30,532 11.3 Other than full-time permanent 39 768 11.5 Other personnel compensation 36 474 11.8 Special personnel services payments 0 0 11.9 Total personnel compensation 2,226 31,774 12 Civilian personnel benefits 183 10,109 13 Benefits for former personnel 7 163 21 Travel and transportation of persons 48 520 22 Transportation of things 12 46 23.1 Rental payments to GSA 185 3,268 23.2 Rental Payments to others 2 39 23.3 Communications, utilities and miscellaneous charges 71 616 24 Printing and reproduction 4 47 25.1 Advisory and assistance services 30 2,595 25.2 Other services 76 940 25.3 Purchases of goods & services from Gov't accounts 137 2,677 25.4 Operation and maintenance of facilities 64 1,084 25.5 Research and development contracts 134 704 25.6 Medical care 0 0 25.7 Operation and maintenance of equipment 50 4,075 25.8 Subsistence and support of persons 2 42 26 Supplies and materials 17 233 31 Equipment 0 1,068 32 Lands and structures 0 0 33 Investments and loans 0 0 41 Grants, subsidies and contributions 0 0 42 Insurance claims and indemnities 0 0 43 Interest and dividends 0 0 44 Refunds 0 0 99 Total obligations 3,248 60,000
CEN-176

NS
OITA
GILs Bam O
CT )ec
er ogr
ands
m eau r RE
ur DI
ous
om h
B
:
C and
P
n t
us es of NC
E i
A
ent
ens s
usR
M ount
m C. Ot ens
am
epar S. Cc R
F
Uod
i E lar
D iN
D P ol
D
er
(
P AM
RA
GR
OP
Exh
ibit
10
Act
ivity
: D
ata
proc
essi
ng s
yste
ms
Sub
activ
ity: D
ata
proc
essi
ng s
yste
ms
Line
Item
Per
sonn
elA
mou
ntP
erso
nnel
Am
ount
Per
sonn
elA
mou
ntP
erso
nnel
Am
ount
Per
sonn
elA
mou
nt
Dat
a pr
oces
sing
sys
tem
sP
os./B
A0
$30,
172
0$3
0,17
20
$30,
529
85$6
4,93
385
$34,
404
FTE
/Obl
.0
30,0
060
30,5
540
30,5
2965
64,9
3365
34,4
04
Tota
lP
os./B
A0
30,1
72
030
,172
030
,529
8564
,933
8534
,404
FTE
/Obl
.0
30,0
06
030
,554
030
,529
6564
,933
6534
,404
Adj
ustm
ents
to O
blig
atio
ns:
R
ecov
erie
s(4
69)
U
nobl
igat
ed b
alan
ce, s
tart
of y
ear
(41)
(3
82)
U
nobl
igat
ed b
alan
ce, e
xpiri
ng
Uno
blig
ated
bal
ance
, end
of y
ear
879
R
efun
d(2
03)
U
nobl
igat
ed b
alan
ce, r
esci
nded
Adj
ustm
ents
to B
udge
t Aut
horit
y:
Res
ciss
ion
673
Seq
uest
ratio
n1,
637
Fina
ncin
g fro
m tr
ansf
ers:
T
rans
fer f
rom
oth
er a
ccou
nts
(76)
Tra
nsfe
r to
othe
r acc
ount
s
App
ropr
iatio
nP
os.
32,4
0630
,172
30,5
2964
,933
34,4
04
Incr
ease
/ (D
ecre
ase)
ov
er B
ase
2013
A
ctua
l20
14
Ena
cted
2015
B
ase
2015
E
stim
ate
CEN-177
Exhibit 12 – 15 APPROPRIATION ACCOUNT: Periodic Censuses and Programs BUDGET PROGRAM: Data Processing Systems For FY 2015, the Census Bureau requests an increase of $34,404,000 and 65 FTE to the FY 2015 base for a total of $64,933,000 and 65 FTE for Data Processing Systems. BASE JUSTIFICATION: Data Processing Systems Overview The Data Processing Systems budget is organized into one sub-program with the same name under the Periodic Censuses and Programs account. That sub-program consists of one line item with the same name ($64.9 million and 65 FTE). SIGNIFICANT ADJUSTMENTS-TO-BASE: The Census Bureau requests a net increase of $0.4 million to fund adjustments to the data processing systems program. SUB-PROGRAM: Data Processing Systems The objective of the Data Processing Systems line item is to provide day-to-day information technology support for all program areas of the Census Bureau. The data processing systems program manages hardware and software supporting the Census Bureau’s enterprise needs. Economies of scale are achieved through centralized information technology contracts and services in accordance with the Department of Commerce guidelines and a comprehensive information technology plan. The Census Bureau-wide information technology responsibilities include all voice and data telecommunications services, management of the general-purpose computing facility, management of the wide area network, support for local area networks, network security and continuity of operations support, and management of several bureau-wide software licenses. These enterprise software licenses ensure a standard open-systems development environment supporting distributed processing platforms. This program will continue to provide automated systems and technology support for the decennial census and other Census Bureau programs.
CEN-178
PROGRAM CHANGES: 1. Census Enterprise Data Collection and Processing ($27,463,000, 65 FTE): In the past, it was common practice at the Census Bureau to develop new and unique data collection and processing systems for each survey or census. We built multiple similar systems tailored to the organizations within our enterprise rather than providing functional capabilities that met requirements across the enterprise. With this initiative, the Census Bureau Chief Information Officer will work hand-in-hand with the 2020 Census Directorate to bring an enterprise approach to data collection and processing. We can no longer build systems that serve a single project - be it a small survey or a Decennial Census. This initiative reflects a new organization of both work and data around functional capabilities and the basic process steps common to all surveys and censuses. Taken together, we refer to these common steps as the Survey Lifecycle. With the Survey Lifecycle as an organizing principle, this initiative will transform the way we work, using standard shared services wherever possible. Data collection is the activity in the lifecycle that costs the most. We are starting with data collection as the critical process that will ultimately lead to more streamlined data dissemination. This means that in the future, whether any given operation produces economic, demographic, governmental, or decennial census information, data collection and processing will take place within a standardized context, based on shared services and applications that support not only our internal data requirements, but also those of all of our data users. Specifically, this initiative supports computer hardware, software, and system development lifecycle costs for common enterprise-wide solutions for the following data collection and processing functions:
– Centralized Development and Testing Environment – Service Oriented Architecture (i.e., common infrastructure and efficient system
interfaces to allow IT applications to communicate without the need for costly system re-writes
– Centralized Operational Analysis and Control and Adaptive Survey Design capability – Survey Interview Operational Control – Dashboard for Monitoring Survey Cost, Progress, and Quality – Enterprise Paradata Repository
As stated above, this initiative works in concert with the 2020 Census Program that has requested funding for hardware, software, and system development lifecycle costs for common enterprise solutions for the following additional critical data collection and processing functions:
– Questionnaire Design – Internet Data Collection – Data Capture from Paper – Address Listing and Mapping – Survey Response Processing
Under this initiative, we will halt the creation of program-specific systems and put in place a solution that will be mature and proven well in advance of the 2020 Census. A holistic investment, it both precedes and outlasts the 2020 Decennial Census moving in the direction of a permanent enterprise
CEN-179
data collection and processing environment at an estimated cost lower than the cost of 2010 Census systems alone. This approach not only decreases costs relative to the previous approach of developing unique systems for the different organizations within the enterprise, it also decreases risk. For example, the planned enterprise solutions for Internet Data Collection and Survey Interview Operational Control will be tested and used in production in the American Community Survey and other demographic surveys starting in FY 2016. This gives us the opportunity to work out problems and enhance both functionality and scalability well in advance of the 2020 Census. Statement of Need and Economic Benefits – Cost Benefit Analysis There are currently six unique systems at the U.S. Census Bureau for managing survey samples during data collection operations; twenty unique systems to manage the different modes of data collection, data capture, and field control; and five major unique survey and census data processing systems. In the preparation and execution of the 2010 Census, the Census Bureau spent over $1 billion to build and deploy only four of the nearly thirty systems mentioned above. After the 2010 Census, those four systems were retired. In the Enterprise Data Collection and Processing initiative, we are creating an integrated and standardized system of systems that offers shared data collection and processing services across the enterprise. We will consolidate costs by retiring unique, survey-specific systems and redundant capabilities and bring a significant portion of the Census Bureau’s total IT expenditures under a single, integrated and centrally managed program. As stated above, we will halt the creation of program-specific systems and puts in place a solution that will be mature and proven for the 2020 Census. This solution will both precede and outlast the 2020 Decennial Census moving in the direction of a permanent enterprise data collection and processing environment at an estimated cost lower than the cost of 2010 Census systems alone. As noted earlier, the CEDCaP initiative works in concert with the 2020 program increase, which funds several of the systems that, combined, move the Census Bureau toward common enterprise solutions for data collection and processing functions. The potential cost savings cited for the 2020 Census in that program narrative assume the CEDCaP initiative is fully funded. Base Resources Assessment
Base Resource Amount: $30,529,000 Base FTE: 0 This initiative significantly changes the nature of the Data Processing Systems appropriation enabling a common shared services and data approach for the enterprise. Prior to this initiative, the more limited role of this appropriation was to support management of hardware and software, voice and data telecommunications services, management of the general-purpose computing facility, management of the wide area network, Management of the local area networks, network security and continuity of operations, and management of several bureau-wide software licenses. As stated above, this new initiative provides the structure for the Census Bureau Chief Information Officer to work collaboratively with the 2020 Census Directorate to bring an enterprise approach to data
CEN-180

collection and processing. It reinforces the Census Bureau’s efforts to organize both work and data around functional capabilities and the basic process steps common to all surveys and censuses. Funding for this new initiative in FY 2015 is critical in order to ensure that the enterprise shared systems are developed and tested in production in advance of the 2020 Census. Risk Assessment: This initiative is tightly aligned with the Office of Management and Budget (OMB) Information Technology Reform and consolidation strategies. It provides a common shared platform for data collection and processing that is a key element in avoiding or mitigating significant risks to Census Bureau Operations. Managing the survey lifecycle using software systems that are not fully integrated can result in survey errors and cost inefficiencies (Thalji and Hill 2013 Journal of Official Statistics). Further, decentralized systems with multiple cyber-security plans are more difficult to secure than centrally-managed systems under a single security plan. This initiative mitigates risk in three areas: data accuracy, cyber security, and cost efficiency. Additionally, by providing shared services used across the enterprise, it strengthens the Census Bureau’s portfolio management approach. This initiative will expose all key system interfaces as services, following a service-based architecture. We will move from isolated, unique data collection systems that complicate interoperability, to a common data collection and control system that uses standard metadata across the organization, increasing our internal efficiency and making data more accessible, discoverable, and usable for the taxpayer. Not taking this approach will perpetuate the development and maintenance of redundant survey-specific systems, some of which will be highly expensive and used only once during the Decennial Census. Schedule and Milestones: Fiscal Year 2015
• Centralized Development and Testing Environment complete • All Systems Integrations Test for Baseline 1 of the Centralized Operational Analysis and
Control and Adaptive Design capability Complete • Service Oriented Architecture Implemented in Production
Fiscal Year 2016
• Baseline 1 the Centralized Operational Analysis and Control and Adaptive Design capability Ready for Production
• Enterprise Paradata Repository in development Fiscal Year 2017
• All Systems Integrations Test for Baseline 2 of the Centralized Operational Analysis and Control and Adaptive Design capability Complete
• Dashboard for Monitoring Survey Cost, Progress, and Quality implemented • Survey Interview Operational Control Systems Production and Interfaces Complete
CEN-181

Fiscal Year 2018 • Baseline 2 of the Centralized Operational Analysis and Control and Adaptive Design
capability Ready for 2020 Census Testing • Survey Interview Operational Control Systems Production and Interfaces in production in the
American Community Survey and for 2020 testing Fiscal Year 2019
• Economic Pilot Test Complete • Systems Integrations Test for Iteration 3 of the Centralized Operational Analysis and Control
and Adaptive Design capability Performance Goals and Measurement Data: Performance FY 2015 FY 2016 FY 2017 FY 2018 FY 2019 Measure:
Target Target Target Target Target
With Change 1) Centralized Development and Testing Environment completed 2) All Systems Integrations Test for Baseline 1 of the Centralized Operational Analysis and
1) Baseline 1 of the Centralized Operational Analysis and Control and Adaptive Design capability in Production for the ACS 2)Enterprise
1) Systems Integration Test for Baseline 2 of the Centralized Operational Analysis and Control and Adaptive Design capability
1) Baseline 2 of the Centralized Operational Analysis and Control and Adaptive Design capability Ready for 2020 Census testing
1)Economic Pilot Test Complete 2) Systems Integration Test for Iteration 3 of the Centralized Operational Analysis and
Control and Adaptive Design capability Completed 3) Service Oriented Architecture Implemented in Production
Paradata Repository in development
Complete 2)Dashboard for Monitoring Survey Cost, Progress, and Quality implemented 3) Survey
2) Survey Interview Operational Control Systems Production and Interfaces in production in the American
Control and Adaptive Design capability implemented
Interview Operational Control Systems Production and Interfaces Complete
Community Survey and for 2020 testing
CEN-182
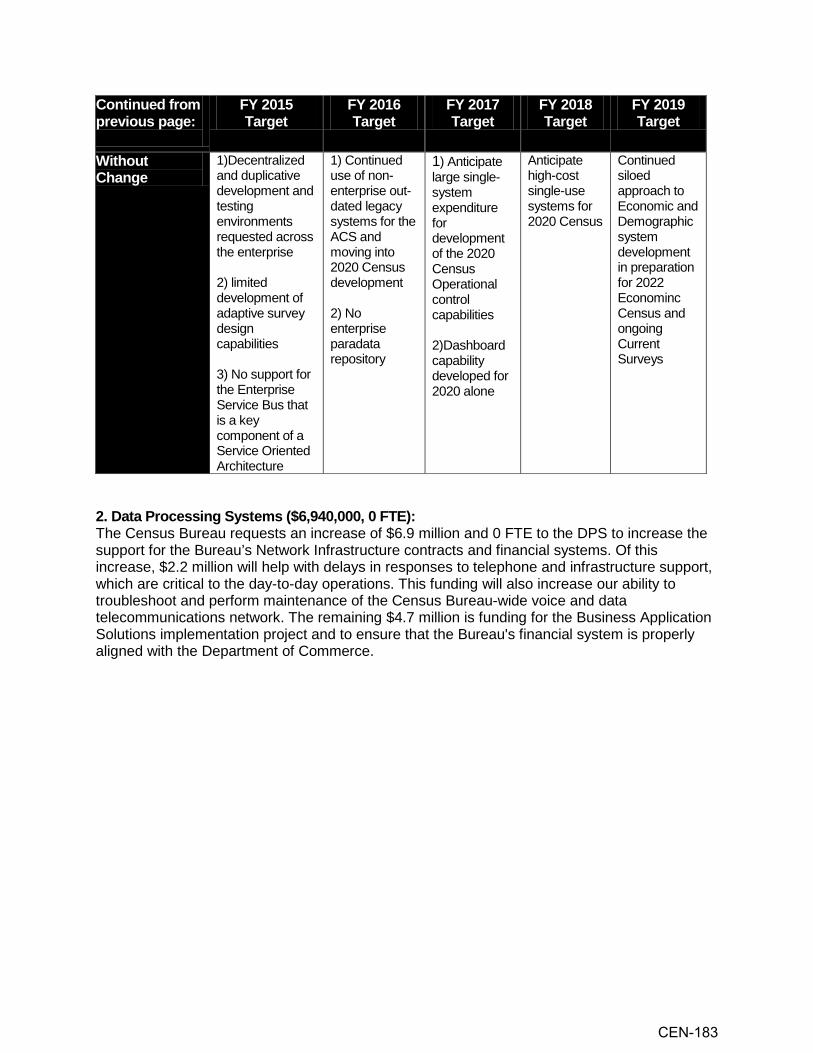
Continued from FY 2015 FY 2016 FY 2017 FY 2018 FY 2019 previous page: Target Target Target Target Target Without 1)Decentralized 1) Continued 1) Anticipate Anticipate Continued Change and duplicative use of non- large single- high-cost siloed
development and enterprise out- system single-use approach to testing dated legacy expenditure systems for Economic and environments systems for the for 2020 Census Demographic requested across ACS and development system the enterprise moving into of the 2020 development 2020 Census Census in preparation 2) limited development Operational for 2022 development of control Econominc adaptive survey 2) No capabilities Census and design enterprise ongoing capabilities paradata 2)Dashboard Current repository capability Surveys 3) No support for developed for the Enterprise 2020 alone Service Bus that is a key component of a Service Oriented Architecture
2. Data Processing Systems ($6,940,000, 0 FTE): The Census Bureau requests an increase of $6.9 million and 0 FTE to the DPS to increase the support for the Bureau’s Network Infrastructure contracts and financial systems. Of this increase, $2.2 million will help with delays in responses to telephone and infrastructure support, which are critical to the day-to-day operations. This funding will also increase our ability to troubleshoot and perform maintenance of the Census Bureau-wide voice and data telecommunications network. The remaining $4.7 million is funding for the Business Application Solutions implementation project and to ensure that the Bureau's financial system is properly aligned with the Department of Commerce.
CEN-183
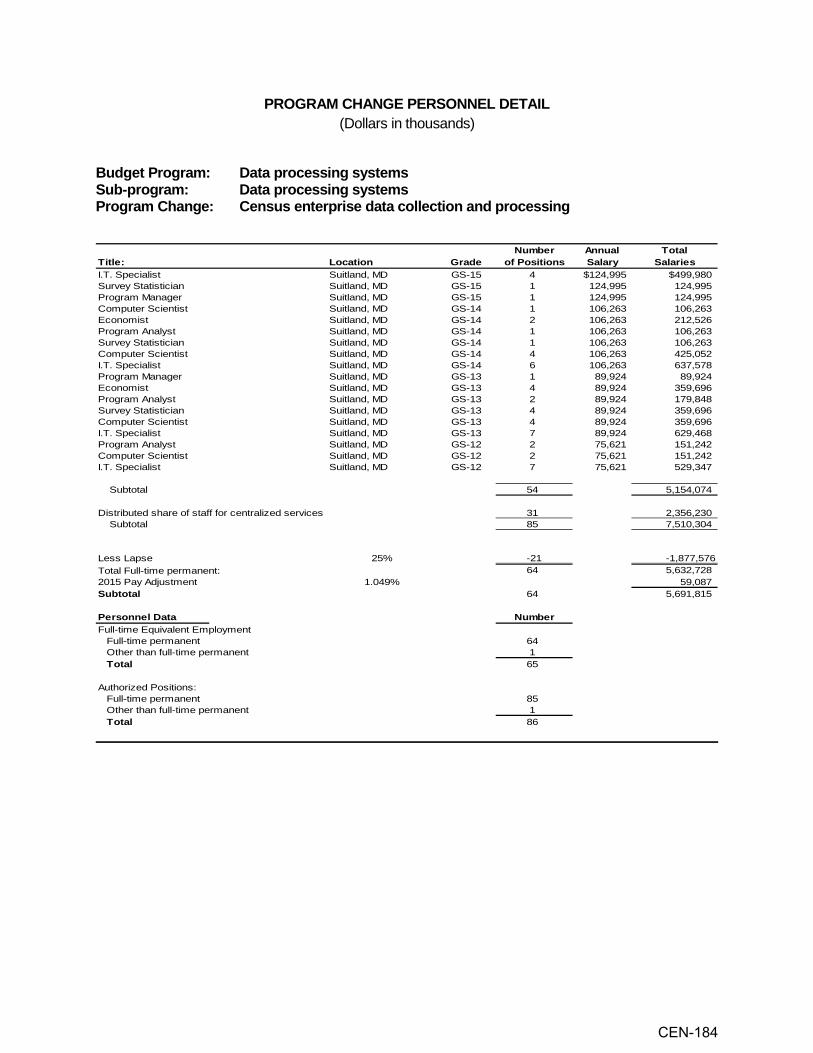
PROGRAM CHANGE PERSONNEL DETAIL (Dollars in thousands)
Budget Program: Data processing systems Sub-program: Data processing systems Program Change: Census enterprise data collection and processing
Number Annual TotalLocation Grade of Positions Salary Salaries
I.T. Specialist Suitland, MD GS-15 4 $124,995 $499,980Survey Statistician Suitland, MD GS-15 1 124,995 124,995 Program Manager Suitland, MD GS-15 1 124,995 124,995 Computer Scientist Suitland, MD GS-14 1 106,263 106,263 Economist Suitland, MD GS-14 2 106,263 212,526 Program Analyst Suitland, MD GS-14 1 106,263 106,263 Survey Statistician Suitland, MD GS-14 1 106,263 106,263 Computer Scientist Suitland, MD GS-14 4 106,263 425,052 I.T. Specialist Suitland, MD GS-14 6 106,263 637,578 Program Manager Suitland, MD GS-13 1 89,924 89,924 Economist Suitland, MD GS-13 4 89,924 359,696 Program Analyst Suitland, MD GS-13 2 89,924 179,848 Survey Statistician Suitland, MD GS-13 4 89,924 359,696 Computer Scientist Suitland, MD GS-13 4 89,924 359,696 I.T. Specialist Suitland, MD GS-13 7 89,924 629,468 Program Analyst Suitland, MD GS-12 2 75,621 151,242 Computer Scientist Suitland, MD GS-12 2 75,621 151,242 I.T. Specialist Suitland, MD GS-12 7 75,621 529,347
Subtotal 54 5,154,074
Distributed share of staff for centralized services 31 2,356,230 Subtotal 85 7,510,304
Less Lapse 25% -21 -1,877,576Total Full-time permanent: 64 5,632,728
1.049% 59,087 Subtotal 64 5,691,815
Personnel Data NumberFull-time Equivalent Employment
Full-time permanent 64Other than full-time permanent 1Total 65
Authorized Positions:Full-time permanent 85Other than full-time permanent 1Total 86
2015 Pay Adjustment
Title:
CEN-184

PROGRAM CHANGE DETAIL BY OBJECT CLASS (Dollars in thousands)
Budget Program: Data processing systems Sub-program: Data processing systems Program Change: Census enterprise data collection and processing
FY 2015 FY 2015Object Class Increase Total Program
11 Personnel compensation11.1 Full-time permanent $5,692 $5,692 11.3 Other than full-time permanent 58 58 11.5 Other personnel compensation 48 48 11.8 Special personnel services payments 0 0 11.9 Total personnel compensation 5,798 5,798 12 Civilian personnel benefits 1,864 1,864 13 Benefits for former personnel 4 4 21 Travel and transportation of persons 168 168 22 Transportation of things 5 5 23.1 Rental payments to GSA 639 639 23.2 Rental Payments to others 8 8 23.3 Communications, utilities and miscellaneous charges 7,724 7,759 24 Printing and reproduction 11 11 25.1 Advisory and assistance services 4,623 9,604 25.2 Other services 661 999 25.3 Purchases of goods & services from Gov't accounts 664 5,371 25.4 Operation and maintenance of facilities 178 178 25.5 Research and development contracts 11 75 25.6 Medical care 0 0 25.7 Operation and maintenance of equipment 4,267 30,851 25.8 Subsistence and support of persons 6 6 26 Supplies and materials 52 813 31 Equipment 780 780 32 Lands and structures 0 0 33 Investments and loans 0 0 41 Grants, subsidies and contributions 0 0 42 Insurance claims and indemnities 0 0 43 Interest and dividends 0 0 44 Refunds 0 0 99 Total obligations 27,463 64,933
CEN-185
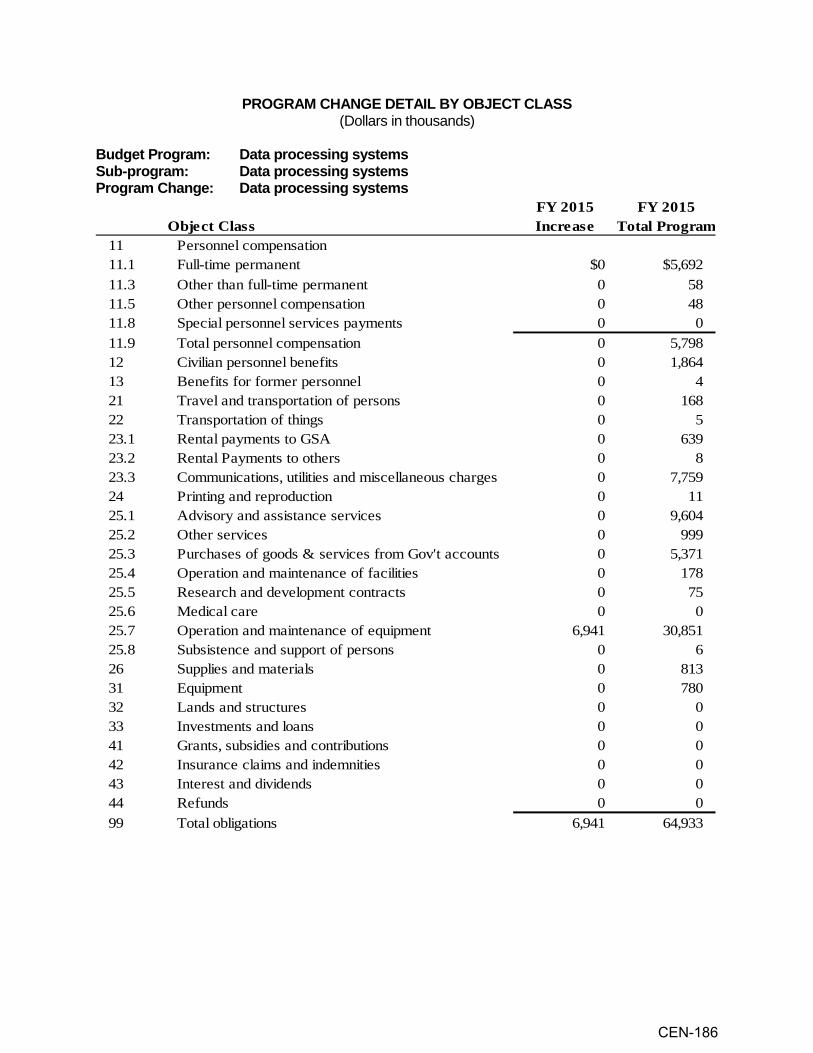
PROGRAM CHANGE DETAIL BY OBJECT CLASS (Dollars in thousands)
Budget Program: Data processing systems Sub-program: Data processing systems Program Change: Data processing systems
FY 2015 FY 2015Object Class Increase Total Program
11 Personnel compensation11.1 Full-time permanent $0 $5,692 11.3 Other than full-time permanent 0 58 11.5 Other personnel compensation 0 48 11.8 Special personnel services payments 0 0 11.9 Total personnel compensation 0 5,798 12 Civilian personnel benefits 0 1,864 13 Benefits for former personnel 0 4 21 Travel and transportation of persons 0 168 22 Transportation of things 0 5 23.1 Rental payments to GSA 0 639 23.2 Rental Payments to others 0 8 23.3 Communications, utilities and miscellaneous charges 0 7,759 24 Printing and reproduction 0 11 25.1 Advisory and assistance services 0 9,604 25.2 Other services 0 999 25.3 Purchases of goods & services from Gov't accounts 0 5,371 25.4 Operation and maintenance of facilities 0 178 25.5 Research and development contracts 0 75 25.6 Medical care 0 0 25.7 Operation and maintenance of equipment 6,941 30,851 25.8 Subsistence and support of persons 0 6 26 Supplies and materials 0 813 31 Equipment 0 780 32 Lands and structures 0 0 33 Investments and loans 0 0 41 Grants, subsidies and contributions 0 0 42 Insurance claims and indemnities 0 0 43 Interest and dividends 0 0 44 Refunds 0 0 99 Total obligations 6,941 64,933
CEN-186

sasl
s Cam
t )
e ec
cer an
ds
rogr bj
Om eau
by
om ur B a
nd P
s hous
C ent n t
us es i
of
us em
ent
ens s
rou
nt
m C.t ens
epar S eq
ui
. C am
c RUD od
i o
f lar
oli y Der ar (
P mum
S
Exh
ibit
16
Obj
ect C
lass
2013
Act
ual
2014
E
nact
ed20
15
Bas
e20
15E
stim
ate
Incr
ease
/ (D
ecre
ase)
ov
er B
ase
11P
erso
nnel
com
pens
atio
n11
.1Fu
ll-tim
e pe
rman
ent
$238
,118
$231
,920
$233
,632
$295
,332
$61,
700
11.3
Oth
er th
an fu
ll-tim
e pe
rman
ent
44,3
7751
,249
51,7
7362
,423
10,6
5011
.5O
ther
per
sonn
el c
ompe
nsat
ion
7,68
34,
074
4,07
48,
751
4,67
711
.8S
peci
al p
erso
nnel
ser
vice
s pa
ymen
ts0
00
00
11.9
Tota
l per
sonn
el c
ompe
nsat
ion
290,
178
287,
243
289,
479
366,
506
77,0
27
12.1
Civ
ilian
per
sonn
el b
enef
its85
,967
93,1
7595
,278
117,
194
21,9
1613
Ben
efits
for f
orm
er p
erso
nnel
2,32
71,
667
1,66
71,
385
(282
)21
Trav
el a
nd tr
ansp
orta
tion
of p
erso
ns14
,398
18,5
0718
,446
23,1
944,
748
22Tr
ansp
orta
tion
of th
ings
951
719
728
849
121
23.1
Ren
tal p
aym
ents
to G
SA
26,3
9136
,653
37,1
0539
,471
2,36
623
.2R
enta
l pay
men
ts to
oth
ers
3,77
31,
376
1,37
726
8(1
,109
)23
.3C
omm
unic
atio
n, u
tiliti
es, m
isc.
cha
rges
26,7
1720
,131
20,1
6528
,459
8,29
424
Prin
ting
and
repr
oduc
tion
3,09
84,
156
4,20
64,
543
337
25.1
Adv
isor
y an
d as
sist
ance
ser
vice
s69
,542
35,6
4935
,120
68,9
8633
,866
25.2
Oth
er s
ervi
ces
from
non
-Fed
eral
sou
rces
13,7
5559
,167
58,5
7812
6,48
867
,910
25.3
Oth
er g
oods
and
ser
vice
s fro
m F
eder
al s
ourc
es21
,697
39,3
4239
,416
39,6
3521
925
.4O
pera
tion
& m
aint
enan
ce o
f fac
ilitie
s4,
784
10,7
9010
,880
11,9
561,
076
25.5
Res
earc
h &
dev
elop
men
t con
tract
s18
08,
132
8,16
75,
986
(2,1
81)
25.6
Med
ical
Car
e0
00
00
25.7
Ope
ratio
n &
mai
nten
ance
of e
quip
men
t64
,201
56,6
9356
,631
106,
440
49,8
0925
.8S
ubsi
sten
ce &
sup
port
of p
erso
ns22
451
452
052
88
26S
uppl
ies
and
mat
eria
ls3,
191
3,38
53,
423
4,58
91,
166
31E
quip
men
t12
,012
16,9
2817
,021
15,4
00(1
,621
)32
Land
s an
d st
ruct
ures
00
00
033
Inve
stm
ents
and
loan
s0
00
00
41G
rant
s, s
ubsi
dies
and
con
tribu
tions
00
00
042
Insu
ranc
e cl
aim
s an
d in
dem
nitie
s0
00
00
43In
tere
st a
nd d
ivid
ends
10
00
044
Ref
unds
00
00
092
Con
tinge
ncy
fund
00
00
0
99S
ubto
tal,
Dire
ct O
blig
atio
ns64
3,38
769
4,22
769
8,20
796
1,87
726
3,67
0P
rior y
ear r
ecov
erie
s(8
,071
)(2
,227
)0
00
Uno
blig
ated
bal
ance
, sta
rt of
yea
r(1
2,55
8)0
00
0U
nobl
igat
ed b
alan
ce, e
xpiri
ng0
00
00
Uno
blig
ated
bal
ance
, end
of y
ear
2,25
50
00
0U
nobl
igat
ed b
alan
ce, r
esci
nded
926
00
00
Ref
und
(5,2
11)
00
00
TOTA
L, B
UD
GE
T A
UTH
OR
ITY
620,
728
692,
000
698,
207
961,
877
263,
670
Res
ciss
ion
13,4
760
00
0S
eque
stra
tion
32,7
500
00
0Tr
ansf
ers
from
Oth
er A
ccou
nts
(18,
000)
00
00
Tran
sfer
s to
Oth
er A
ccou
nts
1,00
00
00
0TO
TAL,
App
ropr
iatio
n64
9,95
469
2,00
069
8,20
796
1,87
726
3,67
0
CEN-187
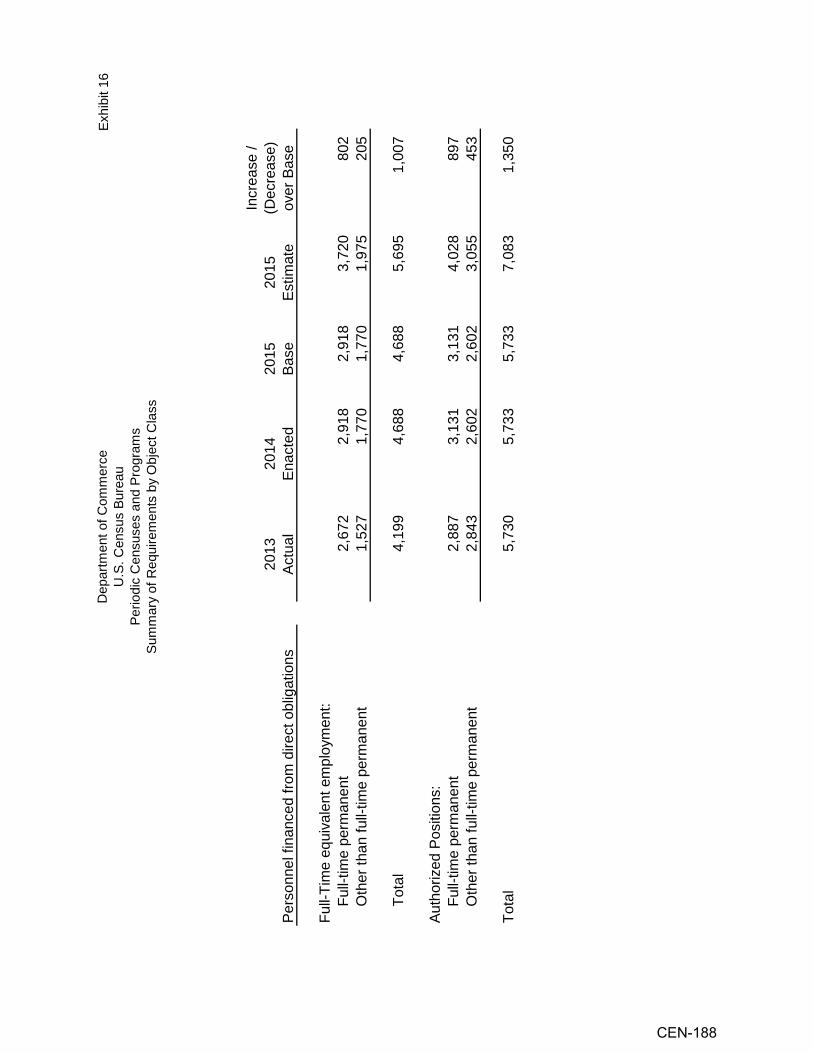
sasl
s Ct
e am ec
cer og
r bj
eau r Om
om ur C a
nd P by
s
B ent
us es of
us em
ent
ens
r
m C.t ens
equi
epar S. Cc RU
of
D iodi y
er arP m
umS
Exhi
bit 1
6
Pers
onne
l fin
ance
d fro
m d
irect
obl
igat
ions
2013
Ac
tual
2014
En
acte
d20
15Ba
se20
15
Estim
ate
Incr
ease
/ (D
ecre
ase)
ov
er B
ase
Full-
Tim
e eq
uiva
lent
em
ploy
men
t:
Ful
l-tim
e pe
rman
ent
2,67
22,
918
2,91
83,
720
802
O
ther
than
full-
time
perm
anen
t1,
527
1,77
01,
770
1,97
520
5
T
otal
4,19
94,
688
4,68
85,
695
1,00
7
Auth
oriz
ed P
ositi
ons:
F
ull-t
ime
perm
anen
t2,
887
3,13
13,
131
4,02
889
7
Oth
er th
an fu
ll-tim
e pe
rman
ent
2,84
32,
602
2,60
23,
055
453
Tota
l5,
730
5,73
35,
733
7,08
31,
350
CEN-188

Exhibit 33
Department of Commerce U.S. Census Bureau
Periodic Censuses and Programs Appropriation Language and Code Citations:
1. For necessary expenses to collect and publish statistics for periodic censuses and
programs provided for by law, $961,877,000 to remain available until September 30, 2016, provided that from amounts provided herein, funds may be used for promotion, outreach, and marketing activities.
13 U.S.C. §§4, 6, 12, 61-63, 81, 91, 181, 182, 301-307, 401; 15 U.S.C. §§1516, 4901 et seq.; 19 U.S.C. §§1484(e), 2354, 2393.
13 U.S.C. §4 authorizes the Secretary to "perform the functions and duties imposed upon him by this title," or he may delegate any of them "to such officers and employees of the Department of Commerce as he may designate."
13 U.S.C. §§6, 12, 61-63, 81, 91, 182, 301-307 provide for (1) acquisition of information from other organizations, public and private; (2) conducting joint statistical projects with nonprofit organizations or agencies; (3) conducting mechanical and electronic developmental work as needed; (4) collection and publication of statistics on fats and oils; (5) collection and publication of statistics relating to the domestic apparel and textile industries; (6) collection and publication of quarterly financial statistics of business operations; (7) conducting current surveys on statistical subjects covered by periodic censuses; and (8) compilation and publication of information on imports, exports, and mode of transportation.
13 U.S.C. §181 provides that "The Secretary...shall annually produce and publish for each state, county, and local unit of general purpose government which has a population of fifty thousand or more, current data on total population and population characteristics and...shall biennially produce and publish for other local units of general purpose government current data on total population."
13 U.S.C. §401 provides that "The Bureau of the Census shall exchange with the Bureau of Economic Analysis of the Department of Commerce information collected under this title, and under the International Investment and Trade in Services Survey Act, that pertains to any business enterprise that is operating in the United States, if the Secretary of Commerce determines such information is appropriate to augment and improve the quality of data collected under the International Investment and Trade in Services Survey Act."
15 U.S.C. §1516 provides that "The Secretary of Commerce shall have control of the work of gathering and distributing statistical information naturally relating to the subjects
CEN-189
confided to his department...He shall also have authority to call upon other departments of the government for statistical data and results obtained by them; and he may collate, arrange, and publish such statistical information so obtained in such manner as to him may seem wise."
15 U.S.C. §4901 et seq. provides that "The Secretary [of Commerce] shall establish the [National Trade] Data Bank. The Secretary shall manage the Data Bank."
19 U.S.C. §1484(e) provides that "The Secretary of the Treasury, the Secretary of Commerce, and the United States International Trade Commission are authorized and directed to establish...an enumeration of articles...comprehending all merchandise imported into the United States and exported from the United States, and shall seek, in conjunction with statistical programs for domestic production and programs for achieving international harmonization of trade statistics, to establish the comparability thereof with such enumeration of articles."
19 U.S.C. §2354 provides that "Whenever the [International Trade] Commission begins an investigation...with respect to an industry, the Commission shall immediately notify the Secretary [of Commerce] of such investigation, and the Secretary shall immediately begin a study of:
(1) the number of firms in the domestic industry producing the like or directly
competitive article which have been or are likely to be certified as eligible for adjustment assistance, and
(2) the extent to which the orderly adjustment of such firms to the import
competition may be facilitated through the use of existing programs."
19 U.S.C. §2393 provides that "The Secretary of Commerce and the Secretary of Labor shall establish and maintain a program to monitor imports of articles into the United States which will reflect changes in the volume of such imports, the relation of such imports to changes in domestic production, changes in employment within domestic industries producing articles like or directly competitive with such imports, and the extent to which such changes in production and employment are concentrated in specific geographic regions of the United States."
CEN-190
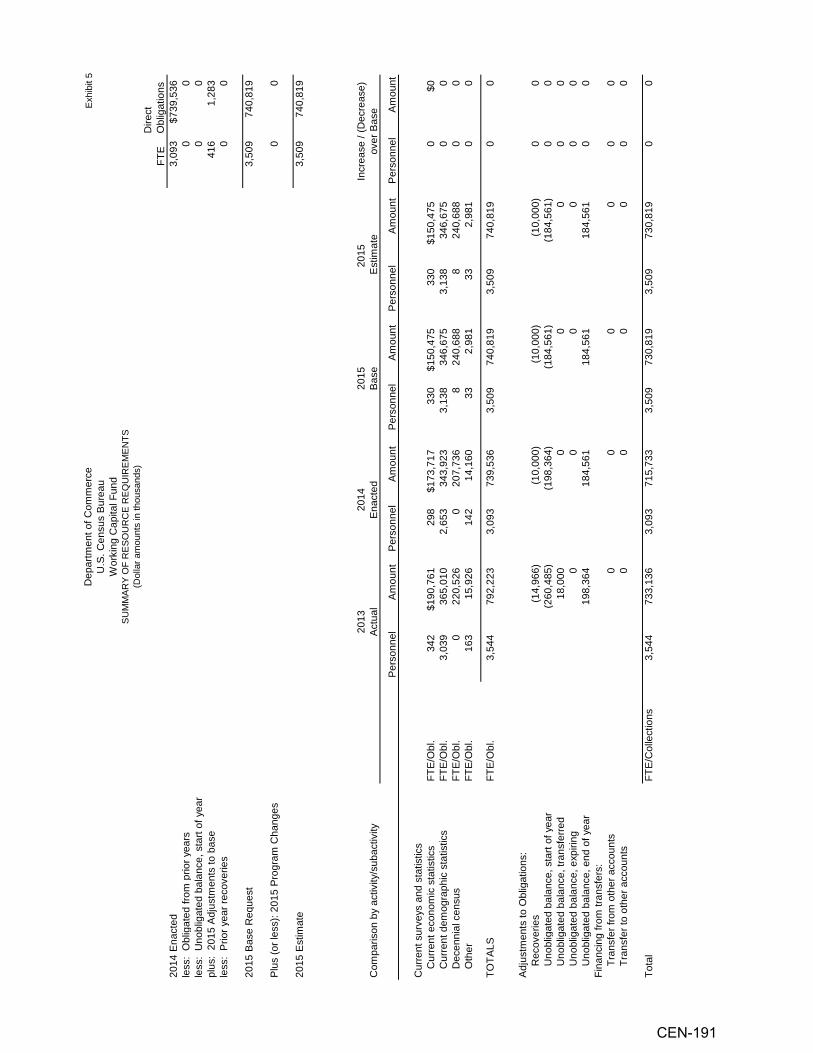
SN
TE
MR
E )ec d UI
er Q ands
m eau
un
om
Fur RE
al hous
B C us apit
of
UR
CE n t
i
ent
ens s
OS ou
nt
m C ng C
i.t kS RE
am
epar . or F arU W O l
ol
D RY D(
AM
UM
S
Exh
ibit
5
FTE
Dire
ct
Obl
igat
ions
2014
Ena
cted
3,09
3$7
39,5
36le
ss:
Obl
igat
ed fr
om p
rior y
ears
00
less
: U
nobl
igat
ed b
alan
ce, s
tart
of y
ear
00
plus
: 20
15 A
djus
tmen
ts to
bas
e41
61,
283
less
: P
rior y
ear r
ecov
erie
s0
0
2015
Bas
e R
eque
st3,
509
740,
819
Plu
s (o
r les
s): 2
015
Pro
gram
Cha
nges
00
2015
Est
imat
e3,
509
740,
819
Com
paris
on b
y ac
tivity
/sub
activ
ity
Per
sonn
elA
mou
ntP
erso
nnel
Am
ount
Per
sonn
elA
mou
ntP
erso
nnel
Am
ount
Per
sonn
elA
mou
nt
Cur
rent
sur
veys
and
sta
tistic
s
Cur
rent
eco
nom
ic s
tatis
tics
FTE
/Obl
.34
2$1
90,7
6129
8$1
73,7
1733
0$1
50,4
7533
0$1
50,4
750
$0
Cur
rent
dem
ogra
phic
sta
tistic
sFT
E/O
bl.
3,03
936
5,01
02,
653
343,
923
3,13
834
6,67
53,
138
346,
675
00
D
ecen
nial
cen
sus
FTE
/Obl
.0
220,
526
020
7,73
68
240,
688
824
0,68
80
0
Oth
erFT
E/O
bl.
163
15,9
2614
214
,160
332,
981
332,
981
00
TOTA
LSFT
E/O
bl.
3,54
479
2,22
33,
093
739,
536
3,50
974
0,81
93,
509
740,
819
00
Adj
ustm
ents
to O
blig
atio
ns:
R
ecov
erie
s(1
4,96
6)(1
0,00
0)(1
0,00
0)(1
0,00
0)0
0
Uno
blig
ated
bal
ance
, sta
rt of
yea
r(2
60,4
85)
(198
,364
)(1
84,5
61)
(184
,561
)0
0
Uno
blig
ated
bal
ance
, tra
nsfe
rred
18,0
000
00
00
U
nobl
igat
ed b
alan
ce, e
xpiri
ng0
00
00
0
Uno
blig
ated
bal
ance
, end
of y
ear
198,
364
184,
561
184,
561
184,
561
00
Fina
ncin
g fro
m tr
ansf
ers:
T
rans
fer f
rom
oth
er a
ccou
nts
00
00
00
T
rans
fer t
o ot
her a
ccou
nts
00
00
00
Tota
l FT
E/C
olle
ctio
ns3,
544
733,
136
3,09
371
5,73
33,
509
730,
819
3,50
973
0,81
90
0
Incr
ease
/ (D
ecre
ase)
ov
er B
ase
2013
A
ctua
l20
14
Ena
cted
2015
B
ase
2015
Est
imat
e
CEN-191

THIS
PAG
E IN
TEN
TIO
NA
LLY
LEFT
BLA
NK
CEN-192
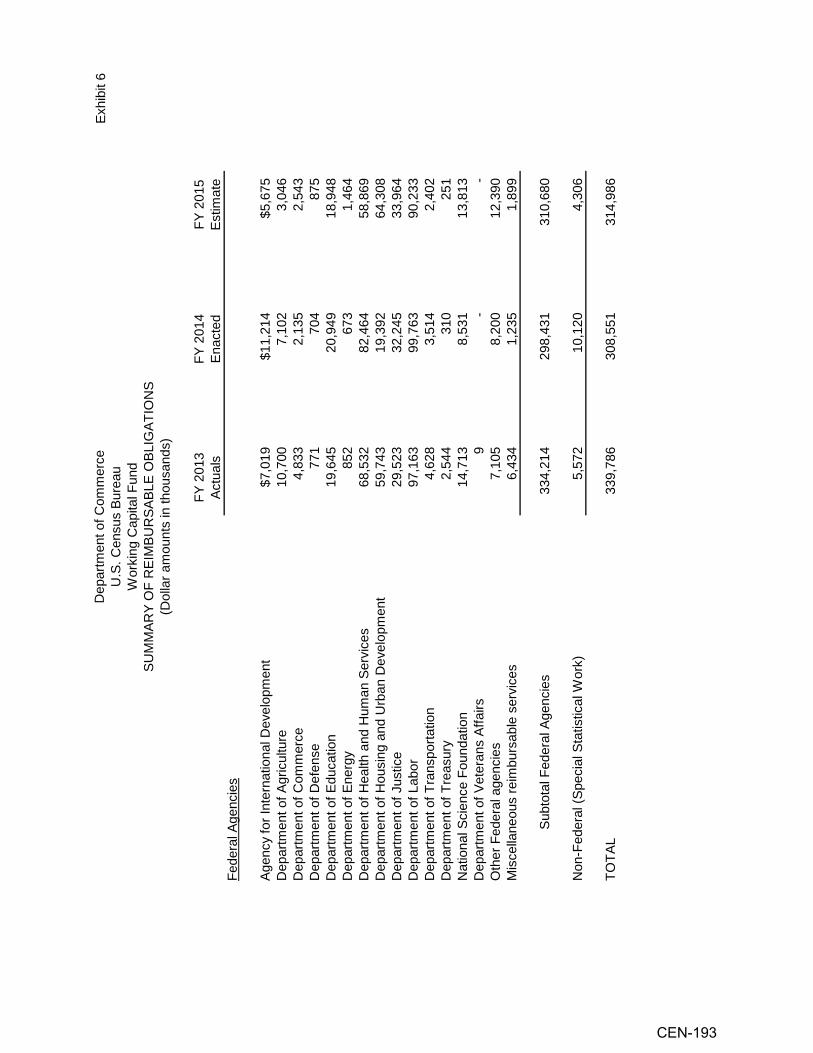
SN
OIAT
G )I
ec BL
er ands
m eau
und
E O
om
Fur al hous
B C SABL
us apit n
t i
of R
ent
ens s
BU ount
m C ng C
i M. kt EIS. or am
epar RU W F lar
D O olDY
AR(
MM
SU
Exh i
bit 6
FY 2
013
Actu
als
FY 2
014
Enac
ted
FY 2
015
Estim
ate
Fede
ral A
genc
ies
Agen
cy fo
r Int
erna
tiona
l Dev
elop
men
t$7
,019
$11,
214
$5,6
75D
epar
tmen
t of A
gric
ultu
re10
,700
7,10
2
3,
046
Dep
artm
ent o
f Com
mer
ce4,
833
2,
135
2,54
3
D
epar
tmen
t of D
efen
se77
1
70
4
875
D
epar
tmen
t of E
duca
tion
19,6
45
20
,949
18,9
48
D
epar
tmen
t of E
nerg
y85
2
67
3
1,46
4
D
epar
tmen
t of H
ealth
and
Hum
an S
ervi
ces
68,5
32
82
,464
58,8
69
D
epar
tmen
t of H
ousi
ng a
nd U
rban
Dev
elop
men
t59
,743
19,3
92
64
,308
Dep
artm
ent o
f Jus
tice
29,5
23
32
,245
33,9
64
D
epar
tmen
t of L
abor
97,1
63
99
,763
90,2
33
D
epar
tmen
t of T
rans
porta
tion
4,62
8
3,51
4
2,
402
Dep
artm
ent o
f Tre
asur
y2,
544
31
0
251
N
atio
nal S
cien
ce F
ound
atio
n14
,713
8,53
1
13
,813
Dep
artm
ent o
f Vet
eran
s Af
fairs
9
-
-
Oth
er F
eder
al a
genc
ies
7,10
5
8,20
0
12
,390
Mis
cella
neou
s re
imbu
rsab
le s
ervi
ces
6,43
4
1,23
5
1,
899
Sub
tota
l Fed
eral
Age
ncie
s33
4,21
4
29
8,43
1
310,
680
Non
-Fed
eral
(Spe
cial
Sta
tistic
al W
ork)
5,57
2
10,1
20
4,
306
TOTA
L33
9,78
6
30
8,55
1
314,
986
CEN-193
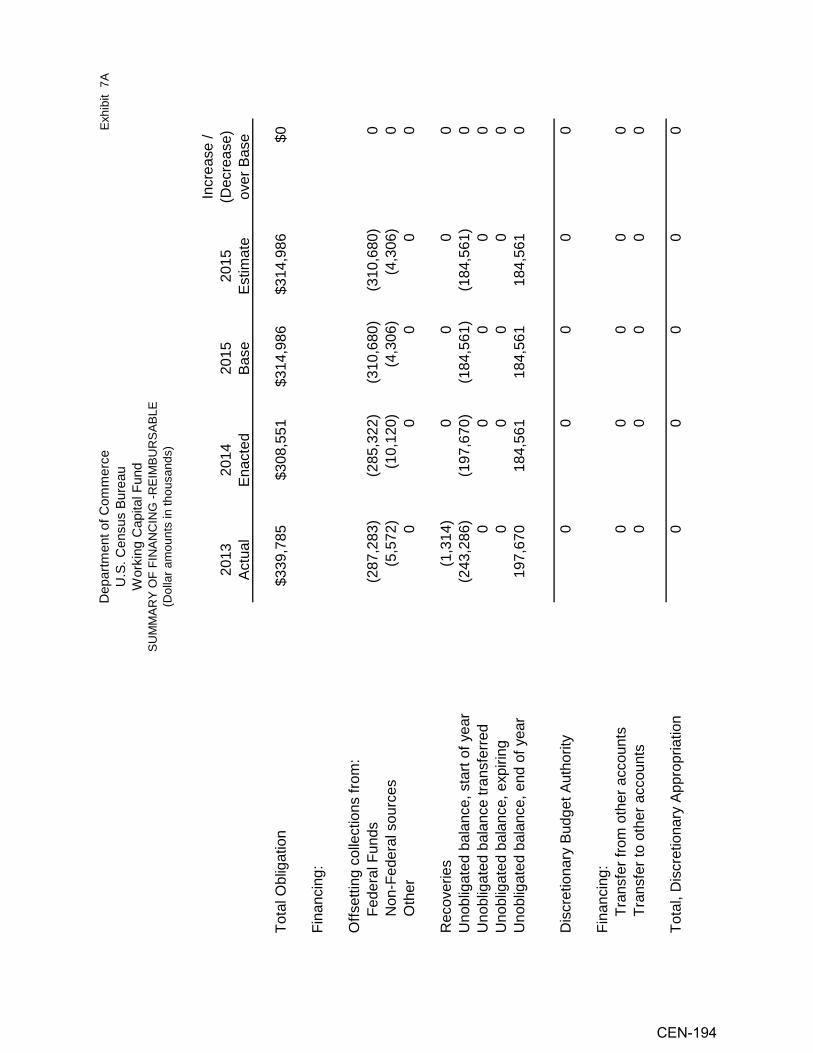
ELB
AU
RS
)ec B
er M ands
m eau
und
IR
E
om
Fur al - hous
B C NG
us apit n
t
of
NC
I i
ent
ens s
ount
m C ng C
i NA
k I.t S F am
epar . or F arU W O l
ol
D RY D(
AM
UM
S
Exh
ibit
7A
2013
Actu
al20
14
Enac
ted
2015
Base
2015
Estim
ate
Incr
ease
/(D
ecre
ase)
over
Bas
e
Tota
l Obl
igat
ion
$339
,785
$308
,551
$314
,986
$314
,986
$0
Fina
ncin
g: O
ffset
ting
colle
ctio
ns fr
om:
F
eder
al F
unds
(287
,283
)(2
85,3
22)
(310
,680
)(3
10,6
80)
0
Non
-Fed
eral
sou
rces
(5,5
72)
(10,
120)
(4,3
06)
(4,3
06)
0
Oth
er0
00
00
Rec
over
ies
(1,3
14)
00
00
Uno
blig
ated
bal
ance
, sta
rt of
yea
r(2
43,2
86)
(197
,670
)(1
84,5
61)
(184
,561
)0
Uno
blig
ated
bal
ance
tran
sfer
red
00
00
0U
nobl
igat
ed b
alan
ce, e
xpiri
ng0
00
00
Uno
blig
ated
bal
ance
, end
of y
ear
197,
670
184,
561
184,
561
184,
561
0
Dis
cret
iona
ry B
udge
t Aut
horit
y0
00
00
Fina
ncin
g:
Tra
nsfe
r fro
m o
ther
acc
ount
s0
00
00
T
rans
fer t
o ot
her a
ccou
nts
00
00
0
Tota
l, D
iscr
etio
nary
App
ropr
iatio
n0
00
00
CEN-194

EDATI
PR )Oec
er ands
m eau
und
ur APP
R
om
F -al hous
B G C us apit n
tN i
of I
ent
ens sC
AN ount
m C ng C
i N. k It S. or F am
epar U W F lar
D O olY DAR
(M
MSU
Exhi
bit
7B
2013
Actu
al20
14
Enac
ted
2015
Base
2015
Estim
ate
Incr
ease
/(D
ecre
ase)
over
Bas
e
Tota
l Obl
igat
ion
$452
,437
$430
,985
$425
,833
$425
,833
$0
Fina
ncin
g: O
ffset
ting
colle
ctio
ns fr
om:
F
eder
al F
unds
00
00
0
Non
-Fed
eral
sou
rces
00
00
0
Oth
er(4
40,2
80)
(420
,291
)(4
15,8
33)
(415
,833
)0
Rec
over
ies
(13,
652)
(10,
000)
(10,
000)
(10,
000)
0U
nobl
igat
ed b
alan
ce, s
tart
of y
ear
(17,
199)
(694
)0
00
Uno
blig
ated
bal
ance
tran
sfer
red
18,0
000
00
0U
nobl
igat
ed b
alan
ce, e
xpiri
ng0
00
00
Uno
blig
ated
Bal
ance
, rec
siss
ion
Uno
blig
ated
bal
ance
, end
of y
ear
694
00
00
Dis
cret
iona
ry B
udge
t Aut
horit
y0
00
00
Fina
ncin
g:
Tra
nsfe
r fro
m o
ther
acc
ount
s0
00
00
T
rans
fer t
o ot
her a
ccou
nts
00
00
0
Tota
l, D
iscr
etio
nary
App
ropr
iatio
n0
00
00
CEN-195

Exhibit 12-15
Department of Commerce U.S. Census Bureau Working Capital Fund
PROGRAM JUSTIFICATION
APPROPRIATION ACCOUNT: Working Capital Fund BUDGET ACTIVITY: Working Capital Fund
The FY 2015 request is for $740.8 million, an increase of $1.3 million from FY 2014. The request includes $315 million in obligations from funding provided by other Federal agencies and other customers for reimbursable work that the Census Bureau performs on their behalf. The request includes 3,509 FTE in support of this reimbursable work for outside customers. BASE JUSTIFICATION FOR FY 2015: Working Capital Fund Overview The Working Capital Fund (WCF) was created by the Omnibus Consolidated Appropriations Act, 1997 (P.L. 104-208). The Working Capital Fund supports Department of Commerce and Census Bureau goals related to increasing scientific understanding and supports informed decision-making in the public and private sectors by providing current and benchmark measures of the Nation’s economy, society, and institutions. Significant Adjustments-to-Base (ATBs): The adjustments to base for the Working Capital Fund are not inflationary adjustments. Rather they reflect the cyclical nature of reimbursable work agreements that are managed by the fund. SUBACTIVITY: Working Capital Fund The Working Capital Fund is a revolving fund that supports a large reimbursable survey line of business performed for other Federal agencies. The Census Bureau is able to capitalize on its nationwide field infrastructure to conduct this work more efficiently and effectively than other agencies are able to do on their own. These reimbursable surveys include some of the most important surveys conducted by the Federal Government including the Current Population Survey, the Consumer Expenditure Survey, the National Crime Victimization Survey, the National Health Interview Survey, and the American Housing Survey, to name a few. A table breaking out FY 2015 estimated reimbursable obligations is shown below. Census leadership is taking a direct role in providing a formal structure to better serve the needs of our customers. We are aggressively implementing policies to achieve greater transparency and better communicate how the WCF serves our corporate needs, as recommended by both the Congress and GAO. The Census Bureau has developed a formal governance structure and put in place performance measures to quantify our progress. The WCF supports centralized enterprise-wide services, such as Information and Cyber Security, to both appropriated and reimbursable programs. We must constantly assess the security of all information systems that support the Census Bureau. This is essential to our core mission because our work depends on protecting respondent data. Other services include human capital support,
CEN-196
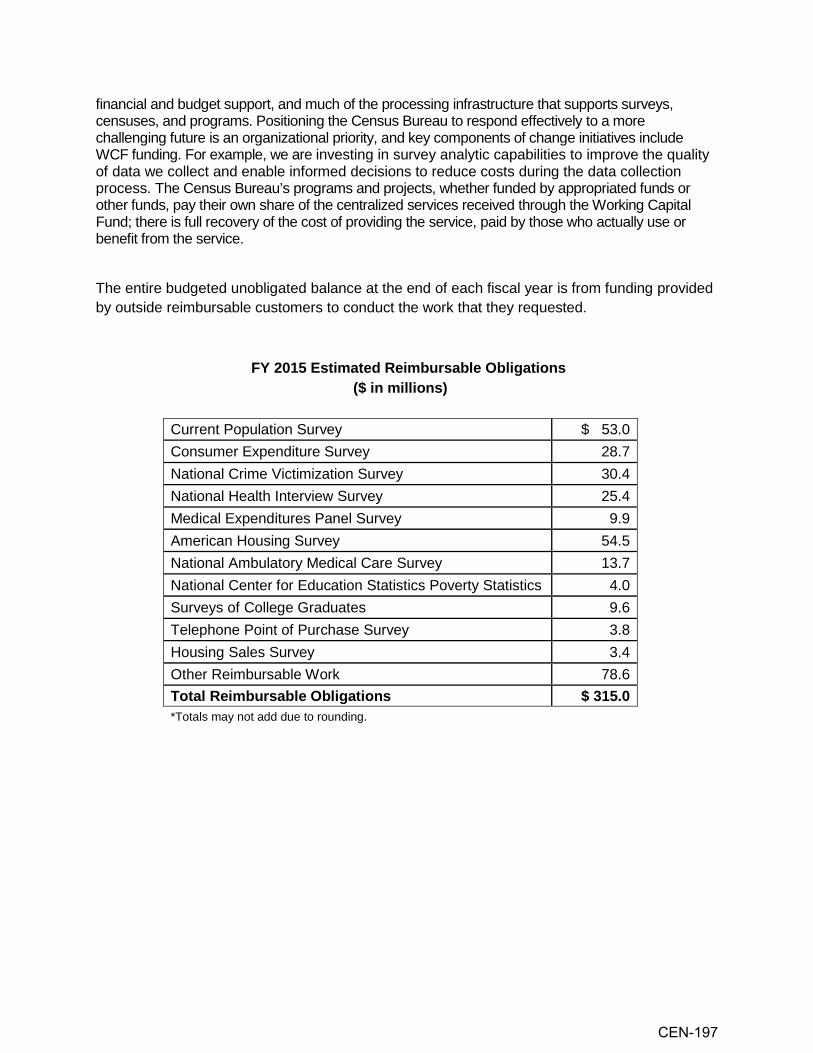
financial and budget support, and much of the processing infrastructure that supports surveys, censuses, and programs. Positioning the Census Bureau to respond effectively to a more challenging future is an organizational priority, and key components of change initiatives include WCF funding. For example, we are investing in survey analytic capabilities to improve the quality of data we collect and enable informed decisions to reduce costs during the data collection process. The Census Bureau’s programs and projects, whether funded by appropriated funds or other funds, pay their own share of the centralized services received through the Working Capital Fund; there is full recovery of the cost of providing the service, paid by those who actually use or benefit from the service.
The entire budgeted unobligated balance at the end of each fiscal year is from funding provided by outside reimbursable customers to conduct the work that they requested.
FY 2015 Estimated Reimbursable Obligations ($ in millions)
Current Population Survey $ 53.0 Consumer Expenditure Survey 28.7 National Crime Victimization Survey 30.4 National Health Interview Survey 25.4 Medical Expenditures Panel Survey 9.9 American Housing Survey 54.5 National Ambulatory Medical Care Survey 13.7 National Center for Education Statistics Poverty Statistics 4.0 Surveys of College Graduates 9.6 Telephone Point of Purchase Survey 3.8 Housing Sales Survey 3.4 Other Reimbursable Work 78.6 Total Reimbursable Obligations $ 315.0 *Totals may not add due to rounding.
CEN-197

THIS PAGE INTENTIONALLY LEFT BLANK
CEN-198
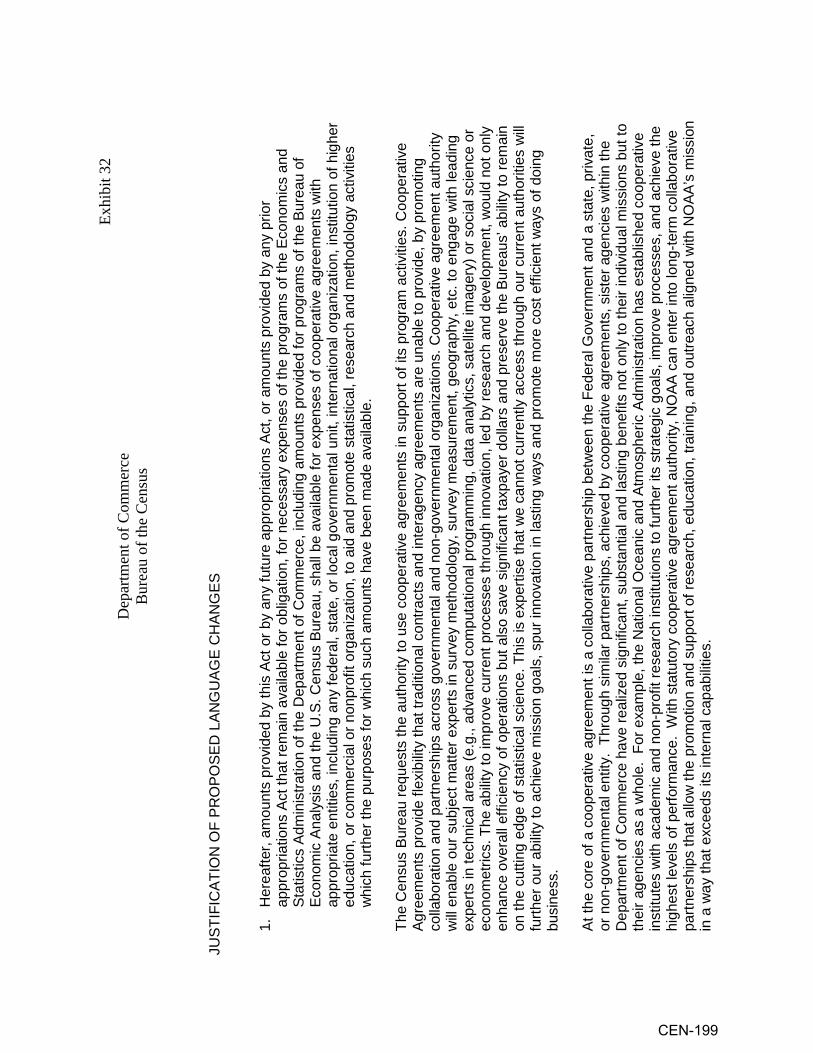
Ex
hibi
t 32
D
epar
tmen
t of C
omm
erce
Bur
eau
of th
e C
ensu
s
JU
STIF
ICAT
ION
OF
PRO
POSE
D L
ANG
UAG
E C
HAN
GES
1.
Her
eafte
r, am
ount
s pr
ovid
ed b
y th
is A
ct o
r by
any
futu
re a
ppro
pria
tions
Act
, or a
mou
nts
prov
ided
by
any
prio
r ap
prop
riatio
ns A
ct th
at re
mai
n av
aila
ble
for o
blig
atio
n, fo
r nec
essa
ry e
xpen
ses
of th
e pr
ogra
ms
of th
e Ec
onom
ics
and
Stat
istic
s Ad
min
istra
tion
of th
e D
epar
tmen
t of C
omm
erce
, inc
ludi
ng a
mou
nts
prov
ided
for p
rogr
ams
of th
e Bu
reau
of
Econ
omic
Ana
lysi
s an
d th
e U
.S. C
ensu
s Bu
reau
, sha
ll be
ava
ilabl
e fo
r exp
ense
s of
coo
pera
tive
agre
emen
ts w
ith
appr
opria
te e
ntiti
es, i
nclu
ding
any
fede
ral,
stat
e, o
r loc
al g
over
nmen
tal u
nit,
inte
rnat
iona
l org
aniz
atio
n, in
stitu
tion
of h
ighe
r ed
ucat
ion,
or c
omm
erci
al o
r non
prof
it or
gani
zatio
n, to
aid
and
pro
mot
e st
atis
tical
, res
earc
h an
d m
etho
dolo
gy a
ctiv
ities
w
hich
furth
er th
e pu
rpos
es fo
r whi
ch s
uch
amou
nts
have
bee
n m
ade
avai
labl
e.
Th
e C
ensu
s Bu
reau
requ
ests
the
auth
ority
to u
se c
oope
rativ
e ag
reem
ents
in s
uppo
rt of
its
prog
ram
act
iviti
es. C
oope
rativ
e Ag
reem
ents
pro
vide
flex
ibilit
y th
at tr
aditi
onal
con
tract
s an
d in
tera
genc
y ag
reem
ents
are
una
ble
to p
rovi
de, b
y pr
omot
ing
colla
bora
tion
and
partn
ersh
ips
acro
ss g
over
nmen
tal a
nd n
on-g
over
nmen
tal o
rgan
izat
ions
. Coo
pera
tive
agre
emen
t aut
horit
y w
ill en
able
our
sub
ject
mat
ter e
xper
ts in
sur
vey
met
hodo
logy
, sur
vey
mea
sure
men
t, ge
ogra
phy,
etc
. to
enga
ge w
ith le
adin
g ex
perts
in te
chni
cal a
reas
(e.g
., ad
vanc
ed c
ompu
tatio
nal p
rogr
amm
ing,
dat
a an
alyt
ics,
sat
ellit
e im
ager
y) o
r soc
ial s
cien
ce o
r ec
onom
etric
s. T
he a
bilit
y to
impr
ove
curr
ent p
roce
sses
thro
ugh
inno
vatio
n, le
d by
rese
arch
and
dev
elop
men
t, w
ould
not
onl
y en
hanc
e ov
eral
l effi
cien
cy o
f ope
ratio
ns b
ut a
lso
save
sig
nific
ant t
axpa
yer d
olla
rs a
nd p
rese
rve
the
Bure
aus’
abi
lity
to re
mai
n on
the
cutti
ng e
dge
of s
tatis
tical
sci
ence
. Thi
s is
exp
ertis
e th
at w
e ca
nnot
cur
rent
ly a
cces
s th
roug
h ou
r cur
rent
aut
horit
ies
will
furth
er o
ur a
bilit
y to
ach
ieve
mis
sion
goa
ls, s
pur i
nnov
atio
n in
last
ing
way
s an
d pr
omot
e m
ore
cost
effi
cien
t way
s of
doi
ng
busi
ness
.
At th
e co
re o
f a c
oope
rativ
e ag
reem
ent i
s a
colla
bora
tive
partn
ersh
ip b
etw
een
the
Fede
ral G
over
nmen
t and
a s
tate
, priv
ate,
or
non
-gov
ernm
enta
l ent
ity.
Thro
ugh
sim
ilar p
artn
ersh
ips,
ach
ieve
d by
coo
pera
tive
agre
emen
ts, s
iste
r age
ncie
s w
ithin
the
Dep
artm
ent o
f Com
mer
ce h
ave
real
ized
sig
nific
ant,
subs
tant
ial a
nd la
stin
g be
nefit
s no
t onl
y to
thei
r ind
ivid
ual m
issi
ons
but t
o th
eir a
genc
ies
as a
who
le.
For e
xam
ple,
the
Nat
iona
l Oce
anic
and
Atm
osph
eric
Adm
inis
tratio
n ha
s es
tabl
ishe
d co
oper
ativ
e in
stitu
tes
with
aca
dem
ic a
nd n
on-p
rofit
rese
arch
inst
itutio
ns to
furth
er it
s st
rate
gic
goal
s, im
prov
e pr
oces
ses,
and
ach
ieve
the
high
est l
evel
s of
per
form
ance
. W
ith s
tatu
tory
coo
pera
tive
agre
emen
t aut
horit
y, N
OAA
can
ent
er in
to lo
ng-te
rm c
olla
bora
tive
partn
ersh
ips
that
allo
w th
e pr
omot
ion
and
supp
ort o
f res
earc
h, e
duca
tion,
trai
ning
, and
out
reac
h al
igne
d w
ith N
OAA
’s m
issi
on
in a
way
that
exc
eeds
its
inte
rnal
cap
abilit
ies.
CEN-199
The
bene
fits
deriv
ed fr
om N
OAA
’s c
oope
rativ
e ag
reem
ents
wou
ld b
e si
mila
rly a
pplic
able
to th
e C
ensu
s Bu
reau
’s m
issi
ons
and
capa
bilit
ies.
Spe
cific
ally
, the
re a
re tw
o ty
pes
of c
oope
rativ
e ag
reem
ents
that
wou
ld b
e of
imm
edia
te a
nd b
enef
icia
l use
to
the
Cen
sus
Bure
aus’
cur
rent
ope
ratio
ns.
Firs
t, th
ere
are
Res
earc
h Su
ppor
t Agr
eem
ents
(RSA
s) w
hich
are
agr
eem
ents
be
twee
n an
age
ncy
and
stat
e co
oper
ativ
e in
stitu
tions
, col
lege
s, o
r uni
vers
ities
to c
arry
out
sta
tistic
al re
sear
ch, e
xten
sion
, or
teac
hing
act
iviti
es o
f mut
ual i
nter
est b
etw
een
them
. Se
cond
, the
re a
re S
peci
fic C
oope
rativ
e Ag
reem
ents
(SC
As) w
hich
are
ag
reem
ents
bet
wee
n an
age
ncy
and
anot
her p
arty
that
des
crib
e in
det
ail a
join
tly p
lann
ed a
nd e
xecu
ted
rese
arch
pro
gram
or
proj
ect o
f mut
ual i
nter
est b
etw
een
them
whe
re b
oth
parti
es c
ontri
bute
reso
urce
s. B
elow
are
two
exam
ples
of i
mpo
rtant
and
va
luab
le o
pera
tions
at C
ensu
s Bu
reau
that
cou
ld b
enef
it su
bsta
ntia
lly fr
om th
e ab
ility
to e
nter
into
thes
e ty
pes
of c
oope
rativ
e ag
reem
ents
. Su
ppor
t for
Cen
sus
Bure
au R
esea
rch
Obj
ectiv
es. R
esea
rch
Supp
ort A
gree
men
ts (R
SA) w
ould
ena
ble
Cen
sus
to in
vest
in
educ
atio
n, tr
aini
ng, o
utre
ach
and
rese
arch
to d
rive
inno
vatio
n an
d pr
oduc
e st
atis
tics
need
ed fo
r pro
gram
eva
luat
ion
and
polic
y an
alys
is.
In a
n er
a of
redu
ced
budg
ets
and
decl
inin
g re
spon
dent
coo
pera
tion,
the
Bure
au n
eeds
to e
xplo
re n
ew
met
hods
to p
rovi
de a
ccur
ate
and
timel
y st
atis
tics.
Res
earc
h br
idgi
ng m
ultip
le d
isci
plin
es is
ess
entia
l: m
oder
n st
atis
tics
requ
ires
skills
from
com
pute
r sci
ence
, dat
a sc
ienc
e, e
cono
mic
s, s
ocio
logy
, dem
ogra
phy,
as
wel
l as
stat
istic
s. T
o ac
cess
ex
perts
acr
oss
thes
e fie
lds,
Cen
sus
need
s to
eng
age
acad
emic
s. R
SAs
allo
w th
e ac
quis
ition
of g
oods
and
ser
vice
s,
incl
udin
g pe
rson
al s
ervi
ces,
whi
ch p
rovi
de m
utua
l ben
efit
to th
e pa
rties
. C
oope
rativ
e ag
reem
ent a
utho
rity
wou
ld p
erm
it en
gage
men
t with
the
facu
lty a
nd re
sour
ces
at a
uni
vers
ity in
way
s, m
eetin
g m
issi
on n
eeds
whe
re o
ur li
mite
d co
ntra
ctua
l ve
hicl
es fa
il.
The
2020
Cen
sus
Res
earc
h an
d Te
stin
g Pr
ogra
m is
exp
lorin
g th
e us
e of
adm
inis
trativ
e re
cord
s da
ta to
redu
ce c
osts
and
re
spon
dent
bur
den
whi
le m
aint
aini
ng d
ata
qual
ity.
Fede
ral a
dmin
istra
tive
data
are
obt
aine
d fro
m m
any
agen
cies
incl
udin
g th
ose
in th
e D
epar
tmen
ts o
f the
Tre
asur
y, H
ousi
ng a
nd U
rban
Dev
elop
men
t, an
d H
ealth
and
Hum
an S
ervi
ces.
Cen
sus
is
purs
uing
dat
a fro
m S
tate
pro
gram
age
ncie
s, e
spec
ially
for f
ood
secu
rity
and
wel
fare
pro
gram
s. O
ther
fede
ral a
genc
ies
and
rese
arch
con
sorti
a ar
e al
so in
tere
sted
in s
ocia
l and
eco
nom
ic m
easu
rem
ent i
nvol
ving
thes
e da
ta.
Coo
pera
tive
Agre
emen
t Au
thor
ity w
ould
ena
ble
Cen
sus
to e
ngag
e w
ith H
ealth
and
Hum
an S
ervi
ces,
leve
ragi
ng C
ensu
s’ re
cord
link
age
infra
stru
ctur
e an
d pr
ogra
m-s
peci
fic e
xper
tise
from
HH
S. A
Spe
cific
Coo
pera
tive
Agre
emen
t wou
ld d
efin
e a
join
tly p
lann
ed a
nd e
xecu
ted
rese
arch
pro
gram
or p
roje
ct o
f mut
ual i
nter
est.
In
add
ition
, we
belie
ve th
at th
e be
st o
ptio
n fo
r the
202
0 C
ensu
s Pr
ogra
m to
aut
hent
icat
e re
spon
dent
s w
ho c
anno
t pro
vide
an
iden
tific
atio
n nu
mbe
r cou
ld b
e so
lved
by
usin
g th
e N
IST
Nat
iona
l Stra
tegy
for T
rust
ed Id
entit
ies
in C
yber
spac
e (N
STIC
) au
then
ticat
ion.
Cen
sus
is c
urre
ntly
con
stra
ined
from
full
test
ing
and
parti
cipa
tion
in th
e N
STIC
aut
hent
icat
ion
wor
k be
caus
e w
e ca
nnot
ent
er a
coo
pera
tive
agre
emen
t with
the
set o
f fed
eral
and
priv
ate
entit
ies
invo
lved
.
CEN-200

Topo
logi
cally
Inte
grat
ed G
eogr
aphi
c En
codi
ng a
nd R
efer
enci
ng (T
IGER
) Sys
tem
. The
Cen
sus
Bure
au c
reat
ed th
e TI
GER
sy
stem
, with
ass
ista
nce
from
the
Uni
ted
Stat
es G
eolo
gica
l Sur
vey,
in o
rder
to h
ave
a na
viga
ble
map
of t
he U
nite
d St
ates
. C
ensu
s Bu
reau
pro
gram
ope
rato
rs a
re c
onsi
sten
tly e
valu
atin
g an
d im
prov
ing
thei
r pro
cess
es to
ens
ure
its a
ccur
acy
and
effic
ienc
y. T
here
are
a n
umbe
r of p
oten
tial o
ppor
tuni
ties
to im
prov
e TI
GER
with
the
assi
stan
ce o
f priv
ate
com
pani
es w
ith
rele
vant
geo
grap
hic
info
rmat
ion
syst
ems
expe
rtise
, but
it is
diff
icul
t to
ente
r int
o an
y ki
nd o
f con
tract
ual r
elat
ions
hip
with
them
gi
ven
our g
oals
.
Trad
ition
al F
eder
al A
cqui
sitio
n R
egul
atio
n (F
AR)-t
ype
proc
urem
ent c
ontra
cts
requ
ire a
n ex
chan
ge o
f val
ue fo
r goo
ds o
r se
rvic
es.
Inhe
rent
in th
is a
ppro
ach,
the
cont
ract
or m
ust m
eet a
requ
irem
ent o
r pro
duce
a d
eliv
erab
le in
exc
hang
e fo
r pa
ymen
t. H
owev
er, i
n th
is c
ase,
the
Bure
au a
nd th
e pr
ivat
e co
mpa
ny w
ould
sha
re a
mut
ual o
bjec
tive
of im
prov
ing
thei
r in
tern
al p
roce
sses
and
ulti
mat
ely
thei
r effi
cien
cy a
nd d
ata
qual
ity.
In d
oing
so,
it w
ould
be
mor
e be
nefic
ial t
o es
tabl
ish
a fra
mew
ork
for e
ngag
emen
t, in
the
form
of a
coo
pera
tive
agre
emen
t, ra
ther
than
atte
mpt
to fo
rce
the
term
s of
a tr
aditi
onal
fe
dera
l con
tract
ont
o th
e re
latio
nshi
p.
In c
oncl
usio
n, th
ere
are
man
y ty
pes
of c
olla
bora
tive
rela
tions
hips
that
are
not
sup
porte
d by
con
tract
s de
rived
from
the
FAR
. N
ot e
very
act
ivity
that
the
Bure
au c
ondu
cts
cent
ers
on e
xcha
ngin
g ap
prop
riate
d m
oney
for s
peci
fic g
oods
and
ser
vice
s.
Thes
e ot
her a
ctiv
ities
stil
l ser
ve a
n im
porta
nt a
nd c
ontin
uing
nee
d to
fulfi
ll th
e du
ties
of th
e ag
enci
es a
nd s
erve
the
publ
ic a
t la
rge.
For
exa
mpl
e, e
nsur
ing
the
cont
inui
ty o
f effe
ctiv
e op
erat
ions
, eng
ende
ring
the
skills
nec
essa
ry fo
r the
nex
t gen
erat
ion
of th
e w
orkf
orce
, and
dev
elop
ing
new
, bet
ter w
ays
to a
chie
ve th
e m
issi
ons
prov
ide
valu
e th
at is
ofte
n di
fficu
lt to
qua
ntify
as
spec
ific
deliv
erab
les.
The
lack
of c
oope
rativ
e ag
reem
ent a
utho
rity
mea
ns th
at th
ere
is a
pot
entia
l wel
lspr
ing
of u
ntap
ped
and
unde
rutil
ized
ben
efits
that
may
be
deriv
ed b
y sp
urrin
g in
nova
tion
thro
ugh
rese
arch
and
dev
elop
men
t and
coo
pera
tive
partn
ersh
ips.
CEN-201

Dep
artm
ent o
f Com
mer
ceEx
hibi
t 34
U.S
. Cen
sus
Bure
auC
ON
SULT
ING
AN
D R
ELAT
ED S
ERVI
CES
(Dire
ct o
blig
atio
ns in
thou
sand
s)
2013
Ac
tual
2014
Enac
ted
2015
Es
timat
e
Man
agem
ent a
nd p
rofe
ssio
nal s
uppo
rt sv
cs.
$36,
628
$39,
578
$65,
908
Stud
ies,
ana
lysi
s an
d ev
alua
tions
23,1
8713
,666
13,8
30En
gine
erin
g an
d te
chni
cal s
ervi
ces
25,2
322,
111
8,85
3
TOTA
L$8
5,04
7$5
5,35
5$8
8,59
1
Not
es:
The
prin
cipa
l use
s of
adv
isor
y an
d as
sist
ance
ser
vice
s ar
e to
mak
e th
e da
ta c
olle
cted
by
the
Cen
sus
Bure
au m
ore
usef
ul to
the
user
com
mun
ity. I
nclu
des
Man
dato
ry fu
ndin
g.
CEN-202

Exh
ibit
35
FY 2
013
Act
ual
FY 2
014
Ena
cted
FY 2
015
Est
imat
e
Per
iodi
cals
$2,3
70$2
,204
$2,1
33P
amph
lets
$1,7
82$1
,657
$1,6
03A
udio
visu
als
$674
$629
$671
TOTA
L$4
,826
$4,4
90$4
,407
Per
iodi
cals
: In
add
ition
to th
e de
cenn
ial C
ensu
s of
Pop
ulat
ion
and
Hou
sing
(con
duct
ed e
very
10
year
s in
yea
rs e
ndin
g in
zer
o), a
nd
the
Eco
nom
ic C
ensu
s (c
ondu
cted
eve
ry 5
yea
rs in
yea
rs e
ndin
g in
2 a
nd 7
), an
d th
e A
mer
ican
Com
mun
ity S
urve
y (a
nnua
l), th
e U
S
Cen
sus
Bur
eau,
on
aver
age,
con
duct
s 15
0 su
rvey
s an
nual
ly th
at m
ay u
ltim
atel
y re
sult
in 1
,000
repo
rts. T
hese
repo
rts a
re d
istri
bute
d in
pr
int a
nd a
vaila
ble
onlin
e to
dat
a us
ers
of a
ll ty
pes,
rang
ing
from
oth
er g
over
nmen
t age
ncie
s to
bus
ines
ses,
soc
ial s
ervi
ce p
rovi
ders
, re
sear
cher
s, li
brar
ies,
and
oth
ers.
Man
y of
thes
e re
ports
are
recu
rring
and
par
ts o
f a s
erie
s of
repo
rts is
sued
on
a re
gula
r bas
is.
Aud
iovi
sual
s: T
his
cate
gory
incl
udes
bot
h in
-hou
se a
nd c
ontra
cted
cos
ts fo
r prin
ting
artw
ork
and
phot
ogra
phic
slid
es a
nd
trans
pare
ncie
s fo
r pre
sent
atio
ns. T
his
cate
gory
als
o in
clud
es th
e pr
oduc
tion
of p
rom
otio
nal a
nd m
edia
-use
vid
eo, a
dai
ly ra
dio
prog
ram
, pos
ters
and
gra
phic
s, p
hoto
grap
hy, a
nd o
ther
mul
timed
ia p
rodu
cts
onlin
e an
d on
dis
c. It
als
o in
clud
es a
dver
tisin
g an
d ot
her
prom
otio
nal a
ctiv
ities
for C
ensu
s B
urea
u su
rvey
s an
d pr
ogra
m a
reas
.
Pam
phle
ts:
In a
n ef
fort
to p
rom
ote
the
two
maj
or c
ensu
ses
note
d ab
ove
and
the
Am
eric
an C
omm
unity
Sur
vey,
the
Cen
sus
Bur
eau
prod
uces
a v
arie
ty o
f pro
mot
iona
l mat
eria
ls d
esig
ned
to g
ener
ate
inte
rest
in h
ighe
r res
pons
e ra
tes
to th
ese
effo
rts. A
ll th
e va
rious
fo
rms,
boo
klet
s an
d tra
inin
g m
ater
ials
nee
d to
con
duct
the
dece
nnia
l cen
sus
are
need
ed in
hug
e qu
antit
ies.
The
age
ncy
also
pro
duce
s ex
tern
ally
-focu
sed
mat
eria
ls re
late
d to
rein
forc
ing
its m
issi
on a
nd g
oals
of p
rovi
ding
val
uabl
e, a
ccur
ate,
qua
lity
data
; rec
ruitm
ent o
f new
st
aff;
polic
ies
(suc
h as
resp
ondi
ng to
FO
IA re
ques
ts o
r adv
ice
on h
ow re
porte
rs c
an w
ork
mor
e ef
fect
ivel
y w
ith th
e C
ensu
s B
urea
u) a
nd
othe
r iss
ues
and
topi
cs o
f int
eres
t. Th
e C
ensu
s B
urea
u al
so p
rints
and
pub
lish
for t
he p
ublic
, Com
plet
e C
ount
Com
mitt
ee G
uide
s fo
r Tr
ibal
Lea
ders
, loc
al le
ader
s, a
nd n
atio
nal l
eade
rs.
Dep
artm
ent o
f Com
mer
ceU
. S. C
ensu
s B
urea
u
PE
RIO
DIC
ALS
, PA
MP
HLE
TS, A
ND
AU
DIO
VIS
UA
L P
RO
DU
CTS
(Obl
igat
ions
in th
ousa
nds)
CEN-203

Exh
ibit
36D
epar
tmen
t of C
omm
erce
U. S
. Cen
sus
Bur
eau
AV
ER
AG
E G
RA
DE
AN
D S
ALA
RY
FY 2
013
Act
ual
FY 2
014
Ena
cted
FY 2
015
Est
imat
e
Dire
ct:
A
vera
ge E
S S
alar
y .
. . .
. . .
. . .
. . .
. . .
. . .
. . .
. $1
63,5
35$1
63,5
35$1
65,1
70
Ave
rage
GS
/GM
Gra
de .
. . .
. . .
. . .
. . .
. . .
. . .
. 11
1111
A
vera
ge G
S/G
M S
alar
y . .
. . .
. . .
. . .
. . .
. . .
. . .
$8
4,43
5$8
4,43
5$8
5,27
9
CEN-204