Embed Size (px)
Citation preview

AD-A257 905
US Army Corpsof Engineers DTICToxic and Hazardous • -LECTEM ate rials A ge ncy OV I 3 192 .-
Report No. CETHA-TS CR-91N031
FINAL REPORT
Removal of DNT fromWastewaters atRadford Army Ammunition Plant
Marcii 1991Corract No. DAAA15-88-D-0001Task Order No. 0002
Prepared by:
IT Environmental Programs, Inc.(formerly PEI Associates, Inc.)11499 Chester RoadCincinnati, OH 45246
Prepared for:
U.S. Army Toxic and Hazardous Materials AgencyAberdeen Proving Ground, Maryland 21010-5423
Disiribution Unlimited 09-29450 :I H.AMA.I 11 . 4il I 9II-
.U•- 1 , /. 1

'jUeW8S'~Ie8PE 10 sesodindjol p. -o aq jou Aew liodej s~tnl slonpoid lei:)ewwjoo tJ~fls io esn Gqi 10 IIAOidd&jo juE)u. -4siopue ezI-oi ue ainnisuocD lou r.eop liodej s!L41 ui sowpu epeii jo esrn eqi
uoijeIuew.noop jeoao Ac poleu*6isep os sselun 'uoisioap jo -Az3od 'uo~ijsod /wiV otji ;o luewliede] eivipo uB sepeniisuo:3 eq iou plnoL~s lijodej s!L41 ui pau!iruoo sbuipuilj o/pue 'suoi~ido 'SMeii eL;jj

unclassif iedSECURIIY CLASSIFICAIISN or THIS PAC:E
REPORT DOCUMENTATION PAGE FOMB No 070-0 18
I& aREPORT SECURITY CLASSIFICATION lb RESTRICTIVE MARKINGS
2&. SECURITY CLASSIFICATION AUTHORITY 3. 0ISTRIBUTION/AVAJI.ABIUiTY OF REPORT
2b OECLASIFICATIONICKWNGRADING SCHZDULC Unlimited
4. PERFOPMING ORGANI2ATION REPORT NUMBER(S) S. MONITORING ORGANIZATION REPORT NUMBER(S)
Reernc 3769-2-A CETR-A-TS-CR--9103 1
6.NAME OF PERFORMING ORGANIZATION 6b. OFFICE SYMBOL 7a. NAME OF MONITORING OPGANIZATION
IT niofetl rgas n (if appi~cable) U.S. Armty Corps of EngineersI ITEnvronenta Prgras, ic. ____________Toxic an'd Hazardous Material-, zec6ý.. ADDPLSS (Crty, State. and ZIP Code) 7b AIDDRESS(Ciry, State, n ZIP Code)
1 11499 Chester Road Attn; CETHA-TS-i)Cincinvati, OHý 45246 Aberdeen Proving; Ground, ýflD 21010-5401
Ba. NAME OF FUNDING / SPONSORiNG j8t OFFICE SYMBOL 9 PROCUREMENT INSTRUMENT IDENTIFICATION NUMBER
U.S.' Arumy Corpso -gITp~~h atra O.i~ -Sh0(T THAM ,s_______ of ____________ Task Order N'0. 00'0?
F8c,-DRS (iySttaa21Code 10 SOURCE OF FUNDING NUMB6FFS
At 1,n CETHAL-TS-1) PP0:ROGAV PROJLCT 7ASK1 1 WOK UNIT
Abe rden 1Prvo. jo Crou6 IN)2110-54 1 M CN,.ET t.0 NO NO ACCcSSION NO
F TiTL (; ndude Secuflt) Clas~s~<a n
Reiui vi of Lt- row ,,ii w_.cr at Kad I rd ,Arflv. A-_77unl t JO 1
_1 ESNLAUTHOR($)J.lieffinger and C. Jak-e of Hurcules Aerospace Com-pany, Ordanice Group
i a. TYPE OF REPORT 13b. TINIE COVERED 71 D4-0ATE OF REPORT (Year, Month, Day) jIs. PAGE COUNT
Fina I ý OL31u1 I1991, March 31 25I6. SUPPLEMENTARY NOTArhON
This report wgas prepared 11' litrculues Aerospace Copn'onY, Ordnancc Groupý, K/J&\ under a
Sut~co:itroe t t o IT T:nv : r n 7 r. t, ,ta ProcIr atr ,nc.
11.COSATI CODES IE SU8jE,-T TERMS (Conritnue on re~'erse it necessary ana tCenttfy by blodi numberd
R GROUP SUB-GROUI'1
19. ABSTRACT (Co-Itinue on reterse if necezary and identify by block numbner)
2,4-[DinJtrotoluc-no (1)PT) , a cIhelriC.;I used ~in the mrui:IfLaCtllrt ol `;i7Ijv-bn5;e propellants, i.s
a sisspu c ted Carc i o~lcuj aio: h.1s al so been,, linlked to ieal t dI)e~c.',' :..ornec stud ieu . In
pr`Ctessllý ng ropel Ia:sts1 containing this in~gredient at RidE ord Army Avtriun itio P~Tlan' RA'
ký3d'ord, %A), w~istewatur i!. ganrerated containing variousb Con~centrat ions of I)NTi. This
watwtrrequirecý abc!telr,.?lnt pri~or to dlischazrge int-o thu New River. At prese.nt , a central'ioigicl wsteaturtretmet pant(BWTP) is operated at R-Ali for treating wasteaes
Though the Virginia State Water 'ýo cin Fo-rd h:not cstabli~hc-ci limits on DNT dis~harjgo.Imonitoring is required; WD'i content is discharged. was7tvwaters, must be reportrd semi-monthly.
Addit ionally , in th, March 29, 1990 Fedeial Regiuter , 2 ,4-D')N] Io isted as a constistuenlt
hazardous organic chemiscal I
project Was: tafsked Wi~th thle IcllowillF.: perforiioI:cc oi a i ter:II lre review to iduntitvItiLchIIlol leb fl~~laieIor bot h LUE.I de:S tuc t ion in) WaStewaters aii UNT remIoval melthod SCn.
26~ 0 STRlt.UTIQNýiAVAI! AT. L~llY ARSITRJ.l.T 121 ABSTRACT 5L(:uRI1Y CLASSIFI(ATiOn rq~t.
DD For!T 1473. JUN 86 '':ocr SI-'1-I, (f'2I ('10t.,t 01 1i 1 t~

Ulnc loss: id•
Iv Ccnri d
based on the literature review, selection of the most promising tez-hnologies forevaluation in the laboratory to determine their removal efficiency; and bench-scaleevaluations of one or more optimum technologies to quantify DNT destruction/removalefiiciency and to select the best available and most cost effective technology forapplication at RAAP. Additionally, research was to b? performed to evaluatebiuaccumulation and determine if DNT was toxic to microorganisms utilized in wastewatt'trtcatn:ehtI.
it was concluded that GAC treatment should be use-i as a means to achieve DNT discharg.goals in the short-term. This technology is developed, reliable, and readily availabie.Both UV/ozonation and biological degradation are DNT abatement tcchnologies that warrantfirther study. Pilot-scale LUV/ozonation studies are recom-mended to establish optina]conditions and assess economics. Additionally further research on biological degradat .,';:
oi DNI is needed to identify biotransfornatior, products, to furtl.(r develop thc tch,,,'.'K v
arnd therebv reduce risks of implenentation.
I

Il
TABLE OF CONTENTS
I Page
i Introduction I
Characterization I
I Process Flow Sources 2Wastewater Collection System 3Biological Waste-ater Treatment Plant 4
I Literature Review 6
g Technological Review 6
Biotransformation or Biodegradation 6Activated Carbon Treatment 7Incineration 8Oxidation 9Reduction 10Gerteral Wastewater Treatment 10
J Health and Safety/ToxiLity 12
Laboratory Evaluations 12
Biological Studies 12
I Toxicity Studies 12Bioaccumulation 14Biodegradation Studies 15
I UV, Ozone, H02z, UV/H 202 , UV/Ozone 18
Granular Activated Carbon Isotherms 19I Optimization of Adsorption Time 19
Isotherms 19
Bench-Scale Evaluations 20
Biological 20UV/Ozone 22
GAC Column Study 26
Economics 28
BiologicalIu/0,tone Z9GAC 29
II

I
I Page
I Hazards Assessment 30
g Conclusions 30
Reco.•inendati ons 31
References 33
Terms 3f Abbreviations, Acronyms, and Symbols 37
STables 39
Figures 67
Appendixes
A Test Plan - DNT Treatment Technologies 199B Statistical Analysis of the Analysis Method 219C UV/Ozone Test Plan Data 227D Preliminary Hazards Assessment 233
'JT
I
IAn
ip .
I

I
TABLES
Page
1. Water dry wastewater characterization data 39
2. Additional water dry wastewatercharacterization data 40
3. Characterization of additional DNT 42wastewater sources
4. Characterization of wastewater collection 43system and BWTP
5. Relationship of DNT release to the wastewatercollection system with respect to one WDtank (40,000 Ib) 44
6. DNT analyses on daily BWTP samples 45
7. COD analyses on daily BWTP samples 46
8. Statistics for RAAP BWTP effluent 47
9. DNT biomass/bioreactor study 49
¶ 10. Biodegradation test no. 1 50
11. Peak analysis of biodegradation test no. 1 51
12. Biodegradation test no. 2 52
13. Biodegradation test no. 3 53
14. Laboratory results for UV, ozone, hydrogen 54
peroxide experiments
15. Optimization of time 55
16. Adsorption isotherm for water dry water 55
17. Adsorption isotherm for solvent-fortifiedwater dry water 56
18. Adsorption isotherm for plant effluent withDNT 56
19. Test matrix for DNT degradation byUV/ozonation 57
iii
I

III Page
20. Operating conditions for activated carbonstudies 58
21. GAC column prior to breakthrough 59
22. GAC column after breakthrough 62
I
I
I i
I

FIGURES
Page
I. Production of propellant containing DNT 67
2. Layout of SR and WD buildings 68
3. Bioplant 69
4. HPLC chromatogram of raw influentto the equalization basin 70
5. HPLC chromatogram of raw influentto the new RBCrs 71
6. HPLC chromatogram of influentto old RBC's 72
7. HPLC chromatograrn of effluentfrom oid RBC's 73
a. HFLC chromatogram uf clar-ifi',re efflu;r,,, 74
9. DNT in bioplant effluent 75
10. Respirometer toxicity data for DNT 76
¶ 11. Chromatogram of respirometer sample after140 h which originally contained 0 mg/L DNT 77
12. Chromatogram of respirometer sample after140 h which originally contained 50 mg/L DNT 78
13. Chromatogram of respirometer sample after140 h which originally contained 100 mg/L DNT 79
14. Chromatogram of respirometer sample after140 h which originally contained 150 mg/L DNT 80
15. Chromatoqram of respirometer sample after140 h which originally contained 200 mg/L DNT 81
16. Chromatogram of respirometer sample after140 h which originally contained 250 mg/L DNT 82
17. Chromatogram of respirometer sample originallycontaining 100% seed 83
18. Respirometer toxicity data for ONT 84
VI

IPage
19. Respirometer toxicity data for ONT 85
20. Respirometer toxicity data for DNT 86
21. Respirometer toxicity data for DNT 87
22. Chromatogram of respirometcr toxicity test No. 5with initial DNT concentration of 0 mg/L 88
923. Chromatogram of respirometer toxicity test No. 5with initial ONT concentration of 50 mg/L 89
24. Chromatogram of respirometer toxicity test No. 5with initial DNT concentration of 100 mg/L 90
25. Chromatogram, of respirometer toxicity test No. 5with initial DNT concentration of 150 mg/L 91
26. Chromatogram of respirometer toxicity test No. 5
with initial DNT concentration of 200 mg/L 92
27. Chromn'togram of respirometer toxicity test No. 5with initial DNT concentration of 250 mg/L 93
28. Chromatogram of respirometer toxicity test No. Swith initial ONT concentration of 0 mg/L (100% seed) 94
29. Blank biornass/bioreactor chromatogram on day 0 95
30. DNT supplemented biomass/bioreactor chromatogramon day 0 96
31. Blank biomass/bioreactor chromatogram on day 1 97
32. DNT supplemented biomass/bioreactor chromatogramon day 1 98
33. Blank biomass/bioreactor chromatogram on day 4 99
34. DNT supplemented biomass/bioreactor chromatogramon day 4 100
35. Blank biomass/bioreactor chromatogram on day 6 101
36. DNT supplemented biomass/bioreactor chromatogramon day 6 102
1 37. Blank biomass/bioreactor chromatugram on day 7 103
I vii,

I Page
S38. DNT supplemented biomass/bioreactor chromatogramon day 7 104
S39. Blank biomass/bioreactor chromatogram on day 8 105
40. DNT supplemented biomass/bioreactor chromatogramIon day 6 106
41. Blank biomass/bioreactor chromatogram on day 11 107
142. DNT supplemented biomass/bioreactor chromatogramon day 11 103
43. Blank biomass/io~eactor chromatogram on day 12 109
44. DNT supplemented biomass/bioreactor chromatog;'amon day 12 110
45. Blank biomass,/bioreactor chromatogram on day 13 111
46. DNT supplemented biomass/bioreactor chromatogramon day 13 11?
47. DNT supplemented b ~orass/bioreactor chromatogramon day 14 113
48. ONT supplemented biomass/bioreactor chromatogramon day 14 114
49. Blank biomass/bioreactor chromatogram on day 15 1)5
50. DNT supplemented biomass/bioreactor chromatogramon day 15 116
51. Biodegradation chromatogram of seed at 0 h 117
52. Biodegradation chromatogram of initial nutrientwater at 0 h 118
53. Biodegradation chromatogram of reactionvessel 1 at 23 h 119
54. Biodegradation chromatogram of reactionSvessel 2 at 77 h 120
55. Biodegradation chromatogram of reactionvessel 3 at 95 h 121
I vii

,PageI
56. Biodegradation chromatogram of reactionvessel 4 at 119 h 122
57. Biodegradation chromatogram of reactionvessel 5 at 144 h 123
58. Biodegradation chromatogram of DNT blankat 168 h 124
59. Biodegradation chromatogram of reactionvessel I at 168 h 125
60. Biodegradation chromatogram of reactionvessel 2 at 162 h 126
61. Biodegradation chromatogram of reactionvessel 3 at 168 h 127
62. Biodegradation chromatogram of reactionvessel 4 at .68 h 128
63. Biodegradation chromatogram of reactionvessel 5 at 168 h 129
64. Biodegradation chromatogram of reactionvessel 6 at 168 h 130
65. Biodegradation chromatogram of reactionvessel I at 22 h 131
66. Biodegradation chromatogram of reactionvessel 2 at 94 h 132
67. Biodegradation chromatogram of reactionvessel 3 at 118 h 133
68. Biodegradation chromatogram of reactionvessel 4 at 142 h 134
69. Biodegradation chromatogram of reactionvessel 5 at 166 h 13.
70. Biodegradation chromatogram of reactionvessel 6 at 190 h 136
71. Biodegradation chromatogram of nutrientwater at 264 h 137
viii
-

f|
Page
72. Biodegradation chromatogram of reactionvessel I at 264 h 138
73. Biodegradation chromatogram of reactionvessel 2 at 264 h 139
74. Biodegradation chromatograin of reactionvessel 3 at 264 h 140
75. Biodegradation chromatogram of reactionvessel 4 at 264 h 141
76. Biodegradation chromatogram of reactionvessel 5 at 264 h 142
77. Biodegradation chromatogram of reactionvessel 6 at 264 h 143
78. Biodegradation chromatogram of reactionvessel 7 at 264 h 144
79. Biodegradation chromatogram of seed at 0 h 145
80. Biodegradation chromatogram of nutrient waterat 0 h 146
81. Biodegradation chromatogram of reactionvessel I at 24 h 147
82. Biodegradation chromatogram of reactionvessel 2 at 48 h 148
83. Biodegradation chromatogram of reactionvessel 4 at 170 h 149
84. Biodegradation chromatogram of reactionvessel 5 at 216 h 150
85. Biodegradation chromatograra of reactionvessel 6 at 264 h 151
86. Biodegradation chromatogram of seed at 337 h 152
87. Biodegradation chromatogram of nutrient waterat 337 h 153
88. Biodegrzdation chromatogram of reactionvessel 1 at 337 h 154
ix

IPage
89. Biodegradation chromatogram of reactionvessel 2 at 337 h 155
I 90. Biodegradation chromatogram of reactionvessel 3 at 337 h 156
91. Biodegradation chromatogram of reactionvessel 4 at 337 h 157
92. Biodegradation chromatogram of reactionvessel 5 at 337 h 158
93. Biodegradation chromatogram of reactionvessel 6 at 337 h 159
94. Biodegradation chromatogram of reactionvessel 7 at 337 h 160
95. Adsorption of DNT by FS-400optimization of time 161
96. Adsorption isotherms (FS-400)water dry wastewater 162
97. Adsorption isotherms (FS-400)solvent rich water dry wastewater 163
98. Adsorption isotherms (FS-400)plant effluent + DNT 164
99. Bench-scale rotating biological contactor (RBC) 165
100. Bench-scale rotating biological contactor 166
101. Close-up photograph of microorganisms on contactors 167
102. Rotating biological contactor effluent collector 16B
103. COD removal efficiency 169
104. DNT removal efficiency 170
105. Biomass from bench-scale rotating biologicalcontactor on day 26 171
106. Biomass from bench-scale rotating biologicalcontactor on day 26 172
g

IPage
107, Birmass from bench-scale rotating biologicalcontactor on day 35 173
I 108. Biomass from bench-scale rotating biologicalcontactor on day 35 174
109. Effluent collector 175
110. Normag photoreactor 176
111. Bench-scale UV/ozone reactor 177
112. Ozone generator and power supplies for UV bulb 178
113. UV reactor bulbs and cooling jacket 179
114. Flow diagram of UV/ozone reactor 180
115. Effect of varying ozone flow rateof reactor at 254-nm 181
116. Comparison of UV bulbs at 10 SCFH 182
117. Solvent effect at ozone flow rate of5 SCFH at 254-nin 183
118. Solvent effect at ozone flow rate of
10 SCFH at 254-nm 184
119. Irradiation of standard at 254 nm 185
120, Preliminary wastewatcr irradiated at 254 nm 186
121. Effect of varying ozone flow rate onwastewater at 254-nm 187
122. Final wastewater experiments at P54-nm 188
123. First order plot of UV/ozone destruction ofDNT In wastewater 189
124. UV/ozone chromatogram of test 29 at 0 min 190
125. UV/ozone chromatogram of test 29 at 5 min 191
126. UV/ozune chromatogram of test 29 at 65 min 192
127. UV/ozone chromatogram of test 29 at 125 min 193
xi
I

I
I Page
I128. UV/ozone chromatogram of test 29 at 285 min 194
I129. UV/ozone chroniatogram of test 29 at 245 nin 195
130. Bench-scale granular activated carbon 196
131. Flow diagram of granular activated carbon column 197
III
I
II
III xii
Si
I
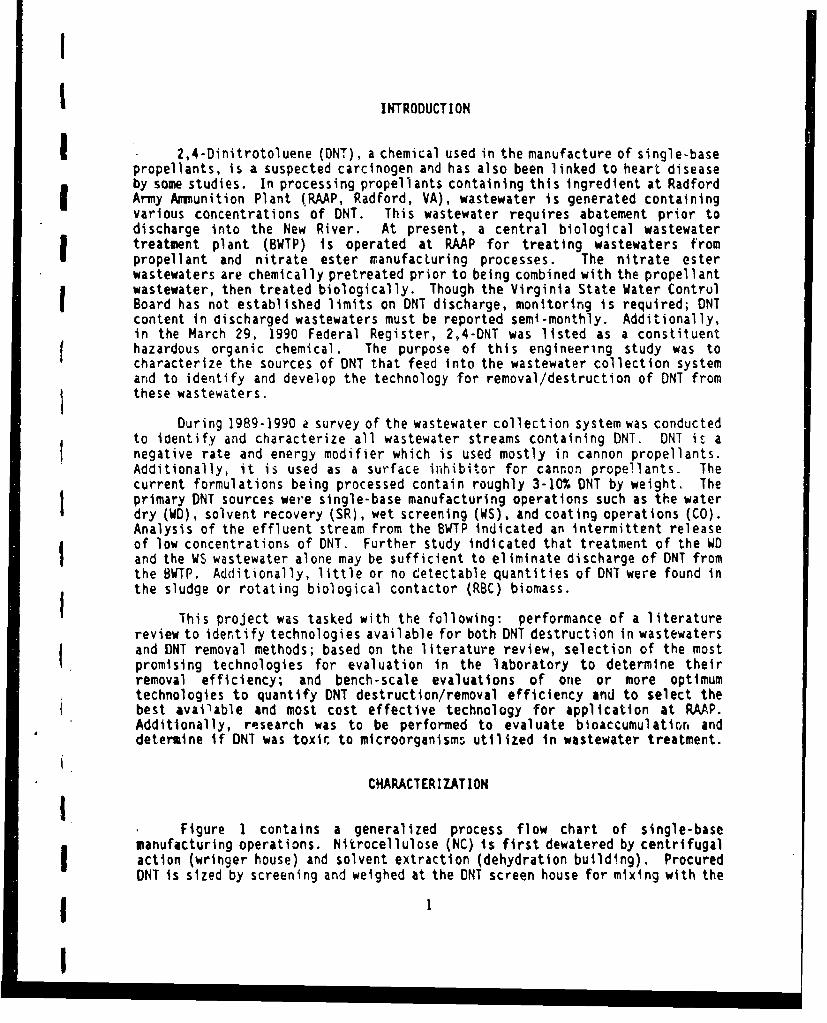
INTRODUCTION
2,4-Dinitrotoluene (DNT), a chemical used in the manufacture of single-basepropellants, is a suspected carcinogen and has also been linked to heart diseaseby some studies. In processing propellants containing this ingredient at RadfordArmy Ammunition Plant (RAAP, Radford, VA), wastewater is generated containingvarious concentrations of DNT. This wastewater requires abatement prior todischarge into the New River. At present, a central biological wastewatertreatment plant (BWTP) is operated at RAAAP for treating wastewaters frompropellant and nitrate ester manufacturing processes. The nitrate esterwastewaters are chemically pretreated prior to being combined with the propellantwastewater, then treated biologically. Though the Virginia State Water ContrulBoard has not established limits on DNT discharge, monitoring is required; DNTcontent in discharged wastewaters must be reported semi-monthly. Additionally,in the March 29, 1990 Federal Register, 2,4-DNT was listed as a constituenthazardous organic chemical. The purpose of this engineering study was tocharacterize the sources of DNT that feed into the wastewater collection systemand to identify and develop the technology for removal/destruction of DNT fromthese wastewaters.
During 1989-1990 a survey of the wastewater collection system was conductedto identify and characterize all wastewater streams containing DNT. ONT is anegative rate and energy modifier which is used mostly in cannon propellants.Additionally, it is used as a surface inhibitor for cannon propellants. Thecurrent formulations being processed contain roughly 3-10% ONT by weight, Theprimary DNT sources were single-base manufacturing operations such as the waterdry (WD), solvent recovery (SR), wet screening (WS), and coating operations (CO).Analysis of the effluent stream from the BWTP indicated an intermittent releaseof low concentrations of DNT. Further study indicated that treatment of the WDand the WS wastewater alone may be sufficient to eliminate discharge of DNT fromthe BWTP. Additionally, little or no detectable quantities of DNT were found inthe sludge or rotating biological contactor (RBC) biomass.
This project was tasked with the following: performance of a literaturereview to identify technologies available for both DNT destruction in wastewatersand DNT removal methods; based on the literature review, selection of the mostpromising technologies for evaluation in the laboratory to determine theirremoval efficiency; and bench-scale evaluations of one or more optimumtechnologies to quantify DNT destruction/removal efficiency and to select thebest available and most cost effective technology for application at RAAP.Additionally, research was to be performed to evaluate bioaccumulaticor, anddetermine if DNT was toxic to microorganisms utilized in wastewater treatment.
CHARACTERIZATION
Figure I contains a generalized process flow chart of single-basemanufacturing operations. Nitrocellulose (NC) is first dewatered by centrifugalaction (wringer house) and solvent extraction (dehydration building). ProcuredDNT is sized by screening and weighed at the DNT screen house for mixing with the
I

NC and other ingredients at the mix houses. After mixing is performed, thematerial is pressed into blocks which are extruded through screens and dies toremove unpl sticized material (block and macaroni presses). The material is thenextruded through dies and cut into the desired configuration (press and cuttinghouse). Inert gas is utilized to extract and recover processing solvents (SP)followed by exposure to water and heat to further reduce the solvent content ofthe propellant (WD). WS Is then performed to properly size the propellant andair (air dry) is utilized to reduce the moisture content of the propellant. Theremaining operations involve packout of the material. Additionally, somepropellants require a coating of DNT which is performed at the CO.
There are four major propellant formulations produced at RAAP containingDNT. These single-base solvent propellants which contain 3-10% ONT are Mi, M6,M14, and LKL. In addition, IMR propellants receive a DNT ballistic inhibitorcoating. The locations where DNT could enter the wastewater system from theprocessing steps are also shown in figure 1. There are six process wastewaterstreams, but only the following four contribute significant quantities ofwastewater containing DNT: SR (cool down wash water and motive water), WD(process water, motive water, leak and overflow water), motive water for the WS,and the DNT CO water. All buildings involved receive a dry cleanup beforewash-down which effectively prevents DNT from entering the wash-down water. Theair dry (AD) buildings require cleaning approximately once a month and are drycleaned prior to wash-down.
M1, M6, and LKL propellants were the primary DNT-containing propellantsbeing manufactured during this evaluation. Therefore, the majority of the watersamples were taken while processing these three propellants. Characterizationof the DNT-containing waste streams was accomplished by collecting samples andanalyzing from the SR, WD, WS, and CO. Grab samples were taken when the othersingle-base propellant formulations were being processed. Flow rates were eithermeasured or estimated.
Process Flow Sources
In SR and WD operations, water used to remove solvents from propellantsduring processing becomes contaminated with other propellant ingredients such asDNT. The SR buildings contain five tanks per building (generally four utilized)which hold -10,000 lb of green (solvent rich) propellant. After the propellantis exposed to heated inert gas to remove and recover the solvents, the propellantis covered with water (1,250 gal ./building) at the end of the cycle to remove the Isurface solvents and to reduce the electrostatic potential. Water (3,790gal ./building) Is then used to move the propellait from the tanks into transferbuggies. These waters, -5,040 gal./SR building, become contaminated with DNT,ethyl ether (ether), and ethyl alcohol (alcohol).
At the WD operation, residual amounts of processing solvents are removedby exposing the propellant to hot water. Approximately 40,000 lb of propellant .in one tank is covered with water and heated to 65*C for 4 to 18 days dependingon the propellant formulation and physical data. During the WD cycle, It isestImated that 7,000 gal. of process water is released from each WD tank during
2
)-

i
I draining and 3,320 gal. is required to discharge the propellant from the tanksto transport buggies (1,890 gal. for the wood tanks and 4,740 gal. for thefiberglass tanks). Additionally, it is estimated that the average WD tank leaksand overflows 6,820 gal ./day. These leaks are caused by the aged wooden WD tankswhich hpve not been replaced by fiberglass tanks. These wooden tanks have smallcracks between the boards which permits water to leak; especially if the wood isallowed to dry.
The last major sources which produce ONT wastewaters are the WS and CO's.The WS house generates 40,000 gal./WD tank and the CO generates 300 gal. ofcoating water/1,000 lb of propellant (50,000 to 100,000 lb of ONT propellantscoated/yr).
I Clearly, the WD's contribute the larger quantity of DNT-containingwastewater and sampling was concentrated at the WD buildings. The results of WDwastewater sampling during a nine-day period are presented in table 1. Thesesamples were collected at the end of the WD cycle during draining. As shown intable 1, samples were collected from the processing of two MI-type propellants;M67 and M724. The average DNT concentration in the wastewater for the M67propellant was -160 m9/L and 280 mg/L for M724. Chemical oxygen demand (COD) forthe M67 was 2,100 my/L 0 versus 6,100 mg/L 02 for the M724.
Additional WD sampling was performed over a six-month period (table 2).f The propellant formulations produced during this ,2riod were M14, M6-155, and LKL120-mm. Additional items were characterized such as COD, ether, alcohol,diphenylamine (DPA), dibutylphthalate (DBP), and N-nitrosodiphenylamine (NnDPA).NnDPA results when the stabilizer DPA is utilized by the propellant to react withNO2. This occurs if the propellant is exposed to excessive heat duringprocessing. M14 and M6 propellants produced the higher DNT concentrations (ashigh as 370 mg DNT/L) while LKL produced lower DNT concentration due to itcontaining a lower DNT concentration and longer treatment period. Solvents(total) were present at less than 1,000 mg/L and other contaminants were usuallyonly a few mg/L. Generally; if it is assumed that each WD tank releases 7,000gal. of 200 mg DNT/L of process water, 3,320 gal. of motive water (0 mg DNT/L),and the WD area releases 122,731 gal ./day of leak/overflow water containing 6.4mg DNT/L into the waste collection system; this results in roughly 8.3 kg ofSDNT/WD tank.
In addition to WD samples, samples were taken at the WS house, the cooldown wash from a SR building, and IMR CO. The results are shown in table 3. Theestimated release of ONT into the wastewater collection system for the SR's is0.8 kg DNT/WD tank, 2.0 kg DNT/WD tank for the WS house, and 0.034 kg DNT/day forthe CO.
Wastewater Collection System,IFigure 2 represents a map (darkened buildings) of both active SR buildings
(large rectangles) and WD (small rectangles). According to the map, only WD andWS building drainage could be intercepted at manhole (MH) 32 (see arrows on fig.2). Additionally, all SRwastewater could be intercepted from MH 36. These H's
I3
II

were located and field-surveyed to confirm rim and invert elevations for thepurpose of conducting a flow measurement study based on water depth measurementsand the Manning formula. Automatic flow-proportional 24-h cpmposlte wastewatersamplers and continuous recording flowmeters were utilized.
Table 4 contains the flow, COD, and concentration of various components ofthe wastewater at MH's 32, 34, and 36 in addition to the BWTP. Both 24-hcomposite and grab samples were collected. MH 36 was further divided by a grabsample to differentiate wastewater from six isolated SR's (MH 36A) and awastewater from the propellant manufacturing areas (MH 368). The flow rate fromthe SR's was 0.3 MGD; however, no SR's were discharged during the measurementperiod as is further confirmed by 0.54 mg DNT/L detected. (This may be due toSR condenser water discharging into the drainage system). MH 32 contains thewater from nine WD's and two WS buildings with an average flow rate of 0.18 MGDand 6.4 mg DNT/L concentration from the composite sample (grab -75.8 mg DNT/L).Since the water discharge and DNT concentration from the WD's was known, MH 32was measured during a period when no WD's or WD buildings were operated todetermine the quantity of wastewater and DNT concentration from leaking andoverflowing tanks.
In summary, utilizing the preceding data, a rough estimate of the sourcesof ONT for the BWTP can be generated with respect to one WD tank (table 5).These are: 0.8 kg from the SR's, 5.3 kg from the WD tank, 3.0 kg/day fromleaks/overflows of the WD tanks, and 2.0 kg from the WS buildings. This wouldindicate that the SR's contribute 7%, the WO's 48%, the WD leaks/overflows 27%,and the WS buildings 18%. During a 307-day count, 308 WD tanks containing ONTpropellants were discharged indicating that one WD tank containing DNT isdischarged per day. This would indicate that 0.28 kg of DNT is released to thewastewater collection system per 1,000 lb of DNT-containing propellantmanufactured.
If a treatment system were installed to intercept the wastewater at MH 32
and production restricted to processing all of the DNT propellants in the WD'sthat drain into MH 32, it is estimated that greater than 90% of the DNT influentload to the BWTP could be intercepted. Additionally, the average quantity of
wastewater for treatment at MH 32 would be 0.18 MGD instead of 1.28 MGD at theBWTP and would be considerably easier to treat. If necessary, similarrestrictions could be placed on the SR area so that SR wastewater could becollected at MH 36 and piped to the treatment Installation for MH 32. Ifproduction increases the DNT coating operations, a basin should be constructedat the coating operations for collection of the coating and wash-down water )(cooling water should be separated and treated normally). This wastewater canthen be transported to the DNT treatment facility.
Biological Wastewater Treatment Plant
Composite samples (24-h) of the wastewater being processed through the BWTPwere analyzed for DNT and COD. The high performance liquid chromatograph (HPLC)chromatograms were examined for the formation of biotransformation by-products.Figure 3 represents the wastewater flow through the BWTP. The wastewater is
4

pumped by a lift station to the aeration/equalization basin (aeration is providedalong with nutrients to enhance biodegradation), new RBC's, old RBC's, and twoclarifiers. (Note: The BWTP was previously expanded with the addition of a newset of RBC's.) Sludge is removed from the clarifiers to aerobic digesters, athickener, and finally a filter press. Table 6 presents the DNT analysis resultsfor BWTP raw composite influent, grab sample raw influent, grab sample new RBinfluent, grab sample old RBC influent, and BWTP effluent. Table 7 presents theresults for COD analysis at the same locations. Based on an average wastewaterflow rate of 1.13 MGD during this sampling period with an average Influent DNTconcentration of 7.67 mg ONT/L, an average of 72.2 lb/day (32.75 kg/day) of Oh(Treached the BWTP and an average of 1.54 lb/day (0.70 kg/day) of ONT wasdischarged in the effluent. It was observed that an average of 62% of the DNIwas removed in the aeration/equalization basin and 36% was removed in the RBC's.Additionally, these results indicate an average overall removal of 98%, with amaximum of 1.2 mg DNT/L discharged from the BWTP.
Analysis of the chromatograms (figs. 4 through 8) confirmed the gradualreduction of DNT. DNT had an average retention time of 4.4 min on thesechromatograms and the representative peak in the chromatograms (figs. 4 through8) decrease in size as the wastewater proceeds through the facility.Additionally, the HPLC chromatograms for DNT analysis wpre utilized to observefor DNT biotransformation products by obsprvir4g peak patterns. The formation ofa new peak, which could be a biotransformation by-product, was observed at -3.37mirn (figs. 5 through 8). Literature reports indicated a number of transformationby-products with one of the ultimate end products being 2,4-diaminotoluene (DAT).
In order to document the previous history of DNT discharged from the BWTP,the weekly effluent composite samples are plotted in figure 9. The sporadic highdischarge levels were compared to production levels of DNT-conta.ning propellantsfor this period. No correlations between the level of production of individualpropellants and DNT discharge levels were noted.
Complete statistics, utilized obtaining a discharge permit for the BWTP,are contained in table 8. Effluent data concerning flow, pH, five-day biologicaloxygen demand (BODO), total suspended solids (TSS), COD, sulfates (SOJ), nitrogen
(N), and ONT is represented by an average daily quantity on a monthly basis andsummarized for the year. The effluent flow ftom the BWTP averaged 1.28 MGD witha maximum flow of 3.09 MGD. DNT effluent loading for the period averaged 1.65kg/day with a maximum of 26.7 kg/day. The effluent contained an average of 0.264mg/L with a maximum of 3.60 mg/L. This information indicates that if dischargelimitations are imposed on the BWTP for DNT, some modification or improvedtreatment will be required.
Biomass samples taken from the RBC's and the filter press of the BMfIPindicated no DNT accumulation. The samples were taken to ascertain the potential
for DNT accumulation or other biological breakdown products in the biomass. Theanalysis was performed with either acetonitrile or methanol as the extraction
Jsolvent to further assure that ONT was not accumulating. Further studies"conducted using sulfuric acid to digest the biomass prior to analysis also didnot indicate significant accumulation.
!S
I

LITERATURE REVIEW
A survey was conducted to identify technologies available for destructionof ONT in wastewaters and to identify ONT removal methods. The decomposition ofDNT and its associated by-products from various treatment methodologies were alsoreviewed wherever available in the literature.
Technological Review
Approximately 60 articles were reviewed concerning biological, activatedcarbon, incineration, oxidation, reduction, and general wastewater treatment.Some articles contained little or no specific information relating to DNT;however, they either provided insight into treatment technologies for ONT orsimilar compounds as described below.
Biotransformation or Biodegradation
Sixteen articles contained information on biological destruction ofDNT. All articles indicated biotransformation occurred with no evidence ofaromatic ring destruction. (Limited information is available that indicatesbreakage of the aromatic ring and will be discussed at the end of thissection.)2 However, previous reports required the formation of a liphenol asa necessary prerequisite for degradation of the aromatic nucleus. For thestructurally similar compound TNT, it was reported there is no evidence forbiological cleavage and degradation of the aromatic ring of TNT.4 Stepwisereduction of the nitro groups by various organisms (mammalian, bacterial, andfungal) occurs through the nitroso and hydroxylamino to the amino. Variouscompounds identified were: 4-amino-2,6-dlnitrotoluene (4A);2,4-diamino-6-nitrotoluene (2,4DA); 2,2',6,6'-tetranitro- 4,4'-azoxytoluene(4,4'Az); 4-hydroxylamino-2,6- dinitrotoluene (4HA); 2-amino-4,6-dinitrotoluene(2A); 4,4',6,6'-tetranitro-2,2'-azoxytoluene (2,2'Az);and 2,4,6-triaminotoluene(TAT).'
For DNT, the following microbial transformation compounds wereidentified: 2,4-diaminotoluene (2,4DAT); 2,6-diaminotoluene (2,6DAT), 2-amino-4-nitrotoluene (2A4NT); and 4-amino-2- nitrotoluene (4AZNT). The microorganismsVeilloneila alkilescens, Eschericha colt, Chostridium pasteurianum, andpseudomonad FR2 was evaluated for the ability to degrade nitroaromatic compounds.These biological systems (both aerobic and anaerobic) demonstrated the abilityto catalyze the reduction of at least one nitro group. The 4-nitro group wasalways reduced first.4 Another article described a method for evaluatingbiotransformation using both anaerobic and aerobic microorganisms. ONT wasbiotransformed by both organisms; however, ring breakage could not bedemonstrated. The anaerobic biotransformation products could not be identified."
Effort involving activated sludge indicated that microbial
transformation of 2,4-DNT occurred only under anaerobic conditions utilizing
6

'activated sludge (no activity was observed under aerobic conditions). Products
detected were: 2A4NT, 4A2NT, 2-nitroso-4-nitrotoluene (2NO4NT), andI 4-nitroso-2-nitrotoluene (4NO2NT)6
An evaluation of the products from the microbial transformation of2,4-DNT by Mucrosporium species (strain QM9651, NLABS Culture Collection ofFungi) identified: ZA4NT; 4A2NT; 2,2'-dinitro-4,4'-azoxytoluene; 4,4'-dinitro-2,2'-azoxytohuene and 4-acetamido-2-nitrotoluene. A third azoxy compounI couldnot be identified. Again none of the compounds indicated ring breakage. One-hundred and ninety fungi representing 98 genera were screened for the ability totransform 2,4,6-TNT and 2,4-DNT. One-hundred and eighty-three of the organismswere able to transform TNT while only five were able to transform DNT. The studyconcluded that the utilization of fungi to treat TNT wastewater appearsunpromising in view of their failure to degrade TIT and DNT and the possibilitythat the amino transformation products are toxic.
Microbial degradation was further evaluated using industrial seedcomprised of four bacterial genera (Acinetobacter, Alcaligenes, Flavobacterium,and Pseudomonas) and one yeast (Rhodotorula) for comparison to municipal seed.A Warburg respirometer was utilized according to the Umbreit (1972) procedure.2,4-DNT was rapidly degraded by industrial seed and even demonstrated stimulationabove 200 mg/L. Municipal seed demonstrated inhibition at all concentrations.4-methyl-3- nitroaniline was detected as a metabolite in the reactor containing
Sthe industrial seed. Similar results were obtained with 2,6-DNT, except2-methyl-5-nitroaniline was formed as a by-prod~ct.- Another article presentedthorough respirometer work on TNT wastewaters.
Conmnunications with researchers indicate that current biologicalefforts are successfully breaking the aromatic ring of 2,4-DNT.2' Research isbeing performed on microorganisms which have been exposed to toxic compounds suchas TNT and 2,4-DNT and determining if metabolism of the compounds occurs. Earlyresults Indicate that both compounds can be completely biodegraded.
I Concerning the formation of toxic or mutagenic compounds duringbiotransformation of DNT, both oxidative and reductive metabolism frommicroorganisms contribute to the formation of mutagenic products from 2,4-DNT andits metabolites in vitro. The products studied were 2,4-DNT, 2,4-DAT, 2A4NT,2,4-dinitrobenzoic acid, 2-amino-4- nitrobenzoic acid, 2NO4NT, and 2,4-dinitrobenzyl alcohol. In summary, 2,4-DNT and 2,4-DAT (the end product of themetabolism) were less mutagenic by -8-80 times than the intermediatemetabolites. ' A review on TNT with references to DNT in the text, indicatesthat ONT has no effect on activated sludge.t
Activated Carbon Treatment
SThe adsorption of 2,4-DNT it, aqueous solution by two commercialactivated carbons was evaluated. Additionally, the desorption of DNT from theseadsorbents by solvent extraction were studied. The efficiency of removal of DNTfrom aqueous solution by Calgon Filtrasorbe (FS)-300 and FS-400 are different,as FS-400 had the greatest capacity. FS-400 has a mean particle diameter of
!7

1.0 mm while FS-300 has a mean particle diameter of 1.6 mm. Additionally, FS-400has an iodine number of 975 min while FS-400 has 1,100 min. Grinding FS-300increased its equilibrium adsorptive capacity, but not to the capacity of FS-400. 3
Ho and Daw conducted carbon loadirg studies utilizing laboratorywater containing 100 mg/LI DNT and FS-400 carbon."' They determined that loadingsof 800 mg of DNT per gram of FS-400 dry carbon were achieved. Additionally, someof the adsorbed DNT is converted to its derivatives. The presence of derivativesof 2,4-dinitrobenzyl alcohol, 2,4-dinitrobenzaldehyde, and 2,4-dinitrobenzoicacid indic1 tes that one of the reactions is a side-chain (the methyl group)oxidation.,
In a second article GAC performance tests were conducted to evaluatetreatment of pink water (munitions wastewater) from U.S. Army Ammunition Plants(AAPs). Comparative isotherm tests were conducted with five GACs to determinean optimum grade for pink water treatment and to evaluate temperature andcompositional effects. The target effluent criteria of 0.04 mg/L for TNT, 0.03mg/L for RDX or HMX, and 0.0007 mg/L 2,4-DNr were achieved with the isothermtests.
A third article involved treatment of wastewatcr containing fivepriority pollutants (7.9 mg DNT/L) in addition to fourteen other contaminants.Comparative assessments were performed for treatability by carbon adsorption,resin adsorption (XAD-4), and stear. stripoing (evaporation). Steam stripping wasineffective, while carbon adsorption was considered more cost effective thanresin adsorption-. Both adsorptive systems appeared to be capable of removing DNTto levels of 0.1 ppm or lower. Carbon was slightly more cost effective with atotal annual cost of I to $3 per 1,000 L for flows of -1,130 L/man and forremoval down to I ppm.
Analytical methodology involving GAC for extraction of 25 prioritypollutants for analysis was also reviewed. Utilizing various displacers(methylene chloride, methanol and benz[alpha]anthracene-7,12-dione), the majorityof the 25 pollutants were totally displaced. However, ONT was one of thepollutants which could not be totally displaced. The report recommended furtherwork on DNT.' 6
An article dealing with TNT recommends the evaluation of watermanagement and thermal regeneration of granular activated carbon. It recommendedthermal regeneration since the treatment cost of 1,000 gal. of pink water couldbe approimately cut in half to a cost of $3.48/1,000 gal. of pink watertreated.'
Inci neration
Patent description of a process to first remove the water from thewastewater containing nitro compounds, and then incinerate, inlicates that thismethod is five times more efficient than direct incineration.
8

I
I Oxidation
IP. C. Ho of Oak Ridge National Laboratory (ORL) evaluated thesynergistic effect of hydrogen peroxide (H202 ) and ultraviolet (UV) radiation
Ifrom a medium-pressure lamp on the decomposition of 2,4-DNT in water wasevaluated. The results indicated that the degradation pathways of DNT in aqueoussolution are: (1) side-chain oxidation, which converts ONT to 1,3-dinitrobenzene,(2) hydroxylation of the benzEine ring, (3) benzene ring cleavage, and (4) furtherphotooxidation, which eventually converts the lower mol5:cular weight a•ids andaldehydes to carbon dioxide (CO), water (H20), and nitric icid (HNO3 ).
The aqueous solutions were irradiated with either a 450-W (sometimes200-W) Hanovia medium-pressure mercury vapor lamp (far-UV to infrared region) ora low-pressure mercury lamp (GE, G15T8), which has a maximum output at 253.7-nm.ONT in aqueous solution has an adsorption maximum at 252-nm. Additionally,H202 is photosensitive to UV light which was used to induce oxidation of
compounds."
The (ORL) experimental results indicated that the H202/DNT molarratios for optimum degradation were determined to be 26 to 52. Both bulbsproduced degradation; however, the presence of light in the far-UV region, as
Swell as an excess of H20A, was required for the degradation of DNT in aqueous
solution. 19
Intermediates identified in this study, after each photooxidation ofaqueous DNT solution and of its degradation intermediates, suggest the followingreaction pathway for photooxidation of aqueous DNT solutions with UV/H 202:
S2,4-ONT + H20 , UV 2,4-dinitrobenzyl alcohol - 2,4-dinitro-benzaldehyde - 2,4-dinitrobenzoic acid -. 1,3-dinitrobenzene . 3-nitrophenol +dinitrophenols (+NO 3,) ., dihydroxynitrobenzenes ý trihydeoxynitrobenzenes .nitromuconic acid derivatives (+NO,') - maleic acid + nitro- and hydroxymaleicacid derivatives + •lyoxal + glyoxylic acid (+NO 3,) . oxalic acid + formic acid(+NO3") . C02 + H20.I
Additional oxidation literature was reviewed which contained noreferences to DNT, but provided insight to Fotential treatment methodology. Wetair oxidation (WAO) for treatment of high COD (70,000 mg/L) wastewater wasreviewed. WAO was recommended for wastes which are not biotreatable ($0.13/1,000L), since WAO ($1B/1,O00 L) is an economically attractive method of treatment inreducing oxygen demand and altering th? blotreatability versus hauling as ahazardous waste ($150-200/1,000 L plus shipping costs)." Several treatmentmethods were evaluated to treat wastewater from the production of utility poles,lumber, railroad ties, and other products treated with preservatives and fir3retardant materials. Chemical coagulation/flocculation alone was eliminated dueto an inconsistent ability to meet discharge standards. Biological methods wereeliminated due to questionable performance with regard to pentachlorcphenol.rem'ival, long lead time for procurement and construction, and the requirement fora coi, tant rate of wastewater flow. Both activated carbon and UV/ozone were
-e _iective; however, the Ultrox International UV/ozone system was selected on the
1 ,
!

basis of cost-effective iess and the fact that the UV/ozone process destroyed thecontaminants rather than transferring them to another medii'm. 21
Ozone photochemistry and its degradative ability was evaluated. Thiseffort demonstrated tqt the TNT aromatic ring was broken down to CO.. No effortwas performed on DNT.
Advanced oxidation processes whi:h utilized UV in conjunction witheither ozone or HO2, to generate hydroxyl radicals were reviewed. Theseradical,ý,iznturn , attack and degrade organic molecules; no effort was performedon DNT. '
Reduction
Methods of electrochemical DNT reduction are containea in theliterature; hoe.ever, none proved to be economical. A nickel-based catalyst andvarious solverts were required for the reduction and several by-products wereproduced. The use of solvents to conduct the reactions makes this approach lesseconomically attractive. 26
Alkaline solutions of carbon monoxide in the form Fe(CO) and watercan be utilized to reduce DNT to 2,4-dlaminotoluene. 27 The potential ofan~allytical rnothneilogy UtilIivinng silvern el ectrodes to --r-fr __A.u+4ion was alsinvestigated. a The reduction of DNT isomers produced ýuring the manufacture ofTNT with compounds such as ascorbic acid is possible. Additionally, 2,4-DNTwas reduced electrolytically to 2,4-DAT using titanic sulfate as t e additionagent and no side products were obtained producing over 90% yields.
General Wastewater Treatment
A form of powdered activated cz'rbon treatment (PACT) process has beendeveloped which lowers the organic concentration of the wastewater in conjunctionwith removing toxic compounds such as DNT, Chemical oxidants (permanganate,ozone and hydrogen peroxide) used for the destruction of organics such as ONT,may be extremely expensive as a treatment process due to the requirement of alarge amount of oxidant. WAO is effective -t degrading organics but requires anenclojed vessel, high temperatures, and pressures (typically 550°F and 2,000psi).• ,
Direct filtration is often able to reduce toxics at the source byremoval of suspended matter. (Generally all of the DNT is in solution in thewastewater; however, some form of filtration may be roquired to remove suspendedmatter to improve the treatment process.) Mono-media sand beds, microscreens,ultrafiltration units and membranes are several filtration devices. Forgross-solids removal to a particle size of 1-5 micrometers, processes such asmono- ormulti-meoia granular beds ormicroscreens are appropriate. A filtrationmethod which borders on being a membrane process, ultrafiltration, Is applicablefor removing constituents of known molecuiir size, with the concentrated
10 )

II
sidestream being disposed of in another manner (e.g., incineration). Membranesystems are for concentrated, low-volume and relatively nonspecific waste streamsand will retain all molecules falling within certain size ranges, depending onthe membrane selected. The constituents on the permeate can be reduced by 50-99%
"and can be contained in 19-30% of the original volume. Again, the concentratemust be disposed of by other means such as thermal or chemical oxidation."However, membrane concentration followed by thermal oxidation, although quiteexpensive as a wastewater treatment process, will be substantially less expensivethan direct thermal oxidation of the entire waste stream.TM
The removal of nitroarimatics from concentrated sulfuric acid can beaccomplished using electrolysis; degradation proceeded to CO2 and oxides ofnitrogen.
Membrane filtration has improved significantly due to its ability tosurvive harsh operating environments and reduce fouling by applying laminar flowthrough a tubular configuration. With a larger pore size, t e resultingincreased membrane flux greatly improves the operating economics.3 While TNTsuccessfully demonstrated the feasibility of membrane ultrafiltration in pinkwater; ONT demonstrat'd poor membrane rejection.
"TWashwater containing blasting oil from washing out residual nitricacid from the reaction mixture in a nitration plant is extracted with DNT,another common component of high explosives, in a mixer-settler apparatus.' TheONT was extracted with toluene from the wastewater. Authors were concerned withDNT in the wastewater only because of the addition of nitrates.35
Another article concerning methodology for analysis of DNT indicatedspecified levels of sensitivity at 0.05 ppb for 2,4-DNT and 2,6-DNT, butcautioned that this tay nt be applicable to various forms of wastewater due toadditional contamination.
"Research is being conducted to investigate closure methods forlagoons containing TNT and RDX wastes (pink water). Research has included (1)an evaluation of existing asphalt encapsulation techniques for hazardous wastes,(2) an evaluation of alternative heating/mixing systems, (3) review of theproperties of various asphalt products that may be used, (4) laboratoryexperiments of the temperature and holding times required for thermal breakdownof the various compounds present in the sludge, and (5) preliminary design of apilot mixer/heating sptem." Heating experiments in'ilcate a 90% reduction at atemperature of 250'C.
"TNT was found to react in aqueous solution with surfactants
containing amino and quaternary ammonium groups at pH 10-11 at ambienttemperature. The surfactants investigated included N-tallow 1,3-diaminopropane,trimethyl N-tallow ammonium chlori e an, N,N, N',N',N'-Pentamethyl N-tallow1,3-propane diammonium dichloride."
"The major expense In this process for the treatment of Composition" 8 wastewater is that of the surfactant, i.e., N,N,N',N',N'-pentamethyl
'N-tallow-1,3-prcpane diammonium dichloride, which is commercially available andis the surfactant of choice. Based on the assumption that the concentration of
(91
I I II I I I II I

the TNT in the water was I lb/1,000 gal. (120 mg/L) and required only 0.37surfactant moles per mole of TNT, the cost, of the 3urfactant would be $1.25(April 1979) per 1,000 gal. of wastewater.*
TNT demonstrated the feasibility of surfactant technology utilizingDuoquad T-50; however, DNT required harsher treatment (55oC and pH-1 5) as pocror erratic removal was achieved at lower temperatures and lower pH.
Health and Safety/Toxicity
From acute and chronic toxicity testing utilizing Daphnia magna andfathead minnows, 8.1 mg/L of DNT is recomrnended as the maximum allowableconcentration and 0.12 mg/L recommended the maximum allowable 24-h averageconcentration by Environmental Protection Agency (EPA) methods.4 0
LABORATORY EVALUATIONS IBased on the literature reviewed, the following methods were recommended
for laboratory evaluation for the following reasons: (1) various combinations ofU', ozone, and hydrogen peroxide treatment were recommended because of economics.easre of installation, and low operator involvement during operation; (2)Ce' elopfrtit of biological degradation and/or accumulation should be monitored andvarious evaluations performed since recent information suggested successfulbreakage of the aromatic ring; and (3) adsorption isotherms should be developedwith GAC and potential means for regeneration evaluated.
Biological Studies
The DNT biological studies were divided into three areas of investigation:toxicity, bioaccumulation, and biodegradation.
Toxicity Studies
The toxicity of a compound is generally assessed by measuring theirrepression of microbial respiration process. To assess the effect of thesepotentially toxic compounds; the microorganisms must be acclimated prior to theexperiments, otherwise, repression of respiration will occur until themicroorganisms acclimate themselves to the toxic compound.
The respirometer studies to evaluate the toxicity of DNT wereperformed with a Hach model 2173B BOD apparatus. The unit consisted of sixindividual reaction vessels tiat operated simultaneously during testing; eachreaction vessel was connected to a separate manometer. The operation of the unitwas based on oxygen utilizatiun by the l.iving microorga,,Isms. As oxygen was used
12

I
in metabolism, COZ was produced as a by-product. In these units, the CO2 gas
chemically reactea with the lithium hydroxide which removed the CO2 from the-unit's atmosphere. The end result was a drop in pressure (measured by themanometer's) which was proportional to the rate of metabolism (BOO or oxygen
-utilization) of the microorganisms. All respirometer tests were conducted in a-temperature range of 20 to 22°C.
The units operated in a range of 0 to 600 mg BOO/L. This wasaccomplished by using a total volume of seed and sample to be metabolized of 160mL for each vessel. The seed was prepared using microorganisms removed from theBWTP RBC's. The 20 L container of seed (wastewater, contaminants, andmicroorganisms) was fed BWTP influent daily to maintain a representativeacclimated biological culture for these studies. The quantity of seed necessaryto provide sufficient quantities of microorganisms to inoculate the samples wasdetermined to be 10 mL. The BOO of 100% seed was also measured for comparison;this was to assure that the seed strength was similar for all testing.
To assess toxicity, each evaluation compared seed strength (1001%) anda blank (150 mL of sample without DNT plus 10 mL of seed) to the remaining unitscontaining increasing concentrations of DNT in plant process water. A testmatrix was developed utilizing solutions prepared in the range of 0 to 250 mgDNT/L with 100 mg/L of ethyl alcohol to provide an energy source for themicroorganisms. If DNT proved to be toxic to the microorganisms, a reductionin respiration wol,*d occur with increasing concentrations of the DNT.
BOD results from the first series of tests did not indicaterepression of microbial respiration. As can be observed in figure 10, nosignificant repression occurred at any of the DNT concentrations. A study ofthe chromatograms indicated that no ONT was detected in the solutions after 140h of respiration (figs. 11 through 17). However, several by-products withvarious HPLC retention times (-2.93, 3.09, 3.53, and 5.08 min) were apparent Inthe solutions after the respirometer studies.
In the second test series (fig. 18), the microorganisms experiencedrepression in the initial period due to temperature shock from the use ofreagents stored at 4°C to inhibit microbial growth prior to experimentation(procedure modified to prevent future problems). However, after a recoveryperiod, vessels containing ONT responded similar to the blank. The 100% seed wasnot exposed to the effects of the temperature shock as can be observed infigure 18.
The third test series (fig. 19) indicated some form of repressionoccurred which temporarily repressed microbial respiration the first few days;the seed responded in a normal manner. Since the blank (0 mg DNT/L) alsoexperienced initial repression similar to the ONT vessels, it would indicate thatsome unknown factor produced the .epression and not ONT.
The fourth test series (fig. 20) indicated that the seed contained-insufficient mnicroorganisms. Following a lag period to allow multiplication ofthe microorganisms, normal respiration occurred. All ONT concentrations had a
;similar response, indicating no repression occurred.
13
!I

In the fifth test series (fig. 21), no repression of microbial growth(BOD) was experienced. The seed responded in a normal manner. Figures 22through 28 represent chromatograms from the individual respirometers from thefifth series of tests after -170 h. The blank (fig. 22) which contains no DNT,shows no detectible compounds. The sample originally containing 50 mg DNT/L(fig. 23), had no ONT, but contained a peak at a HPLC retention time of 3.69 min.Figure 24, representing an initial concentration of 100 mg DNT/L, contained 21.1mg DNT/L (retention time of -6 min) and peaks at retention times of 1.72, 3.1,3.64, and 7.17 min. Figure 25, representing an initial concentration of 150 mgDNT/L, contained 47.2 mg DNT/L and peaks at retention times of 1.79, 2.99, 3.53,and 7.02 min. Figure 26, representing an initial concentration of 200 mg UNT/L,contained 44.5 mg DNT/L and peaks at retention times of 1.77, 3.06, 3.59, and7.13 min. Figure 27, representing an initial concentration of 250 mg DNT/L,contained 88.6 mg DNT/L and peaks at 1.76, 3.10, 3.64, and 7.14 min. Finally,figure 28 which represen.s 100% seed contained no ONT nor any other detectible-ompounds.
In conclusion, the DNT was not toxic to acclimated biomass. The DNTproduced four by-products after 160 h of reaction. These by-products arerepresented by HPLC retention times of -1.75, 3.05, 3.5, and 7.1 inan when DNT hasa retention time of 6.0 min. As demonstrated later by the biodegradationexperiments (refer to the Biodegradation section), the compound with a retentiontime of 1.75 min is apparently a component of the biomass.
Bloaccumulatlon
Two biomass/bloreactors each containing 20 L of blomass (<1%) andBWTP influent wastewater were evaluated to assess the effects of bioaccumulation.The first reactor was utilized as a blank and the second reactor was operatedessentially icentical to the first reactor with the exceptiorn that ONT wassupplemented to the feed (which occasionally resulted in leakage of DNT). SixL of the contents of each reactor were removed on a daily basis (except onweekends and on day 5) and replaced with fresh wastewater from the Influent ofthe BWTP to provide a carbon source for the microorganisms. The DNT supplementedreactor also had an additional L removed and replaced with a more concentratedsolution of DNT (58.6 mg DNT/L) in water. Samples were periodically collectedand analyzed for the concentration of DNT and measurement of COD (tible 9) toassess bioaccumulatlon and its effects.
Figure 29 represents a HPLC chromatogram of the blank blomass/bioreactor. The observed peaks represent background peaks which can be observedthroughout the evaluation. Figure 30 represents a chromatograma of the DNTsupplemented blomass/bioreactor prior to DNT addition. ONT can be observedindicating the presence of a small quantity of DNT in the wastewater feed (3.06mg/L at a retention time of 4.61 min),
At the end of day one, figure 31 indicated no ONT nor any unusualpeaks for the blank. However, figure 32 indicated the DNT supplementedbiomass/bioreactor" contained both ONT (retention time -4.8 min.) and potentialbiodegradation by-products (peaks) with retention times of 3.53, 3.79, and 5.68
14

II
min. On day 4, the blank (fig. 33) was normal while the DNT supplemented reactor(fig. 34) demonstrated peaks at 2.72, 2.99, and 3.82 min and no DNT. On day 6,the blank was normal (fig. 35) while the DNT supplemented reactor (fig. 36)demonstrated peaks at 2.86, 3.11, 3.56, and 5.14 mnn and 0.07 mg DNT/L. On day7, the blank was normal and contained 0.08 mg DNT/L (fig. 37) while the DNIsupplemented reactor (fig. 38) demonstrated peaks at 2.54, 3.02, and 3.70 mn and
1.24 mg DNT/L. Day 8 blank was nnrmal with the exception of an unknown peak at5.46 min (unknown compound in the influent to the BWTP) and a DNW concentrationof 0.74 mg/L (fig. 39). The DNT supplemented reactor (fig. 40) demonstrated apeak at 2.48 min and contained 0.99 DNT mg/L. Day 11 was normal with theexception of an unknown peak at 2.96 min and a DNT concentration of 0.02 mg/L
(fig. 41). The ONT supplemented reactor contained 10.62 mg DNT/L and nosignificant peaks (fig. 42). Day 12 blank was normal with the exception of anunknown peak at 5.42 min and a DNT concentration of 0.07 mg/L (fig. 43); the DNTsupplemented reactor contained 0.02 mg DNT/L and had an unknown peak at 3.63 man_(fig. 44). Days 13, 14, and 15 (fig. 45 through 50) indicated no DNT nor thepresence of any unknown peaks.
This evaluation indicated that instead of bioaccumulation occurring,DNT was biodegraded and produced up to six unknown by-products with HPLCretention times of -2.6, 2.9, 3.1, 3.5, 3.6, and 3.75 in (table 9). As timeproceeded and permitted the microorgan~isms in the DNT supplemented reactor tobecome acclimated to the DNT anW DNT by-products, the peaks for the by-productsare no longer present indicating fýirt-er biodegradation. Additionally, anunknown contaminant from the wastewitr .:ould be observed at an average HPLCretention time of 5.55 min. Unknown nuwt,,er 2 (2.9 min.) appeared at day 11 ofthe evaluation in the blank reactor 'tue to the presence of DNT from thewastewater feed from the BWTP during the period of days 7 through 12. Otherwisethe contaminants appeared only in the DNT supplemented reactor. An unknowncontaminant from the BWTP was detected on days 8 and 12 in the blank and day 1for the DNT supplemented reactor.
Additionally, several experiments were performed with the BWTP RBC
biomass to ascertain if DNT accumulated in the biomass and if current analyticalmethods could detect the presence of DNT. Analysis of the RBC biomass showedonly trace quantities of ONT by HPLC analysis. Digestion of the biomass with
sulfuric acid for 30 min. did not demonstrate any greater quantities of DNTdetected.
Biodegradation Studies
The Hach BOD apparatus was also used in studies ranging up to furtherdefine the hiodegradability of DNT by performing three evaluations. Samples wereremoved from the vessels at different time intervals for HPLC analysis, to
( observe DNT degradation, and the formation and degradation of by-products.Additionally, the test matrix developed to assess the biodegradability of DNTheld the concentration of DNT constant to operate all vessels identically foreach series of tests (70.9 mg DNT/L for tests 1 and 2; 35.4 mg DNT/L for test 3).Sufficient alcohol was added to assure the presence of an energy source for themicroorganisms in the range of 600 to 900 mng BOD/L.
15

Table 10 contains the results of the first biodegradation study. Thetable is divided into two sections to allow correlation of the data. The tophalf represents the progression of metabolism through measurement of BOD's by themanometers, while the bottom half corresponds to sampling of the reactors atvarious time intervals, and measurement of COD (indicative of quantity ofremaining organic material) and DNT concentration.
Figures 51 through 57 are chromatograms of the samples as timeprogressed, while figures 58 through 64 are chromatograms of the final contentof each reaction vessel at the end of the experiment. It should be noted thatthe removal of 10 mL of the contents of each vessel for sampling had a slighteffect on the BOD's; however, it was not considered significant. Figure 51represents the chromatogram of #the seed which contained two small peaks(retention times of 1.64 and 1.94 min). These small peaks should not be observedduring the experiment due to the dilution of the seed. However, the peaksreappeared as time progressed indicating that they were due to microbial growth.Figure 52 represents the chromatogram of the initial nutrient water whichcontained all components including 70.9 mg DNT/L at a retention time of 5.88 min;no other peaks were present. Figure 53 represents the chromatogram of vessel Iat 23 h. In this case, 24.7 mg/L of DNT was present and six peaks werp detectedat retention times of 1.77, 1.95, 2.07, 3.86, 7.45, and 8.42 min. After 77 h,a sample taken from vessel 2 (fig. 54) contained no DNT and five peaks (retentiontimes of 1.34, 1.87, 2.85, 3.75, and 4.03 min). At 95 h (fig. 55), vessel 3contained no ONT and seven peaks (1.63, 1.84, 1.98, 2.45, 2.95, 3.80, and 4.02min). At 119 h (fig. 56), vessel 4 contained no ONT and six peaks (1.74, 1.87,2.00, 2.42, 3.82, and 4.04 min). At 144 h (fig. 57), vessel 5 contained no DNTand six peaks (1.34, 1.80, 1.84, 2.03, 2.41, and 3.78 min).
At 168 h the experiment was concluded and all reaction vesselsexamined for DNT, COD, and peak grouping analysis. Figure 58 represents achromatogram of the blank and a peak present at a retention time of 1.72 min,thereby confirming that this peak was a component of the microorganisms. Smallerpeaks were also observed at 1.96 and 2.03 min. Figure 59 represents vessel 1;no ONT was detected and seven peaks were present (1.69, 1.83, 1.97, 3.59, 3.80,7.55, and 8.53 min). Figure 60 represents vessel 2; no DNT was detected and fourpeaks were present (1.67, 1.90, 1.97, and 3.83 min). Figure 61 represents vessel3; no DNT was detected and three peaks were present (1.67, 1.82, and 1.96 min).Figure 62 represents vessel 4; no DNT was detected and five peaks were present(1.66, 1.82, 1.96, 2.45, and 3.80 min). Figure £3 represents vessel 5; no DNTwas detected and five peaks were present (1.64, 1.83, 1.94, 2.42, and 3.76 min).Figure 64 represents vessel 6; no DNT was detected and five peaks were present(1.67, 1.81, 1.97, 2.40, and 2.69 min).
Table 11 contains a grouping of the various Deaks identified from thebiodegradation experiment. A total of 12 peaks were identified (DNT is the peakat 6.0 min). Peaks with retention times of 1.7 to -2.0 min represent compoundsrelated to the biomass contained in the reaction vessels. .-rom 1.3 to 8.4, sixto nine peaks were observed as by-products from the degradat. on of DNT. As timeprogresses the microorganisms acclimate and less by-products are observed.
Table 12 contains the results of the second biodegradation study.Figures 65 through 70 are chromatograms of the samples as time progressed, while
16

figures 71 through 78 are chromatograms of the final content of each vessel at
the end of the experiment. No chromatogram of the seed was taken on this-experiment; however, the previous biodegradation experiment indicated that peaks
;with retention times of -1.7 and 2.0 mn were attributed to the biomass. In this-biodegradation study the peaks were again present throughout the chromatogramsas time progressed further confirming that they were due to microbial growth.The initial nutrient water contained all components including 70.9 mg ONT/L.Figure 65 represents the chrornatogram of vessel 1 at 22 h. In this case, 0.08mg/L of DNT was present and three peaks were detected at retention times of 1.69,1.81, and 2.03 min. Here, biodegradation occurred at a more rapid rateindicating that the microorganisms were more acclimated to the DNT. After 94 h,a sample taken from vessel 2 (fig. 66) contained no DNT and three peaks(retention times of 1.64, 1.80, and 2.01 min). At 118 h (fig. 67), vessel 3contained no DNT and four peaks (1.68, 1.97, 2.51, and 2.69 min). At 142 h (fig.68), vessel 4 contained no DNT and three peaks (1.68, 1.97, and 2.61 min). At166 h (fig. 69), vessel 5 contained no DNT and three peaks (1.65, 1.81, and 1.95min). At 190 h (fig. 70), vessel 6 contained no DNT and three peaks (1.72, 1.82,and 1.97 min).
At 264 h the second experiment was corcluded and all reaction vesselswere examined for ONT and peak grouping. Figure 71 represents a chromatogram ofthe nutrient water and has peaks at retention times of 1.64, 1.83, and 1.98 min-indicating that these peaks were a component of the microorganisms.Additionally, there were two broad peaks at 2.96 and 3.18 min. Since no broadpeaks of this nature had been observed previously in any samples, it wassuspected that these peaks were contaminants from previous samples processedthrough the HPLC. Figures 72 through 78 represent vessels 1 through 7. No DNTwas detected-and only the biomass peaks were present.
Table 13 contains the results of the third biodegradation study whichwas performed at a lower DNT concentration (35.4 mg DNT/L). Figures 79 through85 are chromatograms of the samples as time progressed, while figures 86 through94 are chromatogram. of the final content of each vessel at the end of theexperiment. A chromatogram of the seed taken during this experiment indicatedno ONT and two peaks with retention times of 1.46 and 1.83 min (similar toprevious biodegradation experiments indicating that peaks with retention timesof -1.7 and 2.0 min were attributed to the biomass). In this biodegradationstudy, these peaks were again present throughout the chromatograms as timeprogressed, further confirming that they were due to microbial growth. Theinitial nutrient water (fig. 80) contained all components including 35.4 mgDNI/L. Figure 81 represents the chromatogram of vessel I at 24 h. in this case,no DNT was present and 1 peak was detected at a retention time of 3.62 min.After 48 h, a sample taken from vessel 2 (fig. 82) contained no ONT and fourpeaks (retention times of 1.67, 1.99, 3.82 and 4.03 min). At 170 h (fig. 83),vessel 4 contained ao DNT and five peaks (1.63, 1.79, 1.8, 1.94, and 3.72 min).At 216 h (fig. 84), vessel 5 contained no DNT and four peaks (1.70, 1.84, 2.OZand 4.62 min). At 264 h (fig. 85), vessel 6 contained no DNT and seven peaks:(1.04, 1.76, 1.99, 2.40, 2.69, 3.6, and 4.55 min).
At 337 h this experiment was concluded and all vessels examined forDNT and peak grouping analysis. Figure 86 represents a chromatogram of the seedand the presence of peaks at retention times 2.04 through 6.87. Figure 87
17

represents a chromatogram of the nutrient water and peaks present at retentiontimes of 1.05, 1.70, 2.03, and 4.63 min. Figures 88 through 94 represent vesselsI through 7. No DNT was detected and several blomass peaks were present.Additionally, a couple of unknown peaks appeared in some of the samples.
Experiment I identified a total of 12 peaks In addition to the DNTpeak. Peaks with retention times of 1.7 to -2.0 min were determined to representcompounds related to the biomass contained in the vessels. From 2.0 to 8.4 min,six tc nine peaks were observed as by-products from the degradation of ONT. Inexperiments 2 and 3, biomass peaks were observed throughout the experiments butonly a few biotransformation products were observed.
In summary, DWT was biotransformed into several unknown by-productswhich can be detected by HPLC. The retention times for the unknown peaksdecrease as time progresses for the experiment indicating that the reactions maybe proceeding to more polar and possibly more degraded molecules. Additionally,there were indications from these experiments that the microorganisms may havecompletely utilized the DNT.
UV, Ozone, H.02, UV/H 202 , UV/Ozone
Information from the literature review indicated UV/H 202 and UV/ozonetreatment of DNT in wastewater yielded C02 , H 0 and other basic molecules whichindicated breakage of the aromatic ring of ENT. Therefore, to assess thesevarious combinations, equipment to generate UV radiation and ozone gas wasassembled and preliminary laboratory-scale evaluations were performed todetermine the parameters to be evaluated during the bench-scale testing.
The 254-nm UV light source was a Mineral ight Lamp model R-520 manufacturedby UVP Inc. The light flux was quantified utilizing a Spectroline model DM-254NUV meter by Spectronics Corporation and was determined to average 5-mW/cm" duringexperimentation. The UV lamp was enclosed in a cardboard box to limit personnelexposure. The ozone was produced by an Airox Ozonator model C2P-3C-2 byPollution Control Industries, Inc. The ozone was introduced using the deliveryend of a disposable polyethylene pipette connected to the source and was notquantified. The stock H120 was 30% by weight and was diluted to -1-3% uponmixing with solutions containing DNT. The UV experiments were conductedutilizing I-crr pathlength quartz cells from various vendors. The ozone and H20,experiments were conducted in small quartz test tubes.
Table 8 contains the results of the experiments and represents DNTconcentrations in relation to duration of exposure to the various treatmentmethods. UV, ozone, and 10, exposure was ineffective *as can be observed fromtable 8. The combination DV/H2 O resulted in a significant improvement in DNTdegradation; however, UV/ozone resulted in nearly complete degradation after 5min of exposure. Finally, UV/ozone was applied to actual water dry wastewaterwhich resulted in degradation at a lower rate. This was expected since thewastewater contained additional components that would compete for the hydroxylradicals.
18

The results (table 14) of the testing concluded that the combination of UVlight and ozone destroyed the ONT and this approach should be furtherinvestigated in the bench-scale studies.
Granular Activated Carbon Isotherms
Adsorption isotherms were developed for removal of 2,4-DNT from WDwastewater, solvent-fortified WD wastewater, and BWTP effluent by FS-400activated carbon.I
Optimization of Adsorption Time
Before isotherms could be conducted, the time of contact between DNTand FS-400 had to be determined. Six samples of -20 mg of FS-400 were weighed.To each sample 100 mL of a known DNT concentration was added. Each sample wasshaken on an orbital shaker at 200 rpm. Samples were removed from the shaker at1-h intervals for 2 h, and 30-man intervals afterwards, until a total time of 240min had elapsed. Data, shown in table 14 and figure 95 indicate that 2 h ofcontact time, with shaking, sufficiently brings the solutions to equilibrium.However, since the adsorption appeared to be linear from 0 to 2 h, I h was chosenas the contact time for the isotherms' work which resulted in approximately 50%of the total adsorption.
Isotherms
Adsorption isotherms were determined by adding increasing amounts ofFS-400 to a solution of WD wastewater. After the 1-h contact time, the liquidwas removed from the bottle, filtered, and analyzed for DNT content by HPLC. Asample of the DNT solution that had not been in contact with FS-400 was analyzedto determine initial concentration. The amount of DNT adsorbed by each gram ofFS-400 in the i-h period was determined and plotted versus final DNTconcentration on a log-log scale. The maximum carbon adsorptive capacityextrapolation of the regression line intersection with the initial concentrationof the DNT solution) would be -200 mg DNT per gram of FS-400 for 1-h contacttime. The adsorption isotherms for this WD wastewater are presented in figure96, and the raw data in table 16.
Additionally, an isotherm was established for the same WD wastewaterwith -1.5% alcohol and 0.6% ether by weight. The addition of these solvents tothe water was to provide indication of the competition for adsorptive sites of
-the three compounds. The experiment was conducted in the same manner as theprevious work and indicated that the maximum carbon adsorptive capacity would be--100 mg DNT per gram of FS-400 in 1 h. The data are presented in table 17 and-the isotherm in figure 97. The reduction in ether concentration observedindicates that preferential adsorption of ether may be occurring.
5 19
I

Finally, the isotherm for a sample of BWTP effluent (collected on 9-11-90) with DNT added was determined. The ONT concentration was less than 2.0mg DNT/L since the wastewater characterization section indicated that the planteffluent rarely exceeded this concentration. The data are presented in table 18arid the isotherm in figure 98. It is obvious that the maximum carbon adsorptivecapacity is greatly decreased, and appears to reach a maximum of about 1.8 mgDNT/g FS-400 in the 1-h of contact time.
In summary, the maximum carbon adsorptive capacity of about 200 mgDNT/g FS-400 in 1-h contact time was seen in the WD wastewater with no additionalsolvents added. Since -50% of adsorption occurred in I h, DNT loading wasestimated at 400 mg ONT/gm of FS-400 carbon. This was reduced -50% when exposedto high solvent concentrations. Additionally, the BWTP effluent showed a DNTadsorptive capacity, which was significantly reduced because other organicscompeted for adsorption sites.
BENCH-SCALE EVALUATIONS
A test plan was developed for the UV/ozone and GAC bench-scale evaluations(appendix A) to isolate and vary individual parameters to define optimumoperating conditions. The biological evaluation was continued without a testplan since the principal objective was to develop microorganisms on an RBC whichcould utilize DNT and optimization was beyond the scope or funding of thiseffort.
Biological
A schematic of the bench-scale unit is presented in figure 99. The bench-scale RBC consists of nineteen 9-in. diameter by 1/4-in. thick discs mounted ona horizontal shaft which rotates through a 10-L liquid reservoir containingwastewater. Rotation is effected by a variable speed motor with controller.Approximately 40% of the disc surface, to which the biomass growth adheres, issubmerged. As the contactor rotates through the wastewater reservoir, it isalternately contacted with air and the wastewater contained in the reservoir,resulting in the biological reduction. Four stages are separated by bulkheads,each of which has a 1-in. diameter hole located near the bottom to provide forcontinuous flow through the reservoir. Following the fourth stage a weir isprovided for wastewater containment and effluent overflow from the finalcompartment for discharge.
Figure 100 is a photcgraph of the bench-scale RBC during operation. Acloseup of the RBC blomass (microorganisms) is contained in figure 101. Aneffluent collector (fig. 102) was utilized to collect and observe what occurredto the microorganisms after exiting the RBC. .
The RBC was evaluated for a period of 71 days. During this period a numberof adjustments to microbial seed, RBC flow rate, and RBC ONT influentconcentratiors were made which assisted in achieving biodegradation of DNT.
20

IContinuous influent flow consisted of three individual streams: (1)
simulated wastewater, (2) phosphate feed, and (3) nitrate feed. The three,streams utilized separate pumping systems to deliver an average composite:influent during the biodegradation period (days 42 throu.1h 71) comprised of 400+ 60 mg COD/L, 0.4 + 0.3 mg phosphates/L as "P", and 29 ± 11 mg nitrates/L as
•N. The to influent flow ranged from 35 to 70 mL/min. DNT was added at"concentrations ranging from 15 to 65 mg ONT/L. The surface area of the RBC discIis 16.8 ft , which translates to a hydraulic loading of 1.58 gallons per day/ft"of surface area and an organic loading of 5.3 lb COD per day/1,O00 ft2 of surfacearea at a flow rate of 70 mL/min (approximately 2.4-H residence time).Rotational speed was maintained at 7 rpm which was previously determined to be
the optimum speed to provide sufficient~teration and prevent excessive sloughingof the biomass from the disc surfaces.
In order to initiate microbial growth on the disc surfaces, the system wasseeded with biomass obtained from the biological wastewater treatment facility.The reservoir was filled to volume with simulated wastewater containing 100 mgethanol/L (carbon source) and supporting nutrients (nitrates and phosphates).The unit was operated under a static hydraulic load for six weeks (i.e., nocontinuous influent feed) until a sufficient growth accumulated on the discsurfaces to support a continuous influent feed. The system was then convertedto normal operation (i.e., continuous feed) on what was designated day 0.Sampling of influent and effluent streams was initiated and COD removalefficiency was monitored observig for stable conditions prior to the additionof DNT. The flow diagram of figure 99 contains the RBC sample locations. Samplelocations B-i and B-2 are where 20-mL samples were taken for COD, nitrates,phosphates, and DNT.
On days 20 through 71 the RBC microorganisms were exposed to DNTconcentrations of -18-65 mg DNT/L. Samples of the influent, effluent, andbiomass were analyzed for DNT and DAT (potential end product of bio-transformation reported in the literature). Previous DNT biological studies andcharacterization efforts (wastewater and biomass) performed for this projectinvolved either dilute or extremely intermittent flows, which may have notallowed for complete acclimation of the biomass to the DNT. This investigativemethod attempted to achieve improved removal efficiency through greater controlof DNT exposure with the RBC.
The COD removal efficiency of the RBC from the beginning to the end of theevaluation is shown in figure 103. Sampling was initiated after sufficientmicrobial mass had developed on the RBC. COD removal efficiency of greater than90% is usually achievable once the biomass acclimates unless the RBC is disturbedor toxicity is experienced. As shown in figure 103, the COD removal efficiencyincreased from -50. to greater than 90% prior to the addition of DNT at aninfluent flow rate of 70 mL/min. The addition of DNT, after 20 days, resultedin a significant decrease in removal efficiency; however, efficiency increaseduntil the flow rate was reduced 50% (38 mI/mm) at day 41. After day 50, the
ýremoval efficiency was greater than 90% until the end of the evaluation when aDNT-alcohol feed pump failure occurred over an estimated two-day period.
The ONT removal efficiency of the RBC is represented in figure 104.Initial sampling indicates that the DNT may have absorbed onto the RBC biomass
21
!

until a limit was reached and then absorption decreased (day 21). On day 29, theRBC was reseeded with fresh microbial mass from the wastewater treatment facilityin an attempt to increase microbial degradation of DNT (since natural selectionmay have eliminated the ONT degrading microorganisms during the six-weekdevelopment stage). DNT removal efficiency increased only slightly over the next12 days; therefore, doubling the residence time by (decreasing the flow rate to38 mL/min) was evaluated starting on day 41. Doobling the residence time of theRBC to allow a longer time period for biodegradation resulted in a significantincrease in the removal efficiency of ONT from the simulated wastewater. DNTremoval of 100% was achieved with -26.5 mg DNT/L in the influent until theinfluent concentration increased (50%) to 39.2 mg DNT/L (day 48). Themicroorganisms were in the process of acclimating to the increase in DNTconcentration when a four-hour power failure occurred (day 49) and allowed thpsystem to become anaerobic. The effects of a system becoming anaerobic cannotbe determined since the power failure occurred prior to a weekend when nosampling was performed. By day 53 the microorganism had recovered and 100% DNTremoval was again achieved. On day 54 the flow rate was increased to 50 mL/min'S6% of original) which resulted in a temporary decrease in removal efficiencyfor DNT. Examination of the HPLC chromatograms on day 57 revealed the presenceof unknowns in the effluent. On day 62, the flow rate was increased to 75 mL/minand 100% DNT removal was briefly achieved prior to a major system failure whichstarved the microorganisms for several days. During days 67 through 71, themicroorganisms attempted to recover while the concentration of influent DNT wasincreased from -18.6 to 36.8 mg DNT/L.
Photographs of the biomass (microorganisms) during the process ofacclimation were taken. Figures 105 and 106 are photographs of the biomass ineach of the four stages of the RBC on day 26. Figures 107 and 108 arephotographs of the biomass in each of the four stages of the RBC on day 35.Figure 109 has photographs of the biomass from a container placed at the effluentend of the RBC where DNT degradation was first confirmed. As can be observed,the biornass appears to become more fibrous as acclimation occurs.
From these experiments, RBC microorganisms with an influent concentrationin the range of 15 to 65 mg DNT/L supplemented with an organic energy source(ethyl alcohol), nitrates, and phosphates; successfully blodegraded DNT but wasunstable over time. During the process of acclimation, the biomass appeared tobecome more fibrous. However, with significant influent fluctuations (hydraulicflow and DNT concentration) in the process, the decomposition rates decrease asobserved in both the bench-scale RBC and the plant scale RBC. This may indicatethat the organisms require further control of biological conditions or that Ibiotransformed products may be toxic to the biomass under certain conditions.
UV/Ozone
A Normag photoreactor was utilized for these bench studies to evaluatedegradation of DNT (fig. 110). The Normag photoreactor was selected as the mostcompatible equipment due to the ability to add ozone, provide constant agitation,control temperature, and irradiate the sample with different types of UVradiation while withdrawing samples as the reaction proceeded.
22

Im
The dimensions of the reactor were: 700-nm height, 260-mm width, and 100-nm
depth. The 350-400 mL capacity reactor uses forced liquid circulation with aglass pump and Hostaflon-coated pump rotor. The reactor required modificationto improve circulation and sampling which resulted in a larger reactor volume aswill be detailed later. The gas exiting the unit was bubbled into water toreduce any emission of ozone into the laboratory. The jacketed reaction ves;elpermitted cooling of the solution being treated.
Two types of UV radiation sources were utilized with the Normagphotoreactor. The mercury low-pressure lamp was used to produce intenseradiation at the 254-nm mercury-resonance line. The mercury high-pressure lampemitted in the short-wave UV region from aboit 240-nm to well into the visiblerange; the strongest line was 366-nm.
The ozone was produced using oxygen flowing through an Airox Ozonator modelC2P-3C-2 (Pollution Control Industries Inc). The ozonator was designed todeliver -1.5 to 0.6% ozone by weight at respective flow rates of 5 to 15 SCFH(higher flow rates diluted the ozone); however, laboratory analysis indicated
ozone concentrations of 0.47, 0.30, and 0.23% at respective flow rates of 5, 10,and 1S SCFH.
Figure III contains a photograph of the assembled bench-scale UV/ozonereactor. Figure 112 contains (from left to right) the ozonator, the highpressure mercury bulb power supply, and the low pressure mercury bulb powersupply. Figure 113 contains (from left to right) the high pressure mercury bulb,the low pressure mercury bulb, and the coolinG jacket for the UV bulbs.
Synthetic wastewater was evaluated initially to separate and quantify theeffects of several parameters which would be difficult to quantify in actualwastewater (table 19 and Appendix A). Tests 1 through 12 varied only theaddition of ozone. This was to evaluate the effect of different flows of ozonewhich could assist in designing treatment facilities that maximize ozone additionsince some locations inay contain low quantities of organics. Tests 13 through15 were designed to evaluate the effects of the high pressure lamp to compare itseffectiveness ir. relation to the low pressure lamp. Tests 16 through 27 weredesigned to evaluate the effects of solvents on UV utilization and ozoneconsumption. Tests 28 through 30 and five additional tests were performed todetermine design requirements for treatment facilities and to provide data foreconomic analysis based on actual wastewater.
Synthetic wastewater was prepared by mixing 100 mg DNT/L in distilledwater. During initial testing and modification, the Normag photoreactor wasdetermined to have a 410-mL capacity for the reactor. The selected UV bulb (twooptions) were inserted and the ozone generator (three flow rates) precalibratedprior to operation. The glass pump with the Hostaflon-coated rotor was startedin addition to a second recycle support circulating pump (installed duringdebugging). Both the photoreactor and the ozone generator were started at time
-0; collection times were varied in an attempt to minimize the loss of reactorvolume. Upon completion of testing on synthetic wastewater, testing wasperformed on actual WD wastewater utilizing optimum conditions.
9 23
I

Figure 114 contains a flow diagram of the UV/ozone reactor and the samplelocations. Sample location UV-1 is where -2-mL samples were taken at varioustime intervals of 0 (blank), 1, 5, and 10.0 min during Test Plan tests I through27 (synthetic wastewater). The time intervals varied during wastewater testingto determine the quantity of UV/,ozone required for complete destruction of DNT.Sample location UV-2 is where ozone flow rates were monitored and concentrationsdetermined.
The HPLC method was used for the detection of ONT and potential by-products(Appendix 8). Wastewater samples were diluted 50/50 with methanol to dissolveany particulate DNT and filtered to remove any additional suspended matter andstored at room temperature for no more than 3 h. A series of ten standards from0 to 200 mg DNT/L were prepared for calibration of the HPLC. After calibration,samples were analyzed with a final calibration check.
Several of the problems encountered with the Normag photoreactor duringdebugging were corrected by: (1) constructing a second pump recycle loop toimprove reactor circulation, (2) performing adjustments to the air drivenmagnetic drive agitator to compensate for pressure drops that occurred atbuilding 4703, (3) reducin -.. ,ple volume (2-3 mL) and flushing prior to sampling(2-3 mL) by collecting samples off the second pump recycle loop, (4) reducing thenumber of samples taken to minimize the loss of reactor liquid, and (5) modifyingthe off-gas port to eliminate the loss of -40% of reactor liquid during thebubbling that occurred during ozonation.
Synthetic wastewater experiments (Test Plan tests 1 through 27) wkreperformed with the exception of tests 16 through 18 (table 19). These tests (16through 18) were eliminated since prior tests indicated that ozone was requiredfor DNT degradation. Five additional experiments were performed on thewastewater prior to tests 28 through 30 in order to develop optimum operatingconditions. Finally, tests 28 through 30 evaluated different wastewaters atthese optimum conditions.
Tests I through 12 (fig. 115) evaluated the quantity of ozune fed to thereactor by varying the flow rate of ozone. (Notes: (1) all UV/ozone data iscontained in Appendix C, (2) the first min of each evaluation was excluded fromcalculations to provide time for ozone to reach the reactor and the output of theUV bulb to stabilize, and (3) the 100 mg DNT/L initial samples were nearsaturation concentration which resulted In a variance for HPLC analysis.] Nosignificant difference in degradation can be observed during the 10-min reactionperiod othe, than ozone being required for the reaction to proceed. Comparisonof tests 7 through 9 and 13 through 15 (fig. 116, indicates that 254-nm radiationis more effective since ozone flow was maintained at 10 SCFH while the high andlow pressure bulbs were co~wpared. Tests 4 through 6 and 19 through 21 comparedthe effect of the addition of -4% solvents (2% ether, 2% alcohol) on degradationefficiency. The differences in these tests (fig. 117) do not appear to besignificant at an ozone flow of 5 SCFH. Cursory measurement of COD duringexperimentation indicated that rapid stripping of the solvents occurs due to gasflow from ozonation. Figures 104 (comparison of tests 7 through 9 to 22 through24) and 105 (comparison of tests !0 through 12 t- 25 through 27) also comparedthe effect of the addition of 4% solvents at flow rates of 10 and 15 SCFH. Infigure 118, DNT appears to be removed at a higher rate with the addition of
24

II
solvents. However, technical difficulties invalidated the results of theaddition of solvents at 15 SCFH.
A sample containing 25 mg ONT/L was treated with UV radiation and a flowrate of 5 SCFH for ozone addition (fig. 119) for 10 min prior to the wastewater
Sexperiments to estimate the rate of DNT removal in the reactor. The removal of5.46 mg DNT was accomplished from I to 10 min (0.61 my DNT/min). This number wasutilized to estimate the time required for complete degradation of DNT in
.wastewater.
Wastewater experiments were performed over extended periods of time toachieve a better understanding of the quantity of radiation and ozone requiredto achieve complete degradation of the DNT. The first wastewater experiment wasfor 120 min (fig. 120) which resulted in a reduction from 106.3 mg DNT/L to nonedetected during the period 5 to 120 min (destruction rate of 0.92 mg ONT/min).Figure 121, contains the results of varying the flow rate of ozone to thereactor. As reported previously, ro significant difference was observed (-0.8mo DNT/min was destroyed for all ozone flows rates).
I Since the molar concentration of ozone for the various flow rates wassimilar due to dilution of the ozone at the higher flow rates, the mosteconomical condition 5 SCFH was chosen for the final tezts (tests 28 through 30).The wastewater for the first test was a mixture of LKL (primary) and M6
rlati,. The wasteate for the secod test was a mixture of M6 (primary)and LKL propellant formulations. The differences of DNT concentrations for thesewastewaters are shown in Appendix C. The third came from the effluent of theBWTP and even though the experiment resulted in complete removal of UNT, theresults cannot be quantified due to the effects of high solids in the effluentwastewater interfering with reactor circulation. Figure 122 contains the resultsof the first two tests. Over the extended period of time, all of the DNT wasremoved at an average rate of 0.56 mg DNT/nin. It should be noted that theefficiency of DNT removal decreases as the corcentration of DNT decreases in the
I liquid.
Since the curve represented in figure 122 is approximately exponential, afirst order plot of the data from the wastewater experiments during the period5 to 245 win is represented in figure 123. Therefore:
dc
and
In( C/CO) -- Kob,,,t
Vhere C and C" are the instantaneous and initial concentrations of DNT and Kbis the observed first-order rate constant.
2I 25
!

Linear estimation of the line indicated a rate constant (slopp) of -0.0161/min and a y-intercept of 0.19 with a correlation coefficient of 0.98.
Figures 124 through 129 represent the HPLC chromatograms for test 29 of theTest Plan. In figure 124, prior to the addition of UV/ozone, ONT is observedwith a retention time of 5.73 min. After 5 min of exposure (fig. 125), by-products are observed at retention times of 1.41, 3.35, an 3.71 rmin in additionto the DNT peak. At 65 min of exposure (fig. 126), the same peaks are observedin different proportions. A new peak appears at a retention time of 4.34 min at125 min of exposure (fig. 127). At 185 min of exposure (fig. 128), new peaksappear at 1.91 and 4.21 min retention times. After 245 min of exposure (fig.129), the DNT and essentially all of the peaks have been eliminated.
By combining a Normag photoreactor and an Airox Ozonator in conjunctionwith several modifications, degradation of ONT and several unidentified by-products was achieved. It was determined that both UV radiation (254-nm) andozone (5 SCFH) provided optimum conditions required for the reaction to proceed.Though the ozonator did not generate the prescribed concentration of ozone, datawas generated that can be utilized for economic analysis. The results indicatethat the DNT destruction rate is directly proportional to the quantity of UVradiation received by the sample. Additionally, since molar concentrations ofozone delivery was similar for all flow rates evaluated, further increases in theozone flow rate was ineffectual in increasing the decomposition rate.
GAC Column Study
A single column length of 20 in. w*as utilized for the establishmentof adsorption characteristics of actual wastewater. Figure 130 contains aphotograph of the bench-scale GAC column and its support equipment. A 1-in.diameter Pyrexs-type glass GAC column was utilized with a measured void volumeof 228 cc. A peristaltic pump was utilized for transfer of the influent to thecolumn. The influent was stored in a 55-L tank while the effluent was collectedby a fraction collector. The fraction collector consisted of 28 500-mL bottles.Connections between the components were made with Tygons tubing.
Figure 131 contains a flow diagram of the GAC column and the effluentsample location (C-I). A daily sample was collected of the effluent along witha sample of the influent tank to quantify DNT adsorption. Additionally, flowrate and time were recorded. At sample location C-1, fractions of effluent werecollected by the fraction collector until DNT was detected above the 0.5 mg/Lthreshold. This was accomplished by allowing the sample collector to collecteffluent for one to three days and utilize up to all of the 28 500-mL bottleswhile processing the wastewater through the column. These bottles were labelledand the last bottle sampled and analyzed. If no DNT was detected, no furtheranalysis was performed. When DNT was detected at breakthrough, all the bottleswere analyzed until at least two adjacent bottles contained no DNT.
FS-400 GAC trom the Calgon Carbon Corporation was utilized for theadsorption studies. The FS-400 has a density of 2.3 g/cc and a packing density
26
Ii

I
of 0.4 to 0.7 g/cc. Measurement indicated that the carbon had a void volume of69.7%. The actual weight of the carbon in the column was determined to be 108.4
• carbon per 20 in. of height in the 1-in. column. Actual WD wastewater wasutilized for the GAC column studies which contained DNT, ether, alcohol, andtraces of DPA.
l The proposed operating conditions (flow rate, total volume, anddirection of flow) for the GAC tests are presented in table 20 from the TestPlan. Originally, six GAC column tests were proposed; however, only one test wascompleted due to the extensive time required to operate the column with actualwastewater. The GAC was backwashed with twice the bed volume of distilled water(-24 h) prior to testing to remove all fine particulate, air pockets, andstratify the carbon bed. After backwashing the GAC, actual WD wastewater wasutilized to saturate the GAC. The reservoir was filled with the wastewater andcontinually replenished during the evaluation. The initial flow rate for the GACstudies was 3 mL/min; however, this flow rate was later increased to as great as16 mL/min so that the minimum of four bed volumes/h could be processed. Theinfluent pump was adjusted to control the flow to the column and a needle valveat the base of the column was adjusted to control the elution flow rate of thecolumn. Finally, the fraction collector was operated to collect 500-mL samplesuntil completion of the evaluation. Column loading was accomplished viadownflow.
Additional testing was performed to determine if the solventsnormally present in the wastewater streams could remove DNT from GAC or affectits adsorption capacity for DNT during intermittent high concentrations. Toevaluate whether the solvents could desorb DNT, -4.0% solvents by wt (estimatedmaximum that the carbon would be exposed to) were processed through the columnafter DNT breakthrough.
1 The analytical method that was used for the eetection of DNT andpotential by-products (Appendix 8) utilized HPLC as previou.;ly detailed for theUV/ozone section. This same criteria was followed with the exception that the3-h holding time for samples had to be extended to roughly 8 h to permit thelaboratory time to process the quantity of samples generated.
I During the GAC bench-scale evaluation, breakthrough occurred after70 days. Table 21 contains daily influent and effluent sample analysis prior tobreakthrough of the ONT through the column. The total volume processed was330.5 L. The influent contained an average of 197.8mg DNT/L. This resulted ina DNT loading of 65.4 g on 108.4 g of carbon, or 60.3 g ONT/100 g activatedcarbon. The Influent concentration of ether was 68.0 + 81.7 mg/L, while theeffluent was 26.6 + 38.1 mg/L. The influent concentration of alcohol was584.5 ± 925.2 mg/L, while the effluent was 699.0 ± 910 mg/L. Traces of DPA wereoccasionally noted in both the influent and effluent. No DBP was observed ineither the infuent or effluent.
Table 22 contains the breakthrough data of DNT from the column. The500-mL, first bottle after b,-eakthrough, cootaired 3.4 mg DNT/L, no ether, and240 mg alcohol/L. Approximately 22.35 L of influent were processed which
'contained an average of 278.6 mng DNTL 300 mg alcohol/L, and 250 mg ether/L.
!

DNT concentration increased to 17.8 mg ONT/L while the effluent concentration ofalcohol and ether were 250.4 ± 61.5 mg/L and 30.6 ± 37.5 mg/L, respectively.
After DNT breakthrough (day 71), solvents were added to assess theeffect of desorption. Approximately 10.55 L of influent was processed whichcontained an average of 236.4 mg DNT/L, 13,125 ffg alcohol/L, and 2,165 mgether/L. ONT effluent concentration immediately increased to 25.9 mg DNT/L withthe first bottle, fluctuated, and increased to 39.8 by the end of the period.The effluent concentration of alcohol and ether were 1:.,090.4 ± 724.0 mg/L andI,C56.4 ± 691.0 mg/L, respectively.
On day 73, the solvent concentration was decreased. Approximately16.33 L of influent were processed which contained an average of 235.9 mg DNT/L,6,520 mg alcohol/L, and 42.5 mg ether/L. ONT effluent concentration momentarilydropped to 35.4 mg DNT/L with the first bottle, and increased to a peak of 140.4mg DNT/L and ended with a concentration of 113.4 mg DNT/L by the last bottleconfirming the desorption effects observed with the isotherms. The effluentconcentration of alcohol and ether were 6,496.1 ± 751.3 mg/L and328.4 ± 300.2 mg/L, respectively.
Therefore, the column study utilizing actual wastewater achieved 60.3mg DNT/100 mg carbon compared to 80% reported in the literature for pure water.Additionally, the effects reported from the isotherins for solvents were alsoobserved. .1
ECONOMICS
Application of the particular treatment methodology for DNT wastewaterabatement could be performed at three locations: (1) at the sites where thewastewater is generated (SR, WD, wet screening, and coating), (2) at collectionpoints prior to the BWTP (MH 32 and 36), or (3) after the BWTP. Treatment at thesites would involve installation and maintenance of numerous facilities whichwould therefore be expensive to both install and operate. Treatment atcollection points would reduce the quantity of wastewater for treatment, requireat most only two treatment plants, and provide equalization of flow andconcentration of contaminants. Treatment after the BWTP poses several difficultproblems. First, the quantity of wastewater for treatment is -5 times greaterthan the quantity at MH 32 where 90% of the DNT wastewater is generated.Secondly, the residual biomass and COD present in the BWTP effluent interferesconsiderably with the treatment process. Adsorption isotherms indicated that thecompetition for sites on the carbon did not permit the DNT to be fully removedafter 1 h (0.5 mg/L remained), nor did it permit high removal (-2 mg/g carbon).With UV/ozone, settling for 30 min did not reduce the'remaining quantities ofbiomass and COD to permit proper circulation in the reactor which preventeddetermination of the quantity of UV energy and ozone required for degradation(however, complete degradation was achieved).
An economic evaluation was performed utilizing collection of wastewater atMH 32. A rough order of magnitude (ROM) operating cost was performed for thetechnologies evaluated on the bench-scale level. As previously reported in the
28

I
Wastewater Characterization section, this location currently averages 180,000gal ./day of wastewater containing 9.8 kg DNT/day. The following data can bescaled-up to handle mobi!"zation requirements.
IBiologicalI
The bench-scale RBC utilized wastewater which contained alcohol (energysource), phosphates, nitrates, and DNT. Implementation at MH 32 would involvepossibly the addition of nitrates and phosphates and the energy source would beat least partially provided by the ether and alcohol in the wastewater (theseparameters would have to be furthev defined). Biological treatment generallycosts $0.13/1,000 L or $0.49/1,000 gal. 20 Utilizing these numbers, the dailybiological treatment cost would be $88.57 (the treatment costs were notcalculated from the limited bench-scale evaluation since the reference providedknown treatment costs for full-scale biological wastewater treatment facilities).
UV/Ozone
The Normag photoreactor utilized a 15-W bulb to generate 1.82-W (measured)of 254-nm radiation (output efficiency - 12.13%) after passing through thecooling jacket. The estimated quantity of radiation that the liquid in thereactor received after compensating for the portion of output not utilized was1.19-W (received efficiency - 7.93%). Degradation of 137 mg DNT occurred in -0.4L of wastewater over a period of 240 min. The current estimated cost ofelectricity at RAAP is $.035/kWh. These figures result in an estimated cost of$372.40/day for electricity or $2.07/1,000 gal. of wastewater. If the 7.9% UVoutput is adjusted to 20% for typical low pressure mercury bulbs, the costs are$149/day or $0.83/i,000 gal. of wastewater. It was calculated that 3.76 g ofozone was required during the 240 min of UV exposure to treat a DNI concentrationof 137.4 mg DNT/h. Treatment of 9.8 kg of DNT would require 267.5 Kg ozone/dayor 588.6 lb/day. If 7 kWh of electricity is required to produce a lb of ozone,this results in a cost of $144/day or $0.80/1,000 gal of wastewater. Therefore,the combined UV/ozone cost for treatment of DNT wastewaters ,t MH 32 is $293/day.
GAC
Since the adsorption results differed for the isotherms (0.4 gm DNT/gmcarbon and 0.2 gm DNT/gm carbon when a high concentration of solvent (COD) waspresent) and the column study (0.6 g DNT/g carbon), 0.3 g DNT/g of FS 400 carbonwas arbitrarily utilized for the economic analysis to conservatively representany losses in efficiency during production operations. This would utilize thehigher adsorption observed by the column (-60%) and the 50% reduction ofadsorption due to solubilization of ONT by the solvents observed by the
1 29

isotherms. The cost of FS 400 in the range of 10,000 to 30,000 lb is $1.28/lb.Wastewater containing 9.8 kg of ONT would require 71.9 lb of carbon at this rate,or $92.03/day. Assuming that the carbon can be recycled, this estimated cost is$0.60/lb (based on previous regeneration of GAC for red water and consultationwith the vendor) or and additional $43.14/day. Unfortunately, no estimate canbe made on the operating cost of processing the carbon. Ignoring the operatingcost, it is estimated that the cost of carbon is $135.17/day or $0.75/1000 gal.
HAZARDS ASSESSMENT
A preliminary hazards assessment was performed on UV/ozone and GAC for thisproject and a report was prepared by the RAAP Hazards Analysis department(Appendix D). Safety precautions were identified and recommendations arepresented and discussed in the report.
CONCLUSIONS
1. New Federal and State regulations will necessitate the implementationof dinitrotoluene (DNT) abatement.
2. Four formulations of single-base propellant contain DNT and oneformulation requires coating with DNT.
3. The water dry (WO) contributes 75% of the DNT; while wet screening(WS) and solvent recovery (SR) contribute 18 and 7%, respectively.
4. The biological wastewater treatment plant is estimated to degrade 98%of the ONT, but excursion periodically occurs.
5. Manhole (MH) 32 provides a cost effective treatment site to interceptand treat -90% of the DifT-containing wastewaters (WO and WS). If the BWTP failsto treat the remaining quantity, MH 36 may be connected to a DNT wastewatertreatment facility at MH 32.
6. Little or no DNT bioaccumulation was observed during biologicalexperiments.
7. DNT did not demonstrate toxicity to acclimated biomass.
8. The DNT was subsequently biodegraded with -6-9 by-products beingobserved by high performance liquid chromatography (HPLC) analysis. The identityand concentration of each by-product were not determined since these materials1were further decomposed.
9. No 2,4-diaminotoluene (the reported end product of biodegradation ofDNT) was detected during the biological experiments.
30
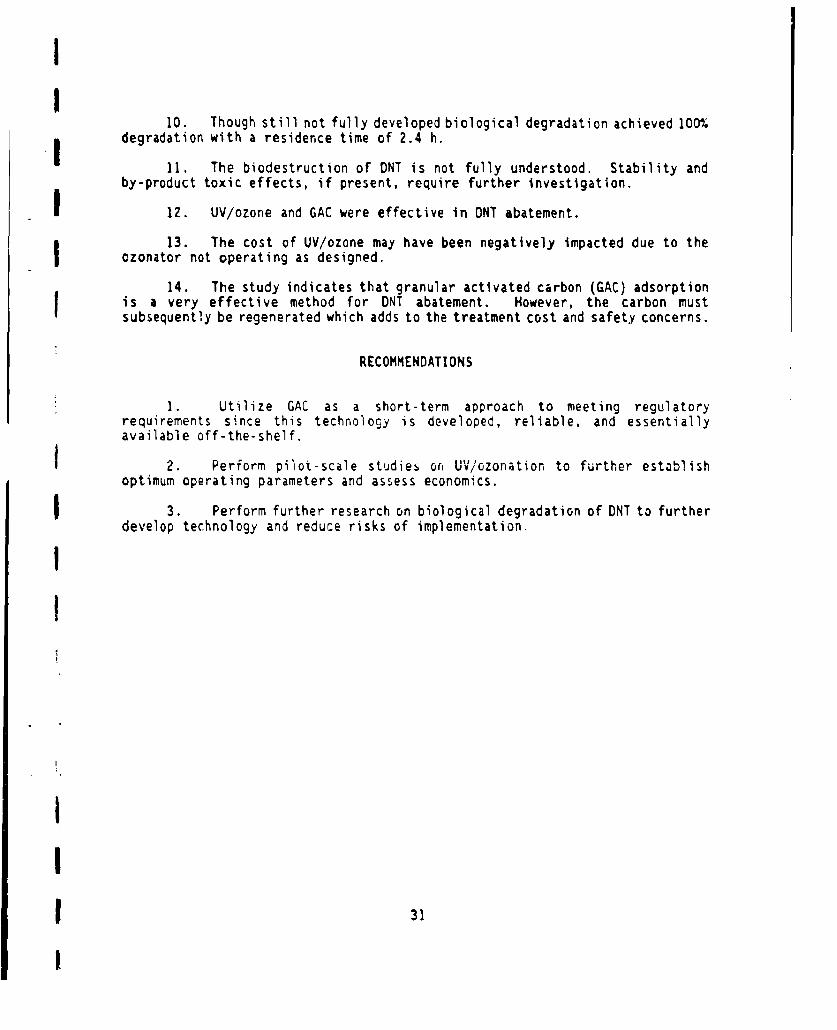
II
10. Though still not fully developed biological degradation achieved 100%degradation with a residence time of 2.4 h.
11. The biodestruction of DNT is not fully understood. Stability andby-product toxic effects, if present, require further investigation.
I12. UV/ozone and GAC were effective in ONT abatement.
13. The cost of UV/ozone may have been negatively impacted due to theozonator not operating as designed.
14. The study indicates that granular activated carbon (GAC) adsorptionis a very effective method for DNT abatement. However, the carbon mustsubsequently be regenerated which adds to the treatment cost and safety concerns.
RECOMMENDATIONS
1. Utilize GAC as a short-term approach to meeting regulatoryrequirements since this technology is developed, reliable, and essentiallyavailable off-the-shelf.
1 2. Perform pilot-scale studies orn UViozonation to further establishoptimum operating parameters and assess economics.
S3. Perform further research on biological degradation of DNT to furtherdevelop technology and reduce risks of implementation.
!I
II
1!3

3Ip
32 I
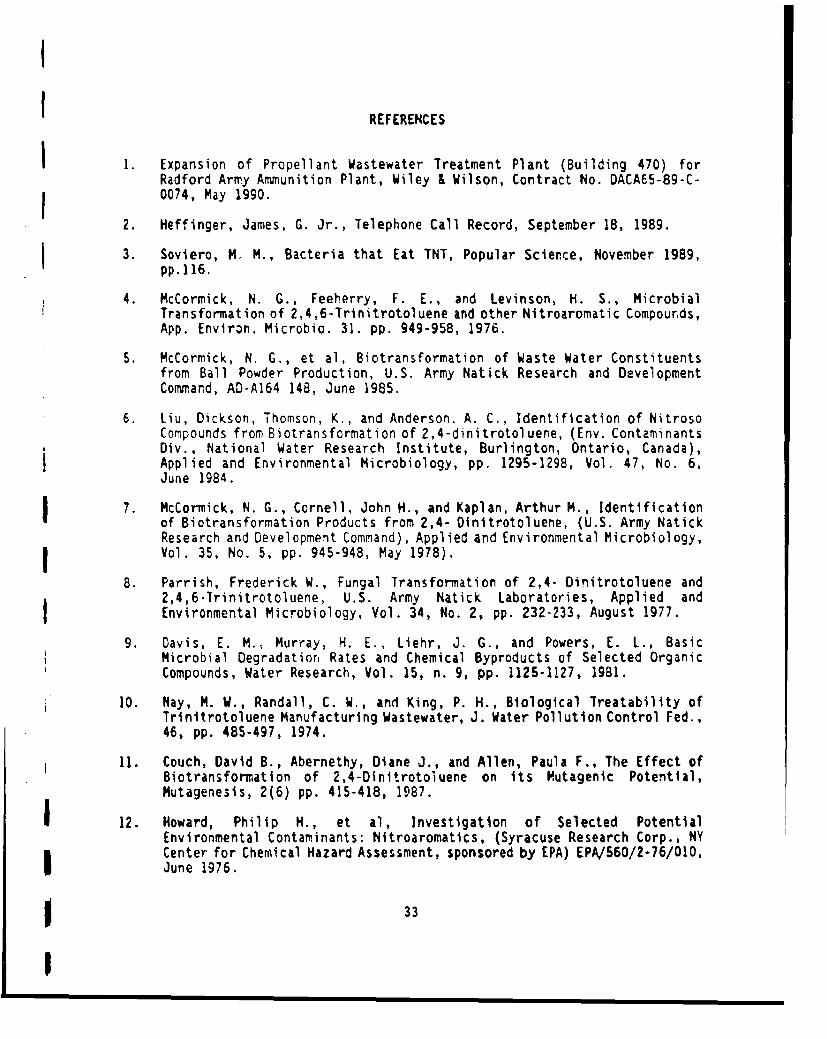
i
REFERENCES
1. Expansion of Propellant Wastewater Treatment Plant (Building 470) forRadford Army Ammunition Plant, Wiley & Wilson, Contract No. DACA65-89-C-0074, May 1990.
2. Heffinger, James, G. Jr., Telephone Call Record, September 18, 1989.
3. Soviero, M. M., Bacteria that Eat TNT, Popular Science, November 1989,pp.116.
4. McCormick, N. G., Feeherry, F. E., and Levinson, H. S., MicrobialTransformation of 2,4,6-Trinitrotoluene and other Nitroaromatic Compounds,App. Environ. Microbio. 31. pp. 949-958, 1976.
5. McCormick, N. G., et al, Biotransformation of Waste Water Constituentsfrom Ball Powder Production, U.S. Army Natick Research and DevelopmentCommand, AD-A164 148, June 1985.
6. Liu, Dickson, Thomson, K., and Anderson. A. C., Identification of NitrosoCompounds from Biotransformation of 2,4-dinitrotoluene, (Env. ContaminantsDiv., National Water Research Institute, Burlington, Ontario, Canada),Applied and Environmental Microbiology, pp. 1295-1298, Vol. 47, No. 6,June 1984.
7. McCormick, N. G., Cornell, John H., and Kaplan, Arthur M., Identificationof Biotransformation Products from 2,4- Dinltrotoluene, (U.S. Army NatickResearch and Development Command), Applied and Environmental Microbiology,Vol. 35, No. 5, pp. 945-948, May 1978).
B. Parrish, Frederick W., Fungal Transformation of 2,4- Dinitrotoluene and2,4,6-Trinitrotoluene, U.S. Army Natick Laboratories, Applied andEnvironmental Microbiology, Vol. 34, No. 2, pp. 232-233, August 1977.
9. Davis, E. M., Murray, H. E., Liehr, J. G., and Powers, E. L., BasicMicrobial Degradatior Rates and Chemical Byproducts of Selected OrganicCompounds, Water Research, Vol. 15, n. 9, pp. 1125-1127, 1981.
10. Nay, M. W., Randall, C. W., and King, P. H., Biological Treatability ofTrinitrotoluene Manufacturing Wastewater, J. Water Pollution Control Fed.,46, pp. 485-497, 1974.
11. Couch, David B., Abernethy, Diane J., and Allen, Paula F., The Effect ofBiotransformation of 2,4-Dinitrotoiuene on its Mutagenic Potential,Mutagenesis, 2(6) pp. 415-418, 1987.
12. Howard, Philip H., et al, Investigation of Selected PotentialEnvironmental Contaminants: Nitroaromatics, (Syracuse Research Corp., NYCenter for Chemical Hazard Assessment, sponsored by EPA) EPA/56O/2-76/O10,June 1976.
33
I
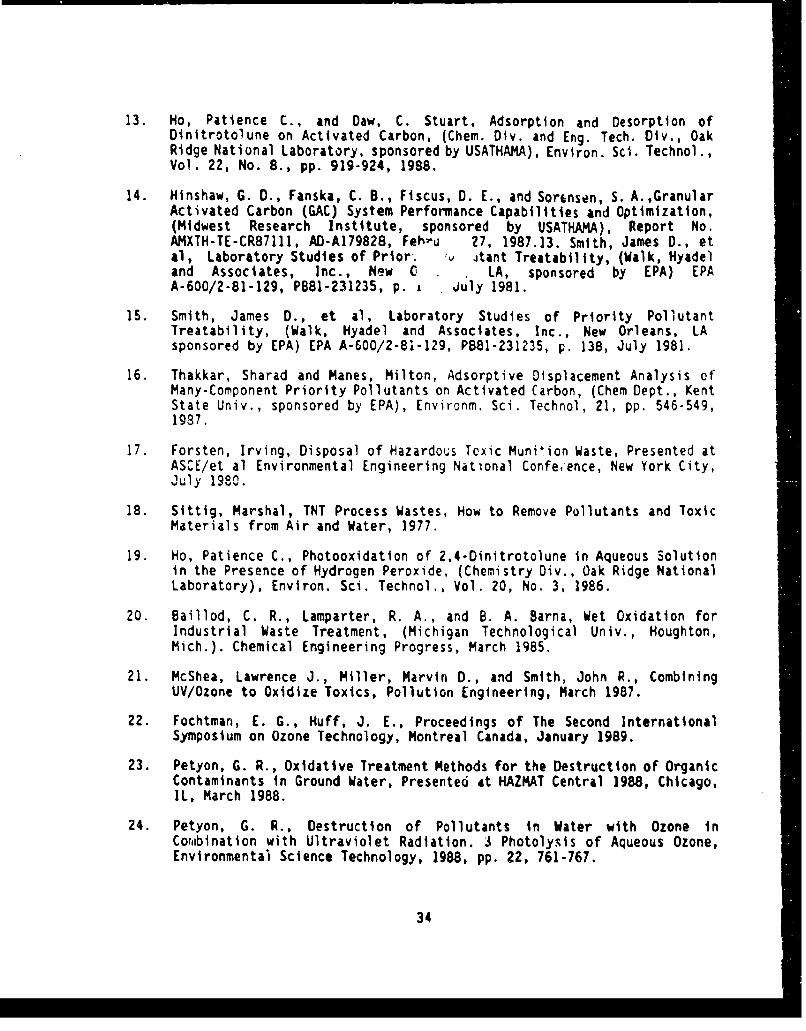
13. Ho, Patience C., and Daw, C. Stuart, Adsorption and Desorption ofDinitrotolune on Activated Carbon, (Chem. Div. and Eng. Tech. Dlv., OakRidge National Laboratory, sponsored by USATHAMA), Environ. SCi. Technol., ,Vol. 22, No. 8., pp. 919-924, 1988.
14. Hinshaw, G. D., Fanska, C. B., Fiscus, D. E., and Sorinsen, S. A.,GranularActivated Carbon (GAC) System Performance Capabilities and Optimization,(Midwest Research Institute, sponsored by USATHAXA), Report No.AMXTH-TE-CR87111, AD-A179828, Fehbu 27, 1987.13. Smith, James D., etal, Laboratory Studies of Prior. °u itant Treatability, (Walk, Hyadeland Associates, Inc., New C LA, sponsored by EPA) EPAA-600/2-81-129, PB81-231235, p. i July 1981.
15. Smith, James D., et al, Laboratory Studies of Priority PollutantTreatability, (Walk, Hyadel and Associates, Inc., New Orleans, LAsponsored by EPA) EPA A-600/2-81-129, P801-231235, p. 138, July 1981.
16. Thakkar, Sharad and Manes, Milton, Adsorptive Displacement Analysis ofMany-Component Priority Pollutants on Activated Carbon, (Chem Dept., KentState Univ., sponsored by EPA), Environm. Sci. Technol, 21, pp. 546-549,1987.
17. Forsten, Irving, Disposal of Hazardous Toxic Munition Waste, Presented atASCE/et al Environmental Engineering National Confeence, New York City,July 1920.
18. Sittig, Marshal, TNT Process Wastes, How to Remove Pollutants and ToxicMaterials from Air and Water, 1977.
19. Ho, Patience C., Photooxidation of 2,4-Dinitrotolune in Aqueous Solutionin the Presence of Hydrogen Peroxide, (Chemistry Div., Oak Ridge NationalLaboratory), Environ. Sci. Technol., Vol. 20, No. 3, 1986.
20. Baillod, C. R., Lamparter, R. A., and B. A. Barna, Wet Oxidation forIndustrial Waste Treatment, (Michigan Technological Univ., Houghton,Mich.). Chemical Engineering Progress, March 1985.
21. McShea, Lawrence J., Miller, Marvin D., and Smith, John R., CombiningUV/Ozone to Oxidize Toxics, Pollution Engineering, March 1987.
22. Fochtman, E. G., Huff, J. E., Proceedings of The Second InternationalSymposium on Ozone Technology, Montreal Canada, January 1989.
23. Petyon, G. R., Oxidative Treatment Methods for the Destruction of OrganicContaminants in Ground Water, Presented it HAZMAT Central 1988, Chicago,IL, March 1988.
24. Petyon, G. R., Destruction of Pollutants in Water with Ozone inCorabination with Ultraviolet Radiation. 3 Photolysis of Aqueous Ozone,Environmental Science Technology, 1988, pp. 22, 761-767.
34

25. Peyton, G. R., Emerging Technologies in Hazardous Waste Management, ACSSymposion Series 422, ACS, May 1989.
26. Giannoccaro, Potenzo, Pannacciulli, Emiliano, Efficient Nickel BasedCatalyst for the Homogeneous Reduction of Aromatic Nitro Compounds,Inorganica Chimica Acta V. 117, no. 1, pp. 69-74, 1986.UI
27. Cann, K., Cole, T., Slegeir, W., and Pettit, R., Catalytic Reduction usingCarbon Monoxide and Water in Place of Hydrogen, (Dept. Chemi., Univ.Texas), J. Am. Chem. Soc., 100 (12), pp. 3969-71, 1978.
28. Fine, D. A., and Miles, M. H., The Reduction of Propylene GlycolDinitrate, Nitroglycerin, Dinitrotoluene, and Trinitrotoluene on SilverElectrodes, (Chem. Div., Naval Weapons Center, China Lake, CA), Anal.Chim. Acta, 153, pp. 141-147, 1983.
29. Schiff, Leon J., Sommer, Harold A., Davis, George T., Selective Reductionof Dinitrotoluene Isomers by Ascorbate Ion, Relative rates in HomogeneousSolution, (Chemical Systems La., Aberdeen Proving Ground, Maryland),AD-A051 292, February 1978.
30. Anantharaman, P. N., and Udupa, H. V. K, Electrolytic Reduction of2,4-Dinitritoluene to 2,4-Diaminotoluene, Central ElectrochemicalInstitute, Indian Journa! of Technology, Vol. 15, pp. 122-124, March 1977.
31. Reducing Wastewater Toxicity, Chemical Engineering, November 7, 1988.
32. Gedye, R. N., Sadana, Y. N., Edmonds, A. C. E., M. L. Langlois,Electrochemical Approach to the Recycling of Nitration Waste ConcentratedSulphuric Acid, (Dept. of Chemistry, Laurentian University, Sudbury,Ontario, Canada), Journal of Applied Electrochemistry, 17, pp. 731-736,1987.
133. Tran, Tam V., Advanced Membrane Filtration Process Treats IndustrialWastewater Efficiently (Memtek Corp.), Chemical Engineering Progress,March 1985.
34. Bhattacharyya, Dibakar, Garrison, Kenneth A., and Grieves, Robert B.,Membrane Ultrafiltration of Nitrotoluenes from Industrial Wastes,Department of Chemical Engineering, University of Kentucky.
35. Michelsen, Odd B., Ostern, Sverre (Norway), Removal of Nitroglycerol andNitroglycol from a Nitration Plant Effluent by Means of SolventExtraction, Environmental Science and Technology, Volume 13, No. 6, June1979.
36. Shafer, Kenneth H., Determination of Nitroaromatic Compounds andIsophorone in Industrial and Municipal Wastewaters, (Battelle ColumbusLabs., Ohio) PB82-208398, March 1982.
37. Triegel, Elly K., Kilmer, Ounanian, Douglas, J., Solidification andThermal Degradation of TNT Waste Sludges using Asphalt Encapsulation,
35

(Woodward- Clyde Consultants, sponsored by WERL, EPA, Jonathan G.Herrmann, Project Officer) EPA/600/U-86/195, August 1986.
38. Okamoto, Y., Chou, E. J., and Croce, M., Removal of 2,4,6-Trinitrotoluene(TNT) and 1,3,5-Trinitro-1,3,5- Triazacylohexane (ROX) from AqueousSolutions with Surfactants (Department o Chemistry, Polytechnic Instituteof New York, Brooklyn) and Freeman, D., Roth, M., and Colitti, Ohio, U.S.Army Armament Research and Development Command (ARRADCOM), Propellants,Explosives, Pyrotechnics 7, 18-21, 1982.
39. Freeman, Donald J., Continuous Fixation and Removal of Explosive Wastesfrom Pink Water using Surfactant Technology, U.S. Army Armament Researchand Development Center, Dover, New Jersey, pp. 659-676.
40. Liu, D. H., et al, Toxicity of TNT Wastewaters to Aquatic Organisms,Volume 2, Acute Toxicity, (SRI, U.S. Army Medial Research and DevelopmentCommand), AD-A142 145, March 1983.
41. E. E. Ogle, Enhanced Solventless Prope'lant Wastewater Characterization,Contractor Report ARAED-CR-87029, April 1988.
42. Berkowitz, Joan B., et al, Unit Operations for Treatment of HazardousIndustrial Wastes, Arthur D. Little, Inc., 1978.
36

I
LIST OF ABBREVIATIONS, ACRONYMS, AND SYMBOLS
Term Definition
DNT 2,4-dinitrotolueneWD Water drySR Solvent recoveryWS Wet screeningCO Coating operationRBC Rotating biological contactor
Biological treatment plantUV Ultraviolet radiation
OzoneH 20 Hydrogen peroxideGAC Granular activated carbon
Biological degradationRAA P Radford Army Ammunition PlantAD Air dryEther Ethyl etherAlcohol Ethyl alcoholCOD Chemical oxygen demandDPA DiphenylamineDBP DibutylphthalateNnDPA N-nitroso-diphenylamineHPLC High performance liquid chromatographBOD5 Five-day bioloqical oxygen demandTSS Total suspended solidsSO 4 SulfatesN NitrogenMH Manhole4A 4-amino-2,6-dinitrotoluene2,4DA 2,4-diamino-6-nitrotoluene4,4'Az 2,2',6,6'-tetranitro-4,4'-azoxytoluene4HA 4-hydroxy amino-2,6-dinitrotoluene2A 2-amino-4,6-dinitrotoluene2,2'Az 4,4',6,6'-tetranitro-2,2'-azoxytolueneTAT 2,4,6-triaminotoluene2,6DAT 2,6-diaminotoluene2A4NT 2-amino-4-nitrotoluene4A2NT 4.amino-2-nitrotoluene2NO4NT 2-nitroso-4-nitrotoluene
* 4NO2NT 4-nitroso-2-nitrotoluene2,2'-dinitro-4,4'-azoxytoluene4,4'-dinitro-Z,2'-azoxytoluene4-acetamldo-2-nitrotoluene4-methyl-3-nitroaniline2-methyl -5-nitroanil ine2,4-dinitrobenzoic acid2-amino-4-nitrobenzoic acid2,4-dinitrubenzyl alcohol
37

Te-m Definition
2,4-dinitrobenzaldehydeBenz (a) anthracene-7,12-dione1,3-dinitrobenzenehydroxynitrobenzene derivatives
cc Carbon dioxideWater
H40 Nitric acidPAR~ Powdered activated carbon treatmentWAO WeL air oxidationTNT Trinitrotoluenenm NanometerFS FiltrasorbROM Rough order o, magnitude
I
I
I_
I!

II C
C IO
39C
en %n ~ CJ (,J C %j-0
V
tA to
I-Z
.0 P. 9-0
m~ ~ - C$
m~~ - t
.1. I. IV'
7 Cý __
-; -m 8 0 'm C'. c,-
3c
0' ~ O O 0)~ 393

0 L0%) I Ln
0 c~ r- - 0m co
gM CD*L. ) 0 Cý . I : C
It
aV Ck 0
0 C
T L
+, 'U
LQ w C. C
&- 11 0 ul4A =0 0 =.w L
a) 0L 0 A* MC
04

III
•. •-'I , , 2 •
-J-
•C5
1•c;l cm , °
06
0 0D
!0vc
le CLco-r
to C C -
UJ 6- C *-c
4A . - 0 d CI . 10 CCC
I-U 0 ~J I- . 001

cx x~% 0
U,~~ ~ m,a~~C Ln 3~ LCDnU, a a a a
0 C
C)~6. - -(
0v CD 'Lo
- I inI
u 01
4- - ~ 4 CD)a a
00
00
4-I P- wcU c
CU a. a a a = ,Ia
4A.. 2 CE E= uV
4-)40

Im
Iv I
m~I 4- c CO 0
00
IDI
0 ub
4)43

eco
Ae C)CDC
CC
o v co q
12
.
4.4 *0 ý D e ciC
OJOJ-
w~~l w~- --
to fu 41 u .) 0
u J vi w0 0 0A &A 0
0A c A i Sfa $
oaI.-
0. 4~J 44

.6-1
CD
CJ to 0 O 0
cr-a0 ~ 4) - 4
ME 31 zlý Cý1 h C
-0 It
C Iý
0 m 7% % m om cn m 0% vi m 0% 0r'3 c m~ t-. 0y%
4.45

-O P - - " - ~ = -- -
4.)
en m m- C7% M %
Ur)a 0 C% 47% m% CD m %D '
0A iC2 DO .
GJ- - - -
C.m
%0 .n m. 0 I.~
C,
-V~~~4 (V0t) .
or m% ON0%NC 2ýO 7 -4
- -ý -O % CD - - " M -wenI
4 V

v P, X
z A
9 8
Nm CY K
V)
-' InI'~'
I~-~ NNO ON
in~88
N'g - 1 ?KS
4- 7

0 a
8 8*WN ~ W~ 0 0 0
9 88
N NW
N48
w 'C * - NN z
OW! ~}
.- ss -- . s s -
88 N~i88:8Jl os - 00 s 00

ch &
ww
cU C m
C) C
C -l W
-e e
CDa 1 -'cr-
ow
CC
E CL
cr CIS
C.. C .- U
L7 40
c c c 0
c C)
U- a.. .0) 0 0tV- c. r_ C. r *C
-iI-
49ai/

0r%- . 0ý
&A Ln -,o42%qr 0 c 0% 0%,
CY%
Q 0 000 00 0 CD oQC ~C0% - ~ P.-~ E
0 -C
CD CDtmU
Q; C) 0- C0 0 oDQC cE en Z O% fl I % D--
o- r..i q% 0k) 0 ) P- C C
L.- 0) Z*j O l n t
Ooj- oo ouin Ln f- P.-0 %
Q Q~ CD 0 r-, 0 0 0 CD-. CD c
on I,-- - -o -'--, OC 0 f-- CD C-.
Oq 0% ýo F*- 0O C
CU lc:
4,. 't 0 Q 03 C, -
CO % C COCO mzt 0E m
CL) CLo
0)e ~i rl % C 0 0I- 1 -
~ tO 0G
gul

.0 cc o
o co
oo coP,0 Of
4A C%.)~
C.) C0.)P
-Co
fa Cý
C.0
'VC t
-. 6 . I
- 06
.0 .0'Uc_
U ., 'U t-~ D
'0 '.0 51

w0C) 0 0 0 0 00 00 00C ) 0 C DC
4 - -- 4= CW LM %0
w 0 0 0 0 40 -D fm CD00 C D C >
Q 00C 00 CD 0000CD0 ý 0 5CA %D m U' (J 0i V %D O P.
-. --- U ' ' .
0%
C; A M~ (%j qw 0D r- ý' j (' J C\
fv rA-jU U . .
0.~ U, - *---
4-J m)
o A - NJ W U' l U") %D p.
0)o
0)D
.0 o P- F.0% ý P
w) Q1 CD CJ 0 . O
- - CJ w) ) wi t n A u
4~0 0 0 00 00 00I oI I
c - c - Wi cc C-4 %D CD V, C v.0-p c t D
-l -Y ~ ' h .w t % %
LLg
52

24 6r* r1C c -N I % % r
I~ cV
C.r -.
4- f0C r %
0
L) 42 _I iA11-f Lr .1
i.{L mlifuICiJC'Ij
I.~

%D 40J
0 Z1. OI
CL4
x_ c - 1-a)t C N
LL
a)n
a)
o cTu
~~oE C-1 en i
.. DX Lr C
C~~ .0 In r..H I -
- -. L I
I~j e~ -54

Table 15. Optimization of time
Concentration % ConcentrationTime (min) WH FS-400 (mg)__ (mg/L)* remaining
0 --- 219 100
60 20.3 177 80.8
120 22.6 138 63.0
150 21.6 151 68.9
180 26.0 151 68.9
210 20.7 132 60.3
240 20.5 133 60.7]
*All concentrations have been normalized to reflect adsorption by a20-mg sample of FS-400.
Table 16. Adsorption isotherm for water dry water
Final concentration X/MWt FS-400 (g) DNT (mg/L) (mg DNl/g FS-400)
--- 229 ---
0.0257 177 202.3
0.0521 138 174.7
0.0774 100 166.7
0.1038 70 153.2
0.1286 60 131.4
0.1606 33 122.0
0.2019 10 108.5
0.2512 7 88.4
I
I

Table 17. Adsorption isotherm for solvent-fortified water dry water
Wt. FS-400 X/M(g) Ether, % Alcohol (%) DNT (mg/L) (mg DNT/g FS-400)
--- 0.610 1.485 168 ---
0.0304 0.303 1.466 154 46.1
0.0496 0.339 1.458 118 100.8
0.0776 0.389 1.457 93 96.6
0.0993 0.381 1.461 72 102.9
0.1245 0.310 1.466 44 99.6
0.1503 0.?18 1.459 38 86.5
0.2078 0.320 1.482 17 72.7
0.2506 0.237 1.490 I 10 63.0
Table 18. Adsorption isotherm for plant effluent with DNT
Wt. FS-400 (g) DNT (mg/L) X/M(mg DNT/g FS-400)
1,327 --- -
0.0116 1.123 1.759
0.214 1.021 1.430
0.0321 0.802 1.636
0.0507 0.502 1.627
56

Table 19. Test mtrix 'or OT d1radation by Mfozonatro
Desired DwT Ozone flow rateTest No. conc (mg/L) LN bulb type (SCPF) SoLvents in water (wt %)
1 100 Low 0 0
2 100 tow 0 0
3 100 tow 0 0
4 100 tow 5 0
5 100 tow 5 0
6 100 tow 5 0
7 100 tow 10 0
8 100 tow ¶0 0
9 100 tow 10 0
10 100 tow 15 0
11 100 low 15 0
12 10C tow 15 0
132 100 high 10 0
142 100 high 10 0
152 100 _ ¶i7h i0 0
16 100 opt ituP 0 2.0 wt Z other, 2.0% ethyl alcohol
17 100 optiniur 0 2.0 wt % ether, 2.0% ethyl alcohol
18 100 opt ihnfJ 0 2,0 wt X ether, 2.0 ethyl alcohol
19 100 opti. wr. 5 2.0 wt % ether, 2.0% ethyl atcohol
20 100 opti 5 2.0 wt % ether, 2.01 ethyl alcohol
21 100 Optimup 5 2.0 Ut % ether, 2.0. ethLt alcohol
22 100 optimumr 10 2.0 Ut % ether, 2.0% ethyl alcohot
23 100 optimum 10 2.0 Ut % ether, 2.0% ethyl tlcohol
2__ -- 100 opti"5Y 10 2.0 wt % ether, 2.0% ethyI alcohol
25 100 aptim. 15 Is 2.0 wt Z ether, 2.0% ethyl atcohol
26 100 optiaum I5 2.0 wt % ether, 2.0% ethyl alcohol
27 100 aptlmM 15 2.0 wt % ether, 2.0% ethyt alcohol
28 w.stgowter optmi _ _
29 westeweter opti" _ _
s0 wastewater CPOI
'Additlonal testing will be performed as determined necessary for economicand design requirements
2Testing with the high pressure bulb will be expanded if results aresuccessful .-
I

F ~ -r
>r
-c
01 1 41 41 *40 +0 0. .-
a 31
03cL 3t I cc 3t3 t c L3
G) .3
-,->)- %J(.
CD C)L0DC) C 0.0 , U)0
0)0
40 Q 6 v t O0 .(v O 40 to
tv~e 3t V.% c j L ttAXt
- 0- -l -l -3W= - =.1
x 0.0x .
0DC 0 D 0 0
0)0 - (.JC3, 14D t 0
58

Co CD 4= -c- co mn F.-- m
4. m
ccc
a0
0E~
0 m c o -i
0k 0 0
r- U
to
C.~
0 C 01 e 0 00l
Cý ~ ~ ~ JW z 0w s. -00v IC- 4II4.)59

CC
0 0D 0C ~ ~CD
C)
C-
oo Co~ a atc C z
41 '40 -4W0 'o C 0 lD 0 00 00L n A ~
0 60

4J~~ ~ ~ enz)C% D mza
Lf 0 % %0~ '. o
4-JJ e-
0))
a CD ~0~ 0
- .0a:- Z ZnJ M n O41
LU I
CO -r(0 - 4
a) 0 el -I
M '0m- 1r 0L %J co
61

Table 22. GAC column after breakthrough
i..- ,__ Concentration (m/L)
Run Aliquot Aliquotday No. vol (L) DNT Alcohol Ether DPA DBP
69' 1 500 3.4 240 NO ND NO
2 500 3.4 230 ND ND ND
3 500 3.2 190 ND ND ND
4 500 4.0 160 ND ND ND
5 500 5.1 200 ND ND NO
6 500 5.1 190 ND ND ND
7 500 5.8 230 ND ND ND
8 500 6.8 310 ND ND ND
9 500 7.4 300 ND ND ND
10 500 8.8 250 60 ND ND
11 500 7.3 240 NO ND NO
12 500 8.9 220 ND ND ND
13 500 11.1 280 80 ND ND
14 500 10.4 290 70 ND ND
15 500 11.3 280 ND ND ND
16 500 10.0 300 ND ND ND -
17 500 8.9 160 ND ND ND
18 500 7.7 310 ND ND ND
19 500 6.6 310 80 ND ND
20 500 4.6 300 ND ND ND )21 500 5.2 300 60 ND ND
22 500 4.5 320 70 ND ND
23 150* 4.6 290 ND ND ND
70 24 500 4.6 310 90 ND ND
25 500 4.3 280 ND ND ND
26 500 4.8 210 ND ND ND
27 500 5.1 160 ND j NO ND
62-

Table 22. (cont)
f-
Concentration (m /L)
Run Aliquot Aliquotday No. vol (L) DNT Alcohol Ether DPA DBP
r 28 500 5.5 210 ND ND ND
"29 500 2.9 190 70 ND ND
_ _30 500 5.5 140 ND ND ND
31 500 6.9 280 60 NO ND
32 500 7.5 300 ND ND ND
33 500 7.7 130 ND ND ND
34 500 8.0 320 90 ND ND
_ _35 500 4.1 280 ND ND ND
36 500 9.4 310 ND ND ND
37 500 9.7 200 ND ND ND
38 500 10.5 190 70 ND ND
39 500 11.7 170 80 ND ND
40 500 12.3 110 80 ND ND
_ _41 500 13.6 320 90 ND ND
42 500 14.8 310 80 ND ND
_ _43 500 14.9 340 80 ND ND
44 500 16.9 290 60 ND ND
45 500 18.4 290 70 ND ND
46 200* 17.7 280 70 ND ND
71b 1 500 25.9 12,750 250 ND ND
2 500 38.0 13,570 1,750 ND ND
3 500 38.5 13,470 990 ND ND
4 500 37.0 13,630 1,060 ND ND
__5 500 38.4 13,540 500 ND ND
6 500 37.5 13,670 1,360 ND ND
I_7 500 38.8 13,790 1,040 ND ND
8 500 38.1 13,860 2,270 ND ND
63I

Table 22. (cont)
I Concentration (mg!L)
Run Aliquot Aliquotday No. vol (L) DNT Alcohol Ether DPA DBP
9 500 36.2 13,800 1,780 ND ND
10 500 33.4 13,560 1,780 ND ND
11 500 29.2 12,280 290 ND ND
12 500 26.0 12,120 ND ND ND
13 300* 18.11 11,210 110 ND NO
72 14 500 18.8 11,540 1,430 ND ND
15 500 20.0 13,150 1,540 NO ND
16 500 19.7 13,460 1,970 NO NO
17 500 23.2 13,350 1,880 ND ND
18 500 28.1 12,950 590 ND NDND
19 500 29.0 13,200 910 ND ND
20 500 32.1 13,280 1,160 ND ND
21 500 34.5 12,920 460 ND ND
22 250* 39.8 12,890 120 ND ND
73c 1 500 35.4 9,190 490 ND ND
2 500 36.0 6,730 ND ND ND
3 500 38.3 7,170 820 ND ND
4 500 43.0 7,140 700 ND ND
5 500 47.8 7,180 850 ND ND
6 500 55.0 7,090 660 ND ND
7 500 57.6 7,200 840 ND ND
8 500 63.5 7,120 540 ND ND
9 500 64.5 7,070 940 ND ND
10 500 67.2 6,780 540 ND ND
11 500 70.5 6,740 600 ND ND
12 500 74.0 6,780 730 ND ND
13 500 72.3 6,770 480 ND ND
64

Table 22. (cont)
Concentration (/L)
Run Aliquot Aliquotday No. vol (L) DNT Alcohol Ether DPA D BP
14 Soo 76.0 6.870 1,180 ND ND
15 500 80.6 6,690 590 ND ND
16 5U0 82.7 6,560 580 ND ND
17 350* 88.2 6,750 270 ND ND
74 18 500 92.9 6,410 ND ND ND
19 500 92.1 6,360 40 ND ND
20 500 93.5 6,390 420 ND ND
2] 500 101.7 6,460 420 ND ND
22 500 102.2 6,300 210 ND ND
_ _23 500 107.0 --- 400 ND ND
24 500 118.9 6,250 140 ND ND
_25 500 109.3 6,610 490 ND ND
26 500 115.0 6,450 230 ND ND
27 500 105.4 7,050 410 ND ND
28 500 106.0 7,120 340 ND ND
29 500 106.4 7,160 660 ND ND
_ _30 500 95.1 6,860 230 ND ND
31 440* 91.7 6,790 180 ND ND
75 32 500 --- 6,470 80 ND ND
33 500 111.8 6,650 290 ND ND
34 500 117.4 6,390 190 ND ND
35 500 124.4 6,410 ND ND ND
36 500 125.0 6,500 160 ND ND
S37 500 126.5 6,520 110 ND ND
38 500 132.2 6,450 80 ND NO
39 500 130.2 6,?60 ND ND ND
40 500 140.4 6,470 90 ND ND
I6$
I

Table 22. (cort)
Concenetraton m/L)
Run Aliquot Aliquot
day No. vol (L) DNT Alcohol Ether DPA DBP
41 500 136.3 6,410 160 ND ND
42 500 134.6 6,260 ND ND ND
43 500 132.3 5,590 ND ND ND
44 500 133.1 5,570 140 ND ND
45 500 133.2 5,270 ND ND ND
46 500 129.3 4,460 ND ND NU
47 500 122.3 5,110 ND ND ND
48 500 121.9 4.960 ND ND ND
49 500 122.4 5,250 80 ND NDii50 390* 113.4 5.270. .10 NO
' Period following breakthrough. Ib Solvent addition.c Solvent reduction.
* Last sample in fracticn collector. 1II
I
II

z: 4 0
U~JLJ!
17-
Li- 0jozi
U) )0 4~ 1 V)
CL.C)
I''

R- , ,v; a "-
"~U
r
C - •I I - ,' .
*-I. *,•" .I - -
I IL-
C~% :;~
el I-- r-V
10: .: ýL _-i_I -
-CI

IxwIf
I. -J
-J
/ 7LJ

U,
ix
(r
4L
to~~~~c LhLqaiato ai
*)
C31
10 a
II'-
ILII3- the equali za ion bIsIi

I
I. I
r
S€I-,
(0J
(T. m T.
W Co
\4
LU J
I Cn
fiur HPLC choatga of *1'nlun
to th ne *w RB
AN~O ~ I
!I

SN
w cT '0•U
-- 12
' a•
w
r,,F44 1' It -'li m
t 0 R BC'sC Ifl VC
Figure 6. HPLC chromiatogram of influentto old RBC's
72

t.o K h
M
J
N
N
c wW ,M N.' I-
U
I- o
D - .t '13
"I-. Ic -
- i
• Figure 7. HPLC chromatogram of effluentS~from old RBC'•
1
!!
73
i

r -
* -
a: --
-J
Li
w -
Ll
IL !
Nj
Figure S. HPLC chromatogram of clarified effluent
Idl
N N Q(
74* w~

0
cIrUU
CLF-8
UJV)
0 1
I
N -7
!_II 10 1
O NO±.Výi:N30NOO INC 4Z'?
I7

on o 0~ ,0 o
oliii 0Co
oLL.* 0)
I j
W 0Lt C) J
E7

CO-W
M-.
S0
I--
a: N
F . Vr
OLLL
zz
Figure 14. Chromatogram of respirometer sample after
140 h which originally contained 150 rng/L ONT

r-
UJ
a 'Iu.J
C• U'
C +J
CO w
(N
MW M 02 W x 0
CO N.9.- -'* *• 0• Li.
. 03 I- •
c- t- oC.,
P I•(Ap W
Figure 15. Chromatogram of respirometer sample after
140 h which originally contained 200 mg/L DNT
I!II

M "'I
-r
C
t4.T -J
W 0
M t
~€
CO W % M
-i i
MM
8-W
II~)
Ck
CW
Fiur 6.Croatgamo rsprmee smpeafe140 whch oigiallyconaine 25 mg/ O+
82w

(7, M D D
SOCJ i • "a: t "rf) F , it a, a, I') t
r +C4 0 T 0, 7,- M M~ 11 o
L~~ ~ I.- T -" t,' 1, LO M' LO W' L~I -t4 CI X 01 N- kD) "1 , " , G 'D
IL"II
continin 10 see
M Ni -
"" U)
P,3
!.

1C-)
0 '
co N
Cm0F-I-0
CC <
0 V-Cl) ZZ
E a 0 000E L 0~ -~L) 0 to) 04 \ \
00C
00 0(D l) IICID C'j l

0LL cv -~
co0
I xv.
LLNI-
o zZ Z Z
ji E' -
a: 0 0 0 4
*o 00-
0 00 0 0 0 00 0 0 0 0 0co - CV) j m

~~ jo
o~j
LU;
I,'-'I_-
CL E. EI- E- E
WL c 0 o 0 LO o
00
00 0 0 0 0CO 0i 0' 0~
26)

0
L-
oi
(P 0 c H
_ *1
0000
00 Eco r J- E ~ 0 0 0
0)j 0 0 0 to 0 fLO occ E L) 0 1O y-J - C*Y
o 0 0 0
8 7

U"SIr".. - J
6 'X
• . . . , • • ,• -, • --
CzCI
Figure 22. Chromatogram of respirometer toxicity test No. 5with initial DNT concentration of 0 mg/L
.8.\

U, jC J
a
F. C t of r ..
I
II
Figure 23. Chromiatogrami of respirometer toxicity test Nio. 5
with initial DNT concentration of 50 mg/L
I'I
II
I

I
= II
NI
I
,Lm
909
CL v0 Nj X
N .V W )C
- Uj
Figure 24. Chromatogram of respirometer toxicity test No. 5with Initili ONT concentration of 100 mg/L
9 0

LC
11
PCO
CC N -
"N -r
i .
J 0
Figure 25. Chromnatogrami of respirometer toxicity test No. 5with initial DNT concentration of 150 nig/L
I
I,i ¢"', o •91
I, o+

CC
I.;r
figre 6. hro~u~gra ofresil~metr txi~tY týS N -
within~tal NI cncenraton o 200mg/

S I, IL c I
L,.
S -
ICm
-"-
I; -
Fiur 27 Choaormo -prmtrtxriyts o
- - -
I •
Figure 27. Chro-atogram of respirometer toxi'.ity test No. 5
with initial DNT concentration of 250 mg/L
, I! -3

• _
S.-
--..
Fiue 8 hrsV tgra -frsioee oiiyts owith* inii. N *ocnrto of0IJL(10 e
- U, C - 0

j *, --
CC 0. r. r*. -i-'
SC C r)-. . ..
Q.j.! -
Figure 29. Blank biomass/bioreactor chromatogram on day 0
I- z,
! %'i

) -
II- -•| -
I
Z - j --
"C -C- .,
I_
I-

;..' 1.r+,+
p- -; r
Or,. - - , -c.
T."".
C --C -
1I~~LW~
Figure 31. Blank biomass/bioreactor chromatogram on day I
I9I 97
I!m1, mII II m

"T..
I: CLl. C-
'b. tT.
St
""I
Figure 32. .NT supplemented biomass/bioreactor chromatogramon day I
98

I
I!I
.r.
7
I-6- ...,..
S-,,v-• C- - ,
•. •.: • '
!~
figure 3 a. Blank biomass/bioreactor chromatogram on day 4
II
l •99

i
II
I
-* -
- I
Figure 34. DNT supplemented biomass/bioreactor chromatogram Ion day 4
I1II
- _ I100 1'

I
I
~ *• . r-,
6.j: T• :r'- •.•
C
Figure 35. Blank biomass/bioreactor chromatogram on day 6- -I

a.
r4 r
I/ l .. , u I h.. uJil o" ' , .•.:- .- •
- I
I
Figure 36. DNT supplemented blomass/bioreactor chromatogram
I-Figur 36. on day 6
102 J

I,
I . -
4-J
!j
1'5"
U0.
Figur 3

' .
7-
,-j
Figur 38. DK upeetdboas/ira rcrmtga
S.
IFigure 38. DN supplemented blomass/bioreactor chromatogram I
on day 7
II
104 J

I = -
I2
Ipm~~ JrftU
UC
Fc
( 9 J w
S- ' C
Sa..
a Figure 39. Blank blomass/bloreactor chroniatogram on day 8
I1. 1OE
I

,'4-
.. " , Q,C o
-- -
Figure 40. DNT supplemented blomass/bloreactor chromnatogramon day 8
10
tI
10
In .,.

I6
CIII - C
~~i1 37

2 1
ve-
-- .'A" -
2 I...-I~J
Figure 42. DKiT supplemented biomnass/bioreactor chromatogramon day 11
I.I
,, I *d --
- .,
S.. ., , , , u I I I. I I I II-

I!-
.I-
I
"": 'm
I
ii -
-. 9 I -
-4 f , t.
I Ftgure 43. Blank biomass/bloreactor chromatogram on day 12
I10
!

2,- --
aJ
r~U.
4pImM ,. I.
.yuC 0 i
eC
Figure 44. I)NT supplemented biomass/bioreactor chromatogramon day 12
'I I '

It
44.
W CO- rc
to Q
60 II
-cL&J
Figure ~ ~ ~ ~ ~ ~ ~ '- ~~ 45. Bln ims/iratrcrmtga ndy1

L.
C-c
6MCQ
to 'M
-c
S2 c
4c -- C"'L
LA.J- W1 wI
c~ 4-' -
e., CI-
SQ.C~
dc - 0C=
L c- - U4c C
0 -0 U=- c -a UC 4c 4c
z 4cc
Fiur 46 -N upeetdboas/ira rcrmtga
ondy1
U K C .112
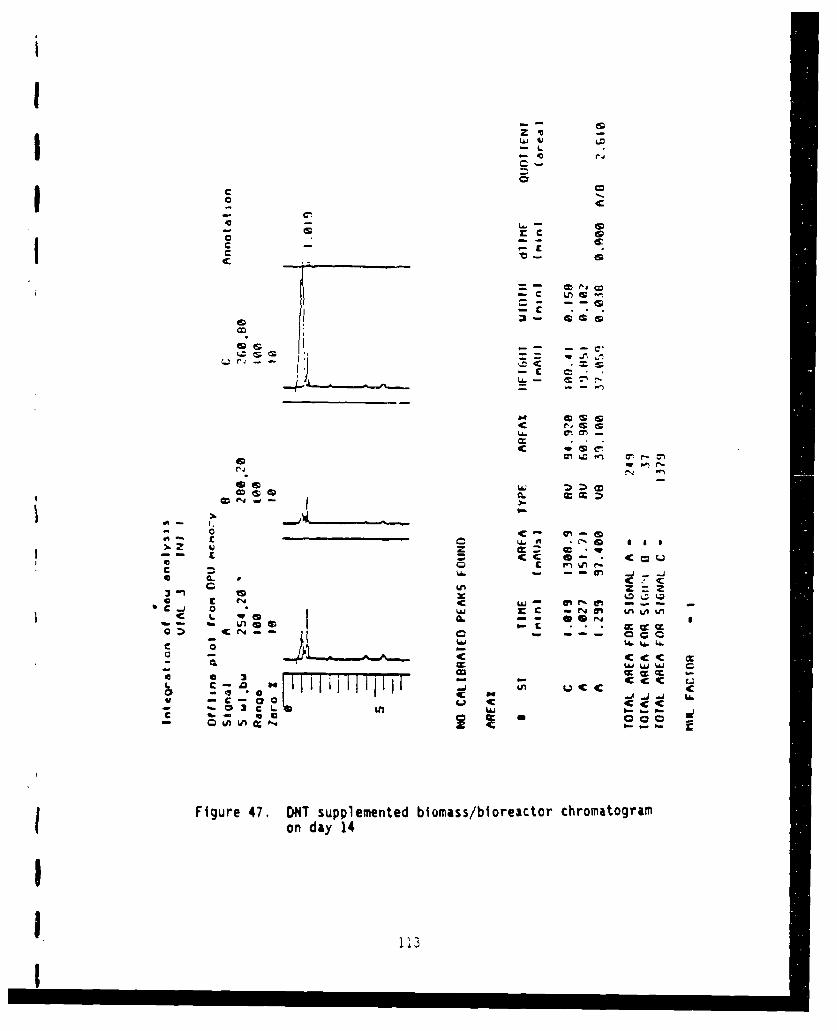
IzIL~jLO
-L
CC
C C,
a acCO
a:g _ _ _ _ _ _ _r €-*&•
I. 4D"s
c-
Q • *~~-- -- IC. :€2
-4- -c - -
% o
S~113
-IC- a -

Lnz I LDLAJ
2 Is
c
CMI Cj LrIc C
Ln 6M
cz
00 CL
L
0 Ic a 0C W
LM a:
c 'C -C is Cem
c cr4 CL
z z3 .P
t. la MIS rn- c Lq C . . . = =
0 c cUi W. U. 6.
a Ic%a=
Ic -CL ca 4c
c 0 Q ýc 4c 4c 4c
SA in cr z qc
Figure 48. DNT supplemented biomass/bioreactor chromatogramon day 14
114

I
II
I Q~r- ur
F r 4. Blank -
115
I
I 115

- LU * * * * .
* i .) . .r' %- j '
r - - []
, -' . -,
-Z -7
Figure 50. DNT supplemented biomass/bioreactor chromatogramon day 15
116
Ii

I*N .
Sm 7S i • cmm r. ITq
C ," ,• -" N - .
It V
'" , '.•1 ,-,, •1•17
- - .,. U. . . .
II
Figure 51. Biodegradation chrornatograrn ofseed at 0 h
I
1 117
I

/
iW
qr c
r.
LUa -
ri
I- J
Figure 52. Biodegradation chromatogram of initial nutrientwater at 0 h
1is
I I m* * m m mI m m-m m m m m m m m m m m m I 'I i i i

fljI- •
X .7
SFigure 53. Bio~le radation chromatogram of reaction
vesse• I at 23 •1
I
I i
S119

ft -
VI-
Figure 54. Biodegradation chromatogram of reaction I
vessel 2 at 77 h
N.,

II
I Th.
*- I
I -.
I I , , • .,
IN-
Figure 55. Biodegradation chromatogram of reactionI vessel 3 at 95 h
II'
12
'I_1 11 11 1

/
II.
.w.
Lz~ýj F% a N If 1.1 Z"• I•C '-- ,3 --
.- \-• -
- .. . . .L,!
- . .5
Figure 56. Biodegradation chromatogram of reactionvessel 4 at 119 h
122

1j'r~.
C
LM
I
-JS
Figure 57. Biodegradation chromdtograin of reaction
vessel 5 at 144 h
I
-I I -

Li
- I
b V.
cm 3
Figure 58. Biodegradation chromatogram of DNT blankat 168 h
I
1.24

./
I
I
' i'II
* -N - - -
N -
1K 6
I I a 112l a5
I" i
~IIFigure 59. Biodegradation chrvomatogram of reactionvessel 1 at 168 h
i
I1 125
I

/
It--
IrI•, N - --
.x:- -- ,
,J,, Q-- . . . .
I)Figure 60. Biodegradation chromatogram of re&-tion
vessel 2 at 168 h
126

IIIiI
am -
S. -
!
-o
Fiur 6: idgsalo hoa m ofrecto
• -
I
J 127

•0I -,.f "J* . . .,- • -
x N
Jbb
Figure 62. Biodegradation chromatogram of reactionvessel 4 at 168 h
I1123
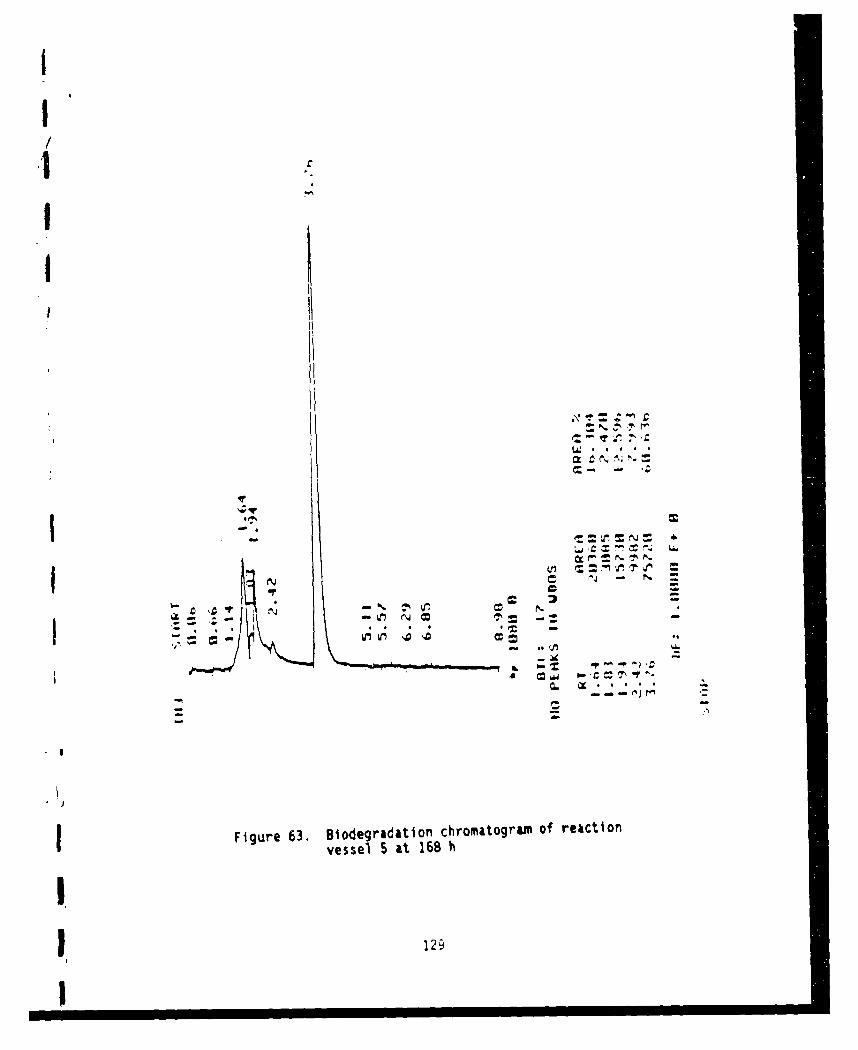
Im
1' r
II
IA
C P7
C- --
112
II -A
I Figure 63. Biodegradation chromatograw of reaction
vessel S at 168 h
II12
!

, . . '. . .
figure 64. Biodegradation chromatogram of reaction
vessel 6 at 168 h
II- I

II
I -
S= -
C.
--
Figure 65. Biodegradation chromatogram of reactionvessel I at 22 h
I
I

*1.°S. -- "
"K - *
Figure 66. Biodegraaation chronmatogram of reaction
vessel 2 at 94 h
I
1322I

III
I
.,- , -
'i1
ii - -
" I h " ' .f: ? ' --
/ :== ~-...- ,
S- =
Figre67 .lerdto cho- tg o e-to
I 133 --
I

wC
I I I I .I II I d. I II I II •.' i ~ * .
', ~. *lj
A C,
II, ,- '._ - .
Figure 68. Biodegradation chromatogram of reactionvessel 4 at 142 h

I!!!
n,7,
vessel 5 at 166 h
I13
i i35~
-!

71 I
143
'~ I
Figure 7C. B1o~egradation chromatogram of reattion1vessel 6 at 190 h
I136 I
I

IIII
-- i ... .7-- ,
- I- 4
"- 'K ..
Figure 71. 8ioderldatio" chroffatogrili of nutrient
I!
I 137

= --
- - I
I
I
I
I
138

ILI
II1
s *"~ ~
1 -lI~ -
_Ii, r- .- ,
,,. - -.;.
-K II-- •-- *. - - '- -
-- !
Svessl 2 a 264Figure 73. Biodegradation chromatogram of reaction
vesl2a 6
II3

I
.|1
LI o
'IFigure 74. Biodegradation chromatogram of reaction
vessel 3 at 264 h | I
II
2:_-_

iIIII
I
Fiu e 75 Bidgadto crmtga of eci onvessel~* 4 a 24
14',
•- _
I = +-.. l- . . .-
S .b- , .-
- IFigure 75. Biodegradation chromatogram of reactionvessel 4 at 264 h
I
1 141
I

i.1=
•,.1- J •. •,
* I
- -
-I- -J --
I-
Fig'are 76. B~odegradatlon chromnatograni of reactionvessel S at 264 h I
142 I,

i
II
I
x. . 0 ev
7.: "
I - , -
-...
i-
Figure 77. Biodegradation chromatogram of reaction
vessel 6 at 264 h
I
I

Il I4 IIIIi i
a '~a
.L -Z -
- ;,, (• N ,
• - ,N --
LCC
C -
Figure 78. Biodegradation chromatogram of reaction
vessel 7 at 264 h

I
I-I.
F u 79..ion cr o
Figure 79. Biodegradation chromatogrami of seed at 0 h

U -
.jj
II
Figure 80. Biodegradation chromatogram of nutrient i;aterat 0h
-Ii . . 6l.&
-N NC

I a
i .
I
II
Fi ur 8 .io eg ad ti n hr ma og am o reac io
vese a 2
'b. N
** U*I

4
° ,.
• 'j ,'J .',j r' ,• --,•
-- LC N�.- C -
. -- II!- r" , =
CL
,., . . a .
III!
Figure 82. Biodegradation chromatogram of reactionvessel 2 at 48 h
I
I•8 I
I'

i i l II III Il.I I II II II II
C/7m
C% Z
C|Cn
iL T
rvsse 4 at 170J h
14 9
-- a
2. . °° "
If *
vese 44t1.
I
I
1 4
II I I I I II I I I I I I I

,J •I~' -~
C.,
,- - . . . . . . .
igure 84. Biodegrad~ation chromatogram of reaction
vessel 5 at 216 h- * -

II
I .r
"r•. .* -- '....-
I : NE C
Figure 85. Biodegradatior chromatogram of reactionvessel 6 at 264 h
I1 '15

em
.'~~4 - -rI
- - -|--
Fiq• 1re 86. Biodegradatjon Chrornatogram ofseecj at 337 h
2:)

ICI
,'
cj
. �
e.
I •d
.3 -
F~gure b i.Bodegradation chromatogram of nutrient water
at 337 h
I -
-

tAn
Figure 88. Biodegradation chromatogram of reaction
vessel 1 at 337 h
I...
I~ ~

I!I
I - I
,• -- , ,-
.• • w .* " 'P
I
-I-

,,0
r,.
I *= ' - ,.\ . . ..*4
II-
,I i ' r,,. "iI = -: • -
I, .- ,, "- r " j.- .S• • e o o •
Figure 90. Biodegradation chromatogram of reactionvessel 3 at 337 h
i•.6 J
I.

1
II'I
I-
:•,
a. - .=.
Ih
II
-Fi ur 31
i d g a a i n c r m t g a f r a t o
-
II
I•

F• , .i -Bg a .ct
- 5
• • • - -, -. -
~. N -
Figre92. Bidegadtio cromtora o rectiovesse 5 (tj37-

II
I•' -... ~, •
Se4 -
A . • .. .. .
Figure 93. Biodegradation chromatogram of reacticnvessel 6 at 337 h
I!
S I ,_9

Nq
W..
IIA j
- , - , -
Figure 94. Biodegradation chromatogram of reactionvessel 7 at. 337 h
-. .0
illll llll lllll llll

IIIII
C
CmCC-i
tz"
_ C.
C=.
- - -1 --- -
1.L.
/ • .
_ /./ I "
I • • •'- ---

I::::.
.................
I .
K: :<:��I 1=
A s----
.. . . -4
:4 . . . 4 � c.r�4> * . - c...
I __ Er..
.. . a-. -. 4
. -ii.... __ 0-'
* . ��::: 1. .. . . I
OC)* . . . . c..�]
= -�'1�*�� -� C)
I.-
-I* . . . �1
................... 1*1-i
-II =C�
- ... I:::::I'',,,, i
-4
-- 4
cm

I
*i i .ii i ]_ .•* . . •
*- : :......r.4
* .. . ,..•
I.... .
I ... .. :S .. '-
- -.... .- -i---
I-:: : -•S...• . •• •-•
S.. . .I • '. i ". • ' -"- ¢
.. .F c./ c °j
.4... ..
...... C.-•--
c...i~ i, , Q .I
• ---
I.•?. -
.! . ,.-

I . .
2 o
o * . .
-, Eo .
. 7jz J 9
* 1
:.. .- 4--- -kC
* . . .°
• . ,
>LIL _ o• o ,
• , .
,,'I!
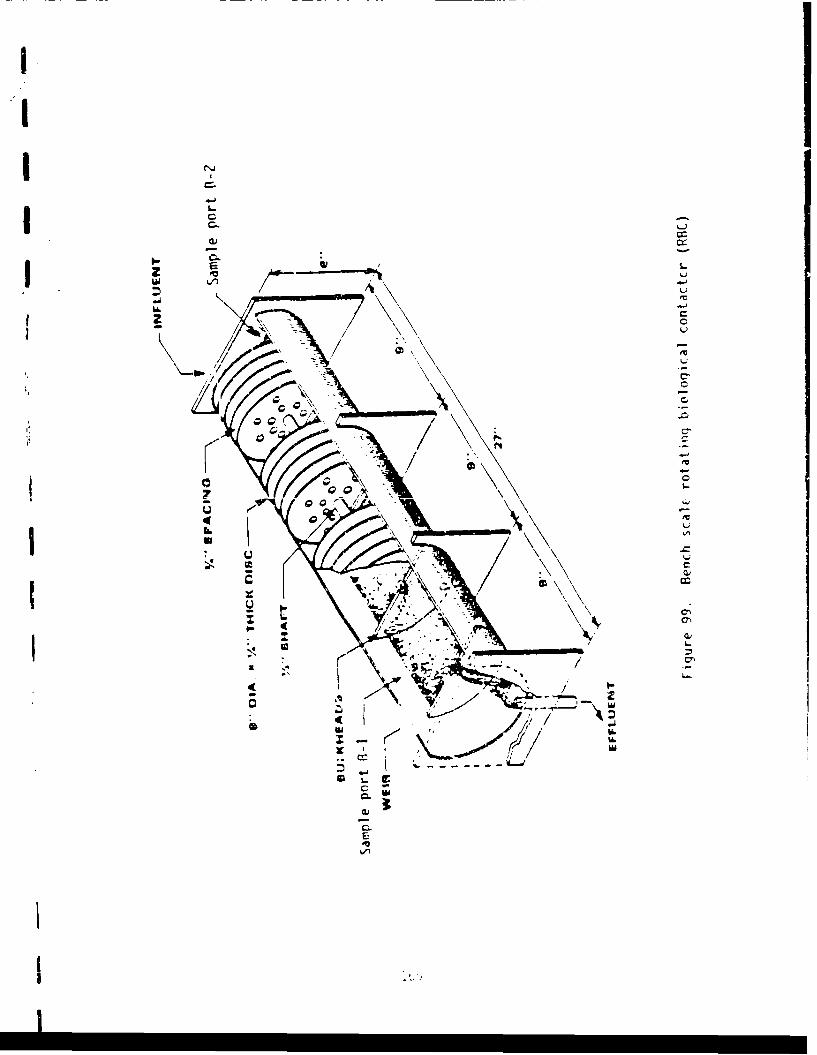
C4-
'eV
2 CLCýCEU
MUV).

-A.-
Cd
Ali-

Ii W r-
Em
I'

I8
Figure 102. Rotating biologic~al contactor effluent collector

oEC E
c 'D 0- a
I 0I=
waLL.
U- I.
-L 010~J
I -
IT C1
o 0o (D
!rU.O-uý

0, E
I C O
iz
0 00
0 40)
I-rItI 04 o

Stage 1
Stage 2
Figure 105. Biomass from bench-scale rotating biological contactor on da: 26
117

-Ir
Stage 3
Lao
II
Stage 4
Figure 106. Biomnass from bench-scale rotating biological contactor on day 26

ll-4
'4- ; " . .r. I , •.' V
-f
" ". -,,.,, .- ~- •A,.
ia cotco on da 35
S.-
)4
"'.• p? •-<S.. .2
Stage 2
IFigure 107. Biomass from tench-scale rotating biologcal cortactor on day 3$
I 73

Stage 3
Stage 4
Figure 108. Biomnass fcom bench-scale rotating biological contactor on day 35

I
, Ap)., . &f:,• \ -,-b- ,.--
{ - P
ioma ss ,
I.
I A.>
700.
I, . --" , , . "'- ,
'VP,
/ ..- .•, • . :- % .'
Fiber
Figure 109. Effluent collector

IIII
I ________________
- c�z'�.; '�e
I I ii -)
.C� �.C
-
I - -
-.--- -
t -- I
-�
�0-
1 -
a ( � �
Fi�re 110. Norag photoreaCtor
176
I

Figure 11.Bench-sr-ale UVO. .,ctor
I 177

IL
II1i
4-4tiS
Ci
II
176a

I
I
I.-
-"
C
C
0
0"
t0
I

coCI
>-
gD
EzE
I C )j

:1 /
~C'rc C o 0/o 0 N 1A
N N Q\ Ii 7
00 0
0 0 m x
XL X ,:. '- .i
I I D
.- 1.1 U')
0 '<
70 (.D 0•
00) 0) 0,. 0). 0)3 0) 0) 0• -0)0) C CODI C.I CO •"l O0Ol,
1•E

.00
ra)
LL.
CJ) 0
S2.
~LLO
0-0
0) r- ( 1) v c C14 )c - ( r

0 H 0
LLW z
wo
0)
U)LU0
LI-
'Jco C'J 0 a) cc;'- wO U) vtC N '0C N - CO m) m
183

I>
001
LL Z -v-
ZLr) I 0 0
COC
LL~
LL~
ZU-WLL.
~0
0zw 00MM

CC
LLA
(D0z
iz0
cc'
cc
cn)
v' c.lJ (D~ co¶ C'J
N C~l N C1

0)
I 1co
I- "I c,
0'
LU '
L 5I CC

c 0 0N 0 00 x m LO
ILLU- 0
0Z zU LOU)
IL N.
z~ 0No0 c.
1 U WO .-
CV ~c,)
LL <~
LLE
z -N4
LL <
0 0Y) CC)( U
127
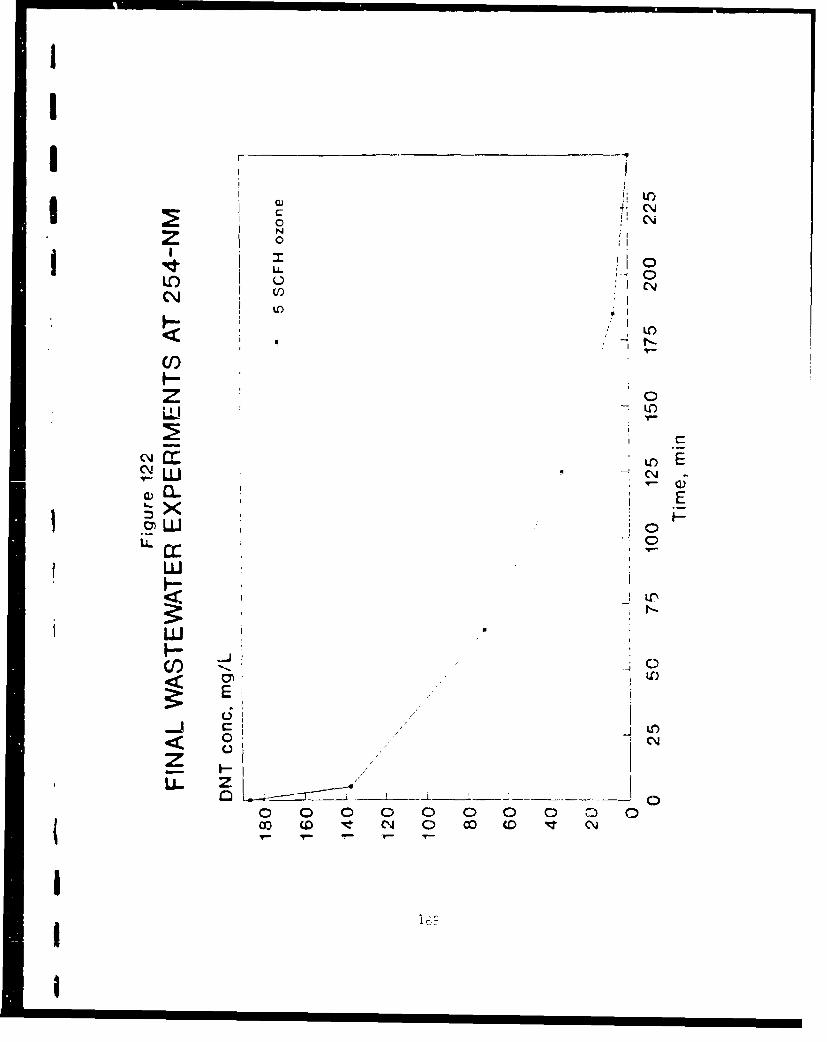
I 4, N r
zN
LO O
U)
z0
w LC)
4) x EIL i-o
m~U
wL
Hi
Ep
z-I-i
0 0 00 00Oo CD It CJ clic (DC'

0
oiL
co I L
W Lr
0
CLU 0
0<
00
OLL
ujQ to0i )c to
0~3O o
H ZI I/,,Cl)

u41
Lw-
rr
I I
I ' I-
1 SOIU,.i e
., ., ,, •-__..
.*b-. •. ,
Figure 124. UV/ozone chromatogram of test 29 at 0 min
19C)Ia

.= n
,- °
a '
CNC
'74
"-ig , N c o t- -- •
Figure 125. UV/ozone chromatogram of test 29 at 5 win

S~,)
IT
= -
II
•' .7,
N "
• II
Figure 126. UV/ozone chromatogram of test 29 at 65 rain
Z J 192
! !

gr~.
S-
,..
A --
- _(¶b,- IN '- a ,.
t -
Figure 127. UV/ozone chromatogramn of test 29 at 125 min J
193
i i i i i i i i i i i i i i i i i i i i

L
IJIII I.
Iii
,-
S. .
I 191
- !

I
,2 ,. .,
,w r, M
IICLC
4L.
.III
Figure 129. UV/ozone chromatogram of test 29 at 245 mi
195

Fiue10 ec-cl rnua ciae abnclm
19

I -
I
I I
Activatedca'-~cn
Glass wool
Giai ] vcc,,
H~d1o
U=31 eEffluentIocationc-1
Figure 131. Flow diagram of granular activated carbon column
197
I

I.
I-
I
II
198 I _

IIII
APPENDIX ATEST PLAN - DNT TREATMENT TECHNOLOGIES
i
I

IIIIIII1
200 1

TEST PLAN - DNT TREATMENT TECHNOLOGIES
1. Introduction
This Test Plan has been prepared for the U.S. Army Toxic and HazardousMaterials Agency (USATHAMA) in accordance with Contract Data RequirementsList CORL A0OS under subcontract No. 897-88, PNB 3769-2-A. The objectiveof this project is to identify and develop the technology for removal ofdinItrotoluene (ONT) from wastewaters by performing bench-scale testingof selected technologies (ultraviolet radiation (UV),ozone and granularactivated carbon (GAC)]. This testing will provide economic data for
Scomparison of the two treatment technologies. The work will be performedby PEI Associates, Inc., with assistance from Hercules Incorporated atRadford Army Ammunition Plant (RAAP), which will provide the bench-scaletest facilities. The tests will be conducted during the period of Aprilthrough June 1990.
1.1 Background
DNT, an ingredient used in the manufacture of single-base propellants, isa suspected carcinogen and has also been linked to heart disease by somestudies. At present, a central biological wastewater treatment plant isoperated at RAAP for treating wastewaters from propellant, nitroglycerin(NG), and other nitrate ester manufacturing processes. The NG andnitrate ester wastewaters are pretreated chemically prior to beingcombined with the propellant wastewater and treated biologically. Thoughthe Virginia St.ate Water Control Board has not established limits on ONTdischarge, monitoring is required and ONT content in dischargedwastewaters must be reported semi-monthly. Additionally, in the March29, 1990 Federal Register, 2,4-ONT was listed as a constituent hazardousorganic chemical. The level of regulatory concern for 2,4-ONT will be0.13 mg/L and these requirements must be implemented by September 25,1990. With recent changes in federal regulations and state requirementsfor monitoring ONT In effluents, it is clear that abatement facilitieswill become necessary.
A survey of the wastewater collection system was conducted whichidentified that water dry water represented the greatest source of ONTwith solvent recovery, air dry, and coating operations providingadditional though lesser amounts.
Analysis of the effluent stream from the biological treatment plantrevealed the presence of occasional concentrations of ONT. Also nodetectable quantities of DNT were found in the biomass.
ONT/blomass studies conducted under laboratory conditions determined thatONT did not exert a toxic or inhibiting effect on acclinated biomass fromthe biological treatment facility. Biomass studies were performed withtwo bioreactors; the first bioreactor was not exposed to ONT (blank) andthe second exposed to ONT. Analysis by high performance liquidchromato~raphy (HPLC) indicated no ONT, bL't the presence of severaltransformed by-products from DNT degradation. Toxicity studies wereaccomplished with wastewater reSpirorneters measuring biological oxygen
201

demand (600) to assess repression of microbial respiration. Little or notoxicity was observed at concentrations of 100 mg/L. 1A survey was conducted to identify technologies available for b'thdestruction in wastewaters and ONT removal methods. The decomposition ofONT and its issociate by-products from various treatment methodologies 1were reviewed whenever available in the literature. Approximately 50
articles were located and reviewed. Some articles contained little or nospecific information related to DNT; however, they either provided 1insight into treatment technologies or information on treatmenttechnologies for similar compounds.
Based on the literature reviewed, the following methods were recommerededfor evaluation: (1) various combinations of UV, ozone, and hydrogenperoxide treatment since they could provide an economical, easy toinstall operation, with low operator involvement; and (?) GAC andregeneration since laboratory work has demonstrated that GAC is able to
remove ONT from wastewater, and a potential regeneration method couldgreatly improve Its economics. Additionally, discussions with variousvendors indicate that GAC was very effective in removing 2.6-DNT fromwastewater.
Laboratory evaluations (performed at RAAP) of the technologiesrecommended from the literature review, indicated that bench evaluationsof UV/ozone and biologi-al (RBC) treatment held the greatest potentialfor successful and economical treatment of DNT containing wastewaters.No laboratory work was performed with GAC due to experience gained fromprevious projects involving TNT (and ONT as a contaminant).
1.2 Objective
The objective of this task is to continue the development of a technologyfor removal of ONT from wartewater through bench-scale UV/ozone and GAC Itests of these wastes. Specifically, the following items will beadd-essed:
(1) Amount and characteristics of the ONT after treatment. I(2) Attempt destruction of the by-products detected qualitatively during
HPLC analysis of DNT.(3) Determine optimum operating conditions for bench equipment utilizing I
water dry wastewater.
RAAP will furnish the ONT wastewaters for these tests. I2. Technology Evaluations
2.1 Descriptions of Treatment Systems tUV/ozone
Oxidation is a chemical reaction that either increases the oxygen content Ior reduces the number of electrons of a compound. In wastewater
I

treatment, this leads to the destruction of waste compounds by theformation of new compounds. In a system where complete breakdown occurs,the by-products are calbon dioxide and water. LIV, ozone, and hydrogenperoxide are various oxidation agents. UV provides a quantum ofradiation that facilitates the breakdown of molecules by the excitationIIof electrons into less stable electron orbitals, while ozone and hydrogenperoxide chemically react with the molecules.
A Normag Photoreactor will be utilized for these bench studies (fig. 1).It has a height of 700-mm, width of 260-mn., and a depth of 100-mm. The350-400 mL capacity reactor uses forced liquid circulation with a y'ass
.| pump and Hostaflon-coated pump rotor. Liquid above the pump is suckeddown, thrown outwards by the rotor at the bottom of the reactor, forcedup through the riser pipe and fed back to the reaction vessel through theupper end of the pipe. The formation o- consumption of gas can bemonitored very crecisely in the complftely closcd apparatus. Thejacketed reaction vessel allows exterior heating or coo'Ing.
Two types of UV radiation sources will be utilized with the Normacphotoreactor. A mercury low-pressure lamp will produce intense radiationat the 254-nm mercury-resonance line. A mercury high-Dressure lamp willbe used to emit tVe characteristic mercury-'Ine system which extends fromthe short-wive UV range of about 240-nm to well into the visible range.The strongast line is 366-nm.
The ozone will be made using oxygen flowing through an Alrox Ozonatormodel C2P-3C-2 by Pollution Control Industries Inc.
Synthetic wastewater will be evaluated initially to separate and quantifythe effects of several parameters which would be difficult to quantify inwastewater (table 2). Tests 1 through 12 will vary only the addition ofozone. This will assist in designing treatment facilities that maximizeozone addition since some locations may contain low quantities otorganics to consume the ozone. Tests 13 through 15 will evaluate theeffects of the high pressure lamp to compare its effectiveness inrelation to the low pressure bulb. Tests lb through 27 will evaluate theeffects of solvents on UV utilization and ozone consumption. Tests 28through 30 and additional testing will Oettrmine design requirements fortreatment facilities and provice data for economic analysis based onactual wastewater.
Granular Activated Carbon
Filtrasorb 400 GAC from the Calgon Carbon Corporation wi1i be utilizedfor the adsorption studies. A 1-inch d1ameer column (20-inch height)utilizing water dry wastewater will be used for the GAC column studies.The column is shown schematically in figure 2. The bed volume in thecolumn will be designed to achieve a contact time of 30 minutes orgreater. (Note: Isotherms will be performed on each batch of GAC forcomparison purposes.)
The proposed operating conditions (flow rate, total volume, and directionof flow) for the GAC tests are presented in table 1. The GAC will be
203II

backwashed with 2y, times the bed volume of distilled water before eachtest to remove all fine particulates, air pockets, and stratify thecarbon bed. The proposed exhaustion flow rate for the GAC studies willbe 3 mL/mln. Exhaustion will be performed by downflow. Ar dutumatedsample collector will be used to collect samples. Since the GAC will beexposed to varying quantities of solvents in the wastewater due to theprocessing of different propellant formulations, the exhausted column fortests I through 3 will be fed a solution containing 4.0 wt % solvents(2.0% ethyl alcohol and 2.U% ether) to determine if the solvents candisplace the ONT from the GAC. For tests 4 through 6 the GAC will beexposed to the high solvent concentrations in wastewater to ascertain Iftheir continuous feed will affect the adsorption of ONT.
2.? Operational Data
UV/ozone
The variables with UV/ozone will consist of the use of two different Uvbulbs, solvents (ethyl alcohol/ether), collection of samples at varioustime Intervals, and periodic assessment oF ozone addition. Alow-pressure mercury lamp will produce 254-nm radiation. A high-pressuremercury lamp will produce from 240-nm to the visible range. Testing willbe performed without solvents and with solvents (2.0 wt % ethyl alcoholand 2.0 wt % ether). Tests will be performed utilizing both bulbs, whilesamples are withdrawn at various time intervals. The flow rate andconcentration of ozone will be monitored. Additionally, adsorption at254 nm will be recorded for each wastewater (synthetic or actual) toquantify the differences in UV adsorption characteristics. Figure 3represents a data collection form for UV/ozone testing.
Activated Carbon
Effluent ONT concentrations, flow rate, and time will be monitored forthe GAC studies. Figure 4 represents a data collection form for the GACcolumn studies.
3. Sampling Plan
The primary objectives of these tests are to: (1) determine theeffectiveness of each treatment technology in ONT pollution abotement:(2) determlne the ontImum operating parameters; and (3) determine theeconomics associated with each technology. RAAP will perform all testsand collect and analyze required samples and operational data asdescribed herein; RAAP testing fac 4 'ities will be used. This sectiondescribes the bench test program that will be implemented to meet theseobjectives.
3.1 Testing Program IUV/nzone
Synthetic wastewater (optical density at 254 nm will be recorded forcompari son tu actual water dry wastewater) will be prepared by mixing
2^4 4
I
I

I100 mg/L ON! in distilled water. ihe Mormag photoreactor will be filledImwith either the synthetic or actual water dry wast!water (350 to 400 mLcapacity). The selected UV bulb (two options) w11i be inserted and theozone generator (three flow rates) precalibrated prior to operation. The
glass pump with the Hostaflon-coated rotor will be started. Both thephotoreactor and the ozone generator will be started at time 0. Sampleswill be collected at 0 (blank), 0.25, 0.5. 1.0, 5.0, 10.0, and 15.0 min(see table 2). Upon completion of testing on synthetic wastewater,testing will be performed on actual water dry wastewater utilizingoptimum destructive conditions.
Activated Carbon
After backwashing the GAC in the column with distilled water, eitheractual water dry wastewater or synthetic wastewater prepared by mlxing100 mg/I. ONT in distilled water will be utilized to saturate the GAC(tests 1 through 3). A reservoir will be filled with the wastewater anda pump will meter the flow to the column at 3.0 mL/mln. The GAC willfirst be completely immersed in the wastewater. The needle valve of thecolumn will then be adjusted to allow for the 3.0 mL/min elution flowrate of the evaluation. A sample collector will be operated to collect10 mL samples until completion of the evaluation. Additional testingwill be performed to determine if solvents in the wastewater streansremove DNT from GAC or affect adsorption capacity. To evaluate if thesolvents can desorb DNT, the previously described steps utilizing watercontaiijing approximately 4.0% solvents by wt (estimated maximum that thecartor. would be exposed to) will be followed. To evaluate the solventseffeict on adsorption capacity, ()NT and sulverits will b. processed (tests4 through 6) at the same time utilizing the previously described steps.
3.2 Sampling
UV/ozone
Figure 5 contains a flow diagram of the UV/ozone reactor and the samplelocations. Sample location UV.-l is whe-e l0-mL samples will be taken attime intervals of 0 (blank), 0.25, 0.5, 1.0. 5.0. 10.0. and 15.0minutes. Sample location UV-2 is where ozone flow rates will becollected.
Activated Carbon
Figure 2 contains a flow diagram of the GAC column and the samplelocation. Sample location C-I is where 10-mL samples will be collectedby a sample collector until DNT is detected above 0.5 mg/L. This will beaccomplished by allowing the sample collector to fill 20 to 40 test tubeswhile processing the wastewater through the column. Thest test tubeswill be labelled and delivered to the Technical Analytical laboratorywhere the two tubes sampled last will be analyzed. If no DN! Isdetected, no further analysis will be performed. If DNT is detected,tubes will be analyzed until at least two adjacent tubes contain no ONT.
2 5II

4. Analytical Plan
4.1 Analytical Methods
The specific analysis that will be conducted on each sample has beendefined upon review of the analytical results of previous work on thisproject and consultation with published literature. The analyticalmethod that will be used for the detection of ONT and potentialby-products (appendix 1) will utilize high performance liquidchromatography (HPLC). Wastewater samples will be diluted 50/50 withmethanol to dissolve any particulate ONT and filtered to remove anyadditional suspended particulate matter and stored at room temperaturefor less than three hours. A series of ten standards encompassing therange from 0 to 200 mg/L ONI will be prepared for calibration of theHPLC. After calibration of the HPLC, samples from the evaluations(UV/ozone and activated carbon) will be processed and followed by a finalcheck of the calibration with a known standard.
4.2 Quality Control/Quality Assurance (QC/QA)
A variety of quality control samples will be utilizeC throughout thelaboratory testing and analysis process. These samples will utilizereplicates, blanks, and/or spikes to monitor the quality of sampleanalysis. At least one blank will be performed on each test.Additionally, a replicate will be performed for each ten analyses and onespike will be performed for each ten analyses. Thus, the procedures used0l1l not adhere to those specified in the "Sampling and Chemical AnalysisProgram" of the U.S. Army and Toxic Hazardous Materials Agency (December19851 guidelines.
Mr. James Heffinger is RAAP's prolect engineer fo, this effort. Mr.Peter Hartmann is RAAP's Technical Analytical laboratory supervisor andis responsible for tracking analytical progress and ensuring timelycompletion of analysis. Both Messrs. Heffinger and Hartmann will reviewall sampling, analysis, and quality control prior to the start of thisprogr~m. Subsequently, Mr. Heffinger and Mr. Hartmann will review theongoing analysis of samples to ensure that cited methods are followed,that adequate quality control data are generated, and, if necessary,appropriate corrective actions are taken.
5. Data Analysis and Reporting
A detailed report summarizing the project background, objectives.experimental methods, results, and conclusions will be prepared at theconclusion of the test-. This report will reference other projectdeliverables, such as the Program Plan and this Test Plan, and willdocument all aspects of the project. The operational and analytical datacollected will be presented in appendices as unreduced data. A su M,*aryof the QC/QA protocols and resilts will be included. The data will beinterpreted with regard to the following questions:
206
i a i I I I

(1) How effective is the process in DNT removal?
(2) Are the by-products formed further degraded by additional treatmentor do they accumulate?
(3) If possible from available data, which process is most costeffective?
207
I

Ct
cc c c c c
E E-eSe - 14NC
0
CC
"*" co - - = --0
C.
.2 o .20o
0 I
co .6cdw -c
00
00l20 U. --
10
2~ CO

Tab.le 2. Tew matrix for DNT degradation by UVozonation
Desired DNT UV bulb Ozone flow ra'eTeS! No C0nC (m /L.) type (SCFM) Solvents in water Nwo 04)
1 100 low 0 02 100 low 0 03 1 C^ low 0 0
4 100 low 5 05 100 low 5 06 100 low 5 0
7 100 low 10 08 100 low 10 09 10O low 10 0
10 100 lw 15 011 100 low 15 012 100 low 15 0
132 100 high 10 014 100 high 10 0152 100 high 10 0
16 100 optimum 0 2.0%,/ ether, 2.0% ethyl a!cohol17 100 optimum 0 2.0% ether, 2.0% ethyl alcohol
18 100 optimum 0 2.0% ether, 2_00* ethyl alcohol
19 100 optimum 5 200, ether, 2.0% ethyl alcohol20 100 optimum 5 2.0% ether. 2.0% wioy! alcohol
21 100 optimum 5 k-l- ether, 2.0% ethyl alcohol
Z2. 100 optimum 10 2.0% other. 2.0% ethyl alcohol
23 100 optimum 10 2.0% ether, 2.0% ethyl alcohol24 100 optimum 10 2.0% other, 2.04 ethyl alcohol
25 100 optimum 15 2.0% ether, 2.0% eliyl alcohol26 100 Optimum 15 2.0% e!her, 2.0% ethyl alcohol27 100 opt!mum 15 2.0% ether. 2.0% ethyl alcohol
28 wastewater optimum29 wastewater optimum30 wastewater optimum
1
Additional esting will be performed as determined necesary for economic and design requirements.
2jTesting with the high pressure bulb will be expanded If results are successful.
2-0

-c COV'tig 112g MtoJ~ I8,
Fiur J. Normag Ihtrco
21-0
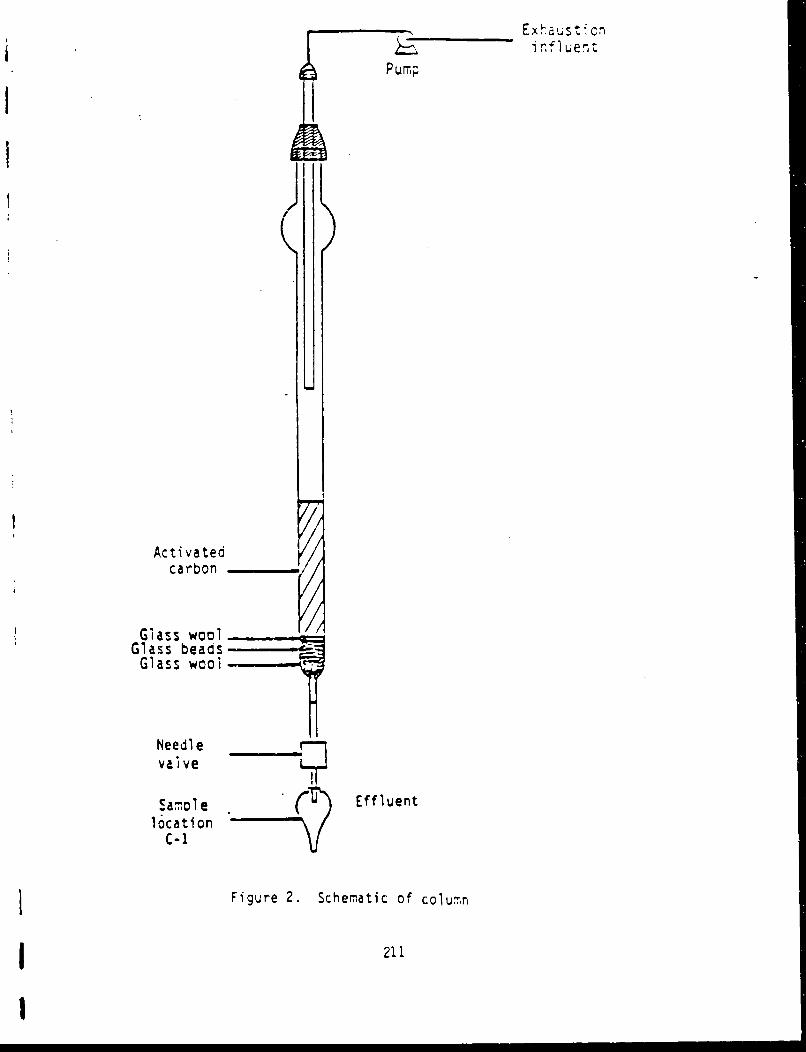
EExhaust cn.• •__infiuent
Pump
Activatedcarbon
Glass woolGlass beads
Glass wool
Needlevaive
Samole ( Effluentlocation
C-I
Figure 2. Schematic of column
211
I

Figure 3. Data collection form for UVlozone testing
Sample time (min)Test No. OD 2r4 Bulb 1/4 1/2 1 5 10 15 Ozone flow rate
212
___________ _____________ _______ _________ - - ........-...~ -~ ________________
_ 11__
- - _____ 7 112

II Figure 4. Data collection form for GAC studies
Column feed DNT concentration Flow rateTest No. 00 2,34 Sample No. (DNT or solvent) (mg/L) (mUmin)
2 13
I - - ~ __ _ _ _ _ _ _ _ __ _ _ _ _ _ _ _ _ _
_ _ _ _ _ _ ___ _-
__ _ _ _ _ __ _ _ _ _ _ _ _ _ _ _ _ _ _ _ _ _ _ _ _ _ _ _ _ _ _ _ _ _ _ _ _ _
213
I

E vi
E
CE
0CD 0 rI V~ E
0 Ir 0
__ I
M~L60
Q CI LL
03)b..
2'. 4

Safety is psi, of ye*' joi.
H HE=RC ULES Mein randu mRA IOD £EY•Y AMMUNITION PLANT March 23, 1992
CC: C. D. Chandler
ATTACHMENT 1 L. R. GizziI ~I.- L. Smath
P. J. Haxtrar•'n
File
*TO: j. 'G. Heffinger I
Test Plan for PEI A-sosiate", Inc.
Attached is the proposed test plan for analysis of dinitrotoluer.e(D0T'Z) in wastewa•&r, to be szub-.tted to PEI ASsociates, Inc. Since EPAMethod 625 is a gas chromatography/maS speCtrometry method and NICSHMethod S215 is for the analysis of DN'r in air sa6-ples, a liquidchrorrtographic method is proposed for use in this sttdy.
If a sample of DN' could .;e obtained from the USATHAMA StandardAnalytical Reference Materials (SANM), it would prove beneficial fcotraceability purpcse5.
LHK4/as
Attachment
RA.-17 REV 1.84 215
II! ! I I I I i j i i l

Sample Prepation
Prio'v to analysis, wastewater samples will Le filtered thro-zh a0.45 m filter to remove suspended particulate matter. Samples will. bestored at ambient temperature until analyzed. Analysis will occurwithin three hours.
Standard Preparation
A series cf ten senrds encopassing the range from 0 to 20ýparts per millicn DCtC w;.il be prepared and chromatographed by t:ebelow.
Cromatographic Method
The sam ples and b, ndards will be &-nalyzed by an isorat-: HPLCmethod. The cnromatographic conditions are listed below:
Instrument: Hewlett Packard H. 1090 L iqId Ch r z-:zxa:hColumn: 25 cm Lichrosorb &P-18 4.6 n- i.d.Mobile Phase: 55% Methanol/45% WatprFlow Rate: 2.-C) rrA1/min
OvenTe~1 atre;40 '.
ReservoirTcmperature: awbient
In'ection Volume: normally 2 50 AtL
Detector: Hewlett Packard 1040A Diode Array Detec:ur a:254 nrm550 nm reference
Statistical Analysis of the Analysis method
Three injections of each standard will be made, and a plot cf areavs. concentraticn made. Line&r reoression analysis should reveal tecorrelation coefficient to be at least 0.990.
The highest, lowest, and mid-range standards will be subjected toa test for precision of the analysis method. Each of these standardswill be injected and c~hrcmatograpried ten times. The area count, fcr !eacr standard, as determined by the integrator, will be averaged and tnemean, standard deviation and relative standard deviation will bedetermined. Relative standard deviation will be less than 5% in the mostused (low to mid-range) por:ion of the calibration curve.
II
2:6
I
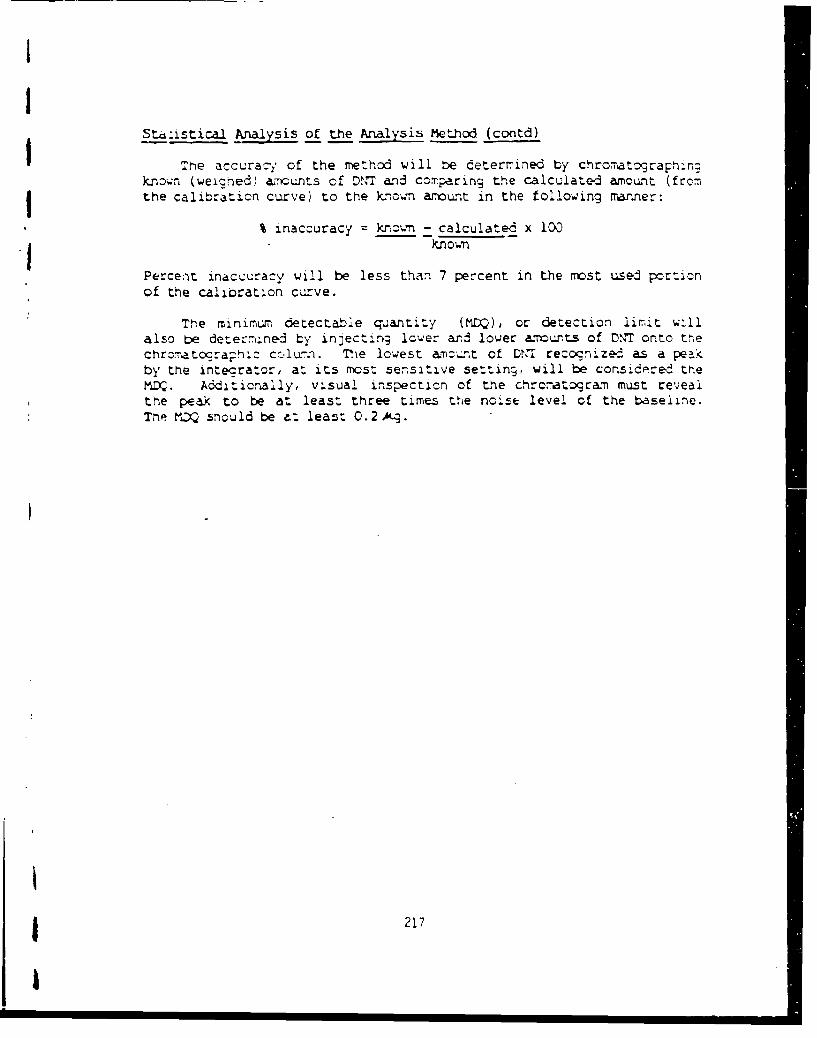
II
Sta-istical Analysis of the Analysis Method (contd)
The accuracy of the method will be determ ined by chrommatograph-inrknown (weigned) amcunts of DNT and comparing the calculated amount (fromthe calibration carve) to the known amount in the following rranne-:
% inaccuracy kncwn - calculated x 100XIknow.n
Percenit inaccuracy will be less than 7 percent in the most usei portionof the calibration curve.
The minimum, detectable qatiti y (?4LQ), or detection lir-it w!ilalso be deter:%.ne3 by injectrlg lower and lower &ons of DN'r onto thechro~rtocraphic crlc7.l . Thlie lowest axm,.ýnt of DNTq recocnized as a peakby the intec-rator, at its most sensitive settin9, will be considered theM!DQ. Additicnally, visual inspecticn of the chromatograxn must revealthe peak to be at least three times the no'se level of the baseline.The KDQ should be e: least 0.2 AL.
217
I

*1IIIIIIIIII

APPENDIX BSTATISTICAL ANALYSIS OF THE ANALYSIS METHOD
219

IIIIIIIII
22 1
I

Si oMemorandum
RADFORD ARM Y AMMUNI'ION PLAN' July 17, 1990
c: C. D. Chandler
L. R. GizziP. J. HartmannFile
J. G. Heffinger, EngineerTO: Process Engineering
Per test plant dated March 23, 1990 to J. G. Heffinger from L. H.McDaniel entitled (Test Plan for PEI Associates Inc.), 10 standards of2,4-DN'I (HPC Lot 1560) were weighed individually ranging from O.X)>0gramis blank to 0.0200 9 and placed in 50 mL HPLC grade methanol with 50mL deionized H 0 Each standard wras then filtered U-nu d MIillex-5 C.5
yr filter befoA being analyzed according to following chrorratographicconditions:
Instr-ament: Hewlett Packard HP-1064B Liquid Ciroxuatograph
Coluxn: 25 cr. Lichrosorb RP-18 4.6 mT i.d.
Mobile Phase: 55% Methanol/45% Water
Flow Rate: 2.00 mL/min
Oven Temperature: 400 C
Reservoir Tefferature: Water &)0C Methanol 40o
Injection Volume: 20AL
Detector: 254 rnm/430 reference
Wc2/as
Attachments
IRA.173 REV S.34 221
I

Statistica Analysi of the Analniz Method I
Three injections of each standard were performed, plotting the areaversus the concentration. The linear regressign analysis showed thecorrelation coefficient to be 0.9974. Table I gives the results for allten samples. Four of the standards (0.0010 g/100 mL, 0.0052 q/l00 mL,0.0078 g/100 mL, 0.0107 g/100 mL) were subjected to a test for precasiotnof the analysis method. Each was injected and chromatographed 10 times.Tacle II gives ,he results obtained. As can be seen In Table II, thehignest relative standard deviation obtained was 2.6%.
The accuracy of the method was determined by chromatographing four kno.vn(weighed) amounts of DNT and comparing the calculated amount (from thecalibration curve) to the known amount weighed. The percent inaccuracyranged from 0.06% to 5.5%, well below the 7.0% listed in the memc.Table III shows the resu-lts of the accuracy test
The minimum detectable quantity (MU) was determined by injectingdiluted samples of the lowest standard into the chromatographic coluxin.The lowest amount detected under these test conditions was 1.2 Nm perliter. Using 200 iL injections instead of 20 4 L injections as in testconditions, 0.12 rrg/L was tne nunimum amount detected.
II
222
I

TABLE I
Triplicate Analysis of DNT Standardson 1084B Liquid Chromatograph
Std. Wt. Triplicate Results Mean RSD
DNT Area Countg 1 2 3
0.0000 O 0 0
0.0005 22600 21710 22310 22206.6 2.04
0.0010 33650 37280 34210 35046.6
0.0025 93860 91820 91820 92500 1.27
0.004, 1533'0 0 150 DO 154500 152633 1.49
0.0052 1 97100 194600 195100 19560C 0.68
0.3-78 298830 30 5300 3 04ý,- 303166 '1.25
0. 0107 413 ..O' 416900 4121 00 414-3 0- C0.62
0.0146 622700 619000 618900 62020, 0.235
0.0200 769000 769200 7732-0 77046 0. 31
Correlation Coefficient Q0.997
2?3
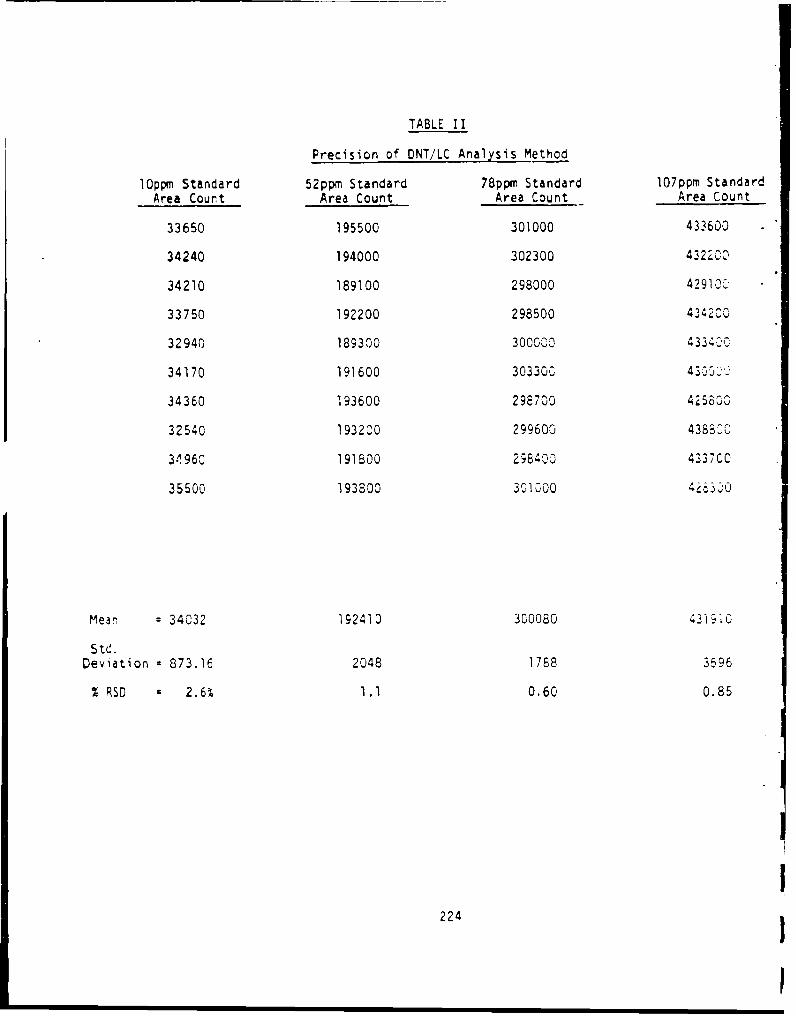
TABLE II
Precision of ONT/LC Analysis Method
lOppm Standard 52ppm Standard 78ppmr Standard 107ppm StandardArea Count Area Count Area Count Area Count
33650 195500 301000 433600
34240 194000 302300 4322Z00
34210 189100 298000 42910C
33750 192200 298500 434200
32940 189300 3000003 43 3 4
34170 191600 303300 43 .3
34360 1193600 298700 425800
32540 193200 299600 438K00
3P960 191500 2-8400 4337CC
35500 193300 301000 4263-0
Mean a 34032 192410 300080 43i9 1
Std.Deviation = 873.16 2048 1788 3596
% RSD c 2.6% 1.1 0.60 0.85
224

TABLE III
I Accuracao' Method
From Cal. Curve Weighed Amount InaccuracyPO pp ._ -pm•
8.3727 8.00 4.752.7404 50.00 5.598.3585 100.00 1.6
102.360 103.00 0.6
* Standards were weigned in giOOml and converted to ppm.
Inaccurazy = Weighed Sarrple - kpournt from L' calik. xWeigned sample
1 225

226

APPENDIX CUV/OZONE TEST PLAN DATA
227
I

I m.
im
I-I
228 ,I
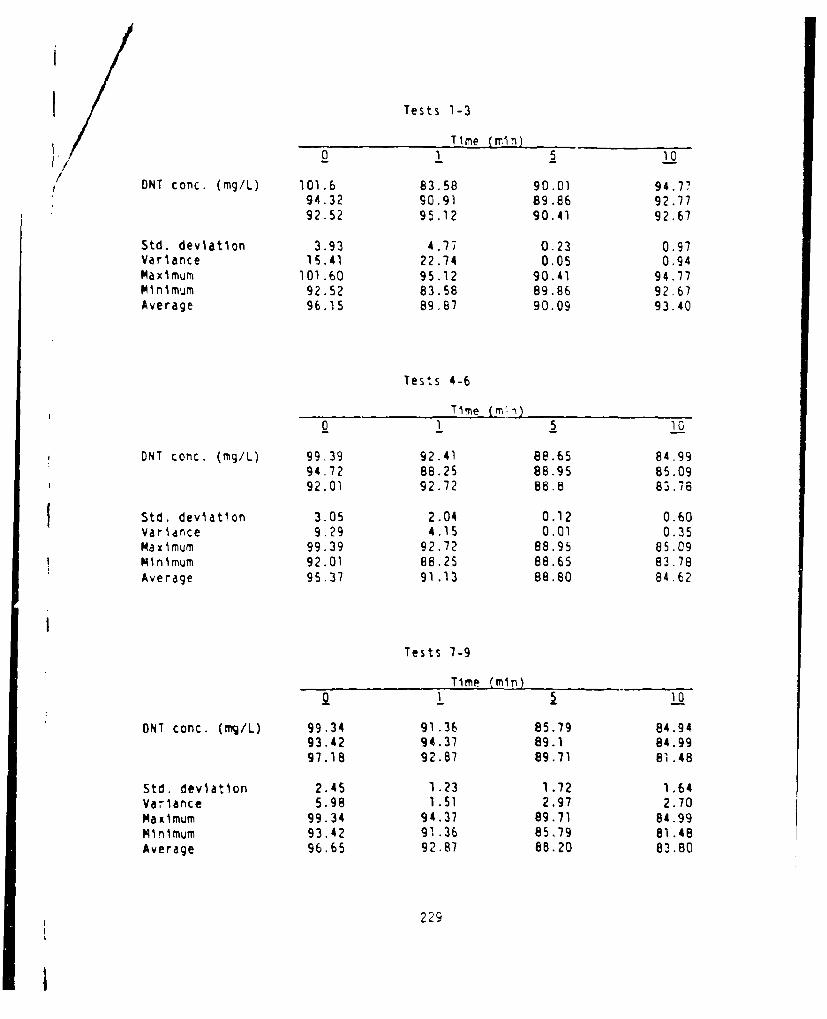
Tests 1-3
Time (mmln)S0 1 5 10
DNT conc. (mg/L) 101.6 83.58 90.01 94.7?
94.32 90.91 89.86 92.7792.52 95.12 90.41 92.67
Std. deviation 3.93 4.77 0.23 0.97Variance 15.41 22.74 0.05 0.94Maximum 101.60 95.12 90.41 94.17Minimum 92.52 83.58 89.86 92.67Average 96.15 89,87 90.09 93.40
Tests 4-6
Time (n')Q 1 5 10
ONT conc. (mg/L) 99.39 92.41 88.65 84.9994.72 88.25 88.95 85.0992.01 92.72 8 .B 83.78
Std. deviation 3.05 2.04 0.12 0.60Variance 9,29 4.15 0.01 0.35Maximum 99.39 92.72 88.95 85.09Minimum 92.01 88.25 88.65 83.78Average 95.37 91.13 88.80 84.62
Tests 7-9
Time Cmln)
01 5 10
DNT conc. (mq/L) 99.34 91.36 85.79 84.9493.42 94.37 89.1 84.9997.18 92.87 89.71 81.48
Std. deviation 2.45 1.23 1.72 1.64Variance 5.98 1.51 2.97 2.70Maximum 99.34 94.37 89.71 84.99Minimum 93.42 91.36 85.79 81.48Average 96.65 92.87 8B.20 83.80
229
II

Time (minr,) _Ce . .i 2•
ONT conc. (mg/L) 82.58 90.86 88.95 81.5396.68 91.61 90.56 83.9391.76 98.54 88.3 80.02
Std. deviation 5.84 3.46 0.95 1.61Variance 34.14 11.95 0.90 2.59Maximum 96.68 98.54 90.56 83.93 IMinimum 82.58 90.86 88.30 80.02Average 90.34 93.67 89.2? 81.83
Tests 13-15
Time (min) ___"_
0 1 5 10o
ONT conc. (mg/L) 95.58 93.47 91.26 87.398.49 90.66 90.26 91.8697.53 92.26 91.41 91.26
Std. deviation 1.21 1.15 0.31 2.02Variance 1.47 1.32 0.26 4.09IMaximum 98.49 93.47 91.41 91.8bMinimum 9S..58 90.66 90.26 87.30Average 97.20 92.13 90.98 90.14
Tests 19-21
Time (mln) 0
ONT conc. (rag/L) 85.69 93.37 87.2 89.55106.97 91.56 88.05 84.29 I119.35 85.29 80.57 76.91
Std. deviation 13.90 3.46 3.34 ,. 1 8Varianre 193.23 11.99 11.18 26.88Maximum 119.35 93.37 88.05 89.55Minimum 85.69 85.29 80.57 76.91Average 104.00 90.07 85.27 83.58
3
230 I

lests 22-24
.' Time (mr .
0 1 5 10
ONT conc. (mg/L) 88.65 90.86 96.13 87.458E.85 144.9 9 .. 51 79.9285.75 93.27 85.69 81.02
Std. deviation 1.20 24.93 4 27 3.32Variance 1.43 621.31 18.25 11.03Maximum 88.65 144.90 96.13 87.45Minimum 85.75 90.86 85.69 79.92Average 87.08 109.68 91.11 82.80
Tests 25-27
Time (m__n)
0 1 5 10
ONT conc. (mg/L) 98.44 91.61 92.26 89.0596.78 95.18 91.16 89.486.64 76.6 80.82 78.26
Std. deviation 5.22 8.24 5.15 5.17Variance 27.20 67.84 26.56 26.74KaXiIum 98.44 95.78 92.26 89.40Minimum 86.64 76.60 80.82 78.26Average 93.95 88.00 88.08 85.57
Irradiation of 25 mg DNT/L solution
_ _Time (mnl)
O 1 5 10
DNT conc. (mg/L) 23.82 22.52 21.06 17.06
Preliminary wastewater irradiation
Time (mm) -
8 5 30 60 90 120
ONT conc. (mý/L) 191.01 172.15 .34.96 103.2 84.79 65.82
I

Effect of varying ozone flow rate on destructionof ONT in wastewater
Time (m1n)0 5 35 65
ONT conc. (rng/L)at various ozone flows
5 SCFH Ozone 105 90.51 62.96 46.9210 SCFH Ozone 97.48 98.29 66.77 45.4315 SCFH Ozone 108.12 91.76 62.01 44.34
Final ozone parameters for wastewater (Tests 28-25)
Time (min) --
05 65 125 12)5 245,
CNT cc: (./g L) 143 87.6 47.64 26.21 10.18 3229.45 187.15 95.27 39.45 3.95 0
SLt . ý_iatlon 42.89 49.78 23.71 6.62 3.11 0.0Variance 1838.27 2477 55 562.40 43.82 9.70 0.0Maximum 229.45 187.15 95.27 39.45 10.18 0.0Mln~mum 143.70 87.60 47.84 26.21 3.95 0.0Average 186.58 137.38 71.56 32.83 7.07 0.0
, l~~~ . I II

APPENDIX DA NPRELIMINARY HAZARDS ASSESSMENT
233
I

IIIIIIIII
234 1

H E R C U L E S ~ ~S a f e t y I t p or t o f y e a r j ob . Mm r n u| ' •s.,,, , ., °, o.,,h.Memorandum
IAoFroo ARMY AMMUNTION PLANT June 28, 1990
HI-90-M-06BPreliminary Hazards Assessment of
Technologies tc Remove ONT from RAAP Wastewaters
OL~ective
The objective of this study is to hazards assess technologies to removedinitrotoluene (ONT) from process wastewater being developed under ProcessEngineerlng (PE) project 277, Removal of ONT from RAAP Wastewaters. Thisrepcrt idertlfAes anc evaluates potential hazards to personnel and facilitiesj during laboratory testing.
Su'rv, ary and Conc!u!ionr
j A preliminary hazards analysis (PHA), shown in Table 1, was conducted on twotechnologies being develo;ea to remove trave amounts of ONT from processwastewater. Technologies assessed were: (1) an activated carbon absorptlcnprocess, and (2) a bench scale ultraviolet (UV)/ozone photoreactor. It wasdetermined that these sstems are acceptably safe because they indolve onlylimited sample volume, and quantities of ONT dissolved in water which arenonreactive concentrations. These laboratory tes^t' involve ozone andultraviolet raalatton, which are not typical operations.
Safety precautions used include: shielding, UV goggles, and ozone bubbledthrough water to decrease concentration. Personnel exposure to these agentsmust be monitored and controlled.
I A.17 3 REV 8-14
235
!

I I I. !A• N ! I
AI
Re:c.•r.endatiors
Recc.-•endations to enhance the safety of DNT removal operations are presentedin Table 2.
Future Work
No future work is planned under this subcontract.
'IINTRO DUCT IC N4
ONT is used in the manufacture of single-base propeliants. BNT has tee-.listed as a hazardcus organic che.ical. and waste.ater CIscha ged af.er
Sezter7er 1990 must have a 0 NT concertraticr c-f . 3 rrmg/l or less. T.a.ae-er, t facilltes are necessary. INow process wastewater is treated at the biological wastewater trelt-lc-'plant. This plant does not effectively remove CNT. Therefore new tec•.rclcc'Must be developed to remove DIT. Two technologies are beirg Investigated byProcess Engineering: (1) an absorption process using activated cdrtCr., ar.(2) a UV/ozone photoreactor to chemically degrade ONT.
A P-A was Perfc -ed on .tCr ,t y scole eCNT rcmcvul eq;,1nret a,,I;; ý s E_operations to provide safety design criteria in the event of scale-up. Theresults are shown in Table 1, and the recoflmendatlons are extracted and liste..in Table 2 for clarity.
DISCUSSIC N .1Material qesc.cnse
The CNT removal studies will be conducted usig sample sizes cf a-Dro ..ratelyc.re liter of water containing up to 350 M-, of ONT. As seen in Tatbe 3.35•C/I is insoluble in water. The Process Engineering study test dataIn.,cates a slig.tly higher solubility. The purpose of the excess DNT is to.Imaintain a saturated solution at all times and this is dore by cons:a tagitation of the feed solution.
Uateria1 response data is presented for DONT in Table 4. The data for C!IT "spresented to illustrate that dry 0.1T is sorewhat reactive, but when 350 -are dissolved in a liter of water, it is ricnreactive. As seen, DNT is fa'r.Vinsens:,tive to mechanical, thermal, and srock st'rmuli, while ONT in scluttcnis insensitive to all stimull listed.
Taobe 5 presents thermal test data for activated carbon containing TNT a I',i. These tests consiste- of 62, activated carbon and 3 .2 '. o rzc
c ntc,-.ants. This data indicates trat sýert activated car.ýcn is inserS , s .et. the"- l st rul , and dces not rreser- a detonation hazard under tre;er:7:•t':r. The •ciut~on used in t•e •T remorai st•s~ ino c~ ~ I., rem ,a sti ,e s w~~ rot ccn-:a,-
r. r w. I te O"JT c t-nceratic be aý hi.- Th.s , t.e teý* act a..c 'zc•. is expected t. be less senst.'ve t'1n the activated cirF-q data s'c-
~ ~aoe 5.236

HI-90-M-068 3 June 27. l93C
Absorption Process
Insufficient ONT is present for an explosive reaction. The granular activated
carbon (GAC) column, depicted in Figure I, has several safety features tominimize rIsk to personnel and facilities (see Appendix A for a processdescription). The safety features include: (1) low concentration of ONT
dissolved in water, and (2) limited sample size.
Personnel hazards were identified as a result of this study. As seen in Table1, personnel will be exposed to alcohol and ONT. However, wearing of neecedprotective equipment will eliminate this concern.
The comoatability of ONT with the activated carbon will also have to bedetermined. Previous tests determined that TNT is incompatible with activateocarbon. However, as seen in Table 5, TNT did not react with the actlvatedcarbon even at high temperatures. To prevent reaction, the activated carbonwill be wet and the tests will be performed at ambient temperatures.
UV/Ozone Photoreactor
The Uv/ozone photcreactor, deplcted in Figure 2. will break down the DNT Intznew compounds. If comolete break down occurs, the by-products are carbondioxide and water. UV provides a quantum of radiation that excites electronsinto less Stable orbitals, which in turn facilitates the break down ofmolecules. The ozone will chemically react to Oxidize the molecules. For acomplete process description see Appendix B.
Insufficient ONT is present for an explosive reaction. However, as seen inTable 1, three concerns were identified as a result of thls study: (I)exposure to UV radlatlon/light. (2) ozone levels within the lab. and (3)thermal hazards as a result of the reaction. Safety features designee tominimize these hazards are: the reactor will be shielded to prevent personnelexposur• from UV radlatlon/light. However, the UV radiation will have to bemonitored to comIly with tte Army requirement of 1 nwl/cm2 for perIodsgreater than 16 minutes. 1
The ozone will be used under an enclosed hood to prevent the gas frnescacing. Currently. personnel do not have the capability to measure ozonelevels. An instrument must be purchased to monitor the ozone levels w'thlnthe lab, which must be lower than 0.20 mg/M*-o¶ 0.1 ppm2 .
As seen in Table 1, thermal hazards are not a concern because the reactor willbe jacketed in order to precisely control the temperature. In the event tnatthe thermometer fails or is broken, it can be easily replaced since it isexternal to the reaction.
A problem cormon to both test procedures is disposal of the ONT solutiCn.Since the waste treatment facility is not equippea to handle ONT, it issuggested that the S~lution be kept in a waste container and disposed ofaccordingly.
237
I

/
HI-9C-M-CEB 4 June 27, 1990/
/
REFERENCES
IAR 40-46, "Control of Health Hazards from Lasers and Other High IntensityOptical Sources," HeadQuarters, Department of the Army, Washington, D.C., 6February 1974.
2 Threshold Limlt Values and Biological Exposure Indices for 1989-1990, IAmerican Conference of Governmental Industrial Hygienists, Cincinnati, Ohio.
2
I-238

31 -
CC .C
o -
.12 *0 A . C,
4~* InC. am'0,
IL
* C.
-C WI 2
c -WIV l 61.
.9 Zit f a
I C,!, -1 goa
*l Ao S U
61 C .- 0C
c -- ~ 239

~0 c *
1 0-C& 4b c 43 a
-C~C m-4 * - -.
dc .9 a CS C3
a, 3-- - .~G6
c -- 4 Z" Z 1 s-e - 4 -l0
4~~~1 C0. C -!£6U 4
4 - £44 0 6c -4. -
a ac
cL
4m a-a
- 4~ 6

C C6 C6
QJ o.
.I
& VI
C61 - 0 . -
c -0 CL
bAI CL CI.
- IbI
6A 4
* -0 Z C6 ~
-. w 3 C
241

- I
00.
CI .C
40.
o ci
'o 6M
C a
40
4)1K
I '-4242
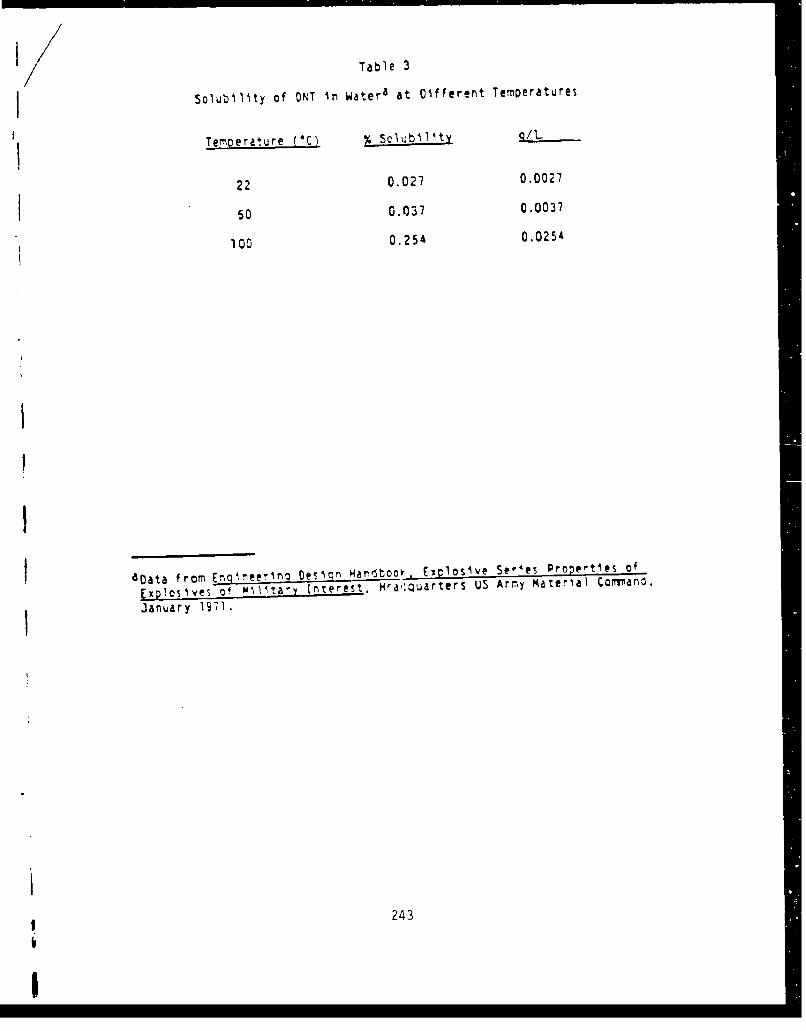
1/ Table 3
Solubility of ONT in Watera at Cifferent Temperatures
Temperature (*C) iSclubIlbtY Q/I
22 0.027 0.0027
50 0.037 0.0037
100 0.254 0.0254
Daata from Eno neerInq Des Iqj _ardtoO2 losive Se, 4 es ProtpI@es of
Explosives-Of 0. 1tary interest. aw8quarters US Army Mater~al Command.
.January 1971.
243
I

//
I
II
U
C
3
C u J0
6I -
I-I
A: 0 w -Vi. U U
o - C0C0
-. 6'I V. Ia:
U A01 -
3:1 A� --. 0 a I
V
3*
-U* C- V. Sa -. -
* V.. -a: *� 'V* - 11
6I U
* -, 0� U- - 0� 3* -, Al C
* 0 6.
- -* a
- I- a 0 C6 1 � 0 -* a a
I I - 5 - 0- a'- V.1
-ml ii-- -. �C
C �
�0
A N. - VC, 0 V.- - C. -V.- V '-- - 0
a a �.. * I:
U V. 0 JC6 -
U.
- � CZ
-e * V. 66- - V.- -
- - A 8
V. I �a £ *..
- 'I- SI *� � A
I -- -- V.A 3I £ 244 i �:i
I

C - 5.1LL-aCCI C .C
L A- iA Cc - E L 3%A~ r- ~ 4CL VI 0
.~ 4" aj o o -C
47% 4w-p4.EUC~~~% Q6~L~ ~ . 6
c b.C .ri CID 'U 0C "v JC~V
El ~ ~ o '
-~C 6A- do .--.. a4
C C~.C h6.0 £ '' ~ gILaO L4
Q0d
b~IV. 0 2".-
Z~.-qO S LItLa IA
000
6.11
c:b.-E .EU
Q. 6. ovU
La: E o. E~ O~ E - C

Nee IVeI
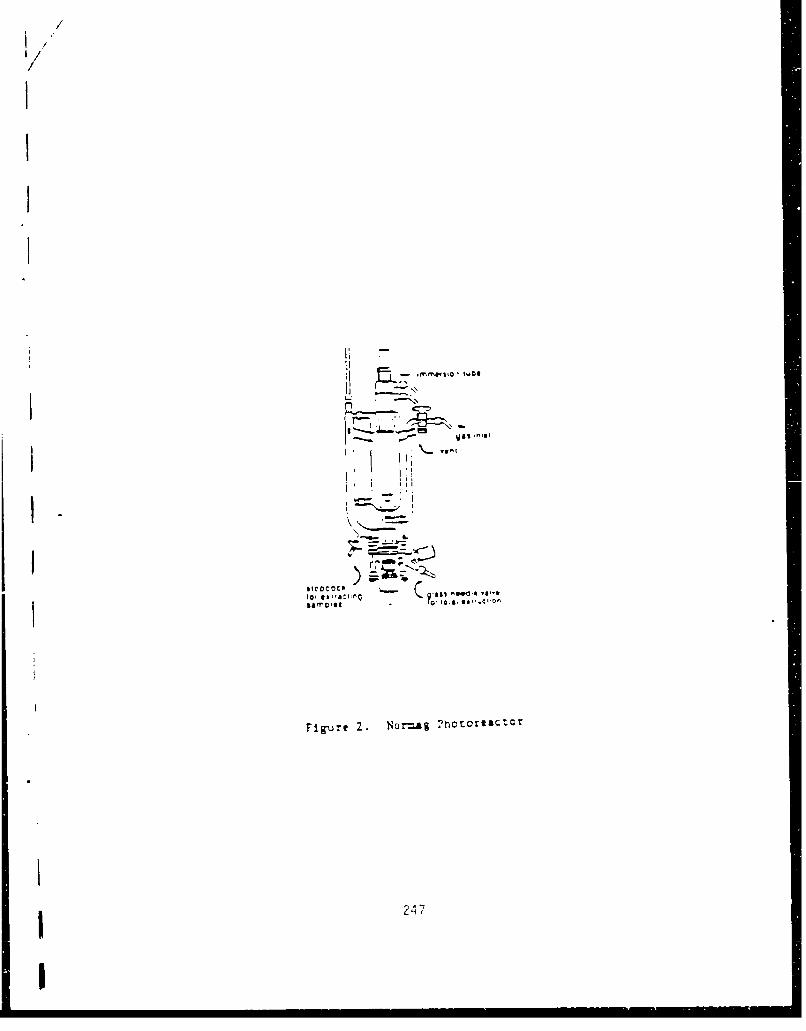
2 4

Ther~ccoupie (typiza1-uncorfined tes:)
/L A ap (con f ned teSL C--IY: j"
'leaded Heater
T /AI
FIgurc 2.Test Setup for 7her-ma.1. Tests

APPENDIX A
/ Granular Activated Carbon Absorption Frocess Description
The process for removing DNT from wastewater is described below. A one inchdiameter column. depicted In Figure 1. will be packed with Filtrasoro 400granular activated carbon from Calgon Carbon Corporation. The column will bepacked so the ONT will contact the activated carbon for 30 minutes. The flowrate will be up to 3 wL/mir. The column will be backflushed with 2 1/2 time-the bed volume distilled water before each test to remove all fineparticulates, air pockets, and to stratify the carbon bed. The proposedexhaustion flow rate, which will be performed by downflow, will be 3 mL/Mn.These tests will determine how many pounds of ONT will be absorbed per pcun'dof granular activated carbon.
I1
I
I

/A
UV/Phctoreactor Process Description
A Ncrrrag photoreactor. depicted In Figure 2. wll be used in these stud~es.
it has a te-ght of 700 rmm, width of 260 vmm, and a depth of 100 nra. The
reaction vessel wll be lacketed to allow exterior heating or cooling. Ozone
will be Introduced through thý gas inlet. The ONT/ozone solutlon will be
citcul~ted down past the radiation source, up the exterior tube. and back down
past the radiation source.
The tests will consist of two types of UV radiatlor sources: (I) a mer-ury
low pressure lamp, which produces intense radiation at 2S4 nm mercury
resonance line, and (2) & mercury high pressure lamo used to emit
characteristic mercury line system foom about 240 nm to well into the visible
range. with the strongest line being 366 nm.
The ozone will be oroduced using oxygen flowing through an Airox Ozotator
Model C2P-3C-2 by Pollution Control IncustrtIes, Inc.
2S


![Army Corps Neg[1]](https://img.dokumen.tips/doc/110x75/577cde9a1a28ab9e78af7164/army-corps-neg1.jpg)