Embed Size (px)
Citation preview
The Independent Science and Partnership Council (ISPC) aims to strengthen the quality, relevance, and
impact of science in the CGIAR.
Foresight Studies analyze emerging issues and trends with the objective of quantifying the research
challenge and the potential impact for agricultural research.
www.sciencecouncil.cgiar.org
Urbanization and Farm Size
in Developing Countries:
Implications for
Agricultural Research
Synthesis of a Foresight Study of
the Independent Science and
Partnership Council
William A. Masters

Page 1 of 20
CGIAR ISPC Foresight Study on
Urbanization and Farm Size in Developing Countries: Implications for Agricultural Research
Synthesis document presented at the 7th
meeting of the ISPC, 25-27 March 2013
Final version for publication, revised 12 May 2013
William A. Masters, Tufts University
http://sites.tufts.edu/willmasters
Executive Summary of Conclusions and Recommendations
The CGIAR was founded in 1971, when the face of global poverty was that of a semi-subsistence
farmer using increasingly scarce land to feed a rapidly growing family. The world’s low-income
countries all had exploding rural populations which, if not provided with locally-adapted seeds,
fertilizer and irrigation, would spread impoverishment and geopolitical instability across Asia, Latin
America and Africa.
Since then CGIAR centers have spread new techniques and institutions through national research and
extension services and all kinds of private-sector agribusinesses to improve food supplies, sharply
reducing the extent and depth of poverty around the world in both rural and urban areas. Many of
the world’s Millennium Development Goals are being met ahead of schedule, as economic growth has
brought industrial and service-sector jobs within sight, transformed agriculture and perhaps ended, or
at least delayed, the Malthusian threat from declining agricultural land, soils and water per farmer.
This report summarizes findings from an ISPC Foresight Study asking what these and other major trends
imply for CGIAR agricultural research priorities. The study is based on five background papers reviewed
by fifteen discussants and debated over a two-day workshop in January 2013, then revised and
synthesized in this document. The workshop agenda and participants are listed at the end of this report,
and all workshop presentations are available online at http://sites.google.com/site/fsustudy2013.
Our deliberations led to the following conclusions and recommendations:
(1) Urbanization and economic development have made global agriculture increasingly
differentiated, creating new opportunities for millions of farmers in commercially dynamic zones,
even as millions more remain isolated in less accessible hinterlands. Heterogeneity is closely tied to
gender barriers and social exclusion as well as geographic isolation. Research priorities for the CGIAR
must be increasingly tailored to this diversity, helping to spread agricultural dynamism while lifting
the productivity of lagging farmers.
(2) Agriculturally dynamic zones often extend quite far from towns and cities, along transport routes
that carry a “quiet revolution” in the commercialization of crops and livestock. In these areas, farms
are served by specialized agribusinesses that exploit scale economies in provision of farm inputs and
marketing of farm outputs, even as crop production remains dominated by household enterprises
with both farm and nonfarm activities. Research priorities in dynamic zones should recognize the
intermediary role of agribusinesses, and provide the new technologies and institutional innovations
needed for competition among the diverse firms that serve farm households.
(3) Isolated hinterland zones offer agricultural households limited opportunities for either farm or
nonfarm activity, due to low productivity and high transaction costs. The boundaries between
dynamic and hinterland zones can shift rapidly as opportunities expand, but those who live in lagging

Page 2 of 20
areas often face worsening poverty due to population growth and resource depletion including
climate change. With limited resources other than labor, hinterland farmers often have no choice but
to farm even as they remain net food buyers, using income from scarce nonfarm employment to
supplement what little they can grow. Thus, CGIAR research priorities in hinterland zones should
recognize those farmers’ resource constraints, and provide the new technologies and institutional
innovations needed to raise the productivity and stability of their agricultural systems, reducing
poverty and supporting a gradual transition towards dynamic agriculture and off-farm employment.
(4) Farm sizes vary widely within each area, reflecting heterogeneity among households as well as
differences in land quality. For most crops, cost-effective farm sizes are that of a household
enterprise that balances the cost of supervising employed workers against any sources of scale
economies such as mechanization. Households bring a variety of assets to their family farm, leading
to a distribution of cropped area and livestock herd sizes that shifts over time in each location. The
poorest households not only have the smallest farms and herd sizes, but often also suffer from gender
bias and many other kinds of discrimination. Meanwhile, the wealthiest or most politically powerful
landowners may accumulate so much land that its productivity falls, due to the high cost of
supervising labor over large areas. Investor-owned farms with hired managers typically succeed only
in crops that are processed on the farm such as tea, sugar and oil palm, or in operations where labor
skills are more readily observed by the employer such as greenhouses or livestock, since remote
monitoring of field operations remains costly despite the spread of GPS devices and variable-rate
technology. For most CGIAR mandate crops, research tailored to the needs of household-sized
operations for self-motivated family farmers has the highest probability of commercial success.
(5) Changes in average farm size depend on rural population growth, which in turn depends on
natural increase minus out-migration from rural areas. During economic development, out-migrants
generally earn higher incomes than those left behind, but urban employment is rationed by the cost
and risk of migration as well as demand for urban goods and services. As the rate of natural increase
slows, rural populations eventually reach their peak and begin to decline, so average farm sizes can
begin to increase. Asia as a whole has already or will soon reach this turning point, but for almost all
of Africa it is decades away. A related transition occurs in livestock based in part on the cost of labor
relative to capital as well as veterinary technologies, driving increases in herd and flock sizes in Asia
that are now starting to be seen in Africa. CGIAR research should anticipate the effect of
demographic trends on average farm sizes; in most African countries farm sizes will continue to
shrink for several more decades, so innovations that are land-saving and readily divisible to serve
smaller plots will have the highest probability of commercial success, whereas in much (but not all)
of Asia innovations to increase farm size are increasingly attractive. For livestock, the emphasis
should be on increasing efficiency with respect to land, water and other resources, as well as the
mitigation of health and environmental externalities.
(6) Targeting agricultural innovations increasingly requires “big data” statistical tools. The
conclusions of this study are framed at the aggregate continental level, but they emphasize
heterogeneity among zones (in the distinction between “dynamic” versus “hinterland” areas), within
any given zone (in the distribution of farm sizes and commercialization levels), and over time (through
shifts in the farm-size distribution that result from demographic trends) and by gender or other social
group (often due to differences in economic opportunity and bargaining power). To operationalize
these conclusions, CGIAR programs should continue to expand their investment in spatial models of
global climate, land use, migration and economic development, to predict changes in what types of
crop or livestock innovations are needed at each location to sustainably increase productivity and
reduce poverty.
Page 3 of 20
CGIAR ISPC Foresight Study on
Urbanization and Farm Size in Developing Countries: Implications for Agricultural Research
Synthesis Document
1. Introduction and Motivation
The goals for this study were laid out in the following excerpt from the project’s Terms of Reference:
Two topics of likely high relevance to the CGIAR as it considers its future priorities over
the next 20 years are (i) farm size dynamics and (ii) urbanization & food demand… the
study will review and summarize the existing literature to map out and understand key
developments in these areas, with an eye to informing the design and prioritization of
agricultural research within the CGIAR.
In analyzing the geographically heterogeneous pattern of changes in farm size and
structure and the increasing importance of urbanization, the study should identify and
prioritize issues requiring further analysis and assessment, including constructing
hypotheses related to combinations of factors affecting those development trends.
Recognizing that these are only two of the important drivers that will shape agriculture
in the decades to come, the study should, to the extent feasible, reference other key
trends and forces.
The study should draw on the best available scientific knowledge, while also
acknowledging the limits and shortcomings of this literature. Where there are likely to
be important uncertainties or disagreements in the projections of future trends, the
study should highlight them and should indicate how these uncertainties might alter the
CGIAR’s research priorities. Though it will ultimately be the responsibility of the study’s
audience – the ISPC and the CGIAR itself – to digest the relevance of the findings and to
translate these findings into research strategies and priorities, the study should (to the
extent possible) take into account the changing context for the CGIAR and its research.
The study’s design rests on five background papers presented and discussed at a two-day workshop in
January 2013, attended by 25 leading experts on various aspects of agricultural development. The
complete agenda and participant list for that workshop are appended to this report. The workshop
aimed to elicit a wide range of views, which we seek to reconcile in this synthesis document. By design,
such a synthesis is neither a summary of the proceedings, nor an independent work of original
scholarship. Instead, the synthesis is based entirely on data and concepts presented at the workshop
and discussed afterwards, reconciling the participants’ diverse views into a single narrative. The
resulting synthesis is based entirely on workshop documents and discussion, but does not replace the
five background papers each of which offers valuable contributions to the ISPC and the CGIAR priority-
setting. Paper authors and workshop participants were deliberately selected to bring diverse and often
conflicting perspectives on the topic. This document does not repeat those divergent arguments, but
provides an original synthesis from the author’s point of view.

Page 4 of 20
2. Urbanization and Rural Population Growth
Average farm sizes are dictated by rural population growth, which in turn is closely tied to urbanization.
Aggregate trends for Africa and Asia since the CGIAR’s founding and over the foresight study period in
these variables are illustrated in Table 1 from Peter Hazell’s background paper:
Table 1: Trends in rural and urban populations, 1970 to 2050, Africa and Asia
Population (millions) Average annual rate of change (%)
1970 2011 2030 2050 1970-2011
2011-2030
2030-2050
Total Population Africa 368 1,046 1,562 2,192 2.55 2.11 1.69 Asia 2,135 4,207 4,868 5,142 1.65 0.77 0.27 Urban population Africa 87 414 744 1,265 3.82 3.09 2.65 Asia 506 1,895 2,703 3,310 3.22 1.87 1.01 Rural population Africa 282 632 818 927 1.97 1.35 0.63 Asia 1,629 2,312 2,165 1,833 0.85 -0.35 -0.83
Source: Hazell 2013, from UN data.
Our focus is on the results shown above in bold, indicating continued high rates of growth in the rural
population of Africa, with lower growth that will soon become a decline in the rural population of Asia.
These same data are used to illustrate year-to-year changes rural as opposed to urban populations in
Figure 1 of Thom Jayne’s background paper:
Figure 1. Changes in rural and urban populations, 1950-2050
Source: Jayne 2013, from UN data in Parnell and Walawege (2012).
The UN urbanization estimates shown in Table 1 and Figure 1 have been subject to great scrutiny by
demographers such as workshop participant Deborah Balk, often using geographic techniques as
described in the background paper by Agnes Andersson Djurfeldt and Magnus Jirström. Both Hazell and

Page 5 of 20
Jayne recognize that the way these estimates were constructed severely limits how they should be
interpreted. In particular, the UN data are derived from national censuses in which the definition of
“urban” or “rural” residence varies widely, so the densities cannot readily be compared across countries.
There may also be systematic differences across continents in statistical procedures. As noted by
Deborah Balk and by Andersson Djurfeldt and Jirström, taking account of increasingly accurate remote-
sensing and geocoded survey data to count seasonal migrants, slum dwellers and the residents of
smaller secondary towns and cities, it appears likely that Africa is actually more rural and less urbanized,
relative to Asia, than these data suggest. In addition, Deborah Balk’s workshop comments explained
how these estimates rely on linear projections between census years, rather than structural
demographic models. Taking account of age-specific fertility, mortality and migration rates, it is likely
that Africa’s rural populations have actually grown more rapidly over time, relative to Asia’s, than these
data suggest.
Other data sources are not sufficiently comprehensive to replace the UN data shown in Table 1 and
Figure 1, but they do indicate that these estimates are really a conservative lower bound on the actual
Asia-Africa differences in rural population growth and hence average farm sizes. Clearly, during the first
three or four decades of CGIAR activity, both Africa and Asia experienced a gradual decline in the total
land available per rural worker. There is great diversity within each continent, but long-term trends are
driving the average farmer in both Africa and Asia to apply more labor on existing land, increasing the
payoff from the development and adoption of labor-using, land-saving techniques such as new seeds
and agronomic techniques. African farmers experienced much steeper declines in land per worker than
Asian farmers, making year-to-year production growth harder for them. Africa’s distinctive
demographic transition also involved much larger increase in child dependency ratios, imposing a
particular burden on women, worsening the cost of unequal access to resources and market
opportunities.
Looking ahead, the shaded area of Figure 1 shows that rural population has or will soon reach its peak in
Asia, but will continue to rise for several more decades in Africa. Some of this change is due to
demographic structure, notably the rapid aging of Asia’s rural populations relative to Africa’s, and some
of it is due to net migration. Local conditions across and within countries influence the exact timing of
this turning point in rural population density, but the average Asian farmer already has or will soon
begin to cultivate land released by neighboring households whose workers have stopped farming. This
rise in total land and other rural resources available per farmer, combined with the increased number
and proximity of urban consumers, farm input suppliers and product marketing firms, ensures that the
average Asian farmer is already or will soon expand output per farm and experience the kind of
commercial dynamism described in detail by Tom Reardon in his background paper, even as the average
African farmer faces several more decades of worsening land scarcity as described by Thom Jayne.
Farm size trends at any given location may vary around the continent-wide trend, and that trend itself
may not be precisely known, but the general direction of demographic change remains among the most
predictable forces driving farmers’ choice of technique and hence CGIAR research priorities identified in
this study. Across Asia, an increasing share of farm households have already or will soon experience an
end to farm-size decline and begin to acquire larger areas, making it newly attractive for them to adopt

Page 6 of 20
land-using, labor-saving techniques with additional equipment and more capital per worker. In contrast,
most of Africa will continue to experience falling average farm sizes for several more decades.
The predictability of these trends arises from demographic momentum and the persistence of age-
specific mortality, fertility and migration rates, combined with economic constraints on the growth rate
of urban employment. As shown in the background paper by Andersson Djurfeldt and Jirström, Annex
Tables A1 and A2, poverty rates are almost universally higher in rural than in urban areas. The gap in
average incomes and living standards is typically larger in poorer countries, and drives a steady flow of
net migration from rural areas into towns and cities. For any given worker, migration is risky and often
seasonal, so net migration rates are smaller than gross flows which include seasonal and circular
movements between various rural and urban locations. Migration itself is costly and urban
opportunities are often highly gendered and age-specific, requiring particular levels of human, social and
financial capital. For all these reasons, the rural-urban income gap tends to narrow over time but it is
not eliminated until countries reach very high levels of income.
The age and sex specific nature of migration is illustrated in Figure 2 from the workshop presentation of
Deborah Balk, showing how access to urban livelihoods in Uganda is concentrated among those who are
15 to 30 years old. Females migrate at somewhat younger ages than males, and migration rates drop
sharply after the age of 30, as urbanization proceeds slowly and drives change in the gender and age
composition of the growing rural population.
Figure 2. Urban in-migration rate by age and gender in Uganda
Source: Balk 2013, from Uganda census data.
In summary, rural population growth determines change in total land area per rural worker and hence
average farm sizes, in predictable ways that can be taken into account when setting CGIAR research
priorities. Most notably, farms in Africa will continue to become smaller and more labor-intensive on

Page 7 of 20
average, even as that trend reverses in Asia where farms will become larger and more capital-intensive.
Underneath these averages, however, there is great heterogeneity within agriculture as described in the
following section.
3. Agricultural Heterogeneity and the Distribution of Farm Sizes
Rural population growth determines average farm size changes, in the sense of total land and other
natural resources available per farm household. Most farm households also have significant nonfarm
activities at all farm sizes and level of farm income, and their mix of those activities vary widely by
location. Crop and livestock activities also vary widely, and farmers typically do not spread out evenly
across all available land as detailed in Thom Jayne’s background paper. Even within cultivated zones
there is great diversity of farm sizes, as illustrated in Table 2. Across all of these surveys, the smallest
quartile of farms are generally much smaller than farms in the largest quartile ones, with about one-
tenth as much land per capita. This reflects differences in land quality, household wealth and many
other variables.
Table 2. Land distribution among smallholder farms in selected African countries
Reprinted from Jayne (2013)
The surveys in Table 2 cover multiple years for Kenya and Rwanda, showing their progressive decline in
average farm sizes. Their farm-size distributions also became more unequal over time, as shown by the
increase in their Gini Coefficients. Indeed this increased dispersion in farm sizes is so great that in Kenya
from 1997 to 2010, and in Rwanda from 1990 to 2000, farms in the largest quartile actually became
larger over time, leaving even less land per farm for the others. It is not clear how or why the largest

Page 8 of 20
farms in these surveys were able to acquire even more land even as other farms became smaller.
Violent conflict and political power may have played a role, along with commercial purchases by
nonresident owners who use earnings from other sectors to buy farmland.
For most field crops, the most cost-effective farm sizes are those cultivated by resident farmers in a
household enterprise, relying primarily on self-motivated family members. Such family farms have
generally displaced colonial plantations, collective farms or state- and investor-owned operations, and
then persist over time even in very high-income countries as explained below. Economically optimal
farm sizes thus rise and fall with the relative scarcity of labor relative to land, implying that optimal farm
sizes across Africa will continue to fall for several more decades until agricultural population density
reaches its peak. Only when agricultural population density begins to decline will optimal farm size will
turn upward as it has in other regions with earlier demographic transitions.
The link between rural population density and optimal farm size is driven by the difficulty of supervision
and offsite management for many field crop operations such as planting, fertilizing, irrigation or
drainage and pest or weed control. Whether such tasks are done correctly is often unobservable,
because they require location-specific response to changes in natural conditions that intervene to
influence the harvest. Self-motivated family members therefore do these tasks more effectively at
lower cost. Family enterprises continue to dominate crop production as incomes rise, even in the US,
Australia or Japan, with farm sizes varying in proportion to land productivity and other factors.
Farms with many nonfamily workers typically arise mainly in settings with state-restricted labor and land
rights, such as serfdom and slavery, or colonialism, socialism and state capitalism. Such systems have
often built up large farms, often using subsidized capital as well as restricted land and labor. Almost all
of these have been broken up in recent decades, and been replaced by more efficient family enterprises
as soon as labor is freed to move onto their own purchased, rented or sharecropped land. The major
exceptions are crops that must be processed on the farm or in close coordination with the harvest,
notably tea, sugar and oil palm, or crops that are produced under highly uniform, controlled conditions
such as flowers and high-value vegetables, or many livestock operations. In these cases, scale
economies in machinery and buildings and marketing or processing activities are sufficient to outweigh
any costs of labor supervision, resulting in efficiencies at larger farm sizes.
For most field crops, the difficulty of supervising nonfamily workers ensures that the most efficient,
least-cost farm size is that which suits a family enterprise, and hence moves in line with rural population
densities. For livestock, as detailed in Cees de Haan’s background paper, the situation is very different:
herd and flock sizes are influenced not by rural land/labor ratios as much as by wage rates relative to the
capital costs of animal ownership, so herd sizes have risen sharply in Asia and are already rising in Africa
despite the decline in farm sizes for Africa’s field crops. The difference between most field crops and
most livestock arises in part because supervision of hired labor is relatively easier for animal care,
particularly those raised under controlled conditions such as pigs and poultry; dairy remains the major
livestock sector where size of operation is typically tied to the scale of a family enterprise.

Page 9 of 20
Future technologies could change the economics of farm size, of course. At the technology frontier in
the U.S., Australia, Brazil and elsewhere, software and hardware is being introduced in an effort to
replace farmers’ real-time judgments and make it possible for investor-owned farms using hired
managers to compete with family operations. Key elements of field crop automation include GPS units
on auto-steer tractors, using soil sensor data to control variable-rate input applicators. Laser-leveling
and other investments can make the environment more uniform, but farmers still need to make
adjustments on the fly in response to real-time weather. The profitability of precision agriculture is
therefore dependent not only on the cost of capital relative to labor, but also on the quality of the
algorithm that adjusts input use in response to changing conditions. Even if these automated field
operations are commercialized successfully in some settings, therefore, the willingness and ability of
self-motivated farmers to adapt themselves and learn quickly how to farm elsewhere ensures that much
of agriculture will remain dominated by family enterprises – including particularly in Africa.
Ken Giller’s workshop discussion provided an agronomic perspective on the challenges brought by falling
farm sizes in the African setting, particularly for the most resource-poor farm households. He used a
stylized distribution shown by the solid line in Figure 3 to explain how the smallest farms, whether
measured in terms of land, livestock or other resources, often cluster near the lower bound of survival.
The modal farm will be somewhat above that minimum size, while a small number of farms enjoy much
larger resource endowments. With the important exception of crops that offer scale economies from
on-farm processing, even the large farms remain family enterprises. As shown by the comparison of
columns (b) and (c) in Table 2 above, they average four to six family members per farm, irrespective of
cropped area across countries. As these farms’ land area shrinks, research must focus on increasingly
labor-intensive, yield-increasing methods for agroecological management of their crops and livestock.
The changes over time in quartile averages and Gini Coefficients shown in Table 2 can be illustrated in
Figure 3 by a change from the solid to the dashed distribution. The dashed curve is wider at both tails,
as the many small farms have shrunk even as the few large farms grow. An extreme version of this story
has occurred in Zambia and elsewhere in recent decades, with prime land along transport routes being
ceded to a few very large farms similar to those developed during the colonial era in Zimbabwe, South
Africa and other countries with latifundia-type agriculture. These farms use capital-intensive irrigation
and machinery, much of which is operated by hired managers and farm workers, even as most Zambian
farm households cultivate smaller and smaller areas in the agricultural hinterland.
Figure 3. Stylized distributions of farm size
Source: Adapted from Giller (2013)
Number of far
Resource endowment per farm

Page 10 of 20
For field crops, farms at the extreme right tail of the farm-size distribution typically incur higher total
costs per unit of output than the modal farms, due to their capital intensity and difficulty of supervising
hired labor. Resource-starved farms at the extreme left tail of the distribution may be similarly
inefficient, especially when they result from recent demographic changes that leave these households
increasingly feminized, rapidly aging or socially excluded for other reasons, which compounds the
challenges they may face from soil degradation, water depletion, climate change and other constraints.
In summary, demographic and other changes have altered both average farm sizes and their
distribution. For CGIAR research priorities, our principal forecast is that Africa’s most resource-poor
farmers will become even more impoverished, unless they are equipped with new seed varieties and
agronomic techniques adapted to their newly constrained circumstances, as well as policies and
institutions that promote economic inclusion and market access. At the other end of the farm size
distribution, the largest farms in Africa may become even larger, but their growth is likely to be driven
by political influence or market failures, coming at the expense of more efficient modal-size farms. Only
where migrants can settle previously uncultivated lands or machinery provides sufficient scale
economies to justify labor supervision will African farm sizes grow, whereas for much of Asia average
farm sizes have already begun to expand in keeping with that region’s falling rural population density.
4. Agricultural Commercialization and Input Use in “Dynamic” and “Hinterland” Zones
The trends in farm size described in the previous section drive changes in land-to-labor ratios, with
important implications for the kinds of innovation that farmers are seeking. Urbanization and economic
development also brings a very different set of changes to the farm, through demand for farm outputs
and opportunities for increased commercialization and input use. As dynamism spreads to previously
hinterland areas, even a shrinking farm can become increasingly commercialized. This often involves
specialized capital investment, for example when developing a zero-grazing dairy, a fruit orchard or a
vegetable garden, but can also occur for staple food production. The workshop comments of Carl Pray
described how input supply firms combine innovations from public sources such as the CGIAR with their
own innovations to produce locally adapted techniques.
Tom Reardon’s background paper describes in detail how this works in the dynamic agricultural zones of
Asia, where falling transaction costs and increased capital availability per worker have led to a
remarkable “quiet revolution” in food supply chains within rural areas and from there to urban
consumers. He estimates that half to two-thirds of Asia’s food production is already fully
commercialized, in the sense of being produced for intermediaries serving urban consumers. This has
major implications for agricultural technologies, as it facilitates a sharp increase in the use of purchased
inputs and specialized capital often provided by small, local agribusinesses. Many activities previously
done by family members on the farm are increasingly purchased from others, including contract
providers of custom services. The transformation also changes market institutions. For example,
Reardon documents the rise of competing cold stores that buy potatoes for urban markets in India,
Bangladesh and China. These have broken historical monopolies, improved farmers’ terms of trade, and
created a competitive market for inputs and farm credit as well. It is only in the “hinterland” areas with

Page 11 of 20
high transaction costs that these markets remain interlinked, with monopsony buyers who provide tied
credit for specific inputs.
Similar dynamic zones arise around African towns and cities, along their main transport and
communications routes. But the magnitude of transformation is much smaller, as most African farm
households are still operated as semi-subsistence operations, often as net buyers of crops that they also
grow themselves. Table 3 below from Jayne (2013) illustrates this for maize in East and Southern Africa.
Table 3. Net maize sales by farm size in Kenya, Malawi, Mozambique and Zambia
Country % of
sample
Net maize sales/adult equivalent
(kgs) Farm size (hectares)
Value of household
assets (US dollars)
Total household income/adult
equivalent (US dollars)
Kenya (2010)
Large sellers 26.9 668 3.7 4 032 984
Small sellers 11.5 57 1.9 2 491 488
Occasional buyers 37.3 -5 1.8 2 912 494
Consistent buyers 24.3 -64 1.4 1 801 471
Malawi (2007)
Large sellers 2.2 542 2.0 1 915 258
Small sellers 4.7 50 1.8 298 75
Occasional buyers 48.2 -4 1.4 248 60
Consistent buyers 44.9 -93 1.1 195 50
Mozambique (2005)
Large sellers 10.4 na 3.3 194 312
Small sellers 16.7 na 2.7 120 151
Occasional buyers 41.1 na 1.8 92 119
Consistent buyers 32.8 na 1.8 121 103
Zambia (2008)
Large sellers 19.5 556 3.0 1 756 488
Small sellers 7.5 59 2.1 642 241
Occasional buyers 42.4 -4 1.6 454 182
Consistent buyers 30.7 -88 1.4 642 252
Source: Adapted from Jayne (2013)
Table 3 suggests that in these countries, the most commercialized maize sellers are the largest farms.
This need not be the case for all crops, to the extent that CGIAR research successfully develops
intensification techniques suited to African farmers’ growing conditions and shrinking farm sizes. To the
extent that these innovations serve urban consumers for high-value and differentiated products, their
adoption domain may be limited to dynamic zones with low cost of transport to towns and cities. But
Table 3 reveals that a very large market is offered by the on-farm consumption of rural households
themselves, when they lack enough land to meet their needs. Developing and disseminating the seed
varieties and agronomic techniques needed to achieve a declining real cost of food for everyone,
including net food buyers in isolated rural areas, is a key pathway to impact for CGIAR research.

Page 12 of 20
5. Dietary Change and Food System Transformation
The commercial dynamism described in the previous section generally follows transportation routes,
reducing transaction costs and opening up low performance but high potential zones for increased
specialization and trade. Along with changes in the mix of inputs comes a dietary transition in the mix of
outputs from lower- to higher-value foods associated with income growth, including the highly visible
transformation of food systems from traditional products to branded goods in supermarkets.
Dietary change across types of food is illustrated in Figure 4, from the workshop presentation of Anita
Regmi. This chart shows how income growth drives consumer expenditure towards higher-value foods
and other products. At low levels of income such as Rwanda, about 20% of any increase in spending on
food goes towards increased consumption of cereal grains. An additional 20% goes towards meat and
fish. About 10% is spent on dairy, oils and fats, and about 20% is spent on produce including tubers.
The remaining 30-35% is split between food away from home and beverages or tobacco.
Figure 4. Composition of one additional currency unit of food expenditure
Source: Regmi (2013), from ERS Technical Bulletin 1929, “International Evidence on Food Consumption Patterns:
An Update Using 2005 International Comparison Program Data”.
The data shown in Figure 4 reveal how food prices are particularly important for reducing extreme
poverty, as price declines driven by agricultural productivity growth release funds for other things. The
total of cereals, meats, fish, dairy, oils and fats, and produce including tubers takes up 60% of
incremental spending at the income level of Bangladesh, but only 40% at the level of Argentina, and
30% at the level of the United States.
For CGIAR priority-setting, a particularly important question is how quickly demand for animal-sourced
foods is likely to grow. This matters both for the absolute level of demand for cereal grains and oilseeds,

Page 13 of 20
and for the degree to which cropland is devoted to commodity crops for animal feed as opposed to
other crops for human consumption. Cees de Haan’s background paper addresses this question in
detail, using evidence such as Figure 5 from Ethiopia.
Figure 5. Meat consumption and income in Ethiopia by urban/rural residence, 1996-2004
Source: De Haan (2013), from Betra and Kawashima (2009).
Figure 5 reveals three distinct patterns. First, confirming the previous result from Anita Regmi, higher
incomes are associated with higher meat consumption. Second, for any given level of measured
income, meat consumption is higher in urban areas. Third, controlling for income and location, the only
visible shift over time appears for the higher income rural households, who consume more meat in 2000
and 2004 than they did in 1996. These results suggest a fairly stable, predictable pattern ahead, as
urbanization and increased incomes both drive higher meat consumption and the need for sharp
increases in animal feeds within Africa as well as in Asia.
A final dimension of food system transformation is the “supermarket revolution”, characterized by
increasing consumer demand for the uniformity, packaging and convenience offered by formal retail
outlets as opposed to traditional markets. Reardon had documented the extraordinary speed and depth
of this transformation across Asia and Latin America. Figure 6 from Jayne shows the much smaller
penetration achieved in African cities, where even the wealthiest quintile of consumers continue to buy
most of their staple foods from informal retailers and open markets as opposed to any kind of
supermarket.

Page 14 of 20
Figure 6. Consumer expenditure shares on staple food products by retailer type
Panel A. Nairobi, Kenya, 2003
Panel B. Four cities of Zambia, 2008
Source: Jayne 2013.

Page 15 of 20
6. From Foresight to Recommendations: Conclusions for CGIAR Research Priorities
To draw recommendations for CGIAR research priorities, discussion at the foresight study workshop
focused on categorizations offered by Tom Reardon and Peter Hazell. Reardon’s distinction between
“dynamic” and “hinterland” areas focuses primarily on commercialization, which is typically driven by
transaction costs and access to urban product demands as well as input provision. Hazell’s
categorization combines that with farm size and propensity to migrate out of agriculture entirely. Here
we use a slightly modified version of Hazell’s terminology, modified in accordance with discussion
among the workshop participants. The categories we propose follow from the previous discussion in
this synthesis report:
• “Subsistence” farming households are low-income, semi-autarkic or net food buyers. They are
characterized by a low use of purchased inputs and low sale of farm outputs. They are often
women, may be geographically isolated, nearly landless, frequently ill, socially excluded or
have particularly insecure property rights, and are pursuing food and cash crop production
largely because they have very limited other options to meet household needs.
• “Commercial” farmers are now or could soon be closely linked to product value chains and
input suppliers, and sufficiently specialized to separate their farm production decisions from
household consumption preferences. They have or will soon invest in significant fixed capital
for their farm, and may also have access to credit markets through which to borrow additional
funds as well as land rental or purchase opportunities with which to expand their farm
operation. Although they are “farming as a business”, it is not their only business. Across all
kinds of countries, most commercial farmers also have significant nonfarm income.
• “Transitional” farm families aim to leave farming. They may have high or low levels of farm
income, but their principal objective is to develop the skills and assets needed to exit from
agriculture. Farm earnings are often needed to help them build human capital, start nonfarm
enterprises or migrate successfully.
Table 4 shows how farms of each type might transition over time, from left to right across each row.
These desirable objectives to be supported by CGIAR research strategies would, for example, help a
subsistence farmer become either a commercial farmer or move to nonfarm activity. A commercial
farmer might be helped to intensify their operation on their existing land, or to acquire additional plots
and become a larger farm, and in a few cases they might sell a profitable operation and exit from the
sector. Finally, a transitional farmer might be helped to become commercial, or they might use
agricultural earnings to exit from farming. The relative size of these three groups will vary by country
context, and it is often very difficult to predict which household will end up in each category, but in all
cases higher agricultural productivity would help the household achieve its desired transitions.
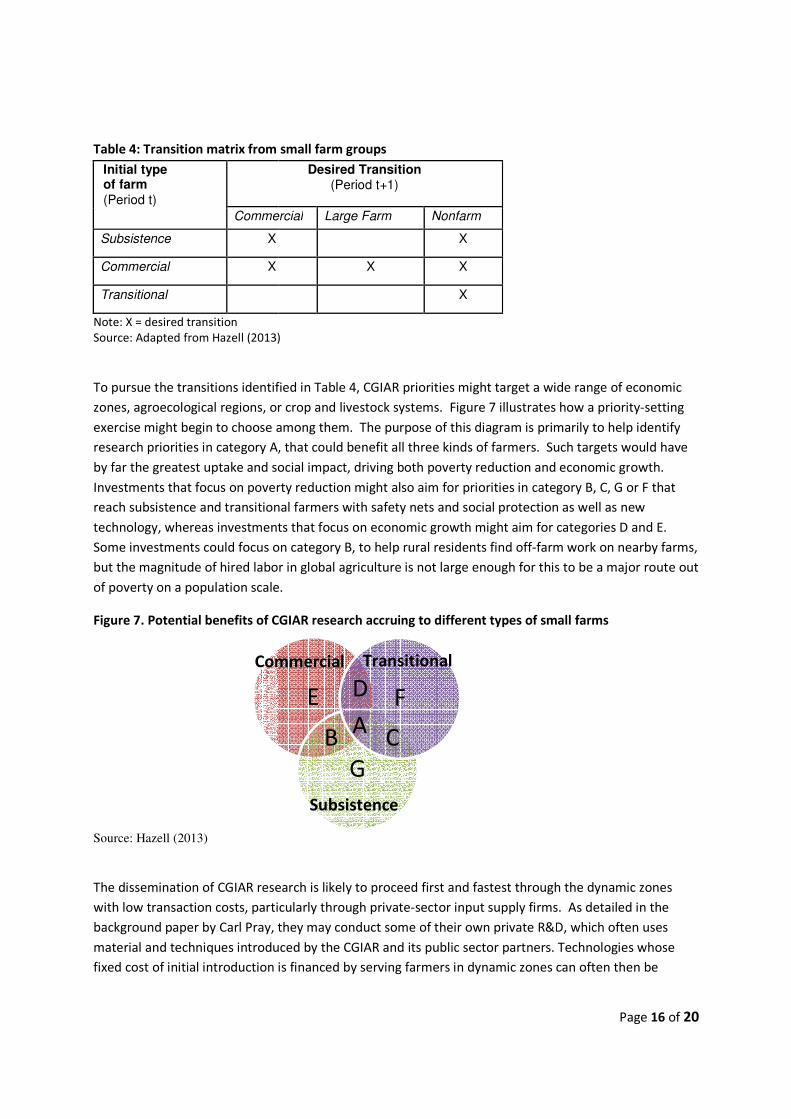
Table 4: Transition matrix from small farm groups
Initial type of farm
(Period t)
Commercial
Subsistence X
Commercial X
Transitional
Note: X = desired transition
Source: Adapted from Hazell (2013)
To pursue the transitions identified in Table 4, CGIAR priorities might target a wide range of economic
zones, agroecological regions, or crop and livestock systems. Figure 7 illustrates how a priority
exercise might begin to choose among them. T
research priorities in category A, that could benefit all three kinds of farmers. Such targets would have
by far the greatest uptake and social impact, driving both poverty reduction and economic gr
Investments that focus on poverty reduction might
reach subsistence and transitional
technology, whereas investments that focus on
Some investments could focus on category B, to help rural residents find off
but the magnitude of hired labor in global agriculture is not large enough for this to be a major rou
of poverty on a population scale.
Figure 7. Potential benefits of CGIAR research accruing to different types of small farms
Source: Hazell (2013)
The dissemination of CGIAR research is likely to
with low transaction costs, particularly through private
background paper by Carl Pray, they may conduct some of their own privat
material and techniques introduced by the CGIAR and its public sector partners. Technologies
fixed cost of initial introduction is financed by serving
Commercial
from small farm groups
Desired Transition (Period t+1)
Commercial Large Farm Nonfarm
X
X X
X
Source: Adapted from Hazell (2013)
To pursue the transitions identified in Table 4, CGIAR priorities might target a wide range of economic
zones, agroecological regions, or crop and livestock systems. Figure 7 illustrates how a priority
exercise might begin to choose among them. The purpose of this diagram is primarily
research priorities in category A, that could benefit all three kinds of farmers. Such targets would have
by far the greatest uptake and social impact, driving both poverty reduction and economic gr
Investments that focus on poverty reduction might also aim for priorities in category
transitional farmers with safety nets and social protection as well as new
, whereas investments that focus on economic growth might aim for categor
Some investments could focus on category B, to help rural residents find off-farm work on nearby farms,
but the magnitude of hired labor in global agriculture is not large enough for this to be a major rou
of poverty on a population scale.
Figure 7. Potential benefits of CGIAR research accruing to different types of small farms
CGIAR research is likely to proceed first and fastest through the dynamic zones
, particularly through private-sector input supply firms
background paper by Carl Pray, they may conduct some of their own private R&D,
material and techniques introduced by the CGIAR and its public sector partners. Technologies
fixed cost of initial introduction is financed by serving farmers in dynamic zones can often then
E
G
F
C
D
B A
Commercial Transitional
Subsistence
Page 16 of 20
To pursue the transitions identified in Table 4, CGIAR priorities might target a wide range of economic
zones, agroecological regions, or crop and livestock systems. Figure 7 illustrates how a priority-setting
primarily to help identify
research priorities in category A, that could benefit all three kinds of farmers. Such targets would have
by far the greatest uptake and social impact, driving both poverty reduction and economic growth.
aim for priorities in category B, C, G or F that
with safety nets and social protection as well as new
economic growth might aim for categories D and E.
farm work on nearby farms,
but the magnitude of hired labor in global agriculture is not large enough for this to be a major route out
Figure 7. Potential benefits of CGIAR research accruing to different types of small farms
through the dynamic zones
sector input supply firms. As detailed in the
e R&D, which often uses
material and techniques introduced by the CGIAR and its public sector partners. Technologies whose
can often then be

Page 17 of 20
adapted and supplied to more remote locations as well. The CGIAR should also aim to develop and
facilitate dissemination of innovations aimed directly at subsistence, resource-poor farmers in
hinterland areas, both to promote their transition to commercialization and also to reduce their poverty
and facilitate their eventual exit from agriculture. In these settings, a small absolute increase in output
or reduction in land, labor and other inputs corresponds to a large proportional increase in productivity.
International agricultural research and policy change is a powerful instrument for sustainable poverty
reduction among all types of farmers, particularly when it spreads productive innovations that are scale-
neutral and divisible to reach small farms. Many other interventions are also needed for economic
development, but the CGIAR’s toolkit is particularly powerful precisely because the fruits of
international agricultural research complement those interventions, and make them more worthwhile.
For example, institutions and infrastructure to support market development are more productive when
farmers can adopt productivity-enhancing innovations – and likewise, social protection and safety nets
are more affordable when agricultural productivity is higher, and environmental sustainability is easier
to achieve when innovations to reduce resource use and limit negative externalities are available.
Furthermore, although the name and structure of the CGIAR highlights its cross-country focus on
international exchange of knowledge and materials, the ultimate goal is always highly location-specific
and tailored to a particular group of farmers. As emphasized in this report, heterogeneity within
countries calls for differentiated strategies, with research activities guided by the systematic use of
large-scale geocoded datasets. The CGIAR’s international mandate gives it a particular comparative
advantage in this kind of “big data” research, including simulation modeling and impact assessment.
In summary, the spread of agricultural dynamism enables many farmers to use international agricultural
research all the more effectively, even as those left behind in hinterlands need it all the more urgently,
while new measurement tools allow the CGIAR to target its work all the more precisely. Our specific
conclusions and recommendations are listed in the Executive Summary, and are repeated here:
(1) Urbanization and economic development have made global agriculture increasingly
differentiated, creating new opportunities for millions of farmers in commercially dynamic zones,
even as millions more remain isolated in less accessible hinterlands. Heterogeneity is closely tied to
gender barriers and social exclusion as well as geographic isolation. Research priorities for the CGIAR
must be increasingly tailored to this diversity, helping to spread agricultural dynamism while lifting
the productivity of lagging farmers.
(2) Agriculturally dynamic zones often extend quite far from towns and cities, along transport routes
that carry a “quiet revolution” in the commercialization of crops and livestock. In these areas, farms
are served by specialized agribusinesses that exploit scale economies in provision of farm inputs and
marketing of farm outputs, even as crop production remains dominated by household enterprises
with both farm and nonfarm activities. Research priorities in dynamic zones should recognize the
intermediary role of agribusinesses, and provide the new technologies and institutional innovations
needed for competition among the diverse firms that serve farm households.
(3) Isolated hinterland zones offer agricultural households limited opportunities for either farm or
nonfarm activity, due to low productivity and high transaction costs. The boundaries between
dynamic and hinterland zones can shift rapidly as opportunities expand, but those who live in lagging

Page 18 of 20
areas often face worsening poverty due to population growth and resource depletion including
climate change. With limited resources other than labor, hinterland farmers often have no choice but
to farm even as they remain net food buyers, using income from scarce nonfarm employment to
supplement what little they can grow. Thus, CGIAR research priorities in hinterland zones should
recognize those farmers’ resource constraints, and provide the new technologies and institutional
innovations needed to raise the productivity and stability of their agricultural systems, reducing
poverty and supporting a gradual transition towards dynamic agriculture and off-farm employment.
(4) Farm sizes vary widely within each area, reflecting heterogeneity among households as well as
differences in land quality. For most crops, cost-effective farm sizes are that of a household
enterprise that balances the cost of supervising employed workers against any sources of scale
economies such as mechanization. Households bring a variety of assets to their family farm, leading
to a distribution of cropped area and livestock herd sizes that shifts over time in each location. The
poorest households not only have the smallest farms and herd sizes, but often also suffer from gender
bias and many other kinds of discrimination. Meanwhile, the wealthiest or most politically powerful
landowners may accumulate so much land that its productivity falls, due to the high cost of
supervising labor over large areas. Investor-owned farms with hired managers typically succeed only
in crops that are processed on the farm such as tea, sugar and oil palm, or in operations where labor
skills are more readily observed by the employer such as greenhouses or livestock, since remote
monitoring of field operations remains costly despite the spread of GPS devices and variable-rate
technology. For most CGIAR mandate crops, research tailored to the needs of household-sized
operations for self-motivated family farmers has the highest probability of commercial success.
(5) Changes in average farm size depend on rural population growth, which in turn depends on
natural increase minus out-migration from rural areas. During economic development, out-migrants
generally earn higher incomes than those left behind, but urban employment is rationed by the cost
and risk of migration as well as demand for urban goods and services. As the rate of natural increase
slows, rural populations eventually reach their peak and begin to decline, so average farm sizes can
begin to increase. Asia as a whole has already or will soon reach this turning point, but for almost all
of Africa it is decades away. A related transition occurs in livestock based in part on the cost of labor
relative to capital as well as veterinary technologies, driving increases in herd and flock sizes in Asia
that are now starting to be seen in Africa. CGIAR research should anticipate the effect of
demographic trends on average farm sizes; in most African countries farm sizes will continue to
shrink for several more decades, so innovations that are land-saving and readily divisible to serve
smaller plots will have the highest probability of commercial success, whereas in much (but not all)
of Asia innovations to increase farm size are increasingly attractive. For livestock, the emphasis
should be on increasing efficiency with respect to land, water and other resources, as well as the
mitigation of health and environmental externalities.
(6) Targeting agricultural innovations increasingly requires “big data” statistical tools. The conclusions
of this study are framed at the aggregate continental level, but they emphasize heterogeneity among
zones (in the distinction between “dynamic” versus “hinterland” areas), within any given zone (in the
distribution of farm sizes and commercialization levels), and over time (through shifts in the farm-size
distribution that result from demographic trends) and by gender or other social group (often due to
differences in economic opportunity and bargaining power). To operationalize these conclusions, CGIAR
programs should continue to expand their investment in spatial models of global climate, land use,
migration and economic development, to predict changes in what types of crop or livestock
innovations are needed at each location to sustainably increase productivity and reduce poverty.

Annex 1: Agenda
Page 19 of 20
Final Agenda for ISPC Foresight Study Workshop on
Urbanization and Farm Size in Developing Countries: Implications for Agricultural Research
Tufts University, Boston, 25-26 January 2013
WORKSHOP AGENDA AND LIST OF BACKGROUND PAPERS*
Friday 25th
January
08:00 Continental breakfast
08:30 Welcome and Introductions -- Ken Cassman
08:40 Chair’s opening remarks -- Will Masters
08:45 Urbanization & Changes in Farm Size in Asia -- Tom Reardon
09:15 Lead discussants: Steve Wiggins, Bharat Ramaswamy
10:00 Urbanization & Changes in Farm Size in Africa -- Thom Jayne
10:30 Lead discussants: Margaret McMillan, Agnes Quisumbing
11:10 Coffee Break
11:30 Urbanization & Changes in Farm Size -- Agnes Andersson Djurfeldt & Magnus Jirström
12:00 Lead discussants: Awudu Abdulai, Anita Regmi
12:40 Lunch
13:45 Changes in the structure and size of livestock herds/husbandry in Asia & SSA -- Cees de Haan
14:15 Lead discussants: Clare Narrod, Steve Staal
14:55 Urbanization & Changes in Farm Size in Asia & SSA -- Peter Hazell
15:25 Lead discussants: Derek Byerlee, Deborah Balk
16:05 Coffee Break
16:20 Respondents’ panel – Ken Giller, Jerry Nelson, Carl Pray, Cheryl Doss
17:20 ISPC Panel –Ken Cassman, Timothy Kelley, Doug Gollin
18:00 Open discussion: key issues emerging, and questions for day 2 – Will Masters
18:30 Adjourn
19:30 Workshop dinner
Saturday 26th
January
8:30 Continental breakfast
9:00 Authors’ panel – T. Reardon, T. Jayne, A. Andersson-Djurfeldt, C. de Haan and P. Hazell
10:00 Lead discussant—Kei Otsuka
10:45 Break
11:00 Discussion and conclusions – Will Masters
12:15 Wrap-up and next steps – Ken Cassman
*Titles of background papers are underlined in the workshop agenda.

Annex 2: Contact Information
Page 20 of 20
CONTACT INFORMATION FOR ALL WORKSHOP PARTICIPANTS
Coordinator/Host
Will Masters [email protected]
Paper authors
Agnes Andersson Djurfeldt [email protected]
Cees de Haan [email protected]
Peter Hazell [email protected]
Thom Jayne [email protected]
Magnus Jirström [email protected]
Tom Reardon [email protected]
Discussants
Awudu Abdulai [email protected]
Deborah Balk [email protected]
Derek Byerlee [email protected]
Cheryl Doss [email protected]
Ken Giller [email protected]
Margaret McMillan [email protected]
Clare Narrod [email protected]
Jerry Nelson [email protected]
Kei Otsuka [email protected]
Carl Pray [email protected]
Agnes Quisumbing [email protected]
Bharat Ramaswami [email protected] / [email protected]
Anita Regmi [email protected]
Steve Staal [email protected]
Steve Wiggins [email protected]
ISPC panel
Ken Cassman [email protected]
Doug Gollin [email protected]
Tim Kelley [email protected]
Note-takers
Dana Goldman [email protected]
Nadira Saleh [email protected]