Embed Size (px)
Citation preview
February 2016
Draft Copy
2015 URBAN WATER
MANAGEMENT PLAN
2015
URBAN WATER MANAGEMENT PLAN
City of Santa Monica
Water Resources Division, Public Works Department City of Santa Monica, 1212 5th Street, 3rd Floor
Santa Monica, CA 90401 (310) 458-8286 phone
(310) 393-6697 fax
February 2016 Draft Copy
Prepared by:
CONSULTING ENGINEERS 1130 W. Huntington Drive
Unit 12 Arcadia, CA91007
(626) 821-3456
DRAFT
CITY OF SANTA MONICA URBAN WATER MANAGEMENT PLAN 2015
2015 URBAN WATER MANAGMENT PLAN TABLE OF CONTENTS
TOC - 1
TABLE OF CONTENTS
Section 1: Introduction
Section Page
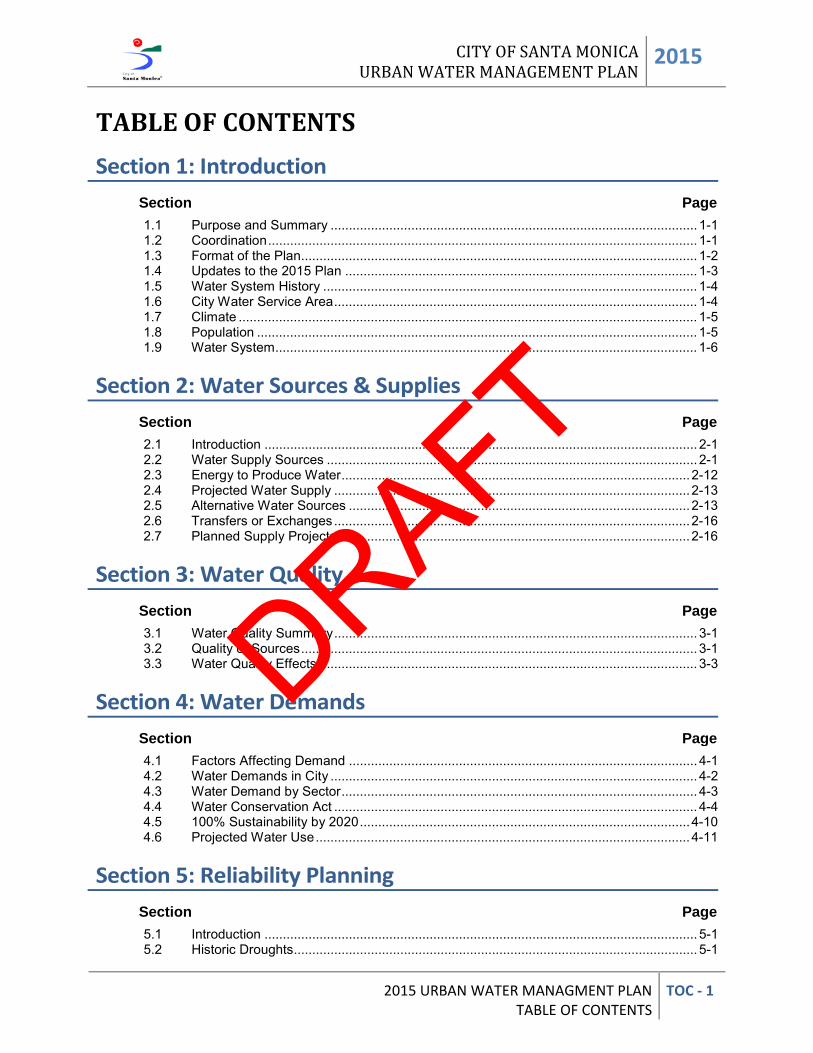
1.1 Purpose and Summary .................................................................................................... 1-1 1.2 Coordination ..................................................................................................................... 1-1 1.3 Format of the Plan............................................................................................................ 1-2 1.4 Updates to the 2015 Plan ................................................................................................ 1-3 1.5 Water System History ...................................................................................................... 1-4 1.6 City Water Service Area ................................................................................................... 1-4 1.7 Climate ............................................................................................................................. 1-5 1.8 Population ........................................................................................................................ 1-5 1.9 Water System ................................................................................................................... 1-6
Section 2: Water Sources & Supplies
Section Page
2.1 Introduction ...................................................................................................................... 2-1 2.2 Water Supply Sources ..................................................................................................... 2-1 2.3 Energy to Produce Water ............................................................................................... 2-12 2.4 Projected Water Supply ................................................................................................. 2-13 2.5 Alternative Water Sources ............................................................................................. 2-13 2.6 Transfers or Exchanges ................................................................................................. 2-16 2.7 Planned Supply Projects ................................................................................................ 2-16
Section 3: Water Quality
Section Page
3.1 Water Quality Summary ................................................................................................... 3-1 3.2 Quality of Sources ............................................................................................................ 3-1 3.3 Water Quality Effects ....................................................................................................... 3-3
Section 4: Water Demands
Section Page
4.1 Factors Affecting Demand ............................................................................................... 4-1 4.2 Water Demands in City .................................................................................................... 4-2 4.3 Water Demand by Sector ................................................................................................. 4-3 4.4 Water Conservation Act ................................................................................................... 4-4 4.5 100% Sustainability by 2020 .......................................................................................... 4-10 4.6 Projected Water Use ...................................................................................................... 4-11
Section 5: Reliability Planning
Section Page
5.1 Introduction ...................................................................................................................... 5-1 5.2 Historic Droughts .............................................................................................................. 5-1
DRAFT
2015 CITY OF SANTA MONICA URBAN WATER MANAGEMENT PLAN
TOC - 2 2015 URBAN WATER MANAGMENT PLAN TABLE OF CONTENTS
TABLE OF CONTENTS (CONT.)
Section 5: Reliability Planning (cont.)
Section Page
5.3 Recent Drought ................................................................................................................ 5-2 5.4 Regional Supply Reliability .............................................................................................. 5-3 5.5 Supply vs. Demand .......................................................................................................... 5-7 5.6 Vulnerability of Supply ................................................................................................... 5-17 5.7 Water Supply Opportunities ........................................................................................... 5-17
Section 6: Conservation Measures
Section Page
6.1 Introduction ...................................................................................................................... 6-1 6.2 CUWCC Membership....................................................................................................... 6-1 6.3 Conservation Measures ................................................................................................... 6-2 6.4 City Conservation Policies ............................................................................................... 6-3
Section 7: Contingency Planning
Section Page
7.1 Introduction ...................................................................................................................... 7-1 7.2 City Response Plan.......................................................................................................... 7-1 7.3 Three Year Minimum Supply ........................................................................................... 7-3 7.4 Catastrophic Interruptions ................................................................................................ 7-3 7.5 Prohibitions ...................................................................................................................... 7-4 7.6 Fiscal Impacts .................................................................................................................. 7-4 7.7 Council Ordinance............................................................................................................ 7-5 7.8 Mechanisms To Determine Reductions In Water Use ..................................................... 7-5
Section 8: Climate Change
Section Page
8.1 Introduction ...................................................................................................................... 8-1 8.2 Climate Change Impacts .................................................................................................. 8-1 8.3 Climate Change Impacts on City Water Supplies ............................................................ 8-2 8.4 Potential City Water Supplies to Deal with Long Term Climate Change ......................... 8-2 8.5 Existing City Policies on Climate Change ........................................................................ 8-3
Appendices
Appendix Description
Appendix A ....................................................................................................................... References Appendix B ....................................................................................................................... UWMP Act Appendix C ................................................................................................................. DWR Checklist Appendix D ............................................................... City Council Resolution Adopting 2010 UWMP
DRAFT
CITY OF SANTA MONICA URBAN WATER MANAGEMENT PLAN 2015
2015 URBAN WATER MANAGMENT PLAN TABLE OF CONTENTS
TOC - 3
TABLE OF CONTENTS (CONT.)
Appendices (cont.)
Appendix Description
Appendix E ......................................................................................... CUWCC Reports (2006-2010) Appendix F ....................................................................................................... Sustainable City Plan Appendix G .............................................. City Ordinance No. ( ) - Water Shortage Response Plan Appendix H ................... City of Santa Monica - Water Efficient Landscape and Irrigation Standards Appendix I ......................................................................................... MWD 2010 RUWMP Section II
Appendix J ............................................................................................................ Public Notification Appendix K ...................................................................................... Groundwater Management Plan Appendix L ........................................................ Baseline & Compliance (2020) Per Capita Analysis Appendix M ..................................... Minutes of the May XX, 2016 Task Force On the Environment Appendix N ....................... Comments from the June XX, 2016 Public Hearing on the 2015 UWMP Appendix O ......................................................... Written & Phoned Comments on the 2015 UWMP
DRAFT
2015 CITY OF SANTA MONICA URBAN WATER MANAGEMENT PLAN
TOC - 4 2015 URBAN WATER MANAGMENT PLAN TABLE OF CONTENTS
This Page Left Blank Intentionally
DRAFT
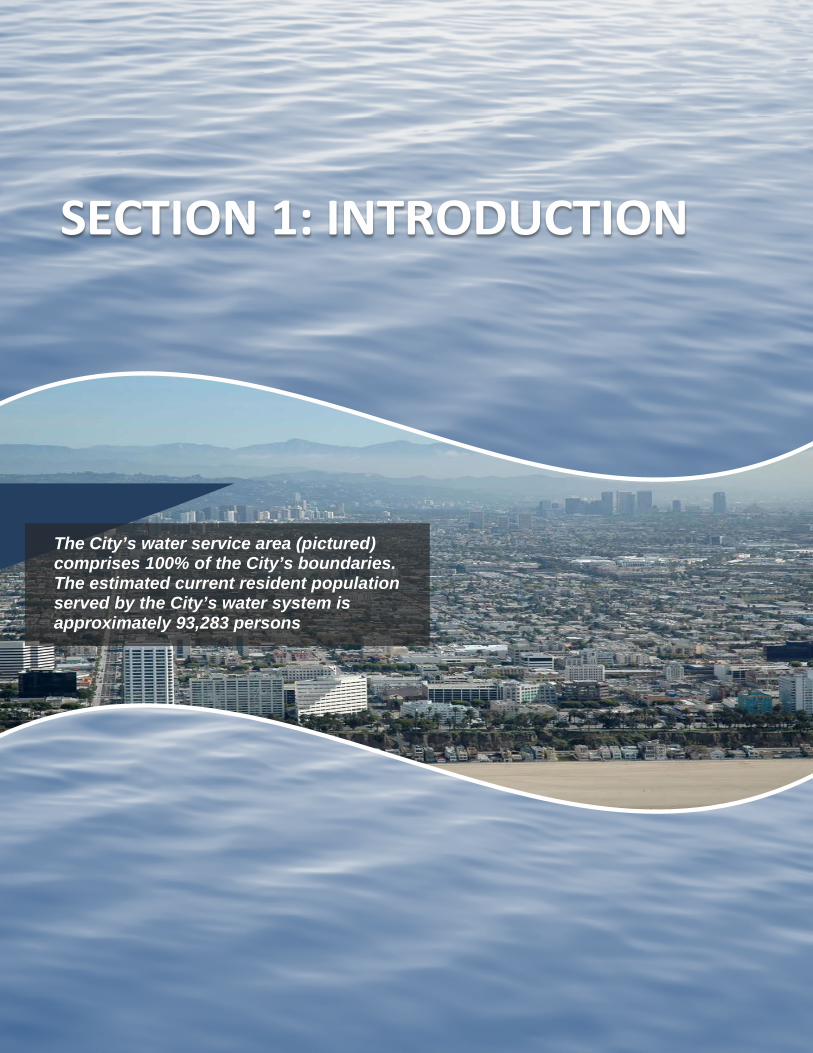
The City’s water service area (pictured) comprises 100% of the City’s boundaries. The estimated current resident population served by the City’s water system is approximately 93,283 persons
CITY OF SANTA MONICA URBAN WATER MANAGEMENT PLAN 2015
2015 URBAN WATER MANAGEMENT PLAN SECTION 1: INTRODUCTION
1 - 1
SECTION 1: INTRODUCTION 1.1 PURPOSE AND SUMMARY This is the 2015 Urban Water Management Plan (UWMP) for the City of Santa Monica (City). This plan has been prepared in compliance with the Urban Water Management Planning Act (Act), which has been codified at California Water Code sections 10610 through 10657 and can be found in Appendix B to this 2015 Plan. As part of the Act, the legislature declared that waters of the state are a limited and renewable resource subject to ever increasing demands; that the conservation and efficient use of urban water supplies are of statewide concern; that successful implementation of plans is best accomplished at the local level; that conservation and efficient use of water shall be actively pursued to protect both the people of the state and their water resources; that conservation and efficient use of urban water supplies shall be a guiding criterion in public decisions; and that urban water suppliers shall be required to develop water management plans to achieve conservation and efficient use. The Act requires “every urban water supplier providing water for municipal purposes to more than 3,000 customers or supplying more than 3,000 acre-feet of water annually, to prepare and adopt, in accordance with prescribed requirements, an urban water management plan.” These plans must be filed with the California Department of Water Resources (DWR) every five years describing and evaluating reasonable and practical efficient water uses, reclamation,
and conservation activities. (See generally Wat. Code § 10631). The Act has been amended on several occasions since its initial passage in 1983. New requirements of the Act due to SBx7-7 state that per capita water use within an urban water supplier's service area must decrease by 20% by the year 2020 in order to receive grants or loans administered by DWR or other state agencies. The legislation sets an overall goal of reducing per capita urban water use by 20% by December 31, 2020. The state shall make incremental progress towards this goal by reducing per capita water use by at least 10% by December 31, 2015. Effective 2016, urban retail water suppliers who do not meet the water conservation requirements established by this bill are not eligible for state water grants or loans. As part of the City's past and current sustainability goals, the City is currently implementing all facets of this plan to be 100% sustainable (import-free) by 2020. 1.2 COORDINATION In preparing this 2015 Plan, the City has encouraged broad community participation. Copies of the City’s draft plan were made available for public review at City Hall and the local public libraries in the City. The City noticed a public hearing to review and accept comments on the draft plan with more than two weeks in advance of the hearing. The notice of the public hearing was published in the local press and mailed to the City Clerk. On June XX, 2016, the City held a noticed public hearing to review and accept comments on the draft plan.
DRAFT
2015 CITY OF SANTA MONICA URBAN WATER MANAGEMENT PLAN
1 - 2 2015 URBAN WATER MANAGEMENT PLAN SECTION 1: INTRODUCTION
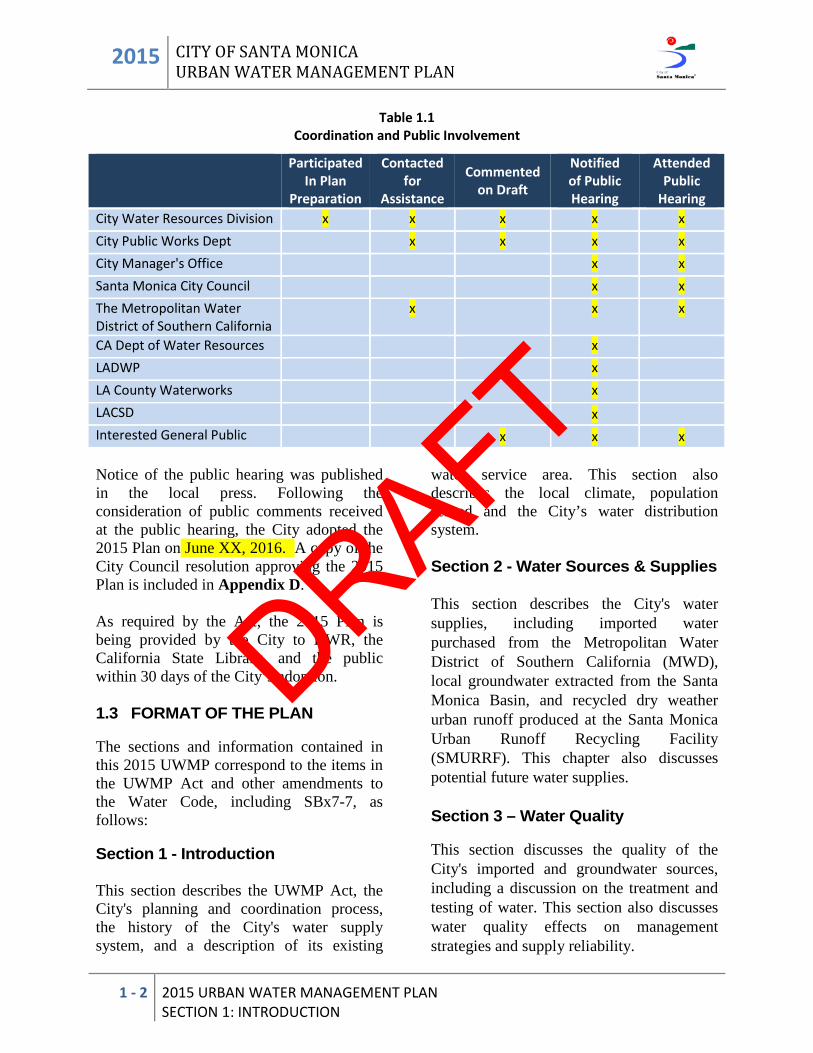
Table 1.1 Coordination and Public Involvement
Participated In Plan
Preparation
Contacted for
Assistance
Commented on Draft
Notified of Public Hearing
Attended Public
Hearing City Water Resources Division x x x x x City Public Works Dept x x x x City Manager's Office x x Santa Monica City Council x x The Metropolitan Water District of Southern California
x x x
CA Dept of Water Resources x LADWP x LA County Waterworks x LACSD x Interested General Public x x x
Notice of the public hearing was published in the local press. Following the consideration of public comments received at the public hearing, the City adopted the 2015 Plan on June XX, 2016. A copy of the City Council resolution approving the 2015 Plan is included in Appendix D. As required by the Act, the 2015 Plan is being provided by the City to DWR, the California State Library, and the public within 30 days of the City’s adoption. 1.3 FORMAT OF THE PLAN The sections and information contained in this 2015 UWMP correspond to the items in the UWMP Act and other amendments to the Water Code, including SBx7-7, as follows: Section 1 - Introduction This section describes the UWMP Act, the City's planning and coordination process, the history of the City's water supply system, and a description of its existing
water service area. This section also describes the local climate, population served and the City’s water distribution system. Section 2 - Water Sources & Supplies This section describes the City's water supplies, including imported water purchased from the Metropolitan Water District of Southern California (MWD), local groundwater extracted from the Santa Monica Basin, and recycled dry weather urban runoff produced at the Santa Monica Urban Runoff Recycling Facility (SMURRF). This chapter also discusses potential future water supplies. Section 3 – Water Quality This section discusses the quality of the City's imported and groundwater sources, including a discussion on the treatment and testing of water. This section also discusses water quality effects on management strategies and supply reliability.
DRAFT
CITY OF SANTA MONICA URBAN WATER MANAGEMENT PLAN 2015
2015 URBAN WATER MANAGEMENT PLAN SECTION 1: INTRODUCTION
1 - 3
Section 4 – Water Demands This section describes past, current, and projected future water demands within the City’s service area prior to the implementation of future demand management measures. This chapter also discusses the requirements of the Water Conservation Act of 2009 (SBx7-7) and the City’s own 100% sustainability goals. Section 5 – Reliability Planning This section presents an assessment of the reliability of the City’s water supplies by comparing projected future water demands with expected water supplies under three different hydrologic conditions: a normal year; a single dry year; and multiple dry years. This 2015 Plan concludes that if projected imported and local supplies are developed or maintained as anticipated, no water shortages are anticipated in the City’s service area during the planning period. Section 6 – Demand Management This section addresses the City’s compliance with water conservation measures as a member of the California Urban Water Conservation Council (CUWCC) with the current Best Management Practices (BMPs). Section 7 – Contingency Planning This section describes the City’s current conservation activities, as well as those efforts that will be utilized in the event of a water supply interruption, such as drought. The City’s water shortage contingency plan (Water Shortage Response Plan), adopted by Council in 2009 and updated in 2015, was developed in consultation and coordination with other MWD member agencies. In addition, MWD’s Water Surplus and
Drought Management Plan (WSDM) is also described. Section 8 – Climate Change This section discusses climate change, its overall impacts on society, and it impacts on City water supplies and finances. This section also discusses alternate water sources the City can consider to offset the adverse effects of climate change, and also existing City policies on climate change. Appendices The appendices contain references and specific documents that contain the data used to prepare this 2015 Plan. 1.4 UPDATES TO THE 2015 PLAN In addition to updated data, the City’s UWMP has undergone several changes from 2010-2015 UWMP years (2011-2016 calendar years). A summary of the changes to the UWMP, by section, are provided below • Section 2: Updated information on
groundwater, including the new Arcadia Treatment Plant
• Section 2: Added a discussion on energy required to produce water
• Section 4: Updated information on the City’s SBx7-7 targets and its 2020 sustainability goals
• Section 5: Added a discussion on the recent California drought.
• Section 8 (New): Added Section 8 (Climate Change) to the UWMP
In addition to the above changes, there are multiple minor changes. The changes reflect both those that are required by the Water
DRAFT
2015 CITY OF SANTA MONICA URBAN WATER MANAGEMENT PLAN
1 - 4 2015 URBAN WATER MANAGEMENT PLAN SECTION 1: INTRODUCTION
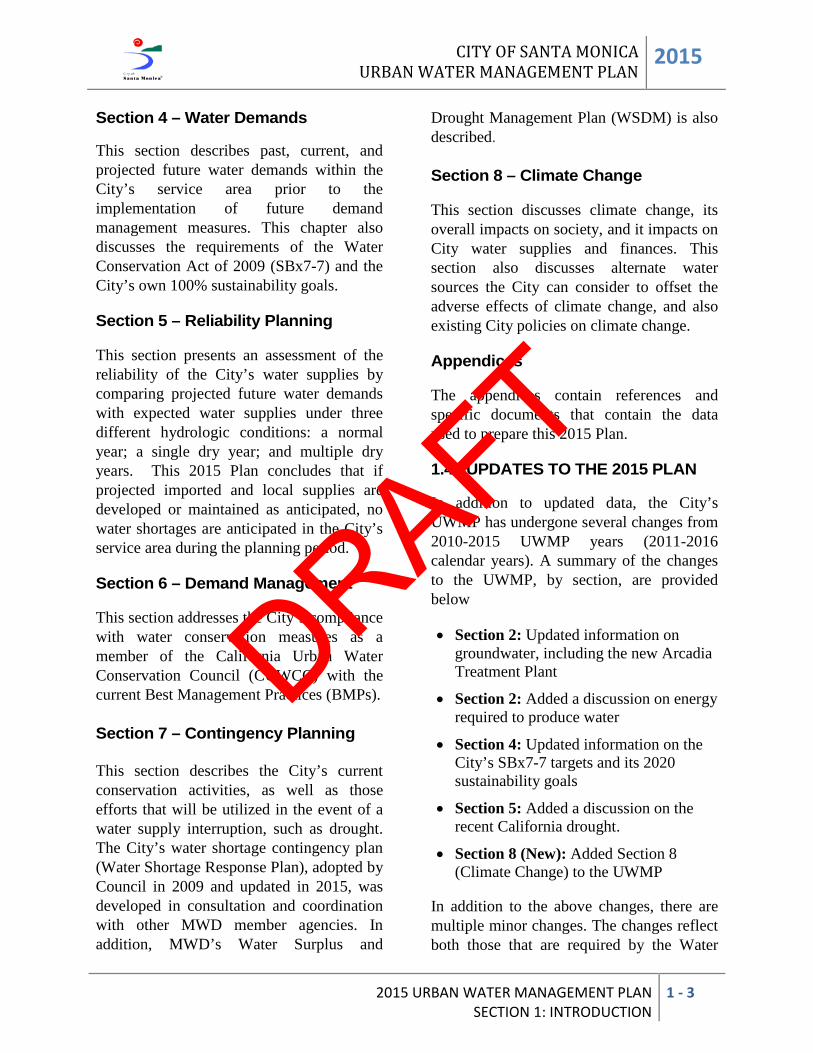
Code and those that the City elected to include or modify. 1.4 WATER SYSTEM HISTORY The City of Santa Monica was founded in 1875 on the site of a land grant by Don Francisco Sepulveda and occupies 8.3 square miles (5,312 acres). The City of Santa Monica started primarily as a seaside resort and gradually became integrated into the Los Angeles Metropolitan Area as development in the Los Angeles Basin grew. During the first half of the twentieth century, Santa Monica’s population (along with most of California) grew at a tremendous pace, averaging over a 120% increase in growth.
Figure 1.1: City of Santa Monica (circa 1920) To meet the needs of the expanding population, the City of Los Angeles constructed aqueducts to bring water from the Owens Valley to supply the needs of Los Angeles. Much of the western Los Angeles area was unincorporated around the early part of the twentieth century, which prompted the City of Los Angeles to offer a reliable water supply as an incentive for annexation to the City of Los Angeles. For many areas, this was a welcomed opportunity; however, the City desired to remain independent and purchased several existing small water purveyors, such as the Arcadia Water Company and the Venice Water Company, to create its own water
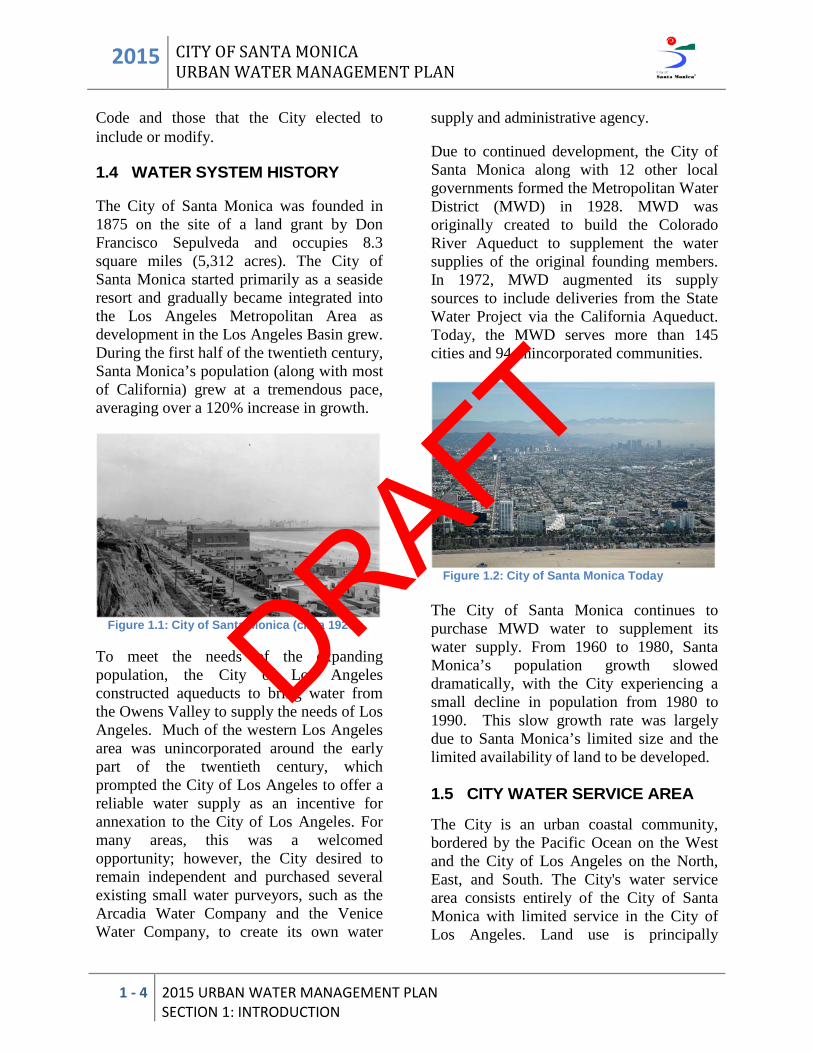
supply and administrative agency. Due to continued development, the City of Santa Monica along with 12 other local governments formed the Metropolitan Water District (MWD) in 1928. MWD was originally created to build the Colorado River Aqueduct to supplement the water supplies of the original founding members. In 1972, MWD augmented its supply sources to include deliveries from the State Water Project via the California Aqueduct. Today, the MWD serves more than 145 cities and 94 unincorporated communities.
Figure 1.2: City of Santa Monica Today The City of Santa Monica continues to purchase MWD water to supplement its water supply. From 1960 to 1980, Santa Monica’s population growth slowed dramatically, with the City experiencing a small decline in population from 1980 to 1990. This slow growth rate was largely due to Santa Monica’s limited size and the limited availability of land to be developed. 1.5 CITY WATER SERVICE AREA The City is an urban coastal community, bordered by the Pacific Ocean on the West and the City of Los Angeles on the North, East, and South. The City's water service area consists entirely of the City of Santa Monica with limited service in the City of Los Angeles. Land use is principally
DRAFT
CITY OF SANTA MONICA URBAN WATER MANAGEMENT PLAN 2015
2015 URBAN WATER MANAGEMENT PLAN SECTION 1: INTRODUCTION
1 - 5
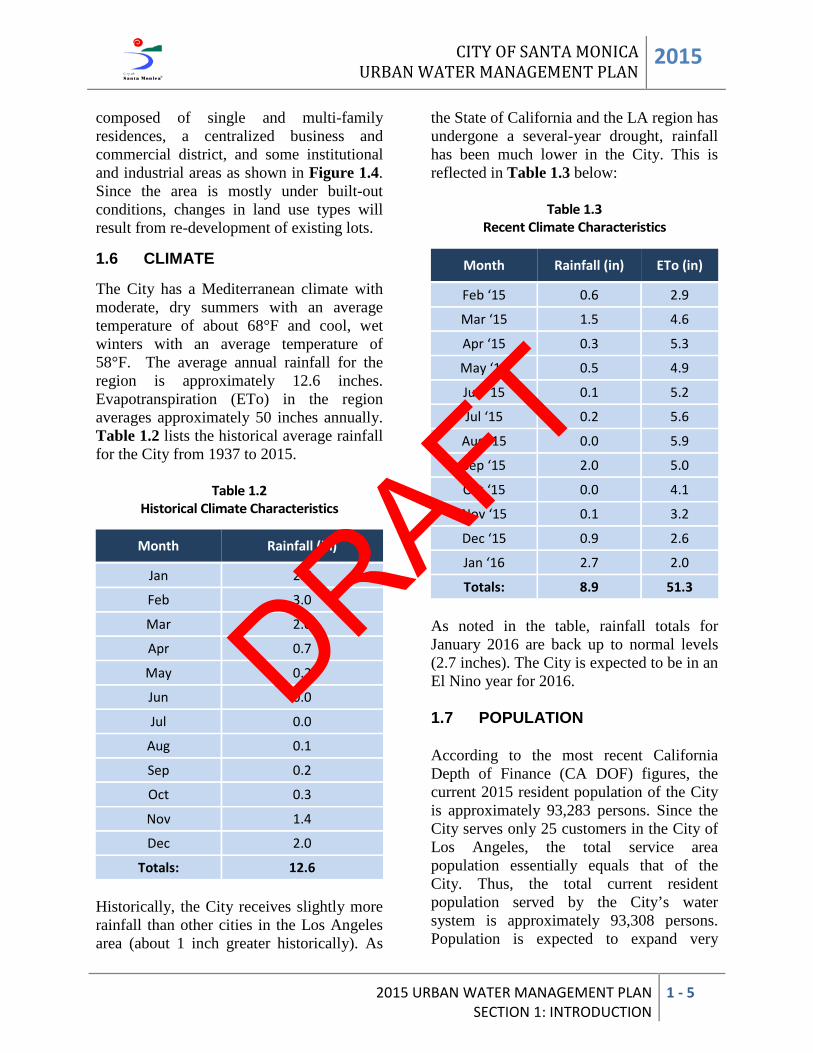
composed of single and multi-family residences, a centralized business and commercial district, and some institutional and industrial areas as shown in Figure 1.4. Since the area is mostly under built-out conditions, changes in land use types will result from re-development of existing lots. 1.6 CLIMATE The City has a Mediterranean climate with moderate, dry summers with an average temperature of about 68°F and cool, wet winters with an average temperature of 58°F. The average annual rainfall for the region is approximately 12.6 inches. Evapotranspiration (ETo) in the region averages approximately 50 inches annually. Table 1.2 lists the historical average rainfall for the City from 1937 to 2015.
Table 1.2 Historical Climate Characteristics
Month Rainfall (in)
Jan 2.7
Feb 3.0
Mar 2.0
Apr 0.7
May 0.2
Jun 0.0
Jul 0.0
Aug 0.1
Sep 0.2
Oct 0.3
Nov 1.4
Dec 2.0
Totals: 12.6 Historically, the City receives slightly more rainfall than other cities in the Los Angeles area (about 1 inch greater historically). As
the State of California and the LA region has undergone a several-year drought, rainfall has been much lower in the City. This is reflected in Table 1.3 below:
Table 1.3 Recent Climate Characteristics
Month Rainfall (in) ETo (in)
Feb ‘15 0.6 2.9
Mar ‘15 1.5 4.6
Apr ‘15 0.3 5.3
May ‘15 0.5 4.9
Jun ‘15 0.1 5.2
Jul ‘15 0.2 5.6
Aug ‘15 0.0 5.9
Sep ‘15 2.0 5.0
Oct ‘15 0.0 4.1
Nov ‘15 0.1 3.2
Dec ‘15 0.9 2.6
Jan ‘16 2.7 2.0
Totals: 8.9 51.3 As noted in the table, rainfall totals for January 2016 are back up to normal levels (2.7 inches). The City is expected to be in an El Nino year for 2016. 1.7 POPULATION According to the most recent California Depth of Finance (CA DOF) figures, the current 2015 resident population of the City is approximately 93,283 persons. Since the City serves only 25 customers in the City of Los Angeles, the total service area population essentially equals that of the City. Thus, the total current resident population served by the City’s water system is approximately 93,308 persons. Population is expected to expand very
DRAFT
2015 CITY OF SANTA MONICA URBAN WATER MANAGEMENT PLAN
1 - 6 2015 URBAN WATER MANAGEMENT PLAN SECTION 1: INTRODUCTION
modestly with an annual growth rate of less than 1.0% annually over the next 25 years as shown in Table 1.3 below.
Table 1.3 Population Projections
(Based on 0.12% Growth Rate* since 1990)
Year Estimated Population
2020 93,868
2025 94,431
2030 94,998
2035 95,568
2040 96,141 *Per CA DOF DATA
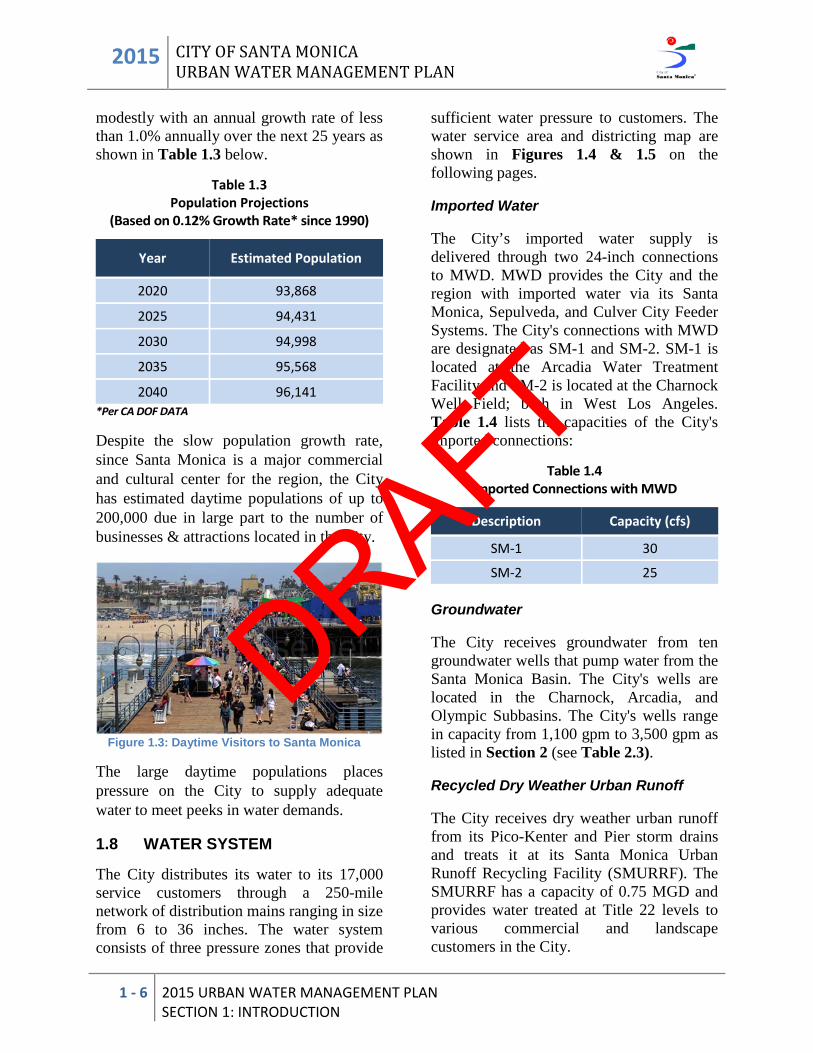
Despite the slow population growth rate, since Santa Monica is a major commercial and cultural center for the region, the City has estimated daytime populations of up to 200,000 due in large part to the number of businesses & attractions located in the City.
Figure 1.3: Daytime Visitors to Santa Monica
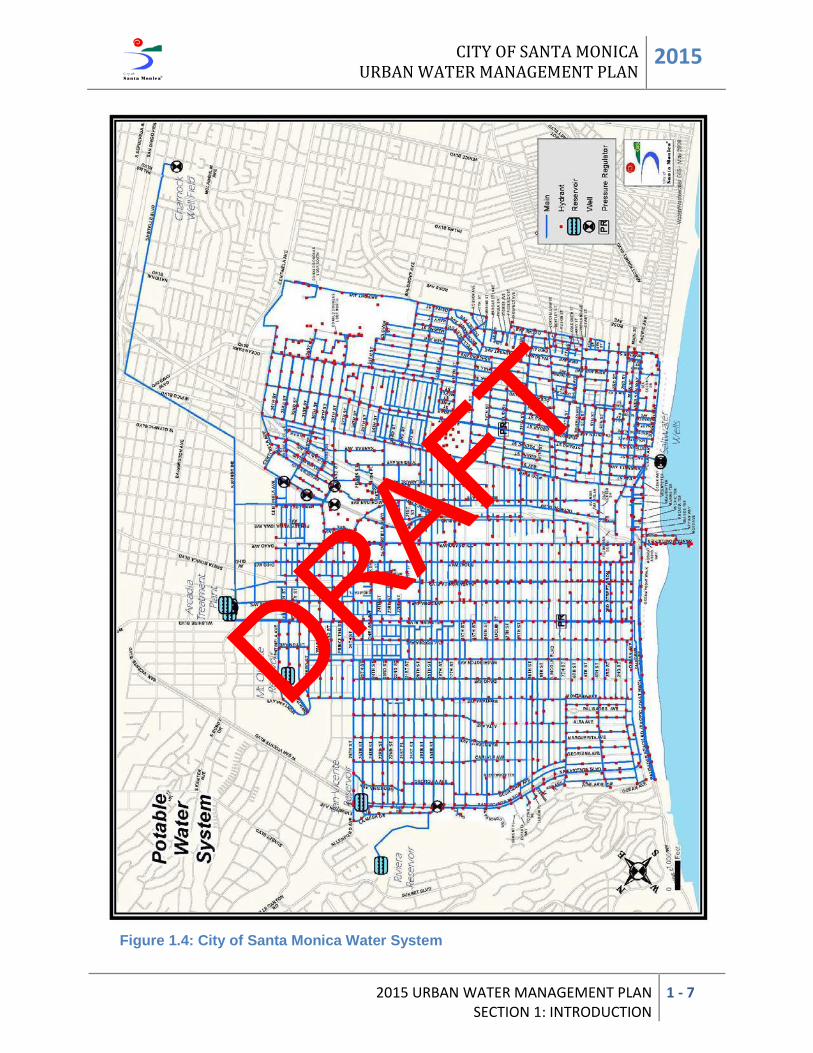
The large daytime populations places pressure on the City to supply adequate water to meet peeks in water demands. 1.8 WATER SYSTEM The City distributes its water to its 17,000 service customers through a 250-mile network of distribution mains ranging in size from 6 to 36 inches. The water system consists of three pressure zones that provide
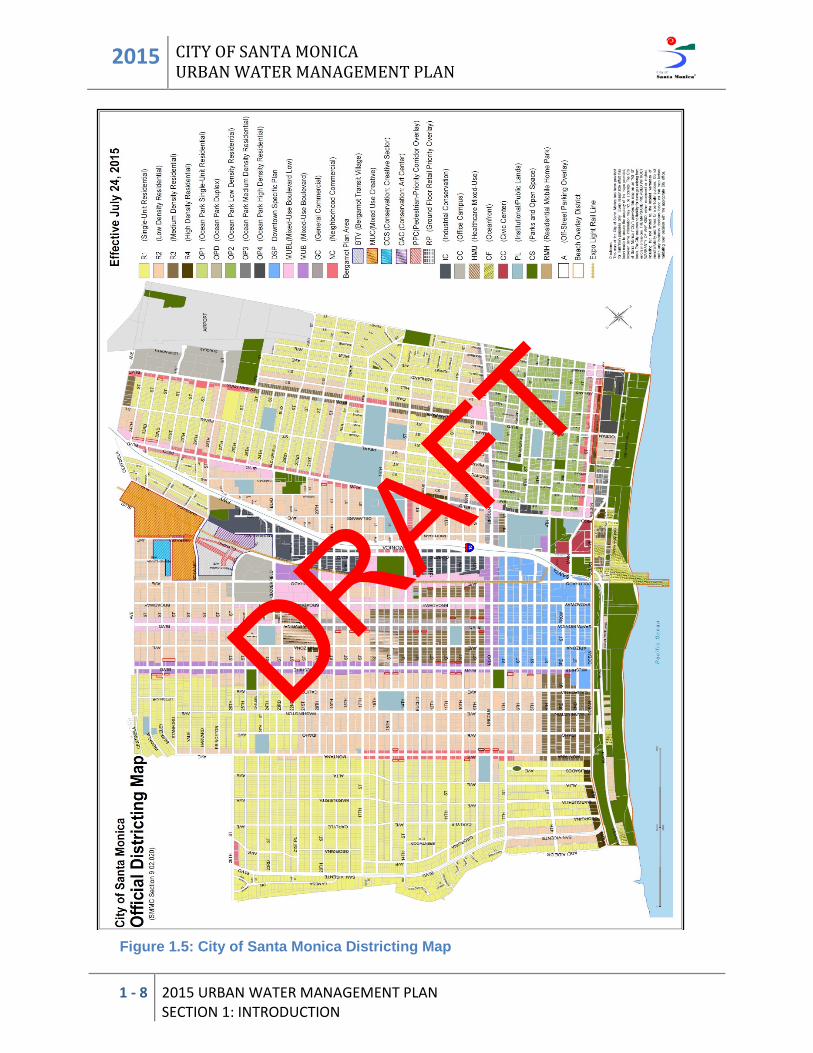
sufficient water pressure to customers. The water service area and districting map are shown in Figures 1.4 & 1.5 on the following pages. Imported Water The City’s imported water supply is delivered through two 24-inch connections to MWD. MWD provides the City and the region with imported water via its Santa Monica, Sepulveda, and Culver City Feeder Systems. The City's connections with MWD are designated as SM-1 and SM-2. SM-1 is located at the Arcadia Water Treatment Facility and SM-2 is located at the Charnock Well Field; both in West Los Angeles. Table 1.4 lists the capacities of the City's imported connections:
Table 1.4 Imported Connections with MWD
Description Capacity (cfs)
SM-1 30
SM-2 25 Groundwater The City receives groundwater from ten groundwater wells that pump water from the Santa Monica Basin. The City's wells are located in the Charnock, Arcadia, and Olympic Subbasins. The City's wells range in capacity from 1,100 gpm to 3,500 gpm as listed in Section 2 (see Table 2.3). Recycled Dry Weather Urban Runoff The City receives dry weather urban runoff from its Pico-Kenter and Pier storm drains and treats it at its Santa Monica Urban Runoff Recycling Facility (SMURRF). The SMURRF has a capacity of 0.75 MGD and provides water treated at Title 22 levels to various commercial and landscape customers in the City.
DRAFT
CITY OF SANTA MONICA URBAN WATER MANAGEMENT PLAN 2015
2015 URBAN WATER MANAGEMENT PLAN SECTION 1: INTRODUCTION
1 - 7
Figure 1.4: City of Santa Monica Water System
DRAFT
2015 CITY OF SANTA MONICA URBAN WATER MANAGEMENT PLAN
1 - 8 2015 URBAN WATER MANAGEMENT PLAN SECTION 1: INTRODUCTION
Figure 1.5: City of Santa Monica Districting Map
DRAFT
The City’s water supply sources consist of imported water from the Metropolitan Water District (MWD), groundwater produced from the Santa Monica Basin, and recycled water produced from the SMURRF facility.
CITY OF SANTA MONICA URBAN WATER MANAGEMENT PLAN
2015
2015 URBAN WATER MANAGEMENT PLAN SECTION 2: WATER SOURCES & SUPPLIES
2 - 1
SECTION 2: WATER SOURCES & SUPPLIES 2.1 INTRODUCTION
The City’s water supply consists of imported
water purchased from MWD, groundwater
produced from the Santa Monica Basin, and
recycled dry weather urban runoff produced
at its SMURFF facility.
2.2 WATER SUPPLY SOURCES
2.2.1 Imported Water
The City has access to imported MWD
water from the Colorado River and the
Sacramento-San Joaquin River Delta in
Northern California. These two water
systems provide Southern California with
approximately 2 million acre-feet (MAF) of
water annually for urban uses.
The Colorado River supplies California with
4.4 MAF annually for agricultural and urban
uses with approximately 3.85 MAF used for
agriculture in Imperial and Riverside
Counties. The remaining unused portion
(600,000 - 800,000 AF) is used for urban
purposes in MWD's service area.
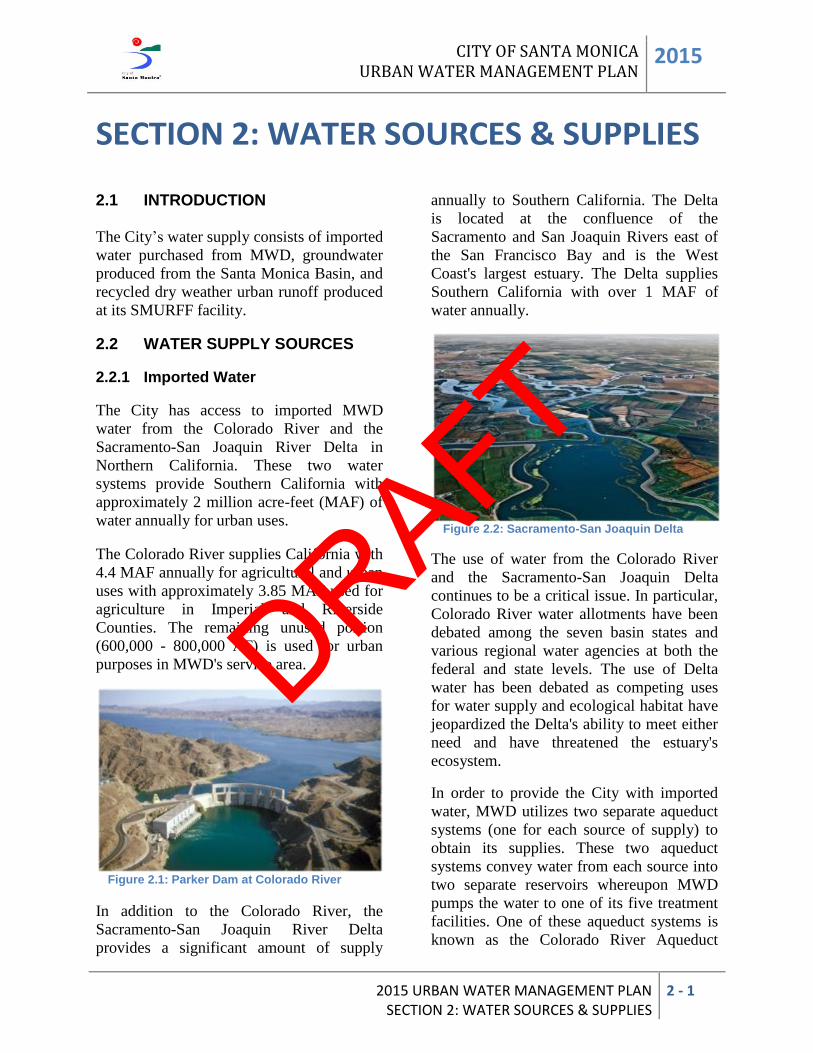
Figure 2.1: Parker Dam at Colorado River
In addition to the Colorado River, the
Sacramento-San Joaquin River Delta
provides a significant amount of supply
annually to Southern California. The Delta
is located at the confluence of the
Sacramento and San Joaquin Rivers east of
the San Francisco Bay and is the West
Coast's largest estuary. The Delta supplies
Southern California with over 1 MAF of
water annually.
Figure 2.2: Sacramento-San Joaquin Delta
The use of water from the Colorado River
and the Sacramento-San Joaquin Delta
continues to be a critical issue. In particular,
Colorado River water allotments have been
debated among the seven basin states and
various regional water agencies at both the
federal and state levels. The use of Delta
water has been debated as competing uses
for water supply and ecological habitat have
jeopardized the Delta's ability to meet either
need and have threatened the estuary's
ecosystem.
In order to provide the City with imported
water, MWD utilizes two separate aqueduct
systems (one for each source of supply) to
obtain its supplies. These two aqueduct
systems convey water from each source into
two separate reservoirs whereupon MWD
pumps the water to one of its five treatment
facilities. One of these aqueduct systems is
known as the Colorado River Aqueduct
DRAFT
2015 CITY OF SANTA MONICA URBAN WATER MANAGEMENT PLAN
2 - 2 2015 URBAN WATER MANAGEMENT PLAN SECTION 2: WATER SOURCES & SUPPLIES
(CRA). The CRA was constructed as a first
order of business shortly after MWD's
incorporation in 1928. The CRA is 242
miles long and carries water from the
Colorado River to Lake Matthews and is
managed by MWD.
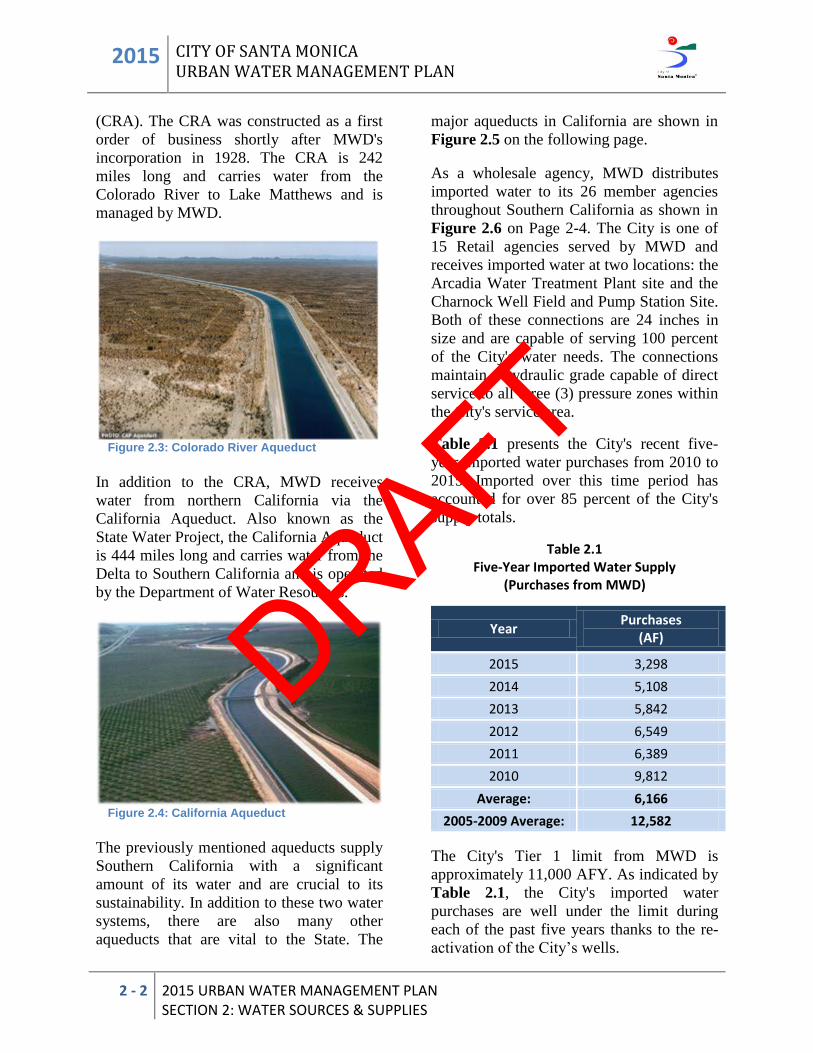
Figure 2.3: Colorado River Aqueduct
In addition to the CRA, MWD receives
water from northern California via the
California Aqueduct. Also known as the
State Water Project, the California Aqueduct
is 444 miles long and carries water from the
Delta to Southern California and is operated
by the Department of Water Resources.
Figure 2.4: California Aqueduct
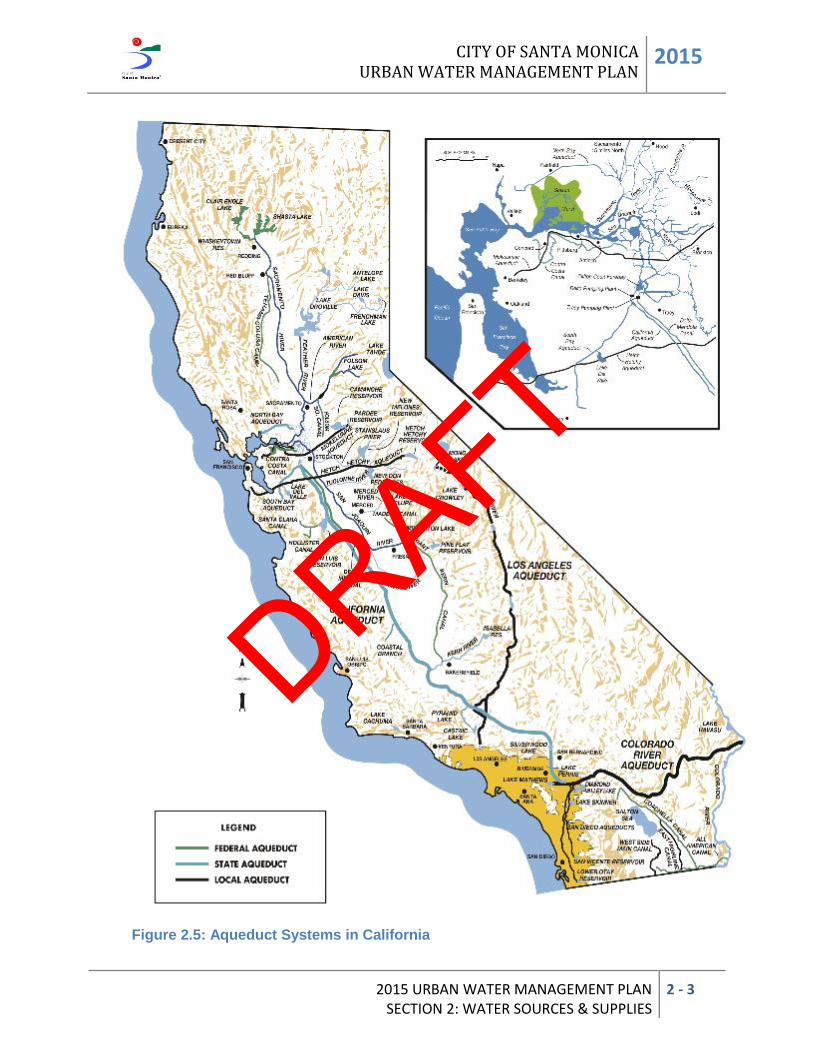
The previously mentioned aqueducts supply
Southern California with a significant
amount of its water and are crucial to its
sustainability. In addition to these two water
systems, there are also many other
aqueducts that are vital to the State. The
major aqueducts in California are shown in
Figure 2.5 on the following page.
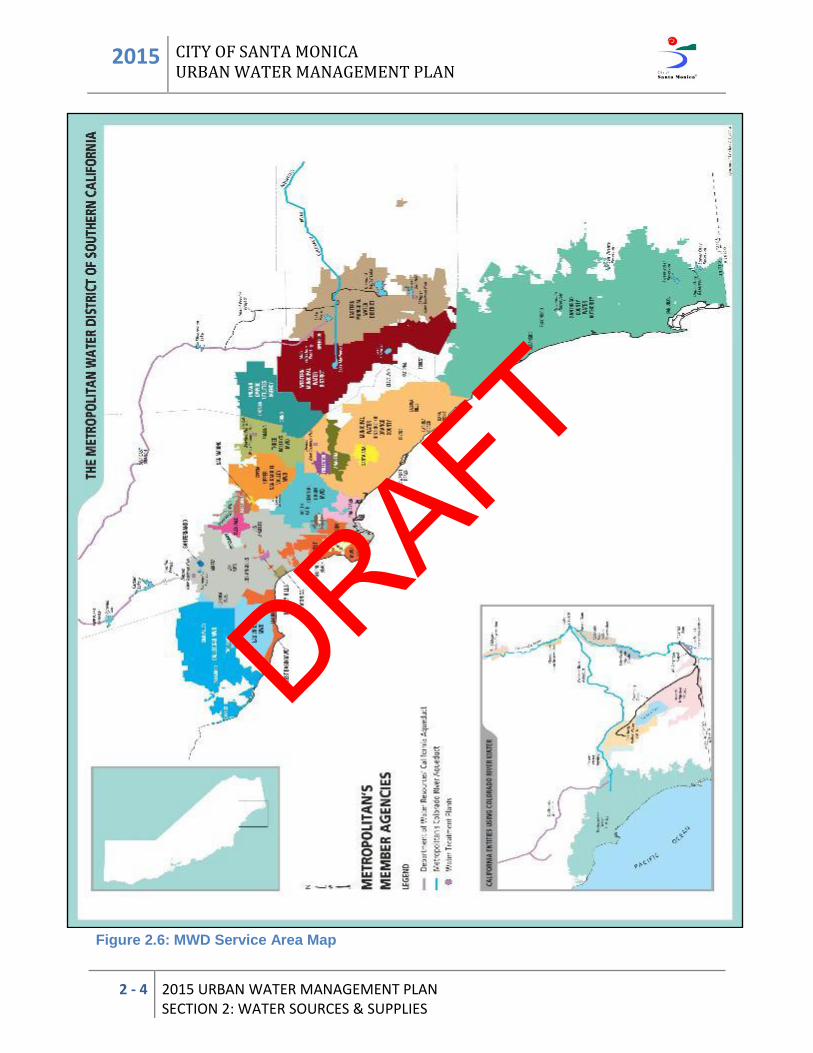
As a wholesale agency, MWD distributes
imported water to its 26 member agencies
throughout Southern California as shown in
Figure 2.6 on Page 2-4. The City is one of
15 Retail agencies served by MWD and
receives imported water at two locations: the
Arcadia Water Treatment Plant site and the
Charnock Well Field and Pump Station Site.
Both of these connections are 24 inches in
size and are capable of serving 100 percent
of the City's water needs. The connections
maintain a hydraulic grade capable of direct
service to all three (3) pressure zones within
the City's service area.
Table 2.1 presents the City's recent five-
year imported water purchases from 2010 to
2015. Imported over this time period has
accounted for over 85 percent of the City's
supply totals.
Table 2.1 Five-Year Imported Water Supply
(Purchases from MWD)
Year Purchases
(AF)
2015 3,298
2014 5,108
2013 5,842
2012 6,549
2011 6,389
2010 9,812
Average: 6,166
2005-2009 Average: 12,582
The City's Tier 1 limit from MWD is
approximately 11,000 AFY. As indicated by
Table 2.1, the City's imported water
purchases are well under the limit during
each of the past five years thanks to the re-
activation of the City’s wells.
DRAFT
CITY OF SANTA MONICA URBAN WATER MANAGEMENT PLAN
2015
2015 URBAN WATER MANAGEMENT PLAN SECTION 2: WATER SOURCES & SUPPLIES
2 - 3
Figure 2.5: Aqueduct Systems in California
DRAFT
2015 CITY OF SANTA MONICA URBAN WATER MANAGEMENT PLAN
2 - 4 2015 URBAN WATER MANAGEMENT PLAN SECTION 2: WATER SOURCES & SUPPLIES
Figure 2.6: MWD Service Area Map
DRAFT
CITY OF SANTA MONICA URBAN WATER MANAGEMENT PLAN
2015
2015 URBAN WATER MANAGEMENT PLAN SECTION 2: WATER SOURCES & SUPPLIES
2 - 5
Figure 2.7: Main Santa Monica Basin and Subbasins
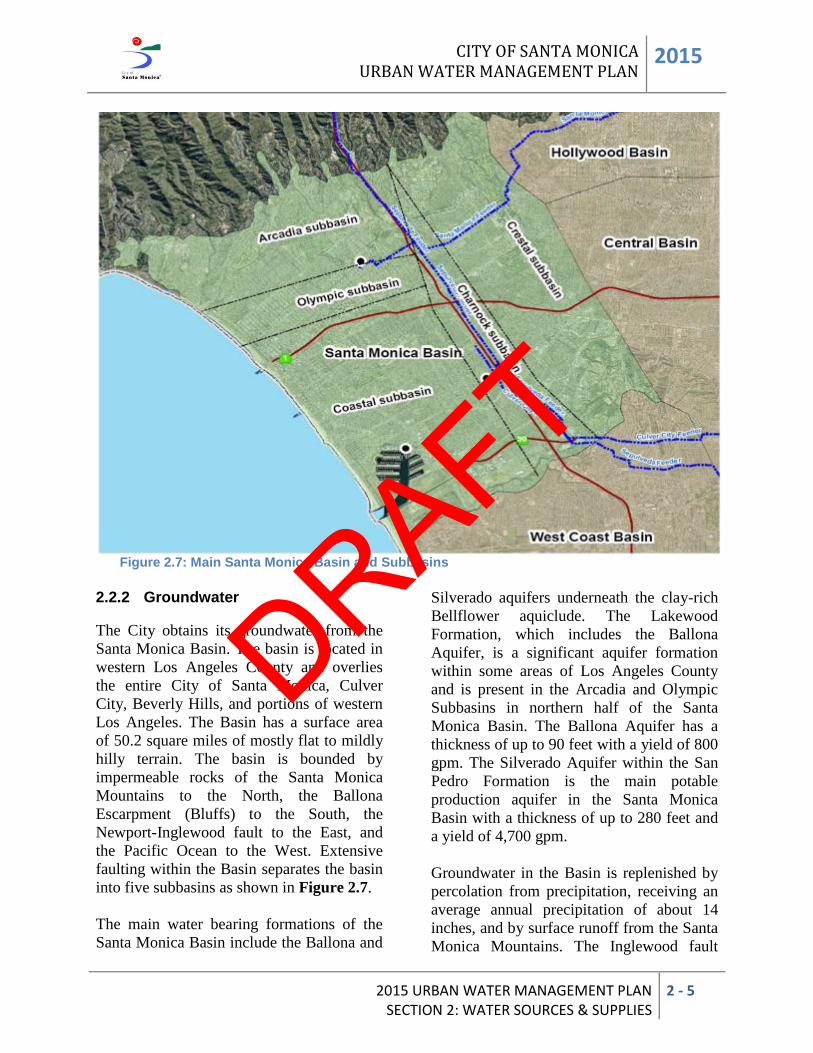
2.2.2 Groundwater
The City obtains its groundwater from the
Santa Monica Basin. The basin is located in
western Los Angeles County and overlies
the entire City of Santa Monica, Culver
City, Beverly Hills, and portions of western
Los Angeles. The Basin has a surface area
of 50.2 square miles of mostly flat to mildly
hilly terrain. The basin is bounded by
impermeable rocks of the Santa Monica
Mountains to the North, the Ballona
Escarpment (Bluffs) to the South, the
Newport-Inglewood fault to the East, and
the Pacific Ocean to the West. Extensive
faulting within the Basin separates the basin
into five subbasins as shown in Figure 2.7.
The main water bearing formations of the
Santa Monica Basin include the Ballona and
Silverado aquifers underneath the clay-rich
Bellflower aquiclude. The Lakewood
Formation, which includes the Ballona
Aquifer, is a significant aquifer formation
within some areas of Los Angeles County
and is present in the Arcadia and Olympic
Subbasins in northern half of the Santa
Monica Basin. The Ballona Aquifer has a
thickness of up to 90 feet with a yield of 800
gpm. The Silverado Aquifer within the San
Pedro Formation is the main potable
production aquifer in the Santa Monica
Basin with a thickness of up to 280 feet and
a yield of 4,700 gpm.
Groundwater in the Basin is replenished by
percolation from precipitation, receiving an
average annual precipitation of about 14
inches, and by surface runoff from the Santa
Monica Mountains. The Inglewood fault
DRAFT
2015 CITY OF SANTA MONICA URBAN WATER MANAGEMENT PLAN
2 - 6 2015 URBAN WATER MANAGMENT PLAN SECTION 2: WATER SOURCES & SUPPLIES
restricts some of the groundwater inflows
from the Central Basin to the East that
would have otherwise replenished the Santa
Monica Basin. Since the basin is mostly
urbanized and soil surfaces have been paved
to construct roads, buildings, and flood
channels, only a small portion of basin soils
are capable of transmitting water to the
water-bearing formations below.
Groundwater flow is generally from the
Santa Monica Mountains in the North to the
West Coast Basin in the South. Groundwater
outflows to the West Coast basin are
estimated to be about 1,000 AFY. However,
there are no formal agreements governing
this outflow. Additional outflow to the
Hollywood and Central Basins is restricted
by the Newport-Inglewood Uplift.
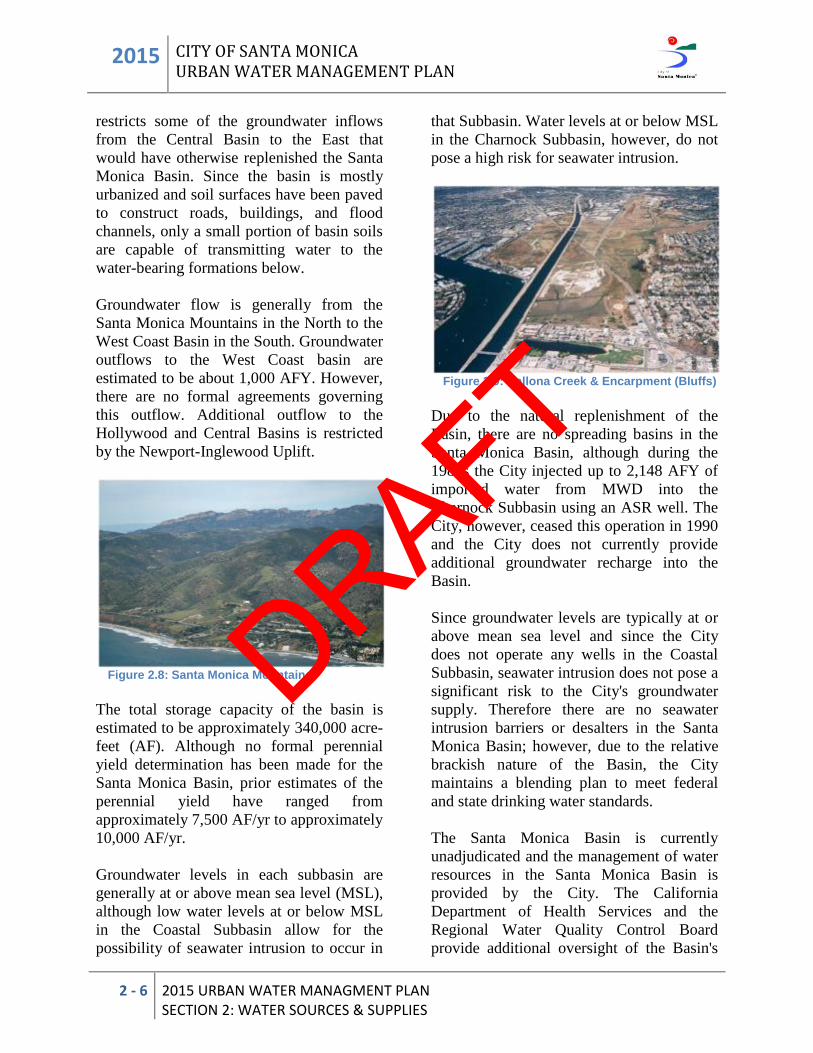
Figure 2.8: Santa Monica Mountains
The total storage capacity of the basin is
estimated to be approximately 340,000 acre-
feet (AF). Although no formal perennial
yield determination has been made for the
Santa Monica Basin, prior estimates of the
perennial yield have ranged from
approximately 7,500 AF/yr to approximately
10,000 AF/yr.
Groundwater levels in each subbasin are
generally at or above mean sea level (MSL),
although low water levels at or below MSL
in the Coastal Subbasin allow for the
possibility of seawater intrusion to occur in
that Subbasin. Water levels at or below MSL
in the Charnock Subbasin, however, do not
pose a high risk for seawater intrusion.
Figure 2.9: Ballona Creek & Encarpment (Bluffs)
Due to the natural replenishment of the
Basin, there are no spreading basins in the
Santa Monica Basin, although during the
1980s the City injected up to 2,148 AFY of
imported water from MWD into the
Charnock Subbasin using an ASR well. The
City, however, ceased this operation in 1990
and the City does not currently provide
additional groundwater recharge into the
Basin.
Since groundwater levels are typically at or
above mean sea level and since the City
does not operate any wells in the Coastal
Subbasin, seawater intrusion does not pose a
significant risk to the City's groundwater
supply. Therefore there are no seawater
intrusion barriers or desalters in the Santa
Monica Basin; however, due to the relative
brackish nature of the Basin, the City
maintains a blending plan to meet federal
and state drinking water standards.
The Santa Monica Basin is currently
unadjudicated and the management of water
resources in the Santa Monica Basin is
provided by the City. The California
Department of Health Services and the
Regional Water Quality Control Board
provide additional oversight of the Basin's
DRAFT
CITY OF SANTA MONICA URBAN WATER MANAGEMENT PLAN
2015
2015 URBAN WATER MANAGEMENT PLAN SECTION 2: WATER SOURCES & SUPPLIES
2 - 7
groundwater quality and help monitor
contaminant levels.
The key characteristics of the Santa Monica
Basin are summarized below in Table 2.2:
Table 2.2
Santa Monica Basin Summary of Characteristics
Item Amount
Max. Depth to Groundwater 500 ft.
Thickness of Groundwater Table
30-280 ft.
Storage Capacity 340,000 AF
Safe Yield* 7,500 AFY – 10,000 AFY
Spreading Basins (Total) 0
Wells (Active) 10
Wells (Inactive)*** 1
Well Capacity (Total) 10,280 gpm
*No formal Safe Yield has been determined ** Well SM 7 inactive and used for monitoring
Groundwater Production
For nearly 100 years, the City has been
producing groundwater from wells located
within the different subbasins of the Santa
Monica Basin. This reliable local source has
helped the City during its formative years to
maintain independence while other cities or
agencies were overtaken by the City of Los
Angeles. The City’s groundwater
capabilities also helped it to survive the
Northridge earthquake of 1994 without any
interruptions in water service. Over the
years, groundwater has been a clean and
reliable source of water for the City.
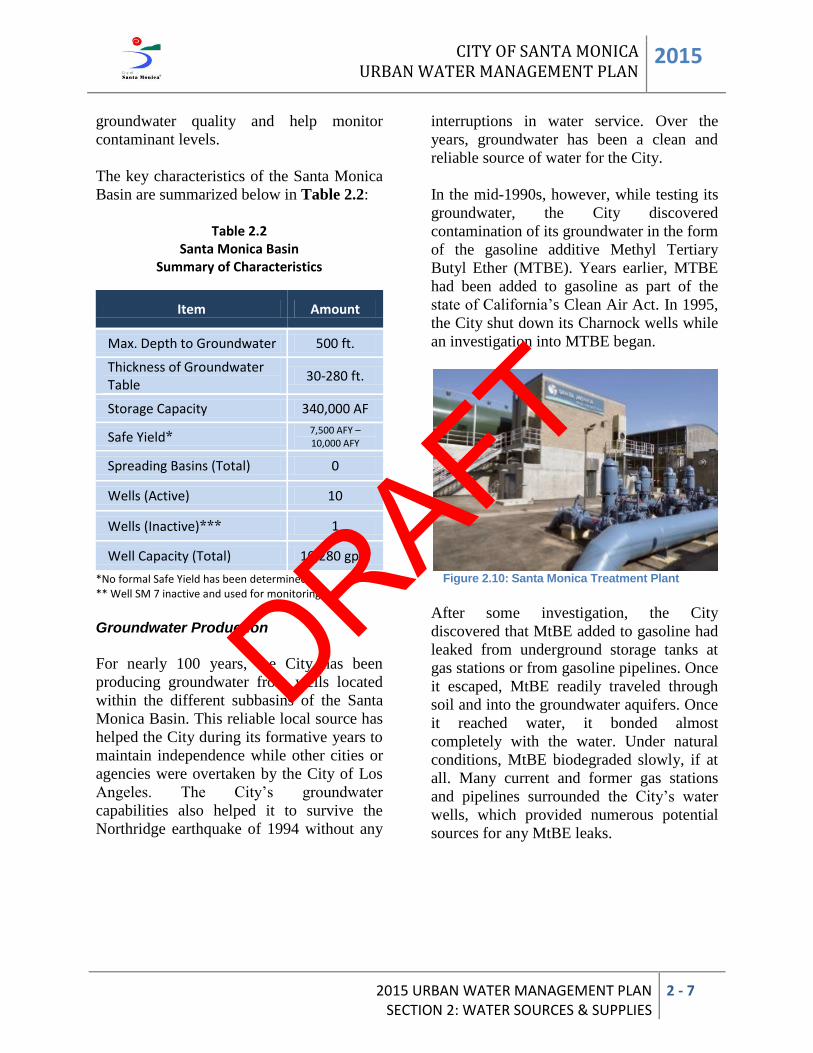
In the mid-1990s, however, while testing its
groundwater, the City discovered
contamination of its groundwater in the form
of the gasoline additive Methyl Tertiary
Butyl Ether (MTBE). Years earlier, MTBE
had been added to gasoline as part of the
state of California’s Clean Air Act. In 1995,
the City shut down its Charnock wells while
an investigation into MTBE began.
Figure 2.10: Santa Monica Treatment Plant
After some investigation, the City
discovered that MtBE added to gasoline had
leaked from underground storage tanks at
gas stations or from gasoline pipelines. Once
it escaped, MtBE readily traveled through
soil and into the groundwater aquifers. Once
it reached water, it bonded almost
completely with the water. Under natural
conditions, MtBE biodegraded slowly, if at
all. Many current and former gas stations
and pipelines surrounded the City’s water
wells, which provided numerous potential
sources for any MtBE leaks.
DRAFT
2015 CITY OF SANTA MONICA URBAN WATER MANAGEMENT PLAN
2 - 8 2015 URBAN WATER MANAGMENT PLAN SECTION 2: WATER SOURCES & SUPPLIES
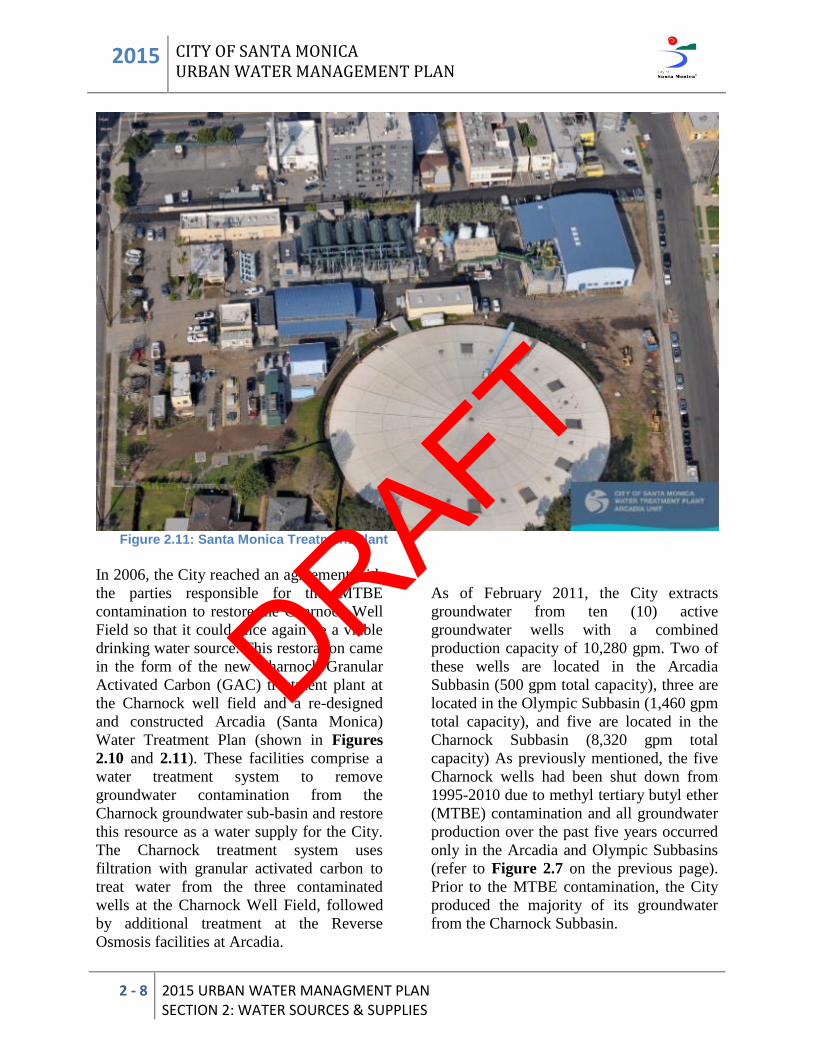
Figure 2.11: Santa Monica Treatment Plant
In 2006, the City reached an agreement with
the parties responsible for the MTBE
contamination to restore the Charnock Well
Field so that it could once again be a viable
drinking water source. This restoration came
in the form of the new Charnock Granular
Activated Carbon (GAC) treatment plant at
the Charnock well field and a re-designed
and constructed Arcadia (Santa Monica)
Water Treatment Plan (shown in Figures
2.10 and 2.11). These facilities comprise a
water treatment system to remove
groundwater contamination from the
Charnock groundwater sub-basin and restore
this resource as a water supply for the City.
The Charnock treatment system uses
filtration with granular activated carbon to
treat water from the three contaminated
wells at the Charnock Well Field, followed
by additional treatment at the Reverse
Osmosis facilities at Arcadia.
As of February 2011, the City extracts
groundwater from ten (10) active
groundwater wells with a combined
production capacity of 10,280 gpm. Two of
these wells are located in the Arcadia
Subbasin (500 gpm total capacity), three are
located in the Olympic Subbasin (1,460 gpm
total capacity), and five are located in the
Charnock Subbasin (8,320 gpm total
capacity) As previously mentioned, the five
Charnock wells had been shut down from
1995-2010 due to methyl tertiary butyl ether
(MTBE) contamination and all groundwater
production over the past five years occurred
only in the Arcadia and Olympic Subbasins
(refer to Figure 2.7 on the previous page).
Prior to the MTBE contamination, the City
produced the majority of its groundwater
from the Charnock Subbasin.
DRAFT
CITY OF SANTA MONICA URBAN WATER MANAGEMENT PLAN
2015
2015 URBAN WATER MANAGEMENT PLAN SECTION 2: WATER SOURCES & SUPPLIES
2 - 9
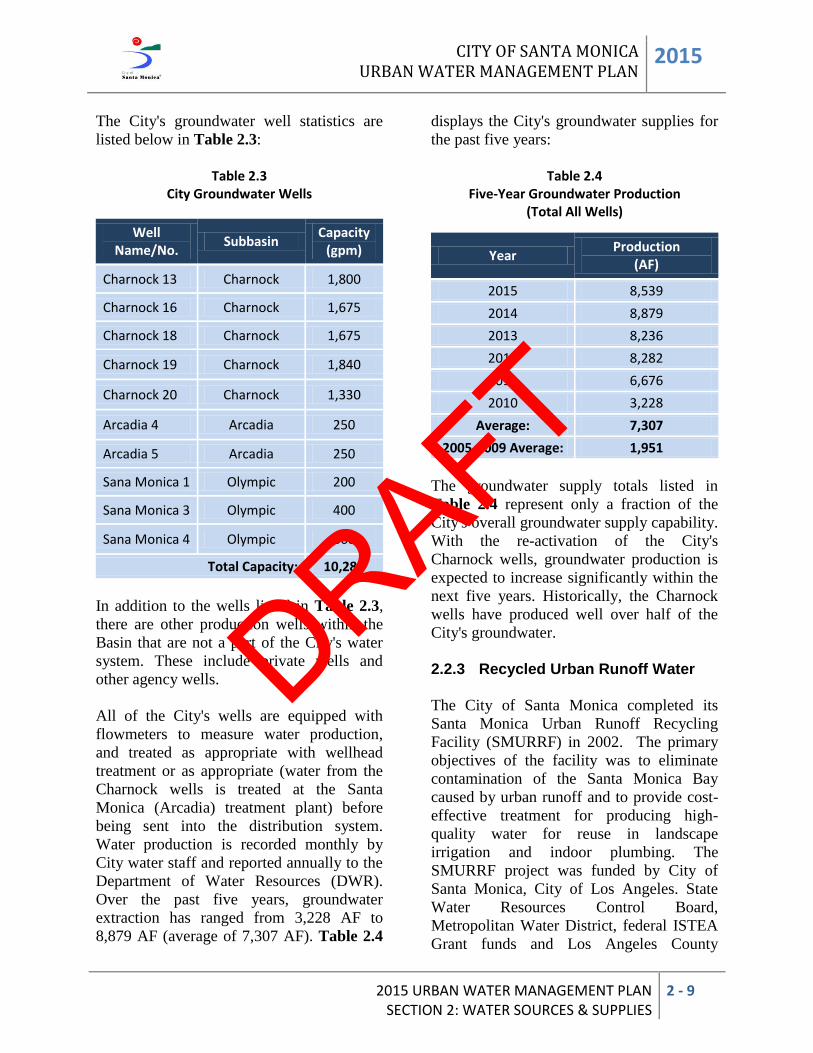
The City's groundwater well statistics are
listed below in Table 2.3:
Table 2.3
City Groundwater Wells
Well Name/No.
Subbasin Capacity
(gpm)
Charnock 13 Charnock 1,800
Charnock 16 Charnock 1,675
Charnock 18 Charnock 1,675
Charnock 19 Charnock 1,840
Charnock 20 Charnock 1,330
Arcadia 4 Arcadia 250
Arcadia 5 Arcadia 250
Sana Monica 1 Olympic 200
Sana Monica 3 Olympic 400
Sana Monica 4 Olympic 860
Total Capacity: 10,280
In addition to the wells listed in Table 2.3,
there are other production wells within the
Basin that are not a part of the City's water
system. These include private wells and
other agency wells.
All of the City's wells are equipped with
flowmeters to measure water production,
and treated as appropriate with wellhead
treatment or as appropriate (water from the
Charnock wells is treated at the Santa
Monica (Arcadia) treatment plant) before
being sent into the distribution system.
Water production is recorded monthly by
City water staff and reported annually to the
Department of Water Resources (DWR).
Over the past five years, groundwater
extraction has ranged from 3,228 AF to
8,879 AF (average of 7,307 AF). Table 2.4
displays the City's groundwater supplies for
the past five years:
Table 2.4
Five-Year Groundwater Production (Total All Wells)
Year Production
(AF)
2015 8,539
2014 8,879
2013 8,236
2012 8,282
2011 6,676
2010 3,228
Average: 7,307
2005-2009 Average: 1,951
The groundwater supply totals listed in
Table 2.4 represent only a fraction of the
City's overall groundwater supply capability.
With the re-activation of the City's
Charnock wells, groundwater production is
expected to increase significantly within the
next five years. Historically, the Charnock
wells have produced well over half of the
City's groundwater.
2.2.3 Recycled Urban Runoff Water
The City of Santa Monica completed its
Santa Monica Urban Runoff Recycling
Facility (SMURRF) in 2002. The primary
objectives of the facility was to eliminate
contamination of the Santa Monica Bay
caused by urban runoff and to provide cost-
effective treatment for producing high-
quality water for reuse in landscape
irrigation and indoor plumbing. The
SMURRF project was funded by City of
Santa Monica, City of Los Angeles. State
Water Resources Control Board,
Metropolitan Water District, federal ISTEA
Grant funds and Los Angeles County
DRAFT
2015 CITY OF SANTA MONICA URBAN WATER MANAGEMENT PLAN
2 - 10 2015 URBAN WATER MANAGMENT PLAN SECTION 2: WATER SOURCES & SUPPLIES
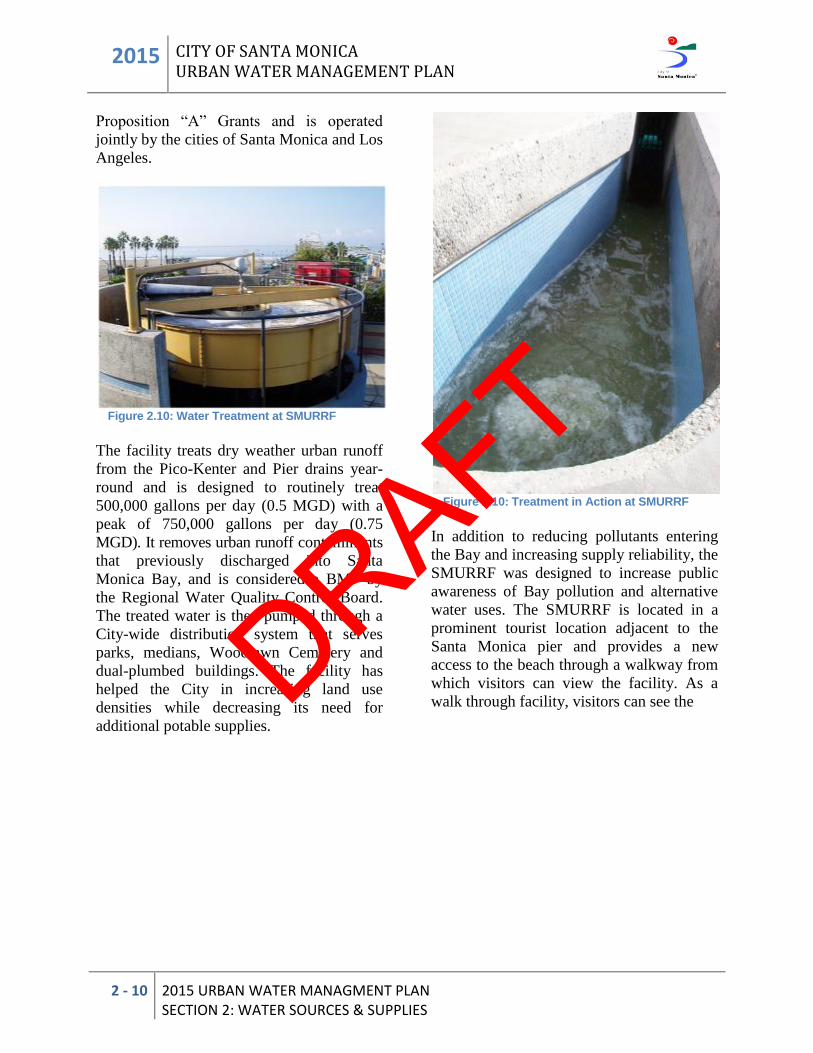
Proposition “A” Grants and is operated
jointly by the cities of Santa Monica and Los
Angeles.
Figure 2.10: Water Treatment at SMURRF
The facility treats dry weather urban runoff
from the Pico-Kenter and Pier drains year-
round and is designed to routinely treat
500,000 gallons per day (0.5 MGD) with a
peak of 750,000 gallons per day (0.75
MGD). It removes urban runoff contaminants
that previously discharged into Santa
Monica Bay, and is considered a BMP by
the Regional Water Quality Control Board.
The treated water is then pumped through a
City-wide distribution system that serves
parks, medians, Woodlawn Cemetery and
dual-plumbed buildings. The facility has
helped the City in increasing land use
densities while decreasing its need for
additional potable supplies.
Figure 2.10: Treatment in Action at SMURRF
In addition to reducing pollutants entering
the Bay and increasing supply reliability, the
SMURRF was designed to increase public
awareness of Bay pollution and alternative
water uses. The SMURRF is located in a
prominent tourist location adjacent to the
Santa Monica pier and provides a new
access to the beach through a walkway from
which visitors can view the facility. As a
walk through facility, visitors can see the DRAFT
CITY OF SANTA MONICA URBAN WATER MANAGEMENT PLAN
2015
2015 URBAN WATER MANAGEMENT PLAN SECTION 2: WATER SOURCES & SUPPLIES
2 - 11
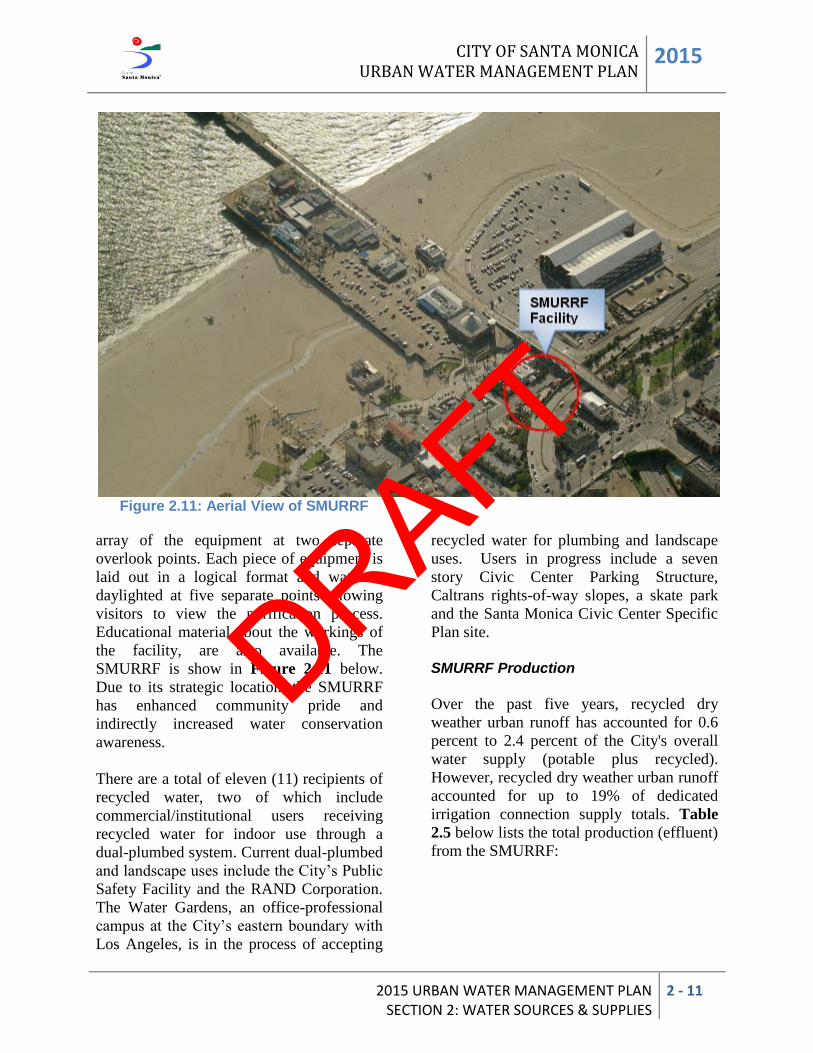
Figure 2.11: Aerial View of SMURRF array of the equipment at two separate
overlook points. Each piece of equipment is
laid out in a logical format and water is
daylighted at five separate points allowing
visitors to view the purification process.
Educational material about the workings of
the facility, are also available. The
SMURRF is show in Figure 2.11 below.
Due to its strategic location, the SMURRF
has enhanced community pride and
indirectly increased water conservation
awareness.
There are a total of eleven (11) recipients of
recycled water, two of which include
commercial/institutional users receiving
recycled water for indoor use through a
dual-plumbed system. Current dual-plumbed
and landscape uses include the City’s Public
Safety Facility and the RAND Corporation.
The Water Gardens, an office-professional
campus at the City’s eastern boundary with
Los Angeles, is in the process of accepting
recycled water for plumbing and landscape
uses. Users in progress include a seven
story Civic Center Parking Structure,
Caltrans rights-of-way slopes, a skate park
and the Santa Monica Civic Center Specific
Plan site.
SMURRF Production
Over the past five years, recycled dry
weather urban runoff has accounted for 0.6
percent to 2.4 percent of the City's overall
water supply (potable plus recycled).
However, recycled dry weather urban runoff
accounted for up to 19% of dedicated
irrigation connection supply totals. Table
2.5 below lists the total production (effluent)
from the SMURRF:
DRAFT
2015 CITY OF SANTA MONICA URBAN WATER MANAGEMENT PLAN
2 - 12 2015 URBAN WATER MANAGMENT PLAN SECTION 2: WATER SOURCES & SUPPLIES
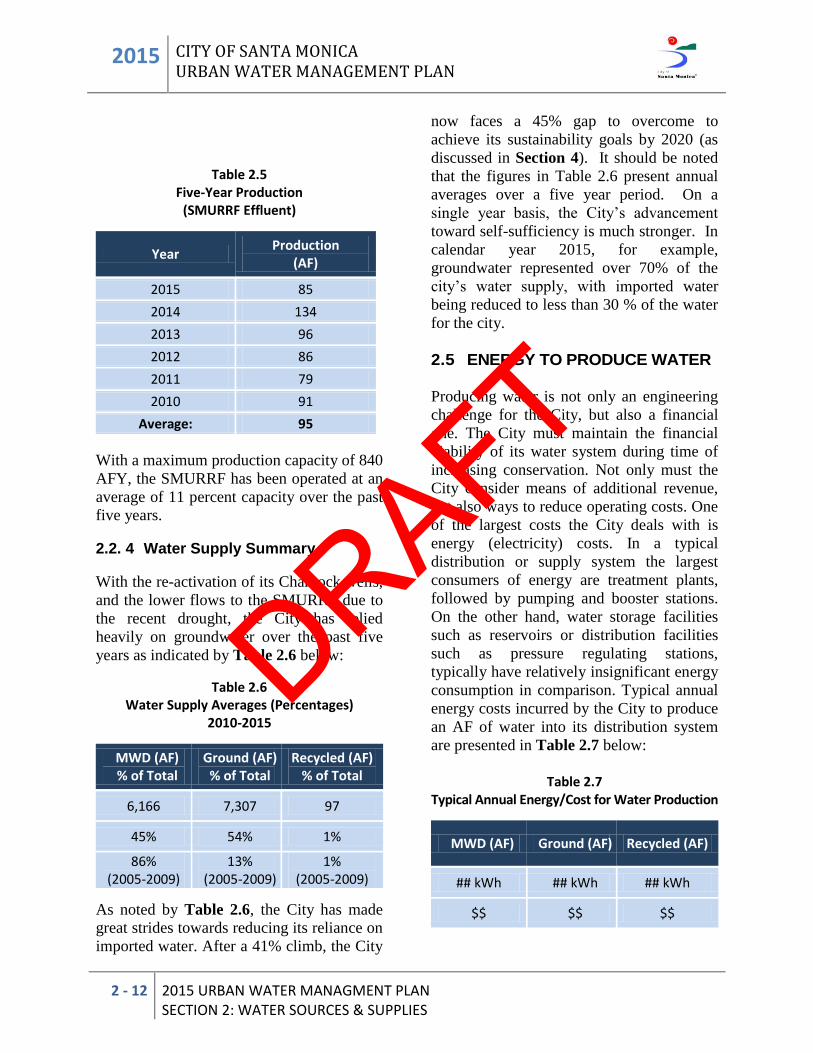
Table 2.5 Five-Year Production
(SMURRF Effluent)
Year Production
(AF)
2015 85
2014 134
2013 96
2012 86
2011 79
2010 91
Average: 95
With a maximum production capacity of 840
AFY, the SMURRF has been operated at an
average of 11 percent capacity over the past
five years.
2.2. 4 Water Supply Summary
With the re-activation of its Charnock wells,
and the lower flows to the SMURRF due to
the recent drought, the City has relied
heavily on groundwater over the past five
years as indicated by Table 2.6 below:
Table 2.6 Water Supply Averages (Percentages)
2010-2015
MWD (AF) % of Total
Ground (AF) % of Total
Recycled (AF) % of Total
6,166 7,307 97
45% 54% 1%
86% (2005-2009)
13% (2005-2009)
1% (2005-2009)
As noted by Table 2.6, the City has made
great strides towards reducing its reliance on
imported water. After a 41% climb, the City
now faces a 45% gap to overcome to
achieve its sustainability goals by 2020 (as
discussed in Section 4). It should be noted
that the figures in Table 2.6 present annual
averages over a five year period. On a
single year basis, the City’s advancement
toward self-sufficiency is much stronger. In
calendar year 2015, for example,
groundwater represented over 70% of the
city’s water supply, with imported water
being reduced to less than 30 % of the water
for the city.
2.5 ENERGY TO PRODUCE WATER
Producing water is not only an engineering
challenge for the City, but also a financial
one. The City must maintain the financial
viability of its water system during time of
increasing conservation. Not only must the
City consider means of additional revenue,
but also ways to reduce operating costs. One
of the largest costs the City deals with is
energy (electricity) costs. In a typical
distribution or supply system the largest
consumers of energy are treatment plants,
followed by pumping and booster stations.
On the other hand, water storage facilities
such as reservoirs or distribution facilities
such as pressure regulating stations,
typically have relatively insignificant energy
consumption in comparison. Typical annual
energy costs incurred by the City to produce
an AF of water into its distribution system
are presented in Table 2.7 below:
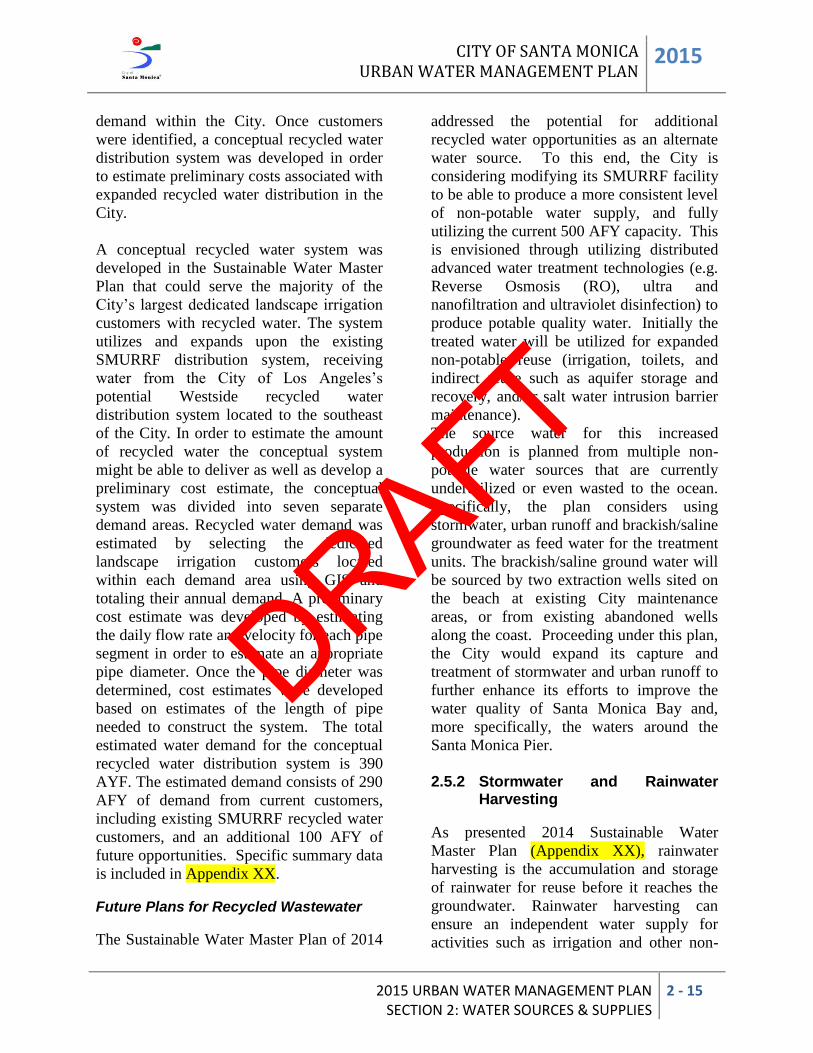
Table 2.7
Typical Annual Energy/Cost for Water Production
MWD (AF) Ground (AF) Recycled (AF)
## kWh ## kWh ## kWh
$$ $$ $$
DRAFT
CITY OF SANTA MONICA URBAN WATER MANAGEMENT PLAN
2015
2015 URBAN WATER MANAGEMENT PLAN SECTION 2: WATER SOURCES & SUPPLIES
2 - 13
As noted by Table 2.7, groundwater is the
most expensive form of water in terms of
energy. However, groundwater is actually
by far the cheapest source of water,
especially when considering the costs to
purchase water from MWD. Nevertheless,
the City continues to look into the most cost-
effective ways to produce its water,
2.3 PROJECTED WATER SUPPLY
As population and land-use densities
increase, the City understands the need to
discover and support local water supply
projects to augment imported supplies. As
part of this process, the City completed its
MTBE remediation effort in February 2011
and re-activated its five wells in the
Charnock Subbasin. In 2013, a groundwater
assessment study was conducted to review
the status of the city’s groundwater supplies
in the Santa Monica basin. The study
included a literature review of prior
investigations into the perennial yield of the
basin. In the near future, the City intends to
conduct a more formal assessment of the
safe yield of the basin with more current
data. In its effort to become independent
from imported water, the City developed in
2014 a Sustainable Water Master Plan to
provide a roadmap to becoming water self-
sufficient by 2020.
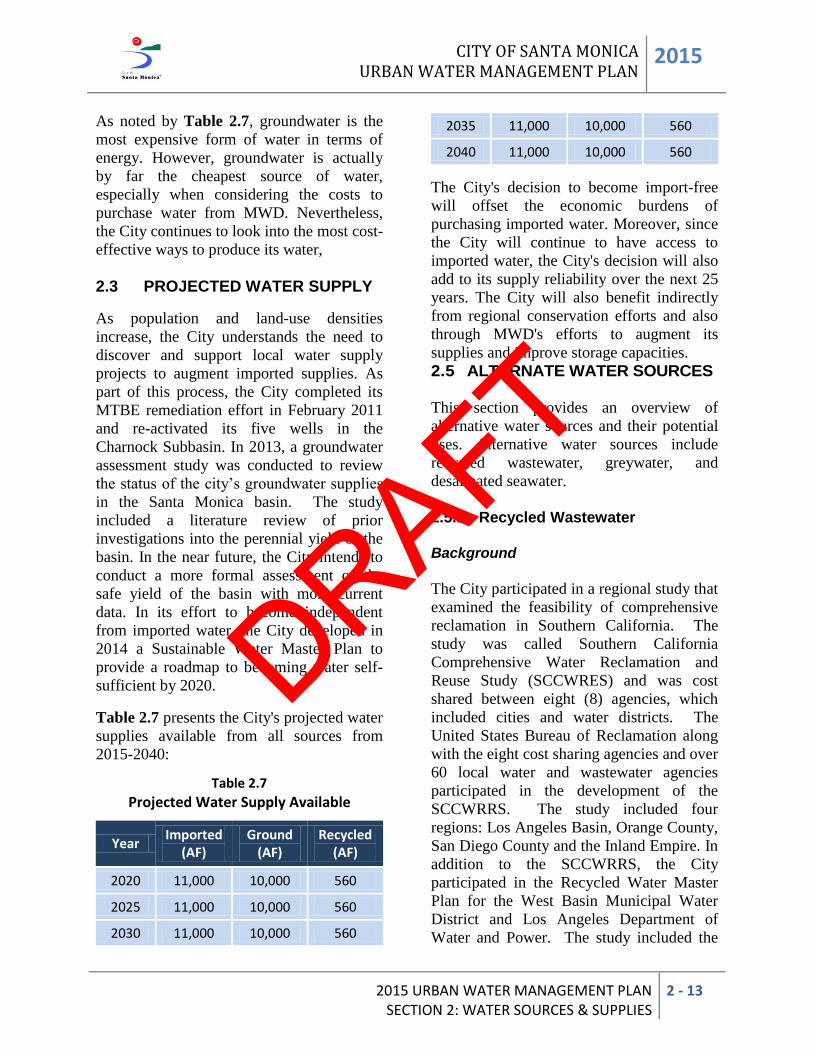
Table 2.7 presents the City's projected water
supplies available from all sources from
2015-2040:
Table 2.7
Projected Water Supply Available
Year Imported
(AF) Ground
(AF) Recycled
(AF)
2020 11,000 10,000 560
2025 11,000 10,000 560
2030 11,000 10,000 560
2035 11,000 10,000 560
2040 11,000 10,000 560
The City's decision to become import-free
will offset the economic burdens of
purchasing imported water. Moreover, since
the City will continue to have access to
imported water, the City's decision will also
add to its supply reliability over the next 25
years. The City will also benefit indirectly
from regional conservation efforts and also
through MWD's efforts to augment its
supplies and improve storage capacities.
2.5 ALTERNATE WATER SOURCES
This section provides an overview of
alternative water sources and their potential
uses. Alternative water sources include
recycled wastewater, greywater, and
desalinated seawater.
2.5.1 Recycled Wastewater Background
The City participated in a regional study that
examined the feasibility of comprehensive
reclamation in Southern California. The
study was called Southern California
Comprehensive Water Reclamation and
Reuse Study (SCCWRES) and was cost
shared between eight (8) agencies, which
included cities and water districts. The
United States Bureau of Reclamation along
with the eight cost sharing agencies and over
60 local water and wastewater agencies
participated in the development of the
SCCWRRS. The study included four
regions: Los Angeles Basin, Orange County,
San Diego County and the Inland Empire. In
addition to the SCCWRRS, the City
participated in the Recycled Water Master
Plan for the West Basin Municipal Water
District and Los Angeles Department of
Water and Power. The study included the
DRAFT
2015 CITY OF SANTA MONICA URBAN WATER MANAGEMENT PLAN
2 - 14 2015 URBAN WATER MANAGMENT PLAN SECTION 2: WATER SOURCES & SUPPLIES
evaluation of expanding the facilities into
Santa Monica as a long-term option. City
staff has attended Los Angeles County
Reclaimed Water Advisory Committee
(LACRWAC) meetings. The LACRAWAC
is an official chapter of the Water Reuse
Association, which has helped implement
water recycling in California.
Wastewater Collection & Treatment System
The City of Santa Monica Water Resources
Division manages the wastewater collection
system for Santa Monica. All of the
wastewater flows from the City (excluding a
percentage of dry weather storm water
runoff) is collected by the City's local sewer
mains and delivered to the Hyperion
Wastewater Treatment Plant. Santa Monica
Wastewater flow is metered and averages
about 11 million gallons per day (MGD).
Santa Monica is a contracting entity to the
City of Los Angeles Amalgamated
Sewerage System, which includes Hyperion.
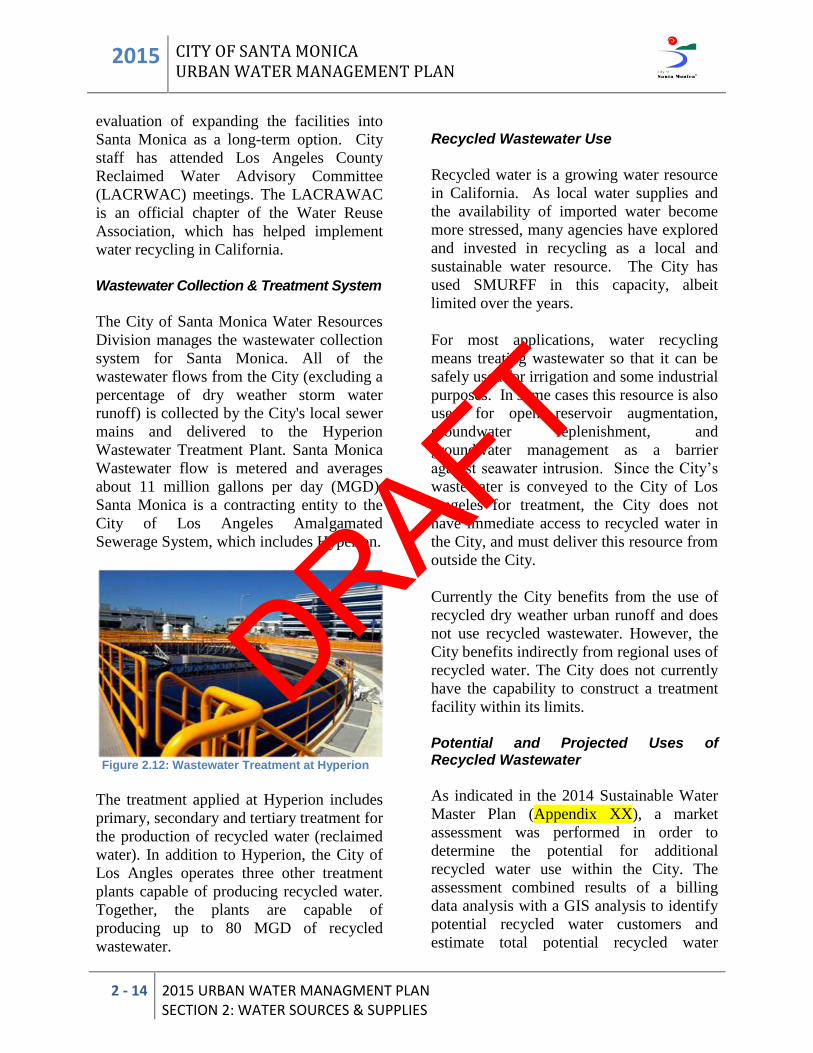
Figure 2.12: Wastewater Treatment at Hyperion
The treatment applied at Hyperion includes
primary, secondary and tertiary treatment for
the production of recycled water (reclaimed
water). In addition to Hyperion, the City of
Los Angles operates three other treatment
plants capable of producing recycled water.
Together, the plants are capable of
producing up to 80 MGD of recycled
wastewater.
Recycled Wastewater Use
Recycled water is a growing water resource
in California. As local water supplies and
the availability of imported water become
more stressed, many agencies have explored
and invested in recycling as a local and
sustainable water resource. The City has
used SMURFF in this capacity, albeit
limited over the years.
For most applications, water recycling
means treating wastewater so that it can be
safely used for irrigation and some industrial
purposes. In some cases this resource is also
used for open reservoir augmentation,
groundwater replenishment, and
groundwater management as a barrier
against seawater intrusion. Since the City’s
wastewater is conveyed to the City of Los
Angeles for treatment, the City does not
have immediate access to recycled water in
the City, and must deliver this resource from
outside the City.
Currently the City benefits from the use of
recycled dry weather urban runoff and does
not use recycled wastewater. However, the
City benefits indirectly from regional uses of
recycled water. The City does not currently
have the capability to construct a treatment
facility within its limits.
Potential and Projected Uses of Recycled Wastewater
As indicated in the 2014 Sustainable Water
Master Plan (Appendix XX), a market
assessment was performed in order to
determine the potential for additional
recycled water use within the City. The
assessment combined results of a billing
data analysis with a GIS analysis to identify
potential recycled water customers and
estimate total potential recycled water
DRAFT
CITY OF SANTA MONICA URBAN WATER MANAGEMENT PLAN
2015
2015 URBAN WATER MANAGEMENT PLAN SECTION 2: WATER SOURCES & SUPPLIES
2 - 15
demand within the City. Once customers
were identified, a conceptual recycled water
distribution system was developed in order
to estimate preliminary costs associated with
expanded recycled water distribution in the
City.
A conceptual recycled water system was
developed in the Sustainable Water Master
Plan that could serve the majority of the
City’s largest dedicated landscape irrigation
customers with recycled water. The system
utilizes and expands upon the existing
SMURRF distribution system, receiving
water from the City of Los Angeles’s
potential Westside recycled water
distribution system located to the southeast
of the City. In order to estimate the amount
of recycled water the conceptual system
might be able to deliver as well as develop a
preliminary cost estimate, the conceptual
system was divided into seven separate
demand areas. Recycled water demand was
estimated by selecting the dedicated
landscape irrigation customers located
within each demand area using GIS and
totaling their annual demand. A preliminary
cost estimate was developed by estimating
the daily flow rate and velocity for each pipe
segment in order to estimate an appropriate
pipe diameter. Once the pipe diameter was
determined, cost estimates were developed
based on estimates of the length of pipe
needed to construct the system. The total
estimated water demand for the conceptual
recycled water distribution system is 390
AYF. The estimated demand consists of 290
AFY of demand from current customers,
including existing SMURRF recycled water
customers, and an additional 100 AFY of
future opportunities. Specific summary data
is included in Appendix XX.
Future Plans for Recycled Wastewater
The Sustainable Water Master Plan of 2014
addressed the potential for additional
recycled water opportunities as an alternate
water source. To this end, the City is
considering modifying its SMURRF facility
to be able to produce a more consistent level
of non-potable water supply, and fully
utilizing the current 500 AFY capacity. This
is envisioned through utilizing distributed
advanced water treatment technologies (e.g.
Reverse Osmosis (RO), ultra and
nanofiltration and ultraviolet disinfection) to
produce potable quality water. Initially the
treated water will be utilized for expanded
non-potable reuse (irrigation, toilets, and
indirect reuse such as aquifer storage and
recovery, and/or salt water intrusion barrier
maintenance).
The source water for this increased
production is planned from multiple non-
potable water sources that are currently
underutilized or even wasted to the ocean.
Specifically, the plan considers using
stormwater, urban runoff and brackish/saline
groundwater as feed water for the treatment
units. The brackish/saline ground water will
be sourced by two extraction wells sited on
the beach at existing City maintenance
areas, or from existing abandoned wells
along the coast. Proceeding under this plan,
the City would expand its capture and
treatment of stormwater and urban runoff to
further enhance its efforts to improve the
water quality of Santa Monica Bay and,
more specifically, the waters around the
Santa Monica Pier.
2.5.2 Stormwater and Rainwater
Harvesting
As presented 2014 Sustainable Water
Master Plan (Appendix XX), rainwater
harvesting is the accumulation and storage
of rainwater for reuse before it reaches the
groundwater. Rainwater harvesting can
ensure an independent water supply for
activities such as irrigation and other non-
DRAFT
2015 CITY OF SANTA MONICA URBAN WATER MANAGEMENT PLAN
2 - 16 2015 URBAN WATER MANAGMENT PLAN SECTION 2: WATER SOURCES & SUPPLIES
potable uses. This helps to offset potable
water demands by ensuring a renewable
source during regular and water restrictive
times. In addition, it produces beneficial
effects by reducing peak storm water runoff
and related processing costs. In
municipalities with systems, reducing storm
runoff is especially important, because
excess runoff during heavy storms leads to
the discharge of raw sewage when treatment
plant capacity cannot handle the combined
flow.
This alternative was evaluated as a water
supply option for offsetting potable water
demand in addition to reducing the amount
of polluted storm water runoff from entering
the Santa Monica Bay. The City actively
promotes the use of rainwater for landscape
irrigation through numerous free workshops
for professionals and homeowners in
addition to rebates for rain barrels and
cisterns. In the recent years the City
initiative has been very successful in
promoting rebates on rain harvesting
products and the City has been awarded
grant funding from the California
Department of Water Resources.
Rainwater harvesting (the capture and onsite
use of rainwater for landscape irrigation
purposes) offers minimal opportunity as an
additional water supply within the City.
Santa Monica’s Mediterranean climate is
characterized by seasonal rainfall, with the
majority of rain falling in the winter months
of November through March. Conversely,
landscape water demands are highest in the
warmer, drier months of April through
September. Analyses were performed to
evaluate and compare the potential for
rainwater harvesting based on average
monthly precipitation data and monthly
landscape water demand for residential and
commercial customers.
Results of the above analysis indicate that
the potential for rainwater harvesting as a
supply option in Santa Monica is limited by
the large size of cisterns and customers’
motivation to install them. For most
residential and commercial customers in the
City, space is limited; therefore, it was
assumed customers would install no more
than 500 gallons of rainwater harvesting
capacity. A cistern of this size is depleted
quickly, even in the wetter winter months. In
the drier summer months, rainwater supply
is minimal, and when available, landscape
irrigation demand far exceeds the capacity
of the cistern therefore depleting this supply
rapidly. Residential cistern installation, even
with a rebate of $1,000 per cistern, has been
minimally accepted by the City’s customers.
Accordingly, it is estimated that the
rainwater harvesting incentive program may
provide only 1-2 AF per year.
Similarly, a City-wide stormwater capture
program offers a seasonal, unreliable
additional water supply option for the City.
A scenario has been developed in which
stormwater captured through the City’s
storm drain system would be routed to the
Santa Monica Urban Runoff Recycling
Facility (SMURRF) for distribution to
landscape irrigation customers. It is
estimated that a City-wide stormwater
capture program could generate an
additional 160 AF of supply per year. This
alternate water supply would reduce potable
water demand while reducing the amount of
polluted storm water runoff from entering
the Santa Monica Bay. The City actively
promotes the use of rainwater for landscape
irrigation through numerous free workshops
for professionals and homeowners in
addition to rebates for rain barrels and
cisterns.
DRAFT
To ensure the highest water quality possible, imported water supplied by the City is treated at one of five separate MWD treatment plants (pictured). The City’s groundwater is also for quality. The City recognizes that water quality is a concern to not only public health but also to their future water supply.
CITY OF SANTA MONICA URBAN WATER MANAGEMENT PLAN 2015
2015 URBAN WATER MANAGEMENT PLAN SECTION 3: WATER QUALITY
3 - 1
SECTION 3: WATER QUALITY 3.1 WATER QUALITY SUMMARY In 1974, Congress passed the Safe Drinking Water Act in order to protect public health by regulating the nation's drinking water supply. As required by the Safe Drinking Water Act, the City provides annual Water Quality Reports to its customers. Currently, all of the water that the City distributes to its customers meet federal EPA standards and California Department of Health Services (CDHS) Standards. The quality of water distributed to the City's water system is directly related to the quality of the supply sources from which the City obtains its water. This section explores the quality of the City's supply sources and examines important water contaminants that the City actively monitors as part of its efforts to supply safe drinking water to its customers 3.2 QUALITY OF SOURCES 3.2.1 Imported Water The City receives imported water from MWD in order to supplement its groundwater supplies and for blending needs to meet Federal and CDHS standards. Imported water obtained from the SWP and the CRA contain specific contaminants which are characteristic of the Bay Delta and the Colorado River regions. Some of the contaminants of concern include: salinity, biological loads, disinfection by-products, percholorate, uranium, and arsenic. MWD's 2010 RUWMP discusses the water quality concerns of its supplies. To provide safe drinking water to its customers, MWD treats its water supply at
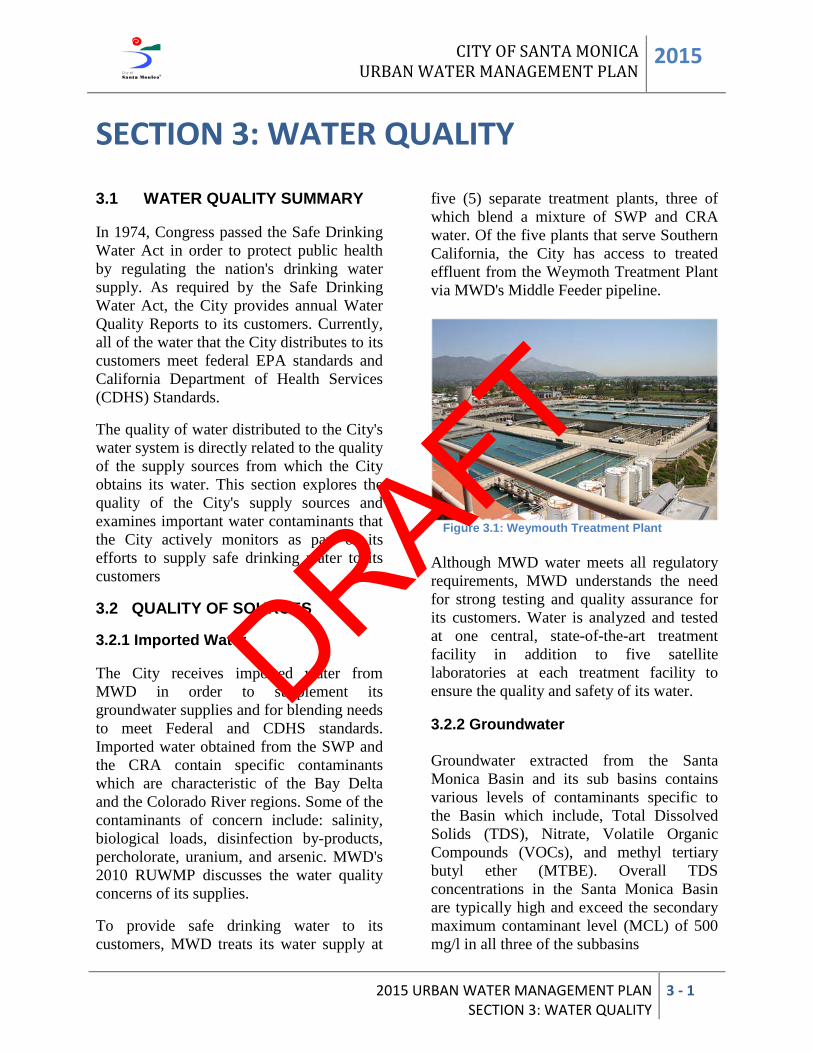
five (5) separate treatment plants, three of which blend a mixture of SWP and CRA water. Of the five plants that serve Southern California, the City has access to treated effluent from the Weymoth Treatment Plant via MWD's Middle Feeder pipeline.
Figure 3.1: Weymouth Treatment Plant Although MWD water meets all regulatory requirements, MWD understands the need for strong testing and quality assurance for its customers. Water is analyzed and tested at one central, state-of-the-art treatment facility in addition to five satellite laboratories at each treatment facility to ensure the quality and safety of its water. 3.2.2 Groundwater Groundwater extracted from the Santa Monica Basin and its sub basins contains various levels of contaminants specific to the Basin which include, Total Dissolved Solids (TDS), Nitrate, Volatile Organic Compounds (VOCs), and methyl tertiary butyl ether (MTBE). Overall TDS concentrations in the Santa Monica Basin are typically high and exceed the secondary maximum contaminant level (MCL) of 500 mg/l in all three of the subbasins
DRAFT
2015 CITY OF SANTA MONICA URBAN WATER MANAGEMENT PLAN
3 - 2 2015 URBAN WATER MANAGEMENT PLAN SECTION 3: WATER QUALITY
Ensuring the Safety of the City’s Water For about 15 years (1995-2010), the City was significantly impacted as a result of MTBE contamination. The City eventually settled with responsible parties of the MTBE contamination in order to construct and operate a treatment facility to clean up residual MTBE contamination.
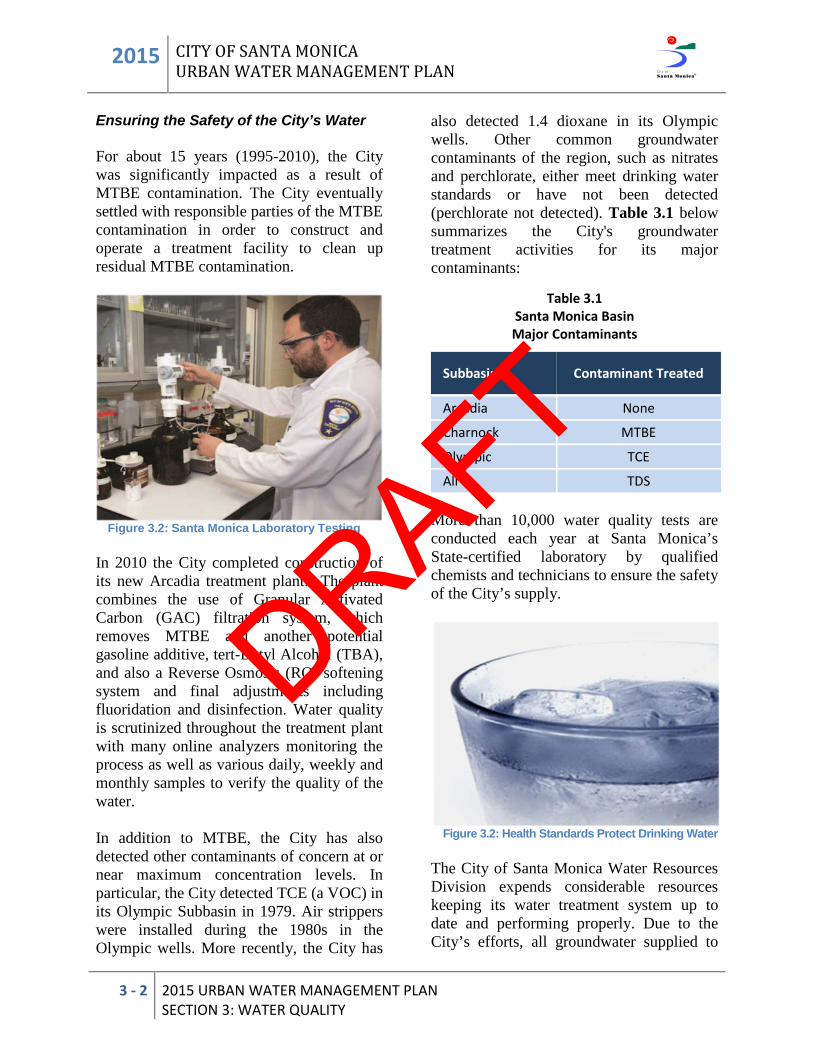
Figure 3.2: Santa Monica Laboratory Testing In 2010 the City completed construction of its new Arcadia treatment plant. The plant combines the use of Granular Activated Carbon (GAC) filtration system, which removes MTBE and another potential gasoline additive, tert-Butyl Alcohol (TBA), and also a Reverse Osmosis (RO) softening system and final adjustments including fluoridation and disinfection. Water quality is scrutinized throughout the treatment plant with many online analyzers monitoring the process as well as various daily, weekly and monthly samples to verify the quality of the water. In addition to MTBE, the City has also detected other contaminants of concern at or near maximum concentration levels. In particular, the City detected TCE (a VOC) in its Olympic Subbasin in 1979. Air strippers were installed during the 1980s in the Olympic wells. More recently, the City has
also detected 1.4 dioxane in its Olympic wells. Other common groundwater contaminants of the region, such as nitrates and perchlorate, either meet drinking water standards or have not been detected (perchlorate not detected). Table 3.1 below summarizes the City's groundwater treatment activities for its major contaminants:
Table 3.1 Santa Monica Basin Major Contaminants
Subbasin Contaminant Treated
Arcadia None
Charnock MTBE
Olympic TCE
All TDS More than 10,000 water quality tests are conducted each year at Santa Monica’s State-certified laboratory by qualified chemists and technicians to ensure the safety of the City’s supply.
Figure 3.2: Health Standards Protect Drinking Water The City of Santa Monica Water Resources Division expends considerable resources keeping its water treatment system up to date and performing properly. Due to the City’s efforts, all groundwater supplied to
DRAFT
CITY OF SANTA MONICA URBAN WATER MANAGEMENT PLAN 2015
2015 URBAN WATER MANAGEMENT PLAN SECTION 3: WATER QUALITY
3 - 3
the City's distribution system meets federal and state drinking water standards. Recycled Dry Weather Urban Runoff The City's SMURRF uses a state-of-the-art treatment process to treat dry weather urban runoff in a seven-step treatment process to California Title 22 standards. The City's SMURRF is considered to be a Best Management Practice (BMP) to reduce pollutants by the Regional Water Quality Control Board (RWQCB). 3.3 WATER QUALITY EFFECTS The previous section discussed water quality issues affecting the City's water supply operations. Due to advanced treatment
procedures and an approved blending plan, the City does not anticipate any reductions in its water supplies due to water quality issues in the near future. Future regulatory changes enacted by the EPA and/or the State legislature will be met through additional mitigation and treatment actions in order to meet the standards and to maintain water supply to the City's customers. Thus, the City does not expect water quality to be a major factor in its supply reliability considerations. However, water quality issues will continue to influence day-to-day water operations and management decisions as mitigation and treatment procedures are evaluated to determine their cost and treatment effectiveness against alternative procedures.
DRAFT
2015 CITY OF SANTA MONICA URBAN WATER MANAGEMENT PLAN
3 - 4 2015 URBAN WATER MANAGEMENT PLAN SECTION 3: WATER QUALITY
This Page Left Blank Intentionally .
DRAFT
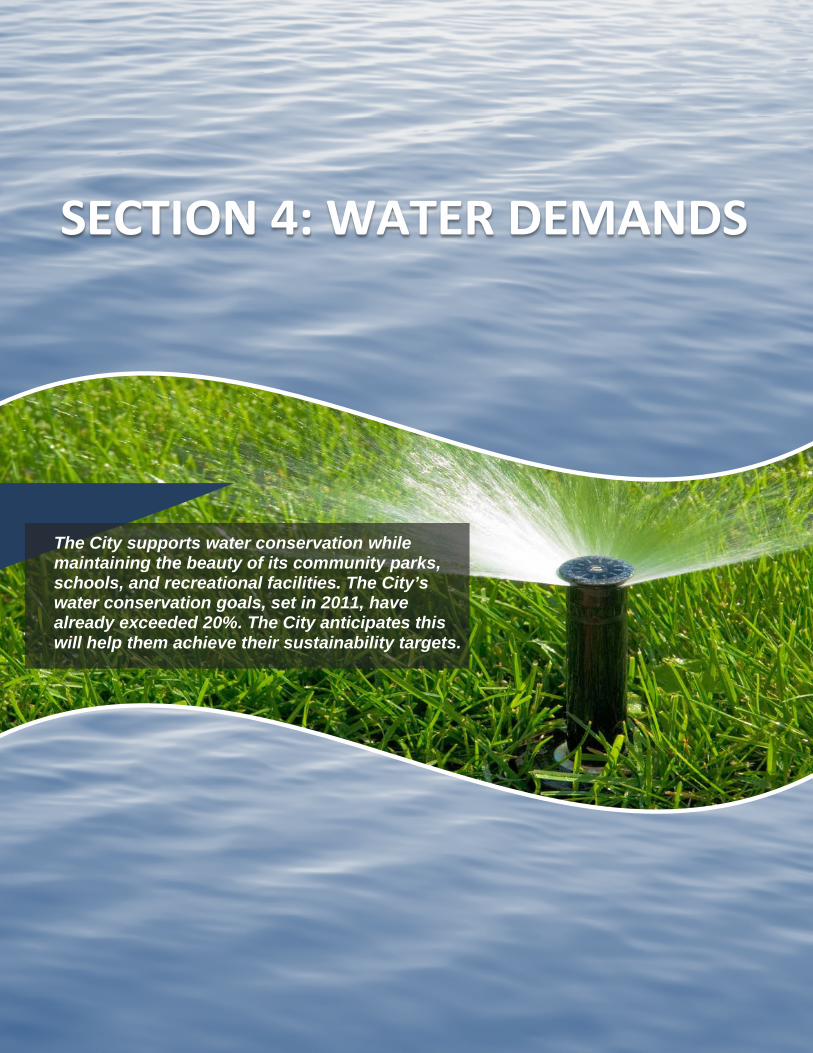
The City supports water conservation while maintaining the beauty of its community parks, schools, and recreational facilities. The City’s water conservation goals, set in 2011, have already exceeded 20%. The City anticipates this will help them achieve their sustainability targets.
CITY OF SANTA MONICA URBAN WATER MANAGEMENT PLAN 2015
2015 URBAN WATER MANAGEMENT PLAN SECTION 4: WATER DEMANDS
4- 1
SECTION 4: WATER DEMANDS 4.1 FACTORS AFFECTING DEMAND Water use within the City is variable and depends on a number of factors that range from increases and decreases in irrigation and water losses to changes in plumbing fixtures and customer usage habits. This section explores the water usage trends within the City and quantifies total usage per customer type. Urbanization's Effect on Water Use The City of Santa Monica, like most of Southern California, began as a small, suburban town with plenty of room for development. Previous land uses in the City at that time were mostly residential with some commercial use for hotels. By 1875, the City's population reached 1,000 persons and the City continued to grow as a seaside sanctuary for wealthy vacationers.
Figure 4.1: Early Santa Monica The City was incorporated in 1887and began its water operations during the early 1900s. In 1928, the City joined 12 other local cities in forming the Metropolitan Water District (MWD). Through these steps, the City paved the way for continued urban
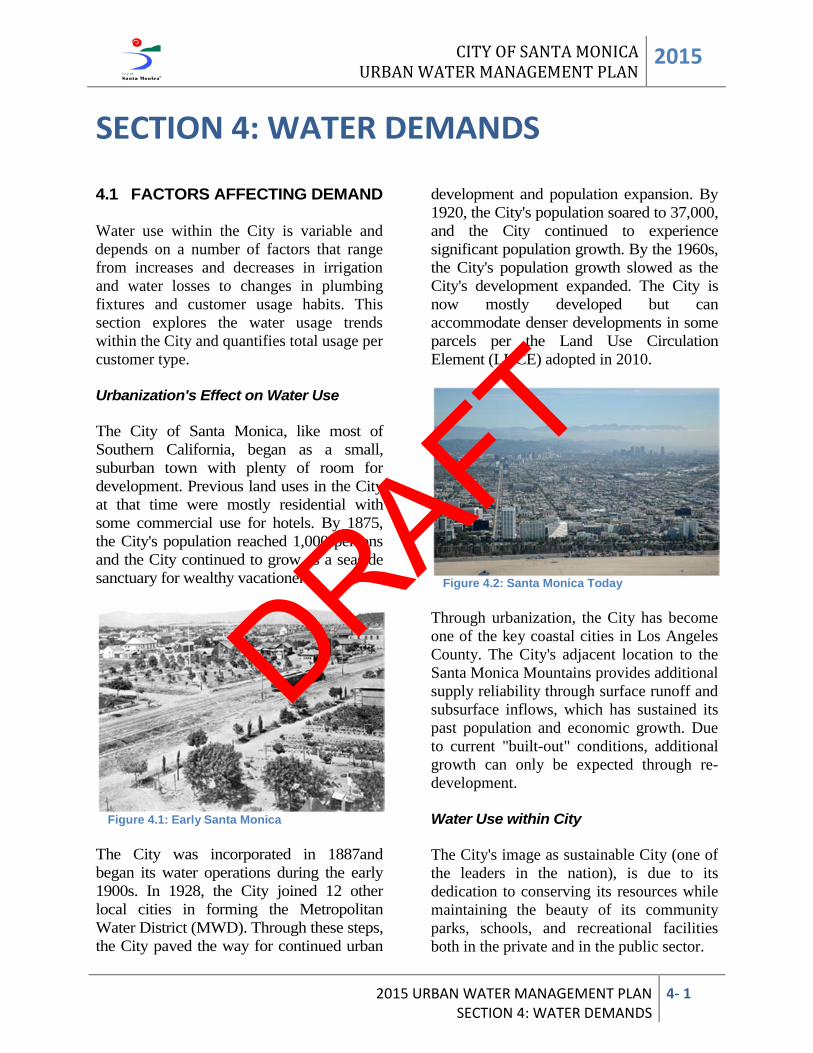
development and population expansion. By 1920, the City's population soared to 37,000, and the City continued to experience significant population growth. By the 1960s, the City's population growth slowed as the City's development expanded. The City is now mostly developed but can accommodate denser developments in some parcels per the Land Use Circulation Element (LUCE) adopted in 2010.
Figure 4.2: Santa Monica Today Through urbanization, the City has become one of the key coastal cities in Los Angeles County. The City's adjacent location to the Santa Monica Mountains provides additional supply reliability through surface runoff and subsurface inflows, which has sustained its past population and economic growth. Due to current "built-out" conditions, additional growth can only be expected through re-development. Water Use within City The City's image as sustainable City (one of the leaders in the nation), is due to its dedication to conserving its resources while maintaining the beauty of its community parks, schools, and recreational facilities both in the private and in the public sector.
DRAFT
2015 CITY OF SANTA MONICA URBAN WATER MANAGEMENT PLAN
4- 2 2015 URBAN WATER MANAGEMENT PLAN SECTION 4: WATER DEMANDS
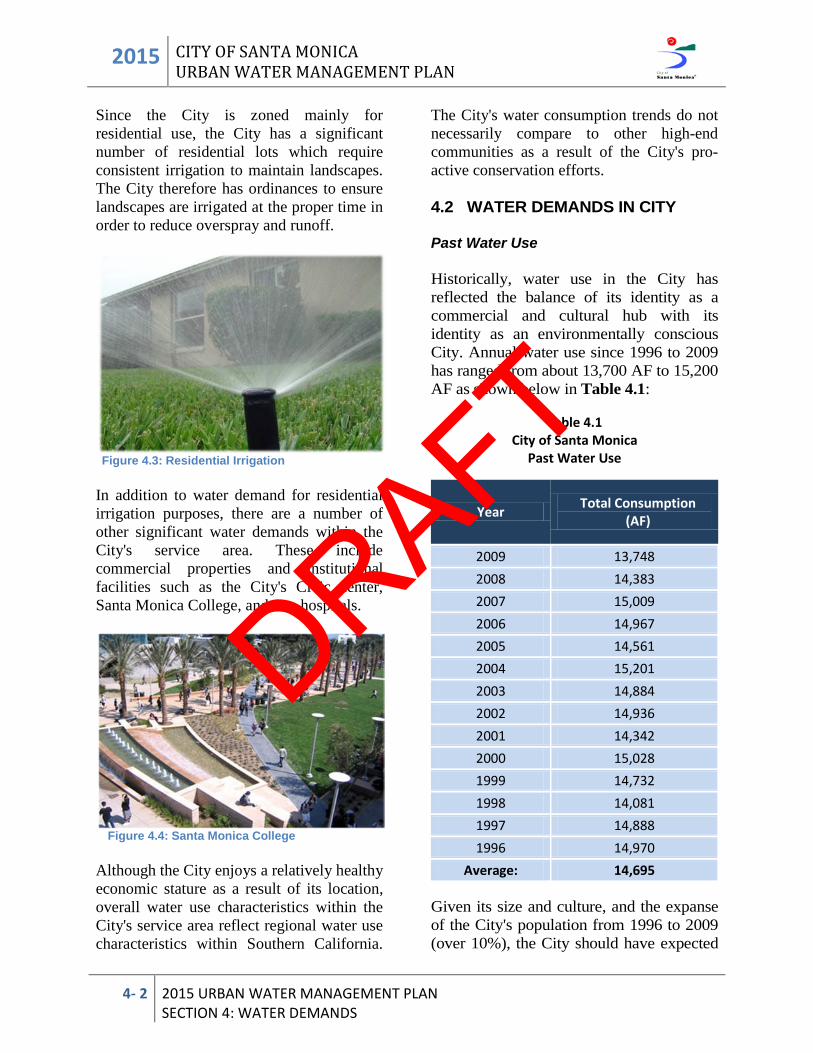
Since the City is zoned mainly for residential use, the City has a significant number of residential lots which require consistent irrigation to maintain landscapes. The City therefore has ordinances to ensure landscapes are irrigated at the proper time in order to reduce overspray and runoff.
Figure 4.3: Residential Irrigation In addition to water demand for residential irrigation purposes, there are a number of other significant water demands within the City's service area. These include commercial properties and institutional facilities such as the City's Civic center, Santa Monica College, and two hospitals.
Figure 4.4: Santa Monica College Although the City enjoys a relatively healthy economic stature as a result of its location, overall water use characteristics within the City's service area reflect regional water use characteristics within Southern California.
The City's water consumption trends do not necessarily compare to other high-end communities as a result of the City's pro-active conservation efforts. 4.2 WATER DEMANDS IN CITY Past Water Use Historically, water use in the City has reflected the balance of its identity as a commercial and cultural hub with its identity as an environmentally conscious City. Annual water use since 1996 to 2009 has ranged from about 13,700 AF to 15,200 AF as shown below in Table 4.1:
Table 4.1 City of Santa Monica
Past Water Use
Year Total Consumption (AF)
2009 13,748 2008 14,383 2007 15,009 2006 14,967 2005 14,561 2004 15,201 2003 14,884 2002 14,936 2001 14,342 2000 15,028 1999 14,732 1998 14,081 1997 14,888 1996 14,970
Average: 14,695 Given its size and culture, and the expanse of the City's population from 1996 to 2009 (over 10%), the City should have expected
DRAFT
CITY OF SANTA MONICA URBAN WATER MANAGEMENT PLAN 2015
2015 URBAN WATER MANAGEMENT PLAN SECTION 4: WATER DEMANDS
4- 3
to experience at least a slight upward trend in water use. As indicted by the relatively constant numbers in Table 4.1, water use did not increase during this time period. Recent Water Use Recent water use has been trending downward in the City, primarily due to increased awareness of conservation and stricter City ordinances. However, the recent drought of 2011-2015 has caused a small rise in water use, as indicated by Table 4.2 below:
Table 4.2 Five-Year Recent Water Use
(Service Area Total)
Year Potable Demand (AF)
2015 11,837
2014 13,987
2013 14,078
2012 14,831
2011 13,065
2010 13,040
Average: 13,473
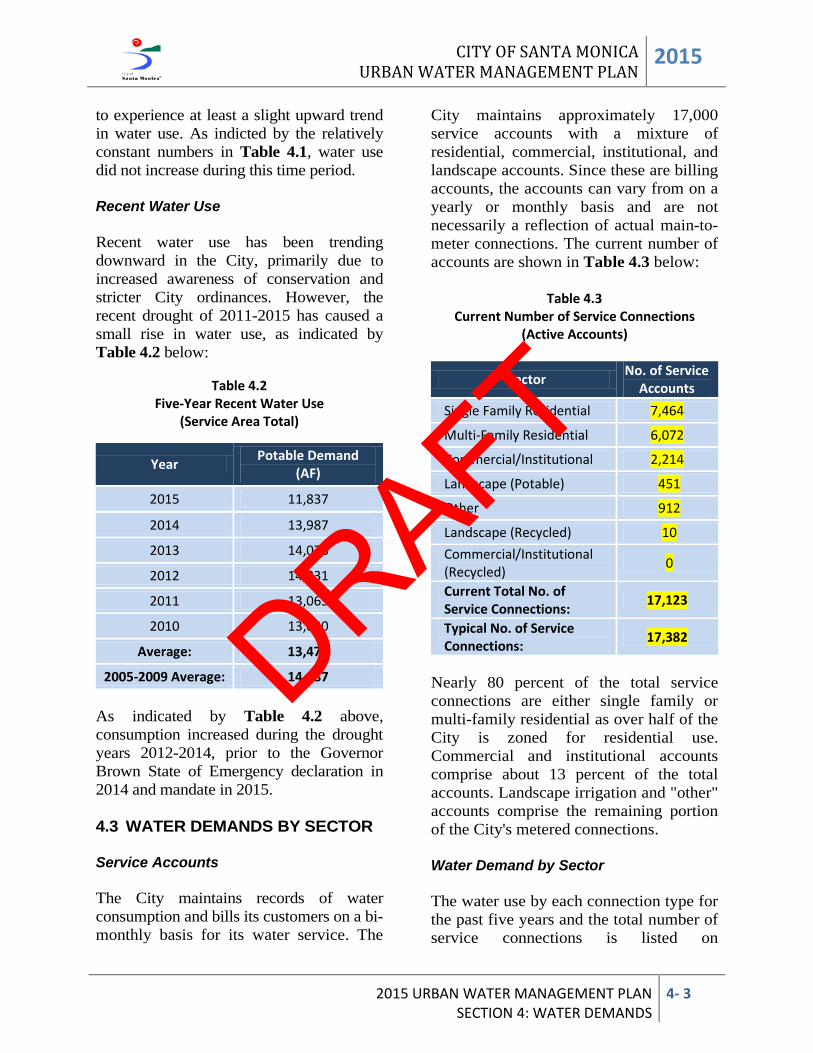
2005-2009 Average: 14,687 As indicated by Table 4.2 above, consumption increased during the drought years 2012-2014, prior to the Governor Brown State of Emergency declaration in 2014 and mandate in 2015. 4.3 WATER DEMANDS BY SECTOR Service Accounts The City maintains records of water consumption and bills its customers on a bi-monthly basis for its water service. The
City maintains approximately 17,000 service accounts with a mixture of residential, commercial, institutional, and landscape accounts. Since these are billing accounts, the accounts can vary from on a yearly or monthly basis and are not necessarily a reflection of actual main-to-meter connections. The current number of accounts are shown in Table 4.3 below:
Table 4.3 Current Number of Service Connections
(Active Accounts)
Sector No. of Service Accounts
Single Family Residential 7,464
Multi-Family Residential 6,072
Commercial/Institutional 2,214
Landscape (Potable) 451
Other 912
Landscape (Recycled) 10 Commercial/Institutional (Recycled) 0
Current Total No. of Service Connections: 17,123
Typical No. of Service Connections: 17,382
Nearly 80 percent of the total service connections are either single family or multi-family residential as over half of the City is zoned for residential use. Commercial and institutional accounts comprise about 13 percent of the total accounts. Landscape irrigation and "other" accounts comprise the remaining portion of the City's metered connections. Water Demand by Sector The water use by each connection type for the past five years and the total number of service connections is listed on
DRAFT
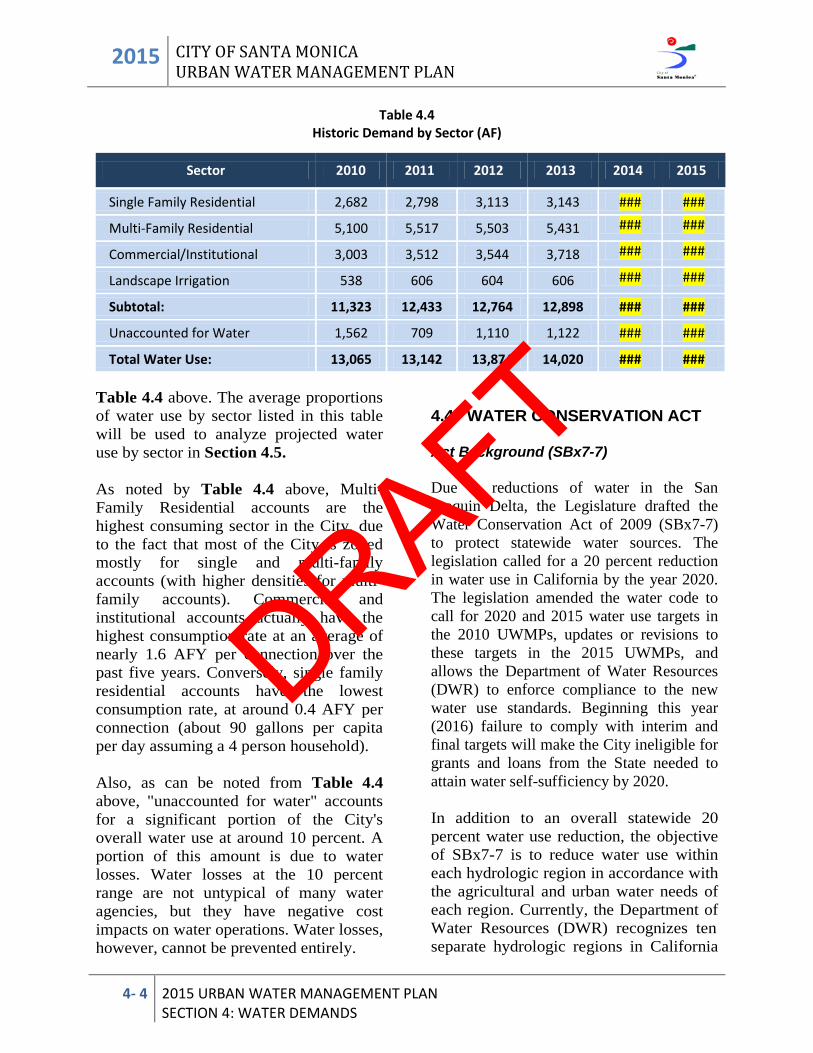
2015 CITY OF SANTA MONICA URBAN WATER MANAGEMENT PLAN
4- 4 2015 URBAN WATER MANAGEMENT PLAN SECTION 4: WATER DEMANDS
Table 4.4 Historic Demand by Sector (AF)
Sector 2010 2011 2012 2013 2014 2015
Single Family Residential 2,682 2,798 3,113 3,143 ### ###
Multi-Family Residential 5,100 5,517 5,503 5,431 ### ###
Commercial/Institutional 3,003 3,512 3,544 3,718 ### ###
Landscape Irrigation 538 606 604 606 ### ###
Subtotal: 11,323 12,433 12,764 12,898 ### ###
Unaccounted for Water 1,562 709 1,110 1,122 ### ###
Total Water Use: 13,065 13,142 13,874 14,020 ### ### Table 4.4 above. The average proportions of water use by sector listed in this table will be used to analyze projected water use by sector in Section 4.5. As noted by Table 4.4 above, Multi-Family Residential accounts are the highest consuming sector in the City, due to the fact that most of the City is zoned mostly for single and multi-family accounts (with higher densities for multi-family accounts). Commercial and institutional accounts actually have the highest consumption rate at an average of nearly 1.6 AFY per connection over the past five years. Conversely, single family residential accounts have the lowest consumption rate, at around 0.4 AFY per connection (about 90 gallons per capita per day assuming a 4 person household). Also, as can be noted from Table 4.4 above, "unaccounted for water" accounts for a significant portion of the City's overall water use at around 10 percent. A portion of this amount is due to water losses. Water losses at the 10 percent range are not untypical of many water agencies, but they have negative cost impacts on water operations. Water losses, however, cannot be prevented entirely.
4.4 WATER CONSERVATION ACT Act Background (SBx7-7) Due to reductions of water in the San Joaquin Delta, the Legislature drafted the Water Conservation Act of 2009 (SBx7-7) to protect statewide water sources. The legislation called for a 20 percent reduction in water use in California by the year 2020. The legislation amended the water code to call for 2020 and 2015 water use targets in the 2010 UWMPs, updates or revisions to these targets in the 2015 UWMPs, and allows the Department of Water Resources (DWR) to enforce compliance to the new water use standards. Beginning this year (2016) failure to comply with interim and final targets will make the City ineligible for grants and loans from the State needed to attain water self-sufficiency by 2020. In addition to an overall statewide 20 percent water use reduction, the objective of SBx7-7 is to reduce water use within each hydrologic region in accordance with the agricultural and urban water needs of each region. Currently, the Department of Water Resources (DWR) recognizes ten separate hydrologic regions in California
DRAFT
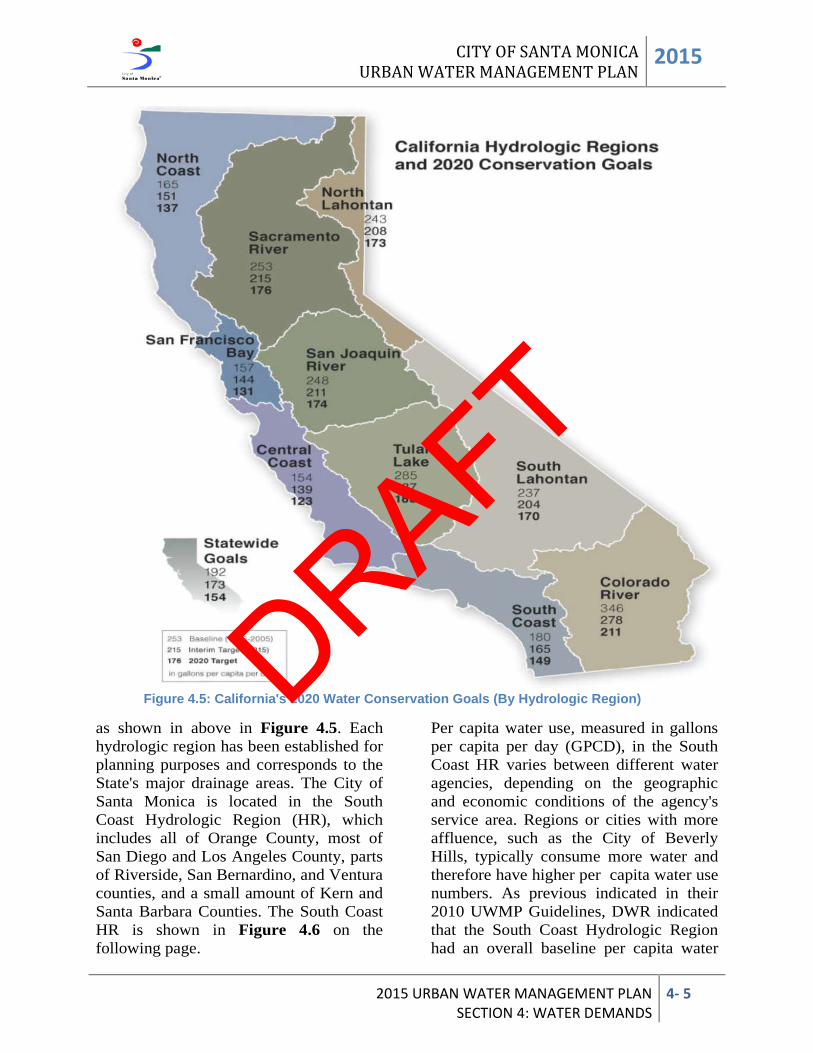
CITY OF SANTA MONICA URBAN WATER MANAGEMENT PLAN 2015
2015 URBAN WATER MANAGEMENT PLAN SECTION 4: WATER DEMANDS
4- 5
Figure 4.5: California's 2020 Water Conservation Goals (By Hydrologic Region) as shown in above in Figure 4.5. Each hydrologic region has been established for planning purposes and corresponds to the State's major drainage areas. The City of Santa Monica is located in the South Coast Hydrologic Region (HR), which includes all of Orange County, most of San Diego and Los Angeles County, parts of Riverside, San Bernardino, and Ventura counties, and a small amount of Kern and Santa Barbara Counties. The South Coast HR is shown in Figure 4.6 on the following page.
Per capita water use, measured in gallons per capita per day (GPCD), in the South Coast HR varies between different water agencies, depending on the geographic and economic conditions of the agency's service area. Regions or cities with more affluence, such as the City of Beverly Hills, typically consume more water and therefore have higher per capita water use numbers. As previous indicated in their 2010 UWMP Guidelines, DWR indicated that the South Coast Hydrologic Region had an overall baseline per capita water
DRAFT
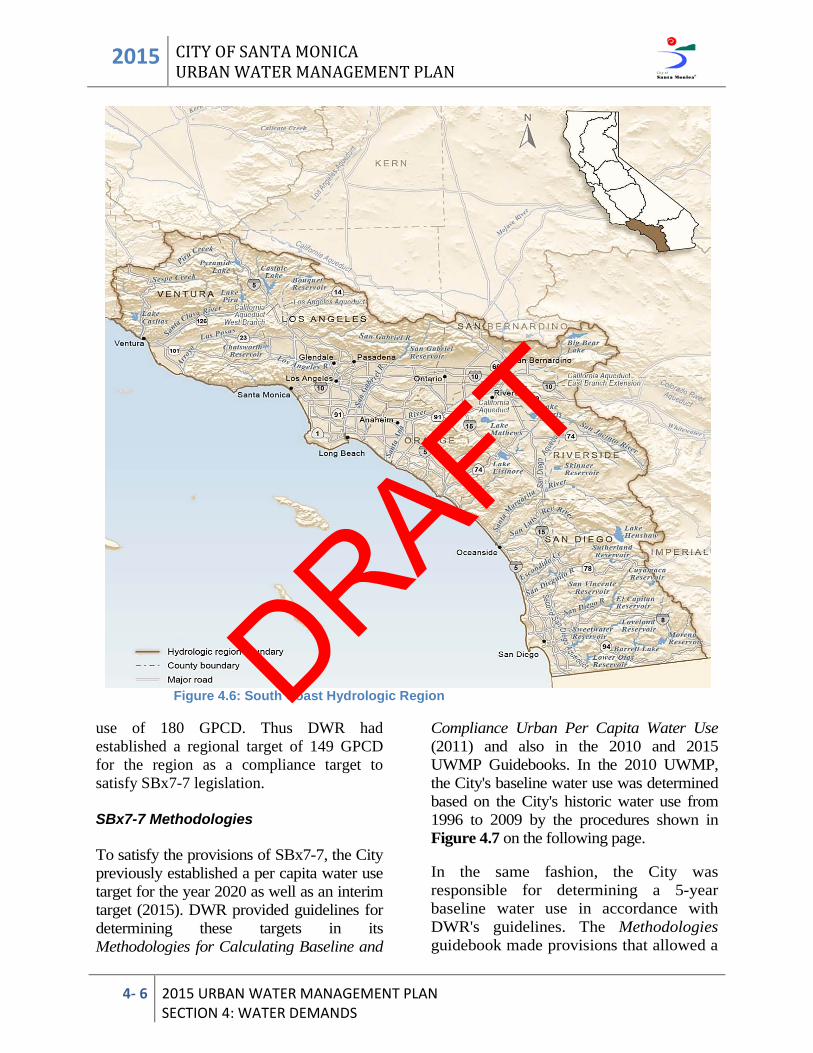
2015 CITY OF SANTA MONICA URBAN WATER MANAGEMENT PLAN
4- 6 2015 URBAN WATER MANAGEMENT PLAN SECTION 4: WATER DEMANDS
Figure 4.6: South Coast Hydrologic Region
use of 180 GPCD. Thus DWR had established a regional target of 149 GPCD for the region as a compliance target to satisfy SBx7-7 legislation. SBx7-7 Methodologies To satisfy the provisions of SBx7-7, the City previously established a per capita water use target for the year 2020 as well as an interim target (2015). DWR provided guidelines for determining these targets in its Methodologies for Calculating Baseline and
Compliance Urban Per Capita Water Use (2011) and also in the 2010 and 2015 UWMP Guidebooks. In the 2010 UWMP, the City's baseline water use was determined based on the City's historic water use from 1996 to 2009 by the procedures shown in Figure 4.7 on the following page. In the same fashion, the City was responsible for determining a 5-year baseline water use in accordance with DWR's guidelines. The Methodologies guidebook made provisions that allowed a
DRAFT
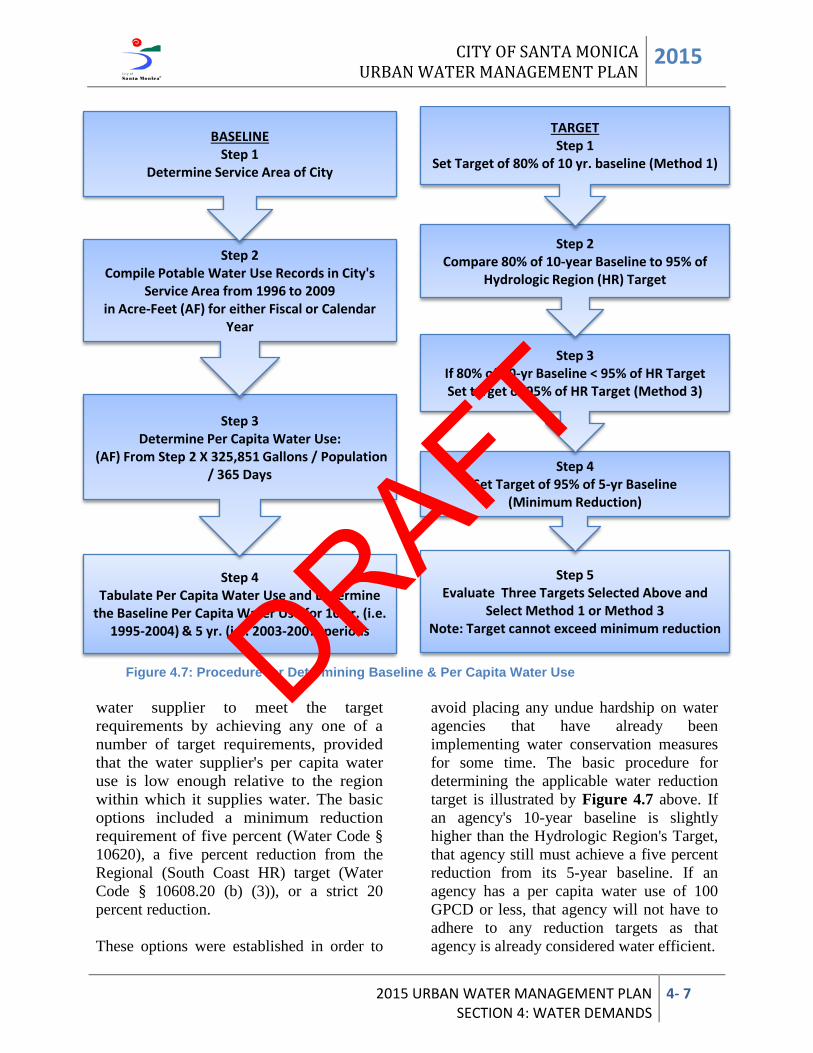
CITY OF SANTA MONICA URBAN WATER MANAGEMENT PLAN 2015
2015 URBAN WATER MANAGEMENT PLAN SECTION 4: WATER DEMANDS
4- 7
Figure 4.7: Procedure for Determining Baseline & Per Capita Water Use water supplier to meet the target requirements by achieving any one of a number of target requirements, provided that the water supplier's per capita water use is low enough relative to the region within which it supplies water. The basic options included a minimum reduction requirement of five percent (Water Code § 10620), a five percent reduction from the Regional (South Coast HR) target (Water Code § 10608.20 (b) (3)), or a strict 20 percent reduction. These options were established in order to
avoid placing any undue hardship on water agencies that have already been implementing water conservation measures for some time. The basic procedure for determining the applicable water reduction target is illustrated by Figure 4.7 above. If an agency's 10-year baseline is slightly higher than the Hydrologic Region's Target, that agency still must achieve a five percent reduction from its 5-year baseline. If an agency has a per capita water use of 100 GPCD or less, that agency will not have to adhere to any reduction targets as that agency is already considered water efficient.
Step 4Tabulate Per Capita Water Use and Determine
the Baseline Per Capita Water Use for 10 yr. (i.e. 1995-2004) & 5 yr. (i.e. 2003-2007) periods
Step 3Determine Per Capita Water Use:
(AF) From Step 2 X 325,851 Gallons / Population / 365 Days
Step 2Compile Potable Water Use Records in City's
Service Area from 1996 to 2009 in Acre-Feet (AF) for either Fiscal or Calendar
Year
BASELINEStep 1
Determine Service Area of City
Step 5Evaluate Three Targets Selected Above and
Select Method 1 or Method 3 Note: Target cannot exceed minimum reduction
Step 4 Set Target of 95% of 5-yr Baseline
(Minimum Reduction)
Step 3If 80% of 10-yr Baseline < 95% of HR TargetSet target of 95% of HR Target (Method 3)
Step 2Compare 80% of 10-year Baseline to 95% of
Hydrologic Region (HR) Target
TARGETStep 1
Set Target of 80% of 10 yr. baseline (Method 1)
DRAFT
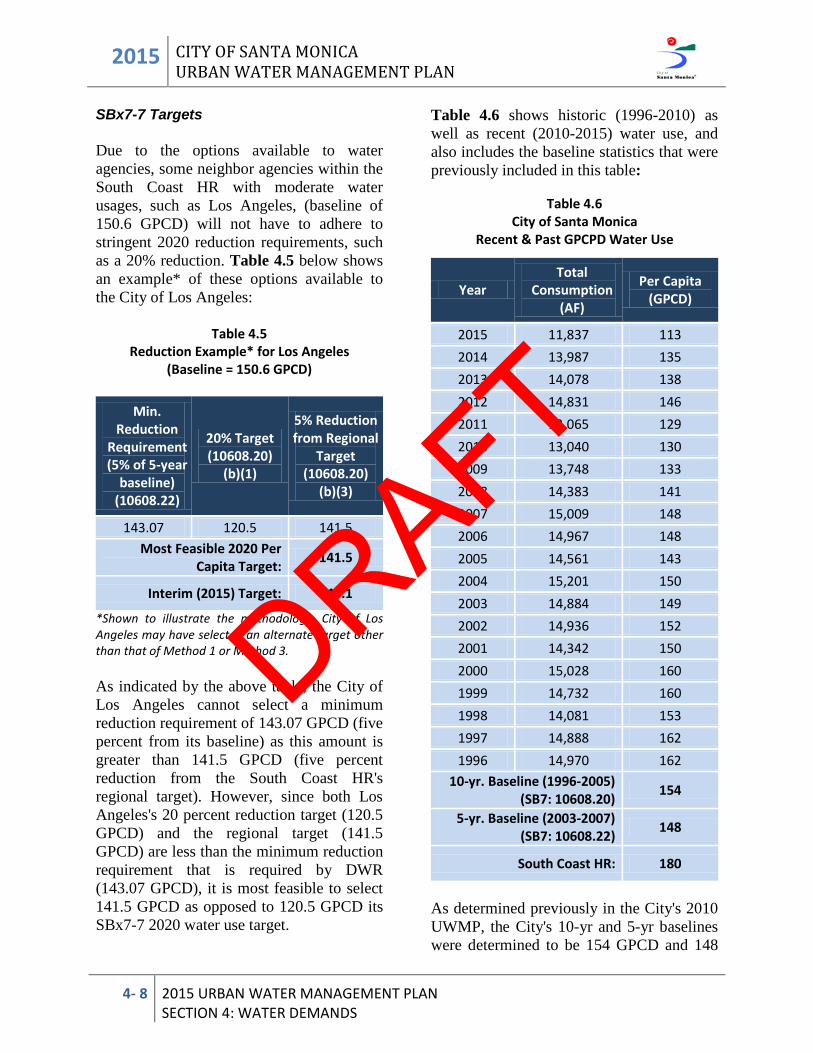
2015 CITY OF SANTA MONICA URBAN WATER MANAGEMENT PLAN
4- 8 2015 URBAN WATER MANAGEMENT PLAN SECTION 4: WATER DEMANDS
SBx7-7 Targets Due to the options available to water agencies, some neighbor agencies within the South Coast HR with moderate water usages, such as Los Angeles, (baseline of 150.6 GPCD) will not have to adhere to stringent 2020 reduction requirements, such as a 20% reduction. Table 4.5 below shows an example* of these options available to the City of Los Angeles:
Table 4.5 Reduction Example* for Los Angeles
(Baseline = 150.6 GPCD)
Min. Reduction
Requirement (5% of 5-year
baseline) (10608.22)
20% Target (10608.20)
(b)(1)
5% Reduction from Regional
Target (10608.20)
(b)(3)
143.07 120.5 141.5 Most Feasible 2020 Per
Capita Target: 141.5
Interim (2015) Target: 146.1
*Shown to illustrate the methodology. City of Los Angeles may have selected an alternate target other than that of Method 1 or Method 3. As indicated by the above table, the City of Los Angeles cannot select a minimum reduction requirement of 143.07 GPCD (five percent from its baseline) as this amount is greater than 141.5 GPCD (five percent reduction from the South Coast HR's regional target). However, since both Los Angeles's 20 percent reduction target (120.5 GPCD) and the regional target (141.5 GPCD) are less than the minimum reduction requirement that is required by DWR (143.07 GPCD), it is most feasible to select 141.5 GPCD as opposed to 120.5 GPCD its SBx7-7 2020 water use target.
Table 4.6 shows historic (1996-2010) as well as recent (2010-2015) water use, and also includes the baseline statistics that were previously included in this table:
Table 4.6 City of Santa Monica
Recent & Past GPCPD Water Use
Year Total
Consumption (AF)
Per Capita (GPCD)
2015 11,837 113 2014 13,987 135 2013 14,078 138 2012 14,831 146 2011 13,065 129 2010 13,040 130 2009 13,748 133 2008 14,383 141 2007 15,009 148 2006 14,967 148 2005 14,561 143 2004 15,201 150 2003 14,884 149 2002 14,936 152 2001 14,342 150 2000 15,028 160 1999 14,732 160 1998 14,081 153 1997 14,888 162 1996 14,970 162
10-yr. Baseline (1996-2005) (SB7: 10608.20) 154
5-yr. Baseline (2003-2007) (SB7: 10608.22) 148
South Coast HR: 180
As determined previously in the City's 2010 UWMP, the City's 10-yr and 5-yr baselines were determined to be 154 GPCD and 148
DRAFT
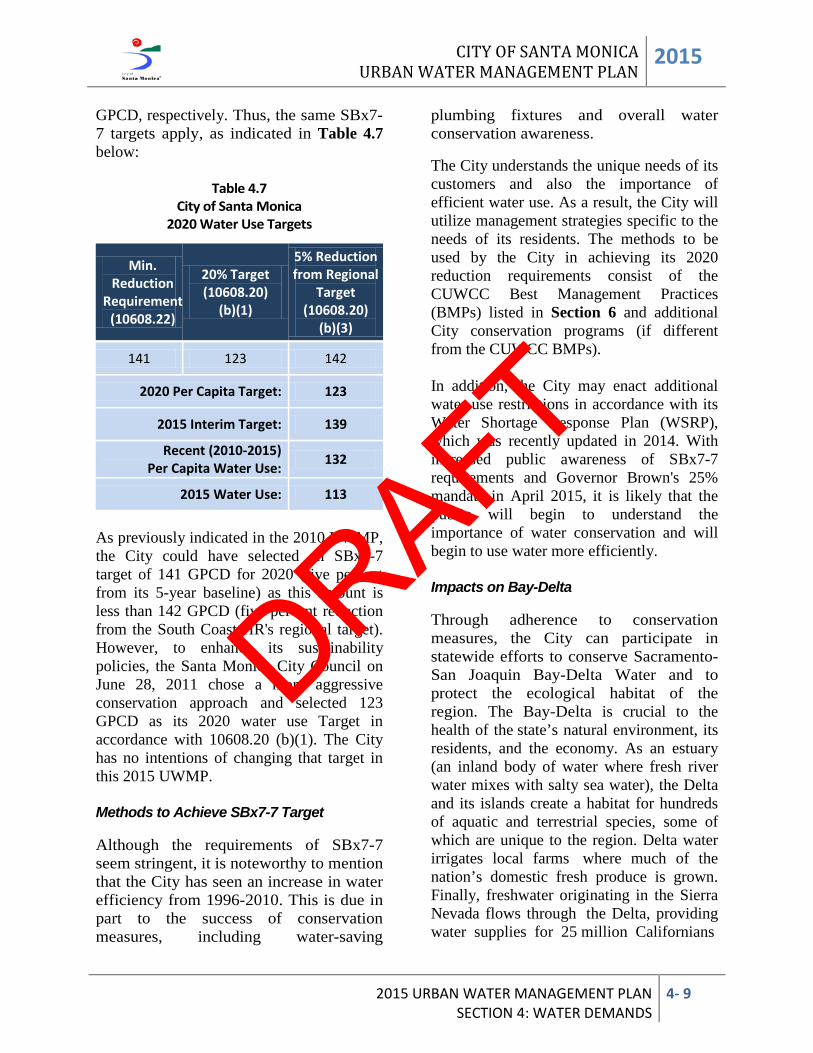
CITY OF SANTA MONICA URBAN WATER MANAGEMENT PLAN 2015
2015 URBAN WATER MANAGEMENT PLAN SECTION 4: WATER DEMANDS
4- 9
GPCD, respectively. Thus, the same SBx7-7 targets apply, as indicated in Table 4.7 below:
Table 4.7 City of Santa Monica
2020 Water Use Targets
Min. Reduction
Requirement (10608.22)
20% Target (10608.20)
(b)(1)
5% Reduction from Regional
Target (10608.20)
(b)(3)
141 123 142
2020 Per Capita Target: 123
2015 Interim Target: 139
Recent (2010-2015) Per Capita Water Use: 132
2015 Water Use: 113
As previously indicated in the 2010 UWMP, the City could have selected an SBx7-7 target of 141 GPCD for 2020 (five percent from its 5-year baseline) as this amount is less than 142 GPCD (five percent reduction from the South Coast HR's regional target). However, to enhance its sustainability policies, the Santa Monica City Council on June 28, 2011 chose a more aggressive conservation approach and selected 123 GPCD as its 2020 water use Target in accordance with 10608.20 (b)(1). The City has no intentions of changing that target in this 2015 UWMP. Methods to Achieve SBx7-7 Target Although the requirements of SBx7-7 seem stringent, it is noteworthy to mention that the City has seen an increase in water efficiency from 1996-2010. This is due in part to the success of conservation measures, including water-saving
plumbing fixtures and overall water conservation awareness. The City understands the unique needs of its customers and also the importance of efficient water use. As a result, the City will utilize management strategies specific to the needs of its residents. The methods to be used by the City in achieving its 2020 reduction requirements consist of the CUWCC Best Management Practices (BMPs) listed in Section 6 and additional City conservation programs (if different from the CUWCC BMPs). In addition, the City may enact additional water use restrictions in accordance with its Water Shortage Response Plan (WSRP), which was recently updated in 2014. With increased public awareness of SBx7-7 requirements and Governor Brown's 25% mandate in April 2015, it is likely that the public will begin to understand the importance of water conservation and will begin to use water more efficiently. Impacts on Bay-Delta Through adherence to conservation measures, the City can participate in statewide efforts to conserve Sacramento-San Joaquin Bay-Delta Water and to protect the ecological habitat of the region. The Bay-Delta is crucial to the health of the state’s natural environment, its residents, and the economy. As an estuary (an inland body of water where fresh river water mixes with salty sea water), the Delta and its islands create a habitat for hundreds of aquatic and terrestrial species, some of which are unique to the region. Delta water irrigates local farms where much of the nation’s domestic fresh produce is grown. Finally, freshwater originating in the Sierra Nevada flows through the Delta, providing water supplies for 25 million Californians
DRAFT
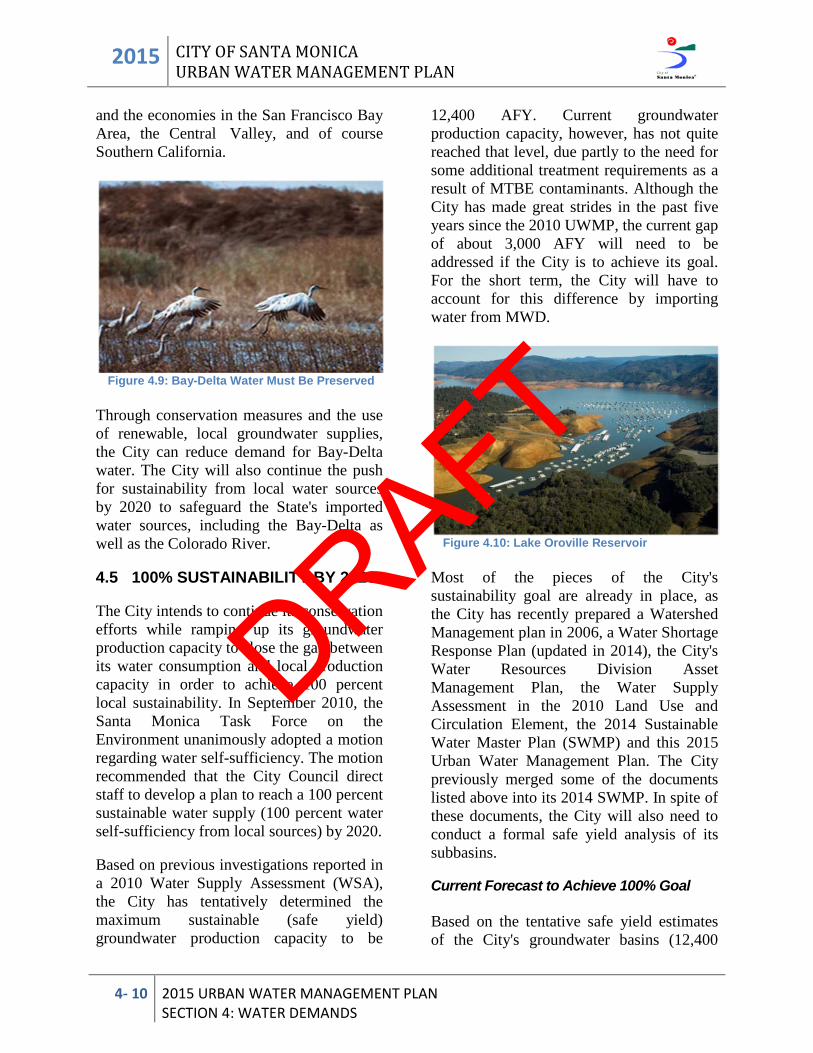
2015 CITY OF SANTA MONICA URBAN WATER MANAGEMENT PLAN
4- 10 2015 URBAN WATER MANAGEMENT PLAN SECTION 4: WATER DEMANDS
and the economies in the San Francisco Bay Area, the Central Valley, and of course Southern California.
Figure 4.9: Bay-Delta Water Must Be Preserved Through conservation measures and the use of renewable, local groundwater supplies, the City can reduce demand for Bay-Delta water. The City will also continue the push for sustainability from local water sources by 2020 to safeguard the State's imported water sources, including the Bay-Delta as well as the Colorado River. 4.5 100% SUSTAINABILITY BY 2020 The City intends to continue its conservation efforts while ramping up its groundwater production capacity to close the gap between its water consumption and local production capacity in order to achieve 100 percent local sustainability. In September 2010, the Santa Monica Task Force on the Environment unanimously adopted a motion regarding water self-sufficiency. The motion recommended that the City Council direct staff to develop a plan to reach a 100 percent sustainable water supply (100 percent water self-sufficiency from local sources) by 2020. Based on previous investigations reported in a 2010 Water Supply Assessment (WSA), the City has tentatively determined the maximum sustainable (safe yield) groundwater production capacity to be
12,400 AFY. Current groundwater production capacity, however, has not quite reached that level, due partly to the need for some additional treatment requirements as a result of MTBE contaminants. Although the City has made great strides in the past five years since the 2010 UWMP, the current gap of about 3,000 AFY will need to be addressed if the City is to achieve its goal. For the short term, the City will have to account for this difference by importing water from MWD.
Figure 4.10: Lake Oroville Reservoir Most of the pieces of the City's sustainability goal are already in place, as the City has recently prepared a Watershed Management plan in 2006, a Water Shortage Response Plan (updated in 2014), the City's Water Resources Division Asset Management Plan, the Water Supply Assessment in the 2010 Land Use and Circulation Element, the 2014 Sustainable Water Master Plan (SWMP) and this 2015 Urban Water Management Plan. The City previously merged some of the documents listed above into its 2014 SWMP. In spite of these documents, the City will also need to conduct a formal safe yield analysis of its subbasins. Current Forecast to Achieve 100% Goal Based on the tentative safe yield estimates of the City's groundwater basins (12,400
DRAFT
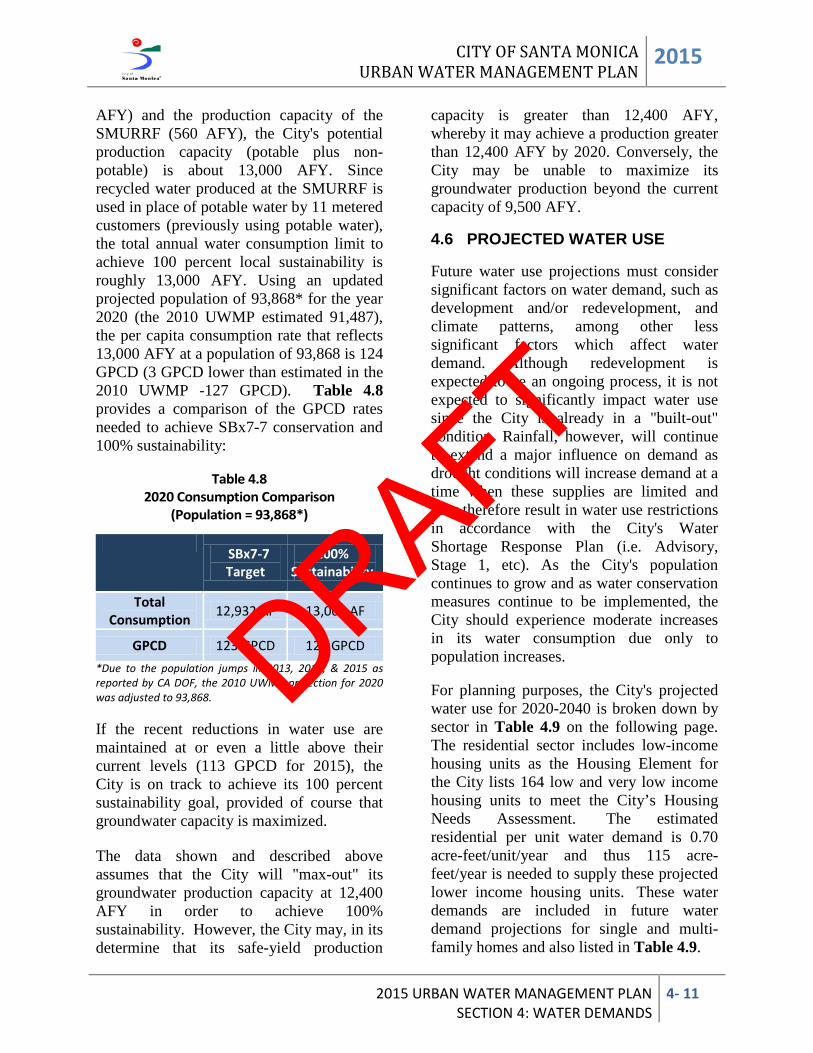
CITY OF SANTA MONICA URBAN WATER MANAGEMENT PLAN 2015
2015 URBAN WATER MANAGEMENT PLAN SECTION 4: WATER DEMANDS
4- 11
AFY) and the production capacity of the SMURRF (560 AFY), the City's potential production capacity (potable plus non-potable) is about 13,000 AFY. Since recycled water produced at the SMURRF is used in place of potable water by 11 metered customers (previously using potable water), the total annual water consumption limit to achieve 100 percent local sustainability is roughly 13,000 AFY. Using an updated projected population of 93,868* for the year 2020 (the 2010 UWMP estimated 91,487), the per capita consumption rate that reflects 13,000 AFY at a population of 93,868 is 124 GPCD (3 GPCD lower than estimated in the 2010 UWMP -127 GPCD). Table 4.8 provides a comparison of the GPCD rates needed to achieve SBx7-7 conservation and 100% sustainability:
Table 4.8 2020 Consumption Comparison
(Population = 93,868*)
SBx7-7 Target
100% Sustainability
Total Consumption 12,932 AF 13,000 AF
GPCD 123 GPCD 124 GPCD *Due to the population jumps in 2013, 2014, & 2015 as reported by CA DOF, the 2010 UWMP projection for 2020 was adjusted to 93,868. If the recent reductions in water use are maintained at or even a little above their current levels (113 GPCD for 2015), the City is on track to achieve its 100 percent sustainability goal, provided of course that groundwater capacity is maximized. The data shown and described above assumes that the City will "max-out" its groundwater production capacity at 12,400 AFY in order to achieve 100% sustainability. However, the City may, in its determine that its safe-yield production
capacity is greater than 12,400 AFY, whereby it may achieve a production greater than 12,400 AFY by 2020. Conversely, the City may be unable to maximize its groundwater production beyond the current capacity of 9,500 AFY. 4.6 PROJECTED WATER USE Future water use projections must consider significant factors on water demand, such as development and/or redevelopment, and climate patterns, among other less significant factors which affect water demand. Although redevelopment is expected to be an ongoing process, it is not expected to significantly impact water use since the City is already in a "built-out" condition. Rainfall, however, will continue to extend a major influence on demand as drought conditions will increase demand at a time when these supplies are limited and may therefore result in water use restrictions in accordance with the City's Water Shortage Response Plan (i.e. Advisory, Stage 1, etc). As the City's population continues to grow and as water conservation measures continue to be implemented, the City should experience moderate increases in its water consumption due only to population increases. For planning purposes, the City's projected water use for 2020-2040 is broken down by sector in Table 4.9 on the following page. The residential sector includes low-income housing units as the Housing Element for the City lists 164 low and very low income housing units to meet the City’s Housing Needs Assessment. The estimated residential per unit water demand is 0.70 acre-feet/unit/year and thus 115 acre-feet/year is needed to supply these projected lower income housing units. These water demands are included in future water demand projections for single and multi-family homes and also listed in Table 4.9.
DRAFT
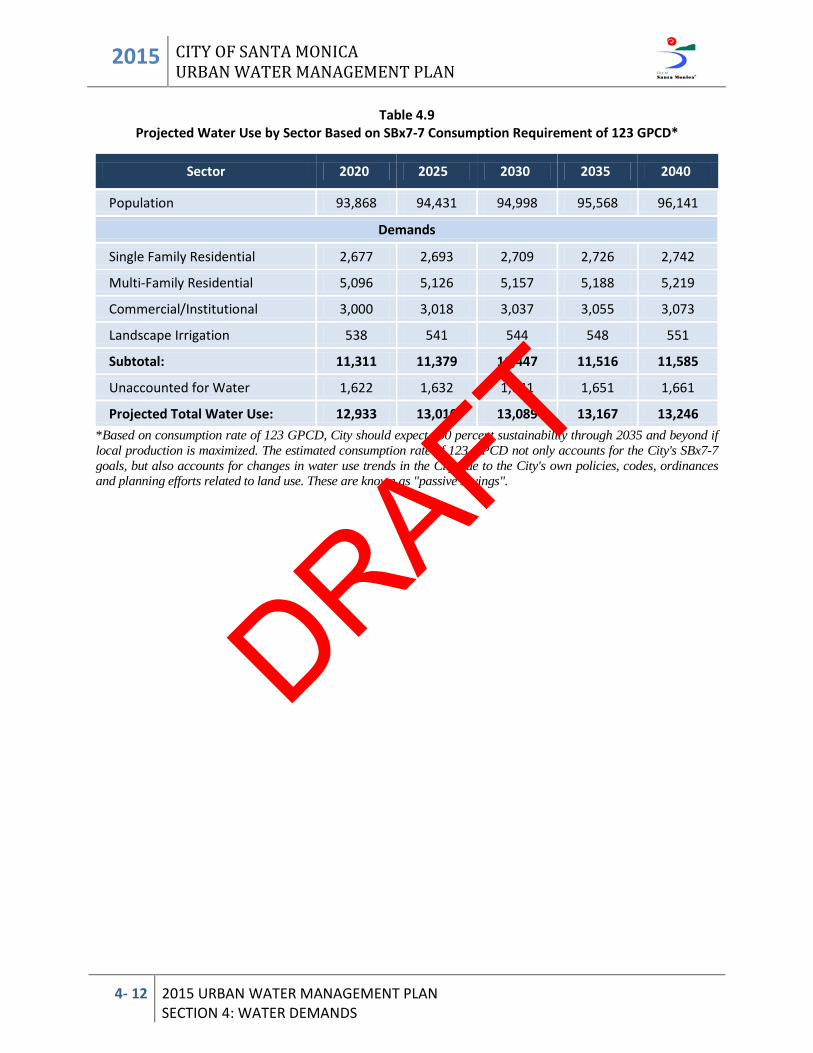
2015 CITY OF SANTA MONICA URBAN WATER MANAGEMENT PLAN
4- 12 2015 URBAN WATER MANAGEMENT PLAN SECTION 4: WATER DEMANDS
Table 4.9 Projected Water Use by Sector Based on SBx7-7 Consumption Requirement of 123 GPCD*
Sector 2020 2025 2030 2035 2040
Population 93,868 94,431 94,998 95,568 96,141
Demands
Single Family Residential 2,677 2,693 2,709 2,726 2,742
Multi-Family Residential 5,096 5,126 5,157 5,188 5,219
Commercial/Institutional 3,000 3,018 3,037 3,055 3,073
Landscape Irrigation 538 541 544 548 551
Subtotal: 11,311 11,379 11,447 11,516 11,585
Unaccounted for Water 1,622 1,632 1,641 1,651 1,661
Projected Total Water Use: 12,933 13,010 13,089 13,167 13,246 *Based on consumption rate of 123 GPCD, City should expect 100 percent sustainability through 2035 and beyond if local production is maximized. The estimated consumption rate of 123 GPCD not only accounts for the City's SBx7-7 goals, but also accounts for changes in water use trends in the City due to the City's own policies, codes, ordinances and planning efforts related to land use. These are known as "passive savings". .
DRAFT
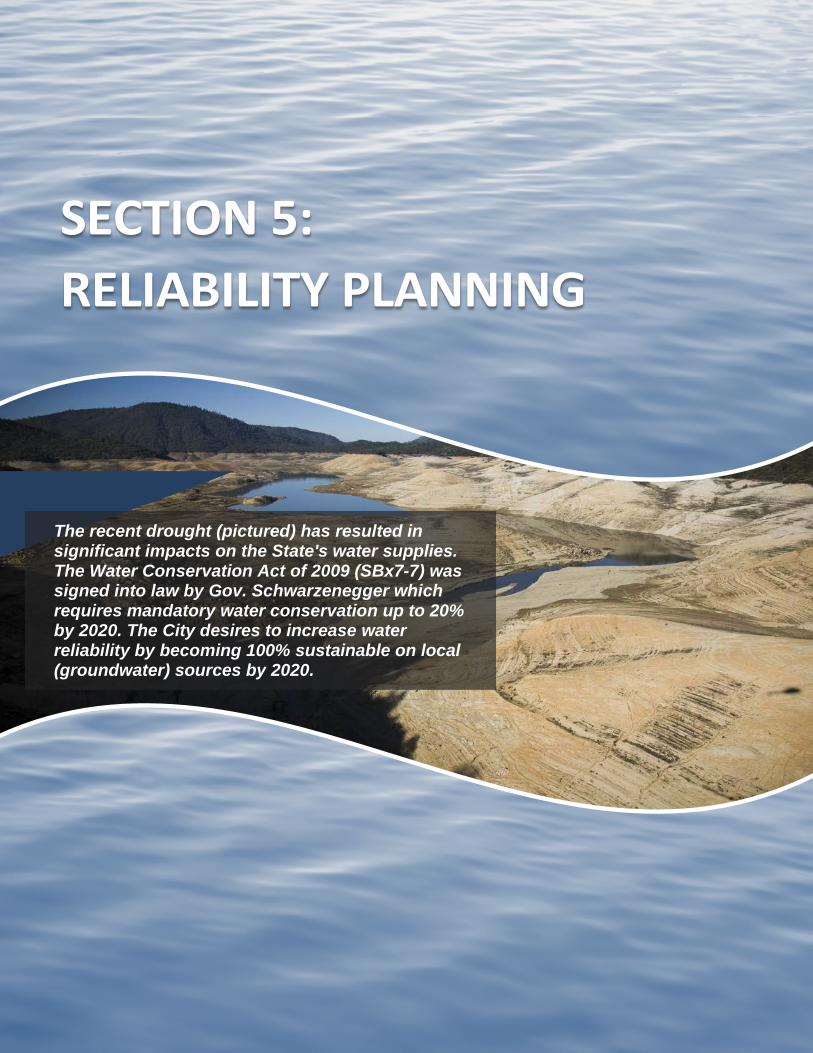
The recent drought (pictured) has resulted in significant impacts on the State's water supplies. The Water Conservation Act of 2009 (SBx7-7) was signed into law by Gov. Schwarzenegger which requires mandatory water conservation up to 20% by 2020. The City desires to increase water reliability by becoming 100% sustainable on local (groundwater) sources by 2020.
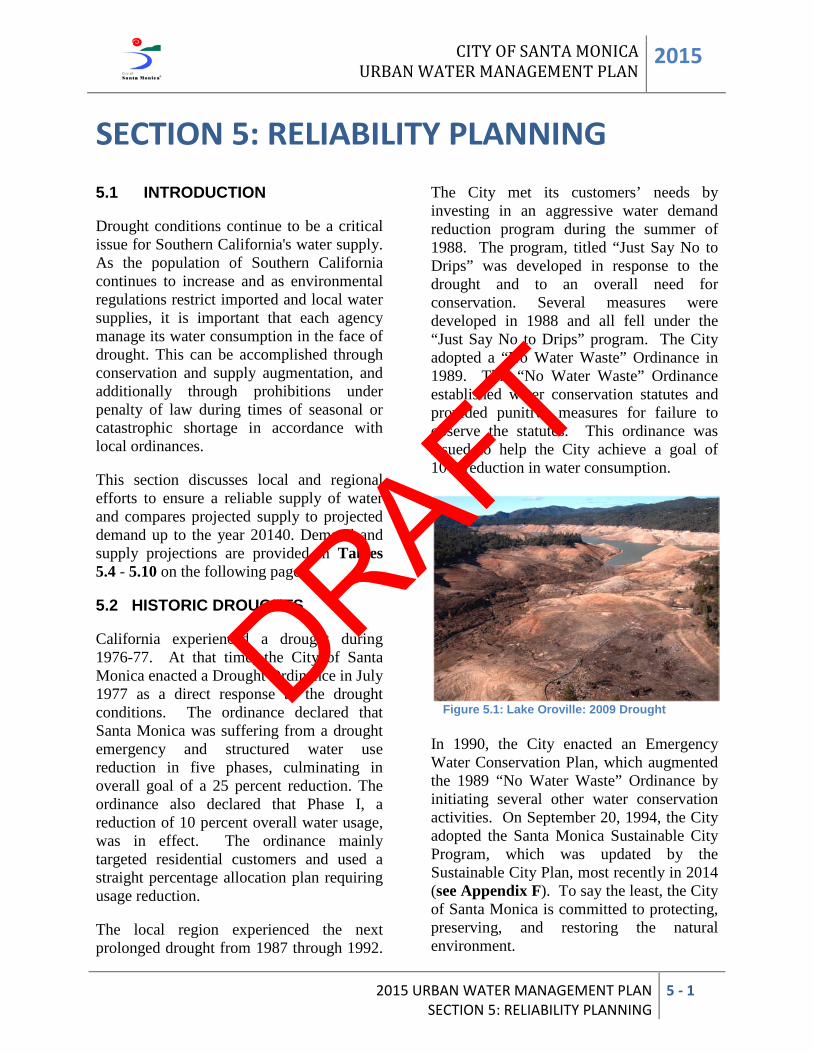
CITY OF SANTA MONICA URBAN WATER MANAGEMENT PLAN 2015
2015 URBAN WATER MANAGEMENT PLAN SECTION 5: RELIABILITY PLANNING
5 - 1
SECTION 5: RELIABILITY PLANNING 5.1 INTRODUCTION Drought conditions continue to be a critical issue for Southern California's water supply. As the population of Southern California continues to increase and as environmental regulations restrict imported and local water supplies, it is important that each agency manage its water consumption in the face of drought. This can be accomplished through conservation and supply augmentation, and additionally through prohibitions under penalty of law during times of seasonal or catastrophic shortage in accordance with local ordinances. This section discusses local and regional efforts to ensure a reliable supply of water and compares projected supply to projected demand up to the year 20140. Demand and supply projections are provided in Tables 5.4 - 5.10 on the following pages. 5.2 HISTORIC DROUGHTS California experienced a drought during 1976-77. At that time, the City of Santa Monica enacted a Drought Ordinance in July 1977 as a direct response to the drought conditions. The ordinance declared that Santa Monica was suffering from a drought emergency and structured water use reduction in five phases, culminating in overall goal of a 25 percent reduction. The ordinance also declared that Phase I, a reduction of 10 percent overall water usage, was in effect. The ordinance mainly targeted residential customers and used a straight percentage allocation plan requiring usage reduction. The local region experienced the next prolonged drought from 1987 through 1992.
The City met its customers’ needs by investing in an aggressive water demand reduction program during the summer of 1988. The program, titled “Just Say No to Drips” was developed in response to the drought and to an overall need for conservation. Several measures were developed in 1988 and all fell under the “Just Say No to Drips” program. The City adopted a “No Water Waste” Ordinance in 1989. This “No Water Waste” Ordinance established water conservation statutes and provided punitive measures for failure to observe the statutes. This ordinance was issued to help the City achieve a goal of 10% reduction in water consumption.
Figure 5.1: Lake Oroville: 2009 Drought In 1990, the City enacted an Emergency Water Conservation Plan, which augmented the 1989 “No Water Waste” Ordinance by initiating several other water conservation activities. On September 20, 1994, the City adopted the Santa Monica Sustainable City Program, which was updated by the Sustainable City Plan, most recently in 2014 (see Appendix F). To say the least, the City of Santa Monica is committed to protecting, preserving, and restoring the natural environment.
DRAFT
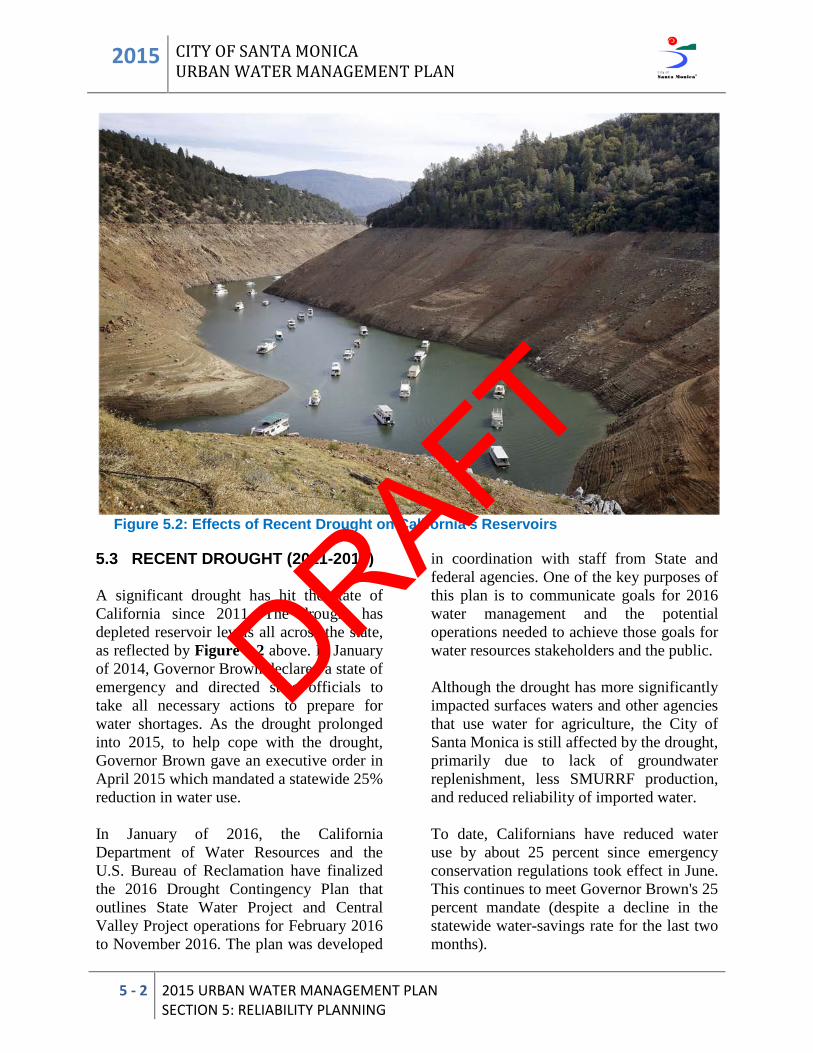
2015 CITY OF SANTA MONICA URBAN WATER MANAGEMENT PLAN
5 - 2 2015 URBAN WATER MANAGEMENT PLAN SECTION 5: RELIABILITY PLANNING
Figure 5.2: Effects of Recent Drought on California's Reservoirs 5.3 RECENT DROUGHT (2011-2015) A significant drought has hit the state of California since 2011. The drought has depleted reservoir levels all across the state, as reflected by Figure 5.2 above. In January of 2014, Governor Brown declared a state of emergency and directed state officials to take all necessary actions to prepare for water shortages. As the drought prolonged into 2015, to help cope with the drought, Governor Brown gave an executive order in April 2015 which mandated a statewide 25% reduction in water use. In January of 2016, the California Department of Water Resources and the U.S. Bureau of Reclamation have finalized the 2016 Drought Contingency Plan that outlines State Water Project and Central Valley Project operations for February 2016 to November 2016. The plan was developed
in coordination with staff from State and federal agencies. One of the key purposes of this plan is to communicate goals for 2016 water management and the potential operations needed to achieve those goals for water resources stakeholders and the public. Although the drought has more significantly impacted surfaces waters and other agencies that use water for agriculture, the City of Santa Monica is still affected by the drought, primarily due to lack of groundwater replenishment, less SMURRF production, and reduced reliability of imported water. To date, Californians have reduced water use by about 25 percent since emergency conservation regulations took effect in June. This continues to meet Governor Brown's 25 percent mandate (despite a decline in the statewide water-savings rate for the last two months).
DRAFT
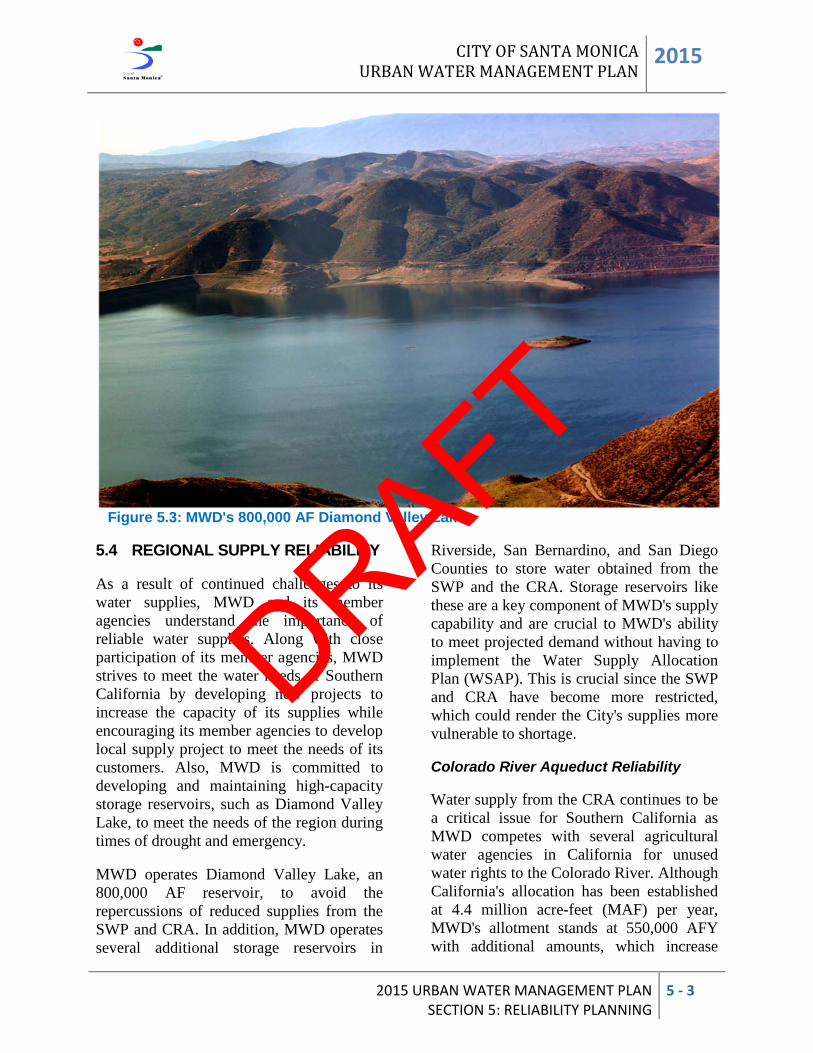
CITY OF SANTA MONICA URBAN WATER MANAGEMENT PLAN 2015
2015 URBAN WATER MANAGEMENT PLAN SECTION 5: RELIABILITY PLANNING
5 - 3
Figure 5.3: MWD's 800,000 AF Diamond Valley Lake
5.4 REGIONAL SUPPLY RELIABILITY As a result of continued challenges to its water supplies, MWD and its member agencies understand the importance of reliable water supplies. Along with close participation of its member agencies, MWD strives to meet the water needs of Southern California by developing new projects to increase the capacity of its supplies while encouraging its member agencies to develop local supply project to meet the needs of its customers. Also, MWD is committed to developing and maintaining high-capacity storage reservoirs, such as Diamond Valley Lake, to meet the needs of the region during times of drought and emergency. MWD operates Diamond Valley Lake, an 800,000 AF reservoir, to avoid the repercussions of reduced supplies from the SWP and CRA. In addition, MWD operates several additional storage reservoirs in
Riverside, San Bernardino, and San Diego Counties to store water obtained from the SWP and the CRA. Storage reservoirs like these are a key component of MWD's supply capability and are crucial to MWD's ability to meet projected demand without having to implement the Water Supply Allocation Plan (WSAP). This is crucial since the SWP and CRA have become more restricted, which could render the City's supplies more vulnerable to shortage. Colorado River Aqueduct Reliability Water supply from the CRA continues to be a critical issue for Southern California as MWD competes with several agricultural water agencies in California for unused water rights to the Colorado River. Although California's allocation has been established at 4.4 million acre-feet (MAF) per year, MWD's allotment stands at 550,000 AFY with additional amounts, which increase
DRAFT
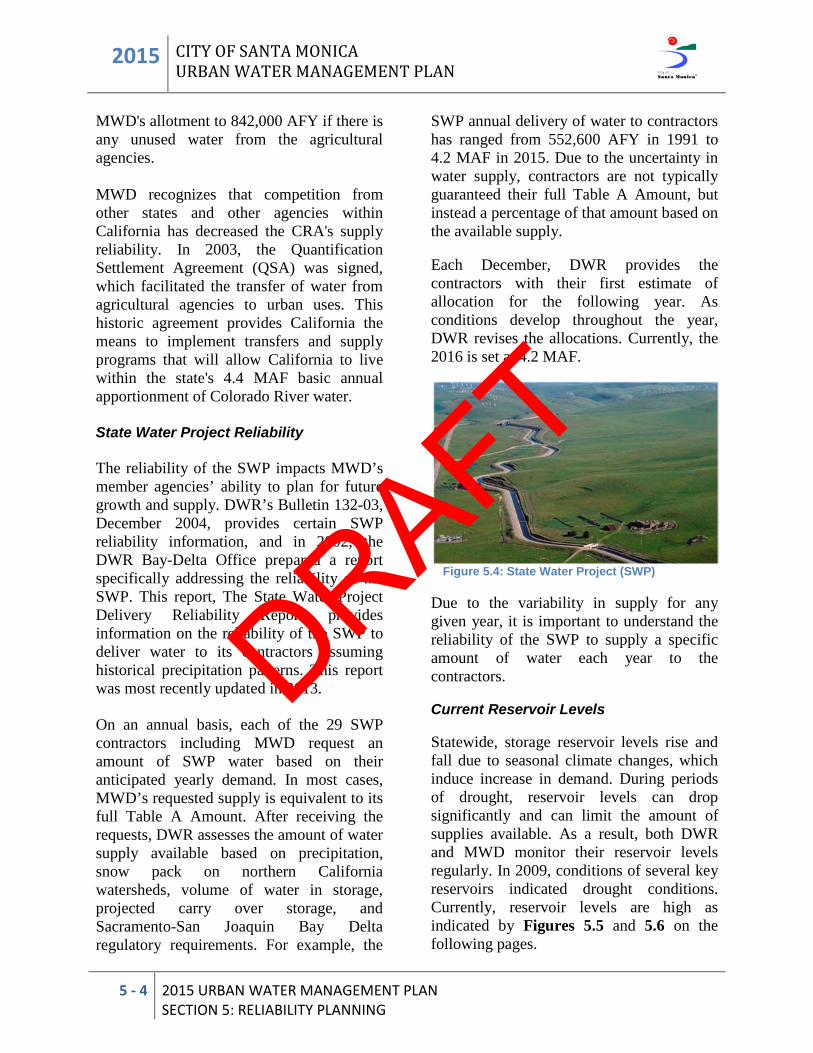
2015 CITY OF SANTA MONICA URBAN WATER MANAGEMENT PLAN
5 - 4 2015 URBAN WATER MANAGEMENT PLAN SECTION 5: RELIABILITY PLANNING
MWD's allotment to 842,000 AFY if there is any unused water from the agricultural agencies. MWD recognizes that competition from other states and other agencies within California has decreased the CRA's supply reliability. In 2003, the Quantification Settlement Agreement (QSA) was signed, which facilitated the transfer of water from agricultural agencies to urban uses. This historic agreement provides California the means to implement transfers and supply programs that will allow California to live within the state's 4.4 MAF basic annual apportionment of Colorado River water. State Water Project Reliability The reliability of the SWP impacts MWD’s member agencies’ ability to plan for future growth and supply. DWR’s Bulletin 132-03, December 2004, provides certain SWP reliability information, and in 2002, the DWR Bay-Delta Office prepared a report specifically addressing the reliability of the SWP. This report, The State Water Project Delivery Reliability Report, provides information on the reliability of the SWP to deliver water to its contractors assuming historical precipitation patterns. This report was most recently updated in 2013. On an annual basis, each of the 29 SWP contractors including MWD request an amount of SWP water based on their anticipated yearly demand. In most cases, MWD’s requested supply is equivalent to its full Table A Amount. After receiving the requests, DWR assesses the amount of water supply available based on precipitation, snow pack on northern California watersheds, volume of water in storage, projected carry over storage, and Sacramento-San Joaquin Bay Delta regulatory requirements. For example, the
SWP annual delivery of water to contractors has ranged from 552,600 AFY in 1991 to 4.2 MAF in 2015. Due to the uncertainty in water supply, contractors are not typically guaranteed their full Table A Amount, but instead a percentage of that amount based on the available supply. Each December, DWR provides the contractors with their first estimate of allocation for the following year. As conditions develop throughout the year, DWR revises the allocations. Currently, the 2016 is set at 4.2 MAF.
Figure 5.4: State Water Project (SWP) Due to the variability in supply for any given year, it is important to understand the reliability of the SWP to supply a specific amount of water each year to the contractors. Current Reservoir Levels Statewide, storage reservoir levels rise and fall due to seasonal climate changes, which induce increase in demand. During periods of drought, reservoir levels can drop significantly and can limit the amount of supplies available. As a result, both DWR and MWD monitor their reservoir levels regularly. In 2009, conditions of several key reservoirs indicated drought conditions. Currently, reservoir levels are high as indicated by Figures 5.5 and 5.6 on the following pages.
DRAFT
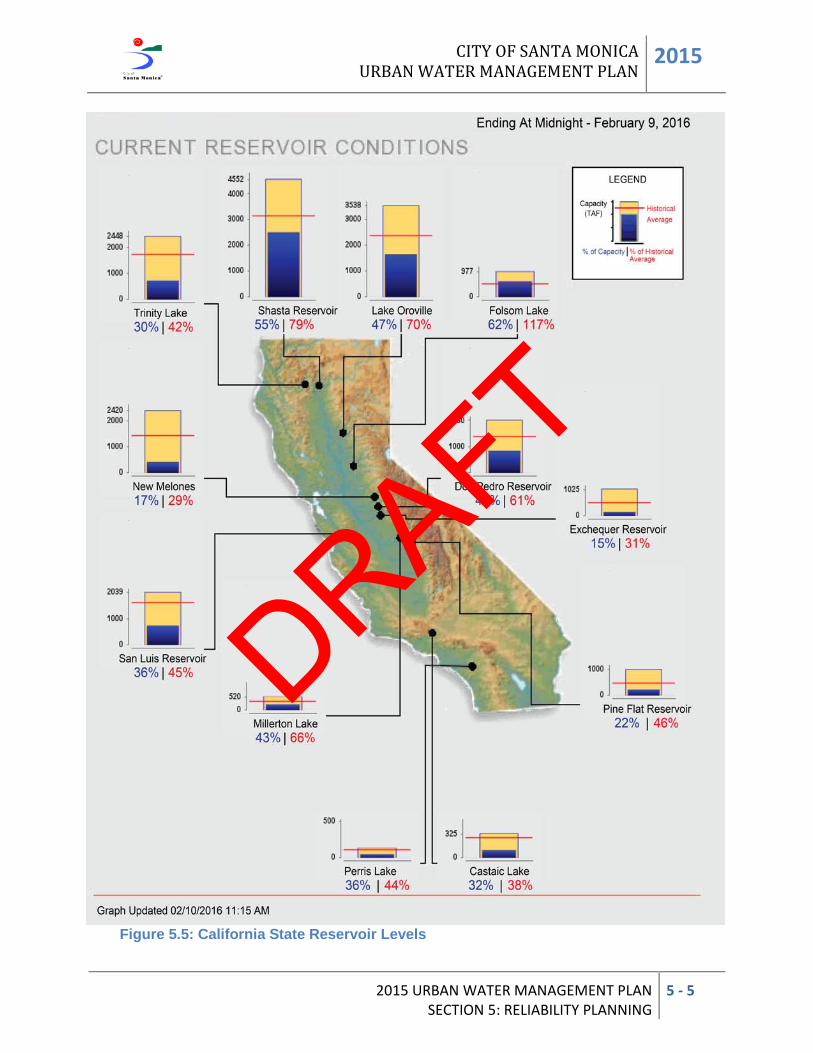
CITY OF SANTA MONICA URBAN WATER MANAGEMENT PLAN 2015
2015 URBAN WATER MANAGEMENT PLAN SECTION 5: RELIABILITY PLANNING
5 - 5
Figure 5.5: California State Reservoir Levels
DRAFT
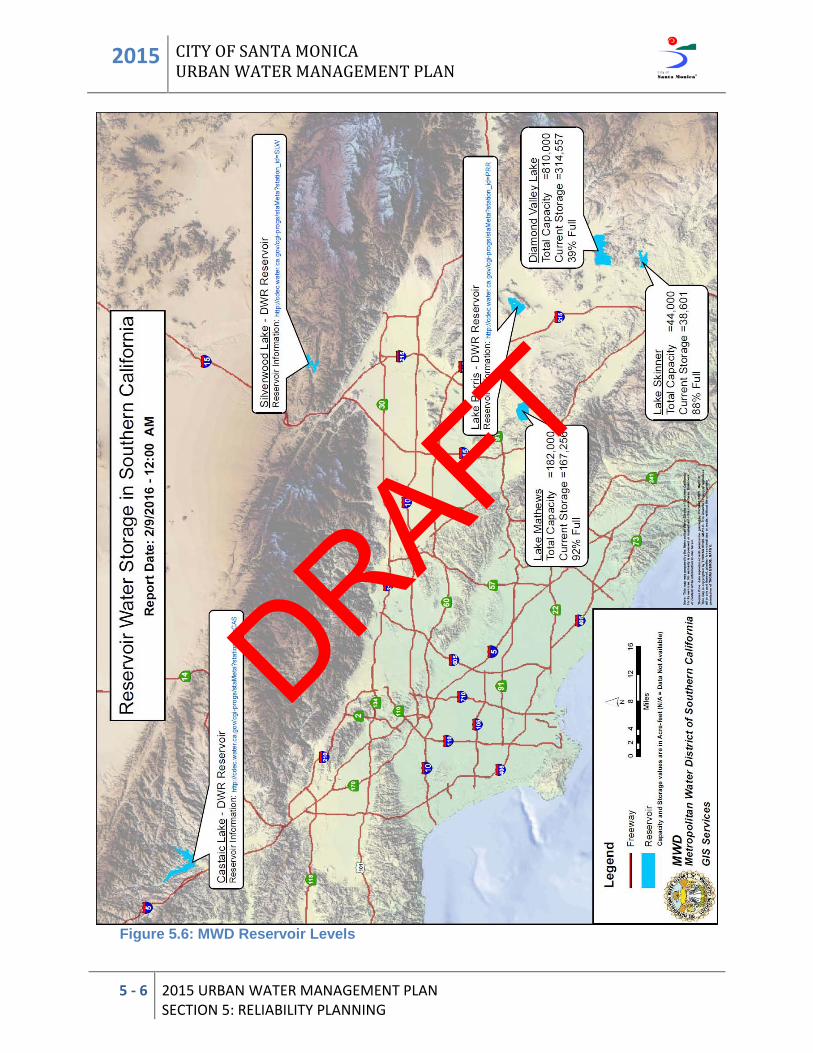
2015 CITY OF SANTA MONICA URBAN WATER MANAGEMENT PLAN
5 - 6 2015 URBAN WATER MANAGEMENT PLAN SECTION 5: RELIABILITY PLANNING
Figure 5.6: MWD Reservoir Levels
DRAFT
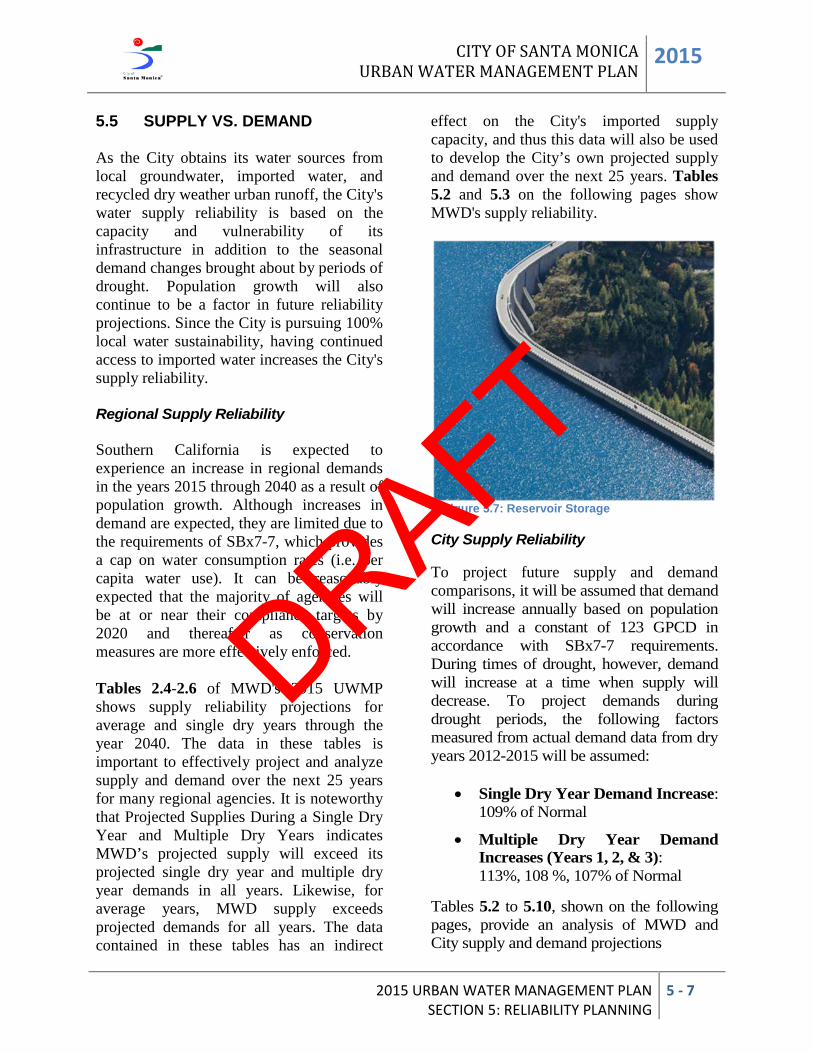
CITY OF SANTA MONICA URBAN WATER MANAGEMENT PLAN 2015
2015 URBAN WATER MANAGEMENT PLAN SECTION 5: RELIABILITY PLANNING
5 - 7
5.5 SUPPLY VS. DEMAND As the City obtains its water sources from local groundwater, imported water, and recycled dry weather urban runoff, the City's water supply reliability is based on the capacity and vulnerability of its infrastructure in addition to the seasonal demand changes brought about by periods of drought. Population growth will also continue to be a factor in future reliability projections. Since the City is pursuing 100% local water sustainability, having continued access to imported water increases the City's supply reliability. Regional Supply Reliability Southern California is expected to experience an increase in regional demands in the years 2015 through 2040 as a result of population growth. Although increases in demand are expected, they are limited due to the requirements of SBx7-7, which provides a cap on water consumption rates (i.e. per capita water use). It can be reasonably expected that the majority of agencies will be at or near their compliance targets by 2020 and thereafter as conservation measures are more effectively enforced. Tables 2.4-2.6 of MWD's 2015 UWMP shows supply reliability projections for average and single dry years through the year 2040. The data in these tables is important to effectively project and analyze supply and demand over the next 25 years for many regional agencies. It is noteworthy that Projected Supplies During a Single Dry Year and Multiple Dry Years indicates MWD’s projected supply will exceed its projected single dry year and multiple dry year demands in all years. Likewise, for average years, MWD supply exceeds projected demands for all years. The data contained in these tables has an indirect
effect on the City's imported supply capacity, and thus this data will also be used to develop the City’s own projected supply and demand over the next 25 years. Tables 5.2 and 5.3 on the following pages show MWD's supply reliability.
Figure 5.7: Reservoir Storage
City Supply Reliability To project future supply and demand comparisons, it will be assumed that demand will increase annually based on population growth and a constant of 123 GPCD in accordance with SBx7-7 requirements. During times of drought, however, demand will increase at a time when supply will decrease. To project demands during drought periods, the following factors measured from actual demand data from dry years 2012-2015 will be assumed:
• Single Dry Year Demand Increase: 109% of Normal
• Multiple Dry Year Demand Increases (Years 1, 2, & 3):
113%, 108 %, 107% of Normal Tables 5.2 to 5.10, shown on the following pages, provide an analysis of MWD and City supply and demand projections
DRAFT
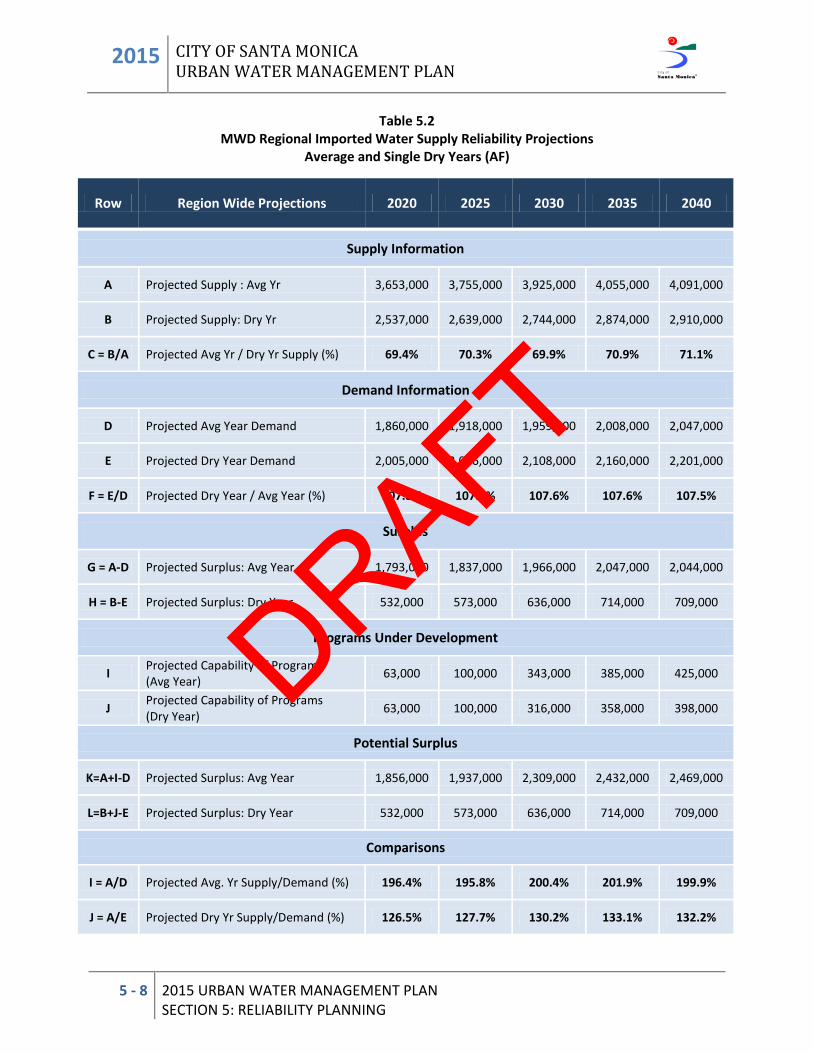
2015 CITY OF SANTA MONICA URBAN WATER MANAGEMENT PLAN
5 - 8 2015 URBAN WATER MANAGEMENT PLAN SECTION 5: RELIABILITY PLANNING
Table 5.2 MWD Regional Imported Water Supply Reliability Projections
Average and Single Dry Years (AF)
Row Region Wide Projections 2020 2025 2030 2035 2040
Supply Information
A Projected Supply : Avg Yr 3,653,000 3,755,000 3,925,000 4,055,000 4,091,000
B Projected Supply: Dry Yr 2,537,000 2,639,000 2,744,000 2,874,000 2,910,000
C = B/A Projected Avg Yr / Dry Yr Supply (%) 69.4% 70.3% 69.9% 70.9% 71.1%
Demand Information
D Projected Avg Year Demand 1,860,000 1,918,000 1,959,000 2,008,000 2,047,000
E Projected Dry Year Demand 2,005,000 2,066,000 2,108,000 2,160,000 2,201,000
F = E/D Projected Dry Year / Avg Year (%) 107.8% 107.7% 107.6% 107.6% 107.5%
Surplus
G = A-D Projected Surplus: Avg Year 1,793,000 1,837,000 1,966,000 2,047,000 2,044,000
H = B-E Projected Surplus: Dry Year 532,000 573,000 636,000 714,000 709,000
Programs Under Development
I Projected Capability of Programs (Avg Year) 63,000 100,000 343,000 385,000 425,000
J Projected Capability of Programs (Dry Year) 63,000 100,000 316,000 358,000 398,000
Potential Surplus
K=A+I-D Projected Surplus: Avg Year 1,856,000 1,937,000 2,309,000 2,432,000 2,469,000
L=B+J-E Projected Surplus: Dry Year 532,000 573,000 636,000 714,000 709,000
Comparisons
I = A/D Projected Avg. Yr Supply/Demand (%) 196.4% 195.8% 200.4% 201.9% 199.9%
J = A/E Projected Dry Yr Supply/Demand (%) 126.5% 127.7% 130.2% 133.1% 132.2%
DRAFT
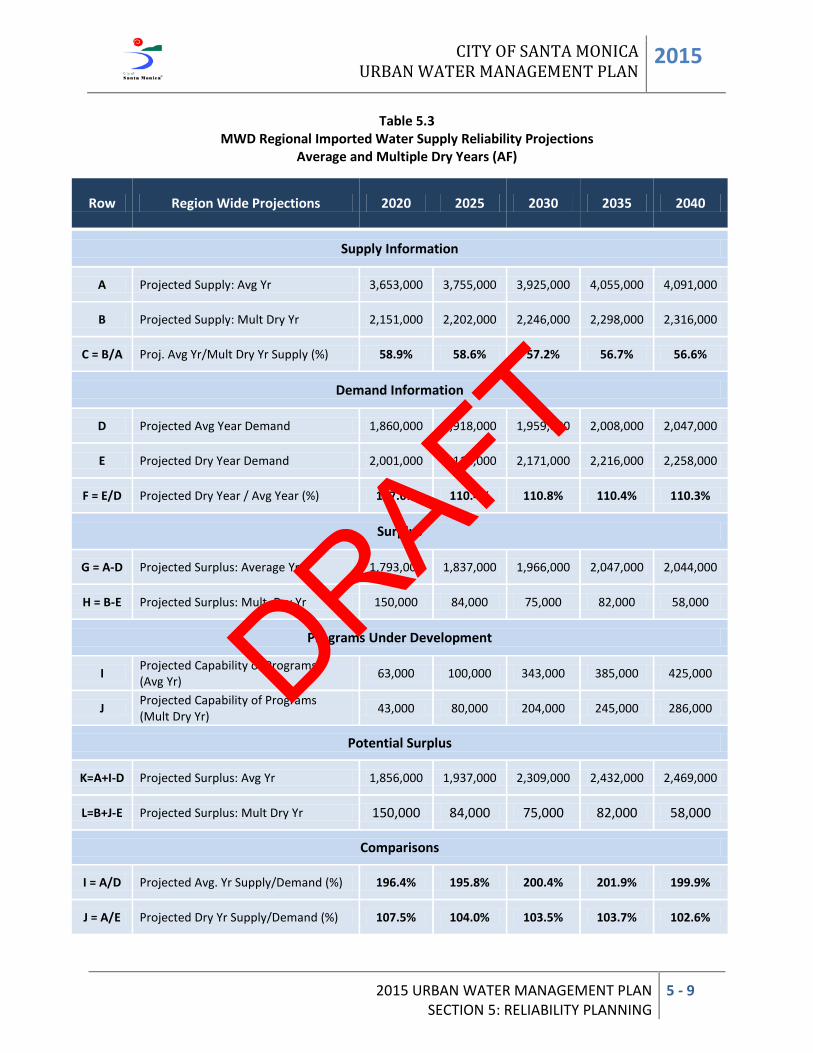
CITY OF SANTA MONICA URBAN WATER MANAGEMENT PLAN 2015
2015 URBAN WATER MANAGEMENT PLAN SECTION 5: RELIABILITY PLANNING
5 - 9
Table 5.3 MWD Regional Imported Water Supply Reliability Projections
Average and Multiple Dry Years (AF)
Row Region Wide Projections 2020 2025 2030 2035 2040
Supply Information
A Projected Supply: Avg Yr 3,653,000 3,755,000 3,925,000 4,055,000 4,091,000
B Projected Supply: Mult Dry Yr 2,151,000 2,202,000 2,246,000 2,298,000 2,316,000
C = B/A Proj. Avg Yr/Mult Dry Yr Supply (%) 58.9% 58.6% 57.2% 56.7% 56.6%
Demand Information
D Projected Avg Year Demand 1,860,000 1,918,000 1,959,000 2,008,000 2,047,000
E Projected Dry Year Demand 2,001,000 2,118,000 2,171,000 2,216,000 2,258,000
F = E/D Projected Dry Year / Avg Year (%) 107.6% 110.4% 110.8% 110.4% 110.3%
Surplus
G = A-D Projected Surplus: Average Yr 1,793,000 1,837,000 1,966,000 2,047,000 2,044,000
H = B-E Projected Surplus: Mult. Dry Yr 150,000 84,000 75,000 82,000 58,000
Programs Under Development
I Projected Capability of Programs (Avg Yr) 63,000 100,000 343,000 385,000 425,000
J Projected Capability of Programs (Mult Dry Yr) 43,000 80,000 204,000 245,000 286,000
Potential Surplus
K=A+I-D Projected Surplus: Avg Yr 1,856,000 1,937,000 2,309,000 2,432,000 2,469,000
L=B+J-E Projected Surplus: Mult Dry Yr 150,000 84,000 75,000 82,000 58,000
Comparisons
I = A/D Projected Avg. Yr Supply/Demand (%) 196.4% 195.8% 200.4% 201.9% 199.9%
J = A/E Projected Dry Yr Supply/Demand (%) 107.5% 104.0% 103.5% 103.7% 102.6%
DRAFT
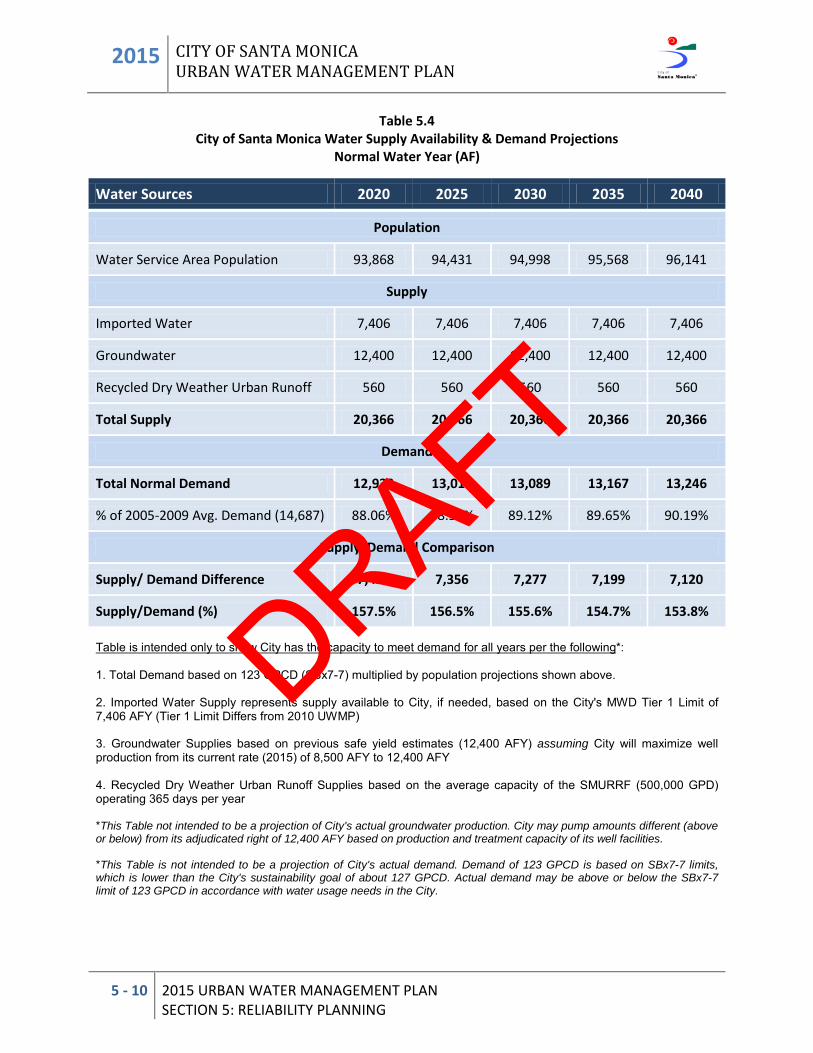
2015 CITY OF SANTA MONICA URBAN WATER MANAGEMENT PLAN
5 - 10 2015 URBAN WATER MANAGEMENT PLAN SECTION 5: RELIABILITY PLANNING
Table 5.4 City of Santa Monica Water Supply Availability & Demand Projections
Normal Water Year (AF)
Water Sources 2020 2025 2030 2035 2040
Population
Water Service Area Population 93,868 94,431 94,998 95,568 96,141
Supply
Imported Water 7,406 7,406 7,406 7,406 7,406
Groundwater 12,400 12,400 12,400 12,400 12,400
Recycled Dry Weather Urban Runoff 560 560 560 560 560
Total Supply 20,366 20,366 20,366 20,366 20,366
Demand
Total Normal Demand 12,933 13,010 13,089 13,167 13,246
% of 2005-2009 Avg. Demand (14,687) 88.06% 88.59% 89.12% 89.65% 90.19%
Supply/Demand Comparison
Supply/ Demand Difference 7,433 7,356 7,277 7,199 7,120
Supply/Demand (%) 157.5% 156.5% 155.6% 154.7% 153.8% Table is intended only to show City has the capacity to meet demand for all years per the following*: 1. Total Demand based on 123 GPCD (SBx7-7) multiplied by population projections shown above. 2. Imported Water Supply represents supply available to City, if needed, based on the City's MWD Tier 1 Limit of 7,406 AFY (Tier 1 Limit Differs from 2010 UWMP) 3. Groundwater Supplies based on previous safe yield estimates (12,400 AFY) assuming City will maximize well production from its current rate (2015) of 8,500 AFY to 12,400 AFY 4. Recycled Dry Weather Urban Runoff Supplies based on the average capacity of the SMURRF (500,000 GPD) operating 365 days per year *This Table not intended to be a projection of City's actual groundwater production. City may pump amounts different (above or below) from its adjudicated right of 12,400 AFY based on production and treatment capacity of its well facilities. *This Table is not intended to be a projection of City's actual demand. Demand of 123 GPCD is based on SBx7-7 limits, which is lower than the City's sustainability goal of about 127 GPCD. Actual demand may be above or below the SBx7-7 limit of 123 GPCD in accordance with water usage needs in the City.
DRAFT
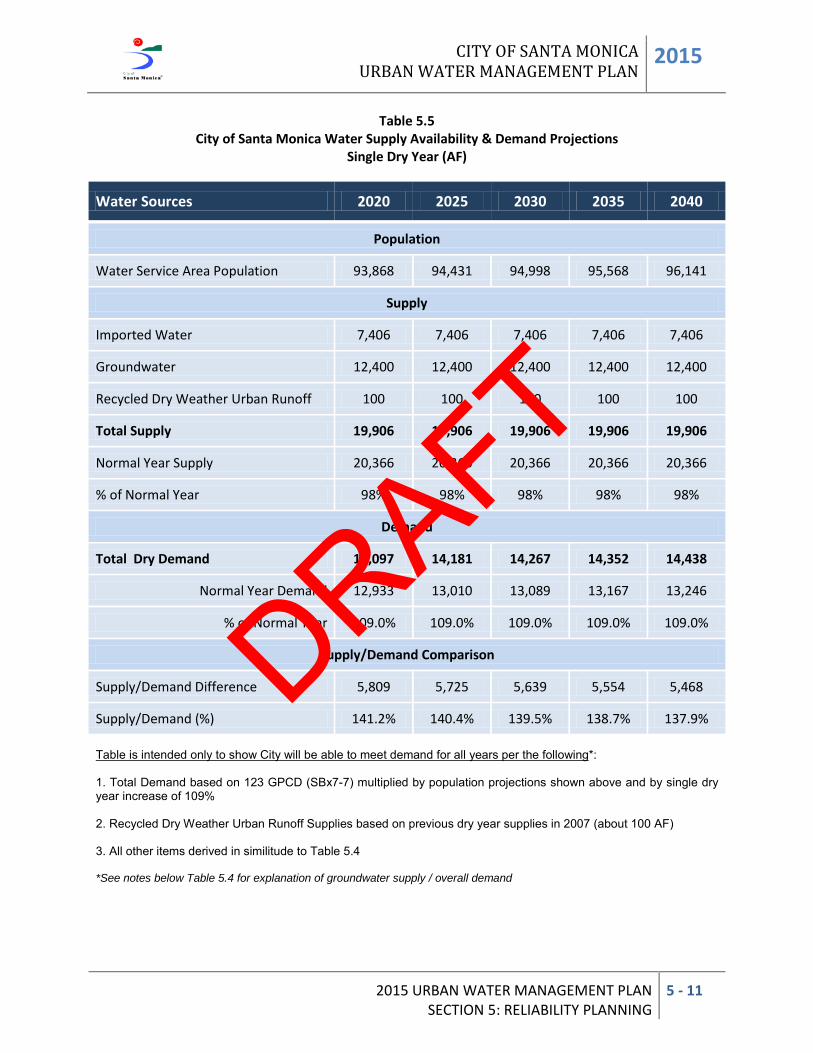
CITY OF SANTA MONICA URBAN WATER MANAGEMENT PLAN 2015
2015 URBAN WATER MANAGEMENT PLAN SECTION 5: RELIABILITY PLANNING
5 - 11
Table 5.5 City of Santa Monica Water Supply Availability & Demand Projections
Single Dry Year (AF)
Water Sources 2020 2025 2030 2035 2040
Population
Water Service Area Population 93,868 94,431 94,998 95,568 96,141
Supply
Imported Water 7,406 7,406 7,406 7,406 7,406
Groundwater 12,400 12,400 12,400 12,400 12,400
Recycled Dry Weather Urban Runoff 100 100 100 100 100
Total Supply 19,906 19,906 19,906 19,906 19,906
Normal Year Supply 20,366 20,366 20,366 20,366 20,366
% of Normal Year 98% 98% 98% 98% 98%
Demand
Total Dry Demand 14,097 14,181 14,267 14,352 14,438
Normal Year Demand 12,933 13,010 13,089 13,167 13,246
% of Normal Year 109.0% 109.0% 109.0% 109.0% 109.0%
Supply/Demand Comparison
Supply/Demand Difference 5,809 5,725 5,639 5,554 5,468
Supply/Demand (%) 141.2% 140.4% 139.5% 138.7% 137.9% Table is intended only to show City will be able to meet demand for all years per the following*: 1. Total Demand based on 123 GPCD (SBx7-7) multiplied by population projections shown above and by single dry year increase of 109% 2. Recycled Dry Weather Urban Runoff Supplies based on previous dry year supplies in 2007 (about 100 AF) 3. All other items derived in similitude to Table 5.4 *See notes below Table 5.4 for explanation of groundwater supply / overall demand
DRAFT

2015 CITY OF SANTA MONICA URBAN WATER MANAGEMENT PLAN
5 - 12 2015 URBAN WATER MANAGEMENT PLAN SECTION 5: RELIABILITY PLANNING
Table 5.6 City of Santa Monica Water Supply Availability & Demand Projections
Multiple Dry Years (2016-2020) (AF)
Water Sources 2016 2017 2018 2019 2020
Population
Water Service Area Population 93,420 93,532 93,644 93,757 93,869
Supply
Normal Years Multiple Dry Years
Imported Water 7,406 7,406 7,406 7,406 7,406
Groundwater 12,400 12,400 12,400 12,400 12,400
Recycled Dry Weather Urban Runoff 560 560 100 100 100
Total Supply 20,366 20,366 19,906 19,906 19,906
Normal Year Supply 20,366 20,366 20,366 20,366 20,366
% of Normal Year 100% 100% 98% 98% 98%
Demand
Normal Years Multiple Dry Years
Total Normal / Mult. Dry Demand 12,871 12,887 14,579 13,951 13,838
Normal Year Demand 12,871 12,887 12,902 12,918 12,933
% of Normal Year 100.0% 100.0% 113.0% 108.0% 107.0%
Supply/Demand Comparison
Normal Years Multiple Dry Years
Supply/Demand Difference 7,495 7,479 5,327 5,955 6,068
Supply/Demand (%) 158.2% 158.0% 136.5% 142.7% 143.8% Table is intended only to show City will be able to meet demand for all years per the following*: 1. Total Demand based on 123 GPCD (SBx7-7) multiplied by population projections above and by multiple dry year increases of 1013%, 108%, and 107% 2. Recycled Dry Weather Urban Runoff Supplies based on previous dry year supplies in 2007 (about 100 AF) 3. All other items derived in similitude to Table 5.4
*See notes below Table 5.4 for explanation of groundwater supply / overall demand
DRAFT
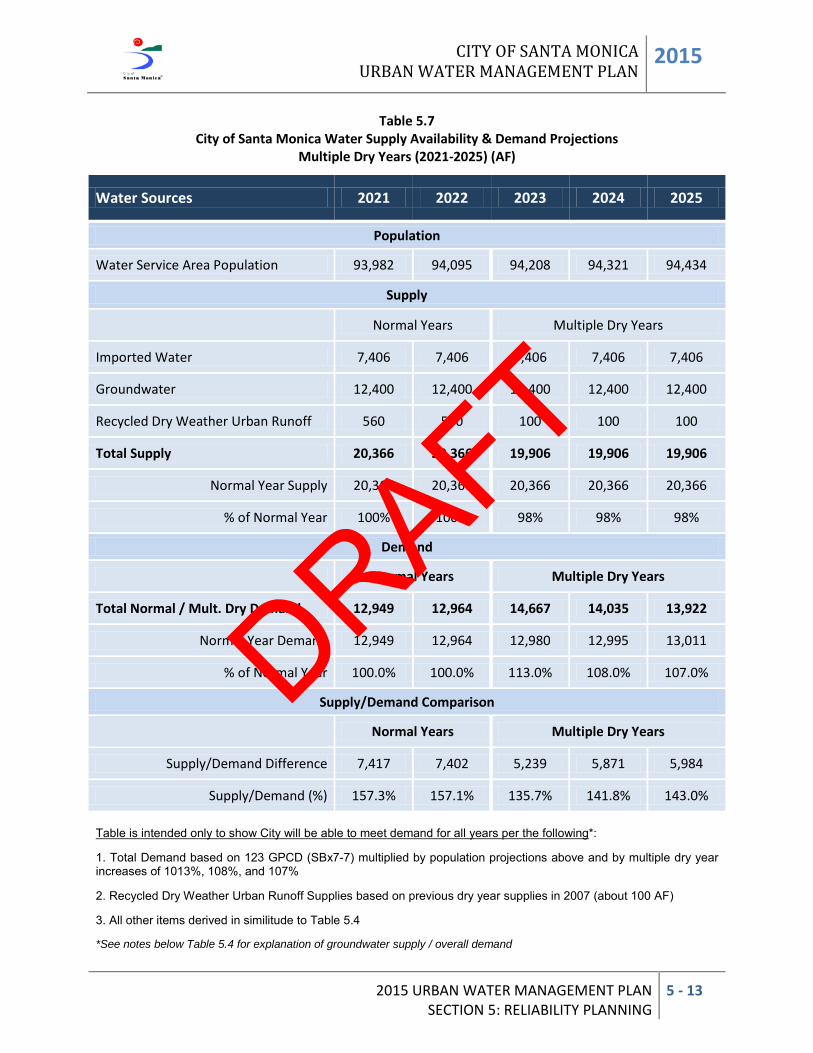
CITY OF SANTA MONICA URBAN WATER MANAGEMENT PLAN 2015
2015 URBAN WATER MANAGEMENT PLAN SECTION 5: RELIABILITY PLANNING
5 - 13
Table 5.7 City of Santa Monica Water Supply Availability & Demand Projections
Multiple Dry Years (2021-2025) (AF)
Water Sources 2021 2022 2023 2024 2025
Population
Water Service Area Population 93,982 94,095 94,208 94,321 94,434
Supply
Normal Years Multiple Dry Years
Imported Water 7,406 7,406 7,406 7,406 7,406
Groundwater 12,400 12,400 12,400 12,400 12,400
Recycled Dry Weather Urban Runoff 560 560 100 100 100
Total Supply 20,366 20,366 19,906 19,906 19,906
Normal Year Supply 20,366 20,366 20,366 20,366 20,366
% of Normal Year 100% 100% 98% 98% 98%
Demand
Normal Years Multiple Dry Years
Total Normal / Mult. Dry Demand 12,949 12,964 14,667 14,035 13,922
Normal Year Demand 12,949 12,964 12,980 12,995 13,011
% of Normal Year 100.0% 100.0% 113.0% 108.0% 107.0%
Supply/Demand Comparison
Normal Years Multiple Dry Years
Supply/Demand Difference 7,417 7,402 5,239 5,871 5,984
Supply/Demand (%) 157.3% 157.1% 135.7% 141.8% 143.0% Table is intended only to show City will be able to meet demand for all years per the following*: 1. Total Demand based on 123 GPCD (SBx7-7) multiplied by population projections above and by multiple dry year increases of 1013%, 108%, and 107% 2. Recycled Dry Weather Urban Runoff Supplies based on previous dry year supplies in 2007 (about 100 AF) 3. All other items derived in similitude to Table 5.4
*See notes below Table 5.4 for explanation of groundwater supply / overall demand
DRAFT

2015 CITY OF SANTA MONICA URBAN WATER MANAGEMENT PLAN
5 - 14 2015 URBAN WATER MANAGEMENT PLAN SECTION 5: RELIABILITY PLANNING
Table 5.8 City of Santa Monica Water Supply Availability & Demand Projections
Multiple Dry Years (2026-2030) (AF)
Water Sources 2026 2027 2028 2029 2030
Population
Water Service Area Population 94,547 94,661 94,774 94,888 95,002
Supply
Normal Years Multiple Dry Years
Imported Water 7,406 7,406 7,406 7,406 7,406
Groundwater 12,400 12,400 12,400 12,400 12,400
Recycled Dry Weather Urban Runoff 560 560 100 100 100
Total Supply 20,366 20,366 19,906 19,906 19,906
Normal Year Supply 20,366 20,366 20,366 20,366 20,366
% of Normal Year 100% 100% 98% 98% 98%
Demand
Normal Years Multiple Dry Years
Total Normal / Mult. Dry Demand 13,026 13,042 14,755 14,119 14,005
Normal Year Demand 13,026 13,042 13,058 13,073 13,089
% of Normal Year 100.0% 100.0% 113.0% 108.0% 107.0%
Supply/Demand Comparison
Normal Years Multiple Dry Years
Supply/Demand Difference 7,340 7,324 5,151 5,787 5,901
Supply/Demand (%) 156.3% 156.2% 134.9% 141.0% 142.1% Table is intended only to show City will be able to meet demand for all years per the following*: 1. Total Demand based on 123 GPCD (SBx7-7) multiplied by population projections above and by multiple dry year increases of 1013%, 108%, and 107% 2. Recycled Dry Weather Urban Runoff Supplies based on previous dry year supplies in 2007 (about 100 AF) 3. All other items derived in similitude to Table 5.4
*See notes below Table 5.4 for explanation of groundwater supply / overall demand
DRAFT

CITY OF SANTA MONICA URBAN WATER MANAGEMENT PLAN 2015
2015 URBAN WATER MANAGEMENT PLAN SECTION 5: RELIABILITY PLANNING
5 - 15
Table 5.9 City of Santa Monica Water Supply Availability & Demand Projections
Multiple Dry Years (2031-2035) (AF)
Water Sources 2031 2032 2033 2034 2035
Population
Water Service Area Population 95,116 95,230 95,344 95,459 95,573
Supply
Normal Years Multiple Dry Years
Imported Water 7,406 7,406 7,406 7,406 7,406
Groundwater 12,400 12,400 12,400 12,400 12,400
Recycled Dry Weather Urban Runoff 560 560 100 100 100
Total Supply 20,366 20,366 19,906 19,906 19,906
Normal Year Supply 20,366 20,366 20,366 20,366 20,366
% of Normal Year 100% 100% 98% 98% 98%
Demand
Normal Years Multiple Dry Years
Total Normal / Mult. Dry Demand 13,105 13,121 14,844 14,204 14,090
Normal Year Demand 13,105 13,121 13,136 13,152 13,168
% of Normal Year 100.0% 100.0% 113.0% 108.0% 107.0%
Supply/Demand Comparison
Normal Years Multiple Dry Years
Supply/Demand Difference 7,261 7,245 5,062 5,702 5,816
Supply/Demand (%) 155.4% 155.2% 134.1% 140.1% 141.3% Table is intended only to show City will be able to meet demand for all years per the following*: 1. Total Demand based on 123 GPCD (SBx7-7) multiplied by population projections above and by multiple dry year increases of 1013%, 108%, and 107% 2. Recycled Dry Weather Urban Runoff Supplies based on previous dry year supplies in 2007 (about 100 AF) 3. All other items derived in similitude to Table 5.4
*See notes below Table 5.4 for explanation of groundwater supply / overall demand
DRAFT
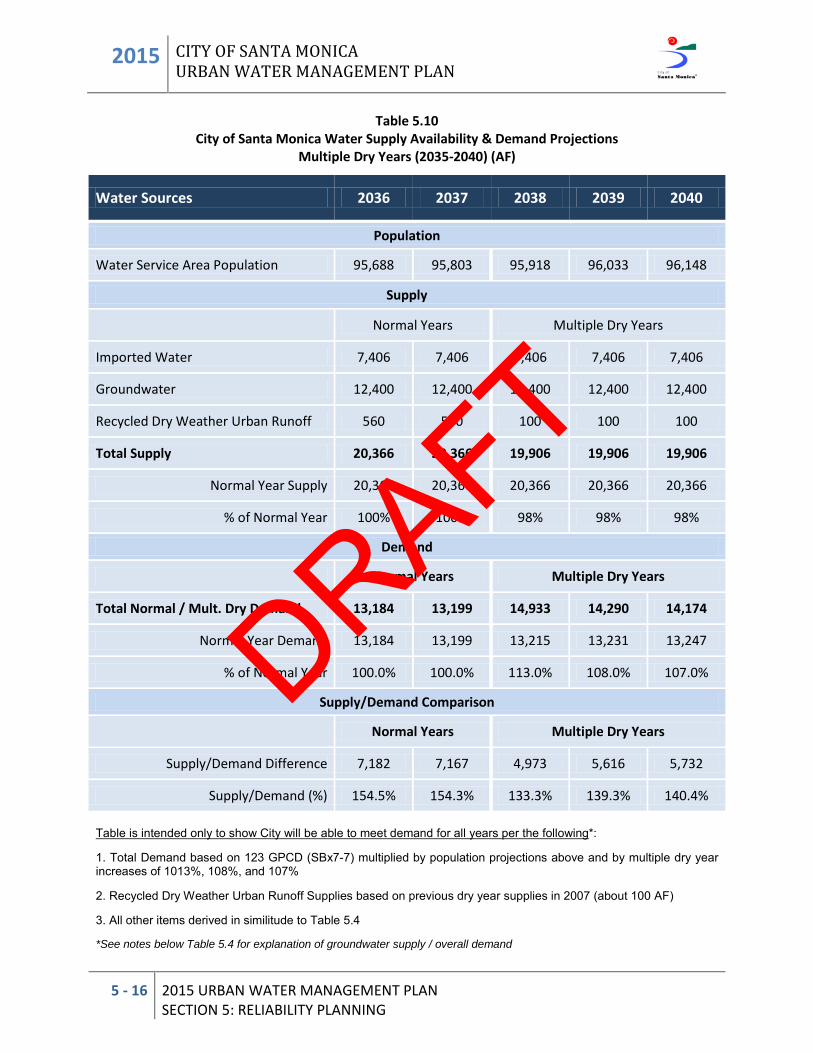
2015 CITY OF SANTA MONICA URBAN WATER MANAGEMENT PLAN
5 - 16 2015 URBAN WATER MANAGEMENT PLAN SECTION 5: RELIABILITY PLANNING
Table 5.10 City of Santa Monica Water Supply Availability & Demand Projections
Multiple Dry Years (2035-2040) (AF)
Water Sources 2036 2037 2038 2039 2040
Population
Water Service Area Population 95,688 95,803 95,918 96,033 96,148
Supply
Normal Years Multiple Dry Years
Imported Water 7,406 7,406 7,406 7,406 7,406
Groundwater 12,400 12,400 12,400 12,400 12,400
Recycled Dry Weather Urban Runoff 560 560 100 100 100
Total Supply 20,366 20,366 19,906 19,906 19,906
Normal Year Supply 20,366 20,366 20,366 20,366 20,366
% of Normal Year 100% 100% 98% 98% 98%
Demand
Normal Years Multiple Dry Years
Total Normal / Mult. Dry Demand 13,184 13,199 14,933 14,290 14,174
Normal Year Demand 13,184 13,199 13,215 13,231 13,247
% of Normal Year 100.0% 100.0% 113.0% 108.0% 107.0%
Supply/Demand Comparison
Normal Years Multiple Dry Years
Supply/Demand Difference 7,182 7,167 4,973 5,616 5,732
Supply/Demand (%) 154.5% 154.3% 133.3% 139.3% 140.4% Table is intended only to show City will be able to meet demand for all years per the following
*See notes below Table 5.4 for explanation of groundwater supply / overall demand
*: 1. Total Demand based on 123 GPCD (SBx7-7) multiplied by population projections above and by multiple dry year increases of 1013%, 108%, and 107% 2. Recycled Dry Weather Urban Runoff Supplies based on previous dry year supplies in 2007 (about 100 AF) 3. All other items derived in similitude to Table 5.4
DRAFT
CITY OF SANTA MONICA URBAN WATER MANAGEMENT PLAN 2015
2015 URBAN WATER MANAGEMENT PLAN SECTION 5: RELIABILITY PLANNING
5 - 17
Based on the data contained in Tables 5.4-5.10, the City can expect to meet future demands through 2040 for all climatologic classifications. Projected groundwater and imported water supply capacities are not expected to be significantly affected during times of low rainfall and over short term dry periods of up to three years. However, during prolonged periods of drought, the City's imported water supply capacities may potentially be reduced significantly due to reductions in MWD's storage reservoirs resulting from increases in regional demand. 5.6 VULNERABILITY OF SUPPLY Due to the semi-arid nature of the City's climate and as a result of past drought conditions, the City is vulnerable to water shortages due to its climatic environment and seasonally hot summer months. While the data shown in Tables 5.4 through 5.10 identifies water availability during single and multiple dry year scenarios, response to a future drought would follow the water use efficiency mandates of the City's Water Shortage Response Plan (WSRP) along with implementation of the appropriate stage of regional plans, such as the WSDM Plan (MWD). These programs are discussed in Section 7. 5.7 WATER SUPPLY OPPORTUNITIES City Projects In general, the City continually reviews practices that will provide its customers with adequate and reliable supplies. As discussed in previous sections, the City is dedicated to maximizing its supply sources to help meet its 100 percent sustainability goals. In the 2010 UWMP, the City did not have any specific plans for additional water supply projects other than ongoing maintenance and upgrades to its existing wells, storage
reservoirs, and SMURRF. However, the City has identified in its 2014 Sustainable Water Master Plan (SWMP) that conservation alone will not allow the City to meet its sustainability goals. Thus, the City has considered several supply opportunities, including traditional sources such as groundwater and alternate sources such as recycled, greywater, and rainwater harvesting. The City may also consider recycling additional urban runoff from Los Angeles County drains that are presently discharging into Santa Monica Bay, such as the Wilshire Boulevard and Montana Avenue drains. However, the economics of purchasing the necessary land to build future recycling plants will be an important factor in assessing the economic viability of these projects. The 2014 SWMP goes into detail on the groundwater options for the City. Regional Projects (MWD) MWD is implementing water supply alternative strategies for the region and on behalf of member agencies to ensure available water in the future, including: • Conservation • Water recycling & groundwater recovery • Storage and groundwater management
programs within the region • Storage related to SWP & CRA • Other water supply management
programs outside of the region MWD has made investments in conservation and supply augmentation as part of its long-term water management strategy. MWD’s approach to a long-term water management strategy was to develop an Integrated Resource Plan (IRP) to include many supply sources. A brief description of the various programs implemented by MWD to improve reliability is included in Table 5.11 on the following page.
DRAFT
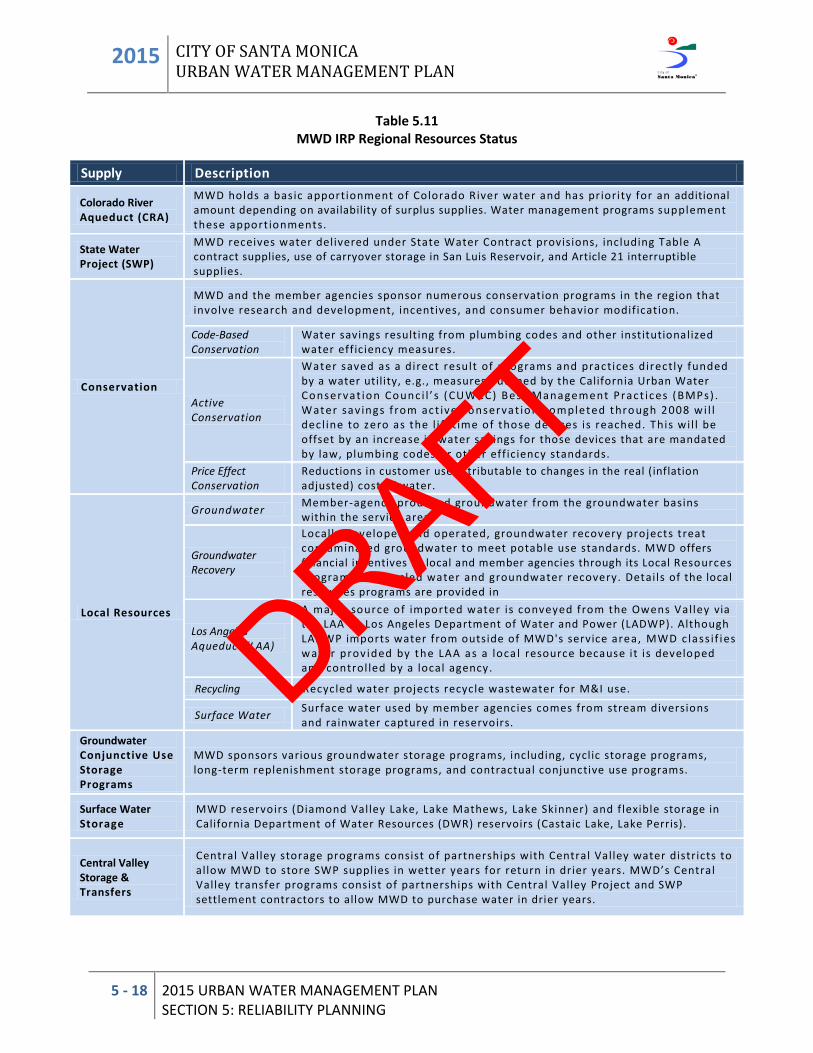
2015 CITY OF SANTA MONICA URBAN WATER MANAGEMENT PLAN
5 - 18 2015 URBAN WATER MANAGEMENT PLAN SECTION 5: RELIABILITY PLANNING
Table 5.11 MWD IRP Regional Resources Status
Supply Description
Colorado River Aqueduct (CRA)
MWD holds a basic apportionment of Colorado River water and has priority for an additional amount depending on availability of surplus supplies. Water management programs supplement these apport ionments.
State Water Project (SWP)
MWD receives water delivered under State Water Contract provisions, including Table A contract supplies, use of carryover storage in San Luis Reservoir, and Article 21 interruptible supplies.
Conservation
MWD and the member agencies sponsor numerous conservation programs in the region that involve research and development, incentives, and consumer behavior modification.
Code-Based Conservation
Water savings resulting from plumbing codes and other institutionalized water efficiency measures.
Active Conservation
Water saved as a direct result of programs and practices directly funded by a water utility, e.g., measures outlined by the California Urban Water Conservat ion Counc i l ’ s (CUWCC) Best Management Pract ices (BMPs) . Water sav ings f rom act ive conservat ion completed through 2008 wi l l decl ine to zero as the l i fet ime of those devices is reached. This wi l l be offset by an increase in water savings for those devices that are mandated by law, plumbing codes or other efficiency standards.
Price Effect Conservation
Reductions in customer use attributable to changes in the real (inflation adjusted) cost of water.
Local Resources
Groundwater Member-agency produced groundwater from the groundwater basins within the service area.
Groundwater Recovery
Locally developed and operated, groundwater recovery projects treat contaminated groundwater to meet potable use standards. MWD offers financial incentives to local and member agencies through its Local Resources Program for recycled water and groundwater recovery. Details of the local resources programs are provided in
Los Angeles Aqueduct (LAA)
A major source of imported water is conveyed from the Owens Valley via the LAA by Los Angeles Department of Water and Power (LADWP). Although LADWP imports water from outside of MWD's service area, MWD c lass if ies water prov ided by the LAA as a loca l resource because it is developed and control led by a local agency.
Recycling Recycled water projects recycle wastewater for M&I use.
Surface Water Surface water used by member agencies comes from stream diversions and rainwater captured in reservoirs.
Groundwater Conjunctive Use Storage Programs
MWD sponsors various groundwater storage programs, including, cyclic storage programs, long-term replenishment storage programs, and contractual conjunctive use programs.
Surface Water Storage
MWD reservoirs (Diamond Valley Lake, Lake Mathews, Lake Skinner) and flexible storage in California Department of Water Resources (DWR) reservoirs (Castaic Lake, Lake Perris).
Central Valley Storage & Transfers
Central Valley storage programs consist of partnerships with Central Valley water districts to allow MWD to store SWP supplies in wetter years for return in drier years. MWD’s Central Valley transfer programs consist of partnerships with Central Valley Project and SWP settlement contractors to allow MWD to purchase water in drier years.
DRAFT
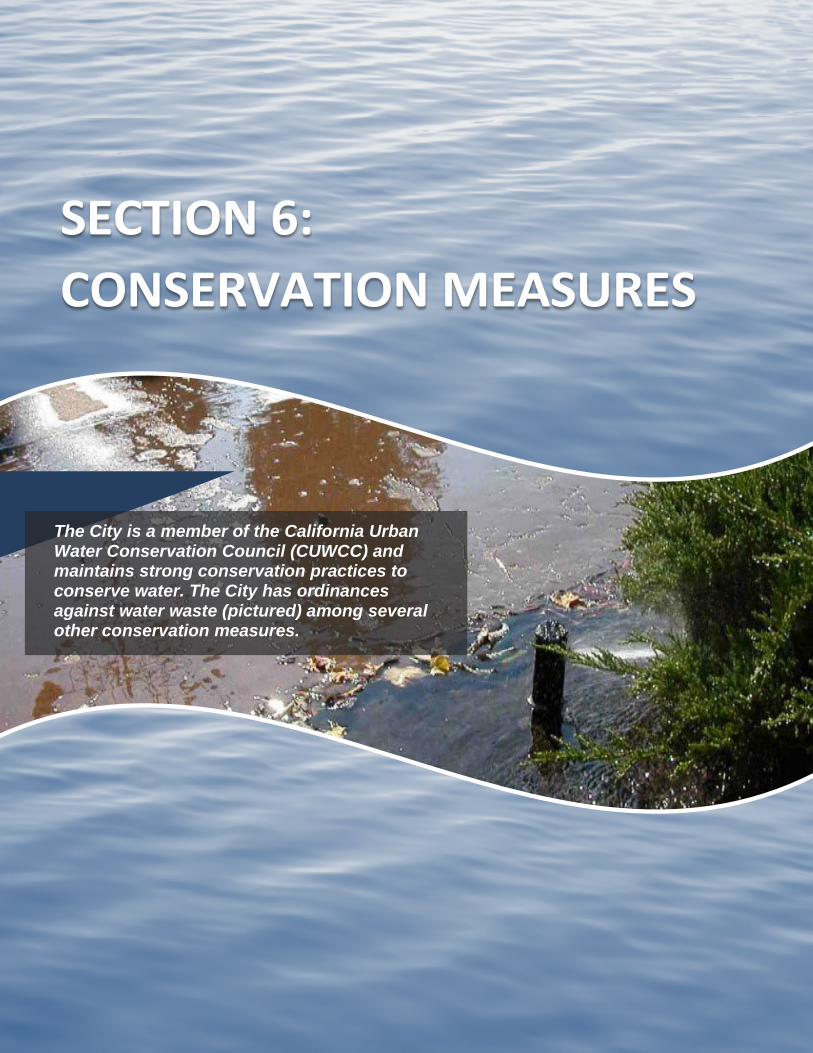
The City is a member of the California Urban Water Conservation Council (CUWCC) and maintains strong conservation practices to conserve water. The City has ordinances against water waste (pictured) among several other conservation measures.
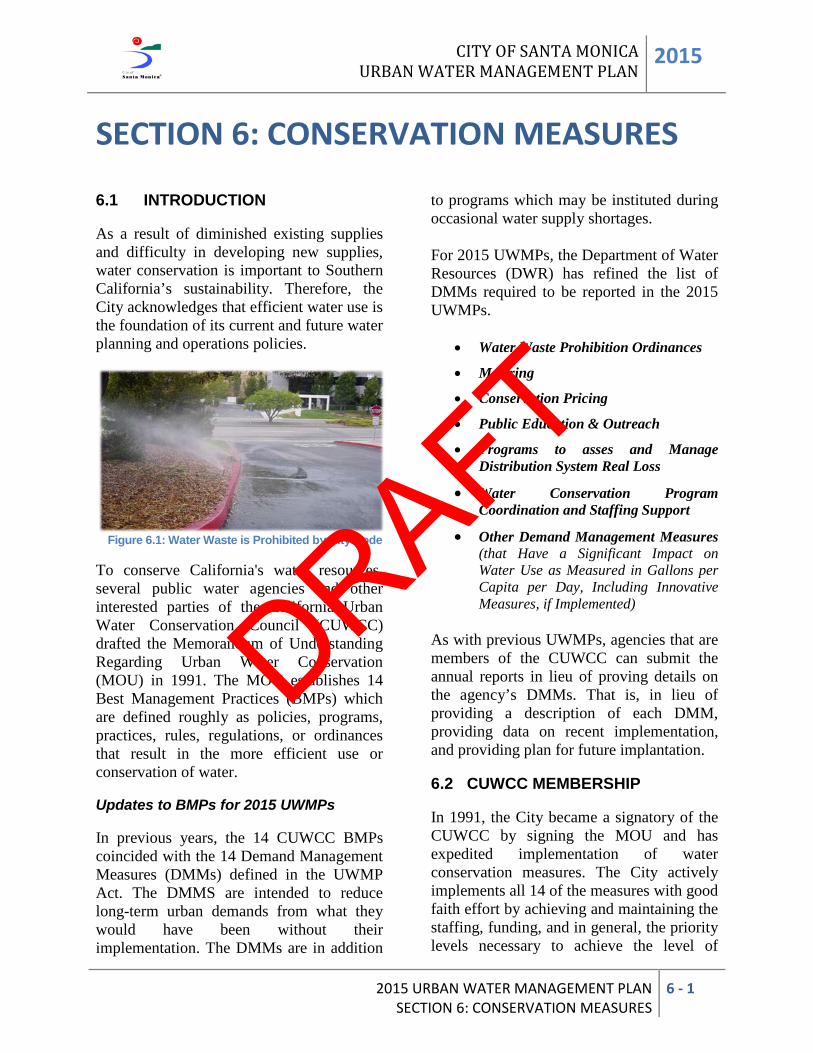
CITY OF SANTA MONICA URBAN WATER MANAGEMENT PLAN 2015
2015 URBAN WATER MANAGEMENT PLAN SECTION 6: CONSERVATION MEASURES
6 - 1
SECTION 6: CONSERVATION MEASURES 6.1 INTRODUCTION As a result of diminished existing supplies and difficulty in developing new supplies, water conservation is important to Southern California’s sustainability. Therefore, the City acknowledges that efficient water use is the foundation of its current and future water planning and operations policies.
Figure 6.1: Water Waste is Prohibited by City Code To conserve California's water resources, several public water agencies and other interested parties of the California Urban Water Conservation Council (CUWCC) drafted the Memorandum of Understanding Regarding Urban Water Conservation (MOU) in 1991. The MOU establishes 14 Best Management Practices (BMPs) which are defined roughly as policies, programs, practices, rules, regulations, or ordinances that result in the more efficient use or conservation of water. Updates to BMPs for 2015 UWMPs In previous years, the 14 CUWCC BMPs coincided with the 14 Demand Management Measures (DMMs) defined in the UWMP Act. The DMMS are intended to reduce long-term urban demands from what they would have been without their implementation. The DMMs are in addition
to programs which may be instituted during occasional water supply shortages. For 2015 UWMPs, the Department of Water Resources (DWR) has refined the list of DMMs required to be reported in the 2015 UWMPs.
• Water Waste Prohibition Ordinances
• Metering
• Conservation Pricing
• Public Education & Outreach
• Programs to asses and Manage Distribution System Real Loss
• Water Conservation Program Coordination and Staffing Support
• Other Demand Management Measures (that Have a Significant Impact on Water Use as Measured in Gallons per Capita per Day, Including Innovative Measures, if Implemented)
As with previous UWMPs, agencies that are members of the CUWCC can submit the annual reports in lieu of proving details on the agency’s DMMs. That is, in lieu of providing a description of each DMM, providing data on recent implementation, and providing plan for future implantation. 6.2 CUWCC MEMBERSHIP In 1991, the City became a signatory of the CUWCC by signing the MOU and has expedited implementation of water conservation measures. The City actively implements all 14 of the measures with good faith effort by achieving and maintaining the staffing, funding, and in general, the priority levels necessary to achieve the level of
DRAFT
2015 CITY OF SANTA MONICA URBAN WATER MANAGEMENT PLAN
6 - 2 2015 URBAN WATER MANAGEMENT PLAN SECTION 6: CONSERVATION MEASURES
activity called for in each BMP's definition as described in the MOU. Water conservation is an integral part of the City's water policies. As a member of CUWCC, the City is required to submit Bi-Annual Reports to the CUWCC that document the implementation of each BMP. The City has maintained compliance with the BMPs since becoming a signatory. Appendix E includes the CUWCC reports. Updates to CUWCC BMPs As with the DMMs, the CUWCC BMPs have changed for CUWCC members. The BMPs are now listed as:
• BMP 1: Utility Operations
• BMP 2: Public Education & Outreach
• BMP 3: Residential Programs
• BMP 4: Commercial, Institutional, and Industrial Programs
• BMP 5: Landscape Programs The changes listed above are reflected in the City’s annual CUWCC BMP reports from 2010-2015. 6.3 CONSERVATION MEASURES As signatory to the MOU, the City has committed to use good-faith efforts to implement the BMPs. In addition, the City has continued to work with the Metropolitan Water District (MWD) to increase the effectiveness of its DMM programs and educate people on the importance of water conservation. Overall, the City’s conservation efforts as a member of CUWCC have led to efficient
water use. The City’s BMPs are summarized in Table 6.1 below.
Table 6.1 City BMPs (CUWCC)
BMP
BMP 1: Utility Operations Deals with water waste prohibitions, water efficiency ordinances, metering, conservation pricing, and other items related to managing water use.
BMP 2: Public Education & outreach Deals with outreach efforts including emails, newsletters, advertisements, presentations, promotions, etc. related to outreach & eduation.
DMM No. 3: Residential Programs Deals with showerheads, faucets, toilets, and leak detection surveys related to residential water use.
DMM No. 4: Commercial, Institutional, & Industrial Programs Deals with toilets, urinals, steamers, cooling towers, food/restaurant equipment, medical equipment, and items related to commercial, institutional, and industrial water use.
DMM No. 5: Landscape Programs Deals with establishing parameters for large landscapes, including measurements, budgets, audits, prohibitions, incentives, etc. related to large landscapes
In addition to the BMPs listed above, the City also maintains the following conservation programs: City of Santa Monica Water-Efficient Landscape Programs
• Rain Harvest Rebates: Property owners are eligible for up to $1,000
DRAFT
CITY OF SANTA MONICA URBAN WATER MANAGEMENT PLAN 2015
2015 URBAN WATER MANAGEMENT PLAN SECTION 6: CONSERVATION MEASURES
6 - 3
for the installation of rain barrels and/or cisterns. The City received $70,000 from the Department of Water Resources in 2010 to double the rebate amount for an additional 300 products.
• Sustainable Landscape Grants: Property owners are eligible for up to $5,000 to replace their existing sprinklers and water guzzling plants with drip irrigation and climate-appropriate plants. The City was awarded $250,000 from the Department of Water Resources in 2010 to fund 50 additional projects.
• Cash for Grass Rebates: Property owners are eligible for up to $1,000 to remove the lawn in the front yard and replace with climate-appropriate plants, mulch and drip irrigation. The City received co-funding from MWD for this program.
• Irrigation Rebate: Property owners are eligible for up to $500 to replace sprinklers with drip irrigation.
• Landscape Design, Installation, and Maintenance Classes: Free monthly classes are held for homeowners and landscape professionals. Each class highlights a specific element of sustainable landscaping that is required as part of the City's updated Water-Efficient Landscape and Irrigation Standards.
• Water Conservation Ordinances: The City actively enforces its water conservation ordinance, which prohibits irrigation runoff and water waste.
City Water-Efficient Indoor Programs
• Rebates for qualified water-saving products: The City co-funds rebates
totaling $40,000 each year through MWD's regional rebate programs.
• Water Audits - the City provides free water audits for homeowners, multi-family owners, and businesses to identify water-saving opportunities.
Additional information on the City's conservation programs can be found at: www.sustainablesm.org/water. 6.4 CITY CONSERVATION POLICIES In 2014, the City updated the Sustainable City Plan, which includes goals for the City’s government and the community to conserve and enhance the City’s local resources, safeguard human health and the environment, maintain a healthy and diverse economy, and improve the livability and quality of life for all of the community. The guiding principles of the 2003 plan are:
1. The concept of sustainability guides City policy.
2. Protection, preservation, and restoration of the natural environment are high priorities of the City.
3. Environmental quality, economic health and social equity are mutually dependent.
4. All decisions have implications to the long-term sustainability of the City.
5. Community awareness, responsibility, participation, and education are key elements of a sustainable community.
6. The City recognizes its linkage with the regional, national, and global community.
7. Those sustainability issues most important to the community will be addressed first, and the most cost-effective programs and policies will be selected.
DRAFT
2015 CITY OF SANTA MONICA URBAN WATER MANAGEMENT PLAN
6 - 4 2015 URBAN WATER MANAGEMENT PLAN SECTION 6: CONSERVATION MEASURES
8. The City is committed to procurement decisions, which minimize negative environmental and social impacts.
9. Cross-sector partnerships are necessary to achieve sustainable goals.
10. The Precautionary Priciple Provides a Complimentary Framework to Help Guide City Decision Makers in the Pursuit of Sustainability (New as of 2014)
11. Santa Monica is committed to Sustainable Rights for its Residents, Natural Communities, and Ecosystems (New as of 2014)
The system level indicators for water use and their target goals are as follows:
Table 6.2 System Level Indicators & Targets
Indicators Targets for 2020
Total citywide use (Self Sufficiency)
Reduce demand by 1,300,000 gallons per day (GPD)
Total Citywide use (Per Capita)
Reduce per capita use to 123 gallons per capita per day (GPCD)
Percent local vs. imported
Increase up to 100% local
Potable vs. non-potable
Upward trend in non-potable use
As part of these policies, the City of Santa Monica is committed to implementing water conservation and water recycling programs to protect, preserve and restore the natural environment. The City's Office of
Sustainability and the Environment (OSE) assists residents with free home water assessments, a water-efficient clothes washer rebate program, a rain barrel rebate program, a high efficiency toilet rebate program, landscaping grants & rebates for new or remodeled gardens demonstrating sustainable design, greywater tips and assists with educational guidance on water-saving methods at home and in business. The division’s website offers indoor and outdoor water saving tips, educational programs, and links to other environmental sites with water saving information. The OSE also enforces the City's water conservation rules and regulations, which include:
1. The Bay Save Fee Ordinance, which assesses a fee on water bills until fixtures are replaced with water conserving fixtures and a free water saving assessment, is performed by City staff.
2. The Good Housekeeping Ordinance, which includes anti-runoff provisions for irrigation and a prohibition of washing down paved areas with potable water.
3. The Selling Your Home/Property Ordinance that requires any building that changes owners since 1993 to be retrofitted with water conserving fixtures upon sale as a condition of escrow.
4. The No Water Waste Ordinance, which prohibits irrigation between 10:00 am and 4:00 pm, prohibits the watering down of paved or hard-surfaced areas, prohibits irrigation runoff, prohibits the filling of decorative fountains, prohibits the draining and re-filling of pools, requires water leaks to be repaired
DRAFT
CITY OF SANTA MONICA URBAN WATER MANAGEMENT PLAN 2015
2015 URBAN WATER MANAGEMENT PLAN SECTION 6: CONSERVATION MEASURES
6 - 5
immediately, prohibits the washing of vehicles with a running hose, and mandates that restaurants serve water only upon request. Staff assesses penalties in accordance with provisions of the ordinance and assists residents with voluntary compliance.
5. The Green Building Ordinance, which requires the most water-efficient plumbing fixtures, irrigation, and landscaping for new construction, major remodels, and new or remolded landscapes.
The OSE also publishes news releases when water use goes up to help residents and business in eliminating waste, advertises water conservation on City buses, calls water customers after a rain event to encourage them to turn off their sprinklers, and also assists Water Resources Billing staff with bill enclosures promoting water conservation. As a result of the City's conservation achievements, the City of Santa Monica is recognized as one of the top ten leaders in sustainability in the United States
DRAFT
2015 CITY OF SANTA MONICA URBAN WATER MANAGEMENT PLAN
6 - 6 2015 URBAN WATER MANAGEMENT PLAN SECTION 6: CONSERVATION MEASURES
This Page Left Blank Intentionally
DRAFT
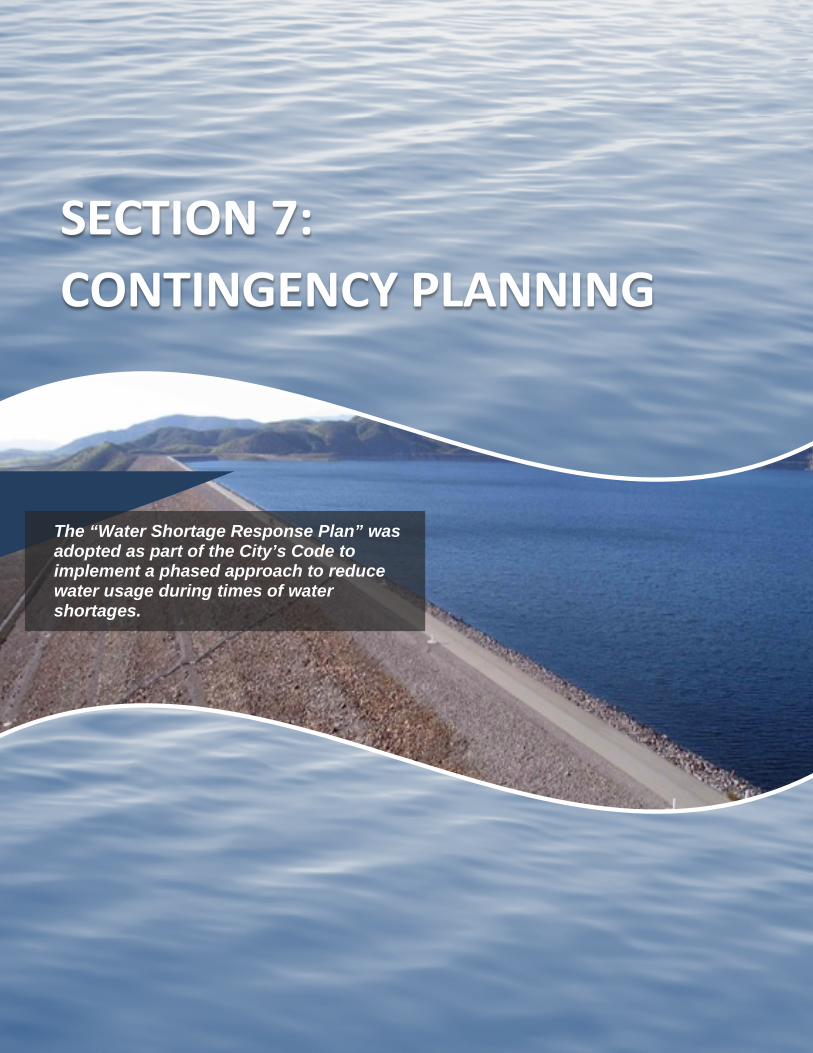
The “Water Shortage Response Plan” was adopted as part of the City’s Code to implement a phased approach to reduce water usage during times of water shortages.
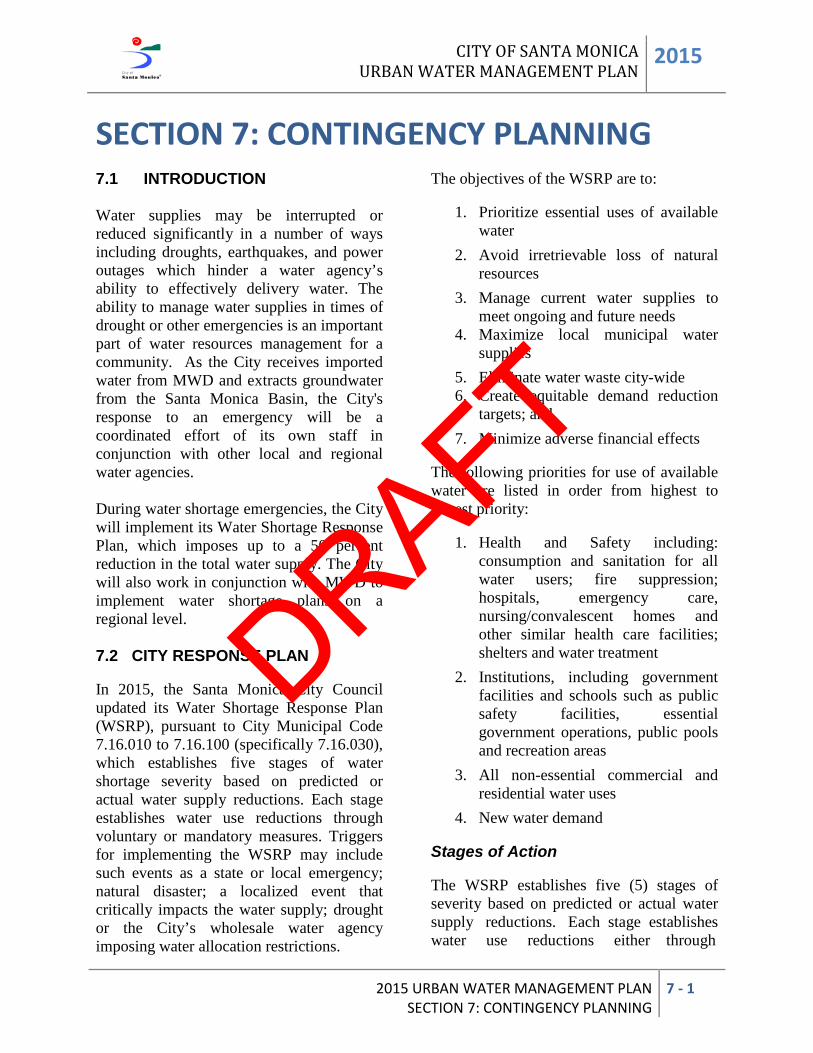
CITY OF SANTA MONICA URBAN WATER MANAGEMENT PLAN 2015
2015 URBAN WATER MANAGEMENT PLAN SECTION 7: CONTINGENCY PLANNING
7 - 1
SECTION 7: CONTINGENCY PLANNING 7.1 INTRODUCTION Water supplies may be interrupted or reduced significantly in a number of ways including droughts, earthquakes, and power outages which hinder a water agency’s ability to effectively delivery water. The ability to manage water supplies in times of drought or other emergencies is an important part of water resources management for a community. As the City receives imported water from MWD and extracts groundwater from the Santa Monica Basin, the City's response to an emergency will be a coordinated effort of its own staff in conjunction with other local and regional water agencies. During water shortage emergencies, the City will implement its Water Shortage Response Plan, which imposes up to a 50 percent reduction in the total water supply. The City will also work in conjunction with MWD to implement water shortage plans on a regional level. 7.2 CITY RESPONSE PLAN In 2015, the Santa Monica City Council updated its Water Shortage Response Plan (WSRP), pursuant to City Municipal Code 7.16.010 to 7.16.100 (specifically 7.16.030), which establishes five stages of water shortage severity based on predicted or actual water supply reductions. Each stage establishes water use reductions through voluntary or mandatory measures. Triggers for implementing the WSRP may include such events as a state or local emergency; natural disaster; a localized event that critically impacts the water supply; drought or the City’s wholesale water agency imposing water allocation restrictions.
The objectives of the WSRP are to:
1. Prioritize essential uses of available water
2. Avoid irretrievable loss of natural resources
3. Manage current water supplies to meet ongoing and future needs
4. Maximize local municipal water supplies
5. Eliminate water waste city-wide 6. Create equitable demand reduction
targets; and
7. Minimize adverse financial effects The following priorities for use of available water are listed in order from highest to lowest priority:
1. Health and Safety including: consumption and sanitation for all water users; fire suppression; hospitals, emergency care, nursing/convalescent homes and other similar health care facilities; shelters and water treatment
2. Institutions, including government facilities and schools such as public safety facilities, essential government operations, public pools and recreation areas
3. All non-essential commercial and residential water uses
4. New water demand Stages of Action The WSRP establishes five (5) stages of severity based on predicted or actual water supply reductions. Each stage establishes water use reductions either through
DRAFT
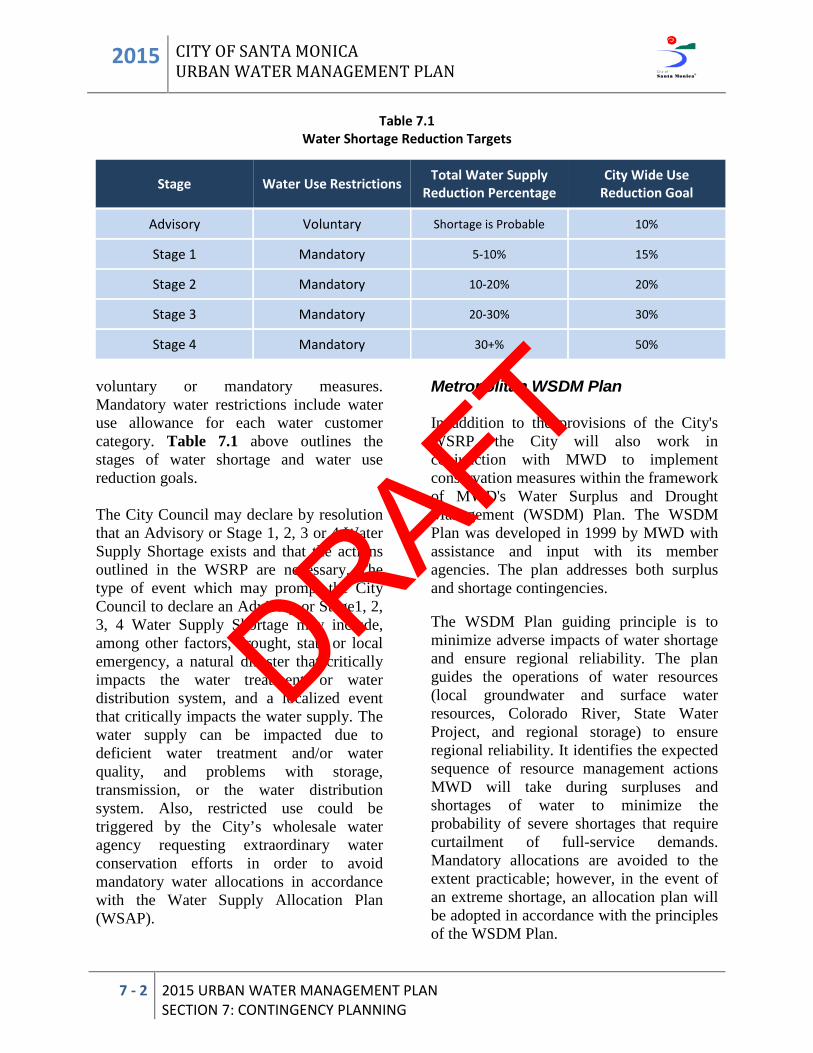
2015 CITY OF SANTA MONICA URBAN WATER MANAGEMENT PLAN
7 - 2 2015 URBAN WATER MANAGEMENT PLAN SECTION 7: CONTINGENCY PLANNING
Table 7.1 Water Shortage Reduction Targets
Stage Water Use Restrictions Total Water Supply Reduction Percentage
City Wide Use Reduction Goal
Advisory Voluntary Shortage is Probable 10%
Stage 1 Mandatory 5-10% 15%
Stage 2 Mandatory 10-20% 20%
Stage 3 Mandatory 20-30% 30%
Stage 4 Mandatory 30+% 50%
voluntary or mandatory measures. Mandatory water restrictions include water use allowance for each water customer category. Table 7.1 above outlines the stages of water shortage and water use reduction goals. The City Council may declare by resolution that an Advisory or Stage 1, 2, 3 or 4 Water Supply Shortage exists and that the actions outlined in the WSRP are necessary. The type of event which may prompt the City Council to declare an Advisory or Stage1, 2, 3, 4 Water Supply Shortage may include, among other factors, drought, state or local emergency, a natural disaster that critically impacts the water treatment or water distribution system, and a localized event that critically impacts the water supply. The water supply can be impacted due to deficient water treatment and/or water quality, and problems with storage, transmission, or the water distribution system. Also, restricted use could be triggered by the City’s wholesale water agency requesting extraordinary water conservation efforts in order to avoid mandatory water allocations in accordance with the Water Supply Allocation Plan (WSAP).
Metropolitan WSDM Plan In addition to the provisions of the City's WSRP, the City will also work in conjunction with MWD to implement conservation measures within the framework of MWD's Water Surplus and Drought Management (WSDM) Plan. The WSDM Plan was developed in 1999 by MWD with assistance and input with its member agencies. The plan addresses both surplus and shortage contingencies. The WSDM Plan guiding principle is to minimize adverse impacts of water shortage and ensure regional reliability. The plan guides the operations of water resources (local groundwater and surface water resources, Colorado River, State Water Project, and regional storage) to ensure regional reliability. It identifies the expected sequence of resource management actions MWD will take during surpluses and shortages of water to minimize the probability of severe shortages that require curtailment of full-service demands. Mandatory allocations are avoided to the extent practicable; however, in the event of an extreme shortage, an allocation plan will be adopted in accordance with the principles of the WSDM Plan.
DRAFT
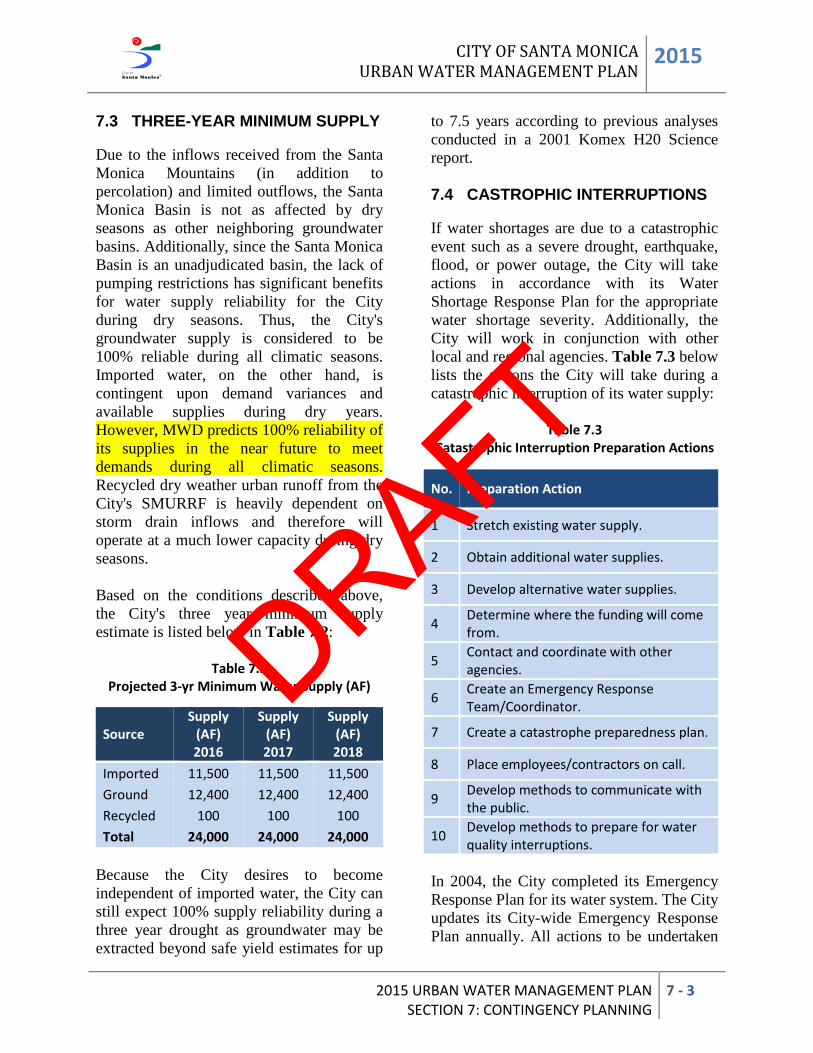
CITY OF SANTA MONICA URBAN WATER MANAGEMENT PLAN 2015
2015 URBAN WATER MANAGEMENT PLAN SECTION 7: CONTINGENCY PLANNING
7 - 3
7.3 THREE-YEAR MINIMUM SUPPLY Due to the inflows received from the Santa Monica Mountains (in addition to percolation) and limited outflows, the Santa Monica Basin is not as affected by dry seasons as other neighboring groundwater basins. Additionally, since the Santa Monica Basin is an unadjudicated basin, the lack of pumping restrictions has significant benefits for water supply reliability for the City during dry seasons. Thus, the City's groundwater supply is considered to be 100% reliable during all climatic seasons. Imported water, on the other hand, is contingent upon demand variances and available supplies during dry years. However, MWD predicts 100% reliability of its supplies in the near future to meet demands during all climatic seasons. Recycled dry weather urban runoff from the City's SMURRF is heavily dependent on storm drain inflows and therefore will operate at a much lower capacity during dry seasons. Based on the conditions described above, the City's three year minimum supply estimate is listed below in Table 7.2:
Table 7.2 Projected 3-yr Minimum Water Supply (AF)
Source Supply
(AF) 2016
Supply (AF) 2017
Supply (AF) 2018
Imported 11,500 11,500 11,500 Ground 12,400 12,400 12,400 Recycled 100 100 100 Total 24,000 24,000 24,000
Because the City desires to become independent of imported water, the City can still expect 100% supply reliability during a three year drought as groundwater may be extracted beyond safe yield estimates for up
to 7.5 years according to previous analyses conducted in a 2001 Komex H20 Science report. 7.4 CASTROPHIC INTERRUPTIONS If water shortages are due to a catastrophic event such as a severe drought, earthquake, flood, or power outage, the City will take actions in accordance with its Water Shortage Response Plan for the appropriate water shortage severity. Additionally, the City will work in conjunction with other local and regional agencies. Table 7.3 below lists the actions the City will take during a catastrophic interruption of its water supply:
Table 7.3 Catastrophic Interruption Preparation Actions
No. Preparation Action
1 Stretch existing water supply.
2 Obtain additional water supplies.
3 Develop alternative water supplies.
4 Determine where the funding will come from.
5 Contact and coordinate with other agencies.
6 Create an Emergency Response Team/Coordinator.
7 Create a catastrophe preparedness plan.
8 Place employees/contractors on call.
9 Develop methods to communicate with the public.
10 Develop methods to prepare for water quality interruptions.
In 2004, the City completed its Emergency Response Plan for its water system. The City updates its City-wide Emergency Response Plan annually. All actions to be undertaken
DRAFT
2015 CITY OF SANTA MONICA URBAN WATER MANAGEMENT PLAN
7 - 4 2015 URBAN WATER MANAGEMENT PLAN SECTION 7: CONTINGENCY PLANNING
during an emergency will follow the City's Emergency Response Plans and the WSRP. 7.5 PROHIBITIONS Mandatory Prohibitions In accordance with the WSRP, the City has enacted several water use restrictions which are permanently enforced as part of the City's Municipal Code. Restrictions include the following:
• No landscape watering (10am-4pm) unless drip irrigation is used.
• No runoff or overspray from excessive irrigation.
• No watering down hardscapes for cleaning.
• No washing of cars except with a hand-held bucket and positive action quick release shutoff valve.
• No filling of fountains, lakes, or ponds unless such features have a recycling system.
• Pools and spas must be covered to prevent evaporation.
• Eating establishments shall serve water only upon request.
The City's prohibitions on water use can be found in Section 7.16.020 of the City code. Consumption Reduction Methods In addition to the City's demand management measures, the following is a list of some of the consumption reduction methods the City may implement during a water shortage:
• Reduce pressure in water mains • Flow restrictions • Restrict building permits • Restrict for only priority uses
• Water Shortage pricing • Mandatory rationing
The City's consumption reduction methods are included in the City's Emergency Response Plan for its water system. Penalties or Charges Violation of the regulations and restrictions on water use set forth in the “No Water Waste” Ordinance constitutes an infraction punishable starting at $250. Each day that a violation occurs constitutes a separate offense, with the second and third penalties at $500 and $1,000, respectively. Any willful misrepresentation constitutes a misdemeanor punishable by a fine not to exceed five hundred dollars or by imprisonment for a period not to exceed six months or both for any person to knowingly misrepresent any material fact to any representative of the City in any attempt or effort to circumvent or otherwise diminish the effectiveness of any of the requirements imposed by any part of the “No Water Waste” Ordinance. 7.6 FISCAL IMPACTS The City has an established rate stabilization structure, which includes rate increases to compensate the City of Santa Monica for operational expenses. When water use is down, fixed operational costs result in rate increases based upon usage to compensate the City for its expenses. Under normal water supply conditions, potable water production figures are recorded daily. Totals are reported monthly to the Water Resources Division Manager and incorporated into the water supply report. As previously mentioned, the City updated its Water Shortage Response Plan particularly addressing water rationing stages, reduction goals, allotments, and triggering
DRAFT
CITY OF SANTA MONICA URBAN WATER MANAGEMENT PLAN 2015
2015 URBAN WATER MANAGEMENT PLAN SECTION 7: CONTINGENCY PLANNING
7 - 5
mechanisms. The City’s revised plan is consistent with the provisions outlined in MWD’s emergency response plan and included in the Urban Water Management Plan after adoption. 7.7 COUNCIL ORDINANCE On September 8, 2015, the Santa Monica City Council passed a resolution updating the Water Shortage Response Plan (WSRP), pursuant to City Municipal Code 7.16.010 to 7.16.100 (specifically 7.16.030). Additionally, the City Council may implement the provisions of this plan by
resolution, following a public hearing to determine the appropriate water shortage stage. A copy of the City's WSRP is included in Appendix G. 7.8 MECHANISMS TO DETERMINE REDUCTIONS IN WATER USE Reductions in water use are tracked through the City's billing system, which tracks bi-monthly use for all metered connections. The use of a tiered rate structure also discourages high water use, and OSE works with the public to reduce consumption.
DRAFT
2015 CITY OF SANTA MONICA URBAN WATER MANAGEMENT PLAN
7 - 6 2015 URBAN WATER MANAGEMENT PLAN SECTION 7: CONTINGENCY PLANNING
This Page Left Blank Intentionally
DRAFT
Changes in weather can have adverse effects on local and regional water supplies. As a coastal city, the subject of climate change is a concern to the city of the City of Santa Monica. Besides its policies on combating the causes of climate change, the City also aims to make its water supplies less vulnerable to adverse weather patterns.
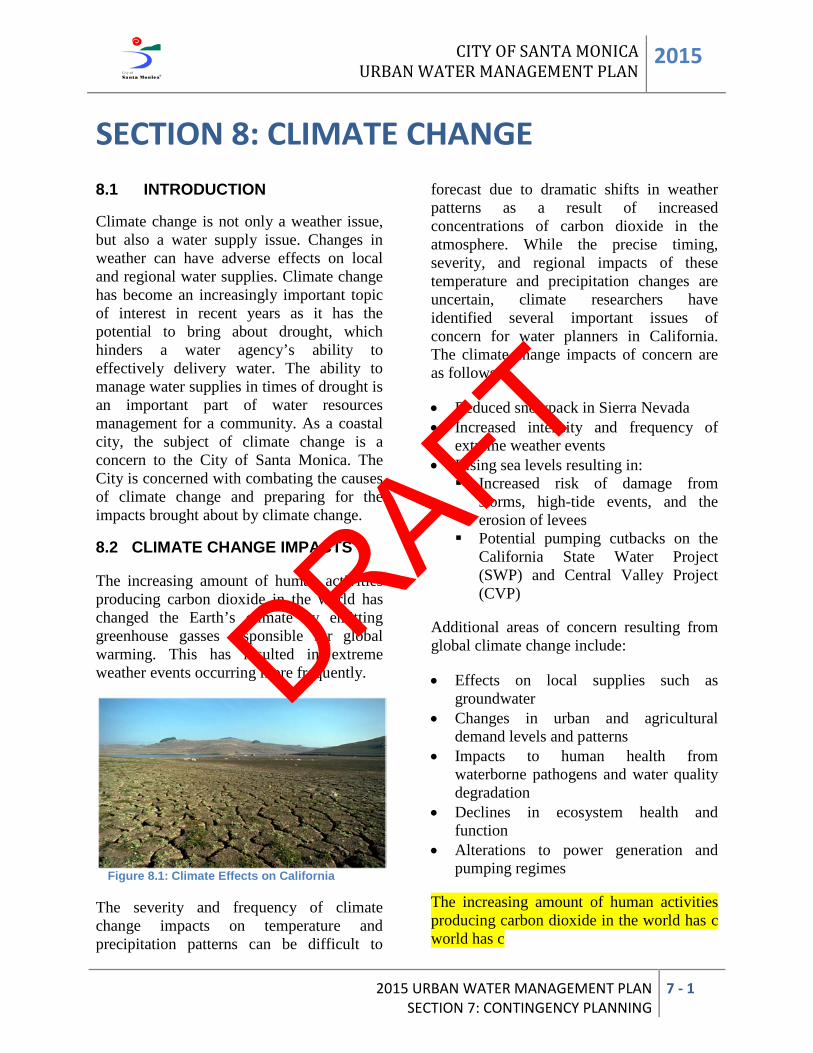
CITY OF SANTA MONICA URBAN WATER MANAGEMENT PLAN 2015
2015 URBAN WATER MANAGEMENT PLAN SECTION 7: CONTINGENCY PLANNING
7 - 1
SECTION 8: CLIMATE CHANGE 8.1 INTRODUCTION Climate change is not only a weather issue, but also a water supply issue. Changes in weather can have adverse effects on local and regional water supplies. Climate change has become an increasingly important topic of interest in recent years as it has the potential to bring about drought, which hinders a water agency’s ability to effectively delivery water. The ability to manage water supplies in times of drought is an important part of water resources management for a community. As a coastal city, the subject of climate change is a concern to the City of Santa Monica. The City is concerned with combating the causes of climate change and preparing for the impacts brought about by climate change. 8.2 CLIMATE CHANGE IMPACTS The increasing amount of human activities producing carbon dioxide in the world has changed the Earth’s climate by emitting greenhouse gasses responsible for global warming. This has resulted in extreme weather events occurring more frequently.
Figure 8.1: Climate Effects on California The severity and frequency of climate change impacts on temperature and precipitation patterns can be difficult to
forecast due to dramatic shifts in weather patterns as a result of increased concentrations of carbon dioxide in the atmosphere. While the precise timing, severity, and regional impacts of these temperature and precipitation changes are uncertain, climate researchers have identified several important issues of concern for water planners in California. The climate change impacts of concern are as follows: • Reduced snowpack in Sierra Nevada • Increased intensity and frequency of
extreme weather events • Rising sea levels resulting in: Increased risk of damage from
storms, high-tide events, and the erosion of levees
Potential pumping cutbacks on the California State Water Project (SWP) and Central Valley Project (CVP)
Additional areas of concern resulting from global climate change include: • Effects on local supplies such as
groundwater • Changes in urban and agricultural
demand levels and patterns • Impacts to human health from
waterborne pathogens and water quality degradation
• Declines in ecosystem health and function
• Alterations to power generation and pumping regimes
The increasing amount of human activities producing carbon dioxide in the world has c world has c
DRAFT
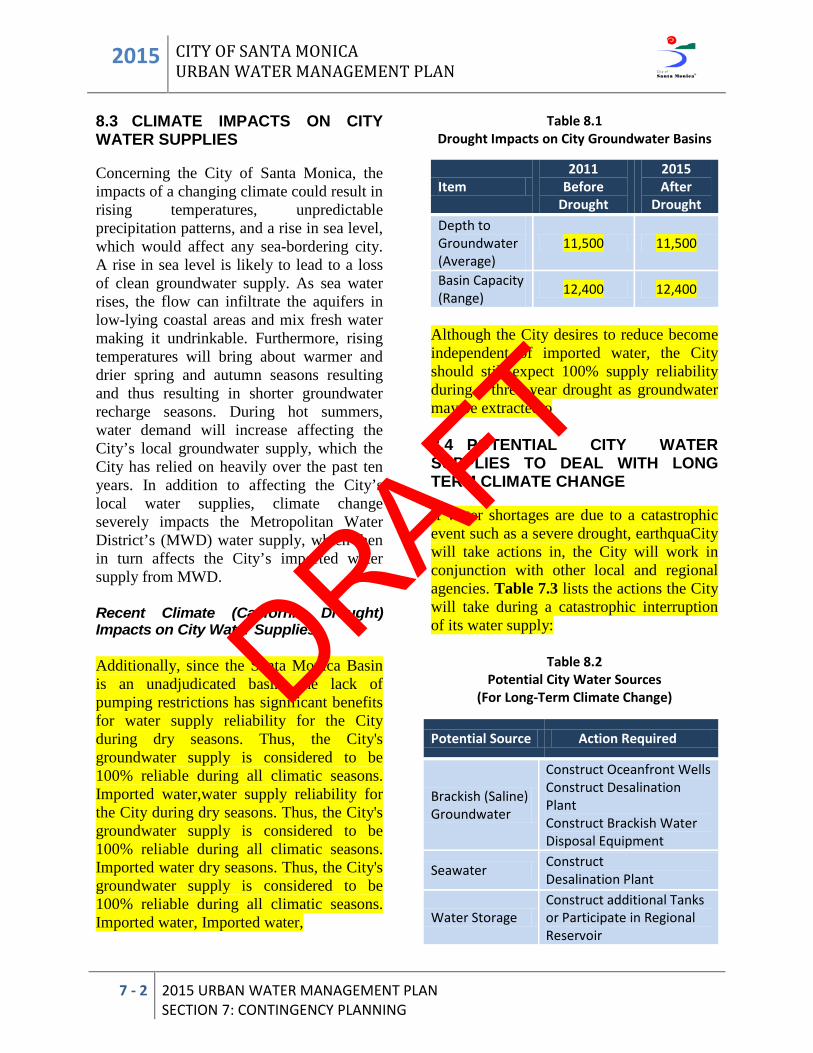
2015 CITY OF SANTA MONICA URBAN WATER MANAGEMENT PLAN
7 - 2 2015 URBAN WATER MANAGEMENT PLAN SECTION 7: CONTINGENCY PLANNING
8.3 CLIMATE IMPACTS ON CITY WATER SUPPLIES Concerning the City of Santa Monica, the impacts of a changing climate could result in rising temperatures, unpredictable precipitation patterns, and a rise in sea level, which would affect any sea-bordering city. A rise in sea level is likely to lead to a loss of clean groundwater supply. As sea water rises, the flow can infiltrate the aquifers in low-lying coastal areas and mix fresh water making it undrinkable. Furthermore, rising temperatures will bring about warmer and drier spring and autumn seasons resulting and thus resulting in shorter groundwater recharge seasons. During hot summers, water demand will increase affecting the City’s local groundwater supply, which the City has relied on heavily over the past ten years. In addition to affecting the City’s local water supplies, climate change severely impacts the Metropolitan Water District’s (MWD) water supply, which then in turn affects the City’s imported water supply from MWD. Recent Climate (California Drought) Impacts on City Water Supplies Additionally, since the Santa Monica Basin is an unadjudicated basin, the lack of pumping restrictions has significant benefits for water supply reliability for the City during dry seasons. Thus, the City's groundwater supply is considered to be 100% reliable during all climatic seasons. Imported water,water supply reliability for the City during dry seasons. Thus, the City's groundwater supply is considered to be 100% reliable during all climatic seasons. Imported water dry seasons. Thus, the City's groundwater supply is considered to be 100% reliable during all climatic seasons. Imported water, Imported water,
Table 8.1 Drought Impacts on City Groundwater Basins
Item 2011
Before Drought
2015 After
Drought Depth to Groundwater (Average)
11,500 11,500
Basin Capacity (Range) 12,400 12,400
Although the City desires to reduce become independent of imported water, the City should still expect 100% supply reliability during a three year drought as groundwater may be extractedto 8.4 POTENTIAL CITY WATER SUPPLIES TO DEAL WITH LONG TERM CLIMATE CHANGE If water shortages are due to a catastrophic event such as a severe drought, earthquaCity will take actions in, the City will work in conjunction with other local and regional agencies. Table 7.3 lists the actions the City will take during a catastrophic interruption of its water supply:
Table 8.2 Potential City Water Sources
(For Long-Term Climate Change)
Potential Source Action Required
Brackish (Saline) Groundwater
Construct Oceanfront Wells Construct Desalination Plant Construct Brackish Water Disposal Equipment
Seawater Construct Desalination Plant
Water Storage Construct additional Tanks or Participate in Regional Reservoir
DRAFT
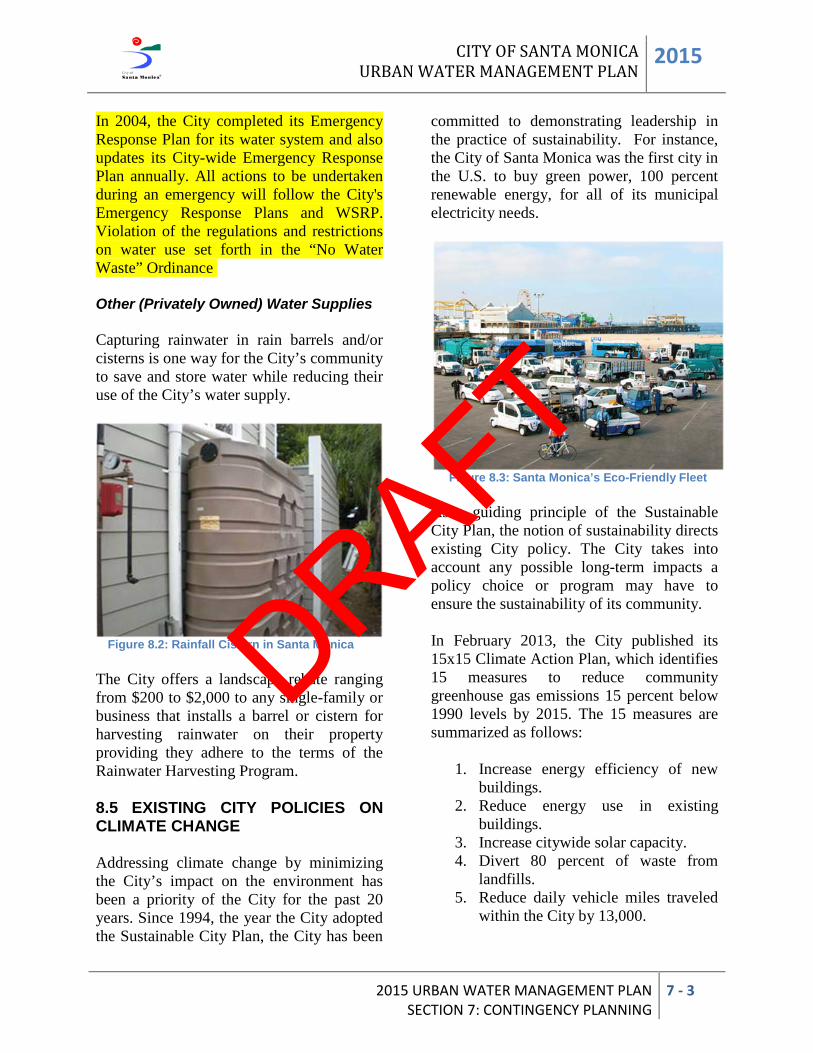
CITY OF SANTA MONICA URBAN WATER MANAGEMENT PLAN 2015
2015 URBAN WATER MANAGEMENT PLAN SECTION 7: CONTINGENCY PLANNING
7 - 3
In 2004, the City completed its Emergency Response Plan for its water system and also updates its City-wide Emergency Response Plan annually. All actions to be undertaken during an emergency will follow the City's Emergency Response Plans and WSRP. Violation of the regulations and restrictions on water use set forth in the “No Water Waste” Ordinance Other (Privately Owned) Water Supplies Capturing rainwater in rain barrels and/or cisterns is one way for the City’s community to save and store water while reducing their use of the City’s water supply.
Figure 8.2: Rainfall Cistern in Santa Monica The City offers a landscape rebate ranging from $200 to $2,000 to any single-family or business that installs a barrel or cistern for harvesting rainwater on their property providing they adhere to the terms of the Rainwater Harvesting Program. 8.5 EXISTING CITY POLICIES ON CLIMATE CHANGE Addressing climate change by minimizing the City’s impact on the environment has been a priority of the City for the past 20 years. Since 1994, the year the City adopted the Sustainable City Plan, the City has been
committed to demonstrating leadership in the practice of sustainability. For instance, the City of Santa Monica was the first city in the U.S. to buy green power, 100 percent renewable energy, for all of its municipal electricity needs.
Figure 8.3: Santa Monica’s Eco-Friendly Fleet
As a guiding principle of the Sustainable City Plan, the notion of sustainability directs existing City policy. The City takes into account any possible long-term impacts a policy choice or program may have to ensure the sustainability of its community. In February 2013, the City published its 15x15 Climate Action Plan, which identifies 15 measures to reduce community greenhouse gas emissions 15 percent below 1990 levels by 2015. The 15 measures are summarized as follows:
1. Increase energy efficiency of new buildings.
2. Reduce energy use in existing buildings.
3. Increase citywide solar capacity. 4. Divert 80 percent of waste from
landfills. 5. Reduce daily vehicle miles traveled
within the City by 13,000.
DRAFT
2015 CITY OF SANTA MONICA URBAN WATER MANAGEMENT PLAN
7 - 4 2015 URBAN WATER MANAGEMENT PLAN SECTION 7: CONTINGENCY PLANNING
6. Increase biking and walking mode share to 15 percent.
7. Expand the support electric vehicle technology.
8. Create vibrant mixed use villages. 9. Expand the number of trees in the
urban forest. 10. Reduce water demand by 200,000
gallons per day. 11. Reduce consumption of carbon
intensive foods. 12. Increase the production and
consumption of local food.
13. Reduce municipal greenhouse gas emissions (Figure 8.3 below)
14. Monitor greenhouse gas emissions. 15. Adapt to the effects of climate
change. An Implementation Update detailing the results of the 15x15 Climate Action Plan was developed in November 2014. The Climate Action Plan was implemented through 2015 and is scheduled to be evaluated by mid-2016.
DRAFT
CITY OF SANTA MONICA URBAN WATER MANAGEMENT PLAN 2015
2015 URBAN WATER MANAGEMENT PLAN SECTION 7: CONTINGENCY PLANNING
7 - 5
This Page Left Blank Intentionally
DRAFT
Appendix A: References
City of Santa Monica 2015 Urban Water Management Plan
Appendix B: UWMP Act
City of Santa Monica 2015 Urban Water Management Plan
Appendix C: DWR Checklist
City of Santa Monica 2015 Urban Water Management Plan

Appendix D: City Council Resolution Adopting 2015 WMP
City of Santa Monica 2015 Urban Water Management Plan

Appendix E: CUWCC Reports (2011-2015)
City of Santa Monica 2015 Urban Water Management Plan

Appendix F: Sustainable City Plan
City of Santa Monica 2015 Urban Water Management Plan

Appendix G: Water Shortage Response Plan
City of Santa Monica 2015 Urban Water Management Plan

Appendix H: Water Efficient Landscape & Irrigation Standards
City of Santa Monica 2015 Urban Water Management Plan

Appendix I: MWD RUWMP Sections II & IV
City of Santa Monica 2015 Urban Water Management Plan
Appendix J: Public Notification
City of Santa Monica 2015 Urban Water Management Plan
Appendix K: Groundwater Management Plan (Sustainable Water Master Plan?)
City of Santa Monica 2015 Urban Water Management Plan
Appendix L: Baseline & Compliance (2020) Per Capita Analysis
City of Santa Monica 2015 Urban Water Management Plan
Appendix M: Minutes of the May XX 2016 Task Force on the Environment
City of Santa Monica 2015 Urban Water Management Plan
Appendix N: Comments from the June XX 2016 Public Hearing on the 2015 UWMP
City of Santa Monica 2015 Urban Water Management Plan
Appendix O: Written & Phoned Comments on the 2015 UWMP
City of Santa Monica 2015 Urban Water Management Plan