Embed Size (px)
Citation preview

Algebra
Ups andDowns
TEACHER’S GUIDE

Mathematics in Context is a comprehensive curriculum for the middle grades.It was developed in 1991 through 1997 in collaboration with theWisconsin Centerfor Education Research, School of Education, University ofWisconsin-Madison andthe Freudenthal Institute at the University of Utrecht, The Netherlands, with thesupport of the National Science Foundation Grant No. 9054928.
The revision of the curriculum was carried out in 2003 through 2005, with thesupport of the National Science Foundation Grant No. ESI 0137414.
National Science FoundationOpinions expressed are those of the authorsand not necessarily those of the Foundation.
© 2010 Encyclopædia Britannica, Inc. Britannica, Encyclopædia Britannica, thethistle logo, Mathematics in Context, and the Mathematics in Context logo areregistered trademarks of Encyclopædia Britannica, Inc.
All rights reserved.
No part of this work may be reproduced or utilized in any form or by any means,electronic or mechanical, including photocopying, recording or by any informationstorage or retrieval system, without permission in writing from the publisher.
International Standard Book Number 978-1-59339-971-9
Printed in the United States of America
1 2 3 4 5 13 12 11 10 09
Abels, M., de Jong, J. A., Dekker, T., Meyer, M. R., Shew, J. A., Burrill, G., &Simon, A. N. (2010). Ups and downs. InWisconsin Center for Education Research& Freudenthal Institute (Eds.), Mathematics in context. Chicago: EncyclopædiaBritannica, Inc.
The Teacher’s Guide for this unit was prepared by David C.Webb, BrynaRappaport, Truus Dekker, and Dédé de Haan.

The Mathematics in Context Development TeamDevelopment 1991–1997
The initial version of Ups and Downs was developed by Mieke Abels and Jan Auke de Jong. It was adapted for use in American schools by Margaret R. Meyer, Julia A. Shew, Gail Burrill, and Aaron N. Simon.
Wisconsin Center for Education Freudenthal Institute StaffResearch Staff
Thomas A. Romberg Joan Daniels Pedro Jan de LangeDirector Assistant to the Director Director
Gail Burrill Margaret R. Meyer Els Feijs Martin van ReeuwijkCoordinator Coordinator Coordinator Coordinator
Project Staff
Jonathan Brendefur Sherian Foster Mieke Abels Jansie NiehausLaura Brinker James A, Middleton Nina Boswinkel Nanda QuerelleJames Browne Jasmina Milinkovic Frans van Galen Anton RoodhardtJack Burrill Margaret A. Pligge Koeno Gravemeijer Leen StreeflandRose Byrd Mary C. Shafer Marja van den Heuvel-PanhuizenPeter Christiansen Julia A. Shew Jan Auke de Jong Adri TreffersBarbara Clarke Aaron N. Simon Vincent Jonker Monica WijersDoug Clarke Marvin Smith Ronald Keijzer Astrid de WildBeth R. Cole Stephanie Z. Smith Martin KindtFae Dremock Mary S. SpenceMary Ann Fix
Revision 2003–2005
The revised version of Ups and Downs was developed by Truus Dekker and Mieke Abels. It was adapted for use in American schools by Gail Burrill.
Wisconsin Center for Education Freudenthal Institute StaffResearch Staff
Thomas A. Romberg David C. Webb Jan de Lange Truus DekkerDirector Coordinator Director Coordinator
Gail Burrill Margaret A. Pligge Mieke Abels Monica WijersEditorial Coordinator Editorial Coordinator Content Coordinator Content Coordinator
Project Staff
Sarah Ailts Margaret R. Meyer Arthur Bakker Nathalie KuijpersBeth R. Cole Anne Park Peter Boon Huub Nilwik Erin Hazlett Bryna Rappaport Els Feijs Sonia PalhaTeri Hedges Kathleen A. Steele Dédé de Haan Nanda QuerelleKaren Hoiberg Ana C. Stephens Martin Kindt Martin van ReeuwijkCarrie Johnson Candace UlmerJean Krusi Jill VettrusElaine McGrath

Cover photo credits: (all) © Corbis
Illustrationsxi (top), xviii (bottom) Christine McCabe/ ©Encyclopædia Britannica,Inc.; 1 Holly Cooper-Olds; 1T Christine McCabe/ ©EncyclopædiaBritannica, Inc.; 13Holly Cooper-Olds; 18, 19 (bottom), 22Megan Abrams/© Encyclopædia Britannica, Inc.; 35 Holly Cooper-Olds
Photographsxvii PhotoDisc/Getty Images; xviii (all) Victoria Smith/HRW;4 Sam Dudgeon/HRW; 7 (middle left) © PhotoDisc/Getty Images; (middleright) © Jack Hollingsworth/PhotoDisc/Getty Images; (bottom) © Corbis;8 © ImageState; 14 © Stephanie Pilick/AFP/Getty Images; 17 StephanieFriedman/HRW; 27 John Bortniak, NOAA; 29 © Kenneth Mantai/VisualsUnlimited; 31 (top) Peter Van Steen/HRW Photo; (bottom) CDC;37 © Corbis; 38 Dynamic Graphics Group/Creatas/Alamy; 39 © Corbis;43Victoria Smith/HRW; 44 Sam Dudgeon/HRW Photo; 48 (left to right) ©Corbis; © Digital Vision/Getty Images

Contents
Ups and Downs v
OverviewNCTM Principles and Standards for School Mathematics viiMath in the Unit viiiAlgebra Strand: An Overview xStudent Assessment in Mathematics in Context xivGoals and Assessment xviMaterials Preparation xviii
Student Material and Teaching NotesStudent Book Table of ContentsLetter to the Student
Section Trendy GraphsSection Overview 1AWooden Graphs: Making Estimations Using Proportional Reasoning 1Totem Pole: Making and Reading Diagrams 3Growing Up: Making Line Graphs 4Growth Charts: Interpreting Graphs 6Water for the Desert: Making Predictions; Reading Graphs 7Sunflowers: Determining Linear and Nonlinear Relationships 8Summary 10Check Your Work 11
Section Linear PatternsSection Overview 13AThe Marathon: Creating Graphs Using Proportional Reasoning 13What’s Next? Making and Using Line Graphs 15Hair and Nails: Writing Formulas; Making Predictions Using
Proportional Reasoning 17Renting a Motorcycle: Using Formulas to Compare Pricing 18Summary 20Check Your Work 21
Section Differences in GrowthSection Overview 23ALeaf Area: Writing Formulas; Estimating Surface Area 23Area Differences: Translating Among Different Mathematical
Representations; Identifying Patterns 24Water Lily: Translating Among Different Mathematical Representations;
Comparing Linear and Quadratic Models 27
C
B
A

vi Ups and Downs Contents
Contents
Aquatic Weeds: Translating Among Different Mathematical Representations; Analyzing Exponential Growth Patterns 29
Double Trouble: Writing Formulas to Model Exponential Growth 30Summary 32Check Your Work 33
Section CyclesSection Overview 35AFishing: Modeling Changes Using Graphs 35High Tide, Low Tide: Interpreting Graphs 36Golden Gate Bridge: Making and Interpreting Graphs 37The Air Conditioner: Interpreting Periodic Graphs 38Blood Pressure: Recognizing and Interpreting Periodic Graphs 38The Racetrack: Making and Identifying Graphs 39Summary 40Check Your Work 40
Section Half and Half AgainSection Overview 43AFifty Percent Off: Analyzing Exponential Decay Patterns 43Medicine: Translating Among Different Mathematical Representations;
Exploring Half-Life 44Summary 46Check Your Work 46
Additional Practice 47
Assessment and SolutionsAssessment Overview 52Quiz 1 54Quiz 2 56Unit Test 58Quiz 1 Solutions 64Quiz 2 Solutions 65Unit Test Solutions 66
Glossary 70
Blackline MastersLetter to the Family 72Student Activity Sheets 73
E
D

Overview
Ups and Downs and theNCTM Principles andStandards for SchoolMathematics for Grades 6-8The process standards of Problem Solving, Reasoning and Proof,Communication, Connections, and Representation are addressed across allMathematics in Context units.
In addition, this unit specifically addresses the following PSSM contentstandards and expectations:
Algebra
In grades 6–8 all students should:
• represent, analyze, and generalize a variety of patterns with tables, graphs,words, and, when possible, symbolic rules;
• relate and compare different forms of representation for a relationship;
• identify functions as linear or nonlinear and contrast their properties fromtables, graphs, or equations.
• develop an initial conceptual understanding of different uses of variables;
• explore relationships between symbolic expressions and graphs of lines, paying particular attention to the meaning of interceptand slope;
• use symbolic algebra to represent situations and to solve problems, especiallythose that involve linear relationships;
• recognize and generate equivalent forms for simple algebraic expressionsand solve linear equations
• model and solve contextualized problems using various representations, such as graphs, tables, and equations; and.
• use graphs to analyze the nature of changes in quantities in linear relation-ships.
Geometry
In grades 6–8 all students should:
• use geometric models to represent and explain numerical and algebraic relationships; and
• understand relationships among the side lengths and areas of similar objects.
Measurement
In grades 6–8 all students should:
• select and apply techniques and tools to accurately find length and areameasures to appropriate levels of precision;
• develop and use formulas to determine the area of circles; and
• solve problems involving scale factors, using ratio and proportion.
Overview Ups and Downs vii

Overview
viii Ups and Downs Overview
Prior Knowledge
This unit assumes that students have an under-standing of how to:
• use metric measurements;
• create a graph from data in a table;
• find information from a graph;
• describe relationships with direct (word)formulas and NEXT-CURRENT formulas(developed in MiC algebra units Expressionsand Formulas and Building Formulas); and
• relate decimals, fractions, and percents.
Unit Focus
In Ups and Downs, students graph, describe, andanalyze real data about natural phenomena,including data about plant and human growth.
More formal mathematicallanguage is used to describechanges in growth. Studentsare introduced to recursiveand direct formulas as toolsfor investigating linear growth.Additional problems aboutmotorcycle rentals reinforcestudents’ understanding oflinear growth and preparethem for the concepts of slopeand intercept, which are madeexplicit in the unit GraphingEquations.
Students investigate linear and quadratic growthby looking at the tables, graphs, and formulas thatrepresent different types of growth. The relationshipbetween the different representations is stressed.
Situations showing linear growth deal with equalincreases over equal time periods: the first differ-ences in the table are equal. The graph also showsequal increases over equal time periods: the graphis a straight line.
For quadratic relationships, the first differencesare not equal, but the second differences are. Inthe unit Patterns and Figures, the concept of firstand second differences is reviewed.
Students are informally introduced to exponentialgrowth as they examine the growth patterns ofbacteria and weeds. Exponential growth can bemodeled with repeated multiplication, the growthfactor is the ratio between the two numbers foradjoining time periods.
Math in the Unit
�4 �4 �4 �4
Radius (in mm)
Year 1 2 3 4 5
4 8 12 16 20
0
Year
Core Sample of a Tree
Ra
diu
s (
in m
m)
0
10
20
1 2 3 4 5
NEXT� CURRENT � 4
radius � year number � 4
or R � 4Y
�3 �5 �7 �9
�2 �2 �2 �2
�11
Length of Square (in cm)
Surface Area of Square (in cm2)
1
1
2
4
3
9
4
16
5
25
6
36
April 3
Water Level
(in cm)
Sea Level
+80
+60
+40
+20
0
-20
-40
-60
-80
Time
A.M.
1 3 5 7 9 11 1 3 5 7 9 11P.M.

Over the course of the unit, students gain anunderstanding of periodic functions by looking atsuch things as the rise and fall of tides, changes inblood pressure with heartbeats, and the speed of acar on a racetrack. Exponential decay is addressedwithin the context of the absorption of medicinein the blood stream.
When students have finished the unit they will;
• understand formal relationships betweendifferent representations like description inwords, table, equation, and graph.
• Students use more formal mathematical language to describe patterns, like constantrate of change, increasing more and more,and growth factor.
• Students understand and use recursive and direct formulas.
• discern different types of graphs;
• Line graphs representing information occurring over time, like changes in length of a child, changes in plant growth, and growth of a tree. The graphshows a certain trend but you cannot useone formula or equation to describe it.
• Straight line, representing a linear function.
• Periodic graphs.
• Graphs that show exponential growth or decay.
• discern different types of formulas or equations:
• Equations describing a linear relationship:Rate of change is constant.
• Equations describing a quadratic relation-ship: Second differences are equal.
• Informal use of equations for exponentialgrowth or decay. If each value in the tableis found by multiplying by a constantgrowth factor, the growth is exponential.
Week
32100 1 32
Bo
dy T
em
pera
ture
(°C
)
Time
Body Temperature of a Camel
3334353637383940414243
4 A.M. 4 P.M. 4 A.M. 4 P.M. 4 A.M. 4 P.M. 4 A.M. 4 P.M.

Overview
x Ups and Downs Overview
Mathematical Content
The Algebra strand in Mathematics in Contextemphasizes algebra as a language used to studyrelationships among quantities. Students learn to describe these relationships with a variety ofrepresentations and to make connections amongthese representations. The goal is for students tounderstand the use of algebra as a tool to solveproblems that arise in the real world or in the worldof mathematics, where symbolic representationscan be temporarily freed of meaning to bring adeeper understanding of the problem. Studentsmove from preformal to formal strategies to solveproblems, learning to make reasonable choicesabout which algebraic representation, if any, to use.The goals of the units within the Algebra strand arealigned with NCTM’s Principles and Standards forSchool Mathematics.
Algebra Tools and Other Resources
The Algebra Tools Workbook provides materials for additional practice and further exploration ofalgebraic concepts that can be used in conjunctionwith units in the Algebra strand or independentlyfrom individual units. The use of a graphing calculator is optional in the student books. TheTeacher’s Guides provide additional questions ifgraphing calculators are used.
Organization of the Algebra Strand
The theme of change and relationships encom-passes every unit in the Algebra strand. The strandis organized into three substrands: Patterns andRegularities, Restrictions, and Graphing. Note thatunits within a substrand are also connected tounits in other substrands.
Algebra Strand:An Overview
123Patterns
and Figures
AlgebraRules!
ComparingQuantities
BuildingFormulas
Ups andDowns
Operations
GraphingEquations
Expressionsand
Formulas
Level 1
Level 2
Level 3
Alg
ebra
To
ols
Wo
rkb
oo
k
Pathways through the Algebra Strand
(Arrows indicate prerequisite units.)

Overview
Overview Ups and Downs xi
In Building Formulas, students explore direct andrecursive formulas (formulas in which the currentterm is used to calculate the next term) to describepatterns. By looking at the repetition of a basicpattern, students are informally introduced to the distributive property. In Patterns and Figures,students continue to use and formalize the ideasof direct and recursive formulas and work formallywith algebraic expressions, such as 2(n + 1).
In a recursive (or NEXT-CURRENT) formula, thenext number or term in a sequence is found byperforming an operation on the current termaccording to a formula. For many of the sequencesin this unit, the next term is a result of adding orsubtracting a fixed number from the current termof the sequence. Operations with linear expressionsare connected to “Number Strips,” or arithmeticsequences.
Students learn that they can combine sequences byaddition and subtraction. In Patterns and Figures,students also encounter or revisit other mathe-matical topics such as rectangular and triangularnumbers. This unit broadens their mathematicalexperience and makes connections between algebraand geometry.
Patterns and Regularities
In the Patterns and Regularities substrand, studentsexplore and represent patterns to develop anunderstanding of formulas, equations, and expres-sions. The first unit, Expressions and Formulas, usesarrow language and arithmetic trees to representsituations. With these tools, students create and useword formulas that are the precursors to algebraicequations. The problem below shows how studentsuse arrow language to write and solve equationswith a single unknown.
The students use an arrow string to find the heightof a stack of cups.
number⎯
� 1⎯→ ⎯⎯⎯
� 3⎯→ ⎯⎯⎯
� 15⎯→
heightof cups of stack
a. How tall is a stack of ten ofthese cups?
b. Explain what each of the numbers in the arrow string represents.
c. These cups need to be stored in a space 50 cmhigh. How many of these cups can be placed ina stack? Explain how you found your answer.
As problems and calculations become more com-plicated, students adapt arrow language to includemultiplication and division. When dealing with allfour arithmetic operations, students learn aboutthe order of operations and use another new tool—arithmetic trees—to help them organize their workand prioritize their calculations. Finally, studentsbegin to generalize their calculations for specificproblems using word formulas.
frameheight
saddleheight
saddle height (in cm) � inseam (in cm) � 1.08frame height (in cm) � inseam (in cm) � 0.66 � 2
4914
1924 �
� �
29
34
4 � 5n
1
3
5
7
9
11
13
�
rim
hold
base

Overview
xii Ups and Downs Overview
Within such contexts as bartering, students areintroduced to the concept of substitution (exchange)and are encouraged to use symbols to representproblem scenarios. Adding and subtracting relation-ships graphically and multiplying the values of agraph by a number help students develop a senseof operations with expressions.
To solve problems about the combined costs ofvarying quantities of such items as pencils anderasers, students use charts to identify possiblecombinations. They also identify and use the number patterns in these charts to solve problems.
Students’ work with problems involving combina-tions of items is extended as they explore problemsabout shopping. Given two “picture equations” of different quantities of two items and their combined price, students find the price of a singleitem. Next, they informally solve problems involvingthree equations and three variables within thecontext of a restaurant and the food ordered bypeople at different tables.
This context alsoinformally introducesmatrices. At the end of the unit, studentsrevisit these problemscenarios more formally as they use variables and formalequations to representand solve problems.
0 1 2 3 4 5
80
0
1
2
3
4
5
76
Number of Caps
Costs of Combinations
(in dollars)
Nu
mb
er
of
Um
bre
lla
s
TACOORDER
1
2
3
4
5
6
7
8
9
10
SALAD DRINK TOTAL
$ 104
4
2
2
$ 832
2
22
—
—
1311
$93
311
—
—
$80.00
$76.00
In the unit Graphing Equations, linear equationsare solved in an informal and preformal way. Thelast unit, Algebra Rules!, integrates and formalizesthe content of algebra substrands. In this unit, avariety of methods to solve linear equations is usedin a formal way.Connections toother strands arealso formalized.For example, areamodels of algebraicexpressions areused to highlightrelationshipsbetween symbolicrepresentationsand the geometryand measurementstrands. In Algebra Rules!, students also work withquadratic expressions.
The Patterns and Regularities substrand includes aunit that is closely connected to the Number strand,Operations. In this unit, students build on theirinformal understanding of positive and negativenumbers and use these numbers in addition, subtraction, and multiplication. Division of negativenumbers is addressed in Revisiting Numbers andin Algebra Rules!
Restrictions
In the Restrictions substrand, the range of possiblesolutions to the problems is restricted because themathematical descriptions of the problem contextsrequire at least two equations. In ComparingQuantities, students explore informal methods for solving systems of equationsthrough nonroutine, yet realistic, problem situations such as running a school store, renting canoes,and ordering in a
restaurant.
a
a a 2
b ab
ab
b
b 2

Overview
Overview Ups and Downs xiii
In Graphing Equations, students move from locatingpoints using compass directions and bearings tousing graphs and algebraic manipulation to findthe point of intersection of two lines.
Students may use graphing calculators to supporttheir work as they move from studying slope tousing slope to write equations for lines. Visualizingfrogs jumping toward or away from a path helpsstudents develop formal algebraic methods forsolving a system of linear equations. In AlgebraRules!, the relationship between the point of inter-section of two lines (A and B) and the x-interceptof the difference between those two lines (A – B) isexplored. Students also find that parallel lines relateto a system of equations that have no solution.
Graphing
The Graphing substrand, which builds on students’experience with graphs in previous number andstatistics units, begins with Expressions andFormulas where students relate formulas to graphsand read information from a graph.
Operations, which is in the Patterns and Regularitiessubstrand, is also related to the Graphing substrandsince it formally introduces the coordinate system.
In Ups and Downs, students use equations andgraphs to investigate properties of graphs corre-sponding to a variety of relationships: linear, quadratic, and exponential growth as well asgraphs that are periodic.
In Graphing Equations, students explore the equation of a line in slope and y-intercept form.They continuously formalize their knowledge andadopt conventional formal vocabulary and notation,such as origin, quadrant, and x-axis, as well as theordered pairs notation (x, y). In this unit, studentsuse the slope-intercept form of the equation of aline, y = mx + b. Students may use graphing calcu-lators to support their work as they move fromstudying slope to using slope to write equationsfor lines. Students should now be able to recognizelinearity from a graph, a table, and a formula and know the connections between those repre-sentations. In the last unit in the Algebra strand,Algebra Rules!, these concepts are formalized andthe x-intercept is introduced. Adding and subtractingrelationships graphically and multiplying the valuesof a graph by a number help students develop asense of operations with expressions.
April 20
Water Level
(in cm)
Sea Level
+80
+60
+40
+20
0
-20
-40
-60
-80
-100
TimeA.M.
1 3 5 7 9 11 1 3 5 7 9 11P.M.
A + B
A
B
–20
–10
–10 0 10 20 30 50 600
10
20
30
40
50
60
70
y
x
A
A – B
B
40

Overview
xiv Ups and Downs Overview
Level III analysis
Level II connections
Leve
ls o
f Thin
king
Questions P
osedDom
ains of Mathem
atics
Level I reproduction
algebra
geometry
number
statistics &
probability
X
O
easy
difficult
Student Assessment in Mathematics in ContextAs recommended by the NCTM Principles and Standards for SchoolMathematics and research on student learning, classroom assessmentshould be based on evidence drawn from several sources. An assessmentplan for a Mathematics in Context unit may draw from the followingoverlapping sources:
• observation—As students work individually or in groups, watchfor evidence of their understanding of the mathematics.
• interactive responses—Listen closely to how students respond toyour questions and to the responses of other students.
• products—Look for clarity and quality of thought in students’solutions to problems completed in class, homework, extensions,projects, quizzes, and tests.
Assessment Pyramid
When designing a comprehensive assessment program, the assessmenttasks used should be distributed across the following three dimensions:mathematics content, levels of reasoning, and difficulty level. TheAssessment Pyramid, based on Jan de Lange’s theory of assessment, is a model used to suggest how items should be distributed acrossthese three dimensions. Over time, assessment questions should “fill” the pyramid.

Overview
Overview Ups and Downs xv
Levels of Reasoning
Level I questions typically address:
• recall of facts and definitions and
• use of technical skills, tools, and standard algorithms.
As shown in the pyramid, Level I questions are notnecessarily easy. For example, Level I questions mayinvolve complicated computation problems. Ingeneral, Level I questions assess basic knowledgeand procedures that may have been emphasizedduring instruction. The format for this type ofquestion is usually short answer, fill-in, or multiplechoice. On a quiz or test, Level I questions closelyresemble questions that are regularly found in agiven unit substituted with different numbersand/or contexts.
Level II questions require students to:
• integrate information;
• decide which mathematical models or tools touse for a given situation; and
• solve unfamiliar problems in a context, based on the mathematical content of the unit.
Level II questions are typically written to elicit shortor extended responses. Students choose their ownstrategies, use a variety of mathematical models,and explain how they solved a problem.
Level III questions require students to:
• make their own assumptions to solve open-endedproblems;
• analyze, interpret, synthesize, reflect; and
• develop one’s own strategies or mathematicalmodels.
Level III questions are always open-ended problems.Often, more than one answer is possible, and thereis a wide variation in reasoning and explanations.There are limitations to the type of Level III prob-lems that students can be reasonably expected torespond to on time-restricted tests.
The instructional decisions a teacher makes as heor she progresses through a unit may influence thelevel of reasoning required to solve problems. If amethod of problem solving required to solve aLevel III problem is repeatedly emphasized duringinstruction, the level of reasoning required to solvea Level II or III problem may be reduced to recallknowledge, or Level I reasoning. A student who doesnot master a specific algorithm during a unit butsolves a problem correctly using his or her owninvented strategy may demonstrate higher-levelreasoning than a student who memorizes andapplies an algorithm.
The “volume” represented by each level of theAssessment Pyramid serves as a guideline for thedistribution of problems and use of score pointsover the three reasoning levels.
These assessment design principles are usedthroughout Mathematics in Context. The Goalsand Assessment charts that highlight ongoingassessment opportunities—on pages xvi and xviiof each Teacher’s Guide—are organized accordingto levels of reasoning.
In the Lesson Notes section of the Teacher’s Guide,ongoing assessment opportunities are also shownin the Assessment Pyramid icon located at the bottom of the Notes column.
Assessment Pyramid
20a
20ab
Make connections betweensituations and graphs.
Use information aboutincrease and decrease tocreate line graphs

Overview
xvi Ups and Downs Overview
Goals and AssessmentGoals and Assessment
Level I:
Conceptual
and Procedural
Knowledge
Ongoing Unit
Goal Assessment Oppo rtunities Assessment Opportunities
1. Use information Section A p. 5, #12a Quiz 1 #1adabout increase and/or p. 6, #13 Test #1a, 5cdecrease to create line p. 8, #20bgraphs. Section B p. 15, #4, 7
p. 18, #19
2. Identify and describe Section A p. 5, #12ab Quiz 1 #1abcpatterns of increase p. 7, #18 Quiz 2 #2band/or decrease from a p. 8, #20a Test 2abcd, 3abc, 5btable or graph. Section B p. 31, #21
3. Identify Section D p. 38, #9ab Quiz 2 #2acharacteristics of p. 39, #15 Test #4abcperiodic graphs.
4. Identify linear Section C p. 24, #4c Quiz 1 #1cpatterns in tables and p. 25, #5c Test #3abc, 5bcgraphs.
5. Understand and use Section C p. 31, #20 Quiz 2 #1acgrowth factors. Section E p. 45, #10 Test #5a
In the Mathematics in Context curriculum, unit goals, organizedaccording to levels of reasoning described in the Assessment Pyramidon page xiv, relate to the strand goals and the NCTM Principles andStandards for School Mathematics. The Mathematics in Contextcurriculum is designed to help students demonstrate their under-
standing of mathematics in each of thecategories listed below. Ongoing assessmentopportunities are also indicated on theirrespective pages throughout the Teacher’sGuide by an Assessment Pyramid icon.
It is important to note that the attainment of goals in one category is not a prerequisiteto the attainment of those in another category.
In fact, students should progress simultaneously toward several goalsin different categories. The Goals and Assessment table is designed tosupport preparation of an assessment plan.
Overview
Overview Ups and Downs xvii
Level II:
Reasoning,
Communicating,
Thinking, and
Making
Connections
Level III:
Modeling,
Generalizing,
and Non-Routine
Problem Solving
Ongoing Unit
Goal Assessment Opportunities Assessment Opportunities
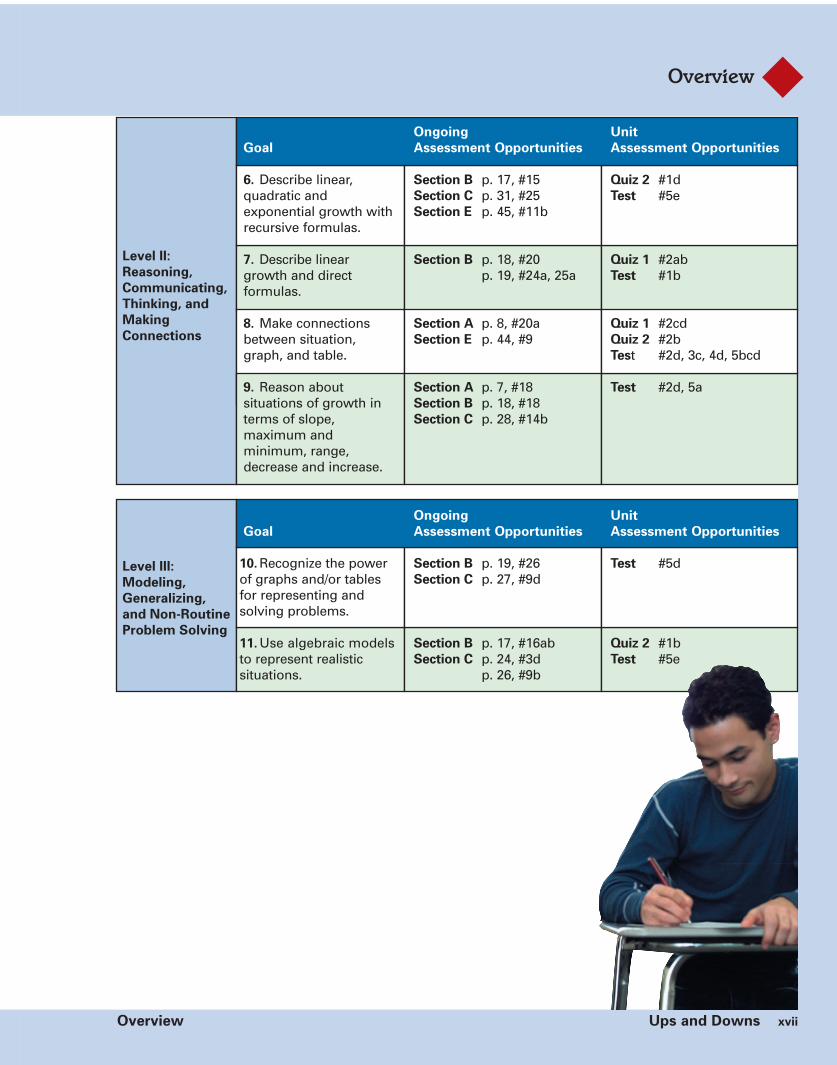
6. Describe linear, Section B p. 17, #15 Quiz 2 #1dquadratic and Section C p. 31, #25 Test #5eexponential growth with Section E p. 45, #11brecursive formulas.
7. Describe linear Section B p. 18, #20 Quiz 1 #2abgrowth and direct p. 19, #24a, 25a Test #1bformulas.
8. Make connections Section A p. 8, #20a Quiz 1 #2cdbetween situation, Section E p. 44, #9 Quiz 2 #2bgraph, and table. Test #2d, 3c, 4d, 5bcd
9. Reason about Section A p. 7, #18 Test #2d, 5asituations of growth in Section B p. 18, #18terms of slope, Section C p. 28, #14bmaximum andminimum, range,decrease and increase.
Ongoing Unit
Goal Assessment Opportunities Assessment Opportunities
10. Recognize the power Section B p. 19, #26 Test #5dof graphs and/or tables Section C p. 27, #9dfor representing andsolving problems.
11. Use algebraic models Section B p. 17, #16ab Quiz 2 #1bto represent realistic Section C p. 24, #3d Test #5esituations. p. 26, #9b

Overview
xviii Ups and Downs Overview
Materials PreparationThe following items are the necessary materialsand resources to be used by the teacher and stu-dents throughout the unit. For further details, seethe Section Overviews and the Materials part ofthe Hints and Comments section at the top of eachteacher page. Note: Some contexts and problemscan be enhanced through the use of optionalmaterials. These optional materials are listed inthe corresponding Hints and Comments section.
Student Resources
Quantities listed are per student.
• Letter to the Family
• Student Activity Sheets 1–11
Teacher Resources
No resources required.
Student Materials
Quantities listed are per pair of students, unlessotherwise noted.
• Calculator
• Centimeter ruler
• Colored pencils, one box
• Compass
• Graph paper (12 sheets per student)
• Scissors
Materials Preparation
10 20 301 2 4 6 8 12 14 16 18 22 24 26 283 5 7 9 11 13 15 17 19 21 23 25 27 29

Overview Ups and Downs xix
StudentMaterial
andTeaching
Notes
StudentMaterial
andTeaching
Notes

Teachers Matter
v Ups and Downs Teachers Matter
ContentsLetter to the Student vi
Section A Trendy GraphsWooden Graphs 1Totem Pole 3Growing Up 4Growth Charts 6Water for the Desert 7Sunflowers 8Summary 10Check Your Work 11
Section B Linear PatternsThe Marathon 13What’s Next? 15Hair and Nails 17Renting a Motorcycle 18Summary 20Check Your Work 21
Section C Differences in GrowthLeaf Area 23Area Differences 24Water Lily 27Aquatic Weeds 29Double Trouble 30Summary 32Check Your Work 33
Section D CyclesFishing 35High Tide, Low Tide 36Golden Gate Bridge 37The Air Conditioner 38Blood Pressure 38The Racetrack 39Summary 40Check Your Work 40
Section E Half and Half AgainFifty Percent Off 43Medicine 44Summary 46Check Your Work 46
Additional Practice 47
Answers to Check Your Work 52
1910
1911
1912
1913
1914
1910 1911 1912 1913 1914
5
15
25
Rin
g T
hic
kn
ess
( in
mm
)
Year

Teachers Matter
Teachers Matter vT
Dear Student,
Welcome to Ups and Downs. In this unit, you will look at situationsthat change over time, such as blood pressure or the tides of anocean. You will learn to represent these changes using tables,graphs, and formulas.
Graphs of temperatures and tides show up-and-down movement,but some graphs, such as graphs for tree growth or melting ice,show only upward or only downward movement.
As you become more familiar with graphs and the changes that they represent, you will begin to notice and understand graphs in newspapers, magazines, and advertisements.
During the next few weeks, look for graphs and statements aboutgrowth, such as “Fast-growing waterweeds in lakes become aproblem.” Bring to class interesting graphs and newspaper articlesand discuss them.
Telling a story with a graph can help you understand the story.
Sincerely,
TThe MMathematics iin CContext DDevelopment TTeam
April 20
Water Level
(in cm)
Sea Level
+80
+60
+40
+20
0
-20
-40
-60
-80
-100
TimeA.M.
1 3 5 7 9 11 1 3 5 7 9 11P.M.

1A Ups and Downs Teachers Matter
Teachers MatterA
Section Focus
Students investigate growth over time within a variety of contexts usingstatements (stories), tables, and graphs. They create and use line graphsto represent continuous processes that occur over time. Students describegrowth patterns in their own words, using expressions such as “fasterand faster” or “increased every week by equal amounts.” Lines are usedto connect data so that a trend becomes visible. The formal term lineargrowth is used. The instructional focus of Section A is to:
• identify and describe growth patterns from a story, table, or graph;
• create line graphs from data in a table; and
• solve problems involving growth patterns.
Pacing and Planning
Day 1: Wooden Graphs Student pages 1–4
INTRODUCTION Problems 1–5 Use tree rings in the cross section of atree to estimate its age.
CLASSWORK Problems 6–8 Compare the cross sections of treestumps to determine their relative ageand when they were cut down.
HOMEWORK Problems 9–11 Interpret a series of marks on a doorevery year to indicate the height of aperson.
Day 2: Growing Up Student pages 5–7
INTRODUCTION Review homework. Review homework from Day 1.
CLASSWORK Problems 12–17 Graph the weight and length of a babyover the first 36 months of life.
HOMEWORK Problem 18 Interpret patterns of decrease from atable.
Day 3: Water for the Desert Student pages 7–12
INTRODUCTION Review homework. Review homework from Day 2.
CLASSWORK Problems 19–23 Match tables, graphs, and stories thatdescribe the growth of sunflowers.
HOMEWORK Check Your Work Student self-assessment: Graph andinterpret growth patterns.
Additional Resources: Algebra Tools; Additional Practice, Section A, pages 47–49

Teachers Matter Section A: Trendy Graphs 1B
Teachers Matter A
Materials
Student Resources
Quantities listed are per student.
• Letter to the Family
• Student Activity Sheets 1–4
Teachers Resources
No resources required.
Student Materials
Quantities listed are per pair of students, unlessotherwise noted.
• Centimeter ruler
• Compass
• Graph paper (three sheets per student)
• Scissors
* See Hints and Comments for optional materials.
Learning LinesDiscern Different Types of Graphs
This section focuses on growth patterns, shown ina variety of graphs:
• a diagram of the thickness of rings of a tree;
• a line graph representing a child’s growth over anumber of years;
• growth curves representing average growth of achild over a number of months;
• a straight line representing linear growth; and
• curved lines, showing a growth pattern thatbecomes “faster and faster” or “less and less.”
Different Representations for A Relationship
Students use tables to identify patterns. Theyinterpret growth patterns by looking at the graphand are introduced to the concept of differentrates of increase (or decrease). By relating growthpatterns to graphical representations, studentsrecognize the faster the growth, the steeper thegraph. They use the tables and graphs to predictfuture growth and make connections betweensituation, graph, and table.
At the End of This Section; LearningOutcomes
Students are able to write a story to describegrowth patterns in a table or graph, and recognizethe power of graphs and/or tables for representingand solving problems. Students begin to identifyand describe patterns of increase or decrease andreason about the situations in which they occur.

Notes
You may want to have ashort class discussionabout sequoia trees,focusing on the diameter of the trunks. Ask studentswhether they have seen orheard of these trees.
1 You may want to brieflydiscuss the differencebetween circumferenceand diameter afterstudents have revealedtheir understanding of thetwo terms.
2 Discuss why the rings,not the lines, need to becounted.
Trendy Graphs
A
Intervention
Students who count 16 years are referring to the magnified portion of thetree rings and should be redirected to count the rings in the complete crosssection. If students have difficulty seeing that they need to count the ringsand not the lines, you might ask students to draw a cross section of a treewith four rings and then color one of the rings.
Act It Out
After solving the problem, have a group of 16 students form a circle withtheir arms extended out to the sides so that they can get a better sense ofthe magnitude of the circumference of this tree.
Reaching All Learners
ATrendy Graphs
Wooden Graphs
Giant sequoia trees grow in Sequoia National Park in California.The largest tree in the park is thought to be between 3,000 and4,000 years old.
It takes 16 children holding hands to reach around the giant sequoia shown here.
1. Find a way to estimate the circumference and diameter of this tree.
This is a drawing of a cross section of a tree. Noticeits distinct ring pattern. The bark is the dark part onthe outside. During each year of growth, a new layerof cells is added to the older wood. Each layer formsa ring. The distance between the dark rings showshow much the tree grew that year.
2. Look at the cross section of the tree. Estimate theage of this tree. How did you find your answer?
Take a closer look at the cross section. The picturebelow the cross section shows a magnified portion.
3. a. Looking at the magnified portion, how canyou tell that this tree did not grow the sameamount each year?
b. Reflect What are some possible reasons forthe tree’s uneven growth?
1 Ups and Downs

Section A: Trendy Graphs 1T
Hints and CommentsMaterialscentimeter rulers (one per student); paper strips, (optional, one per group of students); measuring tape (optional, one per group of students)
Overview
Students estimate the circumference and diameter ofa giant sequoia tree shown in the picture on StudentBook page 1. They use a cross section of a tree toestimate the age of the tree.
About the Mathematics
To solve problem 1, students can use the experiencesand knowledge they have acquired in previous unitsor in previous grades.
• A person’s arm span measures about the same ashis or her height. The historic word for arm spanis fathom.
• The diameter is the length of a straight linethrough the center of a circle. The circumferenceis the perimeter of a circle. These concepts wereintroduced in the unit Reallotment.
• Sizes of pictured objects can be estimated usingthe standard sizes of familiar things that appearnear the object in question.
• The constancy of the ratio between circumferenceand diameter is a bit more than three (somestudents may remember it as pi, π). This is one ofthe concepts studied in Reallotment.
Looking at the thickness of the rings of a cross sectionof a tree shows how much the radius of the treeincreased each year. The study of the thickness of therings will develop students’ understanding of differentrates of increase, which is one of the main topics ofthis unit.
Comments About the Solutions
1. To suggest the relationship between arm span and height, you may want to reference Leonardoda Vinci’s 1492 sketch, Vitruvian Man.
Solutions and Samples
1. Estimates and strategies will vary. Sampleresponse:
When you hold your arms out horizontally, thedistance between the fingertips of your left andright hands is approximately the same as yourheight, measured from head to toe.
If you assume that these children are about 1.5 mtall, then the circumference will be about 16 � 1.5� 24 m. Use the relationship betweencircumference and diameter. The diameter can befound by calculating 24m � π � 7.6 m.
2. Sample response:
About 26 or 27 years. I found my answer bycounting the rings.
3. a. Some students may say that the rings havedifferent widths.
b. Sample responses:
• lack of water
• a long, cold winter
• a spring frost
• a disease

Notes
It is important thatstudents know that ringsgrow on the outside ratherthan from the inside.
5 As a hint, discusswhether you can match upany one year easily. (Thethinnest ring is easiest tosee on both trees.)
Trendy Graphs
A
Extension
Ask one student to bring in a cross section of a tree to count rings with therest of the class.
Reaching All Learners
Tree growth is directly related to the amount of moisture supplied. Lookat the cross section on page 1 again. Notice that one of the rings is verynarrow.
4. a. What conclusion can you draw about the rainfall during theyear that produced the narrow ring?
b. How old was the tree that year?
The oldest known living tree is a bristlecone pine (Pinus aristata)named Methuselah. Methuselah is about 4,700 years old and growsin the White Mountains of California.
Trendy GraphsA
It isn’t necessary to cut down a tree in order toexamine the pattern of rings. Scientists use atechnique called coring to take a look at therings of a living tree. They use a special drill toremove a piece of wood from the center of thetree. This piece of wood is about the thicknessof a drinking straw and is called a core sample.The growth rings show up as lines on the coresample.
By matching the ring patterns from a living treewith those of ancient trees, scientists can create a calendar of tree growth in a certain area.
The picture below shows how two core samplesare matched up. Core sample B is from a livingtree. Core sample A is from a tree that was cut down in the same area. Matching the twosamples in this way produces a “calendar” ofwood.
5. In what year was the tree represented bycore sample A cut down?
A
B
19
60
19
70
19
80
19
90
2 Ups and Downs

Section A: Trendy Graphs 2T
Hints and CommentsOverview
Students use a cross section of a tree to estimate theage of the tree and to draw conclusions about thetree’s growth. They learn how rings of living trees canbe investigated by taking a core sample. They readabout the strategy of matching core samples to createa calendar of tree growth.
Planning
Students may work in pairs or small groups onproblems 3–5. After they finish these problems, youmight have a short class discussion on the meaning ofthe thickness of the rings. Be sure studentsunderstand why it is possible to compare the coresamples taken from different trees by matching thelines.
Solutions and Samples
4. a. Sample response:
The tree didn’t grow very much that year,so perhaps there was not much rain.
b. The tree was about 19 years old.
5. 1973

Notes
Ask students how theywould figure out whatperiod of time sample Cwould represent.
6 Have students shadeevery tenth year for ease incounting.
Have students cut out onlysample C and then match itto samples A and B.
Trendy Graphs
A
Intervention
Suggest that students look for similar patterns in samples B and C and linethem up. As a hint, ask students if they can match up any one year easily.(The thinnest ring is the easiest to see.)
Reaching All Learners
ATrendy Graphs
1910
1911
1912
1913
1914
1910 1911 1912 1913 1914
5
15
25
Rin
g T
hic
kn
ess
( in
mm
)
Year
The next picture shows a core sample from another tree that was cut down. If you match this one to the other samples, the calendarbecomes even longer. Enlarged versions of the three strips can befound on Student Activity Sheet 1.
6. What period of time is represented by the three core samples?
Instead of working with the actual core samples or drawings of core samples, scientists transfer the information from the core samplesonto a diagram like this one.
7. About how thick was the ring in 1910?
Tracy found a totem pole in the woods behind her house. It had fallenover, so Tracy could see the growth rings on the bottom of the pole.She wondered when the tree from which it was made was cut down.
C
Totem Pole
3 Ups and Downs

Section A: Trendy Graphs 3T
Hints and CommentsMaterialsStudent Activity Sheet 1 (one per student); scissors (one pair per student)
Overview
Students match three core samples in order to findout what period of time the calendar of woodrepresents.
About the Mathematics
A diagram that shows the annual increase in theradius of a tree can be used to reconstruct the crosssection of the tree. The diagram also can be used toconstruct a graph that shows the total radius of thetree over time. Note that if you want to have a graphthat shows the growth of the diameter over time, youcan double the measurements of the radius to get thediameter.
Planning
Students may work on problems 6 and 7 in pairs orsmall groups. After students finish the problems, youmay want to discuss them in class. After you discussproblem 6 in class, ask students to describe theconnection between the tree rings and the diagram.This connection is investigated further on the next page.
Solutions and Samples
6. The period of time represented by the samplesis from 1919 to 1994.
This is the way the patterns match. Note: Each dot marks the beginning of a new decade.
7. About six millimeters (mm) or 0.6 centimeters(cm). Accept answers between five and seven mm.
A
19
60
19
70
19
80
19
90
B
C

Notes
You may want to introducethe context about Marsha’sgrowth by talking aboutsimilarities between thisand the previous context.Ask students questions like,What is the average heightof a door? Does a child growwith the same rate ofchange every year? What isthe average length of a babyafter its birth (in Americanmeasurements as well ascentimeters)? How do thecore samples and the doormarks relate?
9–11 Check and discussstudents’ solutions forproblems 9–11.
Trendy Graphs
A
Intervention
If students are having difficulties, refer them to the drawing in problem 7on the previous page to review how a diagram can be constructed from across section.
Extension
Have students find various designs for totem poles on the Internet.
Reaching All Learners
Trendy GraphsA
Tracy asked her friend Luis, who studies plants and trees in college, ifhe could help her find the age of the wood. He gave her the diagrampictured below, which shows how cedar trees that were used to maketotem poles grew in their area.
8. a. Make a similar diagram of the thickness of the rings of thetotem pole that Tracy found.
b. Using the diagram above, can you find the age of the totempole? What year was the tree cut down?
On Marsha’s birthday, her father marked herheight on her bedroom door. He did thisevery year from her first birthday until shewas 19 years old.
9. There are only 16 marks. Can youexplain this?
10. How old was Marsha when her growthslowed considerably?
11. Where would you put a mark to showMarsha’s height at birth?
5101520
Th
ick
ne
ss o
f R
ing
s1915 1920 1930 1940
Year(i
n m
m)
Growing Up
4 Ups and Downs

Section A: Trendy Graphs 4T
Hints and CommentsMaterialsmillimeter graph paper (optional, one sheet perstudent);centimeter rulers (one per student)
Overview
Students use a diagram to date a wooden totem pole.They interpret marks that are put on a door every yearto indicate the height of a person.
About the Mathematics
The marks on the door are similar to the core sampleof a tree: the distances between the lines show theyearly increase, or the rate of growth per year.
Planning
Students may work in pairs or in small groups onproblem 8.
Comments About the Problems
8. a. Observe students measuring the thickness ofthe rings in millimeters. Students should knowthat if they want to measure the thickness ofthe rings precisely, they have to measure alongthe diameter of the circle. Students may wantto use graph paper for drawing the diagram.
b. Wood is usually allowed to dry a few yearsbefore it is carved. So the totem could havebeen made as early as 1937 but probably wasmade sometime after that year.
11. One way to think about this problem is to use thedoorknob as a point of reference. A doorknob isabout 1 m from the floor. Imagine that a newbornbaby would be about half that length, or 50 cm.So you would put a mark halfway between thedoorknob and the floor.
Solutions and Samples
8. a.
Note: This diagram shows differences in growthfrom one year to the next. These differences arenot equal. In the next section, where we look atlinear patterns, the differences from one step tothe next are equal.
b. The graph matches the period from 1933 to1937 in Luis’s diagram, so the tree was cutdown in 1937, and the totem pole was madesometime after that. Assuming that 2005 is thecurrent year, the totem pole would be about 68years old.
9. She stopped growing at age 16. Another less likelyreason is that she stopped growing from one yearto the next.
10. Answers will vary. Some students may say age 13because her growth slowed when she was 13 (thegrowth from age 13 to age 14 is less than age 12 toage 13). Other students may say age 14 becauseshe grew half the amount of the year before, andthe marks after age 14 are very close.
11. Answers will vary. A good estimate would be abouthalfway between the floor and the first mark. Somestudents may use their own birth length as anestimate. Many newborns average 55 cm, or 21 in.,in length. All students should see that the newbornmark should at least be below the 1-year mark.
1
5
10
15
20
2 3
Year
4 5
Th
ick
ne
ss o
f R
ing
s
(in
mm
)

Notes
This problem is criticalbecause it is the first timein the unit that studentsconstruct a graph.
Be sure to relate the markson the door, shown on theleft margin of the graph, to the scale on the verticalaxis.
When students havefinished, draw the graph of Marsha’s growth on atransparency and discussthese problems in class.Students should realizethat it is easier to project a growth pattern forward or backward in time whenyou have a graph.
Whenever something isgraphed “over time,” thevariable representing timeshould be placed on thehorizontal axis.
Trendy Graphs
A
Intervention
You might need to point out to students that the points marked “1,” “2,”and “3” on the graph represent years of age
Parent Involvement
Have students find their birth length and height on a birth certificate orother similar records. Have them work with their parents to make a graphof their heights at select ages (from medical records or door markings).If their height information is not readily available, encourage them tomake reasonable estimates.
Reaching All Learners
ATrendy Graphs
12. a. Use Student Activity Sheet 2 to draw a graph of Marsha’sgrowth. Use the marks on the door to get the vertical coordinates. Marsha’s height was 52 centimeters (cm) at birth.
b. How does the graph show that Marsha’s growth slowed downat a certain age?
c. How does the graph show the year during which she had herbiggest growth spurt?
The graph you made for problem 12 is called a line graph or plot overtime. It represents information occurring over time. If you connect theends of the segments of the graph you made for problem 8 on page 4,you would also see a plot over time of the differences in growth of thetree from one year to the next. These graphs show a certain trend, likehow Marsha has grown or how the tree grew each year. You cannotwrite one formula or equation to describe the growth.
20
30
40
50
60
70
80
90
100
110
120
130
140
150
160
170
180
10
0 1 2 3 4 5 6 7 8 9 10 11 12 13 14 15 16 17 18
1
2
3
( in cm)
Year
Marsha’s Height
Assessment Pyramid
12ab
Use information aboutincrease to create line graphs.
5 Ups and Downs

Section A: Trendy Graphs 5T
Hints and CommentsMaterialsStudent Activity Sheet 2 (one per student);transparency of Student Activity Sheet 2, (optional,one per class); overhead projector (optional, one per class)
Overview
Students use the marks on the door to create a graphthat shows a person’s height over time.
About the Mathematics
Line graphs are created to show how a person’s heightgrows over time. This graph can be used to makeconnections between the differences in growth.For example, a larger distance between two marks onthe door indicates a growth spurt during that period,and the graph for that period is, therefore, steeper.The steepness of a curve over a given period of timelays the foundation for the study of rate of change incalculus.
The dots of a line graph may be connected by asmooth line if the information is derived fromnumbers that are continuous, as depth of water atlow/high tide, etc. A continuous graph does not have“holes” of missing data. If the information is discreteas in snapshots of the time at which runners pass areference point during a race, the dots should not berepresented by a continuous graph. However, the dotsare sometimes connected by small straight lines toshow a trend. These straight lines have no meaning inthemselves.
Planning
Students may work individually on problem 12.You might discuss problem 12 focusing on therelationship between the positions of the marks onthe door and the steepness of the graph.
Solutions and Samples
12. a. Sample graph:
b. The graph starts to level off (starting at age 12).Before that, the graph rises steadily.
c. The biggest growth spurt occurs where thegraph rises most sharply (which is betweenages zero and one).
20
30
40
50
60
70
80
90
100
110
120
130
140
150
160
170
180
10
0 1 2 3 4 5 6 7 8 9 10 11 12 13 14 15 16 17 18
1
2
3
( in cm)
Year
Marsha’s Height

Notes
13 You might havestudents discuss whichanswers are reasonable.Discuss the averageweight and length ofa newborn child incustomary and metricunits.
The curves in the chartsshow the results ofmeasurements of theweights and lengths ofa group of young boys. Thedark line in the center ofeach set of lines is themedian weight or heightfor boys, or the fiftiethpercentile. The bands showthe distributionof the middle 90% ofchildren, from the fifthto the ninety-fifthpercentile.
Ask students, Is “age” on thehorizontal axis of thegrowth charts for a reason?(Yes, it represents time.)
Trendy Graphs
A
Accommodation
The tables and graphs on this page are in metric to motivate students tomake connections between the metric system and measurement units thatthey are more familiar with, for example, inches, feet, and pounds. Somereference points that could be discussed are: 10 kg is about 22 lb; 100 cm isa bit more than 3 ft. If students have difficulty relating the two, the tablevalues and scales on the growth charts could be rewritten using inches andpounds.
Reaching All Learners
Trendy GraphsA
Growth Charts
Weight Growth Chart for Boys
Age: Birth to 36 months
Weig
ht
(in
kg
)
1817161514131211109876543210
Birth 3 6 9 12 15 18 21 24 27 30 33 36
Age (in months)
Height Growth Chart for Boys
Age: Birth to 36 months
105100959085807570656055504540
Heig
ht
(in
cm
)
Age (in months)
Birth 3 6 9 12 15 18 21 24 27 30 33 36
Month Birth 1 2 3 4 5 6 7 8 9 10 11 12 13 14 15
Weight 2.7 3.6 5.7 7.0 7.3 7.8 8.0 8.8 8.8 8.8 9.3 9.6 10.5 10.3 11.3 12.0
Month 16 17 18 19 20 21 22 23 24 25 26 27 28
Weight 12.4 12.9 13.1 12.9 10.5 9.2 9.5 12.0 13.0 13.6 13.5 14.0 14.2
© Am. J. Nutr.American Society for Clinical Nutrition
Healthcare workers use growth charts to help monitor the growth ofchildren up to age three.
13. Why is it important to monitor a child’s growth?
The growth chart below shows the weight records, in kilograms (kg),of a 28-month-old boy.
14. What conclusion can you draw from this table? Do you think thisboy gained weight in a “normal” way?
The graphs that follow show normal ranges for the weights and heightsof young children in one country. The normal growth range is indicatedby curved lines.
Note: The zigzag line on the lower left of the height graph indicatesthat the lower part of the graph, from 0–40, is omitted.
Assessment Pyramid
13
Identify and describepatterns of increase and/ordecrease from a table.
6 Ups and Downs
Section A: Trendy Graphs 6T
Hints and CommentsMaterials
transparencies of the charts on Student Book page 6(optional, one per class); overhead projector (optional, one per class)
OverviewStudents investigate a weight growth chart and a lengthgrowth chart. They compare “normal” growth to theactual measurements of problem 13. They investigatea table showing weight records for a young child frombirth up to the age of 28 months.
About the Mathematics
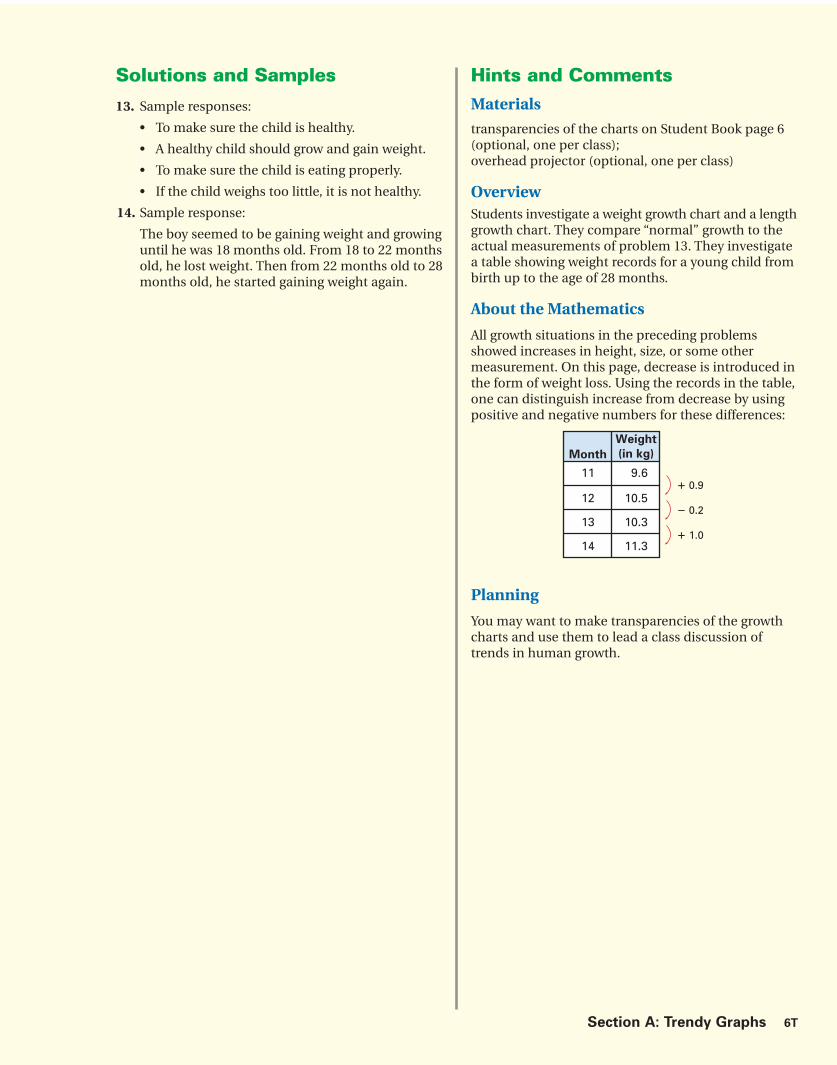
All growth situations in the preceding problemsshowed increases in height, size, or some othermeasurement. On this page, decrease is introduced inthe form of weight loss. Using the records in the table,one can distinguish increase from decrease by usingpositive and negative numbers for these differences:
Planning
You may want to make transparencies of the growthcharts and use them to lead a class discussion oftrends in human growth.
Solutions and Samples
13. Sample responses:
• To make sure the child is healthy.
• A healthy child should grow and gain weight.
• To make sure the child is eating properly.
• If the child weighs too little, it is not healthy.
14. Sample response:
The boy seemed to be gaining weight and growinguntil he was 18 months old. From 18 to 22 monthsold, he lost weight. Then from 22 months old to 28months old, he started gaining weight again.
� 0.911
12
9.6
10.5
13 10.3
14 11.3
� 0.2
� 1.0
Month
Weight
(in kg)

Notes
17a You might point outthat most babies are notweighed every month.
18 During the discussionof student answers, youmay want to point out thatthe seriousness of theweight loss might dependon the child’s height.
Trendy Graphs
A
Intervention
Before having students complete the graph in 17a, have student volunteersmodel on an overhead transparency how to estimate the plotting ofdecimal values on the growth chart.
Vocabulary Building
During class discussion of the growth chart, have some students share theirdefinitions for mean and median. Some students might remember theseterms from the unit Dealing with Data.
Reaching All Learners
ATrendy Graphs
Water for the Desert
15. Describe how the growth of a “normal” boy changes from birthuntil the age of three.
In both graphs, one curved line is thicker than the other two.
16. a. What do these thicker curves indicate?
b. These charts are for boys. How do you think charts for girlswould differ from these?
17. a. Graph the weight records from problem 13 on the weightgrowth chart on Student Activity Sheet 3.
b. Study the graph that you made. What conclusions can youdraw from the graph?
Here are four weekly weight records for two children. The recordsbegan when the children were one year old.
18. Although both children are losing weight, which one would youworry about more? Why?
In many parts of the world, youcan find deserts near the sea. Because there is a water shortagein the desert, you might think thatyou could use the nearby sea as a water source. Unfortunately, seawater contains salt that wouldkill the desert plants.
Week 1 Week 2 Week 3 Week 4
Samantha’s11.8 11.6 11.3 10.9
Weight (in kg)
Hillary’s10.5 10.0 9.7 9.5
Weight (in kg)
Assessment Pyramid
18
18
Reason about situations ofgrowth in terms of slope,range, increase, and decrease.
Identify patterns in graphs.
7 Ups and Downs

Section A: Trendy Graphs 7T
Hints and CommentsMaterials
Student Activity Sheet 3, one per student.
OverviewStudents investigate the weight records of twochildren, presented in two tables. They are thenintroduced to problems in a new context, icebergs asa source of fresh water.
About the Mathematics
Focus on increase and/or decrease in a situationabout growth.
Comments About the Problems
18. Samantha’s weight loss could be considered moreserious because it is more each week than theweek before. Hillary’s weight loss could be moreserious because she weighs less than Samantha.
Solutions and Samples
15. Sample response: During the first six months, a“normal” boy grows fast. After six months, the rateof change differs; the growth slows down. Afterone year, the growth rate slows down again butless than after six months. From 12 months untilage three, the rate of change is almost constant;the boy grows steadily but not as fast as theprevious period.
16. a. The thicker curves show the median weightsand heights for boys. Half of the boys areheavier or taller than the thick line, and half arelighter or shorter.
b. Sample response: Girls are usually shorter atbirth and lighter than boys. The graphs for girlswill start at a lower number and will be more orless parallel to the boys’ graphs.
17. a.
b. Sample response: The baby’s weight gain wasnormal until he was 18 months old. At thispoint he lost weight very fast. Three monthslater, he gained the weight back almost as fast.After that point he seemed to gain weightnormally.
18. Sample responses:
• I would worry about Samantha because sheloses more weight each week than the weekbefore, so she is getting worse all of the time.
• I would worry more about Hillary because sheweighs the least.
• I would not worry as much about Hillary asSamantha because Hillary lost a lot at first butnow is only losing a little bit, so her loss isslowing down.
18171615141312111098765432
3 6 9 12 15 18 21 24 27 30 33 36
Weig
ht
(in
kg
)
Age (in months)
Birth
Weight Growth Chart for Boys
Age: Birth to 36 months

Notes
19 Discuss students’answers to this problem inclass. It will be helpful forstudents to hear how otherstudents describe thegraphs.
20a and b You may find ithelpful to copy and cut outeach of the notes and havestudents reorganize themand paste them on a sheetof paper.
Trendy Graphs
A
Intervention
If students have difficulty completing this problem, be sure to give extraattention to different possible patterns of increase and decrease whendiscussing the section Summary on page 10.
Extension
Over the course of a school day, conduct an ongoing experiment to collectdata on the rate at which ice melts. Take weight measurements of the iceevery 20 minutes. Use different conditions: the shape of the ice (with thesame volume), wind (fan blowing), climate (different locations around theroom), etc. Revisit the data and graphs for each condition the next day andcompare to the graphs for problem 19.
Reaching All Learners
Trendy GraphsA
Some scientists are investigating ways to bring ice from the AntarcticOcean to the desert. The ice from an iceberg is made from fresh water.It is well packed and can be easily pulled by boat. However, there isone problem: The ice would melt during the trip, and the water fromthe melted ice would be lost.
There are different opinions about how the iceberg might melt duringa trip. The three graphs illustrate different opinions.
The graphs are not based on data, but they show possible trends.
19. Reflect Use the graphs to describe, in your own words, what thethree opinions are.
SunflowersRoxanne, Jamal, and Leslie did a group project on sunflowergrowth for their biology class. They investigated how differentgrowing conditions affect plant growth. Each student chose adifferent growing condition.
The students collected data every week for five weeks. At theend of the five weeks, they were supposed to write a groupreport that would include a graph and a story for each of threegrowing conditions.
Unfortunately, when the students put their work together, thepages were scattered, and some were lost. The graphs andwritten reports that were left are shown on the next page.
20. a. Find which graph and written report belong to eachstudent.
b. Create the missing graph.
We
igh
t o
f Ic
e (
in k
g)
70
60
50
40
30
20
10
00 1 2 3 4 5 6 7
Time (in days)
We
igh
t o
f Ic
e (
in k
g)
70
60
50
40
30
20
10
00 1 2 3 4 5 6 7
Time (in days)
We
igh
t o
f Ic
e (
in k
g)
70
60
50
40
30
20
10
00 1 2 3 4 5 6 7
Time (in days)
a b c
Assessment Pyramid
20a
20ab
Make connections betweensituations and graphs.
Use information aboutincrease and decrease tocreate line graphs.
8 Ups and Downs

Section A: Trendy Graphs 8T
Hints and CommentsOverviewStudents explain graphs that show different opinionsabout ways an iceberg might melt. They areintroduced to a new context, growing sunflowers.
About the Mathematics
The rate at which an iceberg melts may depend ondifferent circumstances: the temperature of air andwater, the wind, the movement of the water, and theshape and size of the iceberg. The shape of theiceberg is quite important. A flat iceberg would meltmore quickly than an iceberg with the same volumebut in the shape of a sphere (or a cube) because itssurface area is greater. This can be shown bycomparing a block and a cube with the same volumeas shown below.
volume is 64 cm3 volume is 64 cm3
surface area is 160 cm2 surface area is 96 cm2
Planning
Students may work individually on problem 19.You may want to assign the problem as homework.
Solutions and Samples
19. Descriptions will vary. Sample responses:
Graph a shows a situation in which every daythere will be more of the volume melting than theday before. Or the ice is melting quicker andquicker.
In graph b, the volume decreases by the sameamount every day. Or the rate of change of thedecrease is constant.
Graph c shows that every day there is less icemelting than the day before. Or the ice is meltingslower and slower.
20. a. Roxanne’s report (a) belongs to graph d;Leslie’s report (c) belongs to graph b;Jamal’s graph is missing.
b. Sample table and graph for Jamal. Students’graphs may be different.
10
10
20
30
50
40
2 3
Weeks
4 5
Heig
ht
Weeks 0 1 2 3 4 5
Height 10
� 2 � 5 � 6 �12 � 15
12 17 23 35 50
1 cm8 cm
4 cm
4 cm4 cm

Notes
22b Clarify that all tablesare not ratio tables. In aratio table the ratiobetween the two valuesmust be the same. Discussexamples in the “Aboutthe Mathematics” sectionon page 9T with students.
23b You may want todiscuss the concept of aconstant rate of change,which occurs if growth islinear.
Trendy Graphs
A
Advanced Learners
Have students make up six tables: three that are ratio tables and three thatare not ratio tables. Have them explain the difference between the two setsof tables. You may also have students graph each table to have themdiscover a distinctive feature of graphs for ratio tables. They are lineargraphs that intersect the origin (0, 0).
Vocabulary Building
After completing the Sunflowers activity, have students include a definitionfor linear growth in their notebooks. With their definition, have studentsinclude an example of linear growth represented in a table and a graph.
Reaching All Learners
ATrendy Graphs
The type of growth displayed by Roxanne’s sunflower is called linear growth.
21. Why do you think it is called linear growth?
A plant will hardly ever grow in a linear way all the time, but for someperiod, the growth might be linear. Consider a sunflower that has aheight of 20 cm when you start your observation and grows 1.5 cmper day.
22. a. In your notebook, copy and fill in the table.
b. Meryem thinks this is a ratio table. Is she right? Explain youranswer.
c. How does the table show linear growth?
d. Use your table to draw a graph. Use the vertical axis forheight (in centimeters) and the horizontal axis for time (in days). Label the axes.
Here is a table with data from another sunflower growth experiment.
23. a. How can you be sure that the growth during this period wasnot linear?
b. In your own words, describe the growth of this plant.
Time (in weeks) 0 1 2 3 4 5 6
Height (in cm) 10 12.5 17.5 25 35 47.5
e
Time (in days) 0 1 2 3 4 5 6 7 8
Height (in cm) 20 21.5
I treated my sunflower
very well. It had sun
and good soil, and I even
talked to it. Every week
it grew more than the
week before.Jamal
I put my plant in poor soiland didn’t give it muchwater. It did grow a bit,but less and less everyweek.
Leslie
I planted my sunflower in ashady place. The plant didgrow, but not so fast. Theheight increased every weekby equal amounts.Roxanne
a
b
c
d
e
9 Ups and Downs

Section A: Trendy Graphs 9T
Hints and CommentsOverview
Students match graphs and stories, and recreate themissing graph.
About the Mathematics
Some students may think that these kinds of tablesare always ratio tables. An explanation of how to tellwhether or not a table is a ratio table follows.
This table is a ratio table because the ratio betweentime and height is 1:6. In other words, if you double(triple, etc.) the time, then you get double (triple, etc.)the height. The graph that corresponds to this table isa straight line (starting at the origin).
The relationship between the numbers in thefollowing table is different:
This is not a ratio table. The graph is a straight line,but it doesn’t start at the origin. Linear growthpatterns are investigated further in Section B of thisunit. This problem is an introduction to that section.
Planning
Students may work in pairs or in small groups onproblems 21–23.
Solutions and Samples
21. Sample answers:
• I think the growth is called linear because thegraph is a straight line.
• I think the growth is called linear because thelength increased each week by equal amounts.
22. a.
b. No, this is not a ratio table. The ratio betweentime and height changes throughout the table.The ratio 2 to 23 is about 1:11, but the ratio 8 to 32 is 1:4.
c. Each day, the sunflower grows 1.5 cm. The rateof change in the height for each day isconstant.
d. Graph:
23. a. The height of the sunflower increases by 2.5,5, 7.5, 10, and 12.5 cm, which are not equalamounts. Or the rate of change in the secondrow of the table is not constant.
b. At the start of the experiment, the sunflowerdid not grow very fast, but it started to growfaster soon. After 3 weeks, its height wasalready 2.5 times the original height.
Note: Have students look at the rate of change.This is not constant, but the differences in therates of change are constant (2.5 cm).
� 2
� 2
� 6Time
Height
1
6
2
12
3
18
4
24
Time
Height
1
15
2
20
3
25
4
30
Time (in days)
Height(in cm)
0
20
1
21.5
2
23
3
24.5
4
26
5
27.5
6
29
7
30.5
8
32
33
32
31
30
29
28
27
26
25
24
23
22
21
20
1 2 3 4 5 6 7 8 9
Heig
ht
(cm
)
Time (days)
0
Notes
The Summary for thissection reiterates each ofthe strategies used in thesection. Go through theSummary carefully, havingstudents read parts aloud.It is critical that studentsreview the terminologyused to describe patterns ofincrease and decreasepresented in this section.
Trendy Graphs
A
Parent Involvement
Have parents review the section with their child to relate the Check YourWork problems to the problems from the section.
Extension
During the discussion of the Summary, you might say, Tracy looked at thefirst graph on the left and said, “It’s increasing at first but decreasing towardsthe end.” Ask students whether they agree or disagree with Tracy andexplain why. (The graph is still increasing toward the end, but it isincreasing more slowly.) You might ask a similar question for the graph onthe right.
Reaching All Learners
Trendy GraphsA
Information about growth over time can be obtained by looking at:
• a statement like “My sunflower grew faster and faster.”
• growth “calendars” like the tree rings appearing on a coresample or the height marks made on a door.
• tables like the growth charts used for babies.
• line graphs. The line graphs used in this section show trends.
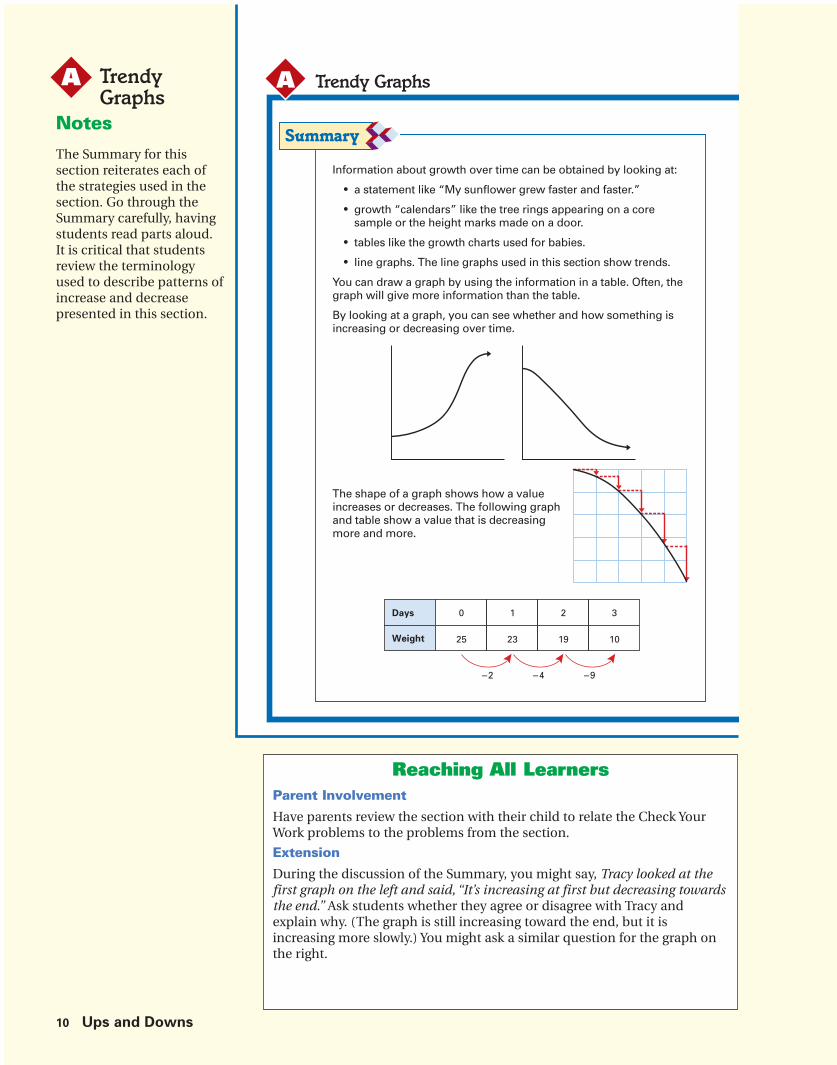
You can draw a graph by using the information in a table. Often, thegraph will give more information than the table.
By looking at a graph, you can see whether and how something isincreasing or decreasing over time.
The shape of a graph shows how a value increases or decreases. The following graph and table show a value that is decreasingmore and more.
0 1 2 3
25 23 19 10
�2 �4 �9
Days
Weight
10 Ups and Downs

Section A: Trendy Graphs 10T
Hints and CommentsOverview
In the Summary, students review how informationabout growth over time can be obtained in differentways: by looking at statements, graphs, tables, coresamples of a tree, or marks on a door post. They seehow the shape of a graph shows that the valuedecreases more and more rapidly over time.
About the Mathematics
When the pattern of increase or decrease isinvestigated, it is important that the differences becalculated for equal time intervals and that the sametime intervals are used in corresponding tables andgraphs.
The dotted lines in the graph at the bottom of theSummary show these time intervals, and the arrowsshow the differences.
Another way to display the differences is by thefollowing diagram.
The lines in the diagram are related to the arrows onthe graph in the Summary, and they point downwardto indicate decreasing values. Although this type ofdiagram was useful at the beginning of this sectionbecause it represented real-world situations, usingit here is probably too abstract for students tounderstand.
0
�
�Dif
fere
nces
Time

Notes
Be sure to go over theCheck Your Work problemswith students so that theylearn whether their answeris correct, even if it doesnot exactly match theanswer given.
1a If students are havingdifficulty drawing circles ormeasuring distances witha compass, you may wantto demonstrate the propertechniques of drawing andmeasuring withcompasses on the board oroverhead.
Trendy Graphs
A
Parent Involvement
Students should share their work on these problems with their parents.Students should be able to show their parents which strategies they usedfor each problem.
Reaching All Learners
This diagram represents the thickness of annual rings of a tree. It shows how much the tree grew each year.
1. a. Use a ruler and a compass to draw a cross section of this tree. The first two rings are shown here. Copy and continue this drawing to show the complete cross section.
b. Write a story that describes how the tree grew.
This table shows Dean’s growth.
2. a. Draw a line graph of Dean’s height on Student Activity Sheet 4.
b. What does this graph show that is not easy to see in the table?
c. At what age did Dean have his biggest growth spurt?
2000
5
15
25
Th
ick
ne
ss o
f R
ing
s
(
in m
m)
2001
Year
2002 2003 2004 2005
2000
2001
Age1 2 3 4 5 6 7 8 9 10 11 12 13 14 15 16 17 18
(in years)
Height80 95 103 109 114 118 124 130 138 144 150 156 161 170 176 181 185 187
(in cm)
Assessment Pyramid
2b
1b, 2a
1a, 2c
Assesses Section A Goals
11 Ups and Downs

Section A: Trendy Graphs 11T
Hints and CommentsMaterialsStudent Activity Sheet 4 (one per student);compass (one per student); centimeter rulers (one per student)
Overview
Students use the Check Your Work problems asself-assessment. The answers to these problems areprovided in the Student Book.
Solutions and SamplesAnswers to Check Your Work
1. a. Note: The figure is not drawn to scale.
b. Your story may differ from the two samplestories below.
First it was planted. It got plenty of sun, air, andwater, and it grew a lot. It grew the second yearbut not as much as the first year. The third andfourth years, the tree grew about the same asthe second year. The fifth year, the tree grewabout the same as the first year. The sixth year,the tree either had a disease or did not getenough sun or water.
I planted this tree in 2000. For the first year,I watered it a lot and took care of it. It was avery pretty tree and grew a lot in the first year.The second, third, and fourth years, I got reallybored with it and stopped watering it. It didn’tgrow much those years. Maybe it grew a coupleof inches but that’s all. In 2004, I decided thatmy tree was very special, and I started to waterit more. It really grew that year. But the nextyear, I got too busy to water it very much, andit grew very little.
2. a.
b. Discuss your answer with a classmate. Sampleanswer:
• From Dean’s second birthday until hissixteenth birthday, he grew very regularly.
• After his sixteenth birthday, Dean’s growthstarted to slow down, but he may still get tallerafter his nineteenth birthday.
c. According to the graph, Dean had his biggestgrowth spurt between his first and secondbirthdays. Dean grew 15 cm that year. But hislength at birth is missing from the graph, somaybe he had his biggest growth spurt during hisfirst year.
200020012002200320042005
70
80
90
100
110
120
130
140
150
160
170
180
0 1 2 3 4 5 6 7 8 9 10 11 12 13 14 15 16 17 18
Year
Dean
’s H
eig
ht
(in
cm
)

Notes
For Further ReflectionThe reflection question ismeant to summarize andextend what students havelearned in the section.
Trendy Graphs
A
Writing Opportunity
Problem 3b would be a good problem to have students write about theadvantages and disadvantages of the different representations: the table,graph, and growth story (which can be told in words or shown in a crosssection drawing).
Reaching All Learners
Trendy Graphs
Mr. Akimo owns a tree nursery. He measures the circumference of the tree trunks to check their growth. One spring, he selected twotrees of different species to study. Both had trunks that measured 2 inches in circumference. For the next two springs, he measured the circumference of both tree trunks. The results are shown in the table.
3. a. Which tree will most likely have the larger circumference whenMr. Akimo measures them again next spring? Explain how yougot your answer.
b. Reflect Do you get better information about the growth of the circumference of these trees by looking at the tables or by looking at the graphs? Explain your answer.
This graph indicates the height of water in a swimming pool from12:00 noon to 1:00 P.M. Write a story that describes why the waterlevels change and at what times. Be specific.
A
Circumference (in inches)
First Second Third
Measurement Measurement Measurement
Tree 1 2.0 3.0 4.9
Tree 2 2.0 5.5 7.1
Time
Heig
ht
of
Wate
r
(in
ft)
12:00
3
3.5
4
4.5
5
12:15 12:30 12:45 1:00
Assessment Pyramid
3b
3a
Assesses Section A Goals
12 Ups and Downs

Section A: Trendy Graphs 12T
For Further Reflection
Answers will vary. Sample solution: On most days thelocal pool opens for swim practice from noon until1 P.M. One group shows up at noon and practices for 45 minutes. Another group shows up at around 12:15and practices for about 40 minutes. As more swimmersget in the pool the water level rises. When everyoneleaves the pool at 1 P.M., the water level drops backdown to 4 feet.
Solutions and Samples
3. a. The first tree will have the larger circumference.You may give an explanation by looking at thetable, or you may make a graph and reasonabout the trend this graph shows.
Sample responses:
• Looking for patterns in the table:The first tree is growing by an increasingamount every year, while the second tree isgrowing by a decreasing amount every year.You can see this in the tables using arrowswith numbers that represent the differences.
• The first tree might grow as much as 4 in,putting it at 8.9 in. The second tree willprobably grow less than 1 in, putting it atabout 8 in. Make two graphs and reasonabout the trend the graphs show.
b. You may prefer either the graph or the table.You might prefer the table because it has theactual numbers, and you can calculate theexact change each year and use those numbersto make a decision. You might prefer the graphbecause you can see the trend in the growth ofeach tree and also the relationship between thetwo trees.
Hints and Comments
OverviewStudents use the Check Your Work problems as self-assessment. The answers to these problems areprovided in the Student Book.
Comments About the Solutions
For problem 3, it is important that students realizethat although they can find a growth pattern, it is notcertain that the same pattern will continue.
1
123456789
2 3 4 5 6 7 8 9 10
Measurement
Cir
cu
mfe
ren
ce (
in in
ch
es)
Growth of Trees 1 and 2
Circumference (in inches)
Tree 1
First
Measurement
Second
Measurement
Third
Measurement
2.0 3.0 4.9
�1.0 in �1.9 in
Circumference (in inches)
Tree 2
First
Measurement
Second
Measurement
Third
Measurement
2.0 5.5 7.1
�3.5 in �1.6 in

13A Ups and Downs Teachers Matter
Teachers MatterB
Section Focus
The situations studied in this section all involve equal increase overequal time periods or a constant rate of growth. This plays an importantrole in making formulas to represent these situations. For students, itis not obvious that all situations investigated in this section can bedescribed by the same mathematical concept of linear growth.It is the focus of this section to recognize and use linear growth bylooking at the differences in a table; looking at the graph, which is astraight line; or looking at the formula that describes the situation.Both recursive (NEXT-CURRENT) and direct formulas are used.
Pacing and Planning
Day 4: The Marathon Student pages 13–16
INTRODUCTION Problem 1 Discuss the physiology of keeping coolwhile running a marathon.
CLASSWORK Problems 2–5 Create and interpret a graph of the bodytemperature of a marathon runner.
HOMEWORK Problems 6–9 Graph the linear growth of the radius ofa tree.
Day 5: What’s Next? (Continued) Student pages 16–18
INTRODUCTION Review homework. Review homework from Day 4.
CLASSWORK Problems 10–17 Write NEXT-CURRENT and direct formulasto represent linear growth of hair.
HOMEWORK Problems 18–20 Graph and write a direct formula to represent linear growth of fingernails.
Day 6: Renting a Motorcycle Student pages 18–22
INTRODUCTION Review homework. Review homework from Day 5.
CLASSWORK Problems 21–26 Graph and write a direct formula to compare the different rates for rentingmotorcycles.
HOMEWORK Check Your Work Student self-assessment: Write recursive and direct formulas for linear growth patterns.

Teachers Matter Section B: Linear Patterns 13B
Teachers Matter B
Materials
Student Resources
Quantities listed are per student.
• Student Activity Sheets 5 and 6
Teachers Resources
No resources required.
Student Materials
Quantities listed are per pair of students.
• Calculator
• Graph paper (one sheet per student)
• Colored pencils, one box
* See Hints and Comments for optional materials.
Learning LinesLinear Relationships
Students investigate linear growth in a variety ofsituations. They identify whether or not the growthis linear and use tables, graphs, and formulas todescribe linear growth. Direct formulas, such asL � 2 � 1.5 � T, are used and interpreted. The firstdifferences in a table of values for a linear formulaare equal for equal periods of time.
first differences
Students solve problems by comparing graphs and formulas involving linear relationships withinthe context of comparing two motorcycle rentalcompanies. They informally identify steepness ofthe graph as represented by the price per mile andthe y-intercept as the fixed starting amount. Thepoint of intercept is only introduced informally bycomparing graphs that represent both companies’formulas for calculating rental prices.
At the End of the Section:Learning Outcomes
Students write and use recursive and direct formulasto represent linear growth patterns. They solveproblems by comparing different linear growthpatterns. They know how to recognize linear growthwithin a variety of contexts by considering differ-ences in a table or by considering the shape of agraph.
Additional Resources: Algebra Tools; Additional Practice, Section B, pages 49 and 50
Time (in months)
Length of Hair(in cm)
0
2
� 1.5
1
3.5
2
5
3
6.5
4
8
� 1.5 � 1.5
Day 7: Mid-unit assessment
INTRODUCTION Review homework. Review homework from Day 6.
REVIEW Sections A–B review Review Summary pages from Sections A and B.
ASSESSMENT Quiz #1 Assesses Section A and B Goals

Notes
You might begin thissection by reading anddiscussing the text andcompleting problem 1 as awhole-class activity.
You might ask studentshow far 40 km is (about 25mi) and how long it mighttake someone to run it. (Ifsomeone ran at an averagespeed of 10 km per hour, itwould take him or her 4hours to run this distance.)
You may also brieflydiscuss how a person’sbody temperature rises as aresult of strenuous exercise,such as running.
LinearPatterns
B
Extension
Have students research the history of the marathon in more detail than thestory on this page. They could investigate why the marathon is now 42.195km, and not the original 40 km. Students could also look up times for themost recent Olympic marathon to get a better sense of world-class timesfor this popular event.
Reaching All Learners
In 490 B.C., there was a battle between the Greeks and the Persiansnear the village of Marathon. Legend tells us that immediately afterthe Greeks won, a Greek soldier was sent from Marathon to Athensto tell the city the good news. He ran the entire 40 kilometers (km).When he arrived, he was barely able to stammer out the news beforehe died.
1. What might have caused the soldier’s death?
Marathon runners need lots of energy to run long distances. Yourbody gets energy to run by burning food. Just like in the engine ofa car, burning fuel generates heat. Your body must release some ofthis heat or it will be seriously injured.
BLinear Patterns
The Marathon
13 Ups and Downs
Section B: Linear Patterns 13T
Hints and CommentsOverview Students read and discuss the history of the marathon run.
Comments About the Solutions
1. The purpose of this introductory question is to getstudents thinking about the fact that the bodygets its energy from burning food calories andthat heat is one of the by-products of convertingfood into energy.
Interdisciplinary Connection
You might ask science or health teachers in yourgrade level to teach a unit on nutrition, emphasizingthe impact that food and exercise have on a person’smetabolism and energy level.
Solutions and Samples
1. Answers will vary. Some students may say that thesoldier died from heat exhaustion, lack of water orfood, or a heart attack.

Notes
2a It is not necessary thatstudents make a table forthe whole period of themarathon. A table thatgoes up to 30 minutes willsuffice.
2b Make sure that everystudent’s graph is astraight line. If studentshave difficulty determiningwhere to plot the first pointon the graph, you may tellthem that the normal bodytemperature is about98.6°F (37°C).
LinearPatterns
B
Intervention
You may need to review common strategies for multiplying by 10. Expandto multiplying by 100, 1000, etc. Remind students that multiplying by 20 isthe same as multiplying by 10 and doubling the answer.
Reaching All Learners
Normal body temperature for humans is 37°Centigrade (C), or 98.6° Fahrenheit (F). At atemperature of 41°C (105.8°F), the body’scells stop growing. At temperatures above42°C (107.6°F), the brain, kidneys, and otherorgans suffer permanent damage.
When you run a marathon, your body producesenough heat to cause an increase in body temperature of 0.17°C every minute.
2. a. Make a table showing how your bodytemperature would rise while running amarathon if you did nothing to cool off.Show temperatures every 10 minutes.
b. Use the table to make a graph of thisdata on Student Activity Sheet 5.
3. a. Why is the graph for problem 2b notrealistic?
b. What does your body do to compensatefor the rising temperature?
Linear PatternsB
Naoko Takahashi won the women’smarathon during the 2000 Olympics.She finished the race in 2 hours, 23minutes, and 14 seconds. She wasthe first Japanese woman to win anOlympic gold medal in track and field.Today the marathon is 42.195 kmlong, not the original 40.
0
36
37
38
39
40
41
42
43
44
10 20 30
Time (in minutes)
Te
mp
era
ture
(in
°C
)
14 Ups and Downs

Section B: Linear Patterns 14T
Hints and CommentsMaterials Student Activity Sheet 5 (one per student)
Overview
Students make a table and a graph that show amarathon runner’s body temperature over time ifhis or her temperature keeps rising by 0.17�C perminute.
About the Mathematics
In Section A, students learned about patterns ofincrease and decrease by looking at the differences inthe growth of one thing over equal time periods.In this section, linear patterns, situations that haveequal increases over equal time periods, areinvestigated. The graphs for these situations are allstraight lines. The fact that there are equal increases,or a constant rate of growth, plays an important rolein making formulas for these situations.
Planning
Students may work on problems 2 and 3 in pairs or insmall groups. You may wish to discuss problems 2 and3 before students continue with problems 4 and 5 onthe next page.
Solutions and Samples
2. a.
or
b.
3. a. Answers will vary. Sample response:
The line graph shows a body temperature of42�C after 30 minutes of running, which is toohigh a temperature for the body to function well.
b. Your body sweats, which helps to lower thebody temperature.
Time (in minutes)
Rise in BodyTemperature (in °C)
10
1.7
20
3.4
30
5.1
40
6.8
Time (in minutes)
Body Temperature (in °C)
0
37
10
38.7
20
40.4
30
42.1
40
43.8
Time (in minutes)
Body Temperature
0 10 20 30
36°
37°
38°
39°
40°
41°
42°
43°
44°
Tem
pera
ture
(°C
)

Notes
5 Remind students howlong it took Takahashi torun the marathon from thetop of the previous page.(2 hr 23 min.) Have students point outwhat they need to do with the time to solve this problem (convert to minutes).
7 Make sure that studentsconnect the plotted pointsto make one continuous(straight) line. This isacceptable because growthis a continuous process.
LinearPatterns
B
Intervention
If students have difficulty starting this problem, you might suggest that theymake a ratio table showing the amount of time in minutes and the amountof water lost in liters. Students can then use the ratio table to determine thetotal water Naoko Takahashi lost during the race.
Reaching All Learners
BLinear Patterns
When the body temperatures of marathon runners rise by about 1°C,their bodies begin to sweat to prevent the temperature from risingfurther. Then the body temperature neither increases nor decreases.
4. Use this information to redraw the line graph from problem 2b onStudent Activity Sheet 5.
During the race, the body will lose about 1��5 of a liter of water every 10 minutes.
5. How much water do you think Naoko Takahashi lost during thewomen’s marathon in the 2000 Olympics?
What’s Next?Here you see a core sample of a tree.When this sample was taken, the treewas six years old.
6. What can you tell about the growthof the tree?
The table shows the radius for each year. Remember that the radiusof a circle—in this problem, a growth ring—is half the diameter.
7. Use the table to draw a graph.
�4 �4 �4 �4 �4
Radius (in mm)
Year 1 2 3 4 5 6
4 8 12 16 20 24
Assessment Pyramid
4, 7
Use information aboutincrease and decrease tocreate line graphs.
15 Ups and Downs

Section B: Linear Patterns 15T
Hints and CommentsMaterials Student Activity Sheet 5, one per student (the samesheet used for problem 2b).
Overview
Students continue investigating the graph of arunner’s body temperature over time. They redrawthe graph taking into account one way the body coolsitself. Then they start to investigate linear growth byexamining a core sample of a tree that shows ringswith equal thickness.
Comments About the Solutions
5. Because the human body does not begin to sweatuntil the body temperature rises 1°C, which willtake about 6 minutes in this situation, studentsneed to subtract 6 minutes from the total runningtime to determine the amount of water lostduring the race.
Solutions and Samples
4.
5. Accept answers in the range of 2.8�3.0 liters ofwater. Sample strategy using a ratio table:
6. The growth is very regular. The rings are all thesame distance apart in the drawing, 4 mm.
7.
Note: If the differences in the second row of thetable are equal, the growth is linear. Of course thisis the case only if the years in the first row aresuccessive or show constant differences as well.
Time (in minutes)
Body Temperature
0 10 20 30
36°
37°
38°
39°
40°
41°
42°
43°
44°
Tem
pera
ture
(°C
)
Time(in minutes)
Water(in liters)
10 140
2
� 14
15
4 5
14 5 �
Tree Growth
Year
Rad
ius (
in m
m)
0
10
20
30
1 2 3 4 5 6
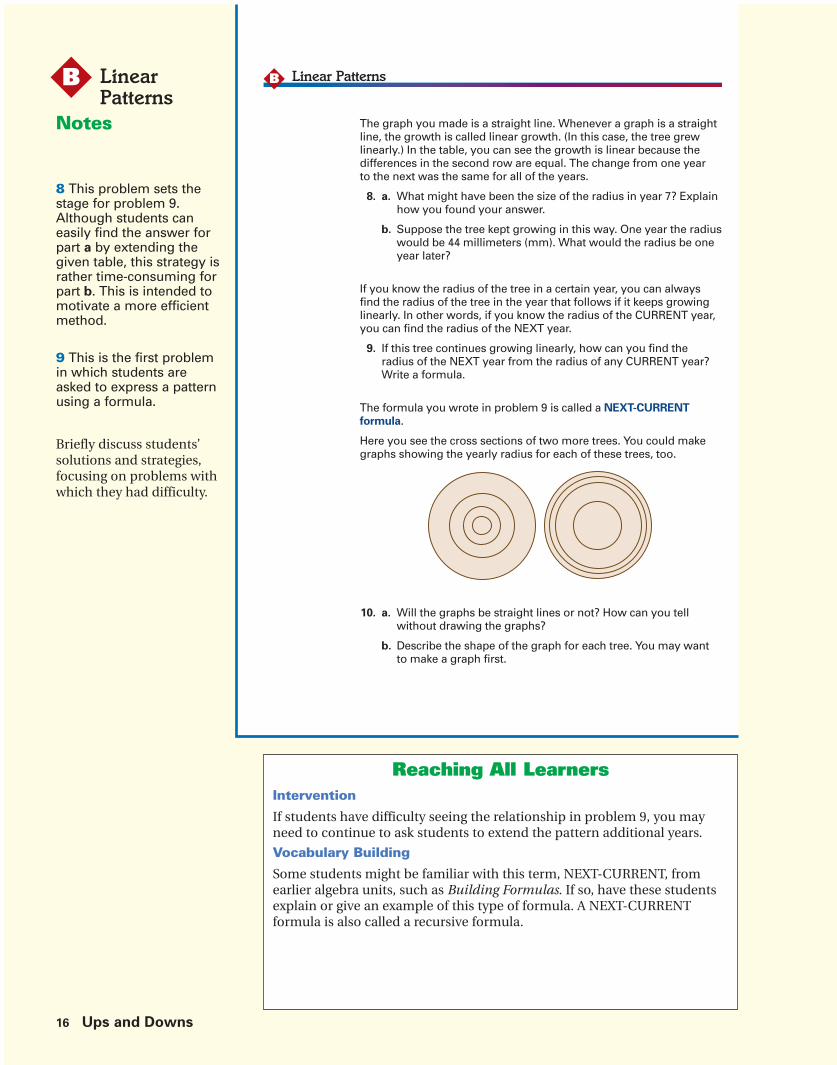
Notes
8 This problem sets thestage for problem 9.Although students caneasily find the answer forpart a by extending thegiven table, this strategy israther time-consuming forpart b. This is intended tomotivate a more efficientmethod.
9 This is the first problemin which students areasked to express a patternusing a formula.
Briefly discuss students’solutions and strategies,focusing on problems withwhich they had difficulty.
LinearPatterns
B
Intervention
If students have difficulty seeing the relationship in problem 9, you mayneed to continue to ask students to extend the pattern additional years.
Vocabulary Building
Some students might be familiar with this term, NEXT-CURRENT, fromearlier algebra units, such as Building Formulas. If so, have these studentsexplain or give an example of this type of formula. A NEXT-CURRENTformula is also called a recursive formula.
Reaching All Learners
The graph you made is a straight line. Whenever a graph is a straightline, the growth is called linear growth. (In this case, the tree grewlinearly.) In the table, you can see the growth is linear because thedifferences in the second row are equal. The change from one yearto the next was the same for all of the years.
8. a. What might have been the size of the radius in year 7? Explainhow you found your answer.
b. Suppose the tree kept growing in this way. One year the radiuswould be 44 millimeters (mm). What would the radius be oneyear later?
If you know the radius of the tree in a certain year, you can alwaysfind the radius of the tree in the year that follows if it keeps growinglinearly. In other words, if you know the radius of the CURRENT year,you can find the radius of the NEXT year.
9. If this tree continues growing linearly, how can you find theradius of the NEXT year from the radius of any CURRENT year?Write a formula.
The formula you wrote in problem 9 is called a NEXT-CURRENT
formula.
Here you see the cross sections of two more trees. You could makegraphs showing the yearly radius for each of these trees, too.
10. a. Will the graphs be straight lines or not? How can you tellwithout drawing the graphs?
b. Describe the shape of the graph for each tree. You may wantto make a graph first.
Linear PatternsB
16 Ups and Downs
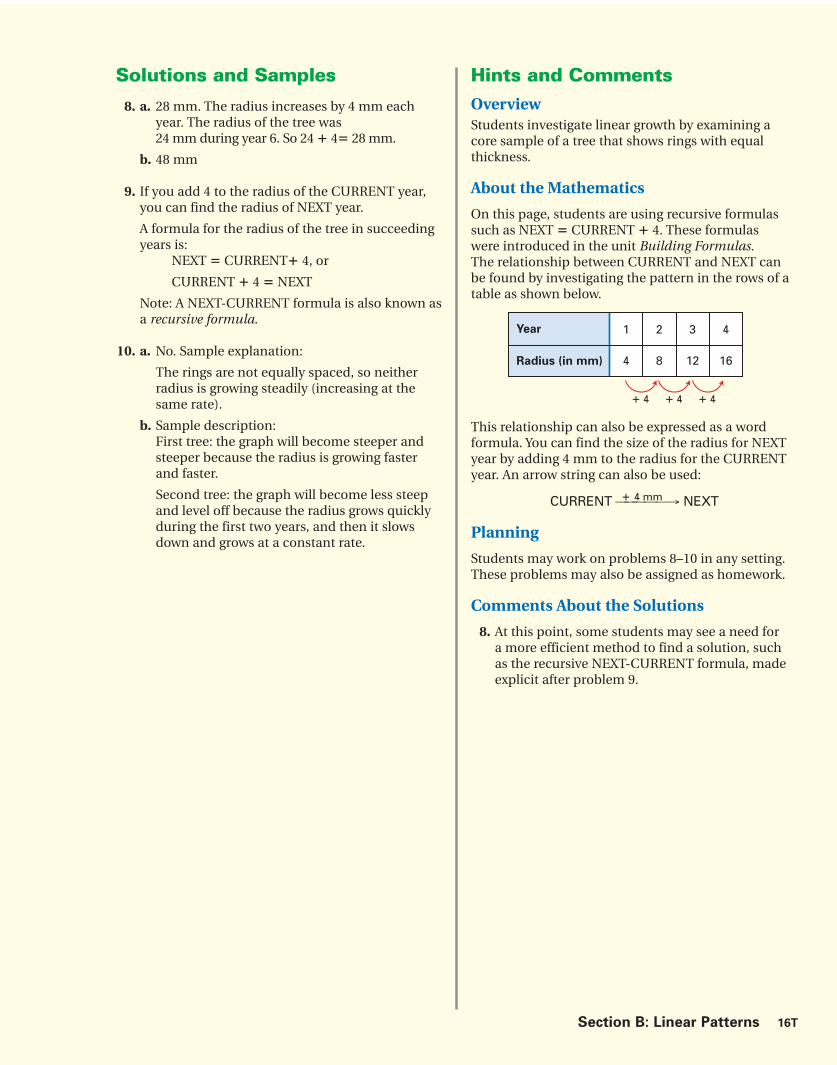
Section B: Linear Patterns 16T
Hints and CommentsOverview Students investigate linear growth by examining acore sample of a tree that shows rings with equalthickness.
About the Mathematics
On this page, students are using recursive formulassuch as NEXT � CURRENT � 4. These formulaswere introduced in the unit Building Formulas.The relationship between CURRENT and NEXT canbe found by investigating the pattern in the rows of atable as shown below.
This relationship can also be expressed as a wordformula. You can find the size of the radius for NEXTyear by adding 4 mm to the radius for the CURRENTyear. An arrow string can also be used:
CURRENT ⎯�⎯4 mm⎯⎯⎯→ NEXT
Planning
Students may work on problems 8–10 in any setting.These problems may also be assigned as homework.
Comments About the Solutions
8. At this point, some students may see a need fora more efficient method to find a solution, suchas the recursive NEXT-CURRENT formula, madeexplicit after problem 9.
Solutions and Samples
8. a. 28 mm. The radius increases by 4 mm eachyear. The radius of the tree was24 mm during year 6. So 24 � 4� 28 mm.
b. 48 mm
9. If you add 4 to the radius of the CURRENT year,you can find the radius of NEXT year.
A formula for the radius of the tree in succeedingyears is:
NEXT � CURRENT� 4, or
CURRENT � 4 � NEXT
Note: A NEXT-CURRENT formula is also known asa recursive formula.
10. a. No. Sample explanation:
The rings are not equally spaced, so neitherradius is growing steadily (increasing at thesame rate).
b. Sample description:First tree: the graph will become steeper andsteeper because the radius is growing fasterand faster.
Second tree: the graph will become less steepand level off because the radius grows quicklyduring the first two years, and then it slowsdown and grows at a constant rate.
Year
Radius (in mm)
1
4
� 4
2
8
3
12
4
16
� 4 � 4

Notes
13 Encourage students toshow or explain how theygot their answers. Studentswho have answers of 22 or26 cm may have mistakenlyused the given table as aratio table.
16a Students should see that due to order ofoperations, the expression2 � 1.5T is the same as1.5T � 2. Multiplication isdone before addition.
16b You may want toexplain to students that thisis called a direct formulabecause you can calculatethe length of hair at anytime without needing toadd 1.5 for each month.
LinearPatterns
B
Intervention
If students have difficulty writing the NEXT-CURRENT formula in problem 15,point out the information gained from problem 14. You might also helpstudents to write a word formula first. Ask, How can you find Paul’s hairlength for the next month? (You can find the length of his hair the nextmonth by adding 1.5 cm to the current length.) You could also suggest thatstudents express the growth pattern using an arrow string.
Vocabulary Building
A direct formula can be used to find a value for any given number. To use aNEXT-CURRENT formula, the starting number (or previous number) mustbe known.
Reaching All Learners
BLinear Patterns
Paul went to get a haircut. When he got home, he looked in themirror and screamed, “It’s too short!”
He decided not to get his hair cut again for a long time. In the meantime, he decided to measure how fast his hair grew. Below is a table that shows the length of Paul’s hair (in centimeters) as he measured it each month.
Hair and Nails
11. How long was Paul’s hair after the haircut?
12. a. How long will his hair be in five months?
b. Why is it easy to calculate this length?
13. a. How long will Paul’s hair be after a year if itkeeps growing at the same rate and he doesnot get a haircut?
b. Draw a graph showing how Paul’s hair growsover a year if he does not get a haircut.
c. Describe the shape of this graph.
14. If Paul’s hair is 10 cm long at some point, howlong will it be one month later?
If you know the length of Paul’s hair in the current month, you can useit to find his hair length for the next month.
15. Write a formula using NEXT and CURRENT.
You knew that the beginning length of Paul’s hair was 2 cm. That’swhy it is possible to make a direct formula for Paul’s hair growth:
L � 2 � 1.5T
16. a. What do you think the letter L stands for? The letter T?
b. Explain the numbers in the formula.
Time (in months) 0 1 2 3 4 5 6
Length (in cm) 2 3.5 5 6.5
Assessment Pyramid
16ab
15
Use algebraic models torepresent realistic situations.
Describe linear growth withrecursive formulas.
17 Ups and Downs
Section B: Linear Patterns 17T
Hints and CommentsMaterials graph paper, one sheet per student
Overview
Students investigate a person’s hair growth using thedata in a table. They draw a graph and makepredictions about what his hair length would be infive months. They write a NEXT-CURRENT formula todescribe the hair growth and are introduced to adirect formula describing the same hair growth.
About the Mathematics
A table is a strong tool to investigate growth patterns.Students may now feel comfortable with the conceptof growth rate. In the table, the growth rate is 1.5 cmper month. Because the differences in length for everytwo consecutive months are equal, this is a lineargrowth pattern. The graph is a straight line.
Planning
Students may work individually on problems 11–15.You may also assign these problems as homework.Discuss the notation used in the formula afterstudents complete this problem.
Comments About the Solutions
11.–14.
The purpose of these problems is to help studentsbegin thinking about how to write a direct formulato represent this hair-growth situation.
13. Distinguish the table of values here from a ratiotable. Relate the data in the table to the graph.Students should learn to recognize linearity froma table, a graph, and a formula.
16. The purpose of this problem is to help studentsrealize the importance of knowing what the wordsand/or symbols used in a formula represent.By this point in the unit, most students shouldunderstand what each letter in the formularepresents and how the formula originated.If students are having difficulty, you might suggestthat they write a word formula to represent thispattern:
You can find the hair length for a given month byadding 1.5 cm to the previous month’s hair length.
Students may write the direct formula in differentorders:
2 � 1.5 � T � L or
2 � T � 1.5 � L.
Solutions and Samples
11. 2 cm
12. a. 9.5 cm
b. Sample explanation:
It is easy to calculate the new hair lengthbecause his hair grows the same amount (1.5cm) every month.
13. a. 20 cm. Sample strategies:
• Some students might extend the table andfill in lengths for the remaining six months.
• In 12 months, Paul’s hair grew 18 cm(12 � 1.5 � 18 cm). His hair was originally 2 cm long, so after one year, his hair lengthwill be 2 � 18 � 20 cm long.
b.
c. The graph of Paul’s hair growth is a straight line.
14. 11.5 cm
15. NEXT � CURRENT � 1.5, or
CURRENT � 1.5 � NEXT
16. a. L stands for length of the hair (cm);T stands for time in months.
b. The number 2 is the length of Paul’s hair afterthe haircut. The number 1.5 standsfor the amount his hair (cm) grows eachmonth. It grows 1.5 cm each month.
Time (in months)
Length(in cm)
0
2
6
11
7
12.5
8
14
9
15.5
10
17
11
18.5
12
20
� 3 � 3
1
1 2 3 4 5 6 7 8 9 10 11 12
2
3
4
5
6
7
8
9
10
11
12
13
14
15
16
17
18
19
20
Hair
Len
gth
(in
cm
)
Time (in months)
Hair Growth

Notes17 Students may use twodifferent growth rates intheir formulas, 1.4 cm (themonthly rate) or 16.8 cm(the yearly rate). In thelatter case, the T mustrepresent the number ofyears rather than thenumber of months.
18 To prompt studentthinking about solving this problem, you may ask, If Sean’s hair is 5 cmin January and 29 cm atthe end of December, how much did it groweach month, on average?(2 cm per month.)
18 After solving thisproblem you may want to ask, Why do you divide8 mm by 4 when there are only three empty rows in the table? (Think: 4 months.)
LinearPatterns
B
Intervention
If students are having difficulty with the fingernail problems, suggest thatthey determine how many millimeters the fingernail grew between the firstmonth and fourth month (8 mm) and remind them that the fingernail isgrowing at a constant rate.
Advanced Learners
Problem: Sonya’s hair grew 14.4 cm in one year. Make a graph that showsthe length of Sonya’s hair over one year if she goes to the hairdresser everytwo months. Explain the assumptions you made.
Reaching All Learners
Sacha’s hair is 20 cm long and grows at a constant rate of 1.4 cm amonth.
17. Write a direct formula with L and T to describe the growth ofSacha’s hair.
Linear PatternsB
Suppose you decided not to cut one fingernail for severalmonths, and the nail grew at a constant rate. The table showsthe lengths of a nail in millimeters at the beginning and afterfour months.
18. How much did this nail grow every month?
19. Predict what the graph that fits the data in the table lookslike. If you cannot predict its shape, think of some pointsyou might use to draw the graph.
20. Write a direct formula for fingernail growth using L forlength (in millimeters) and T for time (in months).
Renting a MotorcycleDuring the summer months, many people visit Townsville. A populartourist activity there is to rent a motorcycle and take a one-day tourthrough the mountains.
You can rent motorcycles at E.C. Rider Motorcycle Rental and atBudget Cycle Rental. The two companies calculate their rental pricesin different ways.
The most popular trip this season goes from Townsville, throughCove Creek, to Overlook Point, and back through Meadowville.
E.C. RIDERbudgetmotorcycle rental
cycle rentalOne Day: $60 Plus $0.20 per Mile One Day: Just $0.75 per Mile
FingernailTime Length
(in months) (in mm)
0 15
1
2
3
4 23
Assessment Pyramid
18, 20
19
Describe linear growth using direct formulas.
Use information aboutincrease to create graphs.
18 Ups and Downs

Section B: Linear Patterns 18T
Hints and CommentsOverview Students explain a direct formula that describes hairgrowth. They write this type of formula to describe thehair growth of another person. Then they investigatethe linear growth pattern of fingernails. They write aformula, use a table, and predict what the graph willlook like for this growth pattern.
About the Mathematics
The relationship between the various representationsof a linear relationship, table, direct formula, andgraph, is emphasized. Formulas like L � 2 � 1.5 � Tare called direct formulas. All linear growth situationscan be described with a direct formula similar to thisone. Formulas and linear equations are studied moreextensively in the unit Graphing Equations.
The remaining problems in this section will reinforcestudents’ understanding of linear growth patterns andformulas. These problems will also provide studentswith enough experiences to begin to understand theconcepts of intercept and slope, which are madeexplicit in the unit Graphing Equations.
These problems involve linear growth patterns.Students should see the similarities between thesesituations and the situations of hair and nail growth.They all deal with equal increases over equal timeperiods. The hair growth situation may be used as amodel to show students an example of linear increase.
Solutions and Samples
17. L � 20 � 1.4T
18. 2 mm. Strategies will vary. Some students mightreason that a growth pattern of 8 mm over a four-month period is the same as 2 mm permonth.
19. The graph will be a straight line because thelength of the nail grows the same amount eachmonth.
20. L � 15 � 2T

Notes
Encourage students todiscuss their solutionstogether, in pairs or smallgroups, before they begineach new problem.
21 Students must realizethat they can use thedistance mentioned in theintroduction to theproblem to calculate theprice that each companycharges.
23c Be sure that studentsuse different coloredpencils to indicate differentgraphs and write theformula’s name next toeach graph.
24a Students should beable to write the 0.20Mpart of the formula. Makesure students use the rightformulas to draw theirgraphs.
LinearPatterns
B
Accommodation
For some students you may want to provide the outline for tables for E.C.Rider and Budget, either on the overhead or handouts, to support theirconstruction of graphs for each formula. Most students will need to maketables before they will be able to draw a graph of both formulas.
Reaching All Learners
BLinear Patterns
Even though more and more peopleare making this 170-mile trip, theowner of Budget Cycle Rental noticedthat her business is getting worse. Thisis very surprising to her, because hermotorcycles are of very good quality.
21. Reflect What do you thinkexplains the decrease in Budget’sbusiness compared to E.C. Rider’s?
The rental price you pay depends onthe number of miles you ride. WithBudget Cycle Rental, the price goes up $0.75 for every mile you ride.
22. a. How much does the cost go up per mile with a rental fromE.C. Rider?
b. Does that mean it is always less expensive to rent fromE.C. Rider? Explain your answer.
Budget Cycle Rental uses this rental formula: P = 0.75M.
23. a. Explain each part of this formula.
b. What formula does E.C. Rider use?
c. Graph both formulas on Student Activity Sheet 6.
Ms. Rider is thinking about changing the rental price for her motorcycles. This will also change her formula. She thinks about raising the starting amount from $60 to $70.
24. a. What would the new formula be?
b. Do you think Ms. Rider’s idea is a good one? Why or why not?
budgetcycle rental
One Day: Just $0.75 per Mile
THE FIRST 20 MILES FREE!
Townsville
Tenhouses
Meadowville
Eastown
Scale
0 5 miles
Winsor
Lake
Old Bay
Overlook Point
Cove Creek
Re d
Mo
u n t a i n s
Budget Cycle Rental is going to change prices too. See thenew sign.
25. a. Write the new formula for Budget Cycle Rental.
b. Make a graph of this new formula on Student Activity
Sheet 6. You may want to make a table first.
26. Look again at the 170-mile trip from Townsville. Whomwould you rent your motorcycle from now, given thenew information from problems 24 and 25?
Assessment Pyramid
26
24a, 25a
Recognize the power ofgraphs for solving problems.
Describe linear growth withdirect formulas.
19 Ups and Downs

Section B: Linear Patterns 19T
25. a. P � 0.75 (M � 20), or (M � 20 ) � 0.75 � P
b.
26. E.C. Rider’s price, $104, is cheaper than Budget’sprice, $112.50.
Solutions and Samples
21. Most people rent where it is the least expensive.
E.C. Rider’s charge for the trip would be
$60.00 � 170 � $0.20 � $94.00.
Budget’s charge for the trip would be
170 � $0.75 � $127.50.
It is less expensive to rent from E.C. Rider forthis trip.
22. a. 20 cents per mile
b. No. Explanations will vary. Sample explanation:
The better choice depends on the length of the trip. To rent a motorcycle from E.C. Riderfor a 10-mile trip would cost $60 � 10 � $0.20� $62.00. To rent from Budget for the samedistance would cost 10 � $0.75 � $7.50.
23. a. P represents the price or cost in dollars.M represents the number of miles of the trip.The price you pay per mile is $0.75.
b. P � 60 � 0.20M
c.
24. a. P � 70 � 0.20M
b. Answers may vary. Sample response:
Ms. Rider’s price will still be cheaper thanBudget’s price for the most popular trip, so I thinkit is a good idea.
Hints and CommentsMaterials Student Activity Sheet 6, one per student;colored pencils (one box per student)
Overview
Students compare motorcycle rental prices of twocompanies. They write formulas to represent therental pricing structure of both companies. Then theydraw a graph to compare the two companies’ rentalprices. They investigate the influence on the formulaand graph if the situation changes.
About the Mathematics
E.C. Rider charges $0.20 per mile. This is the amountof growth per month. This number determines thesteepness of the graph. E.C. Rider’s charges start withan amount of $60. This is analogous to the beginninglength in the hair-growth context. This number can befound where the graph starts on the vertical axis.
As students draw their graphs in problems 23 and 25,they might notice that the starting point for the newgraph line for each company’s rental formula istranslated. Also, the points of intersection (thatindicate trips for which the price is the same for eithercompany) are different. The new graph lines still havethe same steepness (slope).
Comments About the Solutions
22. b. Students may have already noticed that a shorttrip would be more expensive at E.C. Riderbecause of the company’s fixed charge of $60.
0 20 40 60 80 100 120 140 160 180 200 220
Distance (in miles)
A Comparision of Motorcycle Rental Companies
20
40
60
80
100
120
140
Pri
ce
(in
do
lla
rs)
P = 0.75M
(Budget)
P = 60 + 0.20M
(E. C. Rider)
0 20 40 60 80 100 120 140 160 180 200 220
Distance (in miles)
Motorcycle Rental
20
40
60
80
100
120
140
Pri
ce (
in d
ollars
)
P = 0.75M(B
udget)
P = 0.75(M– 2
0)
P = 60 + 0.20M (E. C. Rider)

Notes
The Summary for thissection reiterates eachrepresentation for linearfunctions addressed in thissection. Be sure to gothrough the Summarycarefully, having studentsread parts aloud. It is criticalthat students review therelationship between tables,graphs, and recursive anddirect formulas presentedin this section.
LinearPatterns
B
Parent Involvement
Have students discuss the Summary and Check Your Work problems withtheir parents. The representations of linear patterns may be familiar tosome parents. Parents may benefit from helping their child look forproblems from Section B similar to the Check Your Work problems.
Writing Opportunity
Have students write in their own words how linear growth can berecognized from a formula, a table, and a graph.
Reaching All Learners
Linear PatternsB
The situations in this section were all examples of graphs withstraight lines. A graph with a straight line describes linear growth.The rate of change is constant. The differences over equal timeperiods will always be the same.
You can recognize linear growth by looking at the differences in atable or by considering the shape of the graph.
�4 �4 �4 �4
Radius (in mm)
Year 1 2 3 4 5
4 8 12 16 20
0
Year
Core Sample of a Tree
Rad
ius (
in m
m)
0
10
20
1 2 3 4 5
Linear growth can be described using formulas. A NEXT-CURRENTformula that fits this table and graph is:
NEXT� CURRENT � 4
A direct formula that fits this table and graph is:
radius � year number � 4 or R � 4Y
with the radius measured in millimeters.
20 Ups and Downs

Section B: Linear Patterns 20T
Hints and CommentsOverview
Students summarize what they have learned aboutlinear growth by making tables, formulas, and graphsof linear situations.

Notes1 Note that this problemdoes not describe acontinuous situation.Therefore the dots in agraph should not beconnected. Even thoughstudents are not asked todraw the graph, you mightwant to discuss this point.
LinearPatterns
B
Intervention
For problem 3, if students do not see the relationship between eachformula, ask, What is the relationship between the numbers, 14.4 and 1.2?What is the relationship between 144 and 12?
Vocabulary Building
Have students write an explanation of the differences between NEXT-CURRENT (recursive) and direct formulas. Include the advantages anddisadvantages of each.
Reaching All Learners
1. Lucia earns $12 per week babysitting.
a. Make a table to show how much money Lucia earns oversix weeks.
b. Write a formula using NEXT and CURRENT to describe Lucia’searnings.
c. Write a direct formula using W (week) and E (earnings) todescribe Lucia’s earnings.
2. a. Show that the growth described in the table is linear.
b. Write a formula using NEXT and CURRENT for the example.
c. Write a direct formula using L (length) and T (time) for theexample.
Sonya’s hair grew about 14.4 cm in one year. It is possible to write thefollowing formulas:
NEXT � CURRENT � 14.4
NEXT � CURRENT � 1.2
3. Explain what each formula represents.
Time (in weeks) 0 1 2 3
Length (in cm) 11 12.4 13.8 15.2
Assessment Pyramid
1bc, 2bc, 3
1a, 2a
Assesses Section B Goals
21 Ups and Downs

Section B: Linear Patterns 21T
Hints and CommentsOverview Students use the Check Your Work problems asself-assessment. The answers to these problems areprovided in the Student Book.
Solutions and SamplesAnswers to Check Your Work
1. a. table:
It is all right if you started your table with week 1.
b. recursive formula: NEXT � CURRENT � 12
c. direct formula: E �12W, with E in dollars and W in weeks.
2. a. The table shows that the length grows eachmonth by the same amount; the differences are all equal to 1.4 cm.
b. NEXT � CURRENT � 1.4
c. L � 11 � 1.4T, with L in centimeters and T inweeks.
3. The first formula gives Sonya’s hair growth eachyear, so NEXT stands for next year, CURRENTstands for the current year, and 14.4 stands for thenumber of centimeters her hair grows yearly.
The second formula gives her hair growth eachmonth, so NEXT stands for next month, CURRENTstands for the current month, and 1.2 stands forthe number of centimeters her hair grows monthly.
Time (in weeks)
Earnings(in dollars)
0
0
1
12
2
24
3
36
4
48
5
60
6
72
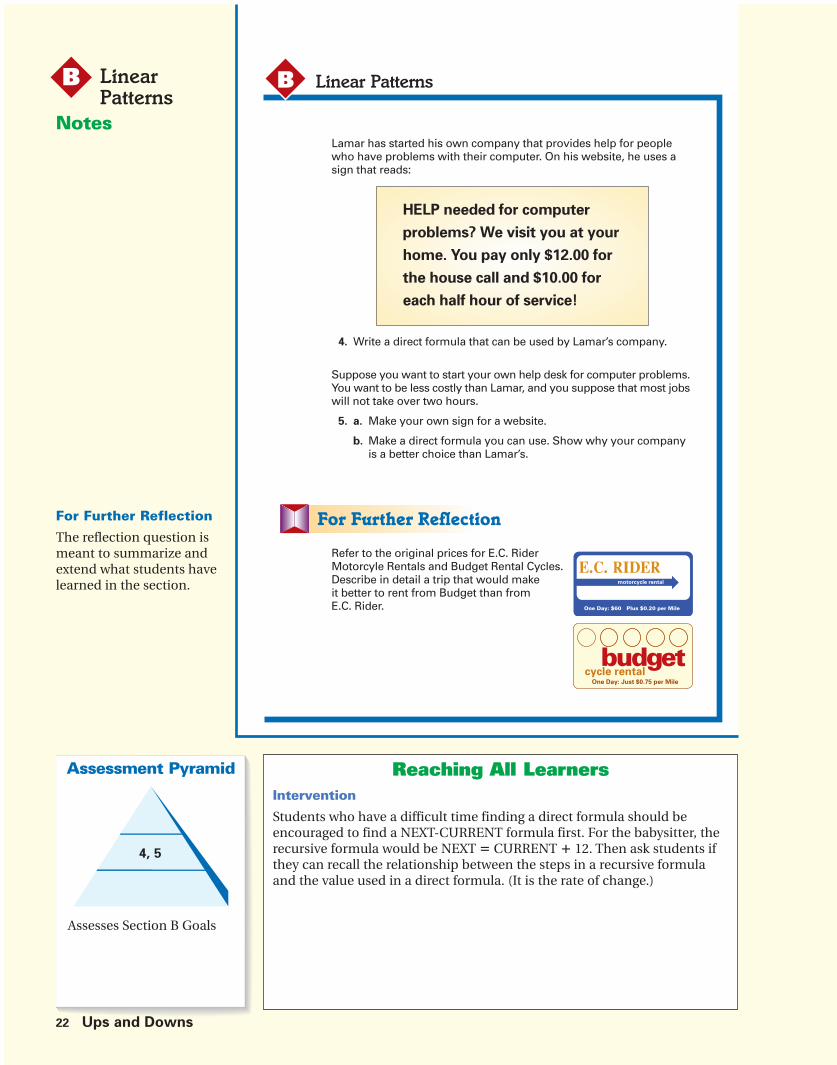
Notes
For Further Reflection
The reflection question ismeant to summarize andextend what students havelearned in the section.
LinearPatterns
B
Intervention
Students who have a difficult time finding a direct formula should beencouraged to find a NEXT-CURRENT formula first. For the babysitter, therecursive formula would be NEXT � CURRENT � 12. Then ask students ifthey can recall the relationship between the steps in a recursive formulaand the value used in a direct formula. (It is the rate of change.)
Reaching All Learners
Linear Patterns
Lamar has started his own company that provides help for peoplewho have problems with their computer. On his website, he uses asign that reads:
4. Write a direct formula that can be used by Lamar’s company.
Suppose you want to start your own help desk for computer problems.You want to be less costly than Lamar, and you suppose that most jobswill not take over two hours.
5. a. Make your own sign for a website.
b. Make a direct formula you can use. Show why your companyis a better choice than Lamar’s.
Refer to the original prices for E.C. Rider Motorcyle Rentals and Budget Rental Cycles. Describe in detail a trip that would make it better to rent from Budget than from E.C. Rider.
B
HELP needed for computer
problems? We visit you at your
home. You pay only $12.00 for
the house call and $10.00 for
each half hour of service!
E.C. RIDERmotorcycle rental
One Day: $60 Plus $0.20 per Mile
budgetcycle rental
One Day: Just $0.75 per Mile
Assessment Pyramid
4, 5
Assesses Section B Goals
22 Ups and Downs
Section B: Linear Patterns 22T
Hints and CommentsOverview Students use the Check Your Work problems asself-assessment. The answers to these problems areprovided in the Student Book.
Planning
After students finish Section B, you may want toassign some additional practice from the AdditionalPractice Section in the Student Book.
Solutions and Samples
4. Discuss your formula with a classmate. Yourformula may differ from the examples shownbelow; you may have chosen other letters or usedwords. Sample formulas:
• E � 12 � 10T with earnings E in dollars andtime T in half hours.
• E � 12 � 20T with earnings E in dollars andtime T in hours.
• amount (in dollars) � 12 � 10 � time (30 minutes)
5. a. Show your sign to your classmates.
b. Discuss your formula with a classmate or inclass. There are different ways to make aformula that yields a less costly result thanLamar’s. You will have to show why it is lesscostly and give your reasoning. Some examples:
• Make both the charge for a house call andthe amount per half hour lower than inLamar’s formula. You will always be cheaper.For instance: E � 10 � 8T with earnings Ein dollars and time T in half hours.
• Keep the call charge equal, but make theamount per half hour lower than in Lamar’sformula. You will always be cheaper.For instance: E � 12 � 8T with earnings Ein dollars and time T in half hours.
• Make the call charge higher and the amountper half hour lower than in Lamar’s formula.For instance: E � 20 � 8T with earnings E indollars and time T in half hours.
Your company will be cheaper after morethan four half hours, but you will earn morefor short calls. Make a note on your websitethat most jobs take an average of two hours.
For Further Reflection
Answers will vary. Sample solution: E.C. Rider rentsbikes for $60 a day and 20 cents a mile. Budget CycleRental rents bikes for just 75 cents a mile. There is acool waterfall that is about 20 miles from the rentalshops. If I wanted to bike to the waterfall and was asmart shopper, I would rent a bike from Budget becauseI would only have to pay 75 cents � 20 miles � $15(each way), or $30 total. Renting a bike from E.C. Riderwould cost more than $60! If I rented from Budget, Icould even take a short side trip and still save money!

23A Ups and Downs Teachers Matter
Teachers MatterC
Section Focus
The surface area of a poplar leaf is used to investigate quadratic growth. Students investigate second differences in a table. They use quadratic formulas that describe quadratic growth within this context.The growth of aquatic weeds is used to introduce students to exponential growth.
Pacing and Planning
Day 8: Leaf Area Student pages 23–27
INTRODUCTION Problems 1–3 Write a direct formula for the area of a leaf.
CLASSWORK Problems 4–6 Use tables and graphs to analyze the direct(quadratic) formula for the area of a leaf.
HOMEWORK Problems 7–9 Graph the direct (quadratic) formula for the area of a leaf and use the graph and the formula to determine the area of leaves with various lengths.
Day 9: Water Lily Student pages 27–28
INTRODUCTION Review homework. Review homework from Day 8.
CLASSWORK Problems 10–13 Investigate the growth pattern of the radius of a circular leaf.
HOMEWORK Problem 14 Extend and identify linear and quadratic growth patterns.
Day 10: Aquatic Weeds Student pages 29–31
INTRODUCTION Problem 15 Determine whether the growth in the area of a fast-growing aquatic weed is linear.
CLASSWORK Problems 16–20 Use tables and graphs to investigate the growth of quantities that repeatedly double over time.
HOMEWORK Problems 21 and 22 Use the concept of growth to predict thenumber of bacteria.

Teachers Matter Section C: Differences in Growth 23B
Teachers Matter C
Materials
Student Resources
Quantities listed are per student.
• Student Activity Sheets 7–11
Teachers Resources
No resources required.
Student Materials
Quantities listed are per pair of students, unlessotherwise noted.
• Calculator
• Centimeter ruler
• Colored pencils, one box
• Graph paper (two sheets per student)
* See Hints and Comments for optional materials.
Learning lines
Quadratic Relationships
If the “first differences” are not equal but the“second differences” are, the growth is quadratic.The table shows the relationship between lengthand area of squares. If the length increases by onecentimeter each time, the first differences are notequal, but the second differences are equal.
first differences
second differences
At this stage, students are not expected toconstruct quadratic formulas, but they use andadapt them. The formal term parabola, for thegraph of a quadratic relationship, is not used.
Relationships Showing ExponentialGrowth
Students are introduced to situations involvingexponential growth. In the table, this becomesvisible if, at equal time periods, each entry in thetable is found by multiplying by a growth factor. Ifeach value in the table is found by multiplying bya growth factor, the growth is exponential. Thetable below shows the area covered by some weedthat yearly grows by a growth factor of two. Noticethat having a growth factor of two means that thearea covered by the weed is doubling every year.
Only NEXT-CURRENT formulas are used todescribe exponential growth.
At the End of This Section: LearningOutcomes
Students are able to discern whether growth aspresented in a situation using tables is linear,quadratic, exponential, or none of these. Theyuse and understand direct formulas for quadraticgrowth and recursive formulas for exponentialgrowth.
Day 11: Double Trouble (Continued) Student pages 31–34
INTRODUCTION Review homework. Review homework from Day 10.
CLASSWORK Problems 23–25 Investigate exponential growth.
HOMEWORK Check Your Work Student self-assessment: Graph, identify, and interpret growth patterns.
Additional Resources: Algebra Tools; Additional Practice, Section C, page 50
Length of Square (in cm)
Surface Area ofSquare (in cm2)
1
1
�3
2
4
3
9
4
16
5
25
6
36
�2 �2 �2 �2
�5 �7 �9 �11
Year
Area Covered (in km2)
1
400
� 2
2
800
3
1,600
4
3,200
5
6,400
� 2 � 2 � 2

Notes
Photosynthesis is discussedhere as a context to motivatethe need to find the surfacearea of leaves.
1a Discuss in class whatsurface area of a leafmeans. Some studentsmay mention you need the area of both sides ofthe leaf.
1b Remind students ofwhat they did in the unitReallotment, when theycompared the surface areasof leaves by drawing theiroutlines on grid paper.
Differencesin Growth
C
Hands On Learning
A direct connection to the measurement unit Reallotment can be madebefore beginning this section. Bring in a small bag of leaves of various sizes.Pass the bag around and have each student choose a leaf from the bag. In pairs, have students share strategies for finding the area of the leaf theyselected. Some students might suggest tracing the outline of the leaf ongraph paper and counting the squares. Other students might suggestmeasurement techniques that require rulers.
Reaching All Learners
The main function of leaves is to create food for theentire plant. Each leaf absorbs light energy and uses itto decompose the water in the leaf into its elements—hydrogen and oxygen. The oxygen is released into theatmosphere. The hydrogen is combined with carbondioxide from the atmosphere to create sugars that feedthe plant. This process is called photosynthesis.
1. a. Why do you think a leaf’s ability to manufactureplant food might depend on its surface area?
b. Describe a way to find the surface area of any ofthe leaves shown on the left.
CDifferences in Growth
Leaf Area
The picture below shows three poplar leaves. Marsha states, “Theseleaves are similar. Each leaf is a reduction of the previous one.”
2. Measure the height and width of each of the leaves to determinewhether Marsha is right.
23 Ups and Downs

Section C: Differences in Growth 23T
Hints and CommentsOverview
Students explore different leaves and describe how tofind their surface areas.
About the Mathematics
In the unit Reallotment, several strategies were used to determine the surface area of a leaf. Knownmathematical shapes can quite easily model the leafof a black poplar, which is why this leaf is used.Similar means having the same shape, the same ratiobetween the dimensions, and the same angles, but thedimensions (the measurements) themselves can bedifferent. Similarity is also studied in the unit It’s Allthe Same.
Interdisciplinary Connection
In science class, students may investigate in moredepth how photosynthesis works.
Solutions and Samples
1. a. Sample response:
A leaf with a larger surface area can absorbmore light energy and carbon dioxide andholds more water within it, all of which arerequired in the manufacture of food.
b. Answers will vary. Students may suggest tracinga leaf onto a piece of graph paper and countingthe squares within the shape, combining anypartial squares.
2. Yes, Marsha is right, the leaves are similar; theyhave the same shape even though they aredifferent sizes. The ratios of the length to widthare the same in all figures.

Notes
3a Students shouldunderstand that the squarecan be divided into fourpieces so that half of eachpiece is shaded.
3d Emphasize thatstudents need to draw onlythe outline of the leaf.
Differencesin Growth
C
Vocabulary Building
A kite is a shape defined in high school geometry. A quadrilateral is called akite if one diagonal is both perpendicular to the other diagonal and cuts itin half (i.e., one diagonal is a perpendicular bisector of the other).
Intervention
You may want to have an enlarged overhead of the kite available todemonstrate the relationship between height and surface area. Have astudent volunteer to demonstrate how they can “reallot” the model kite toform a rectangle that is half the area of the surrounding square.
Reaching All Learners
One way to estimate the surface area of a poplar leaf is to draw a square around it as shown in thediagram on the right.
The kite-shaped model on the left covers about the same portion of thesquare as the actual leaf on the left.
3. a. Approximately what portion of the square does the leafcover? Explain your reasoning.
b. If you know the height (h) of such a leaf, write a directformula that you can use to calculate its area (A).
c. If h is measured in centimeters, what units should be usedto express A?
d. The formula that you created in part b finds the area ofpoplar leaves that are symmetrical. Draw a picture of a leafthat is not symmetrical for which the formula will still work.
Differences in GrowthC
height
Area Differences
Height (in cm) 6 7 8 9 10 11 12
Area (in cm2) 18 24.5
You can use this formula for the area of a poplar leaf when the height(h) is known:
A �1��2 h2
You can rewrite the formula using arrow language:
h ⎯⎯squared⎯⎯→ ..... ⎯� 1��2⎯⎯→ A
The table shows the areas of two poplar leaves.
4. a. Verify that the areas for heights of 6 cm and 7 cm are correct in the table.
b. On Student Activity Sheet 7, fill in the remaining area valuesin the table. Describe any patterns that you see.
c. Reflect How do you know that the relationship between areaand height is not linear?
Assessment Pyramid
3d
4c
Use algebraic models todescribe realistic situations.
Identify linear patterns intables and graphs.
24 Ups and Downs

Section C: Differences in Growth 24T
Hints and CommentsMaterials graph paper (one sheet per student); Student Activity Sheet 7 (one per student)
Overview
Students investigate the surface area of a black poplarleaf and create a direct formula for finding the areabased on the height of the leaf. They draw anonsymmetric leaf that can also be represented by theformula. They then use the formula to make a tablefor the areas of different black poplar leaves andinvestigate patterns in the table.
About the Mathematics
The area can be found by “reallotting” it, by cuttingand pasting the original shape. Another strategy is todivide the given shape into smaller parts of which it iseasy to determine the area. The formula for the areaof a square is length times length or length2. Studentsshould know this formula and the notation as well asan abbreviated form. Squares and square roots wereintroduced in the unit Facts and Factors.
Planning
You may wish to work through problem 3 as a wholeclass activity. Make sure students know how to workwith the formula before they start working onproblem 4.
Comments About the Solutions
4. b. Two patterns are apparent just by looking atthe numbers in the table. The numbersincrease and they are all halves of squarenumbers.
Solutions and Samples
3. a. The leaf covers about half of the square.Sample explanations:
• In the kite-shaped model, if you fold thewhite part of the figure onto the shaded part,you will have completely covered the shaded part.
• The square can be divided into four smallerrectangles. About half of each rectangle isshaded, and half is white.
b. Formulas may vary. Sample formula:
A � 1__2 h2
If the length of the side of the square is h, thenthe area of that square is h2. Because the leafhas an area that is half of the area of the square,the formula for the area of the leaf is A � 1__
2 h2.
c. If the height is measured in centimeters, thearea should be expressed in squarecentimeters.
d. Drawings will vary. Sample drawing:
The center of the leaf in this example is shiftedto the right.
4. a. 1__2 � 62 � 1__
2 � 36 � 18 cm2
1__2 � 72 � 1__
2 � 49 � 24.5 cm2
b.
Students may note the following patterns:
• For odd heights, the areas end with five-tenths.
• Each area is an increase over the previousarea, first by 6.5, then by 7.5, then 8.5, then9.5, and so on.
c. The relationship is not linear because for thesame change in height, the changes in area aredifferent. The differences in the second row ofthe table are not equal as shown in the answerfor problem b.
Height (in cm)
Area (in cm2)
6
18
7
24.5
8
32
9
40.5
10
50
11
60.5
12
72

Notes
Before students begin theproblems on this page, youmay need to spend sometime talking about the ideaof differences.
Differencesin Growth
C
Advanced Learners
For students who finish this page early, encourage them to make their ownquadratic patterns. Have them start from the second differences and workbackwards to build first differences and the original pattern. They shoulddiscover that they will need to address the question, What do you need toknow to use second differences to build first differences and the originalpattern? (You need to decide on a starting or ending, value.)
Reaching All Learners
CDifferences in Growth
The diagram below shows the differences between the areas of thefirst three leaves in the table.
5. a. On Student Activity Sheet 7, fill in the remaining “firstdifference” values. Do you see any patterns in the differences?
b. The first “first difference” value (6.5) is plotted on the graph onStudent Activity Sheet 8. Plot the rest of the differences thatyou found in part a on this graph.
c. Describe your graph.
As shown in the diagram, you can find one more row of differences,called the second differences.
6. a. Finish filling in the row of second differences in the diagramon Student Activity Sheet 7.
b. What do you notice about the second differences? If thediagram were continued to the right, find the next two seconddifferences.
c. How can you use the patterns of the second differences andfirst differences to find the areas of leaves that have heights of13 cm and 14 cm? Continue the diagram on Student Activity
Sheet 7 for these new values.
d. Use the area formula for poplar leaves (A = 1��2h2) to verify yourwork in part c.
Height (in cm)
Area (in cm2)
First Difference
18
6.5 7.5
6 7 8 9 10 11 12
24.5 32 ? ? ??
? ? ? ?
Height (in cm)
Area (in cm2)
First Difference
18
6.5 7.5
6 7 8 9 10 11 12
24.5 32 ? ? ?
Second Difference
?
? ? ? ?
1 1 ? ? ?
Assessment Pyramid
5c
Identify linear patterns intables and graphs.
25 Ups and Downs

Section C: Differences in Growth 25T
Hints and CommentsMaterials Student Activity Sheet 7, (one per student); Student Activity Sheet 8, (one per student)
Overview
Students now investigate the second differences inthe areas of the leaves: These are differences betweenthe differences.
About the Mathematics
In Section A, students found that for linear patterns,the first differences are equal for equal timedifferences. For quadratic relationships, the firstdifferences are not equal, but the second differencesare equal for equal steps in the table.
First and second differences are also discussed in theunit Patterns and Figures. The study of differences isnamed differential calculus. It is an intuitivepreparation for the more formal mathematics offinding derivatives. In the Mathematics in Contextcurriculum, the study of differences is the endpoint ofpreparing for calculus. This lays a conceptualfoundation for calculus at high school.
Solutions and Samples
5. a.
The differences increase by one each time.
b.
c. The points lie on a straight line.
6. a. See the diagram for part c below.
b. The second difference is always 1.
c. You begin with the 1 in the bottom row andwork upward.
d. A � 1__2 � 132 � 84.5 cm2;
A � 1__2 � 142 � 98 cm2.
Height (in cm)
Area (in cm2)
6
18
7
24.5
8
32
9
40.5
10
50
11
60.5
12
72
6.5 7.5 8.5 9.5 10.5 11.5
Am
ou
nt
of
Dif
fere
nce
Difference Number
14
13
12
11
10
9
8
7
6
0 1 2 3 4 5 6 7 8 9 10
8.5 9.5 10.5 11.5
1 1 1 1
12.5 13.5
1 1
40.5 50 60.5 72 84.5 98Height (in cm)
Area (in cm2)
First Difference
18
6.5
6 7 8 9 10 11 12
24.5
7.5
32
1
13 14
Second Difference

Notes7 This problem is critical.At this point students needto realize the commonfeatures of quadraticrelationships.
After problem 8, you maywant to have an in-depthclass discussion about theprevious problems. Discusshow the differences can befound and what they mean.
9a Discuss the usefulnessof calculated leaf areas of15.125 or 43.245. Ask, Whyisn’t useful to give youranswer to three decimalplaces? Why is it moreappropriate to round?
Differencesin Growth
C
Parent Involvement
After this page, you may ask students to tell family members what theyhave learned about differences in a table. This may inform parents aboutthe Mathematics in Context approach toward developing concepts relatedto calculus.
Reaching All Learners
7. a. What is the value for A (A �1��2 h
2) if h � 2 1��2 ?
b. How does the value of A for a poplar leaf change when youdouble the value of h? Use some specific examples to supportyour answer.
8. If the area of one poplar leaf is about 65 square centimeters (cm2),what is its height? Explain how you found your answer.
The table shown below is also printed on Student Activity Sheet 9.
9. a. Use Student Activity Sheet 9 to fill in the remaining areavalues in the table. Use this formula:
A �1��2 h
2
b. Graph the formula on the grid. Why do you think the graphcurves upward?
Differences in GrowthC
Height (in cm) 1 2 3 4 5 6 7 8
Area (in cm2) 0.5 2 4.5
Area of Black Poplar Leaves
80
75
70
65
60
55
50
45
40
35
30
25
20
15
10
5
0 1 2 3 4 5 6 7 8 9 10 11 12
Are
a (
in c
m2)
Height (in cm)
Assessment Pyramid
9b
Use algebraic models torepresent realistic situations.
26 Ups and Downs
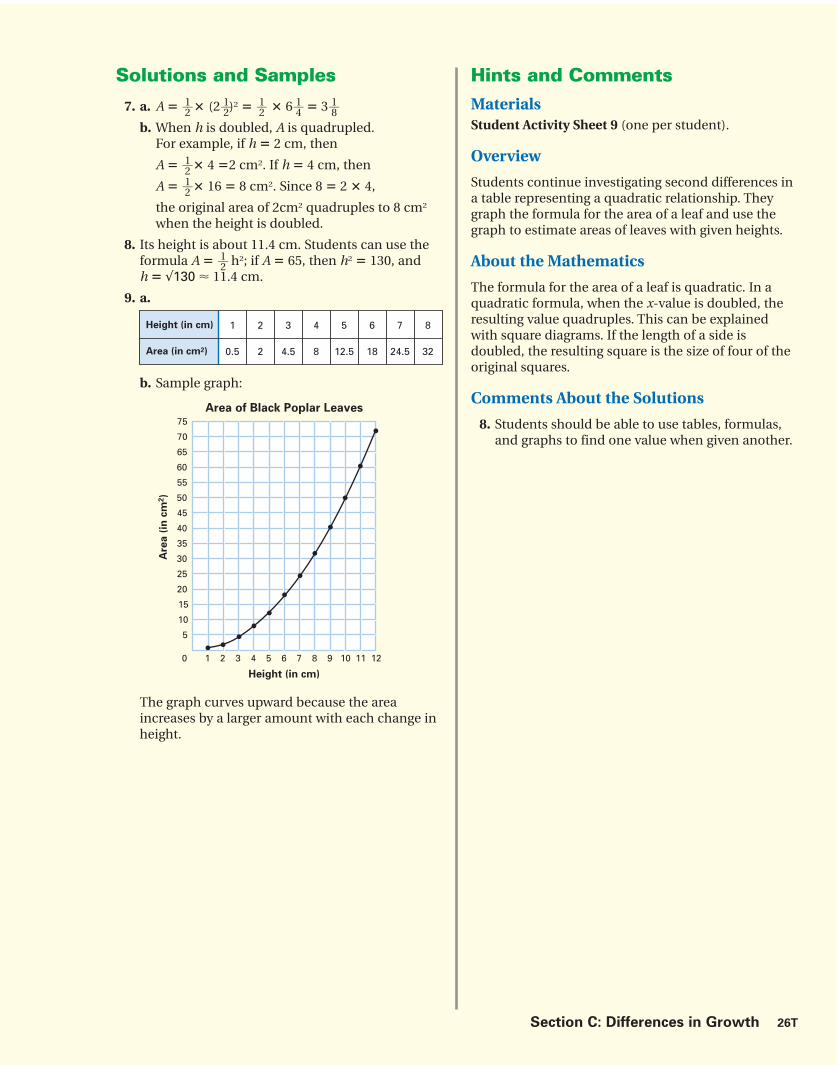
Section C: Differences in Growth 26T
Hints and CommentsMaterials Student Activity Sheet 9 (one per student).
Overview
Students continue investigating second differences ina table representing a quadratic relationship. Theygraph the formula for the area of a leaf and use thegraph to estimate areas of leaves with given heights.
About the Mathematics
The formula for the area of a leaf is quadratic. In aquadratic formula, when the x-value is doubled, theresulting value quadruples. This can be explainedwith square diagrams. If the length of a side isdoubled, the resulting square is the size of four of theoriginal squares.
Comments About the Solutions
8. Students should be able to use tables, formulas,and graphs to find one value when given another.
Solutions and Samples
7. a. A � 1__2 � (2 1__
2)2 � 1__2 � 6 1__
4 � 3 1__8
b. When h is doubled, A is quadrupled. For example, if h � 2 cm, then
A � 1__2 � 4 �2 cm2. If h � 4 cm, then
A � 1__2 � 16 � 8 cm2. Since 8 � 2 � 4,
the original area of 2cm2 quadruples to 8 cm2
when the height is doubled.
8. Its height is about 11.4 cm. Students can use theformula A � 1__
2 h2; if A � 65, then h2 � 130, and h � √130 � 11.4 cm.
9. a.
b. Sample graph:
The graph curves upward because the areaincreases by a larger amount with each change inheight.
Height (in cm)
Area (in cm2)
1
0.5
2
2
3
4.5
4
8
5
12.5
6
18
7
24.5
8
32
Area of Black Poplar Leaves75
70
65
60
55
50
45
40
35
30
25
20
15
10
5
0 1 2 3 4 5 6 7 8 9 10 11 12
Are
a (
in c
m2)
Height (in cm)
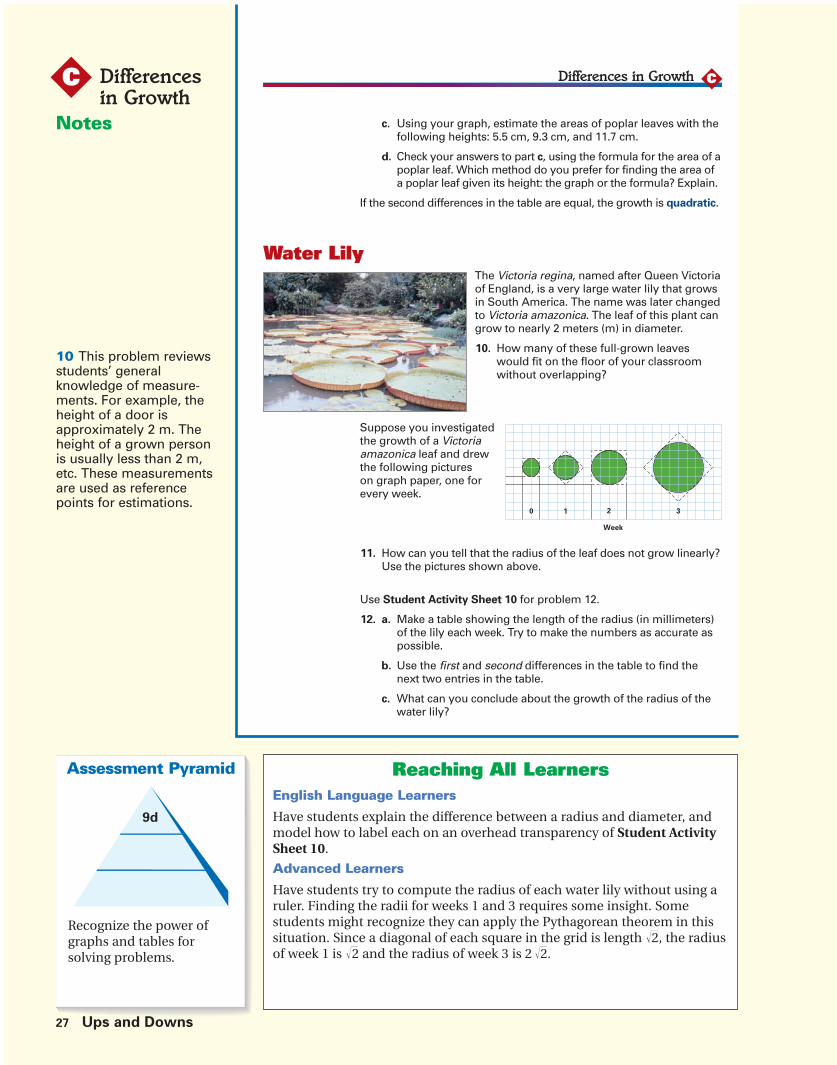
Notes
10 This problem reviewsstudents’ generalknowledge of measure-ments. For example, theheight of a door isapproximately 2 m. Theheight of a grown personis usually less than 2 m,etc. These measurementsare used as referencepoints for estimations.
Differencesin Growth
C
English Language Learners
Have students explain the difference between a radius and diameter, andmodel how to label each on an overhead transparency of Student ActivitySheet 10.
Advanced Learners
Have students try to compute the radius of each water lily without using aruler. Finding the radii for weeks 1 and 3 requires some insight. Somestudents might recognize they can apply the Pythagorean theorem in thissituation. Since a diagonal of each square in the grid is length ��2, the radiusof week 1 is ��2 and the radius of week 3 is 2 ��2.
Reaching All Learners
CDifferences in Growth
c. Using your graph, estimate the areas of poplar leaves with thefollowing heights: 5.5 cm, 9.3 cm, and 11.7 cm.
d. Check your answers to part c, using the formula for the area of apoplar leaf. Which method do you prefer for finding the area ofa poplar leaf given its height: the graph or the formula? Explain.
If the second differences in the table are equal, the growth is quadratic.
Water LilyThe Victoria regina, named after Queen Victoriaof England, is a very large water lily that growsin South America. The name was later changedto Victoria amazonica. The leaf of this plant cangrow to nearly 2 meters (m) in diameter.
10. How many of these full-grown leaveswould fit on the floor of your classroomwithout overlapping?
Suppose you investigatedthe growth of a Victoriaamazonica leaf and drewthe following pictures on graph paper, one forevery week.
Week
32100 1 32
11. How can you tell that the radius of the leaf does not grow linearly?Use the pictures shown above.
Use Student Activity Sheet 10 for problem 12.
12. a. Make a table showing the length of the radius (in millimeters)of the lily each week. Try to make the numbers as accurate aspossible.
b. Use the first and second differences in the table to find thenext two entries in the table.
c. What can you conclude about the growth of the radius of thewater lily?
Assessment Pyramid
9d
Recognize the power ofgraphs and tables for solving problems.
27 Ups and Downs

Section C: Differences in Growth 27T
Hints and CommentsMaterials centimeter rulers, (one per student);Student Activity Sheet 10 (one per student)transparency of Student Activity Sheet 10 (optional)
Overview
Students investigate the growth pattern of the radiusof a water lily. They compare the lily’s radius atdifferent growth stages to determine whether or notthe growth pattern is linear or quadratic.
About the Mathematics
The shape of the water lily leaf used hereapproximates the general shape of a circle. Thereforethe pictures can be used to represent a growth modelin a realistic situation.
Comments About the Solutions
9. d. Students may have different preferences. It takes less time to estimate from the graph, but the formula gives more precise values.
Solutions and Samples
9. c. height 5.5 cm area about 15 cm2
height 9.3 cm area about 43 cm2
height 11.7 cm area about 68 cm2
Allow a reasonable range for the answers of thearea because students have to read them fromthe graph.
d. Discuss answers in class. Some students mayprefer the graph because they can just read offthe estimated values without doing anycalculations. Others may prefer to have theexact calculations by using the formula.
10. Estimates will vary, depending on the size andlayout of your classroom.
11. Answers will vary. Some students may say thatthey can tell from the differences in sizes of theleaf that the radius does not grow the sameamount every week.
12. a. Tables will vary. Sample table:
b. Answers will vary, depending on the tablesstudents made. Sample response:
first differences: 2, 3, 4, so the next two are 5 and 6
second differences: 1
The next two entries in the table are:
c. The growth is not linear (the first differencesare not equal). The growth of the radius of thewater lily is quadratic because the seconddifferences in the table are equal.
Week
Radius(in mm)
0
5
1
7
2
10
3
14
Week
Radius(in mm)
0
5
1
7
2
10
3
14
4
19
5
25

Notes
You may need to review theconcept of area and remindstudents that area ismeasured in square units
Read and discuss withstudents the text anddiagrams about how toreallot the area of a circle.
Briefly review students’solutions and strategies for these problems,focusing especially onproblems 13c and 14b.Review that r � r can bewritten as “r squared,”using an exponent.
14b If students are havingdifficulty, you may suggestthat they look at the firstand second differences.
Differencesin Growth
C
Hands-On Learning
Have students draw and cut out the pictures represented on this page ongraph paper to enhance their understanding of the relationship betweenthe area of the original circle and the area of the square.
Extension
Ask, What is the area of a circle with a radius of 1, 2, 4, 8, 16, 32 in.?Set up this problem as a table.
Ask, What is the relationship between the radius and the area in the table?
Reaching All Learners
The area of the leaves of Victoria amazonica is more important thanthe length of the radius if you want to compare the sizes of leaveswhile they grow. The following series of pictures shows one way ofapproximating the area of a circle if you know the radius.
Using these pictures, you can show that if a circle has a radius of fiveunits, the area is about 75 square units.
13. a. Explain how the pictures show the area is about 75 squareunits.
b. Describe how you can find the area of a circle if you know itsradius is ten units.
c. Describe how you can find the area of any circle if you knowthe radius.
To find the area of a circle, you can use the general rule you found inthe previous problem. The formula below is more accurate:
area of a circle � π � r � r, or
area of a circle ≈ 3.14 � r � r, where r is the radius of the circle
14. a. Use the answers you found in problem 12. Make a new tableshowing the area of the leaves of the water lily each week.
b. Does the area of the leaves show linear or quadratic growth?Explain your answer.
Differences in GrowthC
Assessment Pyramid
14b
Reason about situations ofgrowth in terms of slope and increase.
28 Ups and Downs
Radius 1 2 4 8 ….
Area ….

Section C: Differences in Growth 28T
Hints and CommentsMaterials calculators (one per student);
Overview
Students review the formula for the area of a circlewithin the context of water lily leaves.
About the Mathematics
The conventional formula for the area of a circle isoften better understood when the circle’s area isvisually “reallotted” to make three squares, each withsides equal to the circle’s radius. Students may recallthis strategy from the unit Reallotment. Students arealso formally introduced to the formulas for area andperimeter of a circle, using π, in that unit.
Planning
Students may work in pairs or in small groups onproblems 13 and 14.
Comments About the Solutions
13. a. You may make a drawing of this circle on theboard or overhead projector and demonstratehow the circle’s area can be reallotted to makethree squares. You may need to explain how thepicture of the three squares can be representedusing the formula A � 3 � r � r. The 3 refers tothe 3 squares, and r � r refers to the area ofeach square. Since the circle’s wedges do notmake an exact fit in the spaces, the formulaA � 3 � r � r is an approximation of theconventional formula, A � π � r � r.
Solutions and Samples
13. a. The radius is the length of the side of a smallsquare. Since each square has sides of 5 units,they each have areas of 25 square units (5�5 � 25 square units). Since there are 3 squares(that represent the area of the one circle), thearea of the circle is about 75 square units (3� 25 � 75 square units).
Another explanation: The area of the square is 10 � 10 � 100; the shaded part is 3__4 of this,or 75.
b. If the radius is 10 units, the area is 100 � 3 � 300square units.
c. If you know the radius of the circle, you can findthe area by multiplying the radius by itself andthen multiplying that product by three.
14. a. Tables will vary since the radius was measuredby the students. Sample table:
b. first differences: 75.5; 160; 301
second differences: 84.5; 141
The growth is neither linear nor quadratic.
Note: You may want to use an estimated 3 insteadof 3.14 in the formula
Area of a Circle � 3 � r � r
or you may remind your students of the use of π.
Week
Area(in mm2)
0
78.5
1
153.9
2
314
3
615.4

Notes
Encourage students toorganize the information ina table before answeringproblem 15.
15a Ask. If the weed didgrow linearly, how muchwould it grow each year?(200 km2)
Differencesin Growth
C
Vocabulary Building
Review what “growing linearly” means (growing the same amount eachtime period, which is in this case, about 10 years).
Intervention
You might encourage students to use a trial-and-error strategy with theircalculators. If students are having difficulty, you might give the hint thatthey are allowed to round off the area of 1959 from 199 to 200.
Reaching All Learners
CDifferences in Growth
The waterweed Salvinia auriculata, found in Africa, is a fast-growingweed. In 1959, a patch of Salvinia auriculata was discovered in LakeKariba on the border of what are now Zimbabwe and Zambia. Peoplenoticed it was growing very rapidly.
Aquatic Weeds
The first time it was measured, in 1959,it covered 199 square kilometers (km2).A year later, it covered about 300 km2.In 1963, the weed covered 1,002 km2 ofthe lake.
15. a. Did the area covered by theweed grow linearly? Explain.
b. Was the growth quadratic?Explain.
Lake Albert
LakeKariba
Lake Nyasa
Lake Edward
KENYA
ERITREA
SUDAN
NIGER
IA
NAMIBIA
CHAD
SOUTH AFRICA
TANZANIA
DEM. REP. OF THE CONGO
ANGOLA
MOZAMBIQUE
BOTSWANA
ZAMBIA
GABON
CENTRAL AFRICAN REPUBLIC
UGANDA
SWAZILAND
LESOTHO
MALAWI
BURUNDI
RWANDA LakeVictoria
CAMEROON
ZIMBABWE
REP. OF
THE CONGO
I n d i a nO c e a n
Red Sea
Gulf of Aden
Gulf ofOman
A t l a n t i cO c e a n
Africa
29 Ups and Downs
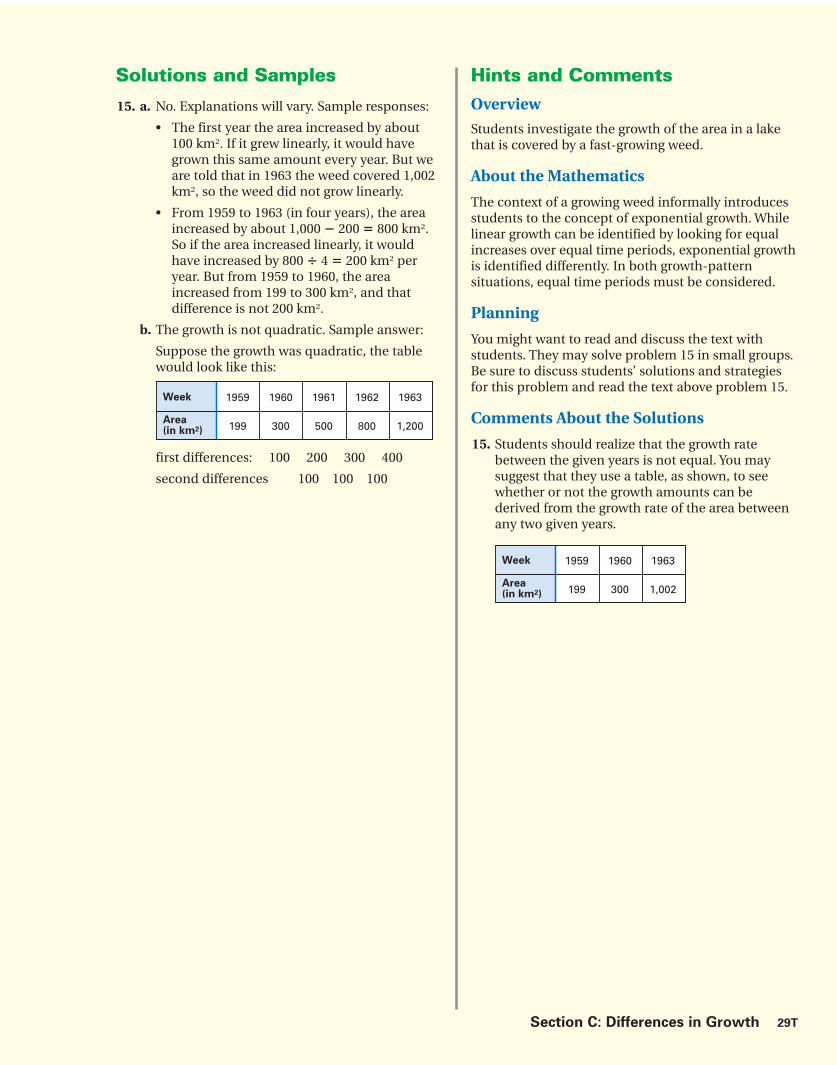
Section C: Differences in Growth 29T
Hints and CommentsOverview
Students investigate the growth of the area in a lakethat is covered by a fast-growing weed.
About the Mathematics
The context of a growing weed informally introducesstudents to the concept of exponential growth. Whilelinear growth can be identified by looking for equalincreases over equal time periods, exponential growthis identified differently. In both growth-patternsituations, equal time periods must be considered.
Planning
You might want to read and discuss the text withstudents. They may solve problem 15 in small groups.Be sure to discuss students’ solutions and strategiesfor this problem and read the text above problem 15.
Comments About the Solutions
15. Students should realize that the growth ratebetween the given years is not equal. You maysuggest that they use a table, as shown, to seewhether or not the growth amounts can bederived from the growth rate of the area betweenany two given years.
Solutions and Samples
15. a. No. Explanations will vary. Sample responses:
• The first year the area increased by about100 km2. If it grew linearly, it would havegrown this same amount every year. But weare told that in 1963 the weed covered 1,002km2, so the weed did not grow linearly.
• From 1959 to 1963 (in four years), the areaincreased by about 1,000 � 200 � 800 km2.So if the area increased linearly, it wouldhave increased by 800 � 4 � 200 km2 peryear. But from 1959 to 1960, the areaincreased from 199 to 300 km2, and thatdifference is not 200 km2.
b. The growth is not quadratic. Sample answer:
Suppose the growth was quadratic, the tablewould look like this:
first differences: 100 200 300 400
second differences 100 100 100
Week
Area(in km2)
1959 1960 1963
199 300 1,002
Week
Area(in km2)
1959 1960 1961 1962 1963
199 300 500 800 1,200

Notes
16 By coloring the squareunits in the area, studentswill realize that the totalnumber of squares theyhave colored at the end ofthe current year is equal tothe number they will colornext year. This preparesstudents to later write arecursive formula todescribe this exponentialgrowth situation.
Make sure studentsunderstand the termgrowth factor.
Differencesin Growth
C
Intervention
Some students may have difficulty with the concept of doubling in problem 17. They may use the following incorrect reasoning: There are 8 squares colored this year. Double that and you get 16, so I need to color 16 new squares. Instead, they should make sure they have colored enough new squares to match the total number of squares that will be covered byweeds at the end of each year.
Reaching All Learners
Lake Victoria is about 1,000 milesnorth of Lake Kariba. Suppose a different weed were found there.
Here is a map of Lake Victoria witha grid pattern drawn on it. Onesquare of this grid is colored in torepresent the area covered by theweed in one year.
Differences in GrowthC
RWANDA
BURUNDI
LakeLakeVictoriaVictoria
UGANDA
TANZANIA
KENYA
Use Student Activity Sheet 11 to answer problems 16–19.
Suppose the area of the weeds in Lake Victoria doubles every year.
16. If the shaded square represents the area currently covered by theweed, how many squares would represent the area covered nextyear? A year later? A year after that?
Angela shows the growth of the area covered by the weed by coloringsquares on the map. She uses a different color for each year. Sheremarks, “The number of squares I color for a certain year is exactlythe same as the number already colored for all of the years before.”
17. Use Student Activity Sheet 11 to show why Angela is or is notcorrect.
18. How many years would it take for the lake to be about half covered?
19. How many years would it take for the lake to be totally covered?
Carol is studying a type of bacteria at school. Bacteria usually reproduce by cell division. During cell division, a bacterium splits inhalf and forms two new bacteria. Each bacterium then splits again,and so on. These bacteria are said to have a growth factor of twobecause their amount doubles after each time period.
Double Trouble
30 Ups and Downs

Section C: Differences in Growth 30T
Hints and CommentsMaterials
Student Activity Sheet 11 (one per student); colored pencils (one box per group)
Overview
Students use a map to investigate the area of weedgrowth on a lake over a time span.
About the Mathematics
By the end of this section, students shouldunderstand the basis for exponential growth used inthis section, doubling. They should be able to look atdoubling patterns in two different ways, as shownbelow.
To find the area for the fourth year, take the area ofthe current year (8) and add the same amount:
8 � 8 � 16 square units.
This leads to the formula
NEXT � CURRENT � CURRENT.
Another way to find the area for the fourth year is totake the previous year’s area and multiply it by two: 2 � 8 � 16 square units.
This leads to the formula:
NEXT � 2 � CURRENT
A formal discussion about these recursive formulas isnot necessary at this point.
Planning
Students may work on problems 16–19 in pairs or insmall groups. Be sure to discuss students’ solutionsand strategies for these problems.
Solutions and Samples
16. Next year: two squares
A year later: four squares
A year after that: eight squares
17. Angela is correct. Sample explanations:
In one year, there are 8 squares covered. The nextyear, that number will double to make 16 squarescovered. So you need to color 8 additionalsquares.
To double something, you add that amount toitself (2 � area � area � area).
Using the map:
18. It would take between five and six years for thelake to be half covered. Sample explanation:
The lake covers an area of 100 square units. Afterfive years, 32 square units would be covered, andafter six years, 64 square units would be covered.So it would take somewhere between five and sixyears for the lake to be half covered.
19. It would take between six and seven years for thelake to be fully covered. Explanations will vary.Sample explanation:
The lake covers an area of 100 square units. Aftersix years, 64 square units would be covered, andafter seven years, more than 100 square unitswould be covered. So it would take somewherebetween six and seven years for the lake to befully covered.
Year
Area (squared)
0
1
� 1
1
2
2
4
3
8
4
16
� 2 � 4 � 8
Year
Area (squared)
0
1
� 2
1
2
2
4
3
8
4
16
� 2 � 2 � 2
RWANDA
BURUNDI
LakeLakeVictoriaVictoria
Lake Albert
UGANDA
TANZANIA
KENYA

Notes
21 Students might havedifficulty in using anappropriate scale for theaxes. Be sure to discussthe idea that the graphshows that doublingresults in an increasinggrowth rate.
22 Make sure studentsunderstand that the termgrowth factor refers tomultiplication and notadditive growth.
22 You may ask studentshow they might find amore precise answer tothis problem. Somestudents might suggestusing a graph.
Differencesin Growth
C
Vocabulary Building
Remind students of the term scale factor from the unit Ratio and Rates.Have students explain what factor means in their own words. Highlightstudent responses that recognize the relationship between factors andmultiplication; for example, “factors are numbers you multiply together toget another number.”
Reaching All Learners
CDifferences in Growth
Suppose the number of bacteria doubles every20 minutes.
20. Starting with a single bacterium, calculatethe number of existing bacteria after twohours and 40 minutes. Make a table likethe one below to show your answer.
Time (in minutes) 0 20 40
Number of Bacteria
21. a. Are the bacteria growing linearly or in a quadratic pattern?Explain.
b. Extend the table to graph the differences in the number of bacteria over the course of two hours and 40 minutes.
c. Describe the graph.
22. Reflect How will the table and the graph in problem 21 change ifthe growth factor is four instead of two?
Two thousand bacteria are growing in the corner of the kitchen sink.You decide it is time to clean your house. You use a cleanser on thesink that is 99% effective in killing bacteria.
23. How many bacteria survive your cleaning?
24. If the number of bacteria doubles every 20 minutes, how long willit take before there are as many bacteria as before?
25. Find a NEXT-CURRENT formula for the growth of the bacteria.
This type of growth, where each new value is found by multiplyingthe previous number by a growth factor, is called exponential growth.
� 6 � 6 � 6
Time (in hours) 0 1 2 3
Number of Bacteria 1 6 36 216
Assessment Pyramid
25
20, 21
Describe exponential growthwith recursive formulas.
Identify patterns from a table and graph
31 Ups and Downs

Section C: Differences in Growth 31T
23. There will be 20 bacteria left. Students may reasonthat 99% are killed, so 1% survive, and 1% of 2,000is 20.
24. Between 120 and 140 minutes. Some studentsmay use a table to find the answer. Sample table:
25. NEXT � CURRENT � 2
Solutions and Samples
20. After 2 hours and 40 minutes, or 160 minutes,there are 256 bacteria.
21. a. No. The bacteria are not growing in a linearpattern. Explanations will vary. Sampleexplanation:
If you calculate the differences, you will seethat the number of bacteria is not increasing by equal amounts.
The bacteria are not growing in a quadraticpattern. If you look at the second differences in the table, you can see they are not equal.
b.
c. Descriptions will vary. Sample description:
The graph is not a straight line. It becomessteeper and steeper, showing that the numberis increasing faster and faster.
22. Table:
Graph:
Hints and CommentsMaterials graph paper (one sheet per student)
Overview
Students are introduced to the concept of a growthfactor. They use the given growth factor to solveproblems about the growth of bacteria.
About the Mathematics
Exponential growth can be modeled with repeatedmultiplication. In the table below, the multiplicationfactor (� 2) is the ratio between the two numbers foradjoining time periods. In exponential patterns, thismultiplication factor is known as the growth factor.Some students may remember the term factor ofenlargement from the unit Ratios and Rates. Use thisterm to help reinforce the idea that a factor deals withthe operation of multiplication.
Planning
Read and discuss the text on Student Book, page 31,together. Students may work on problems 20 and 21individually or in small groups. These problems mayalso be used as informal assessment. Problems 22 and23 may be assigned as homework.
Comments About the Solutions
20. Some students may arrive at the incorrect answerof 16 by using the following table.
Time(in minutes)
Number ofBacteria
0
1
20
2
40
4
80
8
160
16
� 2
� 2
Time(in minutes)
Number ofBacteria
0
1
20
2
40
4
60
8
80
16
100
32
120
64
140
128
160
256
Time(in minutes)
Number ofBacteria
0
1
20
2
40
4
60
8
� 1 � 2 � 4
0 20 40 60 80 100 120 140 160
20
40
60
80
100
120
140
160
180
200
220
240
260
Nu
mb
er
of
Bacte
ria
Time (in minutes)
Growth of Bacteria
0 20 40 60 80 100 120 140 160
20
40
60
80
100
120
140
160
180
200
220
240
260
Nu
mb
er
of
Bacte
ria
Time (in minutes)
Growth of Bacteria
Time(in minutes)
Number ofBacteria
0
1
20
4
40
16
60
64
Time(in minutes)
Number ofBacteria
0
20
20
40
40
80
60
160
80
320
100
640
120
1,280
140
2,560

Notes
The Summary for thissection reiterates each ofthe various strategies forusing table differences toidentify growth as linear,quadratic, or exponential.Be sure to go through theSummary carefully. It iscritical that studentsunderstand the differencebetween quadratic andexponential growth.
Differencesin Growth
C
Parent Involvement
Have parents review the section with their child to relate the Check YourWork problems to the problems from the section.
Reaching All Learners
Differences in Growth
Growth can be described by a table, a graph, or an equation.If you look at differences in a table, you know that:
• if the first differences are equal, the growth is linear. The rate ofchange is constant. In the table, the height of a plant is measuredeach week, and each week the same length is added to theprevious length.
• if the first differences are not equal but the second differences areequal, the growth is quadratic.
In the table it shows the relationship between length and area ofsquares. If the length increases by 1 cm each time, the “seconddifferences” are equal.
C
�5 �5 �5 �5 �5
Time (in weeks)
Height (in cm)
0 1 2 3 4 5
10 15 20 25 30 35
�3 �5 �7 �9
�2 �2 �2 �2
�11
Length of Square (in cm)
Surface Area of Square (in cm2)
1
1
2
4
3
9
4
16
5
25
6
36
32 Ups and Downs

Section C: Differences in Growth 32T
Hints and CommentsOverview Students review different types of growth by lookingat tables.
Writing Opportunity
Have students add to the Summary by writing aboutgraphs that represent the different types of growth.They may use the tables shown in the Summary todraw graphs.
Planning
After finishing Section C, you may assign problems forextra practice from the Additional Practice section onpages 50 and 51 of the Student Book.

Differencesin Growth
C
Extension
To reinforce the relationship between patterns and growth factors, ask, Todouble a number what can you do? (Multiply by 2.) This is a growth factor of 2. To triple a number what can you do? (Multiply by 3.) This is a growthfactor of 3.
Reaching All Learners
The table below shows that the area of a weed is being measuredyearly and that the weed has a growth factor of two. Notice thathaving a growth factor of two means that the area covered by theweed is doubling every year.
• if each value in the table is found by multiplying by a growth
factor, the growth is exponential.
Consider the following formula for the area of a leaf: A �1��3 h2
Height (h) is measured in centimeters; area (A) is measured in squarecentimeters.
1. a. Use the formula for the area of a leaf to fill in the missingvalues in the table.
b. Is the growth linear, quadratic, or exponential? Why?
The next table shows a model for the growth of dog nails.
2. a. How can you be sure the growth represented in the table is linear?
b. What is the increase in length of the dog nail per month?
� 2 � 2 � 2 � 2
Year
Time (in months) 0 1 2 3 4 5
Length (in mm) 15 15.5 16 16.5 17 17.5
h (in cm) 3 4 5 7 8
A (in cm2) 12
Year 1 2 3 4 5
Area (in km2) 400 800 1,600 3,200 6,400
Assessment Pyramid
1, 2
Assesses Section C Goals
33 Ups and Downs

Section C: Differences in Growth 33T
Hints and CommentsOverview Students use the Check Your Work problems as self-assessment. The answers to these problems areprovided in the Student Book.
Solutions and SamplesAnswers to Check Your Work
1. a. Remember that squaring a number goes beforemultiplying. An example, for h � 4:
A � 1__3 � (42) � 1__
3 � 4 � 4 � 16__3
A � 5 1__3 (Note that you should always write
fractions in simplest form and change improper fractions to mixed numbers.)
b. The first differences are: 2 1__3 , 3, 3 2__
3 , 4 1__3 ,
and 5; the growth is not linear because the
first differences in the table are not equal.
The second differences are: 2__3 , 2__
3 , 2__3 , and 2__
3 ,
the growth is quadratic because the second
differences are equal.
The growth is not exponential because thenumbers in the second row are not multipliedby the same number to get from one to thenext.
2. a. The first differences in the table are equal; theyare 0.5. Therefore, you know the growth islinear.
b. The increase in length of the dog’s nail eachmonth is 0.5 mm.
h (in cm)
A (in cm2)
3
3
4
5
5
8
6
12
7
16
8
211 3
1 3
1 3
1 3

Notes
For Further Reflection
The reflection question ismeant to summarize andextend what students havelearned in the section.
Differencesin Growth
C
Writing Opportunity
Problem 4, which many students find challenging, is a classic problem thatcompares additive and exponential growth. Have students write in theirnotebooks about which choice they would make and why.
Reaching All Learners
Differences in Growth
Use this formula for the next problem:
area of a circle ≈ 3.14 � r � r, where r is the radius of the circle
3. a. Find the area of a circle with the radius 2.5. You may use acalculator.
b. How many decimal places did you use for your answer?Explain why you used this number of decimal places.
c. Find the radius of a circle if the area is 100 cm2. You may use a calculator. Show your calculations.
Suppose that you are offered a job for a six-month period and thatyou are allowed to choose how you will be paid:
$1,000 every week or 1 cent the first week,2 cents the second week,4 cents the third week,8 cents the fourth week,and so on…
4. Which way of being paid would you choose? Why?
From birth to age 14, children grow taller. Think about your owngrowth during that time and describe whether you think it is linear,quadratic, exponential, or other. Give specific examples.
C
Assessment Pyramid
4
3
Assesses Section C Goals
34 Ups and Downs

Section C: Differences in Growth 34T
Remembering that in the second way I have tofind how much I would make each week and addup what I was already paid, in week 22, I wouldhave made $20,971.52. My total earnings afterthat week would be $41,943.03. So the doublingmethod is better.
For Further Reflection
Answers will vary. Students should recognize thatgrowth is often erratic. While there may be briefperiods where growth appears to jump faster andfaster—a teenage “growth spurt”—between ages 2 and7, growth might appear to be linear. In their response,it is more important that students are able to givecorrect examples for how they choose to describetheir growth.
Solutions and Samples
3. a. 3.14 � 2.5 � 2.5 ≈ 19.6
Area of the circle is about 19.6.
Note that in the given radius of 2.5, no unitswere mentioned.
b. You may have noted that the answer 19.625 was shown in the calculator window.
However, because the radius is given in onedecimal, the answer should also be in onedecimal.
c. If you do not have a calculator, try some carefully chosen examples.
You know that 3 � 25 � 75, so r > 5.
3 � 36 � 108, so r < 6; you now know that r isbetween 5 and 6.
Try r � 5.5.3.14 � 5.5 � 5.5 ≈ 95 (too little)
Try r � 5.6.3.14 � 5.6 � 5.6 ≈ 98 (too little)
Try r � 5.7.3.14 � 5.7 � 5.7 ≈ 102 (too much)
The answer will be r ≈ 5.6 or r ≈ 5.7.
Using a calculator:
3.14 � r � r � 100
r � r � 100 � 3.14 � 31.847…. (Don’t round offuntil you have the final answer.)
Find a number that gives 31.84…. as a result ifsquared. Or:The square root (√ ) of 31.847…. is about 5.6.
Radius r is about 5.6.
4. Discuss your answer with a classmate. Samplecalculations:
Doubling a penny adds up to more money in asix-month period than receiving $1,000 a week. I calculated how much money I would make aftersix months, using the first case: 26 weeks � $1,000 per week � $26,000.
For the second case, I calculated the amount Iwould receive week by week with a calculator:
In week ten, the amount would be $5.12, and alltogether I would have been paid $10.23.
In week twenty, the amount I would make wouldalready be $5,242.88, and the total I would haveearned would be $10,485.75.
After 23 weeks, my pay for one week wouldalready be $41,943.04, so for that one week Iwould make more than I would in six months inthe first case. So I would choose the doublingmethod.
Hints and CommentsOverview Students use the Check Your Work problems as self-assessment. The answers to these problems areprovided in the Student Book.
Comments About the Problems
Problem 4 of the Check Your Work section is a classicproblem.

35A Ups and Downs Teachers Matter
Teachers MatterD
Section Focus
Section D introduces the terms cycle and period to describe featuresof a periodic phenomenon. Periodic graphs are investigated withinthe context of tides, temperature changes in an air-conditioned room,blood pressure, and laps on a racetrack.
Pacing and Planning
Day 12: Fishing Student pages 35–37
INTRODUCTION Problems 1–3 Draw a simple graph to show how water levels in the ocean change over time.
CLASSWORK Problems 4 and 5 Interpret and create a tidal graph thatrepresents the change in water levelin tidal regions.
HOMEWORK Problems 6 and 7 Compare tidal graphs and describe the changes in water level.
Day 13: The Air Conditioner Student pages 38–39
INTRODUCTION Problems 8 and 9 Interpret a graph representing temperaturechanges in an air-conditioned room.
CLASSWORK Problems 10–12 Identify the period and label one cycle ina periodic graph.
HOMEWORK Problems 13–15 Read and interpret a periodic graph.
Day 14: Summary Student pages 40–42
INTRODUCTION Review homework. Review homework from Day 13.
CLASSWORK Check Your Work Student self-assessment: Create andinterpret periodic graphs.
ASSESSMENT Quiz 2 Assesses Section C and D Goals.
Additional Resources: Algebra Tools; Additional Practice, Section D, page 51

Teachers Matter Section D: Cycles 35B
Teachers Matter D
Materials
Student Resources
Quantities listed are per student.
• Student Activity Sheets 12 and 13
Teachers Resources
No resources required.
Student Materials
Quantities listed are per pair of students, unlessotherwise noted.
• Calculator
• Colored pencils, one box
• Graph paper (four sheets per student)
* See Hints and Comments for optional materials.
Learning Lines
Discern Different Types of Graphs
In Section A, students investigated a variety ofgraphs. In this section, a new type of graph isintroduced, the periodic graph.
Students interpret and draw a tidal graph that represents the change in water level in tidal regions.They describe the increase and decrease of thetemperature in an air-conditioned room and identify the period and cycle of several periodicgraphs. They do not use formulas and/or tablesthat describe periodic phenomena.
At the End of the Section: LearningOutcomes
Students identify the characteristics of a periodicgraph and are able to identify the cycle and periodin a periodic graph.
Bo
dy
Te
mp
era
ture
(°C
)
33
34
35
36
37
38
39
40
41
42
43

Notes
You may wish to start this section with a shortdiscussion about tides.Some students might notbe familiar with tides.Discuss how the water level goes up and downeach day.
2 Ask what should be oneach axis. (Time should beon the horizontal axis andthe water level should beon the vertical axis.)
CyclesD
Extension
Ask students to bring in some sample charts of tide information. A searchon the Internet for “tide charts” will indicate many options for information.Students may also want to explore how the sun and moon influence oceantides day to day and throughout the year.
Reaching All Learners
Camilla and Lewis are fishing in the ocean. Their boat is tied to a postin the water. Lewis is bored because the fish are not biting, so hedecides to amuse himself by keeping track of changes in the waterlevel due to the tide.
He makes a mark on the post every 15 minutes. He made the firstmark (at the top) at 9:00 A.M.
1. What do the marks tell you about the way the water level ischanging?
2. Make a graph that shows how the water level changed duringthis time.
3. What can you say about how the graph will continue? (Thinkabout the tides of the ocean.) You don’t need to graph it.
DCycles
Fishing
35 Ups and Downs

Section D: Cycles 35T
Hints and CommentsMaterialsgraph paper (optional, one sheet per student)
Overview
Students use marks on a post to draw a graph thatshows how the water level changes over time.
About the Mathematics
The marks on the post showing the differences inwater height are similar to the marks on the door andthe core samples of Section A. They all show a patternof change over time. Note that the marks on the posthere indicate a change in the rate of decrease.
The context of this page—the change of water level,which is influenced by the tides—also producescontinuous graphs. Because tide phenomena areperiodic events, the graphs also show a regular,repetitive pattern.
Planning
Students may work on problems 1–3 in pairs or insmall groups. Be sure to discuss students’ solutionsand strategies for these problems.
Comments About the Solutions
1. Make sure that students realize that the marks on the post were made consecutively from top to bottom.
2. Some students may trace the marks from thepost (from Student Book page 35) on the edgeof a strip of paper and use this strip to draw thefour points of the graph. The points of the graphcan then be connected. See the Solutions andSamples column. Some students may want to usegraph paper to draw the graph.
Solutions and Samples
1. Answers will vary. Sample responses:The water level is going down more and more.
The water level is decreasing at a faster andfaster rate.
2.
3. Answers will vary. Students’ responses shouldindicate that the graph may continue downwardfor a number of hours and then eventually beginto rise. Some students may say that the graph willrepeat the same pattern over time.
Time
9:00 9:15 9:30 9:45
Wa
ter
Le
ve
l

Notes
Ask students whether ornot these tidal graphs tellanything about the depthsof the water.
It is important to discusswhether or not this graphcould have a vertical linefor one section. Askstudents what it wouldmean to have a vertical linein the graph. (This wouldmean that the water leveldropped or rose a certainnumber of centimeters inzero seconds.)
4 Students can easily findthe times when it is safe to walk on the tide flats bydrawing a horizontal lineon the tidal graph.
CyclesD
Accommodation
You might want to make a transparency of the tidal graphs shown onStudent Book page 36 and have some students use the overhead projectorto show how they used the graphs to solve problem 4.
Intervention
If students have difficulty starting problem 4, ask, Where on the graph is thelowest level of the tide? (6:30 P.M. for April 3 and 11:30 A.M. for April 20.)Where is the water 45 cm above the lowest level? (All points at �43 cm forApril 3 and at �50 cm for April 20.)
Reaching All Learners
During low tide naturalists lead hikes along coastal tide flats. Theypoint out the various plant and animal species that live in this uniqueenvironment. Some of the plants and animals hikers see on the walkare seaweed, oystercatchers, curlews, plovers, mussels, jellyfish, andseals.
Walkers do not always stay dry during the walk; sometimes the watermay even be waist-high. Walkers carry dry clothing in their backpacksand wear tennis shoes to protect their feet from shells and sharpstones.
The graphs show the tides for the tide flats for two days in April.Walking guides recommend that no one walk in water deeper than 45 cm above the lowest level of the tide.
4. When is it safe to walk on the tide flats on these two days in April?
CyclesD
April 3
Water Level
(in cm)
Sea Level
+80
+60
+40
+20
0
-20
-40
-60
-80
Time
A.M.
1 3 5 7 9 11 1 3 5 7 9 11P.M.
April 20
Water Level
(in cm)
Sea Level
+80
+60
+40
+20
0
-20
-40
-60
-80
-100
Time
A.M.
1 3 5 7 9 11 1 3 5 7 9 11P.M.
High Tide, Low Tide
36 Ups and Downs

Section D: Cycles 36T
Hints and CommentsMaterials
transparency of the tidal graphs on Student Bookpage 36 (optional, one per class);
Overview Students interpret a tidal graph to solve a problemabout walking along the shore.
Planning
You might read this page and complete problem 4together as a whole-class activity.
Comments About the Solutions
4. The solution can be found by shading the sectionof the graph (or by drawing a horizontal line at aheight) that is 45 cm above the lowest level of thetide. See the Solutions and Samples column.
Note: It is only safe to walk along the DutchShallows after sunrise; this area could bedangerous in the dark.
Solutions and Samples
4. The times it would be safe to walk along thebeaches are:
April 3: from about 3:45 A.M. until about 8:20 A.M.(about 4.5 hours) and from about 3:15 P.M. untilabout 8:30 P.M. (about 5.25 hours)
April 20: from about 9:15 A.M. until about 1:45 P.M.(about 4.5 hours), and again at about 10:15 P.M.
Note: The levels of low and high tides are differentat different times.
+80
+60
+40
+20
sea level 0
–20
–40
–60
–80
–100
+80
+60
+40
+20
sea level 0
–20
–40
–60
–80
A.M. P.M.21 3 4 5 6 7 8 9 10 11 12 1 2 3 4 5 6 7 8 9 10 11 12
Tides on April 3
Time
Tides on April 20
Wa
ter
Le
ve
l (h
eig
ht
in c
m)
Wa
ter
Le
ve
l (h
eig
ht
in c
m)
Time
45 c
m
45 c
m
A.M. P.M.21 3 4 5 6 7 8 9 10 11 12 1 2 3 4 5 6 7 8 9 10 11 12

Notes
5 Students use the eightgiven points to draw agraph. The graph shouldnot have sharp zigzagedges, since the waterlevel increases anddecreases gradually.Students’ graphs will varyin precision and neatness.
5 Remind students that12 A.M. is midnight and12 P.M. is noon.
CyclesD
Advanced Learners
If you live near bodies of water that have tidal fluctuations, you can obtainlocal times for high and low tides in the local newspaper. Students couldthen use this information to draw additional tidal graphs.
Writing Opportunity
Make available a sample graph of fluctuation in tides from the Internet orsome other resource. Have students write a story to go along with thegraph. Also encourage students to make a table from the graph thatindicates the highs and lows for each day, in a format similar to the tableshown in problem 5.
Reaching All Learners
DCycles
In different parts of the world, the levels of high and low tides vary. The amount of time between the tides may also vary. Here is a tideschedule for the area near the Golden Gate Bridge in San Francisco,California.
5. Use the information in the table to sketch a graph of the waterlevels near the Golden Gate Bridge for these three days. UseStudent Activity Sheet 12 for your graph.
6. Describe how the water level changed.
7. Compare your graph to the graphs on the previous page. What similarities and differences do you notice?
Date Low High
Golden Gate Bridge
Aug. 7
Aug. 8
Aug. 9
2:00A.M. /12 cm1:24 P.M. /94 cm
2:59 A.M. /6 cm2:33 P.M. /94 cm
3:49 A.M. /0 cm3:29 P.M. /91 cm
9:20A.M. /131 cm7:47P.M. /189 cm
10:18 A.M. /137 cm8:42 P.M. /189 cm
11:04 A.M. /143 cm9:34 P.M. /186 cm
37 Ups and Downs
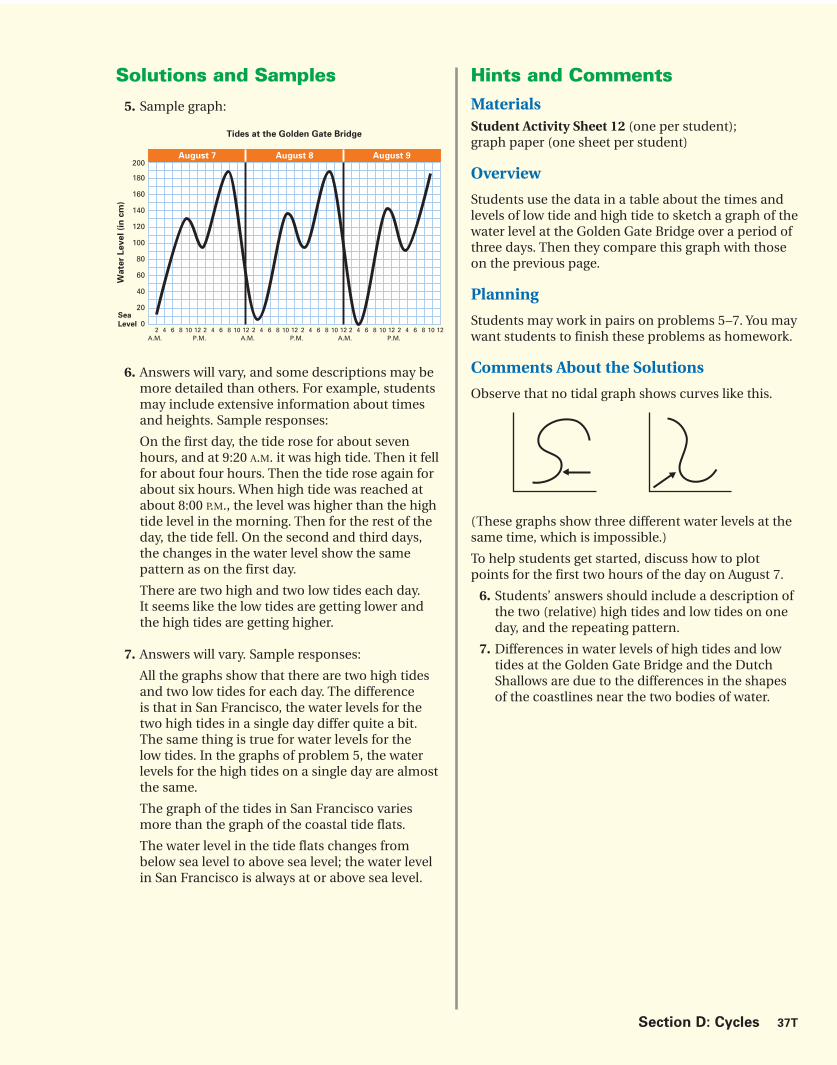
Section D: Cycles 37T
Hints and CommentsMaterialsStudent Activity Sheet 12 (one per student); graph paper (one sheet per student)
Overview
Students use the data in a table about the times andlevels of low tide and high tide to sketch a graph of thewater level at the Golden Gate Bridge over a period ofthree days. Then they compare this graph with thoseon the previous page.
Planning
Students may work in pairs on problems 5–7. You maywant students to finish these problems as homework.
Comments About the Solutions
Observe that no tidal graph shows curves like this.
(These graphs show three different water levels at thesame time, which is impossible.)
To help students get started, discuss how to plotpoints for the first two hours of the day on August 7.
6. Students’ answers should include a description ofthe two (relative) high tides and low tides on oneday, and the repeating pattern.
7. Differences in water levels of high tides and lowtides at the Golden Gate Bridge and the DutchShallows are due to the differences in the shapesof the coastlines near the two bodies of water.
Solutions and Samples
5. Sample graph:
6. Answers will vary, and some descriptions may bemore detailed than others. For example, studentsmay include extensive information about timesand heights. Sample responses:
On the first day, the tide rose for about sevenhours, and at 9:20 A.M. it was high tide. Then it fellfor about four hours. Then the tide rose again forabout six hours. When high tide was reached atabout 8:00 P.M., the level was higher than the hightide level in the morning. Then for the rest of theday, the tide fell. On the second and third days,the changes in the water level show the samepattern as on the first day.
There are two high and two low tides each day.It seems like the low tides are getting lower andthe high tides are getting higher.
7. Answers will vary. Sample responses:
All the graphs show that there are two high tidesand two low tides for each day. The differenceis that in San Francisco, the water levels for thetwo high tides in a single day differ quite a bit.The same thing is true for water levels for thelow tides. In the graphs of problem 5, the waterlevels for the high tides on a single day are almostthe same.
The graph of the tides in San Francisco variesmore than the graph of the coastal tide flats.
The water level in the tide flats changes frombelow sea level to above sea level; the water levelin San Francisco is always at or above sea level.
August 7 August 8 August 9
2 4 6 8 10 12 2 4 6 8 10 12 2 4 6 8 10 12 2 4 6 8 10 12 2 4 6 8 10 12 2 4 6 8 10 12
200
180
160
140
120
100
80
60
40
20
0
A.M. P.M. A.M. P.M. A.M. P.M.
Tides at the Golden Gate Bridge
Sea
Level
Wa
ter
Le
ve
l (i
n c
m)

Notes
By this point in the unit,students should be able tothink about periodicity interms of both the real-world context and thegraph.
9a and b This is the firstproblem in which studentsmust identify the periodand cycle in a periodicgraph. Point out that agraph’s cycle can be col-ored at different places onthe graph curve. Once onecycle is colored, it makes iteasy to identify the periodof the graph, the timeinterval along the horizon-tal axis that it takes tocomplete one cycle.
CyclesD
Vocabulary Building
If students are having difficulty, you might draw a different example of aperiodic graph and discuss the concepts of period and cycle with students.
Extension
You might discuss how the graph would change if the person had beenrunning and the heartbeat was twice as fast.
Reaching All Learners
Your heart pumps blood throughout your system of arteries.When doctors measure blood pressure, they usually measurethe pressure of the blood in the artery of the upper arm.
Your blood pressure is not constant. The graph on the right shows how blood pressure may change over time.
10. What can you tell about blood pressure just before aheartbeat?
11. What happens to blood pressure after a heartbeat?
12. Is this graph periodic? Explain your answer.
CyclesD
Blood Pressure
200
Time (in seconds)
Pre
ssu
re (
mm
Hg
)
50
heartbeat
Suppose the graph on the left shows thetemperature changes in an air-conditionedroom.
8. Describe what is happening in thegraph. Why do you think this is happening?
The Air Conditioner
0Tem
pera
ture
(°F
)
Time (in minutes)
Room Temperature
75°
70°
30 60
The graphs you have seen in this section have one thing in common:They have a shape that repeats. A repeating graph is called a periodic
graph. The amount of time it takes for a periodic graph to repeat iscalled a period of the graph. The portion of the graph that repeats iscalled a cycle.
9. a. How long (in minutes) is a period in the above graph?
b. On Student Activity Sheet 13, color one cycle on the graph.
Assessment Pyramid
9ab
Identify characteristics ofperiodic graphs.
38 Ups and Downs

Section D: Cycles 38T
Hints and CommentsMaterialsStudent Activity Sheet 13 (one per student)
Overview
Students interpret a graph that shows a repeatingpattern of temperature changes in an air-conditionedroom. Students are introduced to a new contextaddressing a cyclic process, blood pressure. Theyinvestigate a graph that shows how blood pressure can change over time.
About the Mathematics
The concepts of a periodic graph, a period, and a cycleare made explicit on this page. Although these are newmathematical concepts, students may already havesome understanding of periodic events, since repeatingpatterns are frequently found in science and nature.For example, sound and light waves show repeatingpatterns that can be illustrated using a periodic graph.High and low tides, phases of the moon, as well as thehuman heartbeat are also characterized by repeatingpatterns that make periodic graphs. Note thatsometimes a phenomenon approximates a regularpattern but is not exactly periodic. In such cases, theperiodic function serves as a model.
Planning
You may want students to work individually onproblems 10–12.
Extension
You may have students work in pairs or small groupson the following activity.
1. Use a reference book or experiment to find thefollowing information:
• How many times do you inhale and exhale inone minute?
• How much air do you inhale when you breathenormally?
• What is the volume of your lungs?
2. Make a graph that shows the volume of your lungsover a time period of 15 seconds.
3. If your graph is periodic, how long is a period? If itis not periodic, explain why.
Solutions and Samples
8. Answers will vary. Some students may commentthat the temperature rises when the airconditioner is off and falls when it is on.
9. a. The period in the graph shown is 30 minutes.
b. Answers will vary, depending on where astudent starts to color a cycle. A cycle iscorrectly shown if it covers the time periodthat corresponds to students’ answers forproblem 9a.
10. Answers will vary. Sample response:
The blood pressure is at its lowest point justbefore the heart beats.
11. Answers will vary. Sample response:
After a heartbeat, the blood pressure rises rapidly,then rises more slowly, and finally stops rising.The pressure then begins to fall, slowly at first,then more rapidly, then more slowly again until itreaches its lowest value.
12. Yes, this is a periodic graph because the cyclerepeats.

Notes
You may want to begin witha short discussion aboutthe context, racetracks, andtalk about graphs that showspeed over time.
15 Some students maynot recognize that thespeed graph is periodic,since the graph would notcontinue to repeat forever.You may need to helpstudents identify what one period is in this graph,the distance it takes tocomplete one cycle onthe graph.
CyclesD
Accommodation
If students have difficulty distinguishing between graphs that showdistance over time and speed over time, you might want students to createa speed graph for a car ride with miles per hour on the vertical axis andtimes on the horizontal axis.
Act It Out
Have several students model the speed variation shown on their graph ofthe racetrack speed by walking around the classroom to match anotherstudent’s narration of the information on the graph.
Reaching All Learners
DCycles
A group of racecar drivers are at a track getting ready to practice for a big race. The drawing shows the racetrack as seen from above.
13. Make a sketch of the track in your notebook. Color it to showwhere the drivers should speed up and where they should slow down. Include a key to show the meanings of the colors or patterns you chose.
14. Make a graph of the speed of a car during three laps around thetrack. Label your graph like the one here.
15. Explain why your graph is or is not periodic.
The Racetrack
Start
Sp
eed
Distance Along the Track
Assessment Pyramid
15
Identify characteristics ofperiodic graphs.
39 Ups and Downs

Section D: Cycles 39T
Hints and CommentsMaterials graph paper (one sheet per student)
Overview
Students sketch a racetrack to indicate where racecardrivers should speed up and slow down. They alsomake a graph that shows the speed of a racecarduring three laps around the track.
About the Mathematics
The periodic graph on this page shows the speed of acar over time.
Planning
Students may work in pairs on problems 13–15.These are optional problems and may be omitted orassigned as homework if time is a concern.
Comments About the Solutions
13. The purpose of this problem is to get studentsto begin thinking about where a racecar driverwill speed up or slow down before studentsactually make a graph showing the speed overtime. In general, racecar drivers speed uphalfway through the curved areas and on thestraightaways. Racecars may be traveling at aconstant speed at the end of the straightaways ifthe cars are being driven at their maximum speed.
14. Students may use the racetrack sketch they drewin the previous problem to help them make theirspeed graphs here.
Solutions and Samples
13. Drawings will vary. Sample drawing:
14. Answers will vary, but the graph shouldcorrespond with the colored parts of the track inproblem 18. Sample response:
15. Explanations will vary. Sample explanation:
My graph is periodic. It shows a repeating patternbetween some time after the beginning and theend of the race.
Start
speed upslow down
Sp
eed
Distance along the Track
Start Lap 1 Lap 2
Note: Graph shows only 2 laps.
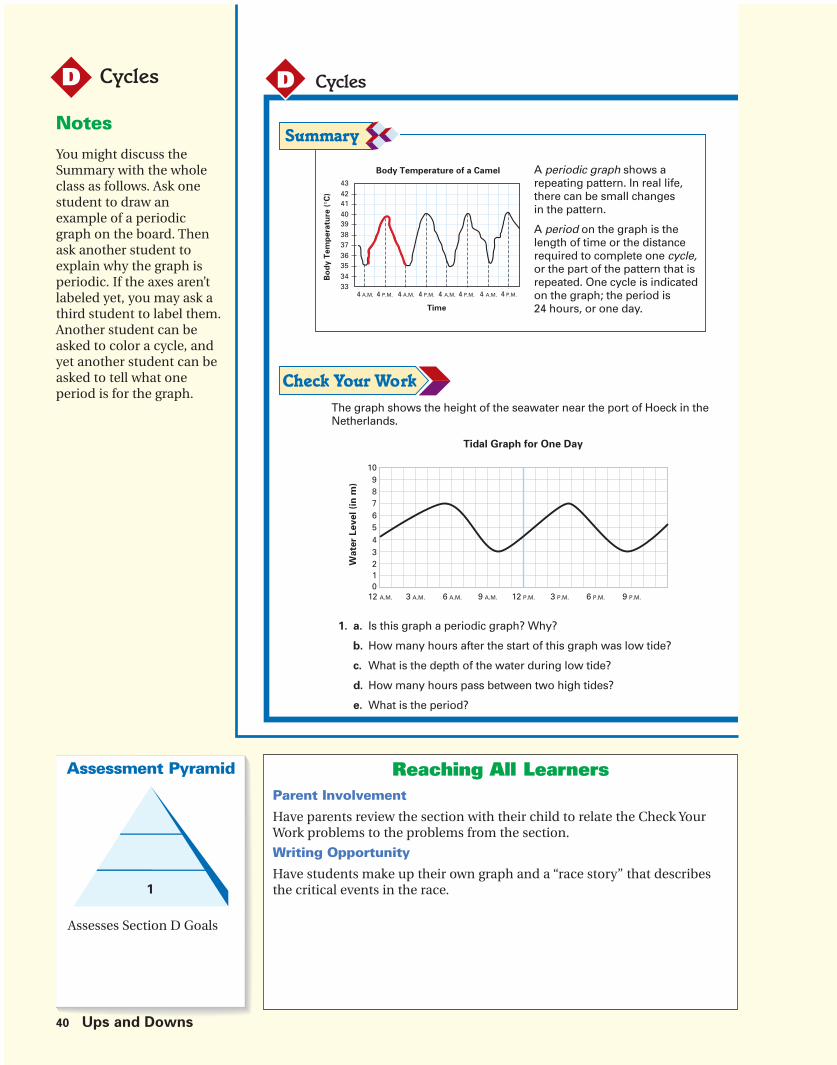
Notes
You might discuss theSummary with the wholeclass as follows. Ask onestudent to draw anexample of a periodicgraph on the board. Thenask another student toexplain why the graph isperiodic. If the axes aren’tlabeled yet, you may ask athird student to label them.Another student can beasked to color a cycle, andyet another student can beasked to tell what oneperiod is for the graph.
CyclesD
Parent Involvement
Have parents review the section with their child to relate the Check YourWork problems to the problems from the section.
Writing Opportunity
Have students make up their own graph and a “race story” that describesthe critical events in the race.
Reaching All Learners
CyclesD
A periodic graph shows arepeating pattern. In real life,there can be small changes in the pattern.
A period on the graph is thelength of time or the distancerequired to complete one cycle,or the part of the pattern that isrepeated. One cycle is indicatedon the graph; the period is 24 hours, or one day.
Bo
dy T
em
pera
ture
(°C
)
Time
Body Temperature of a Camel
3334353637383940414243
4 A.M. 4 P.M. 4 A.M. 4 P.M. 4 A.M. 4 P.M. 4 A.M. 4 P.M.
Tidal Graph for One Day
Wate
r Level (i
n m
)
109876543210
12 A.M. 3 A.M. 6 A.M. 9 A.M. 12 P.M. 3 P.M. 6 P.M. 9 P.M.
The graph shows the height of the seawater near the port of Hoeck in theNetherlands.
1. a. Is this graph a periodic graph? Why?
b. How many hours after the start of this graph was low tide?
c. What is the depth of the water during low tide?
d. How many hours pass between two high tides?
e. What is the period?
Assessment Pyramid
1
Assesses Section D Goals
40 Ups and Downs
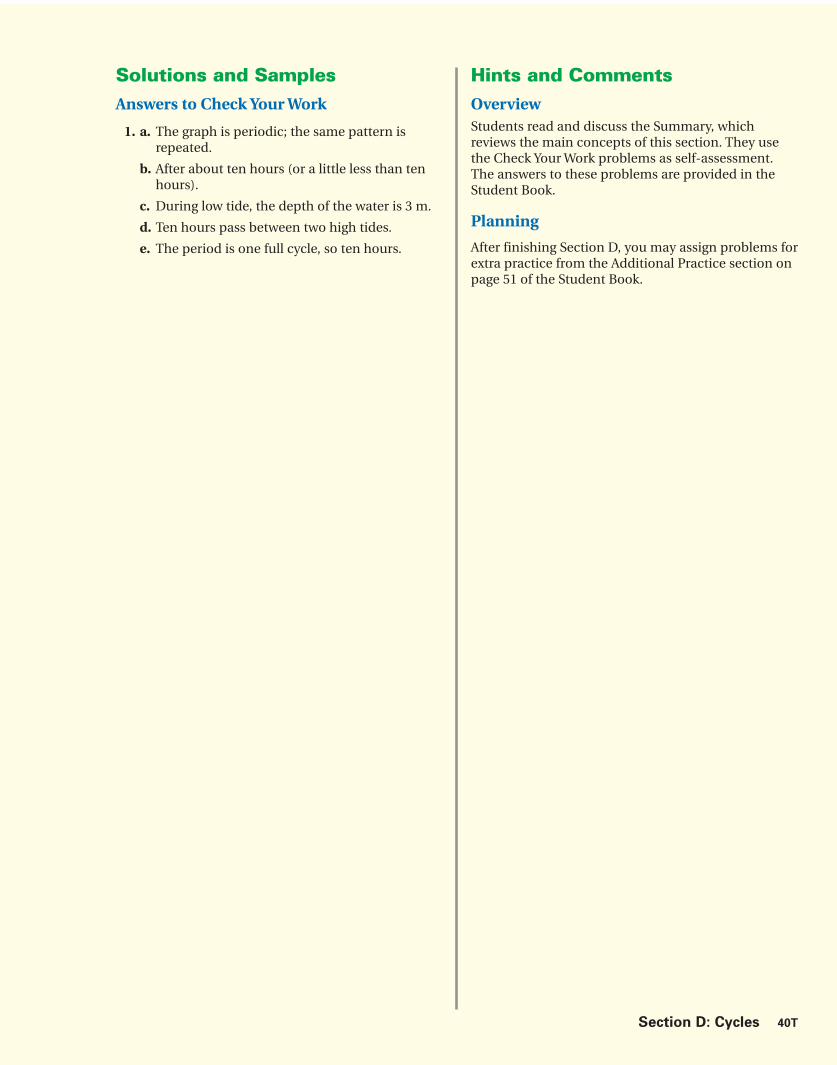
Section D: Cycles 40T
Hints and CommentsOverview Students read and discuss the Summary, whichreviews the main concepts of this section. They usethe Check Your Work problems as self-assessment.The answers to these problems are provided in theStudent Book.
Planning
After finishing Section D, you may assign problems forextra practice from the Additional Practice section onpage 51 of the Student Book.
Solutions and SamplesAnswers to Check Your Work
1. a. The graph is periodic; the same pattern isrepeated.
b. After about ten hours (or a little less than tenhours).
c. During low tide, the depth of the water is 3 m.
d. Ten hours pass between two high tides.
e. The period is one full cycle, so ten hours.

Notes
2a You may want to havestudents mark several keyparts of the graph with alabel that relates thebehavior in the graph towhat is happening to therefrigerator. When does itturn on? When does it shut off?
CyclesD
Extension
Challenge students to draw another periodic graph (using their ownracetrack design) showing three laps in which the following eventsoccurred:
Lap One: The racecar got a flat tire halfway into the first straightaway,causing it to slow down to a crawl, make a pit stop to change the flat tire,and reenter the race at the beginning of the first curve.
Lap Two: The racecar encountered no problems during this lap.
Lap Three: The racecar did not slow down enough as it approached thesecond curve, causing it to spin out of control. The car came to a completestop, then proceeded to continue the race.
Reaching All Learners
1
1
2 3 4 5 6 7 8 9 10 11 12 13 14 15
2
2
1
1
5 10 15
2
2
1
In a refrigerator, the temperature is not always the same. Even if the door isclosed all the time, the temperature will slowly rise. In some refrigerators, assoon as the temperature reaches 45°F, the refrigeration system starts to work.The temperature will decrease until it reaches 35°F. In general, this takes about10 minutes. Then the temperature starts rising again until it reaches 45°F. Thistakes about 20 minutes. Then the whole cycle starts all over again.
2. a. Draw a graph that fits the above information about therefrigeration system. Make your graph as accurately aspossible. Be sure to label the axes.
b. How many minutes does one complete cycle take?
Three periodic graphs are shown.
3. Which graph shows a situation that has a period of about six? Explainyour reasoning.
1
1
2 3 4 5 6 7 8 9 10 11 12 13 14 15
2
2
1
a
c
b
Assessment Pyramid
2, 3
Assesses Section D Goals
41 Ups and Downs

Section D: Cycles 41T
Hints and CommentsOverviewStudents use the Check Your Work problems as self-assessment. The answers to these problems areprovided in the Student Book.
Planning
After finishing Section D, you may assign problems forextra practice from the Additional Practice section onpage 51 of the Student Book.
Solutions and Samples
2. a.
b. One complete cycle takes 30 minutes.
3. Graphs b and c have a period of about six. Notethat the period of graph a is about 12.5.
0 5 10 15 20 25 30
30
35
40
45
50
35 40 45
Time (in minutes)
Te
mp
era
ture
(in
°F)
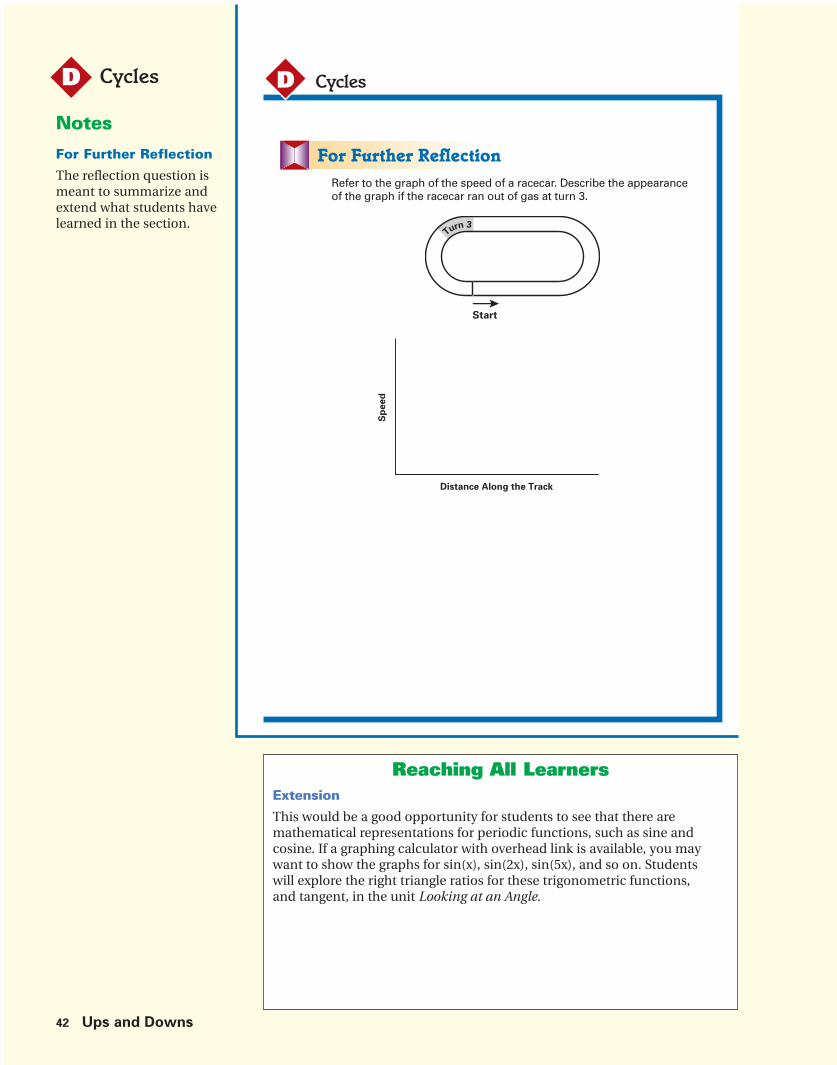
Notes
For Further Reflection
The reflection question ismeant to summarize andextend what students havelearned in the section.
CyclesD
Extension
This would be a good opportunity for students to see that there aremathematical representations for periodic functions, such as sine andcosine. If a graphing calculator with overhead link is available, you maywant to show the graphs for sin(x), sin(2x), sin(5x), and so on. Students will explore the right triangle ratios for these trigonometric functions, and tangent, in the unit Looking at an Angle.
Reaching All Learners
Cycles
Refer to the graph of the speed of a racecar. Describe the appearanceof the graph if the racecar ran out of gas at turn 3.
D
Turn 3
Start
Sp
eed
Distance Along the Track
42 Ups and Downs

Section D: Cycles 42T
Hints and CommentsOverview
Students use the Check Your Work problems asself-assessment. The answers to these problems areprovided in the Student Book.
Planning
After finishing Section D, you may assign problems forextra practice from the Additional Practice section onpage 51 of the Student Book.
Solutions and Samples
For Further Reflection
Answers will vary. A graph should show the speedaccelerating from the start, slowing at turn 1,increasing out of turn 2 and then slowing down to astop in turn 3. Students may choose to show one ormore laps before the car runs out of gas in turn 3.

43A Ups and Downs Teachers Matter
Teachers MatterE
Section Focus
Students already investigated exponential growth in Section C. Each new value was determined by multiplying by a growth factor. In this section, growth factors between zero and one are used to describe exponential decay in real life situations like decrease of the value of a car over time and the absorption of some kind ofmedicine in the blood stream. The relationship between percents and fractions is applied.
Pacing and Planning
Day 15: Fifty Percent Off Student pages 43–44
INTRODUCTION Problems 1–4 Graph and interpret the decrease over time of the value of a car.
CLASSWORK Problems 5–7 Investigate the decrease in the amount of medicine that remains in a person’s stomach at specific intervals of time after ingestion.
HOMEWORK Problem 8 Make a graph of the medicine absorption data.
Day 16: Comparisons Student pages 44–46
INTRODUCTION Review homework. Review homework from Day 15.
CLASSWORK Problems 9–12 Investigate other patterns of exponential decay.
HOMEWORK Check Your Work Student self-assessment: Describe various situations involving exponential decay.
Day 17: Unit Summary
INTRODUCTION Review homework. Review homework from Day 16.
REVIEW Sections A–E review Review Check Your Work and Summary pages from Sections A–E.
Additional Resources: Algebra Tools; Additional Practice, Section E, page 51

Teachers Matter Section E: Half and Half Again 43B
Teachers Matter E
Materials
Student Resources
No resources required.
Teachers Resources
No resources required.
Student Materials
Quantities listed per student.
• Calculator
• Graph paper (two sheets)
* See Hints and Comments for optional materials.
Learning LinesRelationships Showing Exponential Growth
Exponential decay is sometimes referred to asnegative growth. The growth factor is not negativebut a decimal or fraction between 0 and 1.
Number Sense
While working through this section, students showtheir understanding of the relationship between fractions, decimals, and percents. For example, tocalculate one-half of the medicine left in the bloodstream after ten minutes, students may either multiply the amount by 1__
2 , find 50% of theamount, or divide the amount by two since theseexpressions are equivalent to each other.
At the End of the Section:Learning Outcomes
Students use decimal and fraction growth factorsto represent exponential decreasing patterns. They interpret and use tables, graphs, and NEXT-CURRENT formulas to describe exponential decay.

Notes1 You might begin with a class discussion of thecontext of this problem.Ask students to explainwhat it means that the carprice lowers by 50%.
3 Encourage students to refer to the pattern of decrease in theirarguments. They may give examples in dollaramounts. Students shouldbe able to see that thegreatest decrease in priceoccurs during the first twoyears of a car’s life. Afterthat time, the amount ofdepreciation is less.
Half and Half Again
E
Writing Opportunity
You might have students write a few paragraphs in their journals thatexplain the pros and cons of buying a new car and of buying a used car.Encourage them to use mathematical reasons.
Reaching All Learners
EHalf and Half Again
Fifty Percent Off
Monica is shopping for a used car.She compares the prices and agesof midsize cars. She notices thatadding two years to the age of acar lowers the price by 50%.
1. Copy the diagram below.Graph the value of a $10,000car over a six-year period.
2. Is the graph linear? Why or why not?
10,000
5,000
1,000 0
2 4 6
Year
Valu
e o
f C
ar
(in
do
llars
)
Monica decides she does not want to keep a car for more than twoyears. She needs advice on whether to buy a new or used car.
3. Write a few sentences explaining what you would recommend.Support your recommendation.
4. a. Reflect Show that at this rate, the car never has a zero value.
b. Is this realistic?
43 Ups and Downs

Section E: Half and Half Again 43T
Yes, it is realistic. Some cars may becomecollector’s items and never reach a value ofzero. In fact, their value may increase instead ofdecrease.
Solutions and Samples
1.
2. No, the graph is not linear. Sample explanation:
The graph is not a straight line because the car’svalue does not decrease by the same amountevery year. Instead, it decreases by a smalleramount each year.
3. Answers will vary. Sample responses:
• Buy a two-year-old used car. The car isalmost new, so it will probably look goodand run well. Also the car has lost its biggestdrop in value, so it won’t go down in value asmuch in the years ahead.
• Buy a new car because all of the parts arenew and will last longer. A new car will alsohave a warranty so that if something goeswrong, you can get it replaced. The big dropin value for a new car might be offset byhaving the warranty.
4. a. Strategies will vary. Some students may say thatextending the graph shows that the curve neverreaches the horizontal axis. Other students maysay that repeated halving never results in aproduct of zero, and may use an arrow string toshow that even fractional values will neverreach zero.
b. Answers will vary. Sample responses:
• No, it is not realistic. Some cars may becomeinvolved in an accident and be so damagedthat you cannot drive them, so these carshave a zero value. Note that some studentsmay argue that the cars can be sold for scrapand so are worth something.
Hints and CommentsMaterials graph paper (one sheet per student)
Overview
Students draw a graph showing the decrease in thevalue of a car over a six-year period. They also decidewhether this process is linear or not.
About the Mathematics
In Section C, students investigated situations thatinvolved exponential growth. Each new value wasdetermined by doubling the original value. In thissection, students explore patterns of decrease, knownas exponential decay, in which the new value isdetermined by repeatedly halving the original value.The relationship between percents and fractions isstressed in units from the algebra and numberstrands.
Planning
Students may work in pairs or small groups onproblems 1 and 2. Be sure to discuss students’solutions and explanations.
Comments About the Solutions
1. Be sure students understand the basic concept of a repeated percent decrease, or exponentialdecay. They should be able to use the followingrelationship between percents and fractions:lowering a price by 50% is the same as taking half of the price.
$10,000
$5,000
$1,000
1 2 3 4 5 6
Year
Car Depreciation
Va
lue
of
Ca
r (in
do
lla
rs)
1 ⎯⎯→ ⎯⎯→ ⎯⎯→ ⎯⎯→ � 2 � 2 � 2 � 2
⎯⎯→ ⎯⎯→ ⎯⎯→ ⎯⎯→ � 2 � 2 � 2 � 2
12
14
18
116
132
164
1128
1256

Notes
6 Encourage students toextend the diagrams theydrew for problem 5 to helpthem answer this question.Suggest that they alsoinclude a short explanationthat describes how theyfound their answer.
7 Students may prefer todo repeated division bytwo. Have students roundthe amounts to wholenumbers or to the nearesttenth.
8 A complete graphshould have a title, andeach axis should have alabel and a consistentscale. Students may alsoneed to be reminded thattime is graphed along thehorizontal axis.
Half and Half Again
E
Intervention
Check students’ graphs for problem 8 while they are working. It isimportant that students understand that the next amount can be found bytaking half of the current amount or by multiplying the current amount byone-half.
Extension
Have students think of other situations where an amount of somethingdecreases over time.
Reaching All Learners
When you take a certain kind of medicine,it first goes to your stomach and then isgradually absorbed into your bloodstream.Suppose that in the first 10 minutes after itreaches your stomach, half of the medicineis absorbed into your bloodstream. In thesecond 10 minutes, half of the remainingmedicine is absorbed, and so on.
5. What part of the medicine is still inyour stomach after 30 minutes? After40 minutes? You may use drawings toexplain your answer.
6. What part of the medicine is left inyour stomach after one hour?
Kendria took a total of 650 milligrams (mg)of this medicine.
7. Copy the table. Fill in the amount of medicine that is still in Kendria’sstomach after each ten-minute intervalduring one hour.
Half-LivesE
Medicine
Minutes after0 10 20 30 40 50 60
Taking Medicine
Medicine in Kendria’s650
Stomach (in mg)
8. Graph the information in the table you just completed. Describe theshape of the graph.
The time it takes for something to reduce by half is called its half-life.
9. Is the amount of medicine in Kendria’s stomach consistent withyour answer to problem 6? Explain.
Assessment Pyramid
9
Make connections betweensituation, graph, and table.
44 Ups and Downs

Section E: Half and Half Again 44T
Hints and CommentsOverview Students continue to investigate exponential decaywithin the context of decrease of car value. Theyinvestigate the way medicine is absorbed by thebloodstream over time. They make a table of theamount of medicine that remains in a person’sstomach after specific time intervals.
About the Mathematics
It is critical that students understand and are able touse the relationships between fractions, decimals, and percents to investigate exponential decay in thissection. These connections are also studied in unitsFraction Times and More or Less. For example, tocalculate one-half of the medicine amount left after10 minutes, students may either multiply the amountby 1__
2 , find 50% of the amount, or divide the amountby 2, since these expressions are equivalent to oneanother.
Many students may be able to recognize the similaritiesbetween exponential growth, studied in a previoussection, and exponential decay. Both situationsinvolve repeated multiplication using a growth ordecay factor. In exponential growth, the factor is anumber greater than one, while in exponential decay,the factor is a number between zero and one. Studentsmay recall the factors of enlargement or reductionfrom the unit Ratios and Rates, and remember that afactor between zero and one indicates a reduction.
Planning
Discuss students’ solutions and strategies, especiallyfor problem 7. Students may work on problems 8 and9 in pairs or in small groups.
Comments About the Solutions
7. Some students may find the answer by usingthe fractions from problem 5. For example, after 30 minutes, you have 1__
8 left, and 1__8 of
650 is 81.25.
8. You might want to discuss with students that theamount decreases by a factor of one-half, or 0.5.
Did You Know?
Some students may ask whether medicine stays in the body for the rest of a person’s life. The answer is,of course not. The halving concept used here is anapproximate model that is applicable for a limitedtime period. Most of the medicine will be absorbed inthe bloodstream; some of it may never be absorbedand will later be expelled from the body.
Solutions and Samples
5.
6. After 60 minutes, there is 1__64 of the medicine
present. Some students might show this with adrawing. Sample drawing:
7.
8. See the graph below. Descriptions will vary.Sample descriptions:
The graph is falling slower and slower. That isbecause the amount the body absorbs decreasesless and less as time goes by.
9. Students should say yes, because 1__64 of 650milligrams is about 10 milligrams.
0 10 20 30 40 minutes
12
14
18
116
132
164
Minutes after0 10 20 30 40 50 60
Taking Medicine
Medicine in Kendria’s650 325 162.5 81.25 40.625 20.313 10.156
Stomach (in mg)
Time (in minutes)
Medicine Absorption
by the Body
0 10 20 30 40 50 60
50
100
150
200
250
300
350
400
450
500
550
600
650
Med
icin
e (
mg
)
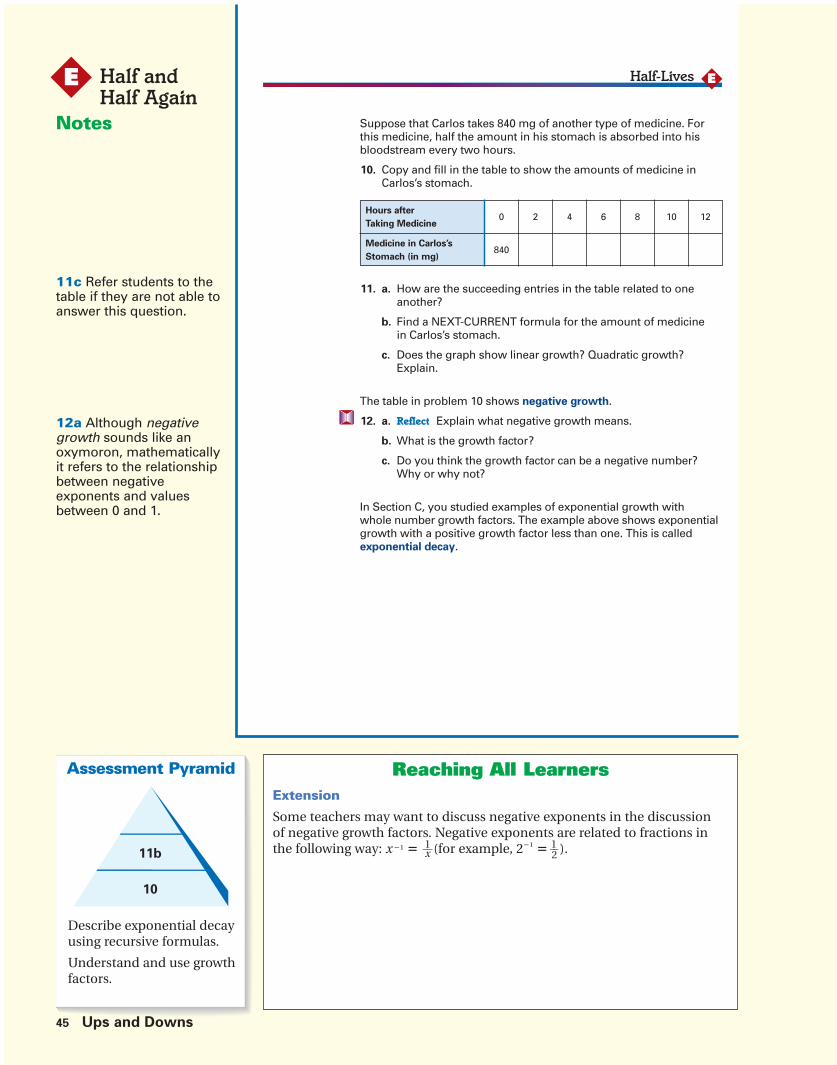
Notes
11c Refer students to thetable if they are not able toanswer this question.
12a Although negativegrowth sounds like anoxymoron, mathematicallyit refers to the relationshipbetween negativeexponents and valuesbetween 0 and 1.
Half and Half Again
E
Extension
Some teachers may want to discuss negative exponents in the discussion of negative growth factors. Negative exponents are related to fractions inthe following way: x �1 � 1__
x (for example, 2�1 � 1__2 ).
Reaching All Learners
EHalf-Lives
Suppose that Carlos takes 840 mg of another type of medicine. Forthis medicine, half the amount in his stomach is absorbed into hisbloodstream every two hours.
10. Copy and fill in the table to show the amounts of medicine inCarlos’s stomach.
11. a. How are the succeeding entries in the table related to oneanother?
b. Find a NEXT-CURRENT formula for the amount of medicinein Carlos’s stomach.
c. Does the graph show linear growth? Quadratic growth?Explain.
The table in problem 10 shows negative growth.
12. a. Reflect Explain what negative growth means.
b. What is the growth factor?
c. Do you think the growth factor can be a negative number?Why or why not?
In Section C, you studied examples of exponential growth with whole number growth factors. The example above shows exponentialgrowth with a positive growth factor less than one. This is calledexponential decay.
Hours after0 2 4 6 8 10 12
Taking Medicine
Medicine in Carlos’s840
Stomach (in mg)
Assessment Pyramid
11b
10
Describe exponential decayusing recursive formulas.
Understand and use growthfactors.
45 Ups and Downs

Section E: Half and Half Again 45T
Hints and CommentsMaterials graph paper (one sheet per student)
Overview
Students complete a table to make a graph. They theninvestigate a similar problem about the absorption ofmedicine into a person’s bloodstream. Students find a NEXT-CURRENT formula describing exponentialdecay within the context of absorption of medicine inthe blood stream.
About the Mathematics
In situations involving exponential increase, thegrowth factor is always a number greater than one,while in situations involving exponential decrease, the factor is a number between zero and one. Eventhough exponential decay is sometimes namednegative growth, the factor can never be negative.
Solutions and Samples
10.
11. a. Each succeeding entry in the column of thetable for the medicine in Carlos’ stomach ismultiplied by 1__
2 . The number of hoursincreases by two each time.
b. NEXT � CURRENT � 1__2
c. The graph does not show linear growthbecause it does not have constant growth. It has the same shape as the graph of problem 8. It is not quadratic as you can seefrom the first and second differences:
first differences: 420; 210; 105; 52.5; ……
second differences: 210; 105; 52.5; ..….
The second differences are not equal.
12. a. Negative growth means that each number issmaller than the previous one.
b. The growth factor is __12 .
c. The growth factor cannot be negative. If theamount of medicine in your blood is forinstance 840 milligrams, it would be impossibleto have a negative number of milligrams ofmedicine in your stomach later.
Hours after0 2 4 6 8 10 12
Taking Medicine
Medicine in Carlos’s840 420 210 105 52.5 26.25 13.125
Stomach (in mg)

Notes
For Further Reflection
The reflection question ismeant to summarize andextend what students havelearned in the section.
Half and Half Again
E
Extension
Have students make up a problem similar to the two equations on thispage, except use 1__
3 and 1__4 instead of 1__
2 and 1__3 . Have students make a graph
and a table for each, and explain what is happening over time.
Parent Involvement
The Summary offers an opportunity for parents to review the unit withtheir child.
Reaching All Learners
Half-Lives
You have explored several situations in which amounts have decreased by a factor of 1��2 . For example, the price of a car decreased by a factor of 1��2 every two years. The amount of medicine in the stomach decreased by a factor of 1��2 every 10 minutes, or every twohours.
Sometimes things get smaller by half and half again and half againand so on. When things change this way, the change is called exponential decay. When amounts decrease by a certain factor, thegrowth is not linear and not quadratic. You can check by finding thefirst and second differences.
Suppose you have two substances, A and B. The amount of eachsubstance changes in the following ways over the same length of time:
Substance A: NEXT � CURRENT �1��2
Substance B: NEXT � CURRENT �1��3
1. Are the amounts increasing or decreasing over time?
2. Which of the amounts is changing more rapidly, A or B? Supportyour answer with a table or a graph.
Although one of the amounts is changing more rapidly, both aredecreasing in a similar way.
3. a. How would you describe the way they are changing—fasterand faster, linearly, or slower and slower? Explain.
b. Reflect What is the mathematical name for this type of change?
Write a description of exponential decay using pesticides.
E
Assessment Pyramid
2, 3
1
Assesses Section E Goals
46 Ups and Downs

Section E: Half and Half Again 46T
If you look at the graphs, you can see that thedecrease slows down and the graphs become“flatter” over time.
b. This type of change is called exponential decay.
For Further Reflection
Answers will vary. Sample response:
When pesticides are sprayed in a field they are at fullstrength. Insects on plants are killed right away. Butafter one week day some new insects come into thearea and only half the insects are killed (the pesticideis not at full strength due to the weather). Afteranother week only one fourth of the insects are killed.By the end of the month, the pesticide has lost somuch of its strength that the pesticide needs to bereapplied, even though some of the old pesticide isstill there!
Solutions and SamplesAnswers to Check Your Work
1. The amounts are decreasing. Sample explanations:
• For substance A, after every time interval, halfof what there was is left; and for substance B,after every time interval, one-third of whatthere was is left.
• You can see the decrease when you use theformulas to make tables.
2. The amount of substance B is decreasing morerapidly. You can see the decrease by looking at thenumbers if you make a table for the answer toproblem 1. The amount of B goes down faster.
You can see that substance B is decreasing fasterby looking at the two graphs.
Sample graph:
3. a. More and more slowly. Sample explanation:
You can see that the decrease is happeningmore and more slowly by looking at thedifferences in the tables; for example:
1 __ 3� 1 __
3�
Time
Am
ou
nt
0
10
20
30
40
1 2 3
A
B
4
� 1 __ 2� 715
� � 720
Hints and CommentsOverview Students read and discuss the Summary. They thenuse the Check Your Work problems as self-assessment.The answers to these problems are provided in theStudent Book.
Planning
Read and discuss the Summary with students,focusing on the similarities and differences betweenexponential increase and decrease. After studentsfinish Section E, you may assign appropriate activitiesfrom the Additional Practice section on page 51.
1 __ 2� 1 __
2�
Time 0 1 2
A 30 15 7.5
Time 0 1 2
B 30 10 3.3
Time 0 1 2
A 30 15 7.5
Time 0 1 2
B 30 10 3.3

Additional Practice SolutionsStudent Page
47 Ups and Downs Additional Practice Solutions Student Page
The graph on the left shows how much the population of the state ofWashington grew each decade from 1930 to 2000.
Additional Practice
Section Trendy GraphsA
Po
pu
lati
on
Ch
an
ge
(in
th
ou
san
ds)
Year
Washington
200
400
600
800
1,000
1,200
1930 1940 1950 1960 1970 1980 1990 2000
4.5
2.5
3
3.5
4
1930 1950 1970 1990 2010
Year
Po
pu
lati
on
(in
millio
ns)
Alabama
1. a. By approximately how muchdid the population grow from1930 to 1940?
b. In 1930, the population ofWashington was 1,563,396.What was the approximatepopulation of Washington in 1940?
2. a. During which decade did thepopulation grow the most?Explain.
b. When did the populationgrow the least? Explain.
The graph below shows the growth of Alabama’s population from1930 to 2000.
3. a. Describe the growth of thepopulation from the year 1960 until the year 2000.
b. From 1970 to 1980, the population of Alabama grew fast. How does thegraph show this?

Section A. Trendy Graphs
1. a. The population grew by about 180,000 people. Estimates will vary. Accept estimatesin the range of 170,000–190,000 people.
b. Answers will vary, depending on students’estimates for part a. Based on a populationgrowth between 1930 and 1940 of 180,000people, the population in 1940 was 1,743,396people (1,563,396 � 180,000 � 1,743,396).
2. a. The population grew the most between1990 and 2000. Explanations will vary.Sample explanation:
The graphs show that the greatest change inpopulation, indicated by the longest bar,was during the decade ending in 2000.
b. The population grew the least between 1930 and 1940. Explanations will vary.Sample explanation:
The smallest increase in population wasduring the decade ending in 1940 and isindicated by the shortest bar on the graph.
3. a. Descriptions will vary. Sample description:
From 1960 to 1970, the growth of the population of Alabama slowed down slightly compared to the previous years.
From 1970 to 1980, the growth was consid-erably larger than in the previous decade,but from 1980 to 1990 the population grewonly little, about the same change as duringthe decade of 1930 to 1940.
b. Explanations will vary. Sample explanation:
The graph line connecting the two dots representing 1970 and 1980 is very steep.
Additional Practice Solutions Ups and Downs 47T

Additional Practice SolutionsStudent Page
48 Ups and Downs Additional Practice Solutions Student Page
Length (in inches)
Date Overall Body (without tail)
July 2007 111��2 3
August 2007 13 31��2
September 2007 15 4
October 2007 17 5
November 2007 211��2 51��2
January 2008 27 71��2
March 2008 291��2 81��2
April 2008 31 9
June 2008 381��2 111��2
August 2008 45 14
October 2008 491��2 151��2
December 2008 50 151��2
These are two pictures of the same iguana.
The chart shows the length of the iguana as it grew.
Note that the iguana was not measured every single month.
Additional Practice

Additional Practice Solutions
Section A. Trendy Graphs
(continued)
There are no problems to solve on this page.
Additional Practice Solutions Ups and Downs 48T
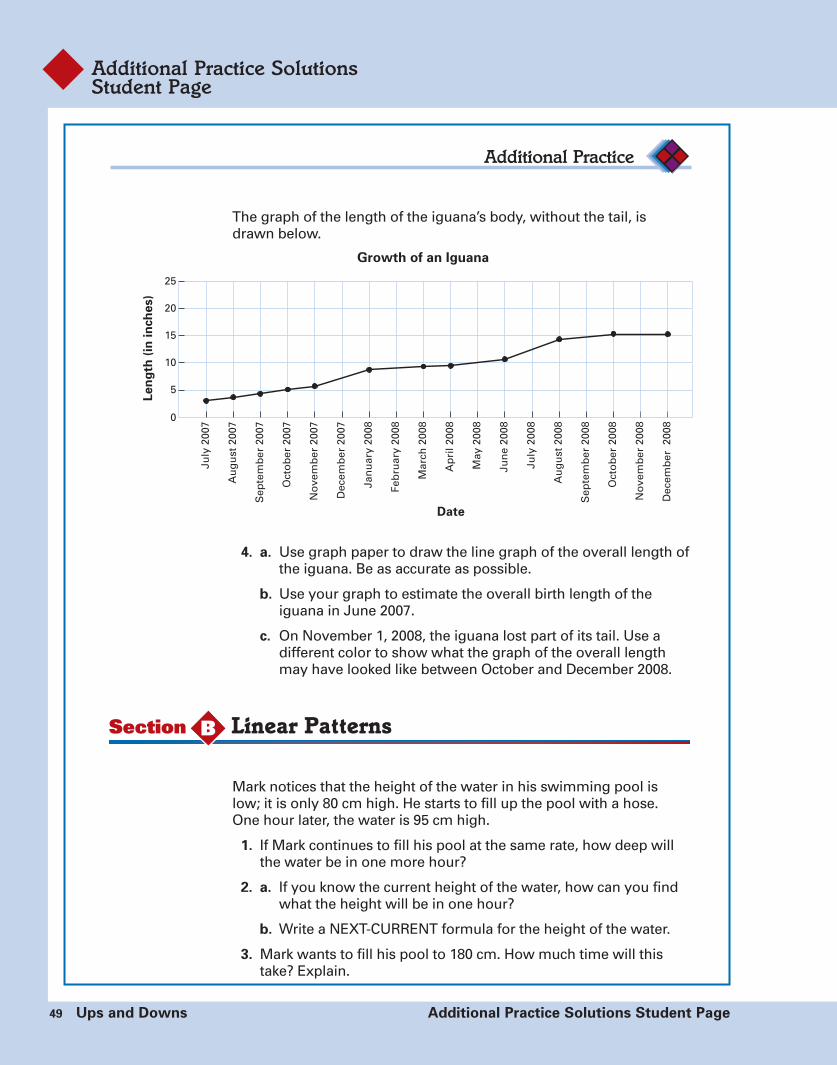
Additional Practice SolutionsStudent Page
49 Ups and Downs Additional Practice Solutions Student Page
The graph of the length of the iguana’s body, without the tail, isdrawn below.
4. a. Use graph paper to draw the line graph of the overall length ofthe iguana. Be as accurate as possible.
b. Use your graph to estimate the overall birth length of theiguana in June 2007.
c. On November 1, 2008, the iguana lost part of its tail. Use adifferent color to show what the graph of the overall lengthmay have looked like between October and December 2008.
Additional Practice
July
2007
Au
gu
st20
07
Sep
tem
ber
2007
Oct
ob
er20
07
No
vem
ber
2007
Dec
emb
er20
07
Jan
uar
y20
08
Feb
ruar
y20
08
Mar
ch20
08
Ap
ril2
008
May
2008
Jun
e20
08
July
2008
Au
gu
st20
08
Sep
tem
ber
2008
Oct
ob
er20
08
No
vem
ber
2008
Dec
emb
er20
08
5
0
10
15
20
25
Growth of an Iguana
Le
ng
th(i
nin
ch
es)
Date
Section Linear PatternsB
Mark notices that the height of the water in his swimming pool islow; it is only 80 cm high. He starts to fill up the pool with a hose.One hour later, the water is 95 cm high.
1. If Mark continues to fill his pool at the same rate, how deep willthe water be in one more hour?
2. a. If you know the current height of the water, how can you findwhat the height will be in one hour?
b. Write a NEXT-CURRENT formula for the height of the water.
3. Mark wants to fill his pool to 180 cm. How much time will thistake? Explain.
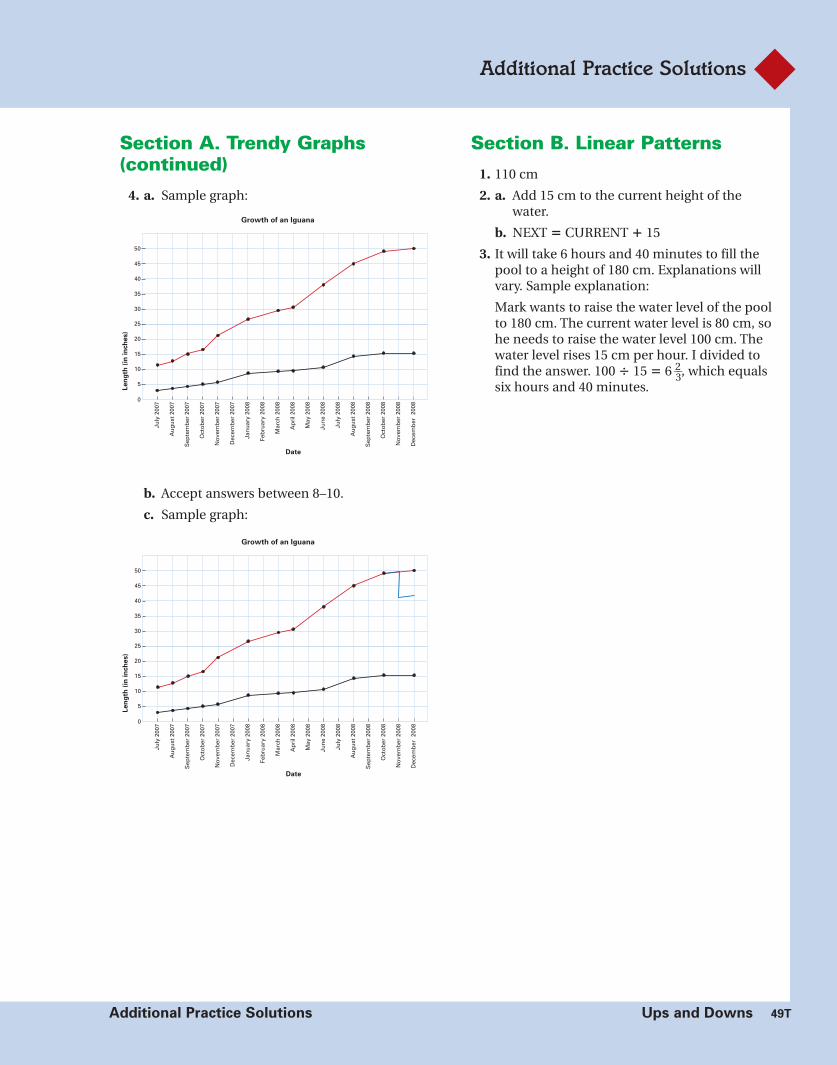
Additional Practice Solutions
Section A. Trendy Graphs(continued)
4. a. Sample graph:
b. Accept answers between 8–10.
c. Sample graph:
Section B. Linear Patterns
1. 110 cm
2. a. Add 15 cm to the current height of thewater.
b. NEXT � CURRENT � 15
3. It will take 6 hours and 40 minutes to fill thepool to a height of 180 cm. Explanations willvary. Sample explanation:
Mark wants to raise the water level of the poolto 180 cm. The current water level is 80 cm, sohe needs to raise the water level 100 cm. Thewater level rises 15 cm per hour. I divided tofind the answer. 100 � 15 � 6 2__
3, which equalssix hours and 40 minutes.
Additional Practice Solutions Ups and Downs 49T
July
2007
Au
gu
st20
07
Sep
tem
ber
2007
Oct
ob
er20
07
No
vem
ber
2007
Dec
emb
er20
07
Jan
uar
y20
08
Feb
ruar
y20
08
Mar
ch20
08
Ap
ril2
008
May
2008
Jun
e20
08
July
2008
Au
gu
st20
08
Sep
tem
ber
2008
Oct
ob
er20
08
No
vem
ber
2008
Dec
emb
er20
08
5
0
10
15
20
25
30
35
40
45
50
Growth of an Iguana
Le
ng
th(i
nin
ch
es)
Date
July
2007
Au
gu
st20
07
Sep
tem
ber
2007
Oct
ob
er20
07
No
vem
ber
2007
Dec
emb
er20
07
Jan
uar
y20
08
Feb
ruar
y20
08
Mar
ch20
08
Ap
ril2
008
May
2008
Jun
e20
08
July
2008
Au
gu
st20
08
Sep
tem
ber
2008
Oct
ob
er20
08
No
vem
ber
2008
Dec
emb
er20
08
5
0
10
15
20
25
30
35
40
45
50
Growth of an Iguana
Le
ng
th(i
nin
ch
es)
Date
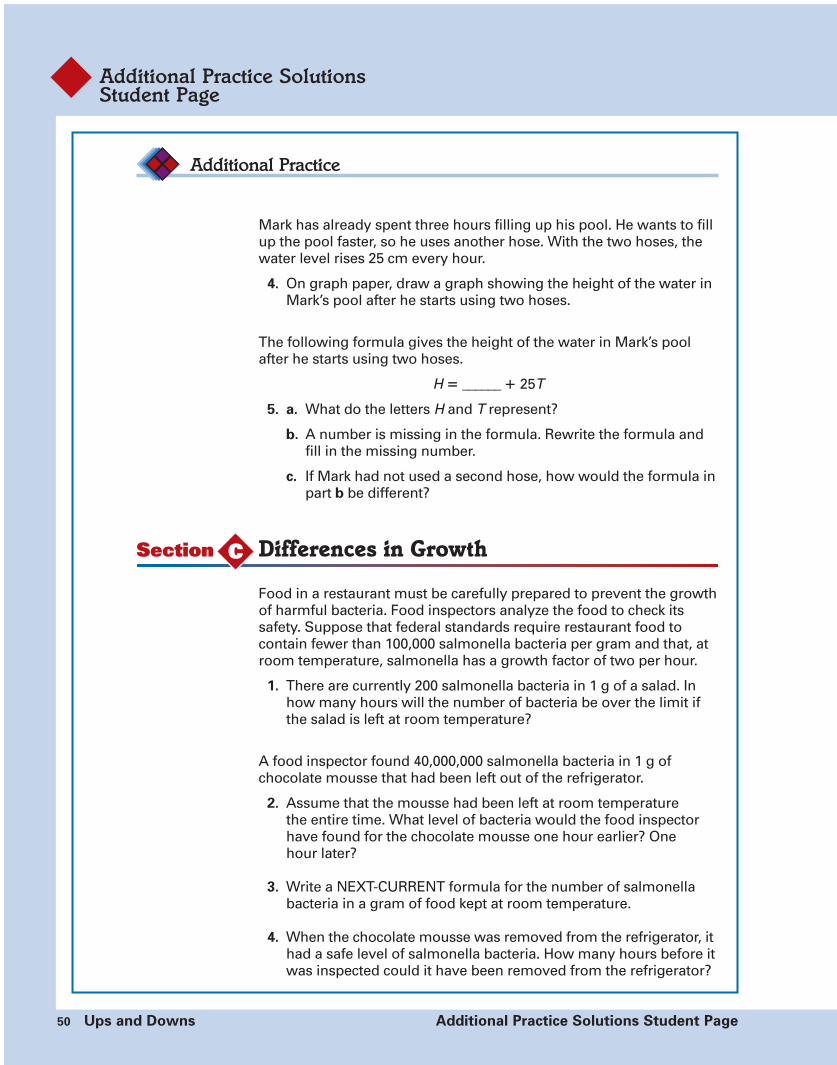
Additional Practice SolutionsStudent Page
50 Ups and Downs Additional Practice Solutions Student Page
Mark has already spent three hours filling up his pool. He wants to fillup the pool faster, so he uses another hose. With the two hoses, thewater level rises 25 cm every hour.
4. On graph paper, draw a graph showing the height of the water inMark’s pool after he starts using two hoses.
The following formula gives the height of the water in Mark’s poolafter he starts using two hoses.
H � ______ � 25T
5. a. What do the letters H and T represent?
b. A number is missing in the formula. Rewrite the formula andfill in the missing number.
c. If Mark had not used a second hose, how would the formula inpart b be different?
Food in a restaurant must be carefully prepared to prevent the growthof harmful bacteria. Food inspectors analyze the food to check itssafety. Suppose that federal standards require restaurant food tocontain fewer than 100,000 salmonella bacteria per gram and that, atroom temperature, salmonella has a growth factor of two per hour.
1. There are currently 200 salmonella bacteria in 1 g of a salad. Inhow many hours will the number of bacteria be over the limit ifthe salad is left at room temperature?
A food inspector found 40,000,000 salmonella bacteria in 1 g ofchocolate mousse that had been left out of the refrigerator.
2. Assume that the mousse had been left at room temperaturethe entire time. What level of bacteria would the food inspectorhave found for the chocolate mousse one hour earlier? Onehour later?
3. Write a NEXT-CURRENT formula for the number of salmonellabacteria in a gram of food kept at room temperature.
4. When the chocolate mousse was removed from the refrigerator, ithad a safe level of salmonella bacteria. How many hours before itwas inspected could it have been removed from the refrigerator?
Additional Practice
Section Differences in GrowthC

Additional Practice Solutions
Section B. Linear Patterns(continued)
4. See the graph below. Since Mark has been fillingthe pool for three hours at 15 cm per hour (3 � 15 � 45 cm), the graph for filling the poolwith two hoses starts at 80 cm � 45 cm, or 125 cm.
5. a. H stands for the height of the water. T stands for the amount of time in hoursthat two hoses have been filling the pool.
b. H = 125 � 25T
c. H = 125 � 15T ; T would be multiplied by 15instead of 25. Some students may write aformula using 80 cm as the starting heightof the water. In that case, the answer wouldbe H � 80 � 15T
Section C. Differences inGrowth
1. The amount of bacteria will be over the limitin a little less than nine hours.
2. The inspector would have found 20,000,000bacteria one hour earlier.
The inspector would have found 80,000,000bacteria one hour later.
3. NEXT � CURRENT � 2
4. The chocolate mousse was removed from the refrigerator almost 9 hours before it wasinspected. Strategies will vary. Some studentsmay count how many times they must divideby 2 until the quantity of bacteria is under100,000.
Additional Practice Solutions Ups and Downs 50T
0
120
130
140
150
160
170
180
1 2 3
Time (in hours)
Wate
r Level (i
n c
m)
Hours
Number ofBacteria
0
200
1
400
2
800
3
1,600
4
3,200 6,400 12,800 25,600 51,200
5 6 7 8 9
102,400

Additional Practice SolutionsStudent Page
51 Ups and Downs Additional Practice Solutions Student Page
Additional Practice
Section CyclesD
Section Half and Half AgainE
Te
mp
era
ture
(°F
)
Time (in minutes)
350
280
210
140
70
2. Copy the graph and show how the temperature changes in theoven as the heating element shuts on and off.
3. Show what happens when someone turns the oven off.
4. Color one cycle on your graph.
Boiling water (water at 100°C) cools down at a rate determined by theair temperature. Suppose the temperature of the water decreases bya factor of 1���10 every minute if the air temperature is 0°C.
1. Under the above conditions, what is the temperature of boilingwater one minute after it has started to cool down? Two minutesafter? Three? Four?
Examine the following NEXT-CURRENT formulas.
2. Which ones give the temperature for water that is cooling downif the air temperature is 0°C? Explain.
a. NEXT � CURRENT � 10
b. NEXT � CURRENT � 0.9
c. NEXT � CURRENT � CURRENT � 0.1
d. NEXT � CURRENT � 0.1
3. How long does it take for boiling water to cool down to 40°Cif the air temperature is 0°C?
The graph shows the temperatureof an oven over a period of time.
1. Describe what the red part of the graph tells you about thetemperature of the oven.
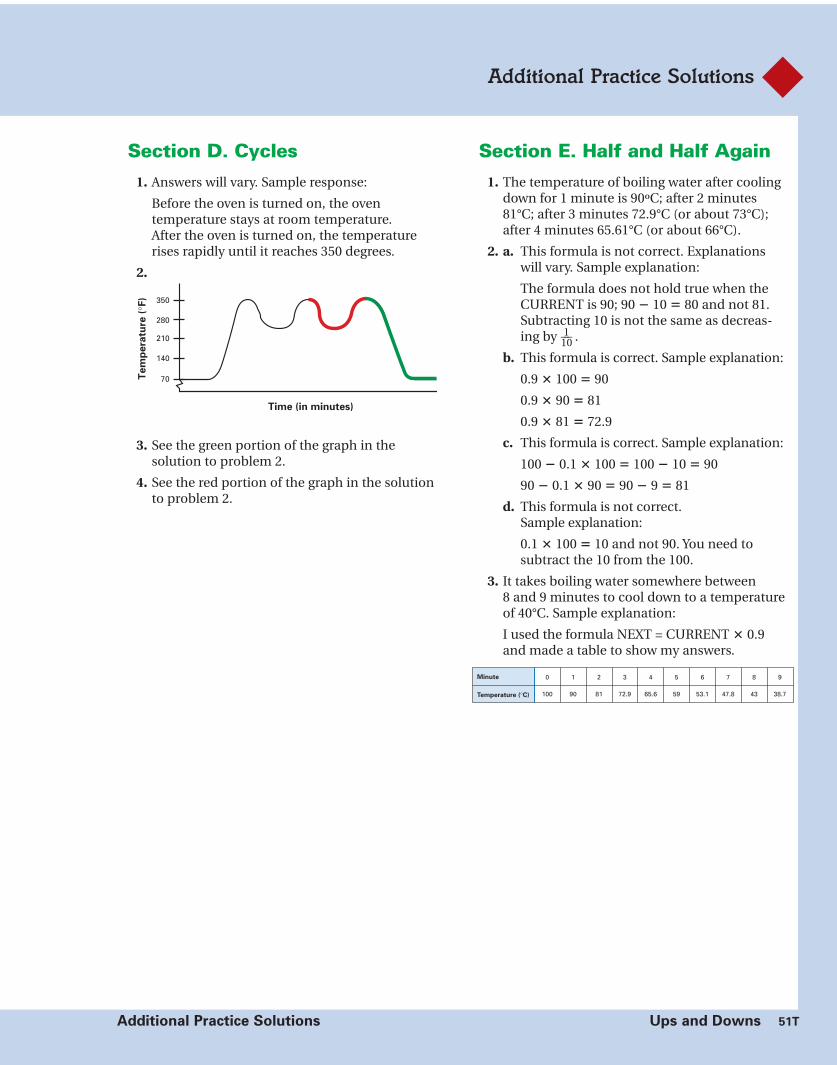
Additional Practice Solutions
Section D. Cycles
1. Answers will vary. Sample response:
Before the oven is turned on, the oven temperature stays at room temperature. After the oven is turned on, the temperaturerises rapidly until it reaches 350 degrees.
2.
3. See the green portion of the graph in the solution to problem 2.
4. See the red portion of the graph in the solutionto problem 2.
Section E. Half and Half Again
1. The temperature of boiling water after coolingdown for 1 minute is 90ºC; after 2 minutes81°C; after 3 minutes 72.9°C (or about 73°C);after 4 minutes 65.61°C (or about 66°C).
2. a. This formula is not correct. Explanationswill vary. Sample explanation:
The formula does not hold true when theCURRENT is 90; 90 � 10 � 80 and not 81.Subtracting 10 is not the same as decreas-ing by 1___10 .
b. This formula is correct. Sample explanation:
0.9 � 100 � 90
0.9 � 90 � 81
0.9 � 81 � 72.9
c. This formula is correct. Sample explanation:
100 � 0.1 � 100 � 100 � 10 � 90
90 � 0.1 � 90 � 90 � 9 � 81
d. This formula is not correct. Sample explanation:
0.1 � 100 � 10 and not 90. You need to subtract the 10 from the 100.
3. It takes boiling water somewhere between 8 and 9 minutes to cool down to a temperatureof 40°C. Sample explanation:
I used the formula NEXT = CURRENT � 0.9and made a table to show my answers.
Additional Practice Solutions Ups and Downs 51T
Te
mp
era
ture
(°F
)
Time (in minutes)
350
280
210
140
70
Minute
Temperature (°C)
0
100
1
90
2
81
3
72.9
4
65.6 59 53.1 47.8 43
5 6 7 8 9
38.7

Assessment Overview
52 Ups and Downs Assessment Overview
Unit assessments in Mathematics in Context include two quizzes anda Unit Test. Quiz 1 is to be used anytime after students have complet-ed Section B. Quiz 2 can be used after students have completed SectionD. The Unit Test addresses all of the major goals of the unit. You canevaluate student responses to these assessments to determine whateach student knows about the content goals addressed in this unit.
Pacing
Each quiz is designed to take approximately 25 minutes to complete.The Unit Test is designed to be completed during a 45-minute classperiod. For more information on how to use these assessments, seethe Planning Assessment section on the next page.
Assessment Overview
Goal Assessment Opportunities Problem Levels
• Use information about increase and/or Quiz 1 Problems 1addecrease to create line graphs. Test Problems 1a, 5c
• Identify and describe patterns of Quiz 1 Problems 1abcincrease and/or decrease from a table Quiz 2 Problem 2bor graph. Test Problems 2abcd, 3abc, 5b
• Identify characteristics of periodic graphs. Quiz 2 Problem 2a Level ITest Problems 4abc
• Identify linear patterns in tables and graphs. Quiz 1 Problem 1cTest Problems 3abc, 5bc
• Understand and use growth factors. Quiz 2 Problems 1acTest Problem 5a
• Describe linear, quadratic, and exponential Quiz 2 Problem 1dgrowth with recursive formulas. Test Problem 5e
• Describe linear growth with direct formulas. Quiz 1 Problems 2abTest Problem 1b
• Make connections between situation, Quiz 1 Problems 2cd Level IIgraph, and table. Quiz 2 Problem 2b
Test Problems 2d, 3d, 4de, 5bcd
• Reason about situations of growth in Test Problems 2d, 5aterms of slope, maximum and minimumrange, decrease, and increase.
• Recognize the power of graphs and/or Test Problem 5dtables for representing and solving problems.
• Use algebraic models to represent Quiz 2 Problem 1bLevel III
realistic situations. Test Problem 5e

Assessment Overview
Assessment Overview Ups and Downs 53
About the Mathematics
These assessment activities assess the major goals of the Ups andDowns unit. Refer to the Goals and Assessment Opportunities sectionon the previous page for information regarding the goals that areassessed in each problem. Some of the problems that involve multiple skills and processes address more than one unit goal. Toassess students’ ability to engage in non-routine problem solving (a Level III goal in the Assessment Pyramid), some problems assessstudents’ ability to use their skills and conceptual knowledge in newsituations. For example, in the radioactivity problem on the Unit Test (problem 5), students must integrate their understanding ofexponential decay and use of graphs and recursive formulas to solve a new problem.
Planning Assessment
These assessments are designed for individual assessment; however,some problems can be done in pairs or small groups. It is importantthat students work individually if you want to evaluate each student’sunderstanding and abilities.
Make sure you allow enough time for students to complete the prob-lems. If students need more than one class sessions to complete theproblems, it is suggested that they finish during the next mathematicsclass, or you may assign select problems as a take-home activity.Students should be free to solve the problems their own way. Studentuse of calculators is at the teacher’s discretion.
If individual students have difficulties with any particular problems,you may give the student the option of making a second attempt afterproviding him or her a hint. You may also decide to use one of theoptional problems or Extension activities not previously done in classas additional assessments for students who need additional help.
Scoring
Solution and scoring guides are included for each quiz and the UnitTest. The method of scoring depends on the types of questions oneach assessment. A holistic scoring approach could also be used toevaluate an entire quiz.
Several problems require students to explain their reasoning or justifytheir answers. For these questions, the reasoning used by students insolving the problems as well as the correctness of the answers shouldbe considered in your scoring and grading scheme.
Student progress toward goals of the unit should be considered whenreviewing student work. Descriptive statements and specific feedbackare often more informative to students than a total score or grade.You might choose to record descriptive statements of select aspectsof student work as evidence of student progress toward specific goalsof the unit that you have identified as essential.

54 Ups and Downs Quiz 1 Mathematics in Context
Ups and Downs Quiz 1 Page 1 of 2
Name ____________________________________________ Date ______________________
Use additional paper as needed.
© E
ncy
clo
pæ
dia
Bri
tan
nic
a, In
c.
Th
is p
age
may
be
rep
rod
uce
d f
or
clas
sro
om
use
.
1. In newspapers, you often find headlines like these.
Four different graphs are shown.
a. Does one of the graphs fit the headline on the left? If yes, which one?
b. Does one of the graphs fit the headline on the right? If yes, which one?
c. Make up headlines for the other graphs.
A B C D
Population of Seattle
Growing Faster and Faster
Price of Calculators
Dropping Faster and Faster
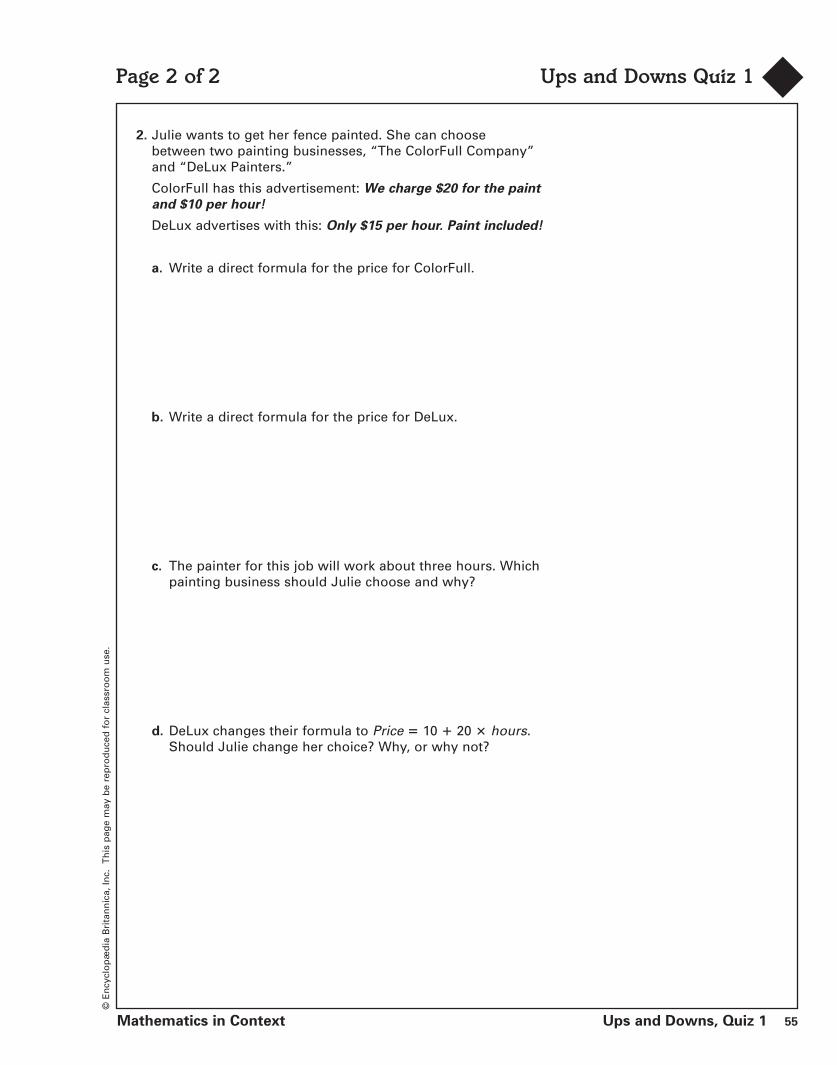
Mathematics in Context Ups and Downs, Quiz 1 55
© E
ncy
clo
pæ
dia
Bri
tan
nic
a, In
c.
Th
is p
age
may
be
rep
rod
uce
d f
or
clas
sro
om
use
.
Page 2 of 2 Ups and Downs Quiz 1
2. Julie wants to get her fence painted. She can choose between two painting businesses, “The ColorFull Company”and “DeLux Painters.”
ColorFull has this advertisement: We charge $20 for the paint
and $10 per hour!
DeLux advertises with this: Only $15 per hour. Paint included!
a. Write a direct formula for the price for ColorFull.
b. Write a direct formula for the price for DeLux.
c. The painter for this job will work about three hours. Whichpainting business should Julie choose and why?
d. DeLux changes their formula to Price � 10 � 20 � hours.Should Julie change her choice? Why, or why not?

56 Ups and Downs Quiz 2 Mathematics in Context
Ups and Downs Quiz 2 Page 1 of 2
Name ____________________________________________ Date ______________________
Use additional paper as needed.
©E
ncy
clo
pæ
dia
Bri
tan
nic
a,In
c.T
his
pag
em
ayb
ere
pro
du
ced
for
clas
sro
om
use
.
1. The growth of a certain leaf is described in the table below.
a. Assume the growth in the table above is quadratic;find the missing value. Show or explain how you foundthe missing value.
b. Check if the following formula describes the quadraticgrowth for the leaf described in the table above. Correctthe formula if necessary.
y � x 2 � x
c. Fill in the missing value below for another leaf that growsexponentially.
d. Write a NEXT-CURRENT formula to describe the exponentialgrowth.
Number of Weeks 1
2
2
4
3
8
4
Area (in cm2)
Number of Weeks 1
2
2
4
3
8
4
Area (in cm2)

Mathematics in Context Ups and Downs, Quiz 2 57
© E
ncy
clo
pæ
dia
Bri
tan
nic
a, In
c.
Th
is p
age
may
be
rep
rod
uce
d f
or
clas
sro
om
use
.
Page 2 of 2 Ups and Downs Quiz 2
2. Ships without radar or other modern equipment on board canfind their way at night by using light signals from lighthouses.Every lighthouse has its own light signal, so a captain canidentify a lighthouse from the pattern of the light flashes.
Below, you see a graphical representation of one lighthouse’ssignal pattern.
a. Examine the diagram of the lighthouse signal pattern.Shade the diagram to show one cycle of the signal pattern.How long is one period?
b. How many light flashes would you see in a one-minuteperiod?
Time (in seconds)
Light On
Light Off
0 5 10 15 20

58 Ups and Downs Unit Test Mathematics in Context
Ups and Downs Unit Test Page 1 of 6
Name ____________________________________________ Date ______________________
Use additional paper as needed.
© E
ncy
clo
pæ
dia
Bri
tan
nic
a, In
c.
Th
is p
age
may
be
rep
rod
uce
d f
or
clas
sro
om
use
.
1. In the small town of Bakersfield, there are two taxicab companies.The Metro Taxi Company charges customers a flat rate of $4 permile. The Acme Taxi Company uses the following table to showtheir cab fare costs.
a. Draw a graph for each taxi company showing the costs of cabrides for various distances.
b. Write formulas that could be used to calculate the costs of cabrides using the two taxi companies. Use the letter C to repre-sent the cost of the trip and the letter D to represent the dis-tance in miles.
0
5
10
15
20
25
30
35
1 2 3 4 5 6 7 8 9 10
Distance (in miles)
Co
st
(in
do
llars
)
Distance (in miles) 1 2 3 4
Cost (in dollars) 7 9 11 13

Mathematics in Context Ups and Downs, Unit Test 59
© E
ncy
clo
pæ
dia
Bri
tan
nic
a, In
c.
Th
is p
age
may
be
rep
rod
uce
d f
or
clas
sro
om
use
.
Page 2 of 6 Ups and Downs Unit Test
2. On the right, you see patterns that are made using matches.The first figure, with one row, is made using 3 matches.The second one, with two rows, is made using 9 matches.
a. How many matches are used for the third figure, with three rows?
b. Draw the fourth and fifth figures.
c. Complete the following table.
d. Is the relationship between the number of rows and thenumber of matches linear, quadratic, or exponential?Explain your answer.
Figure 1
Figure 2
Figure 3
Figure Number 1
3 9Number of Total Matches
2 3 4 5 6
Row 1
Row 1
Row 2
Row 1Row 2Row 3

60 Ups and Downs Unit Test Mathematics in Context
Ups and Downs Unit Test Page 3 of 6
Name ____________________________________________ Date ______________________
Use additional paper as needed.
© E
ncy
clo
pæ
dia
Bri
tan
nic
a, In
c.
Th
is p
age
may
be
rep
rod
uce
d f
or
clas
sro
om
use
.
3. On the right is another pattern made using matches.The first figure, with one row, is made using 2 matches.Figure 2, with two rows, is made using 6 matches.
a. How many matches are used for the third, the fourth, and the fifth figure?
third figure: _________
fourth figure: _________
fifth figure: _________
b. Complete the following table.
c. Is the relationship between the number of rows and thenumber of matches linear, quadratic or exponential? Explainyour answer.
Figure 1
Figure 2
Figure 3
Row 1
Row 1
Row 2
Row 1Row 2Row 3
Figure 4
Figure 5
Row 1
Row 2
Row 3
Row 4
Row 1
Row 2
Row 3
Row 4
Row 5
Figure Number 1
2 6Number of Total Matches
2 3 4 5 6
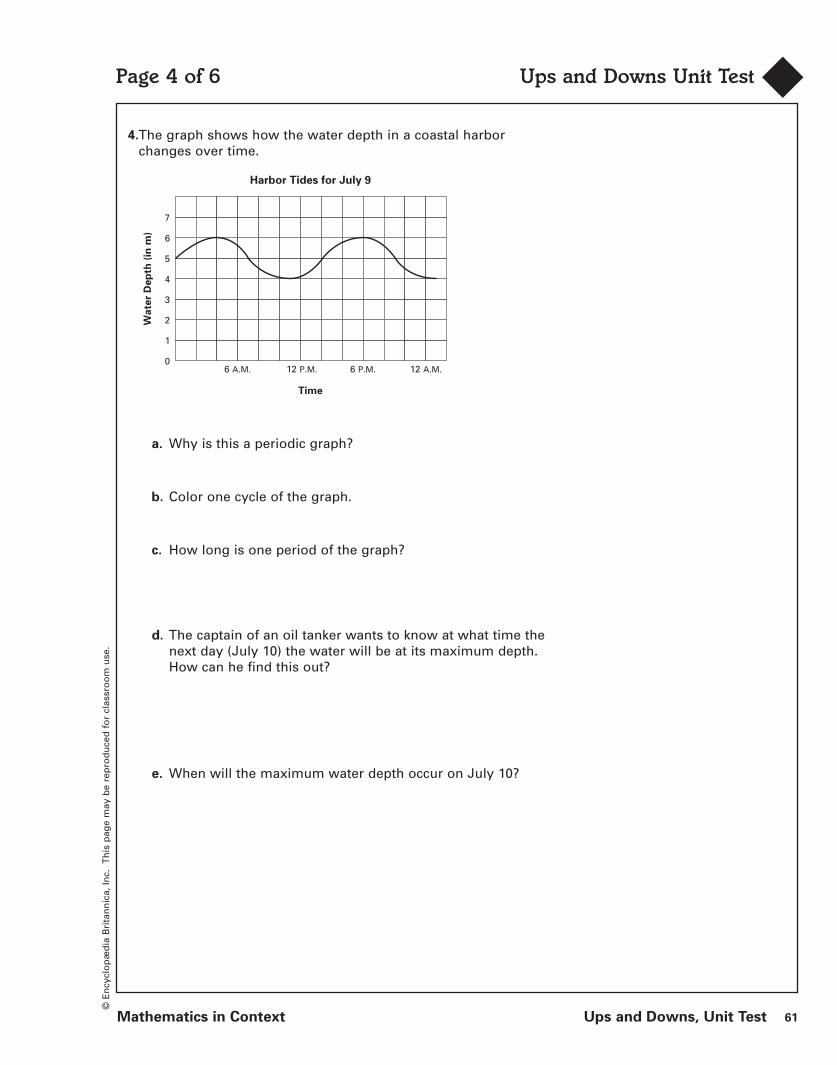
Mathematics in Context Ups and Downs, Unit Test 61
© E
ncy
clo
pæ
dia
Bri
tan
nic
a, In
c.
Th
is p
age
may
be
rep
rod
uce
d f
or
clas
sro
om
use
.
Page 4 of 6 Ups and Downs Unit Test
4.The graph shows how the water depth in a coastal harborchanges over time.
a. Why is this a periodic graph?
b. Color one cycle of the graph.
c. How long is one period of the graph?
d. The captain of an oil tanker wants to know at what time thenext day (July 10) the water will be at its maximum depth.How can he find this out?
e. When will the maximum water depth occur on July 10?
Wa
ter
De
pth
(in
m)
Time
Harbor Tides for July 9
0
1
2
3
4
5
6
7
6 A.M. 12 P.M. 6 P.M. 12 A.M.

62 Ups and Downs Unit Test Mathematics in Context
Ups and Downs Unit Test Page 5 of 6
Name ____________________________________________ Date ______________________
Use additional paper as needed.
© E
ncy
clo
pæ
dia
Bri
tan
nic
a, In
c.
Th
is p
age
may
be
rep
rod
uce
d f
or
clas
sro
om
use
.
5. Nuclear waste is highly radioactive, and it is therefore unsafefor living things. Nuclear waste must be kept in a safe placeaway from people, animals, and food and water supplies untilit loses its dangerous level of radioactivity. Suppose that anuclear plant produced radioactive waste that would lose itsradioactivity as follows: every ten years, the amount of radio-activity decreases by 25%.
One scientist suggested that the nuclear waste be safely stored in barrels for a period of 40 years until it is no longerradioactive. Then the barrels could be dumped into the oceanwithout causing any harm to humans, marine life, or food andwater supplies.
a. How might the scientist have determined that it would take 40 years for the nuclear waste to lose its radioactivity?Do you agree with his plan? Explain your reasoning.
b. The nuclear waste material showed a radioactivity level of1,024 counts per minute on a Geiger counter. Complete thetable below to show how the amount of radioactivity wouldchange over time.
Years 0
1,024Countsper Minute
10 20

Mathematics in Context Ups and Downs Unit Test 63
© E
ncy
clo
pæ
dia
Bri
tan
nic
a, In
c.
Th
is p
age
may
be
rep
rod
uce
d f
or
clas
sro
om
use
.
Page 6 of 6 Ups and Downs Unit Test
c. Make a graph showing the amount of radioactivity over time.
d. Give an estimate of the amount of radioactivity that stillremains after 40 years.
e. Write a NEXT-CURRENT formula to describe the decreasingamount of radioactivity in this situation.

Possible student answer Suggested number Problem levelof score points
Ups and Downs Quiz 1Solution and Scoring Guide
64 Ups and Downs Quiz 1 Mathematics in Context
1. a. No graph fits the headline “faster and faster.” 1 I
b. Graph D: “dropping faster and faster” The vertical differences are larger as you move 1 Ito the right.
c. Answers will vary. Sample responses: 3 IGraph A: “The jump in gas prices is slowing down”
Graph B: “Prices of groceries have increased the same amount every year”
Graph C: “Decline in fresh water levels is slowing down”
2. a. price � 20 � 10 � (number of hours) 2 II
b. price � 15 � (number of hours) 2 II
c. 3 hours: ColorFull will cost 20 � 10 � 3 � $50; 3 IIDeLux will cost 15 � 3 � $45.She should choose DeLux because this one is the cheapest.
d. She should probably switch to ColorFull 3 IIsince DeLux will now cost 10 � 20 � 3 � $70,which is more expensive.
Total score points 15

Expressions and Formulas Quiz 2Solution and Scoring Guide
Mathematics in Context Ups and Downs Quiz 2 65
Possible student answer Suggested number Problem levelof score points
1. a. 2 I
b. y � x 2 � x is not correct. 2 II
If you evaluate the equation for 1 week, when x (number of weeks) is 1, y (area) is 0. However, the table shows that when the number of weeks (x ) is 1, the area (y ) is 2.
The correct direct formula is y � x 2 � x � 2.This formula can be verified by substituting other values for x.
c. 2 I
d. NEXT � CURRENT � 2 1 II
2. a. 2 I
One period is nine seconds. 2 I
b. You would see 13 flashes during a one-minute 3 I/IIperiod. Sample explanation: during the first 54 seconds, you would see 6 complete cycles of two flashes, or 12 flashes. During the next 6 seconds, you would see one flash of the next cycle, so altogether, 13 flashes.
Total score points 14
Time (in seconds)
Light On
Light Off
0 5 10 15 20
Number of Weeks 1
2
2
4
3
8
4
14Area (in cm2)
� 2
� 2 � 2
� 4 � 6
Number of Weeks 1
2
2
4
3
8
4
16Area (in cm2)
� 2 � 2 � 2

Ups and Downs Unit TestSolution and Scoring Guide
66 Ups and Downs Unit Test Mathematics in Context
Solutions Score Points Level
1. a. 2 I
b. Metro: C � 4D 2 II
Acme: C � 5 � 2D
2. a. 18 matches 1 I
b. Figure 4 Figure 5 2 I
c. 2 I
d. The relationship is quadratic because the 3 I/IIsecond differences are all equal. 1 (answer)
2 (explanation)
Metr
o Taxi C
o.
Metr
oTaxi Co.
0
5
10
15
20
25
30
35
1 2 3 4 5 6 7 8 9 10
Distance (in miles)
Co
st
(in
do
lla
rs)
Metr
o Taxi C
o.
Acme Taxi Co.
Acme Taxi Co.
Acme Taxi Co.
Figure Number 1
3 9 18 30 45 63Number of Total Matches
2 3 4 5 6
Figure Number 1
3 9 18 30 45 63Number of Total Matches
2 3 4 5 6
� 6 � 9 � 12 � 15
� 3 � 3 � 3 � 3
� 18

Ups and Downs Unit TestSolution and Scoring Guide
Mathematics in Context Ups and Downs Unit Test 67
Solutions Score Points Level
3. a. 10, 14, and 18 matches 3 I
b. 2 I
c. linear; the first differences are all the same: �4. 2 I/II
4. a. This is a periodic graph because it shows a 1 Irepeating pattern.
b. Answers will vary. Sample response: 2 I
c. One period is about 14 hours. 1 I
d. Strategies will vary. Sample strategies: 2 IIThe captain can extend the graph and draw the repeating pattern for the next day.
The captain can add 14 hours to the last maximum depth time on July 9th.(6:00 P.M. � 14 hours � 8:00 A.M.)
e. The water will be at its maximum depth at 1 II8:00 A.M. and at 10:00 P.M.
Wa
ter
De
pth
(in
m)
Time
Harbor Tides for July 9
0
1
2
3
4
5
6
7
6 A.M. 12 P.M. 6 P.M. 12 A.M.
Figure Number 1
2 6 10 14 18 22Number of Total Matches
2 3 4 5 6

Ups and Downs Unit TestSolution and Scoring Guide
68 Ups and Downs Unit Test Mathematics in Context
Solutions Score Points Level
5. a. The students should be able to explain the 2 I/II*scientists reasoning (1 pt); however, they should also recognize that this type of reasoning is incorrect (1 pt).
Explanations will vary: Some students may say that it is incorrect for the scientist to reason that if 25% of the radiation disappears every 10 years, then all of the radiation will be gone in 40 years (4 � 10 � 40).
Some students may show a correct interpretation of decay in radioactive counts to justify their disagreement withthe scientist’s plan. Example:Suppose that the starting amount was 100 counts per minute. In 10 years, you will have 75 counts per minute. In 20 years, you will have 56 counts per minute, and in 40 years, you will have 32 counts per minute.
b. Tables will vary depending on students’ 2 I/II*interpretation of the scientist’s reasoning. Give full credit for a table that is completed correctly, in line with the student agreement or disagreement with the scientists’ reasoning from part a.Sample response (disagrees with scientist):
Sample response (agrees with scientist):
Years 0
1,024 768 576 432 324Countsper Minute
10 20 30 40
Years 0
1,024 512 256 128 0Countsper Minute
10 20 30 40

Ups and Downs Unit TestSolution and Scoring Guide
Mathematics in Context Ups and Downs Unit Test 69
Solutions Score Points Level
c. Students should receive full credit for a graph 2 I/II*that matches the table they completed for part b.
d. Estimates will vary, depending on the graph 2 II/III*created. Give student credit for correct interpretation of graph from part c.
Sample estimates:
About 30% of the radioactivity remains.
or
A Geiger counter would register about 324 counts per minute of radioactivity.
e. NEXT-CURRENT formulas may vary. 2 II/III*Sample formulas:
NEXT � 0.75 � CURRENT
NEXT � 3__4 � CURRENT
NEXT � CURRENT � (0.25 � CURRENT)
NEXT � CURRENT � ( 1__4 � CURRENT)
Note: The last two formulas will be correct whether or not students use parentheses.
* Differences in the level of reasoning for 5a�5dare due to whether students interpret thesituation as linear orexponential.
Total score points 36
Years
Radioactive Decay
Co
un
ts p
er
Min
ute
1,024
768
576
432
324
0 10 20 30 40

Glossary
70 Ups and Downs Glossary
GlossaryThe Glossary defines all vocabulary words indicatedin this unit. It includes the mathematical terms thatmay be new to students, as well as words having to dowith the contexts introduced in the unit. (Note: TheStudent Book has no Glossary. Instead, students areencouraged to construct their own definitions, basedon their personal experiences with the unit activities.)
The definitions below are specific for the use of theterms in this unit. The page numbers given are fromthe Student Books.
coring (p. 2) a process to extract material todetermine its composition, frequently used withplants, soil, and ice. The core sample extractedthrough this process is often used to investigatechanges in local growth patterns, climate, etc.
cycle (p. 38) the portion of a periodic graph that is repeated
direct formula (p. 17) a formula that can be usedto find a value for any given
exponential decay (p. 45) the growth factor ofan exponential relationship that lies between 0 and 1
exponential growth (p. 31) the growth factor ofan exponential relationship that is greater than 1
growth factor (p. 30) the number by which each current value of an exponential relationship ismultiplied to find the next value. The growth factoris always a positive number.
line graph (p. 5) represents a continuous process,occurring over time. Only the dots on the graph,representing data, are meaningful. The straight linesthat connect the dots are used to show a trend.
linear growth (p. 9) a growth pattern showingequal increase or decrease over equal (time) periods.A graph of linear growth is a straight line. In a table,if equal periods are used, the first differences are equal.
negative growth (p. 45) a pattern of change inwhich the dimensions measured are decreasing
NEXT-CURRENT formula (p. 16) a type offormula based on additive or multiplicativedifferences between successive values (also called a recursive formula)
parabola (TG, Section C opener) a bowl-shapedgraph. The graph of a quadratic relationship isparabolic.
period (p. 38) the amount of time it takes to repeatone cycle of a periodic graph
periodic graph (p. 38) a graph that has arepeating shape or pattern
photosynthesis (p. 23) a process where plantsuse sunlight (or other light sources) to synthesizechemical compounds
quadratic (p. 27) a relationship in which the firstdifferences of table values are not equal and thesecond differences are equal.
second differences (p. 25) the differencebetween first difference values, often used to test if a relationship is quadratic
steepness (p 19T) equal increase or decrease over equal (time) periods as shown in the graphrepresenting a linear relationship. The higher theincrease per period, the steeper the graph.

BlacklineMasters
BlacklineMasters

72 Ups and Downs Letter to the Family
Dear Family,
Your child is about to begin working on the Mathematics in Contextunit Ups and Downs. This algebra unit presents real-world contextsthat can be represented by graphs that show change over time.
Students investigate graphs of ocean tides, tree growth, temperaturechanges, blood pressure, radioactive decay, and so on. They gain anunderstanding of what the shape of a graph means. Why might a graphgo only upward or downward? Students learn to identify cycles (therepeating parts of graphs) and periods(the durations of the parts that repeat).
You can help you child learn aboutgraphs that show change over time bypointing them out when you see themin newspapers or magazines. You maywish to keep track of the temperaturesover a week or a month and then create a graph that represents thedata you have collected. You can alsograph the temperature predictionsthat your local weather personmakes and see how the graphs of thepredicted and actual temperaturescompare.
We hope you enjoy discussing theuses of graphs and the storiesbehind them with your child.
Sincerely,
The MMathematics iinContext DDevelopmentTeam
Dear Student,
Welcome to Ups and Downs. In this unit, you will look at situations
that change over time, such as blood pressure or the tides of an
ocean. You will learn to represent these changes using tables,
graphs, and formulas.Graphs of temperatures and tides show up-and-down movement,
but some graphs, such as graphs for tree growth or melting ice,
show only upward or only downward movement.As you become more familiar with graphs and the changes that
they represent, you will begin to notice and understand graphs
in newspapers, magazines, and advertisements.During the next few weeks, look for graphs and statements about
growth, such as “Fast-growing waterweeds in lakes become a
problem.” Bring to class interesting graphs and newspaper articles
and discuss them.
Telling a story with a graph can help you understand the story.Sincerely,
The MMathematics iin CContext DDevelopment TTeam
Ups and Downs
April 20
Water Level(in cm)
Sea Level
+80
+60
+40
+20
0
-20
-40
-60
-80
-100Time
A.M.
1 3 5 7 9 11 1 3 5 7 9 11P.M.
Letter to the Family
© E
ncy
clo
pæ
dia
Bri
tan
nic
a, In
c.
Th
is p
age
may
be
rep
rod
uce
d f
or
clas
sro
om
use
.
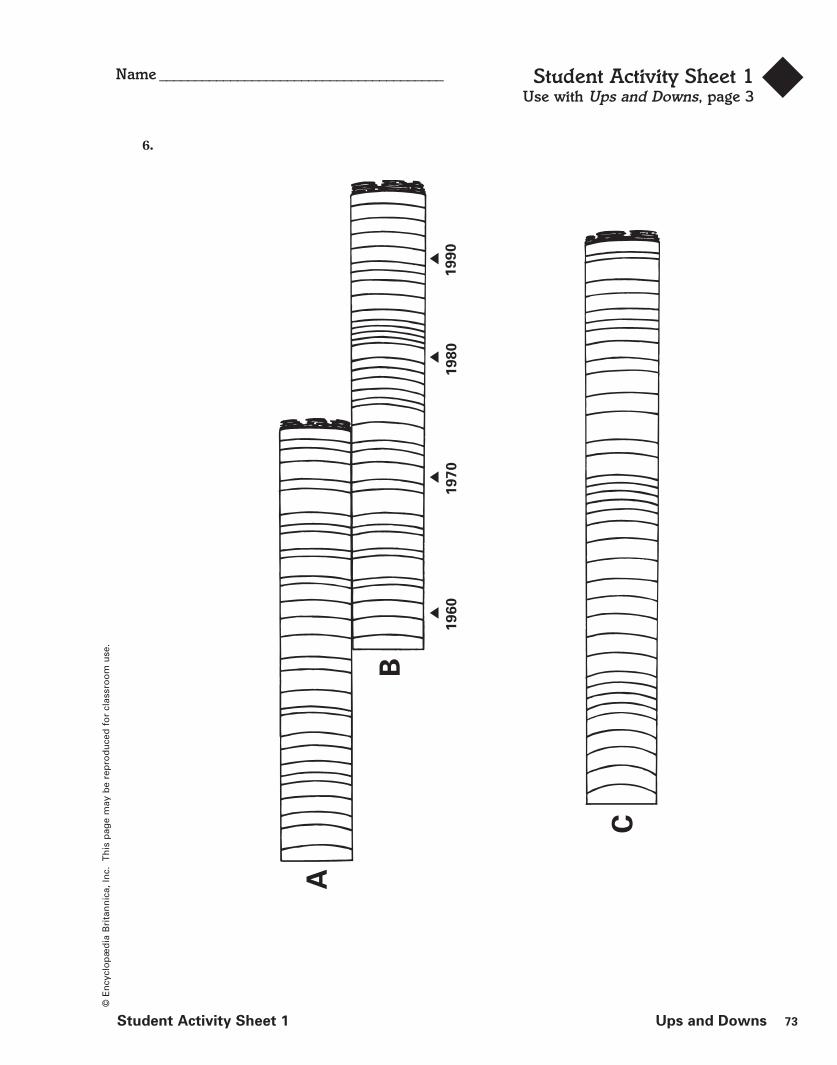
Student Activity Sheet 1Use with Ups and Downs, page 3
6.
Name ________________________________________
Student Activity Sheet 1 Ups and Downs 73
© E
ncy
clo
pæ
dia
Bri
tan
nic
a, In
c.
Th
is p
age
may
be
rep
rod
uce
d f
or
clas
sro
om
use
.
A
B
19
60
19
70
19
80
19
90
C

Student Activity Sheet 2Use with Ups and Downs, page 5.
12. a.
Name ________________________________________
74 Ups and Downs Student Activity Sheet 2
© E
ncy
clo
pæ
dia
Bri
tan
nic
a, In
c.
Th
is p
age
may
be
rep
rod
uce
d f
or
clas
sro
om
use
.
20
30
40
50
60
70
80
90
100
110
120
130
140
150
160
170
180
10
0 1 2 3 4 5 6 7 8 9 10 11 12 13 14 15 16 17 18 19
1
2
3
( in cm)
Year
Marsha’s Height

Student Activity Sheet 3Use with Ups and Downs, page 7.
17.
Name ________________________________________
Student Activity Sheet 3 Ups and Downs 75
© E
ncy
clo
pæ
dia
Bri
tan
nic
a, In
c.
Th
is p
age
may
be
rep
rod
uce
d f
or
clas
sro
om
use
.
181716151413121110
98765432
3 6 9 12 15 18 21 24 27 30 33 36
We
igh
t (i
n k
g)
Age (in months)
Birth
Weight Growth Chart for Boys
Age: Birth to 36 months
105100959085807570656055504540
3 6 9 12 15 18 21 24 27 30 33 36
He
igh
t (i
n c
m)
Age ( in months)
Birth
Height Growth Chart for Boys
Age: Birth to 36 months
© Am. J. Nutr. American Society for Clinical Nutrition

Student Activity Sheet 4Use with Ups and Downs, page 11.
2.
Name ________________________________________
76 Ups and Downs Student Activity Sheet 4
© E
ncy
clo
pæ
dia
Bri
tan
nic
a, In
c.
Th
is p
age
may
be
rep
rod
uce
d f
or
clas
sro
om
use
.
20
30
40
50
60
70
80
90
100
110
120
130
140
150
160
170
180
10
0 1 2 3 4 5 6 7 8 9 10 11 12 13 14 15 16 17 18 19
( in cm )
Year
Dean’s Height

Student Activity Sheet 5Use with Ups and Downs,
pages 14 and 15.
2.b.
Name ________________________________________
Student Activity Sheet 5 Ups and Downs 77
© E
ncy
clo
pæ
dia
Bri
tan
nic
a, In
c.
Th
is p
age
may
be
rep
rod
uce
d f
or
clas
sro
om
use
.
Time (in minutes )
0 10 20 30
36
37
38
39
40
41
42
43
44
Te
mp
era
ture
(°C
)
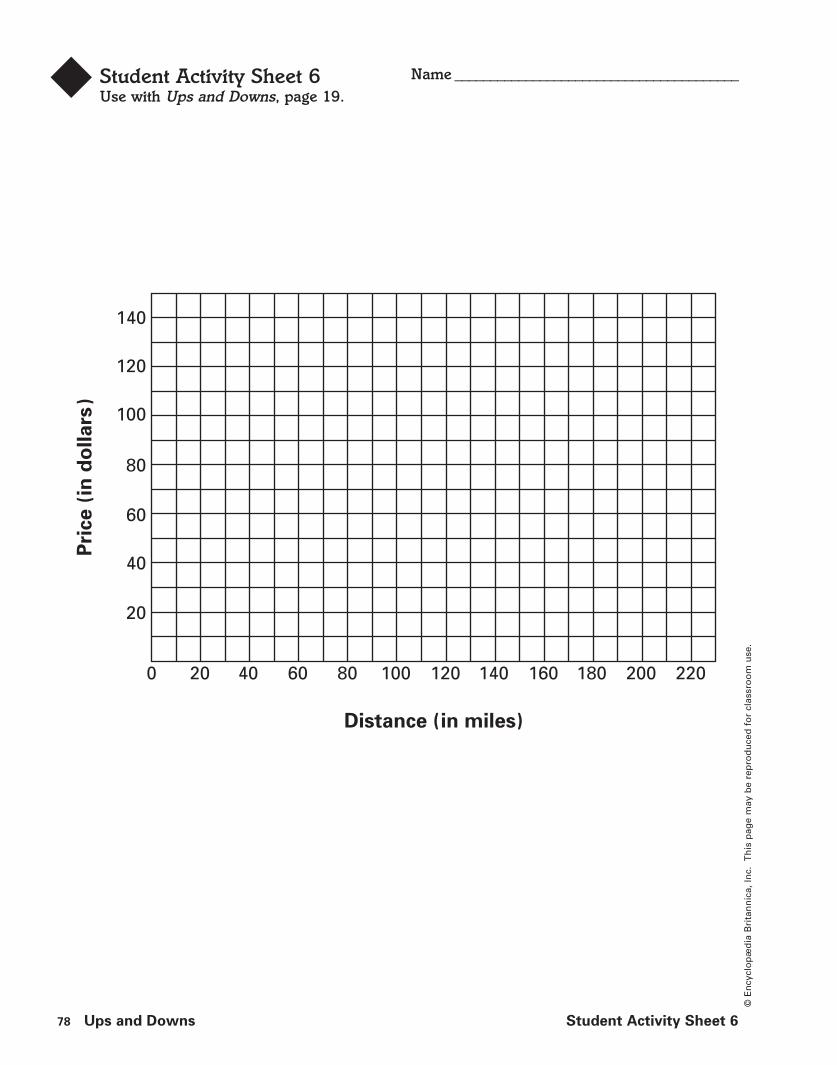
Student Activity Sheet 6Use with Ups and Downs, page 19.
Name ________________________________________
78 Ups and Downs Student Activity Sheet 6
© E
ncy
clo
pæ
dia
Bri
tan
nic
a, In
c.
Th
is p
age
may
be
rep
rod
uce
d f
or
clas
sro
om
use
.
0 20 40 60 80 100 120 140 160 180 200 220
Distance (in miles)
20
40
60
80
100
120
140
Pri
ce (
in d
ollars
)

Student Activity Sheet 7Use with Ups and Downs,
pages 24 and 25.
Name ________________________________________
Student Activity Sheet 7 Ups and Downs 79
© E
ncy
clo
pæ
dia
Bri
tan
nic
a, In
c.
Th
is p
age
may
be
rep
rod
uce
d f
or
clas
sro
om
use
.
Height (in cm)
Area (in cm2)
First Difference
18
6.5
6 7 8 9 10 11 12
24.5
7.5
32
1Second Difference
6 7
18 24.5
8 9 10 11 12Height (in cm)
Area (in cm2)

Student Activity Sheet 8Use with Ups and Downs, page 25.
Name ________________________________________
80 Ups and Downs Student Activity Sheet 8
© E
ncy
clo
pæ
dia
Bri
tan
nic
a, In
c.
Th
is p
age
may
be
rep
rod
uce
d f
or
clas
sro
om
use
.
Am
ou
nt
of
Dif
fere
nce
Difference Number
14
13
12
11
10
9
8
7
6
0 1 2 3 4 5 6 7 8 9 10

Student Activity Sheet 9Use with Ups and Downs, page 26.
9. a. Fill in the remaining area values in the table. Use this formula:A � 1��2 h2
b. Graph the formula on the grid. Why do you think the graphcurves upward?
c. Using your graph, estimate the areas of poplar leaves with thefollowing heights: 5.5 cm, 9.3 cm, and 11.7 cm.
Name ________________________________________
Student Activity Sheet 9 Ups and Downs 81
© E
ncy
clo
pæ
dia
Bri
tan
nic
a, In
c.
Th
is p
age
may
be
rep
rod
uce
d f
or
clas
sro
om
use
.
Area of Black Poplar Leaves
80
75
70
65
60
55
50
45
40
35
30
25
20
15
10
5
0 1 2 3 4 5 6 7 8 9 10 11 12
Are
a (
in c
m2)
Height (in cm)
1 2
0.5 2 4.5
3 4 5 6 7 8Height (in cm)
Area (in cm2)

Student Activity Sheet 10Use with Ups and Downs, page 27.
Name ________________________________________
82 Ups and Downs Student Activity Sheet 10
© E
ncy
clo
pæ
dia
Bri
tan
nic
a, In
c.
Th
is p
age
may
be
rep
rod
uce
d f
or
clas
sro
om
use
.
Week
32100 1 32

Student Activity Sheet 11Use with Ups and Downs, page 30.
Name ________________________________________
Student Activity Sheet 11 Ups and Downs 83
© E
ncy
clo
pæ
dia
Bri
tan
nic
a, In
c.
Th
is p
age
may
be
rep
rod
uce
d f
or
clas
sro
om
use
.
KENYAUGANDA
Lake Albert
TANZANIA
RWANDA
BURUNDI
LakeVictoria

Student Activity Sheet 12Use with Ups and Downs, page 37.
Name ________________________________________
84 Ups and Downs Student Activity Sheet 12
© E
ncy
clo
pæ
dia
Bri
tan
nic
a, In
c.
Th
is p
age
may
be
rep
rod
uce
d f
or
clas
sro
om
use
.
Au
gu
st 7
Au
gu
st 8
Au
gu
st 9
24
68
1012
24
68
1012
24
68
1012
24
68
1012
24
68
1012
24
68
1012
12
200
180
160
140
120
100806040200
Water Level ( in cm)
A.M
.P
.M.
A.M
.P
.M.
A.M
.A
.M.
P.M
.
Se
aL
ev
el
Tim
e
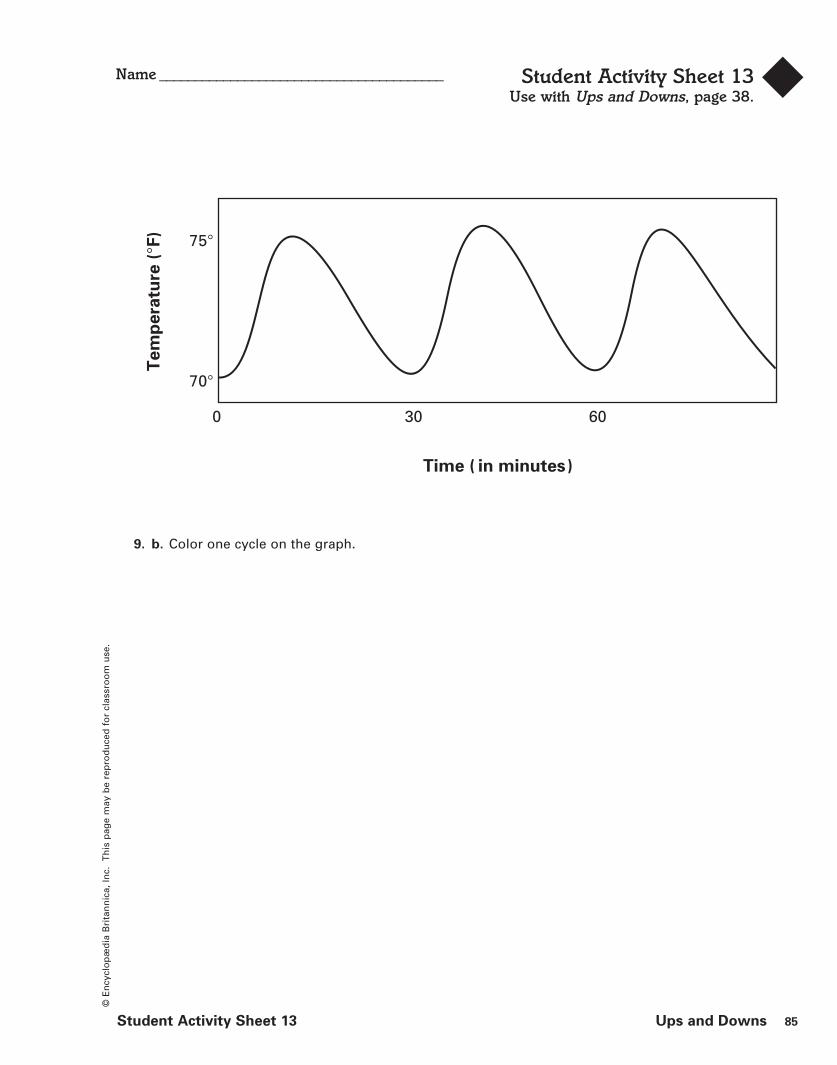
Student Activity Sheet 13Use with Ups and Downs, page 38.
9. b. Color one cycle on the graph.
Name ________________________________________
Student Activity Sheet 13 Ups and Downs 85
© E
ncy
clo
pæ
dia
Bri
tan
nic
a, In
c.
Th
is p
age
may
be
rep
rod
uce
d f
or
clas
sro
om
use
.
Time ( in minutes)
Te
mp
era
ture
(°F
)
0
70°
75°
30 60