Embed Size (px)
Citation preview

Upper Valley
Intermodal
Transportation
Facility Study
Upper Valley Region
NH & VT
June 2010

Report Prepared for:
The Upper Valley Lake Sunapee Regional Planning Commission and the New Hampshire
Department of Transportation
Report Prepared by:
Report Assistance Provided by:

Upper Valley Intermodal Facility – Draft Report
Page i
TABLE OF CONTENTS
1.0 INTRODUCTION ....................................................................................... 1
2.0 PURPOSE AND NEED STATEMENT ............................................................... 5
2.1 Increase Access to and Diversity of Transportation ................................................................................. 5
2.2 Maintain the Regional Environment ........................................................................................................ 6
2.3 Sustain Economic Vitality ......................................................................................................................... 6
2.4 Other Goals for the Project ...................................................................................................................... 7
3.0 TRANSPORTATION CONDITIONS IN THE UPPER VALLEY ................................... 9
3.1 Intercity Transportation Services ........................................................................................................... 10
3.2 Regional Transit Service ......................................................................................................................... 13
3.3 Local Transit Service – Advance Transit ................................................................................................. 16
3.4 Park and Ride Network .......................................................................................................................... 18
3.5 Commuting Trends ................................................................................................................................. 19
4.0 ALTERNATIVES ANALYSIS – PHASE I .......................................................... 25
4.1 Phase I Screening Analysis Methodology ............................................................................................... 26
4.2 Phase I Screening Criteria ...................................................................................................................... 28
4.3 Phase I Screening Criteria Results .......................................................................................................... 33
5.0 ALTERNATIVES ANALYSIS - PHASE II .......................................................... 35
5.1 Phase II Screening Analysis Methodology .............................................................................................. 35
5.2 Phase II Screening Criteria ..................................................................................................................... 38
5.3 Phase II Screening Assessment Results .................................................................................................. 54
6.0 DENSMORE BRICKYARD DESIGN CHARRETTE .............................................. 57
6.1 Day One – Listening Session ................................................................................................................... 57
6.2 Day Two, Morning – Concept Redesign ................................................................................................. 59
6.3 Day Two, Afternoon – Concept Redesign Presentation ......................................................................... 62
7.0 SITE SELECTION...................................................................................... 63
7.1 City of Lebanon Concerns ...................................................................................................................... 63
8.0 DENSMORE BRICKYARD CONCEPTUAL SITE DESIGN...................................... 65
8.1 Conceptual Cost Estimate ...................................................................................................................... 70
8.2 Permitting Requirements ....................................................................................................................... 71
9.0 NEXT STEPS .......................................................................................... 73

15 June 2010
Page ii
LIST OF FIGURES
Figure 1. Intermodal Facilities in Portsmouth (left) and Londonderry (right) ....................................................... 2
Figure 2. Project Advisory Committee Members ................................................................................................... 3
Figure 3. Project Milestones .................................................................................................................................. 3
Figure 4. Average Intercity Travel Times ............................................................................................................. 12
Figure 5. Stagecoach Route Map (as of 2/2010) .................................................................................................. 13
Figure 6. Connecticut River Transit Route Map (as of 2/2010)............................................................................ 14
Figure 7: Advance Transit Performance Measures for April 2008 ....................................................................... 16
Figure 8. Advance Transit Route Map (as of 2/2010) .......................................................................................... 17
Figure 9: Upper Valley Average Annual Daily Traffic (AADT) Volumes and Major Employers............................. 19
Figure 10. Dartmouth College Employee Residence Distribution........................................................................ 20
Figure 11. Dartmouth Hitchcock Medical Center (DHMC) Employee Residence Distribution ............................ 21
Figure 12. Dartmouth College Employee Commuting Routes ............................................................................. 22
Figure 13. Upper Valley Commuting Mode-Share – Drive Alone ........................................................................ 23
Figure 14. Phase I Sites ........................................................................................................................................ 26
Figure 15. Phase I Screening Criteria ................................................................................................................... 27
Figure 16. Phase I Screening Criteria: Access ....................................................................................................... 28
Figure 17. Phase 1 Screening Criteria: Community/Environmental Impacts ....................................................... 30
Figure 18. Phase I Screening Criteria: Planning and Land Use Considerations .................................................... 32
Figure 19. Phase I Screening Criteria: Site Characteristics/Implementation ....................................................... 33
Figure 20. Sites Selected for Phase II Screening Assessment .............................................................................. 33
Figure 21. Calculating Scores and Applying Weighting, Metric 2.1: Impact to Adjacent Property Values. ......... 36
Figure 22. Metrics: Criteria, Weight, and Benchmark. ........................................................................................ 37
Figure 23. Impacts to Adjacent Property Values ................................................................................................. 39
Figure 24. Distribution of Home Zip Codes of Dartmouth Coach Riders Boarding in Lebanon ........................... 41
Figure 25. Graphic Showing Portion of Synchro Traffic Model ............................................................................ 42
Figure 26. Intermodal Center Peak Hour Trip Generation Estimate .................................................................... 43
Figure 27. Local Travel Times for Individual Dartmouth Coach Bus Trips ............................................................ 45
Figure 28. Dartmouth Coach Combined Local Daily Travel Times ....................................................................... 45
Figure 29. Greyhound Lines Combined Local Daily Travel Times ........................................................................ 45
Figure 30. Combined Impact (service hours) on Intercity Bus Operations .......................................................... 46
Figure 31. Assessed Value of Phase II Sites .......................................................................................................... 47
Figure 32. Site Acquisition Cost Summary ........................................................................................................... 49
Figure 33. Off-site Highway Improvements. ........................................................................................................ 51
Figure 34. Current Local Tax Revenue. ................................................................................................................ 54
Figure 35. Phase II Screening Assessment Summary ........................................................................................... 55
Figure 36. Densmore Charrette - April 30 Meeting ............................................................................................. 58
Figure 37. Densmore Charette - May 1 Design Session ....................................................................................... 58
Figure 38. Regional Overview of Transportation Facilities .................................................................................. 59
Figure 39.Preliminary Densmore Site Plan with Transit and Commuter Access. ................................................ 60

Upper Valley Intermodal Facility – Draft Report
Page iii
Figure 40. Preliminary Hanover Street Bridge Rendering with Gate for Buses and Emergency Vehicles and
Pedestrian Covered Bridge .......................................................................................................................... 61
Figure 41. Preliminary Bus Terminal Rendering ................................................................................................... 61
Figure 42. Densmore Charrette - May 1 Meeting ................................................................................................ 62
Figure 43. Densmore Brickyard Conceptual Layout and Off-Site Improvements ................................................. 66
Figure 44. Intermodal Facility Conceptual Floor Plan........................................................................................... 70
Figure 45. Conceptual Cost Estimate for Site Aquisition, Construction, and Off-Site Mitigation ........................ 71
Figure 46. Permitting Matrix ................................................................................................................................ 72
APPENDICES
APPENDIX A: Summary of Public Outreach Efforts
APPENDIX B: Public Meeting Presentations
APPENDIX C: Project Advisory Committee Meeting Materials
APPENDIX D: Public Input
APPENDIX E: Project Correspondence
APPENDIX F: Project-Related News Articles
APPENDIX G: Phase I Screening Assessment Scoring Results
APPENDIX H: Phase II Screening Assessment Scoring Results
APPENDIX I: Densmore Brickyard Traffic Volume Worksheets
APPENDIX J: Park and Ride Demand Estimation Literature Review

15 June 2010
Page iv
This page intentionally left blank

Upper Valley Intermodal Facility – Draft Report
Page 1
1.0 INTRODUCTION The Upper Valley region of Vermont and New Hampshire has long been an economic and cultural engine for both states. Centered on the Connecticut River, railroad lines, and more recently Interstates 89 and 91, it is a bustling crossroads home to close to 40,000 people some of the largest employers in both states. The region is well served by transit, including Advance Transit which provides fixed route and demand response transit service in the four central core towns, a number of public transit providers feeding the center from adjoining regions, two private intercity transit providers, an airport, and an Amtrak station. Despite the number of providers and transportation services in the region, there has never been a central point for these various providers to interface and efficiently facilitate transfers.
At its core, an intermodal facility is a central point that facilitates connections between one or more transportation modes. Intermodal facilities can range from the most basic model – a parking lot with a bus stop – to a more complex facility – an airport with auto, bus, and train connections. The concept of an intermodal facility is not a new one, and several facilities are currently operating throughout New Hampshire and Vermont (e.g., Concord, Portsmouth, Dover, Brattleboro, and Rutland). The model for intermodal facilities in New Hampshire and Vermont is one that serves two main purposes – one, as a location to park your car and transfer to either a bus or train, and two, as a point to transfer between buses or between a bus and a train.
The NHDOT Statewide Intermodal Transportation Planning Study (2003) identified the Hanover and Lebanon area as “a primary location for the development of an intermodal facility that could serve both outbound intercity passengers and inbound commuters. An initial step would be a feasibility study involving all the potential stakeholders to identify goals [and] determine sites. Because of the variety of stakeholder interests this project is likely to be difficult, but worthwhile.”
The concept of an intermodal facility has been embraced in both regional and municipal plans throughout the region:

15 June 2010
Page 2
� The Upper Valley Lake Sunapee Regional Transportation Plan (2004) includes a goal to “increase opportunities for multi-modal travel and intermodal connections to effectively reduce reliance on single-occupant vehicles and to be proactive at preventing future problems and congestion.”
� The Two Rivers Ottaquechee Regional Plan (2007) includes a policy to “[e]ncourage and facilitate coordination between public transportation agencies and the Vermont Agency of Transportation in the construction of park and rides. Give higher priority to park and ride projects occurring along interstate interchanges and existing bus routes.”
� The City of Lebanon’s draft Master Plan (May 2010) states that the City shall “strive for a balanced, and integrated multi-modal (the combination of motor vehicle, air, rail, pedestrian, and bicycle transportation) transportation system that provides incentives for increased use of transit, bicycle and pedestrian modes.”
� The Town of Hartford’s Master Plan states that “[t]he use of park and rides is an important public-transit resource, and facilities should be planned and constructed to better support fixed-route services…pursue locating park and ride facilities along each interstate exit, [and] encourage the coordination for Hartford transit connections among the many different transportation service providers.”
Figure 1. Intermodal Facilities in Portsmouth (left) and Londonderry (right)
New Hampshire Congressman Paul Hodes secured a $500,000 grant in the Consolidated Appropriations Act of 2008 to identify a location for an “I-89 Park and Ride/Bus Terminal” within the Upper Valley. The New Hampshire Department of Transportation allocated a portion of these earmarked funds to conduct a site feasibility study for an Intermodal Facility that could potentially provide the following features:
� New passenger terminal for intercity bus provider(s)
� Connections to local fixed-route transit services
� Connections to demand response human service transportation providers
� Commuter park and ride capacity
� Infrastructure to facilitate bicycle and pedestrian connections
� Potential space for a regional dispatch center
� Potential connections to air or rail transportation
The NHDOT contracted with the Upper Valley Lake Sunapee Regional Planning Commission (UVLSRPC) in July 2009 to manage this planning effort. The UVLSRPC collaborated with the Upper Valley Transportation Management Association (UVTMA) to provide public outreach and facilitation services.
By the end of July, a Project Advisory Committee was established to oversee the development of the study. The Committee’s diverse membership included transit operators, representatives from major employers, municipal staff, and representatives from Federal and State agencies. The PAC membership roster can be seen in Figure 2 below.

Upper Valley Intermodal Facility – Draft Report
Page 3
Figure 2. Project Advisory Committee Members
Member Representing
Van Chesnut Advance Transit
George Sykes (Co-Chair) /
Nicole CormenCity of Lebanon
Mary Habig Connecticut River Transit
Harry Blunt Dartmouth Coach
Dan Dahmen Dartmouth Hitchcock Medical Center
Judi Molloy Federal Transit Administration
Senator Matthew Houde Governor’s Commission on Intermodal Transportation
Tom Stone Greyhound/Vermont Transit
Kit Morgan NH Department of Transportation
Roberta Berner NH Statewide Coordinating Council
David Palmer Stagecoach Transportation Services
Steve Schneider (Chair) Town of Enfield
Julia Griffin Town of Hanover
Charles Bohi /
Lynn BohiTown of Hartford
Peter Gregory Two Rivers Ottauquechee Regional Commission
Dan BrandUpper Valley Lake Sunapee Regional Planning
Commission
Paul Boucher Upper Valley Transportation Management Association
Krista Chadwick Vermont Agency of Transportation
Joanna Whitcomb Dartmouth College
Rick Dyment Lebanon Airport
The study was developed between August 2009 and June 2010 and involved a significant level of outreach to community representatives, the public, and other stakeholders (See Appendix A for full listing of public outreach efforts). Figure 3 below provides a general overview of project milestones.
Figure 3. Project Milestones
Milestone Date
Project Kick-off August 2009
Develop Purpose & Need September
Refine Site Screening Criteria September
1st Public Meeting (project intro) October
Site Identification November
2nd Public Meeting (site overview) November
Phase I Screening December
Selection of 5 Sites for Phase II December
Presentation to Hartford Selectboard January 2010
3rd Public Meeting (Phase I screening) February
Presentation to Lebanon City Council February
Presentation to Lebanon Planning Board February
Presentation to UVLSRPC Commission February
Meetings with Lebanon City Staff April
4th Public Meeting (Densmore Brickyard charette) May
5th Public Meeting (Draft Final Report) June

15 June 2010
Page 4
This report is organized as follows:
� The project Purpose and Need Statement (Section 2.0) provides the framework for understanding the role of the Intermodal Facility and to screen and evaluate the potential sites.
� Section 3.0 provides a comprehensive overview of transportation conditions in the Upper Valley. A thorough understanding of existing transportation services and trends in the region is critical for conducting an objective assessment of sites.
� The alternatives analysis is presented in Section 4.0 and Section 5.0. This assessment was broken into two phases. The first phase (Section 4.0) involved a screening of the 32 identified sites down to five sites, based on an objective analysis of the sites. The second phase (Section 5.0) involved a more detailed look at the five potential sites with the purpose of creating a final ranking. The top ranked site was the Densmore Brickyard.
� Section 6.0provides an overview of the Densmore Brickyard design charrette. The two-day charrette was conducted at the request of the Project Advisory Committee to engage the residents immediately adjacent the highest scoring site on issues and concerns with siting an Intermodal Facility at the Brickyard site.
� Section 7.0presents the site selection. The Project Advisory Committee recommended completing the study with a conceptual design of the Densmore Brickyard site, while also conveying to NHDOT the significant issues and concerns raised by City of Lebanon residents and municipal officials. That conceptual design is presented in Section 8.0.
� This report ends with a brief statement on potential next steps (Section 9.0).
Upper Valley Intermodal Facility – Draft Report
Page 5
2.0 PURPOSE AND NEED STATEMENT The purpose of the Upper Valley Intermodal Transportation Facility is to create an integrated, multimodal passenger transportation hub that increases mobility and accessibility for those who live, work, study, and recreate in the Upper Valley. The Intermodal Transportation Facility would also help meet the region’s growing demand for public transportation and include improvements to the environment, quality of life, and economic vitality of the Upper Valley.
The Upper Valley Intermodal Transportation Facility is needed to help accomplish three key goals:
1. Increase Access to and Diversity of Transportation
2. Maintain the Regional Environment, and
3. Sustain Economic Vitality.
The following sections describe the need for the facility in each of these three areas.
2.1 Increase Access to and Diversity of Transportation
The Upper Valley Intermodal Transportation Facility is needed to Increase Access to and Diversity of Transportation in the following ways:
� The Upper Valley Region is served by a number of intercity transportation providers, local public transit providers, human service transportation providers, and private for profit transportation providers. However, the region lacks an integrated transportation hub to improve the connectivity of these services. The proposed Upper Valley Intermodal Transportation Facility would create such a hub, enhancing connections across and between transportation modes.
15 June 2010
Page 6
� The Upper Valley Region has demonstrated a commitment to public transportation, which is demonstrated by consistent increases in ridership of the region’s local and intercity transit systems. However, the absence of a central coordinated hub complicates seamless transportation connections and perpetuates reliance on single-occupancy vehicles. The proposed Upper Valley Intermodal Transportation Facility would help eliminate barriers to transportation access and encourage the continued growth and development of the region`s intercity and local public transportation services.
� Upper Valley businesses have increasingly seen the need for efficient public transportation systems as housing imbalances have expanded commuting patterns throughout the region. Increased access to coordinated multiple transportation options may assist businesses in retaining and attracting valued employees.
� Current capacity is not adequate to meet the demands within the region. Specifically, there is a lack of park and ride facilities and current bus parking areas are overflowing.
2.2 Maintain the Regional Environment
The Upper Valley Intermodal Transportation Facility is needed to Maintain the Regional Environment in the following ways:
� Although the Upper Valley region has a successful public transportation system, emergent congestion and continued reliance on single-occupancy vehicles will place increasing demands on the natural, cultural, and social environments. The proposed Upper Valley Intermodal Transportation Facility would increase utilization of the region’s public transportation services by promoting energy conservation and reducing emissions.
� The traffic congestion, emissions, and noise associated with the high reliance on private vehicle use have a negative impact on the environment of the Upper Valley region. Further expanding road networks to mitigate increasing congestion can put pressure on undeveloped and unfragmented parcels of land, impacting the natural systems of the region. The proposed Upper Valley Intermodal Transportation Facility would help sustain the natural environments that attract citizens to this region by reducing reliance on private vehicles and promoting alternative modes of transportation.
� The Upper Valley is rich in social capital. Increased traffic congestion and travel times to extracurricular activities could threaten the social and cultural environment. The Intermodal Facility could help alleviate stresses associated with growth and development.
2.3 Sustain Economic Vitality
The Upper Valley Intermodal Transportation Facility in needed to Sustain Economic Vitality in the following ways:
� Enhanced intercity public transportation services can play a key role in attracting new businesses to the region and improving the competitiveness of existing businesses and institutions by providing efficient access to intercity travel. For example, improved bus service to New York and Boston can increase the attractiveness of the area to students and faculty members of Dartmouth College, medical personnel to area hospitals, and business executives looking to relocate to the region.
� There are few locations in the Upper Valley where business travelers and tourists can obtain information about local businesses and tourism destinations. The proposed Upper Valley Intermodal Transportation Facility would provide an easily accessible, centralized location to promote the region and provide a clearinghouse of transportation options as well as education on the region’s commitment to alternative modes of transportation.

Upper Valley Intermodal Facility – Draft Report
Page 7
2.4 Other Goals for the Project
� Support the goals of SAFETEA-LU, the New Hampshire Public Transportation Programs State Management Plan, the Vermont Public Transportation Policy Plan, the Upper Valley Lake Sunapee Regional Plan, the Two Rivers-Ottauquechee Regional Plan, and the Master Plans of affected communities in the Upper Valley.
� Create an attractive gateway to the Upper Valley that attracts visitors and serves the needs of those who live, work, study, and recreate in the region.
� Develop a facility that will accommodate taxi services and demand-response human service transportation providers for elderly and disabled residents.
� Serve as facility that can potentially accommodate a regional transit dispatch center that was recommended in the NH Plan for Coordination of Community Transportation Services, the Grafton County Public Transit-Human Service Transportation Coordination Plan, and the Sullivan County Public Transit-Human Service Transportation Coordination Plan.
� Provide a centralized location that allows for the connection of the intercity and local transit network to rail and/or air transportation.
� Provide a centralized location for residents of the Upper Valley to leave their automobiles and take another means of transportation to employment sites, including Dartmouth College and the Dartmouth Hitchcock Medical Center.
� Provide a centralized location for residents of the Upper Valley to leave their automobiles and take another means of transportation to destinations in Southern New Hampshire, Boston, New York City, Vermont, and the Greater Eastern Seaboard.
� Provide accommodations for bike access.

15 June 2010
Page 8

Upper Valley Intermodal Facility – Draft Report
Page 9
3.0 TRANSPORTATION CONDITIONS IN THE
UPPER VALLEY While transportation in the Upper Valley is, like most places today, dominated by the personal vehicle, it is also served by a large number of alternative modes. Advance Transit, a progressive and thriving local transit system, offers free local bus throughout the Upper Valley. Regional commuter transit is provided by Stagecoach Transit and Connecticut River Transit, which connect satellite towns along all major corridors (I-89 and I-91) with the Upper Valley’s urban center. Additionally, inter-city travel is available via bus (Dartmouth Coach and Greyhound), rail (Amtrak), and air (Lebanon Airport).
The latest public transportation ridership information for the region is presented below:
� Dartmouth Coach: 120,000 passengers (2009)
� Greyhound (White River Junction Terminal): 18,000 (2007)
� Amtrak (White River Junction Station): 15,686 passengers (2009)
� Lebanon Airport: 12,000 passengers (2009)
� Advance Transit: 456,000 passengers (2008)
� Connecticut River Transit (Upper Valley Service): 36,000 passengers (2008)
� Stagecoach (Total Service): 108,000 passengers (2008)
Bicycle and pedestrian travel is also a viable option for much of the Upper Valley. Sidewalks are present in many downtowns and an increasing number of bike lanes, routes, and paths offer an appealing alternative to the personal vehicle for many local commuters.

15 June 2010
Page 10
3.1 Intercity Transportation Services
3.1.1 Greyhound Lines
Greyhound offers four daily roundtrips between Montreal and Boston, with intermediate stops in Burlington and White River Junction. Greyhound also offers two daily round trips between White River Junction and New York City, with intermediate stops in Hartford (CT) and Springfield (MA).
� Southbound Service: Southbound buses depart White River Junction for Boston at 3:45 AM, 1:30 PM, 4:00 PM, and 8:30 PM. The 3:45 AM and 1:30 PM southbound departures operate via Hanover. The 3:45 AM, 1:30 PM, and 4:00 PM southbound White River Junction departures offer stops at Manchester Airport. A southbound bus that departs Burlington at 11:15 AM arrives at White River Junction at 12:55 PM and connects with a 1:20 PM southbound departure from White River Junction to New York City. This bus arrives in New York at 9:20 PM. An earlier New York City bus departs White River Junction at 8:25 AM.
� Northbound Service: Northbound buses from Boston arrive at White River Junction at 10:05 AM, 12:40 PM, 5:05 PM, and 2:25 AM. Northbound buses stop at Manchester Airport at 8:50 AM, 3:15 PM, and 1:00 AM. A northbound bus that departs New York City at 6:00 AM arrives in White River Junction at 12:50 PM and connects with a northbound bus to Burlington and Montreal that departs White River Junction at 1:10 PM. A later northbound bus departs New York City at 1:30 PM and arrives at White River Junction at 8:35 PM.
In past years, Greyhound also operated buses to White River Junction from Rutland and Newport, but these last two services have been discontinued.
Greyhound has a lease and ticket agent arrangement with a restaurant/convenience store in White River Junction on Sykes Mountain Avenue. This facility is located at the interchange of Interstates 91 and 89. It allows Greyhound to provide quick intermediate stops for buses traveling between Montreal and Boston, while also providing easy access to I-91 for service to and from New York City. The current arrangement provides approximately 55 parking spaces adjacent to the store which is shared with the Crossroads Diner, China Moon Chinese restaurant, and Mobil gas station.
3.1.2 Dartmouth Coach
Dartmouth Coach offers seven daily round trips between the Upper Valley and Boston and one daily round trip between the Upper Valley and New York City. All Dartmouth Coach trips stop near the front of the Hanover Inn on Wheelock Street in Hanover, as well as at the Dartmouth Coach terminal on Etna Road in Lebanon.

Upper Valley Intermodal Facility – Draft Report
Page 11
Dartmouth Coach officials report that annual boardings are fairly evenly divided between the Hanover stop and the Etna Road terminal. The Hanover stop experiences high demand from college students at the start and end of school breaks. This means that on a typical day, there may be somewhat heavier demand at the Etna Road facility.
It is important to keep in mind the size of the Hanover market and its sensitivity to travel delays in evaluating potential Intermodal Center sites. Two factors need to be remembered:
1. All Dartmouth Coach buses can be expected to continue to serve downtown Hanover in addition to the new Intermodal Center. Dartmouth Coach will not require Hanover travelers to transfer at the new terminal.
2. Travel times from Hanover are no less important than travel times from the intermodal facility. Hanover travelers are likely to be very sensitive to backtracking and to real or perceived delays. Upon departing Hanover, these passengers will want to proceed directly to their destination, whether this destination is Boston or New York City.
Demand for parking at Dartmouth Coach’s Etna Road facility often exceeds the available supply of 140 parking spaces (staff estimates average peak demand for 250-300 parking spaces). To accommodate demand during busy periods, the bus company offers valet parking and stores cars in a 100-space overflow parking lot on a nearby site. Parking lot attendants ask travelers when they expect to return so that their cars can be moved to the main terminal site in advance of their arrival.
Parking constraints and the need for parking lot attendants result in increased operating costs for Dartmouth Coach and inconvenience for travelers. Inadequate parking also limits the bus company’s ability to offer new and expanded service.
Dartmouth Coach receives daily telephone requests for bus service to Manchester Airport. The intercity carrier has considered the possible addition of Manchester service but has not added this destination in part because of insufficient parking capacity to accommodate increased demand.
Dartmouth Coach officials have suggested that the region could benefit from a transportation facility that accommodates local Advance Transit buses, in addition to intercity coaches. Company officials indicated that they are willing to share a publicly funded facility with local transit providers and with other intercity bus operators, provided the intermodal terminal meets Dartmouth Coach’s standards for cleanliness, appearance, passenger amenities, and hours of operation.
� Lebanon – Boston: Dartmouth Coach offers seven daily round trips between Lebanon and Boston South Station. All Boston trips begin with pick-ups at the Hanover Inn and continue beyond South Station to Logan International Airport. Southbound buses depart Lebanon for Boston every two hours beginning at 5:00 AM and continuing through 5:00 PM Northbound buses depart South Station for Lebanon every two hours beginning at 9:30 AM and continuing though 9:30 PM Pick-ups at Logan Airport are scheduled 35 minutes before scheduled northbound departures from South Station. The first northbound bus departs South Station at 8:55 AM. The last northbound bus departs South Station at 8:55 PM.
� Hanover - New York City: Dartmouth Coach offers limited express service between Lebanon and New York City with intermediate stops in Hanover and Stamford, CT. On most days, a southbound bus departs Lebanon for New York at 6:15 AM. There is no 6:15 AM southbound bus on Sundays. Dartmouth Coach offers an additional Friday bus that departs Lebanon at 1:45 PM. On Sundays, the only southbound bus departs Lebanon at 4:15 PM. On most days, a northbound bus departs New York City at 1:30 PM. There is no 1:30 PM northbound bus on Saturdays. On Saturdays, a northbound bus departs New York City at 8:30 AM. An additional Monday bus likewise departs New York at 8:30 AM This means that on most days, Dartmouth Coach offers a late morning arrival in New York City and an early afternoon departure from New York City. The extra Friday southbound trip means that southbound travelers heading to New York for the weekend can depart Lebanon at 1:45 PM and arrive in New York at 7:00 PM. These weekend travelers can depart New York northbound at 1:30 PM on Sunday or at 8:30 AM on Monday.

15 June 2010
Page 12
People visiting Hanover for the weekend can depart New York at 1:30 PM and arrive at 6:20 PM. They can leave Hanover on Sunday at 4:30 PM and arrive in New York at 9:30 PM.
3.1.3 Amtrak
Amtrak and the State of Vermont offer a single round trip between White River Junction and New York’s Penn Station. The northern terminus of this Amtrak route, the Vermonter, is St. Albans, VT. The southern end of the route is Washington, D.C.
Funding was recently authorized for Vermonter/NECR rail improvements to enhance the conditions of the track, roadbed and bridges along the current route of the Amtrak Vermonter Service in Vermont and New Hampshire resulting in an increased track speed for a distance of 45 miles to 79 MPH and the remaining 145 miles from 55 MPH to 59 MPH. These improvements will reduce the operating schedule by up to 27 minutes and guarantees a more consistent, year round on-track performance by this train.
The southbound train departs St. Albans at 8:30 AM, Burlington-Essex Junction at 9:00 AM, and White River Junction at 11:05 AM. This train arrives at New York’s Penn Station at 6:41 PM on weekdays and 6:25 PM on Saturdays and Sundays.
The northbound train departs New York Penn Station at 11:30 AM on weekdays and 11:33 on weekends. It departs White River Junction for Burlington-Essex Junction and St. Albans at 6:45 PM. It arrives in Essex Junction at 8:44 PM and St. Albans at 9:25 PM.
3.1.4 Lebanon Municipal Airport
The Lebanon Municipal Airport provides daily commercial service via Cape Air to Boston’s Logan Airport (four round trips per day) and White Plains, New York (two round trips per day). The service to White Plains includes a complimentary shuttle service to Mid-town Manhattan. Much of the activity at the airport is generated by local and corporate general aviation activities in the area. In 2009, Cape Air carried nearly 12,000 passengers to and from the Lebanon Airport.
3.1.5 Intercity Bus Travel Times
Travel times between the Upper Valley and Boston depend on the starting point and on intermediate stops. Greyhound requires an average of 2 hours and 40 minutes for travel between White River Junction and Boston’s South Station, while Dartmouth Coach requires 2 hours and 15 minutes for travel between Lebanon and Boston’s South Station.
For travel between Hanover and South Station, average travel times are much closer. Greyhound requires an average of 2 hours 38 minutes, while Dartmouth Coach requires 2 hours 30 minutes northbound and 2 hours 35 minutes southbound. Greyhound serves Hanover after departing White River Junction, while Dartmouth Coach stops in Hanover before departing Lebanon. In other words, Greyhound passengers who board in White River Junction are diverted first to Hanover. Dartmouth Coach passengers who board in Hanover travel first to an Etna Road bus terminal before proceeding to the southbound interstate.
Travel times between the Upper Valley and New York City vary widely by carrier. Dartmouth Coach offers express service that takes 5 hour and 15 minutes southbound and 5 hours northbound. Greyhound service, which makes additional stops along the route, averages 7 hours and 40 minutes southbound and 7 hours northbound. Amtrak, which also makes additional stops
Figure 4. Average Intercity Travel Times
Northbound Southbound
Greyhound Lines 2 h 41 m 2 h 40 m
Dartmouth Coach 2 h 15 m 2 h 15 m
Boston - Hanover
Northbound Southbound
Greyhound Lines 2 h 38 m 2 h 38 m
Dartmouth Coach 2 h 30 m 2 h 35 m
Northbound Southbound
Greyhound Lines 6 h 58 m 7 h 40 m
Dartmouth Coach 5 h 4 m 5 h 15 m
Amtrak 7 h 13 m 7 h 31 m
Boston - WRJ / Lebanon
WRJ / Lebanon - New York City

Upper Valley Intermodal Facility – Draft Report
Page 13
between White River Junction and New York’s Penn Station, takes 7 hours and 30 minutes southbound and 7 hours and 15 minutes northbound. Average intercity travel times are summarized in Figure 4.
3.2 Regional Transit Service
Stagecoach Transportation Services and Connecticut River Transit (CRT) offer five-day-a-week commuter bus service to major employment sites in the Upper Valley. The three most important destination work sites are Dartmouth College, Dartmouth-Hitchcock Medical Center, and the VA (Veterans Affairs) Hospital. Some commuter bus service is also provided to LSI at Centerra and to Dimatix on the Etna Road.
3.2.1 Stagecoach Transportation Services
Stagecoach (Figure 5) operates three buses each day via Interstate 91 from Newbury, Bradford, Fairlee, and Thetford. Buses arrive in Hanover at 7:00 AM, 7:15 AM, and 7:35 AM. One of these buses continues to the VA Hospital in White River Junction while the other two continue to DHMC. One afternoon bus departs the VA Hospital at 4:30 PM. Separate buses depart DHMC at 4:40 PM and 5:10 PM.
Stagecoach also operates three buses each day via Interstate 89 from Exit 4, Randolph, Bethel Village, and Exit 2. Two of the three buses include a stop at the VA Hospital. All three buses operate via I-89 and Route 120 to DHMC and Hanover. Morning buses arrive at DHMC at 7:00 AM, 7:20 AM, and 7:45 AM. Afternoon buses depart DHMC at 4:15 PM, 4:45 PM, and 5:15 PM.
Figure 5. Stagecoach Route Map (as of 2/2010)

15 June 2010
Page 14
3.2.2 Connecticut River Transit(CRT)
Connecticut River Transit (Figure 6) operates four buses each day from park and ride lots at Exits 6, 7, and 8 along Interstate 91. Two buses travel to Hanover via Norwich and the Ledyard Bridge, arriving in Hanover at 6:19 AM and 7:20 AM. Both of these buses continue to Centerra and to Dimatix on Etna Road. Two separate buses operate via I-89 and Route 120 to DHMC, Coburn Hill, and Centerra. These buses arrive at DHMC at 6:45 AM and 7:45 AM.
CRT operates a separate bus between Exit 4 and the VA Hospital, which avoids delaying commuters on buses heading nonstop to New Hampshire. VA employees from points south transfer to the separate VA bus at Exit 4. Before the separate bus was added, VA employees rode first to Hanover and then backtracked to White River Junction. This situation at the VA Hospital is relevant for the Intermodal Center site evaluation because it shows that transit providers will not be willing to introduce off-route diversions that delay express commuters.
Southbound CRT buses depart DHMC at 4:10 PM and 5:10 PM CRT recently added service for 12-hour shift workers. For day-shift nurses, a bus arrives at DHMC northbound at 6:45 AM and departs southbound at 7:45 PM. For night-shift nurses, a bus arrives at DHMC northbound at 6:45 PM and departs southbound at 7:45 AM.
Figure 6. Connecticut River Transit Route Map (as of 2/2010)

Upper Valley Intermodal Facility – Draft Report
Page 15
3.2.3 Regional Transit Demand
As of January 2010, CRT was transporting about 18 people a day to the VA Hospital, about 35 people a day to Dartmouth College, between 60-70 people a day to DHMC, and about 6 people a day to Centerra and Etna Road. Stagecoach was transporting about 45-50 people a day from towns along Interstate 91 and about 45-50 people a day from towns along Interstate 89. Roughly half of the Stagecoach riders work at DHMC, about 30% work at Dartmouth College, and about 20% work at the VA Hospital.
These Vermont transit systems do not charge fares. CRT accepts suggested donations of $3.00 per ride, or $2.50 a ride through the purchase of four weeks’ worth of “tokens.” The written policy is that “no one will be refused a ride on any bus due to inability to make a donation.”
Not all regional bus riders are employed at the major job sites shown in published timetables. For example, buses that stop at the VA Hospital also transport some workers to the Gilman Center and to downtown White River Junction.
Regional buses do not currently deliver workers to job sites in West Lebanon, the Route 12A Plazas, or downtown Lebanon. There is some possibility that a new Intermodal Center could facilitate transfers to local buses to facilitate work trips to additional employers. However, both transit providers indicated that they would not divert commuter buses to a new terminal if this adds a delay for people heading to DHMC or Dartmouth College. They suggested that buses would serve four of the five candidate sites only after dropping off workers at these two important job sites.
The possible exception is the Densmore Brickyard site, provided buses can cross Interstate 89 on a new Hanover Street overpass. This might allow buses to serve the new facility before continuing north to DHMC on Mount Support Road. Time added to serve the Intermodal Center would likely be offset by time saved avoiding traffic signals on Route 120.
Regional transit officials recognize that some people from their communities will be interested in using an Upper Valley Intermodal Center to take advantage of intercity bus service to Boston, New York, and Burlington. They indicated that commuter buses traveling to and from the Upper Valley can serve the new transportation terminal. They suggested that some intercity travelers would take advantage of their regional connecting service, even if they were required to travel first to Upper Valley job sites.
Stagecoach and CRT representatives pointed out that the Intermodal Center could be especially helpful for people traveling from New York or Boston to outlying Vermont towns. Greyhound and Dartmouth Coach ticket agents currently have little awareness of regional commuter routes. A shared terminal would remove confusion and uncertainty about what service is available, when it operates, and where travelers need to go to board a regional bus.
Stagecoach pointed out that the new facility could meet their need for a place to park buses during the middle of the day. Stagecoach had been leaving buses at Dartmouth College’s Dewey parking lot but was forced to look elsewhere for midday parking due to problems with vandalism.
The regional bus operators also observed that steps may need to be taken to avoid congestion caused by too many buses converging on the East Entrance of DHMC, particularly between 5:00 and 5:15 PM.
Both regional Vermont providers recognize there is some demand for shopping trips to the Upper Valley. Stagecoach currently provides a limited number of Saturday shopping trips to the Lebanon area. While Vermont transit systems have experimented in the past with more regular and frequent service, no one is attempting to provide regularly scheduled midday service at the present time.
Residents of outlying Vermont towns can make day trips to the Upper Valley on commuter buses. More obvious and convenient connections with Advance Transit at an Upper Valley Intermodal Center would likely increase the appeal of using commuter schedules for one-day shopping trips.

15 June 2010
Page 16
3.3 Local Transit Service – Advance Transit
Advance Transit (Figure 8) provides regularly scheduled fixed-route transit service for six Upper Valley municipalities in New Hampshire and Vermont. Buses operate five days a week on five routes, serving Lebanon, Hanover, Norwich, Hartford, Enfield, and Canaan. Advance Transit also operates campus and park and ride shuttle routes in Hanover and Lebanon.
Passengers board all Advance Transit routes and services without paying a fare. In addition to municipal funding, Advance Transit receives financial support from the Federal Transit Administration, NHDOT, VTrans, Dartmouth College, Dartmouth-Hitchcock Medical Center, and private donors.
In 2008, Advance Transit provided a total of 456,233 one-way trips. In the last 15 years, Advance Transit ridership has experienced a nearly four-fold increase. Use of regular route service climbed from about 10,000 riders a month in 1994 to an average of 38,000 riders a month in 2008.
The Blue route links Hanover and Lebanon throughout the day and offers peak hour links to Enfield and Canaan. The Blue route is the busiest route in the Advance Transit system, with nearly 20,000 boardings per month. The Red route is the second busiest Advance Transit route and links downtown Lebanon, West Lebanon, and the Route 12A plazas. The Red route carried about 10,000 riders a month in 2008. Usage increased with the introduction of more frequent Red route service in 2009. Performance measures for individual Advance Transit routes are presented in Figure 7. These April 2008 figures are taken from Advance Transit’s 2008 Transit Development Plan.
Figure 7: Advance Transit Performance Measures for April 2008
Route
Monthly
Riders Daily Riders
Riders per
Hour
Riders per
Round Trip
BLUE 19,530 888 21 26
GREEN 4,650 211 18 19
RED 9,876 449 37 37
BROWN 4,065 185 17 9
ORANGE 5,448 248 21 21
DARTMOUTH 7,350 334 11 5
DHMC 19,914 905 27 7
TOTAL 70,833 3,220 21 9
FIXED-ROUTE 43,569 1,980 23 22

Upper Valley Intermodal Facility – Draft Report
Page 17
Figure 8. Advance Transit Route Map (as of 2/2010)
In a 2008 onboard passenger survey, 69% of all Advance Transit riders gave “work” as their primary trip purpose. In regards to specific routes, 82% of Blue route trips and 54% of Red route trips were work related.
Twenty-six percent of regular route riders said their trip involved a transfer between bus routes. Eighty-two percent said they use the bus service three or more days a week. Twenty-eight percent of Advance Transit passengers were employed by Dartmouth College. Thirteen percent were Dartmouth students. Dartmouth employees and students together accounted for 41% of Advance Transit ridership. Twelve percent of Advance Transit regular-route riders said they are employed by DHMC.
Fifty-three percent of Advance Transit survey respondents indicated that they had a car available for their trip. The percentage of Advance Transit riders who chose to ride instead of drive increased from 25% in 1999 and 43% in 2004 to 53% in 2008. Sixty percent of Advance Transit riders indicated that they have a valid driver’s license.
These survey findings are relevant for the selection of an Intermodal Center site for at least two reasons.
1. The findings suggest that the facility may appeal to regional commuters because many workers in the region have already accepted Advance Transit as a preferred mode of travel. This becomes

15 June 2010
Page 18
even more evident if parking lot shuttle riders, who were not surveyed, are also taken into consideration.
2. The fact that more than half of Advance Transit’s riders could choose to drive suggests that extra care must be taken to avoid service changes that introduce delays or otherwise degrade existing service quality. Commuters want service that is fast and direct. This is true of current Advance Transit riders, and it will be true of potential new commuting customers as well.
There should also be some consideration of funding requirements and opportunities. A new Upper Valley Intermodal Center may require that additional buses and new routes be added to the Advance Transit system. Different sites will require different levels of increased financial investment.
Advance Transit receives FTA 5311 rural operating assistance from NHDOT and VTrans. The Upper Valley has been very successful in obtaining these allocations from both states. It is important to remember, however, that there is a twofold limit on the future use of 5311 subsidies. First, each state receives a limited apportionment from the nationwide rural transit program. Second, these funds must be shared with the other public transit programs in each state. Advance Transit already receives a large percentage of the 5311 funding allocated to New Hampshire. It may be difficult for the Upper Valley to obtain more, unless the overall national funding levels are increased. In addition, any new federal grants will need to be matched by local contributions.
Funding issues suggest that expansion plans should be modest and that alternative service plans should perhaps be evaluated in terms of their relative appeal for Advance Transit’s major funding partners. It will be important to consider how various transit scenarios associated with candidate intermodal sites address anticipated future parking needs for DHMC and Dartmouth College.
3.4 Park and Ride Network
Park and ride lots play an integral role in facilitating carpool and transit commuting in the Upper Valley. In recent years, many new lots have been established and more are in the works. The following twelve official park and ride lots are located in and around the Upper Valley:
� I-89 Exit 4 in Randolph, VT (89 spaces)
� I-89 Exit 2 in Sharon, VT (24 spaces)
� VT 14 at VT 110 in Royalton, VT (15 spaces)
� I-91 Exit 9 in Hartland, VT (40 spaces)
� I-91 Exit 8 in Weathersfield, VT (65 spaces)
� I-91 Exit 16 in Bradford, VT (23 spaces)
� I-91 Exit 14 in Thetford, VT (25 spaces)
� US 5 in Wilder, VT (48 spaces)
� Turnpike Road in Norwich, VT (+/- 25 spaces)
� NH 10 in Lyme, NH (+/- 10 spaces)
� Exit 13 in Grantham, NH (+/- 50 spaces)
� Exit 12 in New London, NH (+/- 130 spaces)

Upper Valley Intermodal Facility – Draft Report
Page 19
3.5 Commuting Trends
Commuting trends in the Upper Valley are largely driven by the two largest employers, Dartmouth College and Dartmouth Hitchcock Medical Center (DHMC), and other large businesses in Lebanon, NH. The vast majority of commuting trips are made in personal vehicles, many with only a single occupant. Large morning rush hour flows are directed towards Hanover and Lebanon from the surrounding towns while evening rush hour flows return from these hubs. The two major routes accessing Dartmouth College and DHMC are not surprisingly two of the area’s most congested during peak commuting hours. The highest traffic volumes accessing Hanover and Dartmouth College cross Ledyard Bridge along Wheelock Street. The highest traffic volumes accessing DHMC come from I-89 Exit 18 along NH 120. Both of these routes are highly congested during peak commuting times.
Figure 9 presents a map of the Upper Valley indicating the locations of major employers and the annual average daily traffic (AADT) volumes on major local and regional roads. Figure 10 and Figure 11 illustrate the concentrations of employees residing in the various Upper Valley towns who work at Dartmouth College and DHMC, respectively.1
Figure 9: Upper Valley Average Annual Daily Traffic (AADT) Volumes and Major Employers
1 Dartmouth College commuting trends are based on survey data obtained from a 2009 RSG survey conducted for Dartmouth College.
DHMC commuting trends are based on survey data obtained internally at DHMC.

15 June 2010
Page 20
Figure 10. Dartmouth College Employee Residence Distribution (by zip code)

Upper Valley Intermodal Facility – Draft Report
Page 21
Figure 11. Dartmouth Hitchcock Medical Center (DHMC) Employee Residence Distribution (by zip code)

15 June 2010
Page 22
In 2009, Resource Systems Group conducted an employee survey for Dartmouth College to examine commuter transportation patterns and campus parking utilization. Data from this survey is shown in Figure 12, which shows the percentage of employees commuting by various routes into downtown Hanover. As can be seen in the figure, the two most used routes for accessing campus are along Wheelock Street (over Ledyard Bridge) and along NH 120.
Figure 12. Dartmouth College Employee Commuting Routes
12%
11%
24%
10%
38%
19%
11%
17%
12%
41%
Route to Campus
Route to Ledyard Bridge
12%
11%
24%
10%
38%
19%
11%
17%
12%
41%
12%
11%
24%
10%
38%
19%
11%
17%
12%
41%
Route to Campus
Route to Ledyard Bridge
Data from the 2000 US Census further supports the Upper Valley commuting trends seen at Dartmouth College and DHMC. Census Journey to Work data for the towns of Lebanon and Hanover shows that 50% of people working in these two towns reside in one of the four central and urban towns in the Upper Valley (i.e., Lebanon, Hanover, Hartford, and Norwich), while 50% live in the surrounding towns. This mirrors the pattern seen in Figure 10 and Figure 11 for commuting trends at Dartmouth College and DHMC.
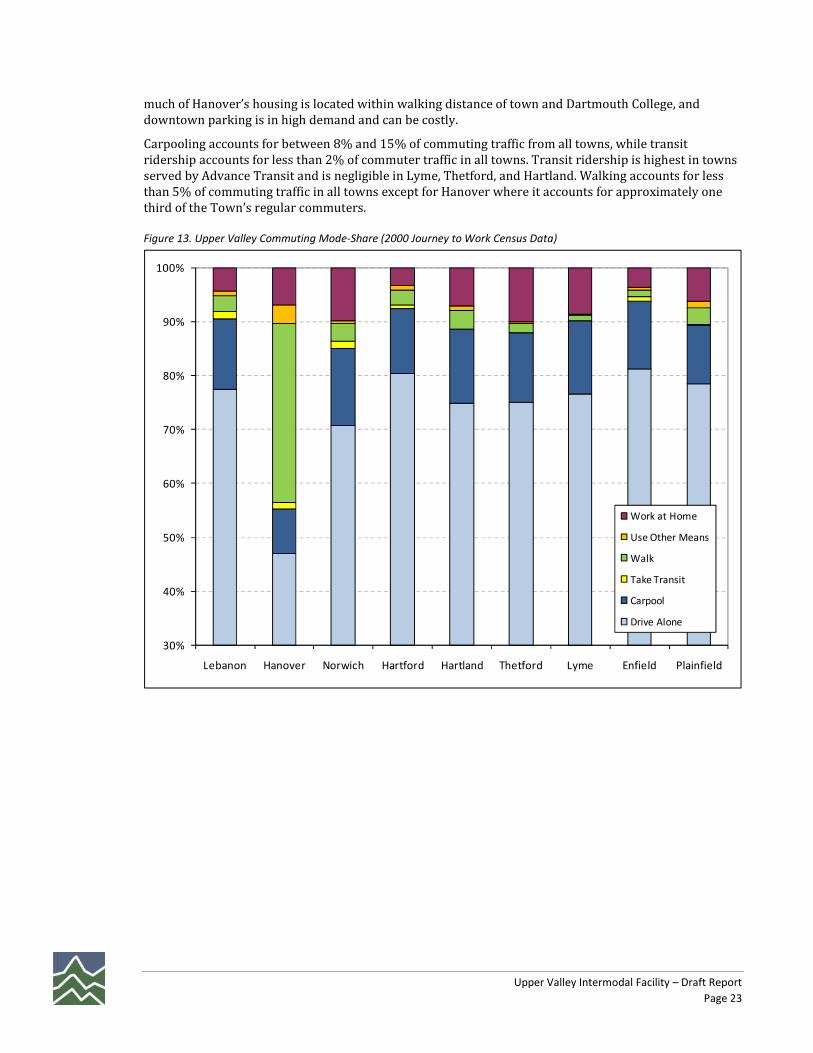
Additionally, Census data provides a summary of reported travel modes typically used by people commuting in the Upper Valley. Figure 13 shows the percentage of commuters by town who regularly drive alone, carpool, take transit, or walk to work. Data for the two largest employer towns (Lebanon and Hanover) are presented along with data for towns immediately bordering these two towns (i.e., Norwich, Hartford, Hartland, Thetford, Lyme, Enfield, and Plainfield).
As can be seen in the figure below, driving alone is the most common commuting mode. For all towns except Hanover, approximately 75% of all commuters regularly drive alone. In Hanover less than half of resident commuters regularly drive alone. It is not surprising that Hanover is the one exception here as
Upper Valley Intermodal Facility – Draft Report
Page 23
much of Hanover’s housing is located within walking distance of town and Dartmouth College, and downtown parking is in high demand and can be costly.
Carpooling accounts for between 8% and 15% of commuting traffic from all towns, while transit ridership accounts for less than 2% of commuter traffic in all towns. Transit ridership is highest in towns served by Advance Transit and is negligible in Lyme, Thetford, and Hartland. Walking accounts for less than 5% of commuting traffic in all towns except for Hanover where it accounts for approximately one third of the Town’s regular commuters.
Figure 13. Upper Valley Commuting Mode-Share (2000 Journey to Work Census Data)
30%
40%
50%
60%
70%
80%
90%
100%
Lebanon Hanover Norwich Hartford Hartland Thetford Lyme Enfield Plainfield
Work at Home
Use Other Means
Walk
Take Transit
Carpool
Drive Alone

15 June 2010
Page 24

Upper Valley Intermodal Facility – Draft Report
Page 25
4.0 ALTERNATIVES ANALYSIS – PHASE I The Alternatives Analysis proceeded through three major steps: 1) site identification, 2) Phase I screening, and 2) Phase II screening. The goal of this process was to identify all potential Intermodal Facility sites and then proceed through a comprehensive, objective, two-step screening process to identify the best suited site.
The site screening process began with an identification of potential sites throughout the greater Upper Valley area. Sites were identified through public input received at public meetings held in the Fall of 2009 as well as from land owners, real estate agents, owners representatives, and other interested parties. A total of 29 sites were identified through this process in six towns and ranged in size from 1.5 acres to 250 acres. These 29 sites went through a preliminary screening process based on owner interest, parcel size, and proximity to I-89 or I-91. This initial screening resulted in the removal of nine sites, which were determined to be not feasible.
The remaining feasible sites then moved into a more formal Phase I screening assessment for evaluation and scoring. The locations of the sites evaluated in Phase I are shown in Figure 14 below.

15 June 2010
Page 26
Figure 14. Phase I Sites
4.1 Phase I Screening Analysis Methodology
The Phase I sites were evaluated based on seventeen criteria which were identified by the Project Advisory Committee (see Figure 15). These criteria cover the four following categories: 1) Access, 2) Community/Environmental Impacts, 3) Planning and Land Use Considerations, and 4) Site Characteristics/Implementation. A 5-member PAC subcommittee was formed to identify weightings for the criteria and discuss the scoring for each of the sites. The subcommittee established the criteria weights prior to examining any of the site-specific information.

Upper Valley Intermodal Facility – Draft Report
Page 27
Figure 15. Phase I Screening Criteria

15 June 2010
Page 28
Each criterion was scored from -2 to +2 points and weighted from 1 to 5 based on input from the PAC subcommittee. A benchmark and related scoring metric for each criterion was also established to assist in objectively scoring each site.
4.2 Phase I Screening Criteria
This section provides additional detail on the individual scoring criteria, the benchmarks used to clarify each criterion, and the objective metrics used to score each site.
4.2.1 Access
The Phase I screening criteria included five criteria related to site access, as summarized in Figure 16.
� Access from I-89: This criterion measured how far the potential sites were from the interstate. Locations less than a half mile from the interstate were given +2 points, and locations greater than 1.5 miles from the interstate were given -2 points. Additional consideration of congestion impacts were applied to locations proximate to the interstate that did not have efficient access due to existing delays and queues.
� Multimodal Access: Four criteria measured the ability of each site to provide efficient multimodal (bus, bicycle, pedestrian, air, and rail) access. Sites that had multiple bus providers, bike lanes, sidewalks, or were located near an airport/train station were given +2 points. Negative points were assigned when there were no bike lanes or sidewalks or if existing congestion prevented a site from providing efficient access.
Figure 16. Phase I Screening Criteria: Access
Criteria Weight Benchmark Scoring Metric
1. Would the site be efficiently
accessed from Interstate 89 and
Interstate 91?
5 Location less than one
mile or less than 5
minutes travel time from
I-89 and/or I-91
Distance from I-89/I-91:
<0.5 mile= +2 points
0.5 - 1 mile = +1 point
1 - 1.5 miles = -1 point
>1.5 miles = -2 points
Lacks efficient access due to congestion
and # access points = -2 points
2. Would the site be efficiently
accessed by buses, and cars? 5 Adequacy and ease of
access of existing road
infrastructure linking the
site to the interstate and
other key locations in
proximity to the site
# of transit providers within 1/4 mile of
site
0 providers = -1 point
1 provider = 0.5 points
2+ providers = +1 point
# of arterial or higher roads within 1/2
mile radius
0 roads = -1 point
1 road = 0.5 points
2+ roads = 1 point
Lacks efficient access due to congestion
and # access points = -2 points
Maximum -2
3. Would the site be efficiently
accessed by bicycles and
pedestrians?
4
Adequacy and ease of
access of existing
sidewalk infrastructure,
adequacy and ease of
access of designated
bicycle routes serving
the site
Designated bicycle lanes/routes within
1/4 mile of site
0 bike lanes/routes = -1 point
1 bike lanes/routes = 0.5 points
2+ bike lanes/routes = +1 point
Sidewalks within 1/4 mile of site
0 sidewalks = -1 point
1 sidewalks = 0.5 points
2+ sidewalks = +1 point

Upper Valley Intermodal Facility – Draft Report
Page 29
4. Could the site allow for efficient
connections to air
transportation?
2 Adequacy of
infrastructure linking the
site to air transportation
hubs
Located adjacent to airport
Immediately adjacent to airport = +2
points
All other sites = 0 points (assume shuttle
connection)
5. Could the site allow for efficient
connections to rail
transportation?
4 Adequacy of
infrastructure linking the
site to rail transportation
hubs
Located within walking distance of train
station
<1/4 mile from train station = +2 points
< 1 mile from train station = +1 point
All other sites = 0 points (assume shuttle
connection)

15 June 2010
Page 30
4.2.2 Community/Environmental Impacts
The Phase I screening criteria included five criteria related to community and environmental impacts, as summarized in Figure 17.
� Cultural/Historic Impacts: Sites located within ¼ mile from historical or cultural resources (such as the river, historic districts, and parks) received -1 (one resource impacted) or -2 points (two or more resources impacted). Sites that were not located within a ¼ mile of historical or cultural resources received 0 points.
� Future Tax Revenues: Criterion #9 measured the ability of each site to contribute to future tax revenues in the host community. Sites located on parcels that are not highly valued and could accommodate future mixed-use development received +2 points, while sites located on highly valued parcels with no opportunity for future development associated with the intermodal center received -2 points.
� Environmental Impacts: The impacts of the potential sites on the natural environment were also considered in the screening criteria. Wetlands, floodplains, slopes greater than 25% and animal habitats were mapped to determine whether the individual site parcels were impacted. Sites located on parcels that did not overlap with any of the environmental constraints received +1 point. An additional point was given for sites that are designated brownfields. Parcels that overlapped with all four environmental constraints received -2 points.
� Impacts to Neighborhoods: Two criteria measured the impacts of the proposed sites on neighborhoods. Criterion #6 measured whether the local street network could handle the additional traffic generated by the intermodal center. Using traffic engineering judgment, the various sites were scored qualitatively on their congestion impacts, from +2 points for sites with minimal impacts to -2 points from sites with significant impacts.
Criterion #7 measured the secondary impacts – noise, odor, lighting, etc – of the sites on adjoining neighborhoods. Again, sites were scored qualitatively with those sites located adjacent to vacant land or commercial/industrial land uses scoring +2 points and those sites located adjacent to residential areas receiving -2 points.
Figure 17. Phase 1 Screening Criteria: Community/Environmental Impacts
Criteria Weight Benchmark Scoring Metric
1. Would the selection of the site
and subsequent operation of
the Intermodal Transportation
Facility minimize local traffic
impacts?
4 Adequacy of local street
network
Score by hand
Minimal impact, adjacent to interstate,
arterials = +2 points
Moderate impact, some congestion, not
close to interstate = 0
Significant impact, LOS E/F, local street
access only = -2 points
2. Would the selection of the site
and subsequent operation of
the Intermodal Transportation
Facility minimize secondary
impacts to existing
neighborhoods?
4 Proximity to existing
neighborhoods
Score by hand
Isolated or adjacent to
commercial/industrial uses = +2 points
Immediately adjacent to neighborhoods:
-2 points
3. Would the selection of the site
impact historical or cultural
resources of the host
community and region?
3 Proximity of existing
historical and cultural
resources
No historical or cultural resources within
1/4 mile of site
Criteria: 1/4 mile river buffer, Historic
Districts, Parks
2+ criteria hit = -2 points
1 criteria hit = -1 point
0 criteria hit = 0 points

Upper Valley Intermodal Facility – Draft Report
Page 31
4. How would developing the site
as an Intermodal
Transportation Facility affect
future tax revenues in the host
community?
3 Land value, potential for
site to accommodate
other mixed-use
development, currently
publicly owned
Score by hand
Not highly valued parcel, opportunity for
public/private = +2 points
High value parcel, no opportunity for
public/private = -2 points
5. How developing the site will
impact on the natural
environment?
4 Are there wetlands,
floodplains, steep slopes,
or other natural
features?
No environmental impacts on the site
Criteria: wetlands, floodplains, steep
slopes, wildlife corridors
All 4 criteria hit = -2 points
3 criteria hit = -1.5 points
2 criteria hit = -1 point
1 criteria hit = -0.5 points
0 criteria hit = 1 points
Brownfield site = +1 point
4.2.3 Planning and Land Use Considerations
The Phase I screening criteria included three criteria related to planning and land use considerations, as summarized in Figure 18.
� Consistency with Local Ordinances and Plans: Consistency with local ordinances and plans was scored qualitatively. Sites located in areas where building an intermodal facility would be completely consistent with local/regional plans received +2 points, and sites located in areas where the facility would be inconsistent received -2 points.
� Consistency with Progressive Land Use Principles: Consistency with progressive land use principles was scored based on proximity to major employers, location within a commercial/industrial zone, and a site size greater than 25 acres. Up to one point could be scored for being located near major employers, a half point could be scored for being located in a commercial/industrial zoning district, and another half point could be scored for having a site greater than 25 acres. Negative points were not assigned in this criterion.
� Utility Service: The adequacy of existing community utilities was measured based on whether the site was located within a ¼ mile of public water and sewer service. Again, negative points were not assigned in this criterion.

15 June 2010
Page 32
Figure 18. Phase I Screening Criteria: Planning and Land Use Considerations
Criteria Weight Benchmark Scoring Metric
1. Would the development of the
site as an Intermodal
Transportation Facility be
consistent with existing local
and regional land use plans and
zoning?
4 Consistency with local
and regional land use
plans and zoning
ordinance
Score by hand
Completely consistent = +2 points
Completely inconsistent = -2 points
2. Would developing the site as an
Intermodal Transportation
Facility be consistent with
generally accepted land use
principles such as Transit-
Oriented Development or other
compact design land use
techniques, proximity to
existing employment center, or
parcels suitable for new
commercial/industrial
employment?
4 Proximity of site to
existing employment
centers, potential for site
to accommodate other
mixed-use development
Consistent with generally accepted land
use principles
Located within 1/2 mile of major
employers = +0.25 point per employer
with 25+ employees or +1 for single
employer 100+ (Max +1)
Located within commercial/industrial
zoned land = 1/2 point
Site 25+ acres = 1/2 point
3. Would the site be adequately
served by existing community
utilities (e.g. water/sewer
infrastructure)?
3 Access to and capacity of
existing community
utilities
Access to existing community utilities
Public water service line within 1/4 mile
= +1 point
Public sewer service line within 1/4 mile
= +1 point
4.2.4 Site Characteristics/Implementation
The Phase I screening criteria included four criteria related to site characteristics and implementation, as summarized in Figure 19.
� Site Space Requirements: The proposed sites would need to accommodate not only the actual building but the associated parking for vehicles and buses. The amount of land unconstrained by wetlands, floodplains, and steep slopes was measured for each site. Sites with less than 4 acres of environmentally unconstrained land received -2 points. Sites with more than 12 acres of environmentally unconstrained land received +2 points.
� Future Expansion Potential: The ideal site could accommodate future expansion of additional vehicle parking spaces and bus bays. Again, the amount of land unconstrained by wetlands, floodplains, and steep slopes was measured for each site. Sites with less than 8 acres of environmentally unconstrained land received -2 points. Sites with more than 16 acres of environmentally unconstrained land received +2 points.
� Safety Considerations: The safety of each potential site was measured qualitatively. Sites considered to be safe and do not require additional safeguards received +2 points while sites deemed unsafe received -2 points.
� Site Cost: The cost of acquiring the site as well as preparing the site for construction was taken into consideration. To measure this criterion, the current ownership of the parcels, environmental constraints, existing structures, current tenants, ROW needs, and other costs were evaluated. Sites earned +1 point for being publicly owned, environmentally unconstrained, and inexpensive. Sites earned -1 or -2 points for needing an existing structure demolished, relocating a current tenant, requiring additional ROW purchase, and being prohibitively expensive.

Upper Valley Intermodal Facility – Draft Report
Page 33
Figure 19. Phase I Screening Criteria: Site Characteristics/Implementation
Criteria Weight Benchmark Scoring Metric
1. Would the site accommodate
initial estimates for space
requirements?
5 Could the site
accommodate 1,000
parking spaces and 10
bus bays?
Adequate unconstrained land acreage
< 4 acres = -2 points
4-8 acres = -1 point
8-12 acres = +1 point
12+ acres = +2 points
2. Would the site allow for
potential future expansion
and/or phasing of
development?
4 Could the site
accommodate 1,500
parking spaces and 15
bus bays?
Adequate unconstrained land acreage
< 8 acres = -2 points
8-12 acres = -1 point
12-16 acres = +1 point
16+ acres = +2 points
3. Would the site provide safe and
secure passenger waiting
facilities, and vehicle and bus
parking?
3 Necessity for extra
safeguards required
Score by hand
Safe location = +2 points
Unsafe location = -2 points
4. Would the cost of acquiring the
property and preparing the site
for construction be feasible
given realistic budget estimates
for the project?
5 Site acquisition cost and
topographic
characteristics of the site
Site acquisition/characteristics
Parcel publicly owned = +1 point
No environmental constraints = +1 point
If demolish existing vacant structure = -1
point
If cause relocation of tenant = -2 points
If ROW purchase required for access = -1
point
If prohibitively expensive = -1 point
If inexpensive = +1 point
4.3 Phase I Screening Criteria Results
All of the sites deemed to be feasible were evaluated based on the Phase I screening criteria described above. The full site screening worksheet can be found in Appendix G. The site ranking was presented to the Project Advisory Committee. Based on the results of the Phase I screening assessment, the PAC chose to move forward with the top five ranked sites. The locations of the top five sites are shown in Figure 20.
Figure 20. Sites Selected for Phase II Screening Assessment

15 June 2010
Page 34

Upper Valley Intermodal Facility – Draft Report
Page 35
5.0 ALTERNATIVES ANALYSIS - PHASE II
5.1 Phase II Screening Analysis Methodology
The following fourteen metrics were identified by the Project Advisory Committee (PAC) to evaluate each of the five Phase II intermodal sites.
For each metric, raw scores or values were calculated based on the benchmarks described in the subsections below. For example, Metric 2.1: Impact to Adjacent Property Values, four benchmarks were used to calculate a raw score for this metric. Each of the benchmarks was scored from -2 to +2 and added together to obtain a raw score (Figure 23). For Metric 2.7: Direct Site Costs, the raw values were calculated as the total cost for site acquisition and preparation (a dollar amount, Figure 32).
Once the raw scores or values for each metric were obtained, these values were standardized to a -2 to +2 score using the following equation:
Score = [Raw Value/Max(Absolute Values of the Raw Scores for all 5 Sites)]*2
For example, for Metric 2.1, the raw scores ranged from -5 to +4. Using the equations above, a raw score of -5 would be scored as a -2.0, a raw score of -4 would be scored as a -1.6, and vice versa, a raw score of +4 would be scored as a +1.6 (Figure 21).
For some scores, the opposite sign may have been applied to the score so that a positive raw value was scored as a detriment (negative score), and a negative raw value was scored as a benefit (e.g., a reduction in congestion of -35 seconds is actually a benefit for the site and would have a positive score).
The metrics were reviewed by a subcommittee of the PAC before scores were calculated, at which point the subcommittee defined a weight from 1 to 5 for each metric (Figure 22). This weight was used to identify the relative importance of each of the metrics in the scoring of the five sites and was multiplied to

15 June 2010
Page 36
the final score. For example, for Metric 2.1, the weight assigned by the subcommittee of the PAC was a 3. This was multiplied by the scores obtained using the above equation to obtain a weighted score. Figure 21 shows the values obtained after applying the weights. The weighted final scores for each metric were added together to obtain the final weighted score for each site. This score was used to rank the five sites.
Figure 21. Calculating Scores and Applying Weighting, Metric 2.1: Impact to Adjacent Property Values.
VTrans/
Holiday Drive
Westboro/
"Wye" Lot
Carter
Country
Club
Densmore
Brickyard Heater Road Raw Value 4 3 -5 -4 -5
Score 1.6 1.2 -2.0 -1.6 -2.0
Weight x3 x 3 x 3 x 3 x 3
Weighted score 4.8 3.6 -6.0 -4.8 -6.0
For reference, the No Build scenario was added as an alternative to the scoring matrix, and scored accordingly for each metric.

Upper Valley Intermodal Facility – Draft Report
Page 37
Figure 22. Metrics: Criteria, Weight, and Benchmark.
# Criteria Weight Benchmark
2.1
IMPACT TO ADJACENT PROPERTY VALUES
Would the development of the site minimize adverse
impacts to adjacent property values?
3 Impact of development on
adjacent property values
2.2.1
VMT & CONGESTION REDUCTION
How would the development of the site as an
Intermodal Transportation Facility impact Vehicle
Miles Traveled (VMT) and regional congestion?
5 VMT reduction
4 Delay/vehicle reduction
2.2.2
2.3 LOCAL TRANSIT OPERATIONS & RIDERSHIP 5
How would the development of
the site impact local transit
access volume and travel times?
2.4
INTERCITY BUS TRAVEL TIME
How would the development of the site as an
Intermodal Transportation Facility impact Intercity
bus travel times within the region?
3
Total additional on-the-road
travel times for Dartmouth Coach
and Greyhound
2.5
INTERCITY BUS RIDERSHIP
How would the development of the site as an
Intermodal Transportation Facility impact Intercity
bus volumes?
5
Net impact to intercity
passengers based on home and
terminal location
2.6
BIKE/PED TRAVEL TIMES
How would the development of the site as an
Intermodal Transportation Facility impact bicycle
and pedestrian travel times?
2 Qualitative
2.7
DIRECT SITE COSTS
What is the direct cost of acquiring the site and
preparing this site for construction including the
provision of community facilities?
4 Site acquisition and preparation
2.8
FINAL DESIGN & FACILITY CONSTRUCTION COSTS
What is the cost to design, permit, and construct the
facility, including any unusual site characteristics
(e.g. structured parking)?
4 Soft & hard costs
2.9
OFF-SITE IMPROVEMENT COST
What is the direct capital and O&M cost of the
highway, transit, and bicycle/pedestrian
infrastructure necessary to link the site to the
existing transportation network?
5 Construction cost
2.10
REDUCING FUEL CONSUMPTION AND EMISSIONS
Would the development of the site as an Intermodal
Transportation Facility reduce regional fuel
consumption and vehicle emissions?
4
Reduction in fuel consumption
Reduction in CO, CO2, NOx and
VOC emissions

15 June 2010
Page 38
# Criteria Weight Benchmark
2.11
SITE ENVIRONMENTAL IMPACTS
What are the direct costs associated with on-site
environmental mitigation/remediation?
4 Environmental mitigation impacts
2.12
IMPACT TO LOCAL TAX BASE
How would developing the site as an Intermodal
Transportation Facility effect future tax revenues in
the host community?
4
Land value, potential for site to
accommodate other mixed-use
development, currently publicly
owned, vehicle registration taxes
2.13
SITE REDEVELOPMENT
Does the site involve the redevelopment of a former
use on the site?
3
Is the site undeveloped or will it
involve a redevelopment of a
previous use
5.2 Phase II Screening Criteria
5.2.1 Adjacent Property Values
The impacts to adjacent property values were assessed based on a review of consistency with the Town or City zoning district within which the property is located and a qualitative examination of the impacts of an Intermodal Facility on adjacent uses.
We addressed the following questions for each candidate site and summarized the information in Figure 23:
� What is the zoning district for the parcel? Is the project allowed in the zoning district?
� What are the adjacent uses? Is the proposed use compatible with the adjacent uses?
� Does the project revitalize an abandoned property?
� Are there other unique benefits or detriments?
We assigned a numerical rating for each beneficial or detrimental quality identified: benefit (+2 or +1), detriment (-2 or -1), or neutral impact (0).
1. Consistency with Zoning Ordinance: If a parking facility is a permitted use or is allowed by conditional use or special exception within the zoning district, it is more likely that the project is consistent with the surrounding uses, which is beneficial (+2 or +1). For parcels in zoning districts that do not specifically allow parking facilities, we deemed this to be detrimental and more likely inconsistent with the surrounding uses (-2 or -1). For this quality, there is no neutral (0) rating.
2. Compatibility with Adjacent Uses: We regarded the project as detrimental to abutting property values if the surrounding uses were primarily low to medium density residential (-1), since relatively few riders/commuters would originate from the neighborhood. We regarded the project as enhancing abutting values (+1) if the site was in a commercial area since businesses could benefit from having commuting alternatives for their employees, and users of the facility could be potential customers of commercial businesses.
3. Revitalization Benefits: If the project revitalized an abandoned property, then it was regarded as beneficial to adjacent property values (+1). If the project replaced current open space, it was regarded as a detrimental impact (-1).
4. Other Unique Benefits or Detriments: If a project site has known unique benefits or detriments, we included those as well, along with a corresponding rating of -1, 0, or +1.

Upper Valley Intermodal Facility – Draft Report
Page 39
We summed the ratings of these criteria to obtain a raw score for each property. The results are included in Figure 23. We then adjusted the raw score to assign a numerical ranking between -2 and +2 for the Phase II Scoring Matrix.
Figure 23. Impacts to Adjacent Property Values
5.2.2 Vehicle Miles Travelled (VMT)
The Vehicle Miles Traveled (VMT) reduction criterion focused specifically on reductions gained through capturing long-distance Dartmouth Coach-related trips, since these longer-distance VMT reductions (e.g. 120 mile trips to Boston) far outweighed the smaller local VMT reductions gained through shifts to carpooling and local transit use.
The VMT reduction criterion was calculated as a savings or reduction in VMT using each of the proposed sites compared to existing VMT with the current Dartmouth Coach facility at 90 Etna Road. A baseline assumption is that an expanded Intermodal Facility would allow Dartmouth Coach to add service to Manchester Airport at four of the five locations. The Westboro/Wye Lot site would not be able to accommodate the addition of bus service to Manchester due to limitations in parking. Similarly, the VTrans site would only be able to accommodate a little over three-quarters of the buses to Manchester due to limitations in parking. A single day’s worth of VMT was estimated for all scenarios (i.e., current and proposed sites).

15 June 2010
Page 40
Dartmouth Coach administered an on-board survey of passengers from 28 January 2010 to 2 February 2010 that collected the following information:1
� Home zip code
� Boarding location
� Departing location
� Mode of travel to bus terminal
� Duration of trip
� Frequency of trip
The number of trips generated by Dartmouth Coach was estimated using data on the average number of riders per bus, number of buses scheduled to depart across an average week day, and percent of riders currently utilizing the current Dartmouth Coach site in Lebanon. Each bus is estimated to generate an average of 15 trip boardings in Lebanon. The percent of riders per home zip code were calculated using the Dartmouth Coach ridership survey (Figure 24).
Distances between current riders’ home zip codes and the current and proposed Intermodal Center locations were calculated based on the number of people that would be riding a given bus for an entire day. VMT figures were also calculated for the buses driving from the terminal to the destination (i.e., BOS, MHT, NYC).
� Current VMT Calculation: Current VMT was calculated as: VMT from current riders’ home zip codes to the Etna Road terminal, plus VMT from the current riders’ home zip codes to Manchester Airport via auto (this number was based on the proposed increase in Dartmouth Coach service to MHT).
� VMT Calculation for Each Site: VMT to the five potential locations was estimated as: VMT from current riders’ home zip codes to the proposed site, plus VMT for the buses driving to the final destination.
These VMT figures were summed for the entire day for a proposed location and compared to the VMT for current users. The differences in VMT between the proposed sites and the current site (plus MHT) were used as the raw score. The raw scores were adjusted to assign a numerical ranking between -2 and +2 for the Phase II Scoring Matrix.
1 Separate data on number of riders per bus were also collected from Dartmouth Coach drivers.

Upper Valley Intermodal Facility – Draft Report
Page 41
Figure 24. Distribution of Home Zip Codes of Dartmouth Coach Riders Boarding in Lebanon1
1 Data based on Dartmouth Coach on-board ridership survey: 28 January 2010 to 2 February 2010

15 June 2010
Page 42
5.2.3 Congestion
In order to estimate the impact of the proposed Intermodal Center sites on congestion and delay, peak hour microsimulation models encompassing all five sites were built. Recent turning movement counts for twenty-eight study intersections were assembled and adjusted to represent traffic volumes during the AM and PM peak hours in 2012.1 Inputs to the model include lane geometries, background traffic volumes, and optimized signal timings.
Figure 25. Graphic Showing Portion of Synchro Traffic Model
The following scenarios were developed and modeled:
� 2012 No Build
� 2012 Build (for each of the five sites)
� 2012 Build plus off-site traffic mitigation improvements (for each of the five sites)
A No Build scenario was run for each peak hour to establish baseline conditions. The No Build scenario includes 2012 traffic volumes with the Dartmouth Coach and Greyhound terminals in their current locations.
The Build scenario adds the traffic volume impacts of locating an Intermodal Center at each of the five proposed sites. Traffic volume impacts of the proposal Intermodal Center comes from three primary sources:
� Dartmouth Coach riders
� Greyhound riders
� Commuters using the site as a park and ride
The proposed intermodal site generates some new trips due to expanded intercity bus service, causes certain trips to be re-routed, other trips to be consolidated into a single carpool trip from the site, and other trips to be eliminated due to use of public transit. These impacts were estimated for each site based on existing traffic flows, engineering judgment, employee home zip code data for Dartmouth College and
1 Based on traffic volume data, we estimated background traffic to grow 2% per year.

Upper Valley Intermodal Facility – Draft Report
Page 43
DHMC, journey–to-work information from surveyed Dartmouth College employees, and data from a survey of Dartmouth Coach passengers.
The number of trips generated by Dartmouth Coach and Greyhound bus service was estimated using data on the average number of riders per bus, number of buses scheduled to arrive/depart during the peak hours, mode of travel to the bus terminal, and percent of riders currently utilizing the current Dartmouth Coach site in Lebanon. Based on these sources, we estimated that each bus generates 21 auto trips (15 enters and 6 exits for out bound buses, 6 enters and 15 exits for inbound buses).
Based on these data, the number of trips currently using Dartmouth Coach and Greyhound service were re-routed to the five proposed sites. Additional future trips due to increased bus service were then added to the network. The zip code data was used to approximate the percentage of transit passengers utilizing various routes throughout the microsimulation model’s road network.
The number of trips generated by commuters was estimated using the Institute of Transportation Engineers’ Trip Generation1 for Land Use 90: Park-and-Ride Lot with Bus Service based on 100 available commuter parking spaces
Figure 26 shows the peak period trip generation estimate for the Intermodal Center.
Figure 26. Intermodal Center Peak Hour Trip Generation Estimate
AM PM
Dartmouth Coach 62 83
Commuters 72 62
Greyhound 21 42
Total: 155 187
Peak Hour
Based on observed delay and queuing in the Build scenarios, specific roadway improvements were identified to address congested generated by the Intermodal Facility. These roadway improvements were then added into the network to create the Build plus Mitigation scenarios.
The peak hour simulation models were run for one hour five times and the results were then averaged to determine network-wide delay per vehicle during both the AM and PM peak periods. The Phase II Scoring Matrix includes the sum of the AM and PM peak hour network-wide change in average delay/vehicle between the No Build and Build plus Mitigation scenarios. The raw scores were adjusted to assign a numerical ranking between -2 and +2 for the Phase II Scoring Matrix.
5.2.4 Local & Regional Transit Access Volume and Travel Time
This criterion seeks to measure how locating an Intermodal Center (and transfer point) at each of the five identified locations would impact local and regional transit access volume and travel time. To score this criterion, the following ten metrics were used:
� Can the intermodal site be served with the current number of regular service local buses? Based on current Advance Transit operations, service to the VTrans/Holiday Drive and Densmore Brickyard (with Hanover Street bridge connection) sites could be served with the current number of busses. All of the other locations would require acquisition of additional bus(es) to maintain existing service levels.
� Are operating funds available at this time to bring Advance Transit buses to the site? Similar to the previous metric, this looks at the availability of funds to provide service to each of the sites.
1
Institute of Transportation Engineers, Trip Generation 8th
Edition (Washington, D.C.: Institute of Transportation Engineers, 2008).

15 June 2010
Page 44
There is currently no funding available to Advance Transit to cover additional capital and operating expenses.
� Are there funding partners who may be interested in supporting expanded operations at the site? Based on local knowledge and previous work on the Advance Transit system, this metric identifies whether there are funding partners who may be interested in supporting expanded operations to each of the sites.
� Will adding Advance Transit service to the site increase travel times on current routes? This metric identifies whether serving the site would increase travel times on current AT routes.
� Will development of the site result in faster travel times on existing routes? With the re-connection of Hanover Street across I-89, the Blue Route could serve the Densmore Brickyard site and reach DHMC faster than it does as it would avoid the lights on NH 120. Service to all other sites would result in either no change or an increase in travel times on existing routes.
� Will Advance Transit service to the site negatively impact existing transfers between routes? Based on current AT operations, this metric identifies whether there would be a negative impact on timed transfers in West Lebanon or on the Lebanon Green as a result of providing service to each site.
� What headways can be offered with no additional cost? Headways are defined as the time between bus arrivals (e.g., 60-minute, 30-minute, 15-minute headways). That is, the shorter the amount of time between bus arrivals, the better the service. The only two sites that can be served at no additional cost are the Densmore Brickyard site and the VTrans site.
� What midday headways can be offered for $150,000 per year? This metric looks at the mid-day (i.e. non-commute) headways that could be provided for $150,000 per year in operating expenses.
� Will regional buses offer commuter access to the site? Based on discussions with representatives from Connecticut River Transit and Stagecoach Transportation, this metric identifies the number of routes that would likely serve each of the sites during the morning and evening commute times per day.
� Will regional buses offer intercity travelers access to the site? This metric identifies the number of regional bus routes that would service each site during the mid-day period.
The above metrics were scored from -1 to +1 in relation to each site and were added to obtain a raw value for this metric. The raw scores were adjusted to assign a numerical ranking between -2 and +2 for the Phase II Scoring Matrix.
5.2.5 Intercity Bus Travel Times
Two measures were used to assess the impact on intercity bus operations:
� The number of minutes required for intercity buses heading toward Boston to travel from downtown Hanover and the UVIC site to Exit 18 on Interstate 89
� The number of minutes required for intercity buses heading toward New York City to travel from the UVIC site and downtown Hanover to the interchange of Interstates 89 and 91
Changes to travel times will impact bus operations and costs. This will also have a bearing on the appeal of the resulting intercity service for potential customers. Passengers heading south will not want to begin by traveling north or west to pick up other riders. Shorter travel times are better, because they result in lower operating costs and higher levels of passenger satisfaction.
Calculations were developed separately for Boston and New York City markets. Anticipated local travel times for individual Dartmouth Coach bus trips are shown in Figure 27. The combined daily total for multiple Dartmouth Coach trips is shown in Figure 28.

Upper Valley Intermodal Facility – Draft Report
Page 45
Figure 27. Local Travel Times for Individual Dartmouth Coach Bus Trips
Minutes to Exit 18
Hanover to
UVIC
UVIC to
Exit 18
Combined
Travel Time
Heater Road 15 2 17
Densmore Brickyard 15 2 17
Carter Country Club 20 5 25
Westboro/Wye Lot 18 10 28
VTrans/Holiday Drive 14 11 25
Minutes to I-89/91 Interchange
UVIC to
Hanover
Hanover to
I-89/91
Combined
Travel Time
Heater Road 15 11 26
Densmore Brickyard 15 11 26
Carter Country Club 20 11 31
Hanover to
UVIC
UVIC to
I-89/91
Combined
Travel Time
Westboro/Wye Lot 18 10 28
VTrans/Holiday Drive 14 3 17
Figure 28. Dartmouth Coach Combined Local Daily Travel Times
Boston
buses
NYC
Buses
Total Daily
Minutes
Total Daily
Hours
Extra
Hours
Heater Road 238 30 268 4.5 0.0
Densmore Brickyard 238 30 268 4.5 0.0
Carter Country Club 350 35 385 6.4 1.9
Westboro/Wye Lot 392 32 424 7.1 2.6
VTrans/Holiday Drive 350 19 369 6.2 1.7
Calculations are somewhat different for Greyhound, because Greyhound offers a different number of trips on each route, and because Greyhound diverts some Montreal-Boston buses from Interstate I-89 to Hanover. The combined daily total for multiple Greyhound trips is shown in Figure 29.
Figure 29. Greyhound Lines Combined Local Daily Travel Times
Boston buses
w/ Hanover
Boston buses
w/o Hanover NYC Buses
Total Daily
Minutes
Total Daily
Hours
Extra
Hours
Heater Road 160 42 56 258 4.3 0.9
Densmore Brickyard 160 42 56 258 4.3 0.9
Carter Country Club 220 24 44 288 4.8 1.4
Westboro/Wye Lot 215 54 40 309 5.2 1.8
VTrans/Holiday Drive 150 42 12 204 3.4 0.0
The impact on intercity travel times for Dartmouth Coach and Greyhound Lines can be summarized by adding together the combined impact on existing intercity bus operations. Figure 30 shows the number of over-the-road service hours added for both companies by the various sites. This approach provides a higher relative weight to routes with more frequent service. It offsets time added or saved by one bus company with time added or saved by the other intercity provider.

15 June 2010
Page 46
Figure 30. Combined Impact (service hours) on Intercity Bus Operations
Dartmouth
Coach
Greyhound
Lines
Combined
Hours
Score
(+2 to -2)
Heater Road 0.0 0.9 0.9 0
Densmore Brickyard 0.0 0.9 0.9 0
Carter Country Club 1.9 1.4 3.3 -2
Westboro/Wye Lot 2.6 1.8 4.4 -2
VTrans/Holiday Drive 1.7 0.0 1.7 -1
5.2.6 Intercity Bus Ridership
To estimate the impact on intercity bus ridership between the different sites, an incremental logit model was used to estimate the difference in mode share (ridership) that would be achieved between the proposed sites. This incremental logit model with travel time and access/egress time coefficient estimates was derived from intercity mode choice models developed by RSG and Charles River Associates (CRA) for the Toronto to Montreal high speed rail corridor. The following formula was used to estimate changes in mode share:
= new mode share
= current mode share
= Beta travel time1 * the change in access time
This formula was used to estimate the change in mode share (increase or decrease in Dartmouth Coach ridership) based on changes in travel time (i.e., access time to the proposed site, plus travel time on the bus from the proposed sites to their final destination – BOS and NYC). Differences in ridership were calculated between the proposed sites and the current Dartmouth Coach location. The percent change in ridership was estimated for each proposed location and ridership market and then multiplied by the number of riders for each bus in an average week day (based on current bus ridership numbers). These weighted numbers were added to get a raw score or the change in ridership for an average day. The raw scores were adjusted to assign a numerical ranking between -2 and +2 for the Phase II Scoring Matrix.
5.2.7 Bicycle and Pedestrian Travel Times
The proximity of the Intermodal Center to residential areas offers the potential for walking or bicycling to the facility to board a local, regional, or intercity bus. This qualitative metric identified whether the site was located within reasonable proximity to a built-up residential area.
5.2.8 Direct Site Costs
Site acquisition costs were developed from the following sources:
� City of Lebanon Assessors’ record data.
� Interviews with the City of Lebanon Assessors’ office.
1 Estimated as -0.01 from CRA (1994). Projections of Ridership and Passenger Revenue for High Speed Rail Alternatives Operating between
Windsor and Quebec City

Upper Valley Intermodal Facility – Draft Report
Page 47
� Town of Hartford Listers’ record data.
� Available Real Data® information.
� Interviews with local real estate agents.
� Asking prices from the representatives of the candidate properties.
Our interviews with the City of Lebanon Assessors’ office and local real estate agents produced comparable results. The Assessors informed us that transfer prices and assessed values were generally very similar. Information from the City indicated that the assessed values were approximately 96% of the transfer prices. The real estate agents indicated that assessed values and transfer prices in Lebanon and Hartford tend to be very close. However, the data from both sources was primarily based on the residential market, since there were very few recent transfers of vacant land. The real estate agents also informed us that the recent transfer prices through January 2010 are at the 2005 market levels. Nevertheless, the overall market trend supports using the assessed values as a base line for determining a reasonable purchase price for the candidate properties.
We specifically reviewed the assessment data for the four subject properties in the City of Lebanon with the City Assessors’ office. We also obtained the assessment data for the parcels in Hartford from the Hartford Listers’ office. Figure 31 summarizes the parcel data provided by both offices. In the last column, “Comments,” we included the asking price for those parcels that are currently for sale on the open market.
Figure 31. Assessed Value of Phase II Sites
Land Building
1 14-22 State of Vermont 122 Beswick Drive Hartford,
VT
7.5 I-C2 highway
maintenance
facility
$149,300 $515,000 $664,300
14-41 Mascoma Bank 259 Holiday Drive Hartford,
VT
building
only
I-C2 hotel - building
(abandoned)
$900,000 $900,000 hotel and land for
sale at $1.2M
14-41LND Valley Land Corp. 259 Holiday Drive Hartford,
VT
5.5 I-C2 hotel - land $426,800 $426,800
$1,991,100
2 46-24 State of Vermont Railroad Row Hartford,
VT
5.69 I-C vacant with
active rail
$85,500
72-5 NHDOT Westboro Yard,
Railroad Ave.
West
Lebanon,
NH
19.07 CBD abandoned rail
yard, storage
$735,200 $128,600 $863,800 sales price in 1999
$700,000
$863,800
3 132-16 Carter Country
Club
Mechanic Street Lebanon,
NH
253.38 R3 9-hole golf
course
$371,000 $680,600 $1,051,600
$1,051,600
4 48-1 Lane NH Holdings,
LLC
174 Hanover St. Ext.
(Densmore Brickyard)
Lebanon,
NH
101 RL3 undeveloped $121,355 $121,355 sale price 2005
$805,000; for sale at
$8.9M for 133 acres48-2 Lane NH Holdings,
LLC
174 Hanover St. Ext.
(Densmore Brickyard)
Lebanon,
NH
26 R1 undeveloped $101,510 $101,510
48-4 Lane NH Holdings,
LLC
174 Hanover St. Ext.
(Densmore Brickyard)
Lebanon,
NH
6.5 RO1 abandoned
brickyard
$318,000 $137,100 $455,100
$677,965
5 79-52 Jonathan and
Jennifer Friedman
Heater Road Lebanon,
NH
66 RL1, RL3 undeveloped $388,500 $388,500 Current Use,
assessed value
$6,440; sales price
in 2005 $795,600;
for sale at $1.75M$388,500
Site Land Use
Appraised
Value for SiteLocation Owner NameMap/Lot
Zoning
District
Current Appraised Value
Comments
Lot Size
(acres)City/State
Site 1 Total
Site 2 Total
Site 4 Total
Site 5 Total
Site 3 Total
As noted previously, there have been few land sales in recent years to use as comparables for the subject properties. We compiled the following list of properties from the City of Lebanon and Town of Hanover

15 June 2010
Page 48
records in support of our analysis.1 Many of the properties were comprised of multiple lots; thus, actual acreages and/or sales prices could be different.
1. Lebrun parcel, Route 4 (Dartmouth College Highway), Lebanon – 22.82 acres of vacant land for $310,000 on January 29, 2008.
2. Lebrun property, Route 4 (Dartmouth College Highway), Lebanon – 252.8 acres of land and improvements, including two units (houses), a barn, and other improvements, for $1,185,000 on December 10, 2008.
3. Lebrun parcel, Ruddsboro Road, Hanover – 237.7 acres of vacant land for $700,000 on September 15, 2008.
4. Lebanon School District, Route 4 (Dartmouth College Highway), Lebanon – 27.08 acres of vacant land for $1,000,000 on November 10, 2008.
5. Timberwood Commons, Mount Support Road, Lebanon – 42.63 acres of vacant land plus permits for 252 units for $2,445,000 on December 29, 2009.
6. L-A Suncook, Route 120, Lebanon and Hanover – 373.52 acres of land and improvements, including the former Wilson Tire site, for $15,538,733 on December 4, 2007. It should be noted that these same properties were transferred from a development group for $10,726,700 between 2004 and 2006, according to City records.
7. Sleeper Village, Old Pine Tree Cemetery Road, Lebanon – 326 acres of land and improvements, including a house and permits for 141 units for $5,194,000 on July 5, 2006. It should be noted that the same properties were transferred in 2000 for $900,000 before permitting.
8. Hypertherm, Heater Road, Lebanon – 23.1 acres of vacant land and permits for a 6-lot subdivision for $2,025,000 on August 24, 2007.
9. Upper Valley Technology Park, Airport parcel, West Lebanon (former Korpela parcel) – 37.83 acres of vacant land for $2,050,000 on November 26, 2008.
In each case where there were plans to develop and/or where permits were issued, the sales price increased significantly. We would also like to point out that many of these properties were in Current Use; therefore, assessed values on these properties were not listed.
In our opinion, it is reasonable to utilize the purchase price information from the above transactions for #1, #2, #3, #4, #8, and #9 as comparables to develop a reasonable range for the per-acre purchase price for undeveloped land. This range is $3,000 to $88,000 per acre, without consideration for anything else. Purchase prices for transactions #5, #6, and #7 are not representative comparables because they included approved permits for multi-unit developments and/or development plans, which drastically increased the price. We applied the range to the candidate sites and their corresponding land acreages, and we arrived at a “Purchase Price Range based on Average Price Per Acre of Representative Land Sales.” These values are summarized in Figure 32. Note that the Westboro Rail Yard is already owned by the state of New Hampshire and requires no site acquisition cost.
1 Please note the following information on these parcels, corresponding by number:
– #2 is currently before the Planning Board for a major subdivision.
– #4 is currently before the City voters to develop as a school.
– #5 is approved as a 252-unit residential development.
– #6 has no application at this time.
– #7 is approved as a 141-unit residential development.
– #8 received Site Plan approval for a 156,650 square-foot light industrial building.
– #9 is approved as a 3-lot subdivision for industrial/office use.

Upper Valley Intermodal Facility – Draft Report
Page 49
Figure 32. Site Acquisition Cost Summary
VTrans/Hotel,
Hartford
Railroad Row,
Hartford and
Westboro Rail
Yard, West
Lebanon
Carter Country
Club, Lebanon
Densmore
Brickyard,
Lebanon
Friedman Parcel,
Heater Road,
Lebanon
Assessed Value $2,084,703 $909,263 $1,106,947 $713,647 $408,947
Open Market Asking Price$1.2M
(hotel site only) n/a n/a $8.9M $1.75M
Parcel Size (AC) 13 16 40 133.5 66
High Value Land (AC) 13 16 40 31 30
Low Value Land (AC) 0 0 0 102.5 36
Reaonable Price High Value
Land ($70,400/acre)$915,200 $1,126,400 $2,816,000 $2,182,400 $2,112,000
Reasonable Price Low
Value Land ($3,600/acre)$0 $0 $0 $369,000 $129,600
Reasonable Price All Land $915,200 $1,126,400 $2,816,000 $2,551,400 $2,241,600
Estimated Relocation Cost $1,500,000 $0 $0 $0 $0
Estimated Site Acquisition
Cost$2,415,200 $0 $2,816,000 $2,551,400 $2,241,600
We did not perform appraisals of the candidate properties, nor did we develop a comprehensive comparable sales analysis. Ultimately, the true sales price is the price at which there is a willing seller and a willing buyer. It should be noted, however, that because this site feasibility process is a public process, which will end with a single preferred site, the “buyer” in the real estate transaction has forfeited much of its negotiating power with the seller of the preferred site. This situation is similar to the recent purchase of land by the Lebanon School District (#4 above) where the appraised value for the 27-acre parcel was $177,800 and the sales price was $1,185,000.
Other Unique Factors Considered in Site Acquisition Cost
VTrans/Hotel Site, Hartford
� Relocate VTrans Operations: The VTrans district office and maintenance facilities will need to be relocated to develop the site for an intermodal transit hub. The cost to find and acquire another site and to relocate the VTrans facilities needs to be factored into the cost of the project. It is logical to assume that the costs associated with moving the existing facilities would be reflected in the sale price of the subject parcel. These costs were estimated at $1,500,000 and are reflected in the site acquisition cost in Figure 32.
� Hotel Lease Interest: The hotel property has a lease interest with the following rights and payment schedule, according to information provided by the real estate agent/broker representing Mascoma Bank, the lease holder:
- Rights with Ground Lease: Right to convert lease to fee simple. The land lease can be subrogated to 90% bank financing. It must continue as a hotel/motel with a restaurant. Signage: the lease includes a signage right-of-way.

15 June 2010
Page 50
- Lease Payment Schedule: Currently and for the next 27 years at 8.2 cents/sq. ft. or $1,956.76/month. The next 33 years will be at 8.6 cents/sq. ft. or $2,054.60/month. Approximately 61 years to the end of the lease.
If the hotel property were to be used for the intermodal transit hub, it appears that the lease interest would need to be purchased from the leaseholder. While we understand that Mascoma Bank is offering the hotel site for sale, we are also aware of legal action relative to the lease of the parcel. The actual ramifications of the lease and legal determinations that may exist are not clear to us and should be verified through legal counsel prior to acquisition. (-1)
Carter Country Club, Lebanon
� Relocation of Golf Course: The existing 9-hole golf course will need to be relocated elsewhere on the 253-acre parcel or the property will revert to prior ownership. The representative for the owner has indicated that the owner will bear the cost of constructing the new golf course, presumably as an investment toward developing additional portions of the parcel near the proposed intermodal facility. Based on past experience with golf course construction, the actual cost of this effort is expected to be in the range of $5M, incentives for which are not evident based on the current zoning of the property. Rezoning of any portion of the land is beyond the scope of the intermodal transit hub project and not a realistic basis for acquiring the land. (-1)
Site Preparation Cost
Site preparation costs were based on conceptual layouts for each site that included the circulating roadway, surface parking, and a building footprint between 5,000 and 10,000 square feet, bus parking, and a transit passenger drop off zone. Special site features such as wetland impacts and steep slopes were accounted for where the wetland mapping and topographic data were available. Ledge was assumed to be present on the sites where the WebSoil Survey mapping by the Soil Conservation Service indicated ledge relatively near the surface.
5.2.9 Final Design & Facility Construction Costs
This metric represents the order-of-magnitude cost estimate for final design, permitting, construction assistance, and construction of the respective sites. It should be noted that these estimates are conceptual in nature and are developed for the purpose of providing a relative comparison of costs between the candidate sites. These costs should not be used for budgeting purposes.
5.2.10 Off-Site Improvement Costs
Three types of off-site improvement costs were calculated: improvements to highways, transit, and bicycle/pedestrian facilities:
� Highway Improvements: Based on the traffic analysis and simulation evaluation of the No Build and Build scenarios, combined with local knowledge of the traffic conditions proximate to each site, a series of off-site roadway improvements was identified to address the additional congestion and delay generated by the Intermodal Center. These improvements are cited in the Evaluation Matrix and in Figure 33 along with order-of-magnitude cost estimates.
� Transit Improvements: This metric identifies the annual operating cost to provide mid-day Advance Transit service to each of the sites. As mentioned previously, existing Advance Transit routes can service the Densmore Brickyard and VTrans sites at no additional cost and without diminishing service quality. All of the other sites would require additional operating costs (and buses) to be served.

Upper Valley Intermodal Facility – Draft Report
Page 51
� Bicycle and Pedestrian Improvements: This metric identifies order-of-magnitude cost estimates associated with identified bicycle and pedestrian improvements to tie the site into adjacent major land uses or existing bicycle/pedestrian facilities.
Figure 33. Off-site Highway Improvements.
VTrans/ Holiday Drive
Westboro/
"Wye" Lot
Carter Country
Club Densmore Brickyard Heater Road
Improvement
Expanded Sykes Ave
approach to US 5 and
expanded roundabout
to add 1 circulating
lane on northern
quadrant
Expand site access road
from NH 12A to
accommodate frequent
bus movements.
New signal at
US
4/Buckingham
Place
intersection
New signal at Old
Etna Rd/Heater Rd
and new left turn
lane on Hanover St
approach
Restriping and
retiming at NH
120/Heater Rd
intersection
Cost $500,000 $100,000 $250,000 $350,000 $20,000
Improvement
New signal at US 5/I-
91 NB ramps
intersection
Optimize traffic signal
timings on South Main
Street in West Lebanon
New Signal at
Hanover Street/Evans
Drive
Cost $250,000 $20,000 $250,000
Improvement
New signal at US 5/I-
91 SB ramps
intersection
New signal at NH
120/Hanover St
Cost $250,000 $250,000
Improvement
Replace pedestrian
bridge with full-
service bridge
Cost $7,000,000
Improvement
Restriping and
retiming at NH
120/Heater Rd
intersection
Cost $20,000
Highway Improvements
Total1,000,000 120,000 250,000 7,830,000 20,000
5.2.11 Fuel Consumption and Emissions
Construction of a multi-modal transportation facility in the Upper Valley has the potential to positively affect vehicle emission levels and fuel consumption associated with both local and inter-city travel. Build scenario emissions and fuel consumption levels for all proposed Intermodal Center sites were compared to No Build 2012 conditions using SimTraffic microsimulation models. The SimTraffic models project emissions and fuel consumption every 0.1 seconds throughout hour long simulations using lookup tables of emissions and fuel consumption factors based on vehicle speed and acceleration characteristics. Emissions and fuel consumption were also estimated for reductions in VMT due to expanded inter-city bus services using NHDES emissions factors assuming an average highway cruise speed of 65 mph.
Emission levels were estimated for carbon monoxide (CO), nitrogen oxides (NOx), volatile organic compounds (VOCs), and carbon dioxide (CO2).
While all sites are projected to have a positive impact on overall vehicle fuel consumption and emissions due to inter-city personal vehicle trips being captured by expanded bus services (primarily service to Manchester Airport), differences between sites arise due to their location in relation to major intercity transit destinations, levels of traffic congestion at adjacent and upstream intersections (affecting both transit and carpool related traffic), and indirect effects of network improvements required by the sites.

15 June 2010
Page 52
5.2.12 Site Environmental Impacts
The site environmental impacts for each site are described below:
� VTrans/Hotel Site, Hartford
- Site Contamination: While no contamination is known to exist on either parcel, given the current (i.e. VTrans maintenance and material storage operations) and former (i.e. hotel) uses on the site, there is the potential for site contamination. (-0.5)
� Railroad Row, Hartford and Westboro Rail Yard, Lebanon
- Site Contamination: The Westboro Rail Yard is known to contain asbestos and petroleum contamination within the vicinity of the roundhouse building. The State of New Hampshire and the City of Lebanon have been evaluating the contamination for several years, but no known remediation plan has been established as of the date of this narrative. It is very likely that remediation of the site will be a costly and time-consuming effort. (-1)
- Comprehensive Shoreland Protection Act (CSPA): The Westboro Rail Yard property is subject to the CSPA, which regulates development within 250' of protected waters, including the Connecticut River. The regulations and review process will influence the location of structures, parking lots, and landscaping on the site, which may translate to a reduction in parking spaces, additional cost for landscaping and screening, and more structured parking. (-1)
� Carter Country Club, Lebanon
- Wetland and Steep Slope Impacts: The City of Lebanon GIS mapping of the site includes steep slope and wetland overlays. Topographic surveying and wetland delineations are needed to delineate steep slopes and wetlands accurately on the site; the proposed layout should be adjusted to minimize impacts to environmentally sensitive areas. This alteration may result in a reduced number of parking spaces or use of additional acreage to provide the desired number of parking spaces. Given the relatively large size of this particular parcel, it is likely that 650 parking spaces can be designed on the site to avoid (or accommodate the mitigation of) any significant environmental impacts. (-0.5)
� Densmore Brickyard, Lebanon
- Wetland and Steep Slope Impacts: The City of Lebanon GIS mapping of the site includes steep slopes and wetland overlays. The property representative provided us with recent wetland mapping, but we recommend vetting this with the New Hampshire Department of Environmental Services (NHDES) for reconciliation of actual boundaries based on recent work with the Lebanon School District property analyzed by the same firm. Topographic surveying and NHDES evaluation of wetlands are needed to assess site conditions accurately. The proposed layout should be adjusted to minimize impacts on environmentally sensitive areas. This modification may result in a reduced number of parking spaces or use of additional acreage or structured parking to provide the desired number of parking spaces. Wetland and steep slope impacts may require a special exception from the Zoning Board of Adjustment, which could pose a barrier to development of the project. If wetland impacts cannot be adequately minimized or mitigated on-site, then off-site compensatory mitigation may be required, possibly requiring the purchase and preservation of other wetland resources or upland property. (-1)
� Friedman Parcel, Heater Road, Lebanon
- Aesthetic concerns: The proposed intermodal facility will be terraced into a relatively steep hillside. The facility will be elevated above the other existing developed lands along the I-89/Heater Road corridor, making it visible from a distance. This feature will likely be considered a negative impact by local regulators. (-1)

Upper Valley Intermodal Facility – Draft Report
Page 53
- Steep Slope Impacts: The City of Lebanon GIS mapping of the site includes a steep slope overlay that impacts much of the site. Topographic surveying is needed to delineate slopes 25% or more on the site accurately. The proposed layout should be adjusted to minimize impacts on environmentally sensitive areas. This change may result in a reduced number of parking spaces or use of additional acreage or structured parking to provide the desired number of parking spaces. Impacts to steep slopes may require a Special Exception from the Lebanon Zoning Board of Adjustment, which could pose a barrier to development of the project. (-1)
5.2.13 Local Tax Base
The impacts on the municipal tax base of locating an Intermodal Center in each of the five identified locations was quantified based on the following parameters:
� Vehicle Registration Fees (Excise Taxes): In New Hampshire, registration fees are assessed based on the value and age of vehicles garaged in a specific town. For the purposes of this assessment, it was assumed that Dartmouth Coach would garage an additional four buses (in addition to the eight already used to service their current routes) to provide service to Manchester Airport at the locations that could accommodate such service. Based on a $800,000 value for new coach buses, the Lebanon City Clerk identified local registration fees to range from $14,400 for the first year stepping down to $2,400 for the fifth year and beyond. It was conservatively assumed that each of the buses garaged would provide $3,000 per year to the City of Lebanon general fund. There is no equivalent municipal component of the vehicle registration fee in Vermont, so no revenues were assumed to be generated in Hartford.
� Cost of Community Services for the Intermodal Facility: To determine an order-of-magnitude Cost of Community Services for the Intermodal Facility, the City of Lebanon’s Cost of Community Services Study1 (Economic & Policy Resources, Inc, 2005) which identified revenue and expense ratios by primary land use type2. The Intermodal Facility was identified under the ‘public institutional lands – exempt’ category, which, generates $0.24 in revenue per $100 of assessed value and costs $2.27 per $100 of assessed value in community services. To be conservative, we assumed that the Intermodal Facility would not generate any revenue. To estimate an assessed value of the Intermodal Center site, we examined the Concord Intermodal Center’s assessment record, which identified the total assessed value of the 5.19 acre site at $274,000. We doubled this figure and assumed the assessed value of the Upper Valley Intermodal site would be approximately $500,000. Multiplying this assessed value by the estimated cost rate results in an annual community services cost of $11,350.
� Net Annual Revenue for Likely Development: The potential municipal revenue and community service costs associated with the development that would “likely” occur on each of the five parcels was estimated. This figure serves as an indicator of the “opportunity cost” potentially lost in citing the Intermodal Center on each site. The likely development on each parcel is identified in the Screening Matrix along with estimated revenues and costs derived from the Costs of Community Services Study, updated to 2010 values.
The net impact on local taxes was then estimated using the following equation:
Net Impact = (Additional revenue generated by vehicle registration fees) -
(Net Cost of Community Services for Intermodal Facility) -
(Net Annual Revenue for Likely Development)
1 No comparable report was identified for the Town of Hartford. The cost and revenue assumptions from this report were used for the
assessments on the Hartford parcels. 2 These values were updated to reflect 2010 values using the US Bureau of Labor Statistics’ CPI inflation calculator,
http://www.bls.gov/data/inflation_calculator.htm.

15 June 2010
Page 54
This metric was then compared to the No Build scenario’s estimated annual municipal revenue to estimate the potential difference between the revenue generated by the No Build Scenario and each alternative.
This metric shows that the likely development at the VTrans parcel is less costly (in terms of community services) than the Intermodal Center (due primarily to the fact that the Town of Hartford would not directly benefit from vehicle registration fees). For all other sites, the Intermodal Center is less costly (in fact, shown to a positive revenue generator) than the likely alternative land use scenario.
For reference, the current local tax revenues were estimated for each site based on the assessed value of the site (both land and buildings) and are included in 34. Both the VTrans and Railroad Row parcels include state owned property which was not included in this calculation. Tax revenues were based on both Hartford and Lebanon’s 2009 local tax rates. Note that the Friedman Parcel on Heater Road is classified as Current Use and has an assessed value of $6,440.
Figure 34. Current Local Tax Revenue.
VTrans/Hotel,
Hartford
Railroad Row,
Hartford and
Westboro Rail Yard,
West Lebanon
Carter Country
Club, Lebanon
Densmore
Brickyard, Lebanon
Friedman Parcel,
Heater Road,
Lebanon
Current Tax Revenue $8,867.00 $7,610.08 $9,264.60 $5,980.23 $56.74
5.2.14 Site Redevelopment Potential
This metric identifies whether the location of an Intermodal Facility at each site would potentially redevelop an underutilized or undesirable parcel or whether the development would involve development of an undeveloped parcel. Sites involving potential redevelopment were scored higher in this metric.
5.3 Phase II Screening Assessment Results
Figure 35 below presents a summary of the Phase II Screening Assessment. A detailed table with results from the Phase II Screening Assessment can be found in Appendix H. As the figure shows, the Densmore Brickyard Site scored the highest of the five sites, and was the only site that had a positive score.
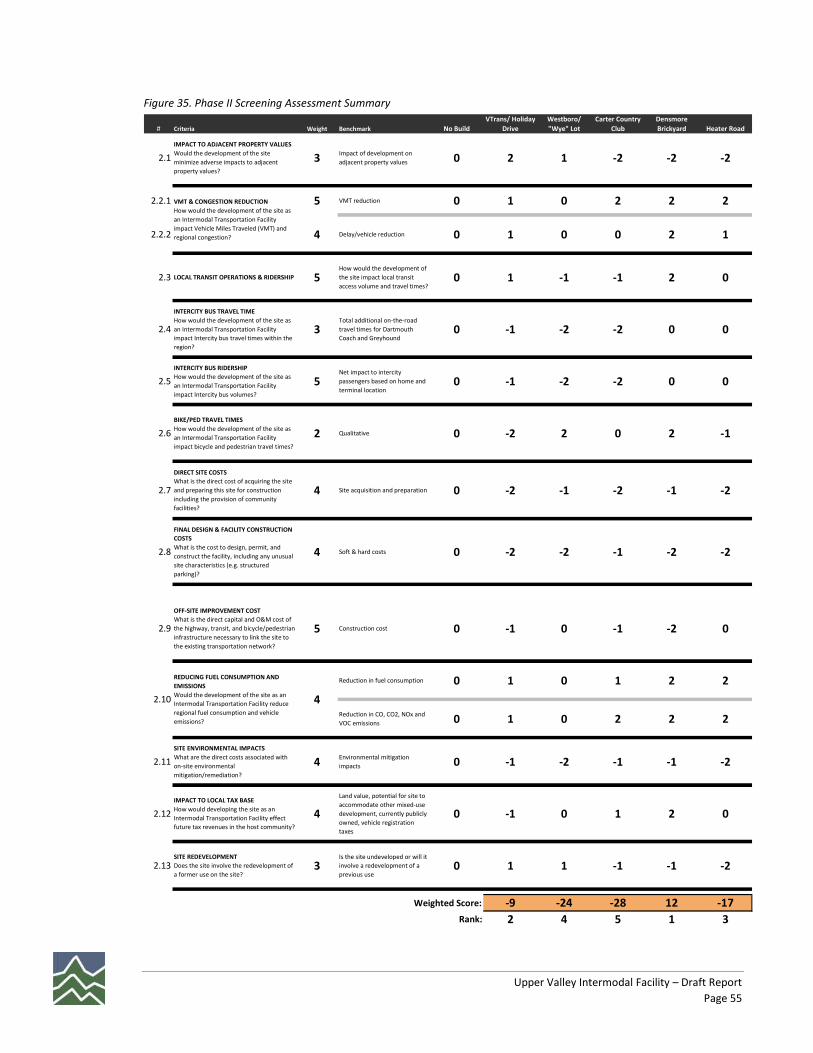
Upper Valley Intermodal Facility – Draft Report
Page 55
Figure 35. Phase II Screening Assessment Summary
# Criteria Weight Benchmark No Build
VTrans/ Holiday
Drive
Westboro/
"Wye" Lot
Carter Country
Club
Densmore
Brickyard Heater Road
2.1
IMPACT TO ADJACENT PROPERTY VALUES
Would the development of the site
minimize adverse impacts to adjacent
property values?
3Impact of development on
adjacent property values 0 2 1 -2 -2 -2
2.2.1 5 VMT reduction 0 1 0 2 2 2
2.2.2 4 Delay/vehicle reduction 0 1 0 0 2 1
2.3 LOCAL TRANSIT OPERATIONS & RIDERSHIP 5How would the development of
the site impact local transit
access volume and travel times?0 1 -1 -1 2 0
2.4
INTERCITY BUS TRAVEL TIME
How would the development of the site as
an Intermodal Transportation Facility
impact Intercity bus travel times within the
region?
3Total additional on-the-road
travel times for Dartmouth
Coach and Greyhound 0 -1 -2 -2 0 0
2.5
INTERCITY BUS RIDERSHIP
How would the development of the site as
an Intermodal Transportation Facility
impact Intercity bus volumes?
5Net impact to intercity
passengers based on home and
terminal location0 -1 -2 -2 0 0
2.6
BIKE/PED TRAVEL TIMES
How would the development of the site as
an Intermodal Transportation Facility
impact bicycle and pedestrian travel times?
2 Qualitative 0 -2 2 0 2 -1
2.7
DIRECT SITE COSTS
What is the direct cost of acquiring the site
and preparing this site for construction
including the provision of community
facilities?
4 Site acquisition and preparation 0 -2 -1 -2 -1 -2
2.8
FINAL DESIGN & FACILITY CONSTRUCTION
COSTS
What is the cost to design, permit, and
construct the facility, including any unusual
site characteristics (e.g. structured
parking)?
4 Soft & hard costs 0 -2 -2 -1 -2 -2
2.9
OFF-SITE IMPROVEMENT COST
What is the direct capital and O&M cost of
the highway, transit, and bicycle/pedestrian
infrastructure necessary to link the site to
the existing transportation network?
5 Construction cost 0 -1 0 -1 -2 0
Reduction in fuel consumption 0 1 0 1 2 2
Reduction in CO, CO2, NOx and
VOC emissions 0 1 0 2 2 2
2.11
SITE ENVIRONMENTAL IMPACTS
What are the direct costs associated with
on-site environmental
mitigation/remediation?
4Environmental mitigation
impacts 0 -1 -2 -1 -1 -2
2.12
IMPACT TO LOCAL TAX BASE
How would developing the site as an
Intermodal Transportation Facility effect
future tax revenues in the host community?
4
Land value, potential for site to
accommodate other mixed-use
development, currently publicly
owned, vehicle registration
taxes
0 -1 0 1 2 0
2.13SITE REDEVELOPMENT
Does the site involve the redevelopment of
a former use on the site?3
Is the site undeveloped or will it
involve a redevelopment of a
previous use0 1 1 -1 -1 -2
Weighted Score: -9 -24 -28 12 -17
Rank: 2 4 5 1 3
2.10
REDUCING FUEL CONSUMPTION AND
EMISSIONS
Would the development of the site as an
Intermodal Transportation Facility reduce
regional fuel consumption and vehicle
emissions?
4
VMT & CONGESTION REDUCTION
How would the development of the site as
an Intermodal Transportation Facility
impact Vehicle Miles Traveled (VMT) and
regional congestion?

15 June 2010
Page 56

Upper Valley Intermodal Facility – Draft Report
Page 57
6.0 DENSMORE BRICKYARD DESIGN
CHARRETTE As part of the alternatives analysis, a design charrette was employed at the request of the Project Advisory Committee to engage the local community and neighborhood on the highest scoring alternative – the Densmore Brickyard site. The charrette consisted of a two-day event on Friday, April 30 and Saturday, May 1.
6.1 Day One – Listening Session
Day One consisted of a presentation by the project team on the process so far and how and why the Densmore site scored the highest (see presentation in Appendix B. Some salient points included in the presentation include the following:
� Of the sites evaluated, the Densmore Brickyard site is the most compatible with existing local, regional and intercity transit providers.
� With the prescribed off-site transportation improvement recommendations in place (including the I-89 access ramps and new Hanover Street bridge), the Densmore Brickyard site results in the greatest overall reduction in congestion, fuel consumption, vehicle miles traveled, and vehicle emissions.
� The estimated daily trip generation at the Densmore Brickyard site (assuming 650 parking spaces) is approximately 1,162 trips.

15 June 2010
Page 58
Figure 36. Densmore Charrette - April 30 Meeting
Following the presentation, the public was asked to provide comments and suggestions about issues they might have with locating the intermodal facility at the Densmore Brickyard site. These comments were taken into consideration during the design session on Day Two. The listening session yielded a number of issues, including the following:
� Increased traffic in the adjacent neighborhood
� Pedestrian safety and proximity to the elementary and high schools
� Aesthetic impacts of a large parking lot close to downtown
� Adverse impacts of bringing traffic into downtown Lebanon
� The fiscal impacts and future maintenance costs that would be largely borne by City of Lebanon taxpayers
� Concern over the use of Federal dollars to subsidize a private bus company
� Lack of clarity of how the site fits into the regional transportation context
Comments turned in by participants on Friday, including a public statement from the Mayor of Lebanon, are included in Appendix D.
Figure 37. Densmore Charette - May 1 Design Session

Upper Valley Intermodal Facility – Draft Report
Page 59
6.2 Day Two, Morning – Concept Redesign
On Saturday morning, the design team met and decided how to move forward to incorporate the comments from Friday’s listening session. The public was invited to this session to further incorporate their comments and suggestions.
Two concepts were developed further. The first concept involved looking at the regional overview of transportation, park and ride facilities, and transit transfer facilities in the area (Figure 38). This approach was developed to provide a general overview of the context for an intermodal facility and to provide proper context for potentially separating intercity traffic from local traffic.
Figure 38. Regional Overview of Transportation Facilities

15 June 2010
Page 60
The second concept looked specifically at the Densmore Brickyard site to design a facility that better met the concerns expressed by the public the previous evening. The resulting facility was more of a transit-to-transit transfer point with limited parking for local residents – primarily to connect to regional transit. This site would not be designed to service intercity transit providers. Automobile access to the site would be provided via new ramps directly connected to I-89 Northbound (Figure 39). Buses could access the site directly from I-89 northbound or from Hanover Street via a gated, improved bridge on Hanover Street (Figure 40). This bridge would have a separated, covered multi-use path to provide improved safety for pedestrian and bicycle traffic. A rendering of a smaller transit hub facility was designed to show an example of the footprint from such a transit-to-transit transfer point (Figure 41). This redesigned facility would help alleviate some of the traffic and safety concerns raised by the public and decrease the visual and environmental impact because of its smaller size.
Figure 39.Preliminary Densmore Site Plan with Transit and Commuter Access.

Upper Valley Intermodal Facility – Draft Report
Page 61
Figure 40. Preliminary Hanover Street Bridge Rendering with Gate for Buses and Emergency Vehicles and Pedestrian
Covered Bridge
Figure 41. Preliminary Bus Terminal Rendering
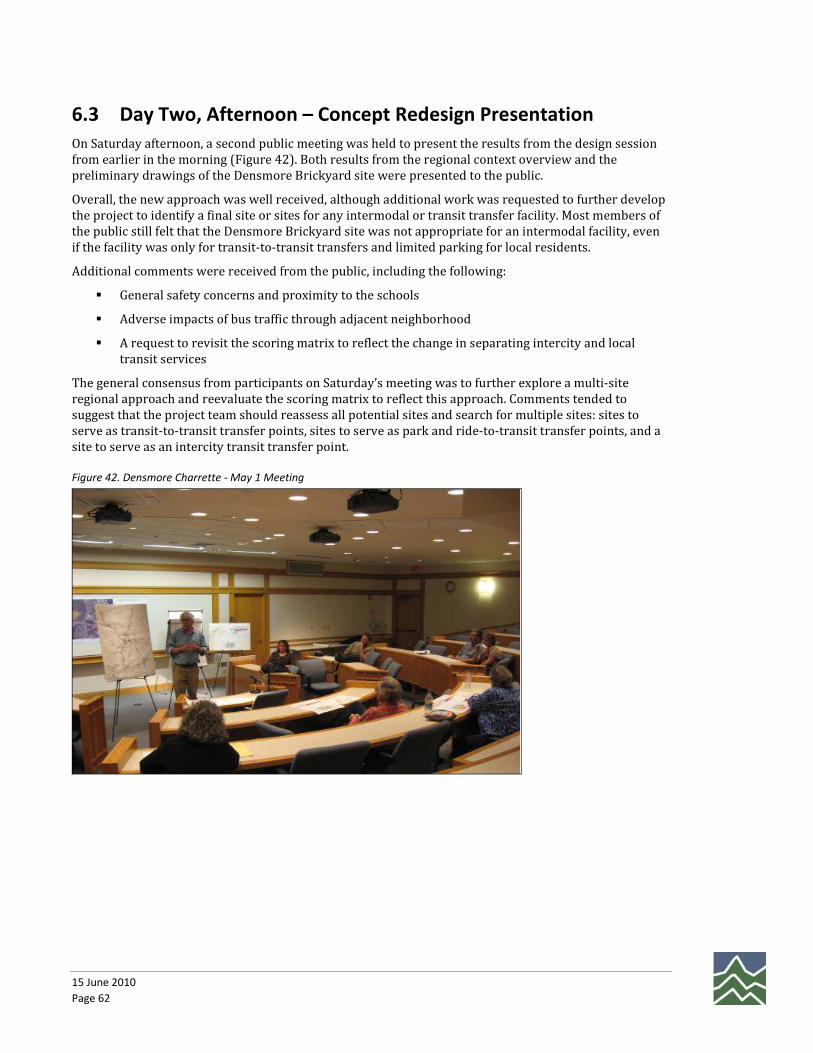
15 June 2010
Page 62
6.3 Day Two, Afternoon – Concept Redesign Presentation
On Saturday afternoon, a second public meeting was held to present the results from the design session from earlier in the morning (Figure 42). Both results from the regional context overview and the preliminary drawings of the Densmore Brickyard site were presented to the public.
Overall, the new approach was well received, although additional work was requested to further develop the project to identify a final site or sites for any intermodal or transit transfer facility. Most members of the public still felt that the Densmore Brickyard site was not appropriate for an intermodal facility, even if the facility was only for transit-to-transit transfers and limited parking for local residents.
Additional comments were received from the public, including the following:
� General safety concerns and proximity to the schools
� Adverse impacts of bus traffic through adjacent neighborhood
� A request to revisit the scoring matrix to reflect the change in separating intercity and local transit services
The general consensus from participants on Saturday’s meeting was to further explore a multi-site regional approach and reevaluate the scoring matrix to reflect this approach. Comments tended to suggest that the project team should reassess all potential sites and search for multiple sites: sites to serve as transit-to-transit transfer points, sites to serve as park and ride-to-transit transfer points, and a site to serve as an intercity transit transfer point.
Figure 42. Densmore Charrette - May 1 Meeting

Upper Valley Intermodal Facility – Draft Report
Page 63
7.0 SITE SELECTION As was described in previous sections, the Phase I and Phase II screening assessments resulted in the Densmore Brickyard site scoring the highest overall. Within the Phase II screening assessment, the Densmore Brickyard site was the only site to achieve a positive score (in relation to a ‘No Build’ scenario), based on the criteria identified by the Project Advisory Committee.
Given the results of the Phase I and Phase II screening assessments, the Densmore Brickyard design charrette, and public input, the Project Advisory Committee voted 11-1 to finalize the report, noting that the Densmore Brickyard site was the highest scoring site but acknowledging the significant concerns expressed by City of Lebanon officials and residents.
The Project Advisory Committee determined that the preliminary site layout developed during the Densmore Brickyard design charrette did not accommodate intercity transit, which was a fundamental element of the current evaluation and purpose of the project from the outset. The Committee elected to complete the study with a full-service Densmore Brickyard site that provides connections for intercity, regional, and local buses but to clearly note to NHDOT the lack of public support for any implementation at this time.
7.1 City of Lebanon Concerns
As the Phase II screening assessment progressed and the Densmore Brickyard site emerged as the highest scoring site, significant concerns were raised by City of Lebanon officials and residents with the site. As the host community for the potential site, it is critical that these concerns be addressed before moving forward with this project.
At their 17 February 2010 meeting, the Lebanon City Council voted 6-1 to not locate the Intermodal Transportation Facility in the city. Following additional analysis, public outreach, and discussion with

15 June 2010
Page 64
City officials, the City Council voted on 5 May 2010, by a 5-3 vote, to request to extend the scope of the Intermodal Facility study to re-examine potential sites and identify “a functional network of suitably located component sites – rather than try to do everything on one site, with the host municipality bearing most of the costs.”
Following this vote, the City Council drafted a letter to the NHDOT and UVLSRPC articulating their primary concerns with the Intermodal Facility site. The concerns expressed in this letter include the following:
� The City of Lebanon should not have to bear the burden of a facility that primarily benefits other towns in the region.
� The Intermodal Facility must capture commuter traffic on the City’s periphery, before it enters the urban core.
� The Intermodal Facility must respect the quality of life in the city’s residential neighborhoods.
� The Intermodal Facility must link multiple modes of transportation – rail and air, in addition to buses, cars, bicycles, and feet – in an effective network.
� The Intermodal Facility must reflect the prevailing scale of the Upper Valley’s built environment, which generally is much smaller than DHMC, Centerra, and other big complexes.
� The Intermodal Facility must make fiscal sense for the City, i.e., not increase the burden that Lebanon taxpayers already carry as the region’s economic and service center.
Throughout the public outreach process, additional comments and concerns were brought forward by City of Lebanon officials and residents regarding the selection of the Densmore Brickyard site. These comments are further detailed in Appendix D. Some of the concerns brought forward include the following:
� Addition of traffic and congestion into the heart of Lebanon, which is already stressed by high traffic volumes.
� Increased automobile and bus traffic through the neighborhoods surrounding the site.
� A significant reduction in safety for school kids walking and bicycling to school along Hanover Street.
� The location of an intermodal site in close proximity to the Hanover Street Elementary School and Lebanon High School.
� Aesthetic impacts of locating an Intermodal Facility and parking lot on the Densmore property.
� High cost of community services and higher taxes placed on Lebanon residents and businesses to support a facility that benefits the region.
� Decreased safety and higher propensity for crime associated with an Intermodal Facility.
� An expanded facility for Dartmouth Coach may lead to Manchester Airport service, which will pull business away from the Lebanon Airport.
� The perception that this project would use federal tax dollars to support a private bus company.
� No direct connection to the Lebanon Airport or Amtrak station in White River Junction.
� Decreased quality of life for City of Lebanon residents, particularly those located immediately adjacent to the site.
While the PAC has identified the Densmore Brickyard site as the highest scoring site for an Intermodal Facility in the Upper Valley, the Project Advisory Committee expects that the above concerns from the public and City of Lebanon will be taken into consideration before a facility is built on any site within the region.

Upper Valley Intermodal Facility – Draft Report
Page 65
8.0 DENSMORE BRICKYARD CONCEPTUAL
SITE DESIGN Acknowledging the Project Advisory Committee’s vote to finalize the study, the remainder of this chapter presents the conceptual layout for the Intermodal Facility at the Densmore Brickyard site, along with an identification of off-site improvements, conceptual cost estimate, and overview of project permitting needs.
Figure 43 below shows a general overview of the Densmore Brickyard site and surroundings. The figure shows the conceptual layout of the 650-space parking lot and transit hub, the potential access ramps from I-89 northbound, and other off-site transportation enhancements that have been identified to serve the site.
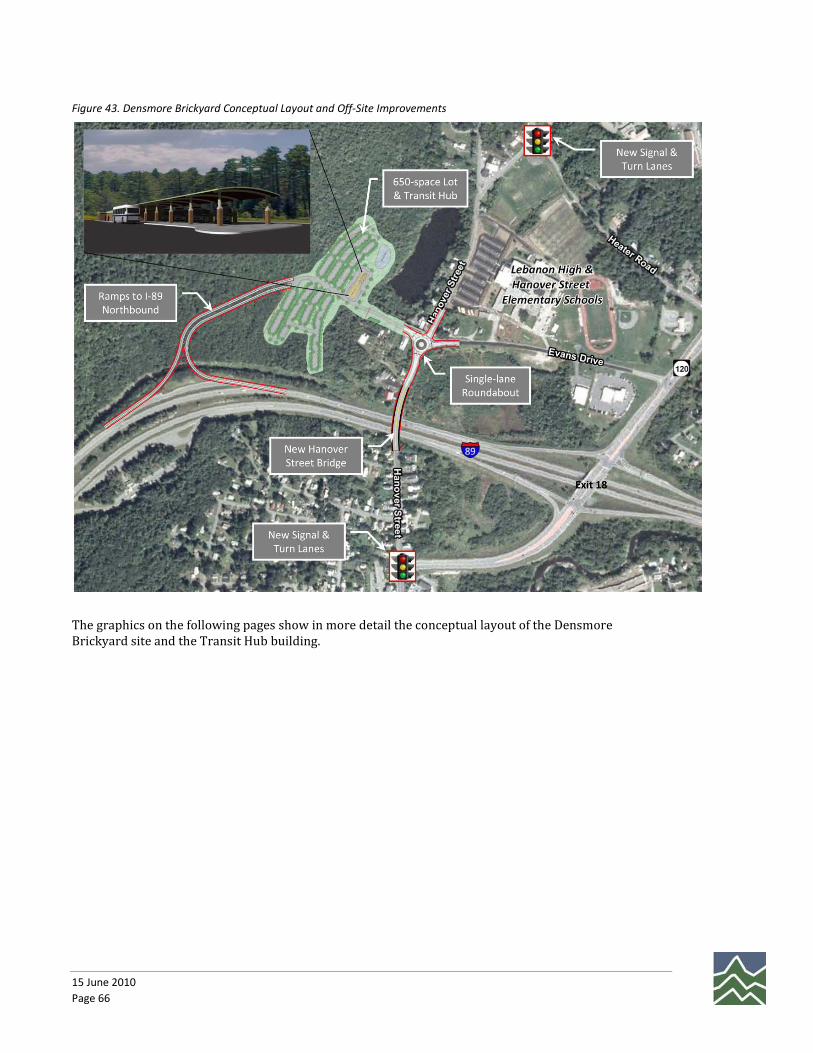
15 June 2010
Page 66
Figure 43. Densmore Brickyard Conceptual Layout and Off-Site Improvements
The graphics on the following pages show in more detail the conceptual layout of the Densmore Brickyard site and the Transit Hub building.

Upper Valley Intermodal Facility – Draft Report
Page 67

15 June 2010
Page 68
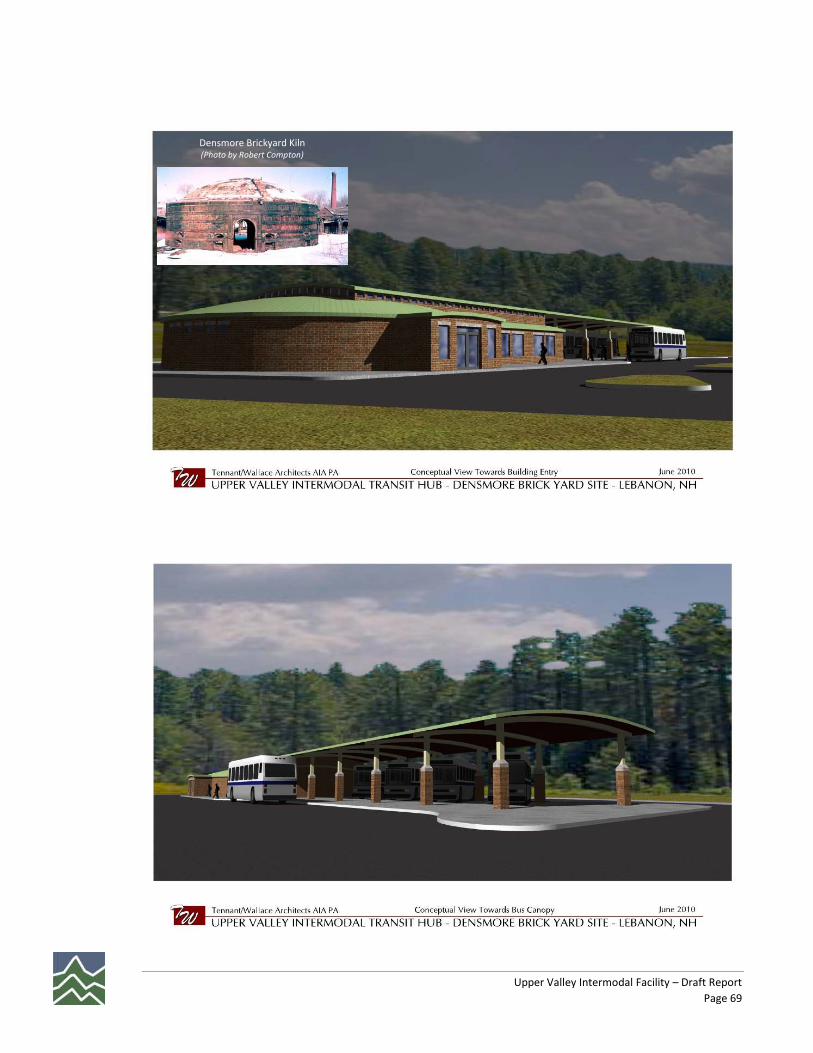
Upper Valley Intermodal Facility – Draft Report
Page 69
Densmore Brickyard Kiln (Photo by Robert Compton)
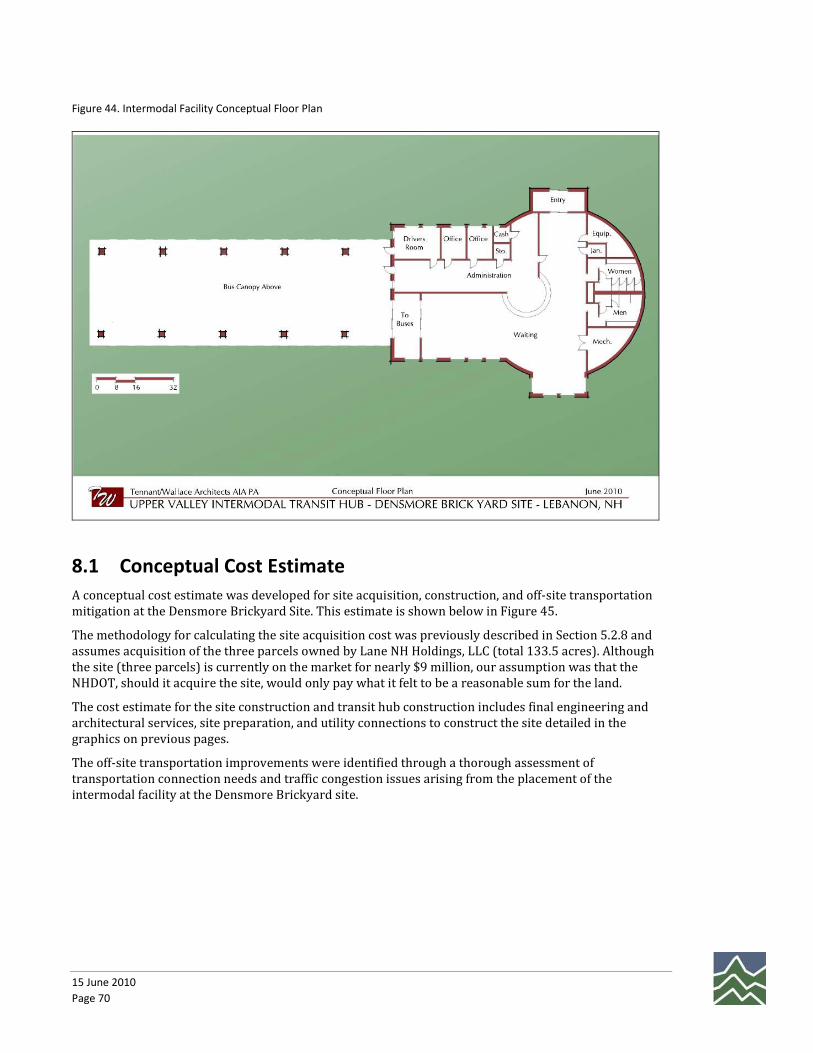
15 June 2010
Page 70
Figure 44. Intermodal Facility Conceptual Floor Plan
8.1 Conceptual Cost Estimate
A conceptual cost estimate was developed for site acquisition, construction, and off-site transportation mitigation at the Densmore Brickyard Site. This estimate is shown below in Figure 45.
The methodology for calculating the site acquisition cost was previously described in Section 5.2.8 and assumes acquisition of the three parcels owned by Lane NH Holdings, LLC (total 133.5 acres). Although the site (three parcels) is currently on the market for nearly $9 million, our assumption was that the NHDOT, should it acquire the site, would only pay what it felt to be a reasonable sum for the land.
The cost estimate for the site construction and transit hub construction includes final engineering and architectural services, site preparation, and utility connections to construct the site detailed in the graphics on previous pages.
The off-site transportation improvements were identified through a thorough assessment of transportation connection needs and traffic congestion issues arising from the placement of the intermodal facility at the Densmore Brickyard site.

Upper Valley Intermodal Facility – Draft Report
Page 71
Figure 45. Conceptual Cost Estimate for Site Acquisition, Construction, and Off-Site Mitigation
Site Acquisition
Reasonable Price High Value Land ($70,400/acre) $2,182,400
Reasonable Price Low Value Land ($3,600/acre) $369,000
SUBTOTAL: $2,551,400
Site Construction
General Site Earth Work Construction $983,750
Storm Drainage Construction $337,500
Sewer Utility Construction $51,750
Water Utility Construction $193,750
Roadway & Sidewalk Construction $1,326,600
Landscaping $192,500
Erosion & Sediment Control $60,000
Site Electrical & Lighting $326,500
Mobilization/Demobilization/Clean-up $260,426
Contingency (15%) $559,916
Construction Engineering (6.5%) $242,630
SUBTOTAL: $4,535,323
Transit Hub Construction
Building $1,787,500
Canopy $532,000
Utility Allowance $75,000
Security System $125,000
Furnishing & Equipment $150,000
Site at Canopy $100,000
Contingency (10%) $276,950
Final Design & Engineering $249,255
SUBTOTAL: $3,295,705
Off-Site Transportation Improvements
I-89 Access Ramps $1,450,000
New Hanover Street Bridge $7,000,000
Single-lane Roundabout at Hanover Street & Evans Drive $1,250,000
New Signal & Turn Lanes at Hanover St/Heater Road Intersection $300,000
New Signal & Turn Lanes at Hanover St/NH 120 Intersection $300,000
New Sidewalk along Hanover St from I-89 to Heater Road $340,000
SUBTOTAL: $10,640,000
TOTAL - Acquisition, Construction, Off-Site Mititgation: $21,100,000
8.2 Permitting Requirements
Should this project move forward, one of the next major milestones will be to address various site permitting issues. Figure 46 below provides a summary of the identified permitting issue areas and the potential adverse impacts related to the construction of the Intermodal Facility at the Densmore Brickyard site.

15 June 2010
Page 72
Since the site acquisition and construction will likely include at least some portion of federal funds, the project will be required to prepare necessary environmental documentation reflecting appropriate project categorization under the National Environmental Policy Act (NEPA). Based on an assessment of defining criteria and determinations of eligibility for previously permitted intermodal facilities in New Hampshire, we believe that this facility will fall under a Categorical Exclusion (CE). The section of the Federal Rule related to this facility is 23 CFR 771-117(d) (10) which reads:
Construction of bus transfer facilities (an open area consisting of passenger shelters, boarding areas, kiosks and related street improvements) when located in a commercial area or other high activity center in which there is adequate street capacity for projected bus traffic.
The relevant impacts necessary to completing the Categorical Exclusion document is included in Figure 46 below.
Figure 46. Permitting Matrix
Category Detail No Build
Densmore Brickyard
(650 spaces)
Alteration of Terrain
Require Alteration of Terrain Permit No Yes
Air Quality
Require conformity determination? No No
Require 8-hour CO analysis No No
Cultural Resources
Adverse impact to Historic Resources? No Potential
Adverse impact to Archeological Resources? No Potential
Endangered Species
Adverse affect to species and critical habitat of species
protected by the Endangered Species Act?No Potential
Floodways
Encroachment on regulatory floodways? No No
Noise
Type I Highway Project? No No
Right-of-Way
Acquisition of residences or businesses? No No
Require acquisition or permanent easement? No No
Section 4(f) Resources
Impact to recreational facilities, historic properties, LCIP
recreational land?No No
Section 6(f) Resources
Impacts to improvements funded with LWCF funds? No No
Water Quality
More than negligible impact on surface waters? No No
Wetlands
Require an Army Corps of Engineers Individual
Permits?No Potential
Zoning
Require Zoning Permit or Site Plan ApprovalNo
No - NHDOT immune from
local regulations
Other
Other items of note N/ANeed FHWA authorization for
I-89 access
Alternatives

Upper Valley Intermodal Facility – Draft Report
Page 73
9.0 NEXT STEPS If this project and site selection had received support from the regional community, the next logical step in the process would have been to pursue funding for final design and construction of the facility and related off-site improvements. There is currently funding available from the USDOT under the TIGER II discretionary grant program to fund projects that enhance livability and have a significant impact on the nation, metropolitan area, or region. Grant applications are due on 23 August 2010. Up to $35 million of the grants may be awarded for planning projects, and up to $140 million will be awarded to projects in rural areas.
To best address the unique and complex transportation issues in the Upper Valley, a more holistic regional transportation plan should be conducted as a next step. This study should consider the opportunity for utilizing multiple sites to interconnect and integrate the current bus, air, and rail services throughout the region. The study should take into account ways to enhance connectivity of existing and planned park and ride facilities as well as opportunities for connecting off-site satellite parking areas with the region’s major employers. In order to best address the potential fiscal impacts to the municipalities within the region, a comprehensive Cost of Community Services study should be integrated into this regional study and approved by the municipalities. Prior to moving forward with the next phase of assessment, there should be clearly documented interest by municipal officials that there is local support to further identify solutions to the region’s growing transportation issues.