Embed Size (px)
Citation preview

UPPER THAMES RIVER LIVESTOCK
MANURE AND WASTE MANAGEMENT PROGRAM
Prepared by: Craig Merkley
For: Ministry of Environment
Southwestern Region


TABLE OF CONTENTS
Page
1. List of Figures
2. List of Appendices
3. Terms of Reference 5
4. 1987 Work Program 6
4.1 Promotion of Corrective Measures 6
4.2 Havelock Sanitary Study 11
4.3 Kintore Creek Watershed Study 14
4.4 Additional Studies 14
LIST OF FIGURES
Page
1. Manure Storage Fact Sheet 7
2. Cattle Access Fact Sheet 8
3. Milkhouse Waste Fact Sheet 9
4. Ministry of the Environment Enhancement Brochure 10
5. Havelock Corners Sub-division Map 13
APPENDICES
1. Farm Survey Questionnaire 16
2. a) Summary of Pollution Sources 19
b) Summary of Estimated Value of Remedial Work 20
3. Kintore Creek Watershed Study Report 22

3. TERMS OF REFERENCE
Under the terms of the contract to the Southwestern Region, the UTRCA agreed toprovide assistance to the Ministry of the Environment in the following tasks:
1) promotion of corrective livestock manure management measures for farmspreviously identified as causing water quality impairment.
2) the recording and monitoring of water quality in rural watersheds.3) record and monitor upstream and downstream conditions of receiving waters as
a result of rural sources. Document results.4) continue monitoring background and runoff event conditions of Kintore Creek
sub-basins.5) assess the extent and severity of domestic waste treatment system deficiencies.
The Program was also to include the following services:
a) liaison with local Beaches Steering Committee, the S.W. Region Abatementsection and the Joint Soil & Water Conservation Program to bring aboutsolutions.
b) increase farmers awareness of OSCEPAP and the MOE enhancement ofOSCEPAP.
c) define and measure the water quality impact of certain problem farms, includingsample collection of MOE analysis.
d) record implementation of corrective measures and measure the resultingimprovements.
e) contact all dairy operators in the study area to promote installation milkhousewater handling systems.
f) report to MOE problem situations which present difficulty or involve grossnegligence in causing pollution.
g) participate on local meetings and discussions on farm pollution to promotecorrective measures.
h) produce press releases for local distribution and provide a livestock manuremanagement display at relevant events.
5

4. 1987 WORK PROGRAM
4.1 Promotion of Corrective Livestock Measures
A significant portion of the 1987 work program involved the promotion of correctivemeasures on livestock operations in the Upper Thames watershed. Staff worked closelywith the local Beaches Strategy Program on this project. A total of 850 livestockoperations were approached during the year. These farms had either been targetedfrom previous survey work (Hayman and Merkley, 1986) or were dairy operations.
Method
Staff used a three step approach to begin the promotional task. The first step involvedthe compilation and distribution of an information/education package. Once mailed thepackages were followed up with a farm call. If the landowner expressed interest in anyremedial measures, an addition call was made by more technically experienced staff.
Informative Packages
The information packages were intended to raise the farmers level of awareness tolivestock related pollution. They contained information that was specific problempreviously identified on his farm. The packages included the following items:
1) covering letter2) OSCEPAP brochure3) MOE Enhancement insert4) Series of 3 fact sheets.
The factsheets (fig. 1,2,3) were intended to emphasize the effect livestock inputs haveon water quality. The enhancement insert (fig. 4) was produced and included to clarifythe grant system.
Farm Calls
Before farms calls were made, staff were trained to recognize potential livestockrelated pollution sources. Manure storage systems were toured, wind screen surveysof livestock farms were conducted and various situations were discussed withexperienced staff.
The farm calls were conducted on a Township by Township basis. The farmer wasrepresented with promotional literature explaining corrective measures. The grant wasdiscussed and a brief questionnaire was completed.
6

MANURE STORAGE FACTS
Figure 1: Manure Storage Facts Information Sheet
Did You Know That .....
! based on conservative OMAF figures, enough manure Nitrogen is producedin Ontario to supply ½ of the Province's corn chop requirements.
! through proper manure management and cropping practices, home farmersare finding that they can reduce or eliminate the amount of commercialfertilizer previously bought...
! one cow produces about $95.00 worth of nutrients per year, Middlesex,Oxford and Perth counties produce $11,000,000. worth!
! about ½ of the Nitrogen and b of the Potassium are in the liquidportion.
! runoff from open feedlots and manure storages can carry 40-60% of theNitrogen and 30-50% of the Potassium - containing this runoff willreduce nutrient losses and prevent potential bacterial contamination ofnearby water courses.
! manure application followed by immediate incorporation decreasesnitrogen -losses up to 70%.
For Information call ... Rural Water Quality Program
Upper Thames River Conservation Authority451 — 2800
7
CATTLE ACCESS FACTS
Figure 2: Cattle Access Facts Information Sheets
Did You Know That .....
! one cow produces approximately 5.4 billion fecal coliforms /day. If acow is allowed to graze for a 24 hour period, with unrestricted accessto a stream, approximately 565 million fecal coliforms could enter thestream!
! one defecation by a dairy cow produces enough bacteria to make theequivalent of six backyard swimming pools unsafe for swimmers!
! water with a 'fecal coliform' count of 100/100 ml, is unsafe to swimin ...
! fifty cows allowed unrestricted access to a stream for a 24 hour periodcould contaminate the equivalent of one days untreated water supply fora city the size of Toronto!
! waters with a 'fecal coliform' count of 2/100 ml, is unsafe to drink...
! bacteria entering the stream can result in disease transmission betweenand within Livestock herds especially mastitis and dysentry.
! livestock fencing and alternative watering facilities prevent streambank erosion and the need for expensive drain maintenance work.
For Information call ...Rural Water Quality Program
Upper Thames River Conservation Authority451 — 2800
8

MILKHOUSE WASTE FACTS
Figure 3: Milkhouse Waste Facts Information Sheets
Did You Know That....
! 30 to 40 kg of phosphorus is used annually by each dairy farmer to washmilking equipment... this is the equivalent of pouring 600,1-kg boxesof laundry detergent into the drain each year!
! Canada/USA have agreed to reduce phosphorus loadings to Lake Erie fromAgricultural sources by 200 tonnes/year.! an estimated 200 tonnes enters rivers annually from milkhouse
waste waters alone!! 200 tonnes is the equivalent of dumping 6.2 million boxes of
laundry soap into Ontario streams.
! phosphorus is the 'nutrient' which 'causes excessive weed growth andalgae blooms in rivers and lakes...these conditions adversely affectfish populations and limit recreational activity.
! bacteria in milkhouse waste waters can transmit disease to Livestockwatering downstream.
! some surveys indicate that 80-90% of all dairy operations in Ontario donot have proper milkhouse waste handling facilities!
For Information call .. . Rural Water Quality ProgramUpper Thames River Conservation Authority
451 - 2800
9
Enhanced OSCEPAP IIThe Ontario Ministry of Environment is pleased toparticipate in a co-operative grant program withthe Ontario Ministry of Agriculture and Food.Under the terms of the agreement, the Ministry ofEnvironment (MOE) will supplement OSCEPAP IIgrants paid by the Ministry of Agriculture andFood in target watersheds within the province,identified by MOE.
Purpose of Enhanced OSCEPAP IITo provide additional grant assistance to livestockoperators to maximize nutrient value frommanure and to protect downstream waterresources, particularly recreational beaches.
Terms and FundingAll terms of OSCEPAP II must be met.
Additional funding is available if all or part of yourlivestock farm falls within the Upper ThamesRiver Conservation Authority watershed.
The Ministry of Environment has committedan additional 1.0 million dollars for each fiscalyear from April 1st, 1986 to March 31st, 1990.
If the project qualifies under the OMAFOSCEPAP II grant and conditions are met for theMOE Enhanced OSCEPAP II grant, the additionalfunds will be paid automatically along with theOMAF basic payment. You do not have to applyseparately to the Ministry of Environment.
In summary, simply follow the applicationprocedures outlined in the OMAF OSCEPAP IIbrochure.
The ProgramEnhanced OSCEPAP II applies to portions of twosections:
A. Soil ConservationB. Environmental Protection
A Soil Conservation— Enhanced Eligible Items! Water diversions around livestock lot areas! Fencing off ditches/watercourses from
livestock! Alternate livestock water devices! Controlled access ramps and fencing for
in-channel livestock watering
! Seeding and sodding buffer strips betweenfeedlot / barnlot areas and watercourse
Amount of Assistance for Section AThe Enhanced OSCEPAP II increases the grantfrom 66b% to 75% for the eligible SoilConservation items listed above. As well, the totalmaximum grant for these items increases from$10,000 to $14,500 per farmer, partnership orcorporation.
B Environmental Protection- Enhanced Eligible Items! Liquid and semi-solid manure storage tanks! Earthen storages! Dry or solid manure storage pads! Transfer piping! Storage covers for liquid, semi-solid dry, or
solid manures to reduce rain, snow or odours! Milkhouse and parlour washwater handling
facilities including expansion of manurestorage, holding tanks, lagoons, transferpiping and sediment tank/stone filledtreatment trench systems
Amount of Assistance for Section BThe Enhanced OSCEPAP II increases the maximumtotal grant from $7,500 to $12,500 per farmer,partnership or corporation for the eligibleEnvironmental Protection items listed above. Thepercentage for Section B is unchanged from thestandard OSCEPAP II percentage of 40%.
For more information contact:
Your Local OMAF Office:Middlesex50 King Street ORLondon, OntarioN6A 2P2 Ministry of EnvironmentOxford Rural Water Quality ProgramP.O. Box 666 Upper Thames RiverWoodstock, Ontario Conservation AuthorityN4S 7Z5 P.O. Box 6278, Stn. DPerth London, Ontario413 Hibernia Street N5W 5S1Stratford, Ontario (519) 451-2800N5A 5W2
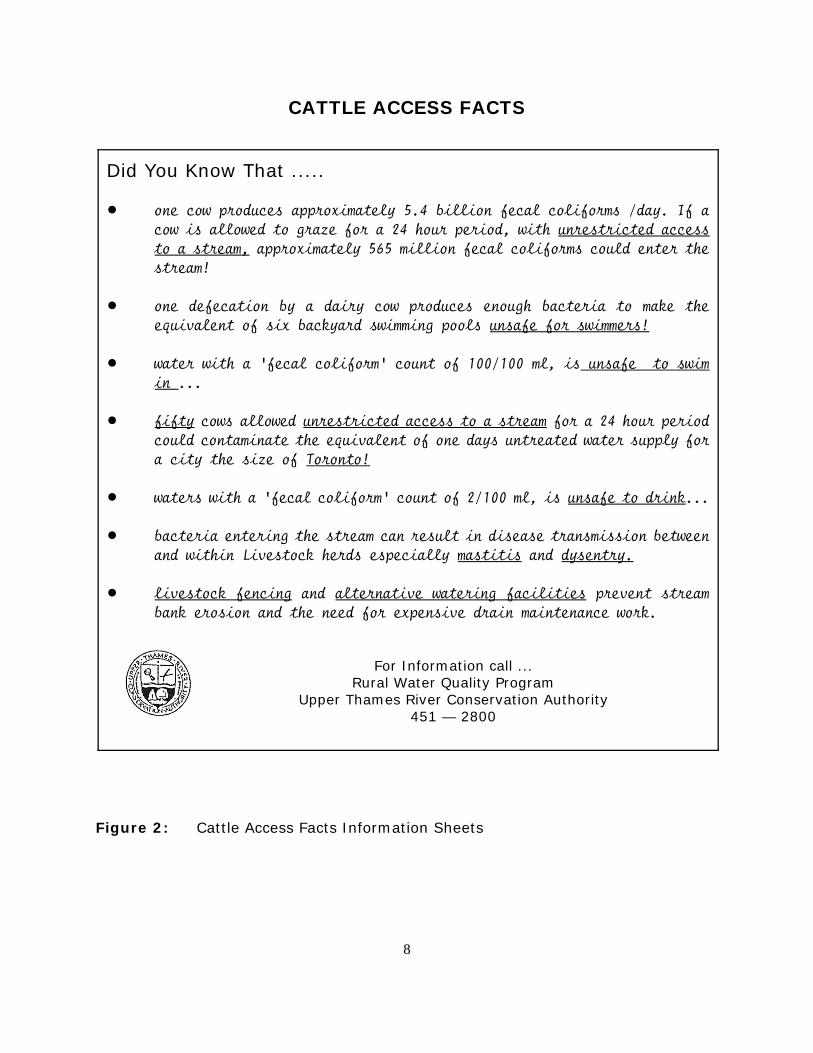
Figure 4 : Ministry of Environment Enhancement Brochure
10
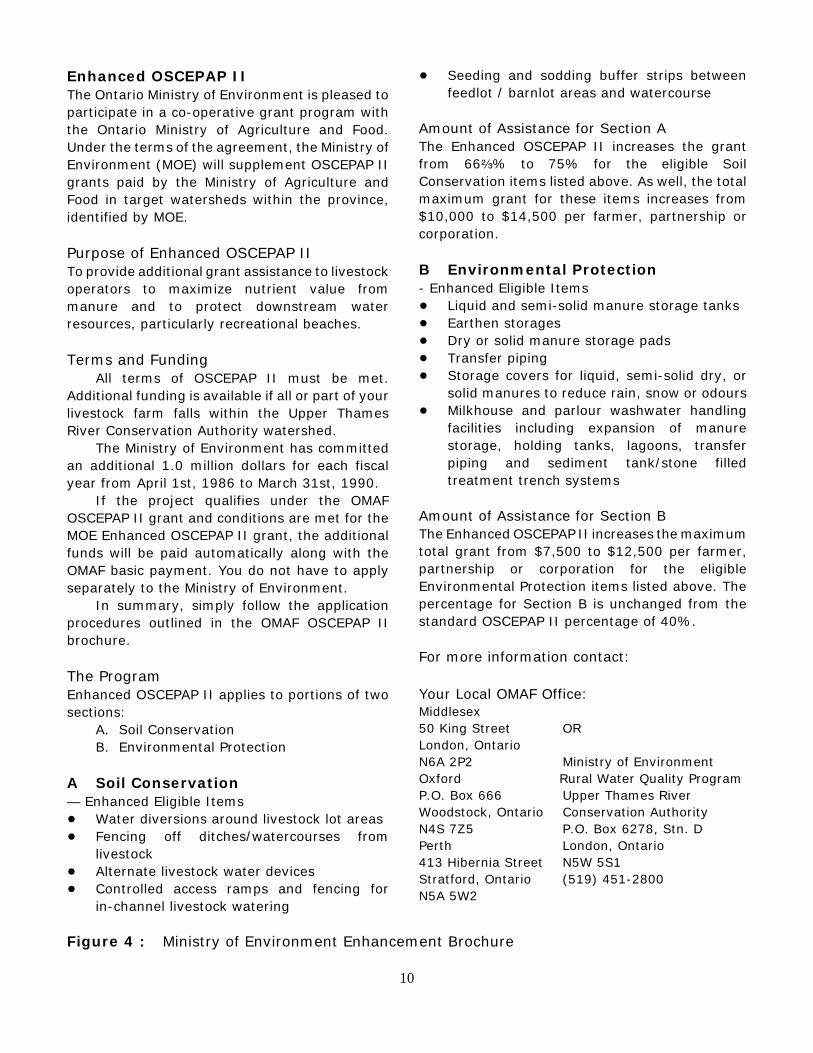
The questionnaire (Appendix 1) was designed to help determine the extent of thepollution potential from the livestock related sources. The information was also usedto put a dollar estimate on the cost of complete implementation of all remedialmeasures (appendix 2).
Additional Farm Calls
If the landowner expressed an interest in some type of remedial work, a second farmcall was arranged. Experienced technical staff reviewed various options with thefarmer. Depending on the magnitude of the project, steps were taken to correct theproblem. Generally, cattle access and milkhouse waste problems were handled byAuthority staff, manure storage projects were passed along to the County AgriculturalEngineer. Records of all farm calls are kept on file for future reference.
Of the 850 livestock operations visited during the year, approximately a could nolonger be considered a problem. In these cases the operation had either beenconverted to cash crop or remedial measures had been implemented. An additional acould not be reached. Either the farmer was not at home when the farm call wasscheduled, or they were unavailable at the time the call was made. Therefore,follow-up work must be conducted during the upcoming field season.
4.2 Havelock Sanitary Study
Three municipal drains join to form Havelock Creek at the hamlet of Havelock Corners(fig. 5). The creek outlets into Pittock Reservoir near the main beach at the northwestcorner of the lake.
The creek has long been suspected of contributing to the high bacteria counts at thebeach. Water samples analysed from the creek have contained very highFecal-coliform/ fecal Streptococci ratios. The high ratio is a strong indicator of ahuman contamination. In addition to the high ratios, Pseudomonas aeruginosis bacteriawas present in the samples. Pseudomonas is a positive indication of human relatedcontamination.
As a result of these findings, investigations were conducted during the summary of1987 to locate and correct sources of human contamination in the Havelock Creek.
11
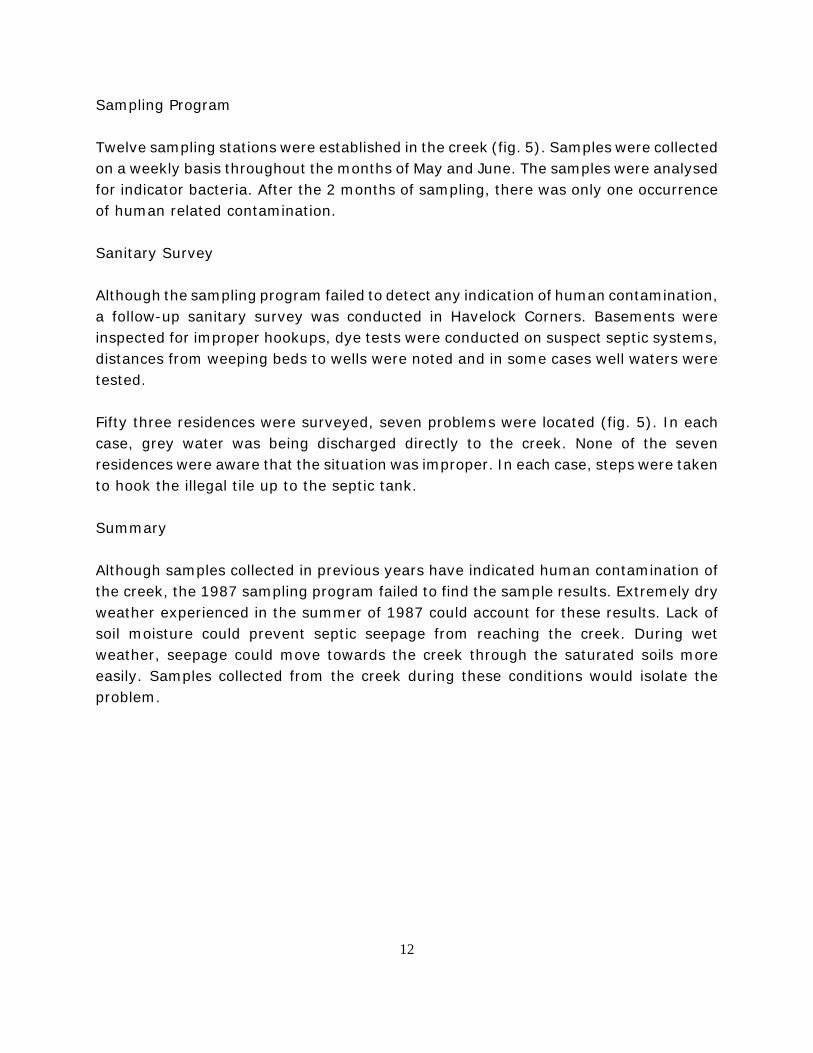
Sampling Program
Twelve sampling stations were established in the creek (fig. 5). Samples were collectedon a weekly basis throughout the months of May and June. The samples were analysedfor indicator bacteria. After the 2 months of sampling, there was only one occurrenceof human related contamination.
Sanitary Survey
Although the sampling program failed to detect any indication of human contamination,a follow-up sanitary survey was conducted in Havelock Corners. Basements wereinspected for improper hookups, dye tests were conducted on suspect septic systems,distances from weeping beds to wells were noted and in some cases well waters weretested.
Fifty three residences were surveyed, seven problems were located (fig. 5). In eachcase, grey water was being discharged directly to the creek. None of the sevenresidences were aware that the situation was improper. In each case, steps were takento hook the illegal tile up to the septic tank.
Summary
Although samples collected in previous years have indicated human contamination ofthe creek, the 1987 sampling program failed to find the sample results. Extremely dryweather experienced in the summer of 1987 could account for these results. Lack ofsoil moisture could prevent septic seepage from reaching the creek. During wetweather, seepage could move towards the creek through the saturated soils moreeasily. Samples collected from the creek during these conditions would isolate theproblem.
12

Figure 5: Havelock Corners
13

4.3 Kintore Creek Watershed Study
Background and runoff event conditions were monitored in both the eastern andwestern sub-basins of Kintore Creek. A full report on the year's activities is availablein appendix 2.
4.4 Additional Studies
A number of other studies were carried out in accordance with the terms of reference.Most were in conjunction with the local Beaches Strategy Program. Studies included:
1) monitoring rural water quality through a pond study.
2) impact assessment of milkhouse waste water on rural water courses.
3) assessment of milkhouse waste treatment systems.
4) investigation of suspect drainage tile outlets and fish hill.
Details of these particular studies can be found in the 1987 Beaches Summary Report(Hayman/Briggs).
14

APPENDIX 1: QUESTIONNAIRE USED TO SURVEY HIGH PRIORITYLIVESTOCK OPERATORS
15

Rural Water Quality Program
TOWNSHIP: _____________________Map No. : _____________________
DATE: ______________________NAME: ______________________ LOT: _______ CONCESSION: _____________
LIVESTOCK TOTAL NUMBER TYPE & NUMBER
None _________
Dairy _________ Dry ___ Milking ____ Heifer ____ Calf ____
Beef - Cow-Calf; Feeder Cow ____ Calf ____
Swine - Farrow; Feeder;Farrow to Finish _________ Sow ____ Weiner ____ Hog _____(in the barn)
Poultry - Broiler; Laying; Pullet _________(in the barn)
Horses _________Sheep _________Other _________
AcresTiled Acres Manure Spread None ______ _________Random ______ _________Systematic ______ __________
Manure Storage Dimensions Description IsDry Pad - Concrete; Walls - Concrete; Runoff- Pond
Earthen Earthen Contained TankLiquid Covered; Tank - Above; Lagoon
InSemi Solid Covered; Pad - Concrete; Walls - Concrete
Earthen Earthen
IsFeedlot Covered; Pad - Concrete; Walls - Concrete; Runoff- Pond
Earthen contained Tank
Upper Thames RiverConservation AuthorityPO. Box 6278, Stn “D”, London, OntarioN5W 5S1 Telephone 451-2800
16

Potential Problems Comments: __________________________________
Storagedistance to water ; slope ; grass cover (%) ; add. water (land, or: roof
Feedlot dimensions)
Manure Management
Spreading Capacity Application Rate When Incorporate When BoxLiquidInjectionIrrigationOther
How Often Soil Test Manure Test
Length ofLivestock Access: Watercourse# of Animals Length of Year Time each Day 1 side/2 sides
UnlimitedLimitedRestricted
Current water supply
barn; stream ; trough ; nose pump.; other
Possible alternatesDairy Volume/ Type of
Treatment Cycles Milking System Milkhouse Presan
NoneParlour Manure Rinse
Trench WashLagoon AcidOther Bulk Tank
Grant
InterestedReasons: ________________________________________________
Not Interested
17

APPENDIX 2:
A) EXTENT OF POLLUTION POTENTIAL FROM UPDATE REPORT
B) COST ESTIMATE OF REMEDIAL MEASURES
18

Township Summary of Identified Pollution Sources from the 1987 Survey of High Priority Livestock Operations
Biddulph Blanshard DownieEastZorra
TavistockEllice Fullarton Hibbert Logan
NorthEasthope
SouthEasthope
UsborseWest
NissouriTotal
FARM SURVEY Confirmed High Priority
2 33 54 63 31 31 5 30 37 7 4 13 315
No Longer High Priority
1 37 26 71 19 29 6 24 58 10 2 18 301
Manure StorageLiquid 0 2 10 4 10 3 0 3 2 0 0 3 37Semi Solid 0 3 5 3 2 5 0 0 2 0 0 6 23Dry 2 37 47 56 25 27 5 30 28 7 4 6 274 Gal/ Yr ofContaminated
147,623 2,561,541 2,876,165 3,437,895 907,082 1,607,036 236,384 714,477 2,568,828 1,060,457 200,506 115,130 16,433,12
RunoffLIVESTOCK ACCESS (# of animals)No Access 3,442 4,103 5,791 577 3,442 5,777 130 3,104 4,236 525 145 10 36,287Limited 0 175 0 0 0 314 39 90 183 0 0 65 866Unlimited 335 415 487 660 335 0 35 0 140 69 128 40 2,644
146,950Length Of FenceRequired (Ft.) 12,953 23,424 20,229 33,710 12,953 10,510 1,320 1,650 5,280 7,326 14,305 4,290Milkhouse WashWater
.
Milkhouses 2 24 45 61 16 19 3 26 34 6 1 30 267Parlours 0 0 1 0 5 1 0 2 0 0 0 0 9No. With Treatment 0 0 12 5 9 6 2 6 13 0 0 9 62No. to Water 2 24 34 56 12 14 1 20 21 6 1 21 205Gal/ Year To Water 36,354 753,363 843,880 1,226,400 359,160 367,920 18,250 554,800 797,160 87,600 29,200 345,290 5,419,374
From: 1987 U.T.R.C.A. Beaches Strategy Summary Report
19

Interim Township Summary of Estimated Value of Remedial Work on Total Phosphorus and Fecal Coliform Reductions
Biddulph Blanshard DownieEastZorra
TavistockEllice Fullarton Hibbert Logan
NorthEasthope
SouthEasthope
Usborne West
NissouriTotal
Manure StorageTotal Remediation Cost* 40,200 709,200 799,800 976,500 260,800 457,600 70,000 235,200 632,400 255,500 51,200 35,700 4,524,100
Livestock Access-Est. Phosphorus Load (Kg/yr)
55 97 80 108 55 51 12 15 53 11 21 13 571
Fecal Coliform Input (#/153 Days)
6.8x10¹² 1.2x10¹³ 9.9x10¹² 1.3x10¹³ 6.8x10¹² 1.5x10¹² 6.4x10¹² 1.8x10¹² 6.6x10¹² 1.4x10 2.6x10¹² 2.1x10¹² 7.1x10¹³
Total Remediation Cost ($1.50/ft.of Fence)
19,400 33,600 30,300 50,600 19,400 15,800 2,000 2,500 7,900 11,000 21,500 6,400 220,400
Value/$1,000 Spent Tp Reduction (Kg/yr)
2.8 2.9 2.6 2.1 2.8 3.2 6.0 6.0 6.7 1.0 1.0 2.7 39.8
F.C Reduction (#/153 days)
3.5x10¹¹ 3.6x10¹¹ 3.3x10¹¹ 2.6x10¹¹ 3.5x10¹¹ 4.1x10¹¹ 7.5x10¹¹ 7.2x10¹¹ 8.4x10¹¹ 1.3x10¹¹ 1.2x10¹¹ 3.3x10¹¹ 5.0x10¹²
MILKHOUSE WASHWATEREst. Phosphorus Load (Kg/yr)
70 840 1,190 1,960 420 490 35 700 735 210 35 735 7,420
Fecal Coliform Input (#/yr)
2.0x10⁸ 2.4x10⁹ 3.4x10⁹ 5.6x10⁹ 1.2x10⁹ 1.4x10⁹ 1.0x10⁸ 2.0x10⁹ 2.1x10⁹ 6.0x10⁸ 1.0x10⁸ 2.1x10⁹ 2.1x10¹⁰
Total Remediation Cost($3,000/milkhouse)
6,000 72,000 102,000 168,000 36,000 42,000 3,000 60,000 63,000 18,000 3,000 63,000 636,000
Value/$1,000 Spent TP Reduction(kg/yr) 11.6 11.6 11.6 11.6 11.6 11.6 11.6 11.6 11.6 11.6 11.6 11.6 i1.6 FC Reduction (#/yr) 92,000 92,000 92,000 92,000 92,000 92,000 92,000 92,000 92,000 92,000 92,000 92,000 11.600Total Costs Of IdentifiedSources As Of 1987
65,600 814,800 932,100 1,195,100 316,200 515,400 75,000 297,700 703,300 284,500 75,700 105,100 5,314,500
* For Explanation of Calculations, Refer to Section 3.4
From: 1987 U.T.R.C.A. Beaches Strategy Summary report
20

APPENDIX 3:
KINTORE CREEK WATERSHED STUDY UPDATE REPORT
21
KINTORE CREEK WATERSHED STUDY- 1987 PROGRESS REPORT -
Prepared By: Craig Merkley
Rural Water Quality Specialist
(March 1988)
22

TABLE OF CONTENTSPage
1. List of Figures
2. Background
3. Objectives
4. 1984 to 1986 Work Program Summary4.1 Water Quality Monitoring4.2 Landowner Liaison4.3 Structural Measures4.4 Summary
5. 1987 Work Program5.1 Landowner Liaison5.2 Water Quality Monitoring5.3 Structural Measures5.4 Tillage Program
6. 1988 Work Program
23

LIST OF FIGURES
1. Location of Kintore Creek and Paired Watersheds2. Erosion/Delivery Map of Paired Watersheds3. Sampling Locations/Storm Hydrographs4. Erosion Rates on a Kintore Farm5. Deposition from Sheet Erosion6. Results of Kintore Poll7. Stream Gauging at Station 18. Storm Event Hydrographs9. Low Flow/High Flow Conditions at Station 210. Streambank Revetment11. WASCOB Construction12. Mulch Tillage13. Fall 1987 Mulch Tillage Map14. Chart of Landowner Acreage15. Watershed Tour
24

1. BACKGROUND
Kintore Creek originates near the village of Kintore in Zorra Township, Oxford County.It flows in a southerly direction for approximately 10 miles before outletting into themiddle branch of the Thames River near Thamesford (fig. 1).
The headwaters of the creek are located in two adjacent subbasins. The westernsubbasin is drained by the Vannatter municipal drain, while the eastern subbasin isdrained by the Logan municipal drain. The drains converge to form the Kintore creekjust south of Kintore.
Each of these paired subwatersheds are approximately 1,500 acres in size. They arecharacterized by long sloping fields with erodible soils. Environment Canada sedimentdelivery maps have classified 45% of the watersheds as high potential for erosion anddelivery of that erosion to a watercourse (fig. 2).
Agriculture is the primary landuse in each subbasin. There are 15 landowners in thewestern basin and 13 in the eastern basin. There are an equal number of both cashcrop and livestock operations in each watershed. The farm sizes range from 300 acresto 40 acres.
25

Figure 1: Location of Kintore Creek Paired Watersheds
26

Figure 2: Erosion/Delivery Map of Paired Watersheds
27

2. OBJECTIVES
The primary objective of the watershed study are to quantify the effect conservationpractices have on erosion and downstream water quality.
To accomplish the objective, the western subbasin was selected for "demonstration"purposes, the eastern subbasin is left as a "control". Conservation tillage andcropping, are promoted in the demonstration basin, no such promotion is planned forthe control.
The water quality of each subbasin has been continuously monitored. Samples areanalysed to determine existing phosphorus and suspended solid levels. As a result,four years of data have been collected and tabulated. The existing conditions in eachsubwatershed are well documented.
With the background data base established, the effect future conservation practiceshas on water quality can be measured.
3. 1984 TO 1986 PROGRAM SUMMARY
3.1 Water Quality Monitoring ProgramTo help determine the existing water quality condition in the two subbasins, a watermonitoring program was established. Seven sampling stations were selected (fig. 3).Three are located in the western basin,-four are located in the eastern basin. Todetermine loadings, stage discharge curves were developed at each of these sevenstations. Base level recorders were installed at the two outlets. To monitor stormevents, ISCO automatic samples were also installed at the outlets. The water qualitydata has been tabulated and entered on computer for storage and future analysis.
3.2 Landowner LiaisonStaff have worked closely with landowners in the demonstration basin. Individualfarm plans have been developed for each. These plans help landowners identify andcorrect erosion problems on the farm.
28

Fig. 3: Sampling Locations
The universal soil loss equation was used to calculate existing erosion rates on a fieldby field basis (fig. 4). Landowners were shown how certain conservation practicescould help reduce these erosion rates to a tolerable level.
Individual recommendations included:a) tillage and cropping practicesb) medial measuresc) drainage improvementsd) livestock related controlse) fishery potentialf) wind erosion control
Landowners were informed of the financial and technical assistance available to them.A number of farmers in the demonstration basin have acted upon therecommendations made in their farm plans.
29

Figure 4: From Farm Plan of Marinus Arts, Erosion Rates on a Kintore Farm.
30

3.3 Structural Measures
To date, a total of 11 water and sediment control basins (WASCOBs) have beenconstructed in the demonstration basin. One waterway diversion has also beenconstructed. The WASCOBs are designed to control gully erosion. They pond runoffwater during a storm event, then drain it slowly away to a safe outlet through aunderground tile system.
Although these structures do not reduce sheet erosion, they have helped farmersidentify the sheet erosion problem. After severe storm events, deposition in theponding areas can be quite noticeable (fig. 5). Farmers have seen this occurring andnow recognize the additional sheet erosion problem. The structures have served asan educational tool, most farmers realize structures are only part of the solution toupland erosion.
Fig. 5: Structures help prevent gully erosion, but do not control upland sheet erosion.
31

3.4 SummaryLandowners in the demonstration watershed are at the stage where widespreadadoption of conservation practices are possible. The success of the study depends onthis component of the program. With financial assistance from the Ministry of theEnvironment and technical support from the local Joint Soil and Water ConservationProgram, the study is in a position to successfully implement the final stage of theprogram - conservation tillage and cropping.
4. 1987 WORK PROGRAM4.1 Landowner LiaisonAs previously mentioned, landowners cooperation is an essential component of thewatershed study. On June 17, 1987, a meeting was held with the landowners in thedemonstration watershed to determine their commitment to the study. During themeeting several concerns were expressed with regards to the program. These concernsincluded:
a) yield reductionb) potential reimbursement methodsc) examination of fertilizer practicesd) program deliverye) degree of farmer control
It was resolved that each landowner be given the chance to reconsider the programbefore further commitment was made. A poll was then to be conducted to determinegroup interest level. The poll was conducted one week after the meeting, unanimousapproval for the project to continue. The results of the poll are summarized in fig. 6.
A second meeting was held in December to review the tillage season and introduce theLand Stewardship Program (LSP). The LSP is intended to promote the adoption ofconservation practices by offering grants incentives. The program complemented theefforts of the Kintore Study, landowners were encouraged to apply.
In individual meetings help during the winter, staff helped the landowner fill out theLSP forms and complete the required three year action plan. Only one farmer wasuninterested in the applying to the program. The action plans submitted by eachfarmer as part of the application, indicated that during the next two years, conservationtillage will be adopted on 80% of the tillable land in the demonstration basin.
32
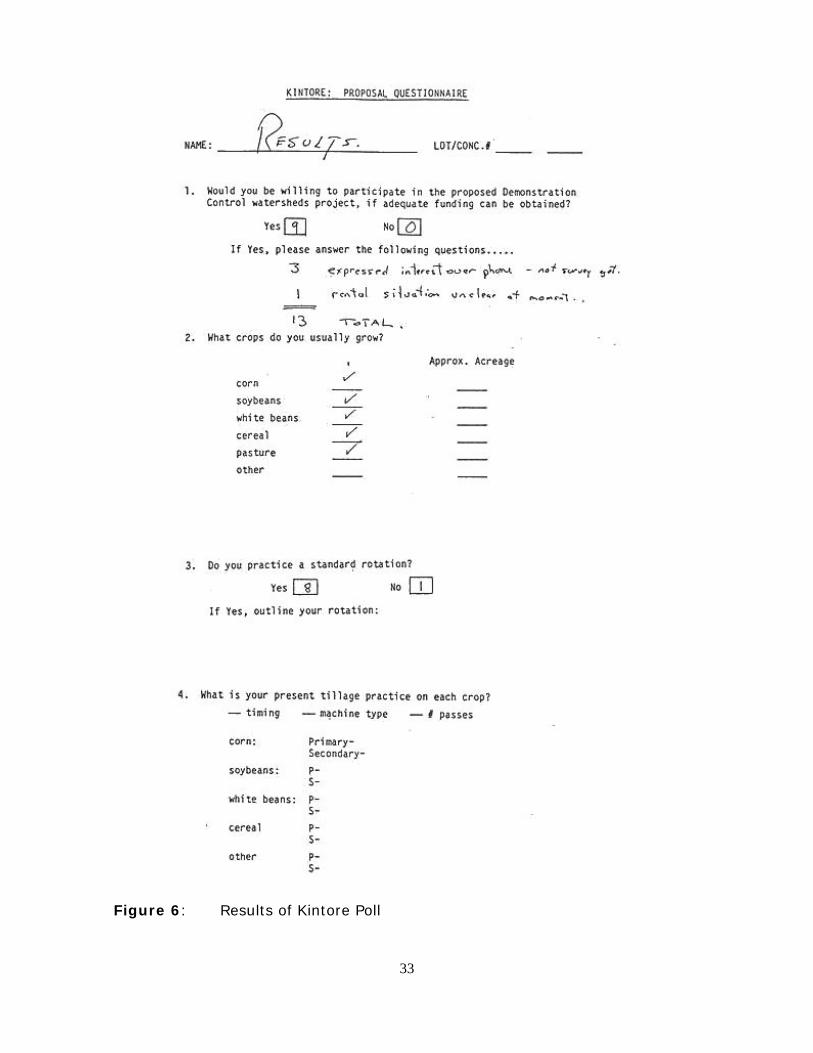
Figure 6: Results of Kintore Poll
33

4.2 Water Quality Monitoring
Between September 1, 1987 and march 31, 1988, 133 samples were collected at theseven stations. Of these, 63 were event related. the samples were collected with aUSPH - 48 depth integrated sampler. The events were sampled at the outlets by ISCO2100 series automatic samples.
The water levels at the outlets were monitored by A-71 Stevens recorders. The chartsfrom these recorders are digitized so hourly flows can be computed at each outlet.Stage discharge curves are maintained at each of the seven stations, the flows aregauged with a Pymy-Price current meter. A Bats unit has been installed at station 6.The unit has helped assure runoff events are not missed. Staff can keep accurateaccount of the runoff event from the office. The unit has also helped determine thedifferent characteristics of the two drains. The Logan drain responds more quickly toan event then the Vannatter (Fig. 8). The drains are sampled accordingly.
Fig 7: A current meter is used to calculate stream velocity in low flow conditions.
34

Figure 8: The Logan Drain responds more quickly to runoff events.
35

Streambank revetment was completed at the outlet to the demonstration basin (fig.10). Ten meters of rip rap and filter cloth material were required to stabilize the bankand protect the monitoring equipment. Repairs were also made to the access lanewaysto the two outlet stations. The repairs were necessary to assure samples were collectedduring runoff events.
Fig. 9: Low flow and high flow conditions at Station 2.
Fig 10: Repair to the stream bank at Station 1
36

4.3 Structural Measures
Two structural projects were completed during the fall of 1987. A water and sedimentcontrol basin (fig. 11), and grassed waterway/diversion. Both were completed on J.McMurray property. Two projects are still planned in the demonstration subbasin. Onecould be completed during the spring of 1988. The other conflicts with the OntarioDrainage Act. The landowner must work in accordance with the Act if the work is to becompleted.
Fig. 11: WASCOB Construction on the McMurray Property.
37

4.4 Tillage Program
A long dry fall provided ideal conditions for conservation tillage.
321 acres were mulch tilled. An additional 69 acres will be mulch tilled during thespring. The acreage represents over a of the row crop acreage in the demonstrationbasin (fig. 13). As figure 14 indicates, 10 of the 15 landowners used the soil saverduring the fall. Of the 5 that did not, 3 had land in the watershed that was seededdown, 1 farm was sold and the last farmer had improper soil conditions.
A Glencoe 7-shank Soil Saver was used in the subbasin. The machine was supplied bythe local JSWCP as part of their commitment to the study. A John Deer mulch finisherhas been acquired from the JSWCP. This machine is designed for single pass seed bedpreparation on mulch tilled land.
Fig. 12: Corn ground should be mulch tilled on a 30° angle to the rows.
38

Figure 13: Fall 1987 Mulch Tillage Map
39

Figure 14: 1987 Cropping and Tillage Demonstration Basin
LandownerTillable Acres
'87 Crop Acreage
'88 CropAcreage
'87 Acres inConservation
Tillage
'88 PlannedAcreage in
ConservationTillage
'88 Forage Crop
% Acreage in CT& Forage
Arts 120 Corn 120 Corn 87 34 60 10 60+10=70
Grain 23 (58%)
Alfalfa 10
Vanstrien 245 Corn 175 Corn 175 10 74 0 74(30%)
Grain 35 Grain 35
Wt. Beans 35 Wt. Beans 35
Brekeimans 137 Corn 136 Corn 136 40 89 0 89(65%)
Pelkmans 93 Corn 41 Corn 60 30 60 19 60+19=79
Grain 14 Grain 14 (85%)
Alfalfa 38 Alfalfa 19
McMurray 88 Corn 47 Corn 28 71 68 15 58+15=83
Grain 25 (94%)
Soybean 41 Soybeans 20
Alfalfa 15
Deslippe 82 Corn 33 Corn 13 4 13 49 13+49=62
Grain 0 Grain 20 (75%)
Alfalfa 79 Alfalfa 49
Henderson/ 80 Corn 80 Corn 20 '80 20+ 0 20(25%)
Rounds Soybeans 60
Ball 58 Corn 42 Corn 40 15 40 18 40-118=58
Alfalfa 16 Alfalfa 18 (100%)
40

Figure 14: 1987 Cropping and Tillage Demonstration Basin - continued
LandownerTillable Acres
'87 Crop Acreage
'88 Crop'87Acreage
Acres inConservation
Tillage
'88 PlannedAcreage in
ConservationTillage
'88 Forage Crop
% Acreage inCT & Forage
Van Maar 50 Corn 28 Corn 28 0 0 22 22 (44%)
Alfalfa 22 Alfalfa 22
Pearson 48 Corn 48 Soybeans 48 20 48 0 48 (100%)
Kew* 42 Corn 42 Corn 22 0 0 10 10 (23%)
Soybean 10
Alfalfa 10
McLarnon 41 Corn 11 Corn 11 17 11 3011+30=42
(100%)Grain 10 Alfalfa 30
Alfalfa 20
Davis 40 Corn 25 Alfalfa 40 0 0 40 40 (100%)
Grain 5
Alfalfa 10
McKay 30 Grain 30 Corn 30 0 ? 0 0
Arther 17 Corn 10 Alfalfa 17 0 0 17 17 (100%)
Alfalfa 7
321 483 230 61% **Totals: 1171
* Soil type on farm unsuitable for conservation tillage** 61% is calculated from totals for 1988, divided by Total Tillage Acreage
41
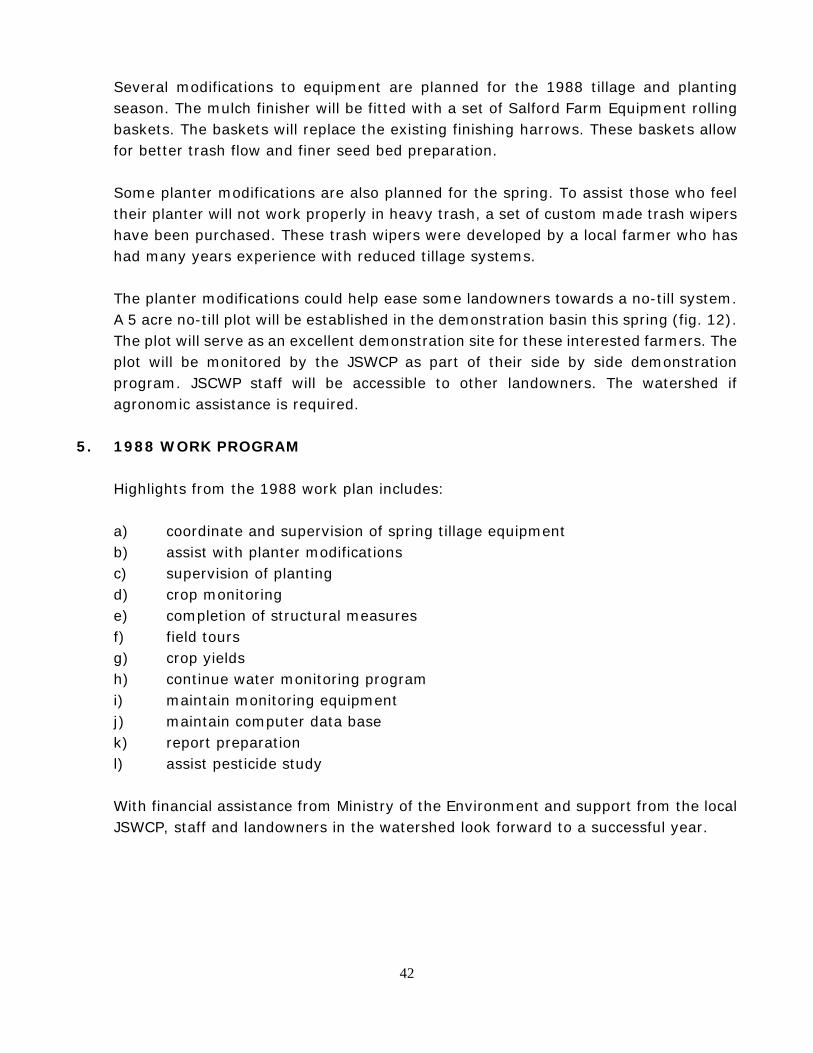
Several modifications to equipment are planned for the 1988 tillage and plantingseason. The mulch finisher will be fitted with a set of Salford Farm Equipment rollingbaskets. The baskets will replace the existing finishing harrows. These baskets allowfor better trash flow and finer seed bed preparation.
Some planter modifications are also planned for the spring. To assist those who feeltheir planter will not work properly in heavy trash, a set of custom made trash wipershave been purchased. These trash wipers were developed by a local farmer who hashad many years experience with reduced tillage systems.
The planter modifications could help ease some landowners towards a no-till system.A 5 acre no-till plot will be established in the demonstration basin this spring (fig. 12).The plot will serve as an excellent demonstration site for these interested farmers. Theplot will be monitored by the JSWCP as part of their side by side demonstrationprogram. JSCWP staff will be accessible to other landowners. The watershed ifagronomic assistance is required.
5. 1988 WORK PROGRAM
Highlights from the 1988 work plan includes:
a) coordinate and supervision of spring tillage equipmentb) assist with planter modificationsc) supervision of plantingd) crop monitoringe) completion of structural measuresf) field toursg) crop yieldsh) continue water monitoring programi) maintain monitoring equipmentj) maintain computer data basek) report preparationl) assist pesticide study
With financial assistance from Ministry of the Environment and support from the localJSWCP, staff and landowners in the watershed look forward to a successful year.
42

Figure 15: Students From the University of Guelph Tour the Demonstration Basin.
43